Estimating Roof Solar Energy Potential in the Downtown...
22
Article Estimating Roof Solar Energy Potential in the Downtown Area Using a GPU-Accelerated Solar Radiation Model and Airborne LiDAR Data Yan Huang 1,2 , Zuoqi Chen 1,2 , Bin Wu 1,2 , Liang Chen 2 , Weiqing Mao 3 , Feng Zhao 3 , Jianping Wu 1,2 , Junhan Wu 1,2 and Bailang Yu 1,2, * Received: 30 October 2015; Accepted: 8 December 2015; Published: 18 December 2015 Academic Editors: Richard Müller and Prasad S. Thenkabail 1 Key Laboratory of Geographic Information Science, Ministry of Education, East China Normal University, Shanghai 200241, China; [email protected] (Y.H.); [email protected] (Z.C.); [email protected] (B.W.); [email protected] (J.W.); [email protected] (J.W) 2 School of Geographic Sciences, East China Normal University, Shanghai 200241, China; [email protected] 3 Shanghai Surveying and Mapping Institute, 419 Wuning Rd, Shanghai 200063, China; [email protected] (W.M); [email protected] (F.Z.) * Correspondence: [email protected]; Tel./Fax: +86-21-5434-1172 Abstract: Solar energy, as a clean and renewable resource is becoming increasingly important in the global context of climate change and energy crisis. Utilization of solar energy in urban areas is of great importance in urban energy planning, environmental conservation, and sustainable development. However, available spaces for solar panel installation in cities are quite limited except for building roofs. Furthermore, complex urban 3D morphology greatly affects sunlit patterns on building roofs, especially in downtown areas, which makes the determination of roof solar energy potential a challenging task. The object of this study is to estimate the solar radiation on building roofs in an urban area in Shanghai, China, and select suitable spaces for installing solar panels that can effectively utilize solar energy. A Graphic Processing Unit (GPU)-based solar radiation model named SHORTWAVE-C simulating direct and non-direct solar radiation intensity was developed by adding the capability of considering cloud influence into the previous SHORTWAVE model. Airborne Light Detection and Ranging (LiDAR) data was used as the input of the SHORTWAVE-C model and to investigate the morphological characteristics of the study area. The results show that the SHORTWAVE-C model can accurately estimate the solar radiation intensity in a complex urban environment under cloudy conditions, and the GPU acceleration method can reduce the computation time by up to 46%. Two sites with different building densities and rooftop structures were selected to illustrate the influence of urban morphology on the solar radiation and solar illumination duration. Based on the findings, an object-based method was implemented to identify suitable places for rooftop solar panel installation that can fully utilize the solar energy potential. Our study provides useful strategic guidelines for the selection and assessment of roof solar energy potential for urban energy planning. Keywords: solar radiation; urban area; roof planes; LiDAR; GPU 1. Introduction Today’s global energy demand still relies largely on fossil fuels [1]. This results in rapid increase in anthropogenic greenhouse gas emissions and overexploitation of natural resources. The issues of global change, energy crisis, and environmental pollution caused by burning fossil fuels have drawn worldwide attention [2]. The pursuit of new renewable energy, such as solar, wind, biomass, nuclear, Remote Sens. 2015, 7, 17212–17233; doi:10.3390/rs71215877 www.mdpi.com/journal/remotesensing
Transcript of Estimating Roof Solar Energy Potential in the Downtown...
Article
Estimating Roof Solar Energy Potential in theDowntown Area Using a GPU-Accelerated SolarRadiation Model and Airborne LiDAR Data
Yan Huang 1,2, Zuoqi Chen 1,2, Bin Wu 1,2, Liang Chen 2, Weiqing Mao 3, Feng Zhao 3,Jianping Wu 1,2, Junhan Wu 1,2 and Bailang Yu 1,2,*
Received: 30 October 2015; Accepted: 8 December 2015; Published: 18 December 2015Academic Editors: Richard Müller and Prasad S. Thenkabail
1 Key Laboratory of Geographic Information Science, Ministry of Education, East China Normal University,Shanghai 200241, China; [email protected] (Y.H.); [email protected] (Z.C.); [email protected] (B.W.);[email protected] (J.W.); [email protected] (J.W)
2 School of Geographic Sciences, East China Normal University, Shanghai 200241, China;[email protected]
3 Shanghai Surveying and Mapping Institute, 419 Wuning Rd, Shanghai 200063, China;[email protected] (W.M); [email protected] (F.Z.)
* Correspondence: [email protected]; Tel./Fax: +86-21-5434-1172
Abstract: Solar energy, as a clean and renewable resource is becoming increasingly important inthe global context of climate change and energy crisis. Utilization of solar energy in urban areasis of great importance in urban energy planning, environmental conservation, and sustainabledevelopment. However, available spaces for solar panel installation in cities are quite limited exceptfor building roofs. Furthermore, complex urban 3D morphology greatly affects sunlit patterns onbuilding roofs, especially in downtown areas, which makes the determination of roof solar energypotential a challenging task. The object of this study is to estimate the solar radiation on buildingroofs in an urban area in Shanghai, China, and select suitable spaces for installing solar panels thatcan effectively utilize solar energy. A Graphic Processing Unit (GPU)-based solar radiation modelnamed SHORTWAVE-C simulating direct and non-direct solar radiation intensity was developed byadding the capability of considering cloud influence into the previous SHORTWAVE model. AirborneLight Detection and Ranging (LiDAR) data was used as the input of the SHORTWAVE-C modeland to investigate the morphological characteristics of the study area. The results show that theSHORTWAVE-C model can accurately estimate the solar radiation intensity in a complex urbanenvironment under cloudy conditions, and the GPU acceleration method can reduce the computationtime by up to 46%. Two sites with different building densities and rooftop structures were selected toillustrate the influence of urban morphology on the solar radiation and solar illumination duration.Based on the findings, an object-based method was implemented to identify suitable places forrooftop solar panel installation that can fully utilize the solar energy potential. Our study providesuseful strategic guidelines for the selection and assessment of roof solar energy potential for urbanenergy planning.
Keywords: solar radiation; urban area; roof planes; LiDAR; GPU
1. Introduction
Today’s global energy demand still relies largely on fossil fuels [1]. This results in rapid increasein anthropogenic greenhouse gas emissions and overexploitation of natural resources. The issues ofglobal change, energy crisis, and environmental pollution caused by burning fossil fuels have drawnworldwide attention [2]. The pursuit of new renewable energy, such as solar, wind, biomass, nuclear,
Remote Sens. 2015, 7, 17212–17233; doi:10.3390/rs71215877 www.mdpi.com/journal/remotesensing
Remote Sens. 2015, 7, 17212–17233
and hydropower, as substitutions for traditional fossil fuels is an urgent need [2,3]. As a clean andrenewable energy source, solar energy has great potential because of its flexibility and sustainability [4].It was reported that solar power generation grew rapidly (+58%) in the world in 2012, which is higherthan the average growth rate of renewable energy used in power generation (15.2%) [5]. Solar energyis harnessed by using several types of technologies, such as solar heating, solar photovoltaic, and solarphotochemistry. Common urban applications include the solar thermal collector for water heatingand the solar photovoltaic panel placed on building roofs [6,7]. The estimation of the potential solarradiation on building roofs is significantly important for improving the efficiency of solar energyutilization in the urban environment.
The potential of solar energy utilization at a specific site in urban areas, especially in downtownareas, is determined by three factors: the amount of solar radiation reaching the ground, the accessibilityof the receiving solar radiation at a specific location, and the space available for mounting the solarinstruments. The amount and intensity of the shortwave solar radiation at ground level typically varywith geographic location (latitude), season of year, time of day, atmospheric condition (e.g., cloudcoverage, atmospheric transparency), and original Earth surface topography [8,9]. Particularly forurban areas, the emergence of various artificial objects and natural features creates complex urbanmorphology, which has profound influence on the sunlight, shade, and solar radiation access withinurban space [10,11]. Thus, the spatial distribution of solar radiation receiving surface at a given timeand season is largely influenced by the complex urban morphology. In addition, the very limitedspace in urban environment also affects the space available for mounting solar instruments [12,13].Therefore, to fully delineate and quantify the practical solar radiation in the urban area, an assessmentframework needs to include a solar radiation simulation model that deals with various sky conditions,detailed and accurate urban morphological information, as well as the function to identify potentialspaces where solar instruments can most utilize the received solar radiation.
Some spatially explicit solar flux models have been developed to simulate the topographicaleffects on solar radiation variations over time and space (e.g., [8,9,14]). Most of them were designed tomodel the spatio-temporal variations of solar radiation in natural mountainous terrains based on coarseresolution Digital Elevation Models (DEMs) [8,9]. However, coarse resolution surface topography dataare unable to support a reliable and detailed analysis of urban 3D morphology. Besides, high-resolutionsurface topography data is still unavailable for most metropolitan areas. Thus, in previous studies, therehas not been much discussion on the simulation of solar radiation in the urban built-up area. In therecent decade, digital photogrammetry and airborne Light Detection and Ranging (LiDAR) RemoteSensing technology have provided highly accurate and densely sampled topographic measurementsfor surface morphology surveying and mapping in urban environments. Photogrammetry requirestrue-orthophoto generation from aerial photographs, and the produced surface elevation largelydepends on the geometrical resolution and the quality of the aerial images [15,16]. In contrast,surface elevation measurements obtained from airborne LiDAR are quicker and more effective thantraditional photogrammetric techniques [17,18]. Since then, a number of studies have been conductedusing LiDAR data on the urban 3D building modeling [19–23], urban vegetation identification andgreen volume estimation [24,25], and solar potential evaluation in the urban area [26–30]. For example,Yu, et al. [26] demonstrated that the integration of urban Digital Surface Model (DSM) from LiDAR dataand a solar radiation flux model is able to investigate the spatio-temporal variations of solar radiationin downtown Houston. Their study provided a new effective and efficient way to model the impacts ofurban 3D morphology on solar radiation in an urban built-up environment. Santos, et al. [27] estimatedsolar radiation on rooftops by employing GIS-based solar models and LiDAR data, and assessed thephotovoltaic potential of residential buildings in Lisbon, Portugal. Despite valuable findings, theseprevious studies only focused on modeling solar radiation under a clear-sky condition although theatmospheric condition has a significant attenuation influence on solar radiation transmission [31].It has been shown that solar radiation transmission through the atmosphere is normally attenuatedby atmospheric turbidity and cloud cover [32]. Turbidity attenuation is caused by aerosols and
17213

Remote Sens. 2015, 7, 17212–17233
atmospheric gases, which are highly variable in both time and space and often infeasible to bemeasured at the desired resolution for solar radiation simulation at urban scale [33]. For cloud cover,this has the greatest influence on ground level irradiance attenuation [31], particularly for coastal ortropical urban areas. Thanks to the development in satellite technology, cloud cover at urban level cannow be monitored successfully using meteorological satellite data, such as FengYun-2F. FengYun-2F isthe fourth geostationary meteorological satellite operated by China and was launched on 13 January2012. It provides a visible image and four infrared images hourly in normal periods and every 30 minin the flood season. By utilizing FengYun data, cloud influence can be determined and integrated intothe clear-sky solar flux model for handling different sky conditions.
In addition, as high-resolution airborne LiDAR data is employed to represent complex urban3D morphology, high-performance computation techniques are required for fast and accurate solarradiation estimation. A number of high performance geospatial computation approaches havebeen taken to process large remote sensing data, such as cluster computing and hardware-basedacceleration [34]. However, applications of computer clusters are largely restricted by their highcost. The use of a parallel hardware structure makes high-performance computation possible forgeneral purposes, and various techniques have been developed, among which is the GPU (GraphicProcessing Unit) technique that has been increasingly popular in parallel computation. GPU is initiallydesigned to work with CPU (Central Processing Unit) to speed up graphic rendering, and now itcan also be employed as a parallel structure for computation due to its unique design feature [35].Normally a GPU has a much greater number of cores than a CPU, which means that the memoryaccess latency can almost be ignored when running a large number of threads simultaneously [36].Therefore, although the clock rate of a single GPU core is lower than that of a single CPU core, theoverall efficiency of parallel computation on GPU can be much higher. There are two main GPUprogramming architectures available so far, namely NVIDIA’s Compute Unified Device Architecture(CUDA) and ATI’s Close To the Metal (CTM). Hu, et al. [36] compared the efficiency of fast filtering ofLiDAR data using the Open Multi-Processing (OpenMP) method, a technology of multiprocessing inCPU, and NVIDIA’s CUDA, and found that CUDA can increase computational efficiency to a muchlarger extent when compared with OpenMP. CUDA has also been used for solar radiation simulation.For example, Lukac and Žalik [37] employed CUDA and used LiDAR data to estimate the roof’s directand diffuse solar radiance potential in two test locations in Slovenia. A multiresolutional shadowingapproach was taken where the urban area was treated with higher resolution and the surrounding hillyarea with lower resolution. The influence of the vegetation was also considered. Their results showthat the GPU-based CUDA is faster and more efficient compared with the multi-core CPU approachfor solar irradiance computation. To our best knowledge, no research has been reported to simulatethe solar radiation (including direct, reflect, and diffuse radiation) under various cloudy conditionsusing a GPU-accelerated method.
The objective of this paper was two-fold. Firstly, by integrating high-resolution airborne LiDARdata and FengYun meteorological data, we proposed a new GPU-based solar radiation model, namedSHORTWAVE-C, which is updated from the SHORTWAVE model developed by Kumar, et al. [8], toevaluate solar radiation intensity under cloudy condition. The GPU acceleration method ensures thatthe simulation of solar radiation in large spatial scale is practically feasible. Secondly, in terms ofpractical application, an object-based method was adopted to segment building roofs and identifysuitable roofs for enhancing the utilization of solar energy. The next sections are organized as follows.Section 2 introduces the case study area and data collection method. In Section 3, the GPU-based solarradiation model and the object-based method for selecting suitable building roofs are described in detail.In Section 4, the spatio-temporal pattern of solar radiation, efficiency of GPU-accelerated estimation,and selection of suitable roofs are analyzed and discussed. The last section draws some conclusions.
17214

Remote Sens. 2015, 7, 17212–17233
2. Case Study Area and Data Collection
2.1. Case Study Area
Shanghai, the economic center and the largest city of China, is located in the east of the YangtzeRiver Delta, and has a total population of 24 million. It has a humid subtropical climate with a rainyspring and summer. In this study, a rectangular area in downtown Shanghai, the Lujiazui region wasselected for case study (Figure 1). The Lujiazui region is located in the west of Shanghai Pudong NewDistrict and is one of the most prosperous financial centers in China. The study area is ca. 300 ha insize, and has a relatively flat terrain with average elevation height of about 3.5 m. This area representsthe most complex urban landscapes in downtown Shanghai, which is a mixture of modern skyscrapers,residential buildings, and urban greening such as urban green belt and street trees. According to theheight information obtained from airborne LiDAR measurements in 2006, the average building heightof the study area is about 34.9 m, while the tallest building is up to 365.8 m. Two sample areas, AreaA and Area B were selected to illustrate the influence of different urban morphology on the solarradiation variations (Section 4).
Figure 1. The geographic location and Digital Surface Model (DSM) from airborne Light Detection andRanging (LiDAR) data of the Lujiazui region, Shanghai, China.
2.2. Data Collection
The airborne LiDAR data of the Lujiazui region were collected by the Geomatics Center atShanghai Municipal Institute of Surveying and Mapping using the Optech ALTM 3100 system onFebruary, 2006 [38]. The LiDAR point measurements of the last return were provided as x, y, z lists inASCII files. According to the metadata, the mean accuracy of LiDAR measurements is estimated tobe about 10 cm and the average sampling density is one point per 0.6 m2. First, a Triangle IrregularNetwork (TIN) was created from the original LiDAR points cloud. Then, a DSM grid with a 1 m cell sizewas interpolated by using the linear interpolation method. The DSM contains elevation information forall objects and ground features, including buildings and trees. The DSM was used as the input in solarradiation simulation. In addition, to select suitable roofs for solar panels, a normalized DSM (nDSM)data is required. The nDSM is the difference between the DSM and the digital terrain model (DTM),which provides the relative height information of man-made and natural objects above the ground.To generate nDSM, ground points were extracted from the original airborne LiDAR point cloud databy using a progressive morphological filter [39]. Then, these ground points were interpolated to forma DTM grid. After that, the nDSM data were extracted by removing the DTM value from the DSM grid.
17215
Remote Sens. 2015, 7, 17212–17233
The color infrared aerial photograph with 1 m spatial resolution was acquired in February, 2006.The image contains three spectral bands: green, red, and near-infrared. The Normalized DifferenceVegetation Index (NDVI) calculated from the near-infrared band and red band is used to removevegetation from nDSM.
Hourly cloud cover data of Shanghai (from December 2012 to November 2013) was downloadedfrom the FengYun Satellite Data Center (http://satellite.cma.gov.cn). The data were sensed by Visibleand Infrared Spin Scan-Radiometer (VISSR) carried on the FengYun-2F satellite and converted to griddata with a spatial resolution of 0.1˝ ˆ 0.1˝. Since the case study area is smaller than one pixel of thegrid data, the value of the pixel which covers the centroid of the study area is extracted as the cloudamount of the case study area.
3. Methods
3.1. GPU-Based Solar Radiation Model—SHORTWAVE-C
In our previous studies [26,40,41], we adopted and re-implemented the SHORTWAVE model,originally developed by Kumar, et al. [8] and later modified by Zimmermann [42], to simulate thevariations of solar radiation over space and time on the assumption of a clear-sky condition. Althoughwe used a much smaller time interval and a high-resolution DSM to adapt this model to complex urbancontext, the influence of atmospheric condition was ignored. To simulate solar radiation under differentsky conditions, the influence of cloud is required. Some algorithms considering cloud influence havebeen developed in previous studies [43,44], but most of these algorithms are either directly fueledby climatic observations or need a subsequent cloud correction using in situ ground measurementsafter clear-sky simulation. For example, Redweik, et al. [43] calculated the solar energy on buildingroofs and facades by using a solar radiation model associating with observed hourly climatic dataover 30 years from climatic observations. Although the meteorological measurements from in situsensors and stations are accurate and temporally frequent, they are often limited to a small number oflocations in urban areas. In recent decades, meteorological satellite data is capable to provide cloudcoverage with sufficiently high temporal and spatial resolution at medium and large scales. Basedon DSM and FengYun meteorological data, we developed a GPU-based solar radiation model namedSHORTWAVE-C by extending the SHORTWAVE model. The GPU acceleration method ensures thespeed and efficiency of the solar radiation simulation.
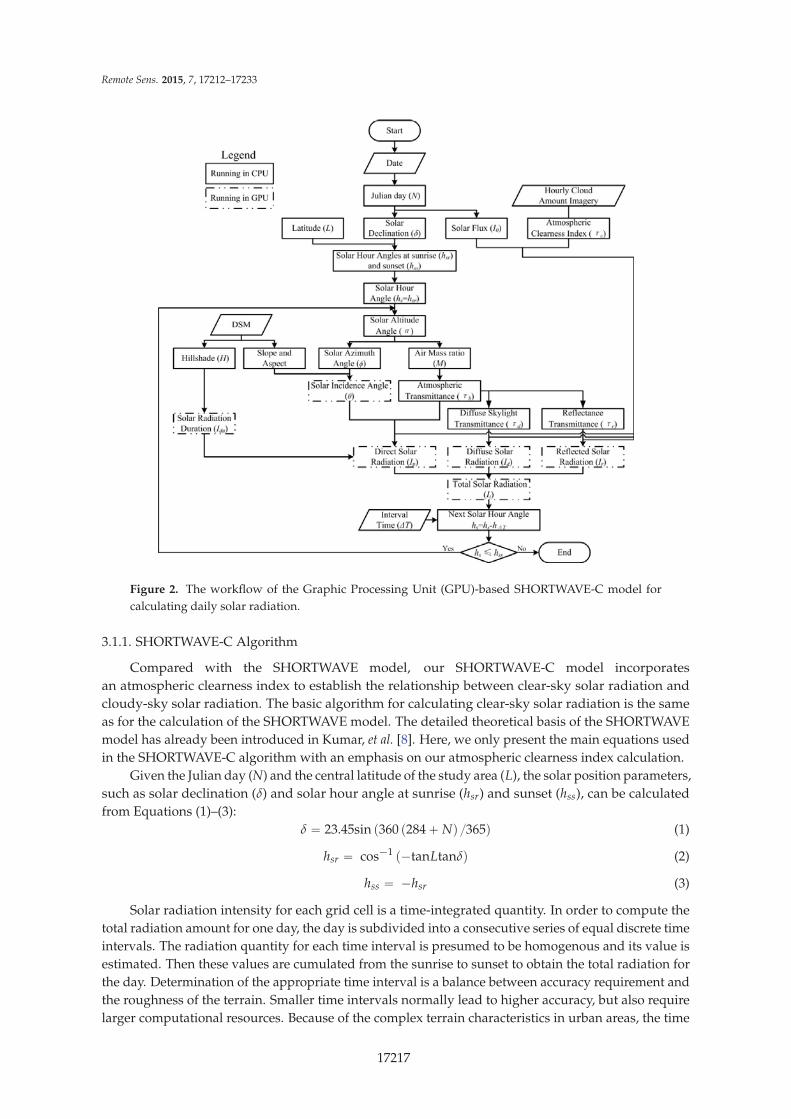
Figure 2 shows the workflow of the SHORTWAVE-C model. The model takes DSM, latitude, date,interval time, and hourly cloud amount image as input, and estimates direct, diffuse, reflected solarradiations, and solar duration under cloudy condition. DSM is obtained from airborne LiDAR data,and is employed to calculate topographic parameters, such as hillshade, slope, and aspect. Date andaltitude are important parameters to calculate solar position. Interval time is set to 10 min. Hourlycloud amount is acquired from FengYun-2F satellite data. Firstly, a relationship is established betweencloud amount and cloud penetration to obtain the atmospheric clearness index. Then solar radiationunder cloudy condition can be calculated from clear-sky radiation and its corresponding atmosphericclearness index. To accelerate solar radiation calculation, we assigned different tasks for CPU andGPU. The following sections give a detailed description of our solar radiation algorithm and GPUacceleration implementation.
17216
Remote Sens. 2015, 7, 17212–17233
Figure 2. The workflow of the Graphic Processing Unit (GPU)-based SHORTWAVE-C model forcalculating daily solar radiation.
3.1.1. SHORTWAVE-C Algorithm
Compared with the SHORTWAVE model, our SHORTWAVE-C model incorporatesan atmospheric clearness index to establish the relationship between clear-sky solar radiation andcloudy-sky solar radiation. The basic algorithm for calculating clear-sky solar radiation is the sameas for the calculation of the SHORTWAVE model. The detailed theoretical basis of the SHORTWAVEmodel has already been introduced in Kumar, et al. [8]. Here, we only present the main equations usedin the SHORTWAVE-C algorithm with an emphasis on our atmospheric clearness index calculation.
Given the Julian day (N) and the central latitude of the study area (L), the solar position parameters,such as solar declination (δ) and solar hour angle at sunrise (hsr) and sunset (hss), can be calculatedfrom Equations (1)–(3):
δ “ 23.45sin p360 p284 ` Nq {365q (1)
hsr “ cos´1 p´tanLtanδq (2)
hss “ ´hsr (3)
Solar radiation intensity for each grid cell is a time-integrated quantity. In order to compute thetotal radiation amount for one day, the day is subdivided into a consecutive series of equal discrete timeintervals. The radiation quantity for each time interval is presumed to be homogenous and its value isestimated. Then these values are cumulated from the sunrise to sunset to obtain the total radiation forthe day. Determination of the appropriate time interval is a balance between accuracy requirement andthe roughness of the terrain. Smaller time intervals normally lead to higher accuracy, but also requirelarger computational resources. Because of the complex terrain characteristics in urban areas, the time
17217

Remote Sens. 2015, 7, 17212–17233
interval for an urban area should be much smaller than that for natural regions [26]. Yu, et al. [26]proved that the appropriate time interval for the high-relief urban area is 10 min, which is muchsmaller than that which Kumar, et al. [8] and Antonic [45] suggested for mountainous terrains whenusing the same accuracy criteria (better than 1%). In this study, we also set 10 min as the appropriatetime interval. The current solar hour angles (hs), which is initialized as hsr, is employed to calculatecurrent solar position, including solar altitude angle (α), solar azimuth angle (φ), and air mass ratio(M) [46,47] using Equations (4)–(6):
sinα “ sinLsinδ ` cosLcosδcoshs (4)
sinφ “ cosδsinhs{cosα (5)
M “”1229 ` p614sinαq2
ı1{2 ´ 614sinα (6)
The solar flux outside the atmosphere (I0) is calculated by using Equation (7) [48]:
I0 “ Sc p1 ` 0.0344cos p360N{365qq (7)
where Sc is the solar constant. In this research, we accepted a solar constant value of 1367 W/m2,which is same as the value adopted by the World Radiation Center.
Then, we estimate the atmospheric transmittance (τb), diffuse skylight transmittance (τd) andreflectance transmissivity (τr) based on Equations (8)–(10) [8]:
τb “ 0.56´
e´0.65M ` e´0.095M¯
(8)
τd “ 0.271 ´ 0.294τb (9)
τr “ 0.271 ` 0.706τb (10)
To calculate the cloud cover influence on the solar radiation, we incorporate an atmosphericclearness index (τc) into our solar radiation model. τc can be calculated by Equation (11) [49]:
τc “ 1 ´ A pC{8qB (11)
where C is the cloudy amount with unit of okta, A and B are two constant coefficients, which are 0.75and 3.4 respectively [50].
The solar incidence angle (θ) between the solar illumination ray and the normal of terrain surfaceis not only influenced by the solar position but also by the topographic features. It can be measuredbased on solar altitude angle (α), solar azimuth angle (φ), surface slope (β), and surface aspect (ω)from Equation (12). The surface slope and surface aspect were both generated from DSM data.
cosθ “ sinβcosαcos pφ ´ ωq ` cosβsinα (12)
Assume that the atmospheric clearness index affect direct, diffuse, and reflected solar radiation inan equal way, so the direct (Ip), diffuse (Id), reflected (Ir), and total (It) solar radiation can be estimatedfrom following equations:
Ip “ I0τbτccosθ (13)
Id “ I0τdτccos2β{2sinα (14)
Ir “ γI0τrτcsin2β{2sinα (15)
It “ Ip ` Id ` Ir (16)
where γ is the surface reflectance coefficient. In this model, γ is set to 0.2 [8].
17218

Remote Sens. 2015, 7, 17212–17233
In addition, hillshade analysis was executed using DSM data with the current solar positioncalculated above. The topographical blocking effect on direct solar radiation is considered in our study.If a grid cell faces away from the solar beam and its slope is larger than solar altitude angle, the solarbeam is below the horizon. In this case, the grid cell has negative cosθ and is in the shadow cast by itself.Shadows cast by surrounding terrain are performed by using the hillshade analysis from ArcGIS. Thedirect solar radiation for grid cells that are shadowed by themselves or surrounding terrain featuresare set to zero. After the hillshade analysis, a pixel with zero hillshade value indicates that this pixel isin shadow, while a pixel with a non-zero hillshade value indicates that pixel is exposed to the sun [26].If a pixel is in shadow, the location at this temporal interval (ΔT) does not receive any direct solarradiation so its illumination duration should be zero. If it is not in shadow, this location is good toreceive solar radiations so its illumination duration should be recorded as ΔT. The solar illuminationtime from sunrise and sunset for a certain day can be calculated using Equations (17) and (18):
D pkq “#
0 i f this pixel is in shadowΔT otherwise
(17)
Idu “Nÿ
k“1
D pkq (18)
where D pkq is the sun illumination duration for one pixel at the kth time interval, k (=1, 2, . . . , N) isthe sequential number of time intervals from the sunrise to sunset in one day, and Idu is the daily solarillumination duration.
The calculation iterates for each time interval. Finally, the solar radiations and the solarillumination duration from sunrise to sunset in one day were accumulated to achieve daily values.In a similar way, the monthly, seasonal, and yearly solar radiation amount were also simulated.
3.1.2. GPU Acceleration
In order to reduce the computational expense and keep the same accuracy for the solar radiationsimulation, an effective way to calculate tremendous datasets is required. In this study, we usedthe CUDA combined Python (CUDA-Python) method to accelerate the solar radiation estimation.CUDA is a convenient and efficient way to implement GPU acceleration because of its enormouscomputational ability and high memory bandwidth [36]. The logical memory in CUDA is structuredhierarchically. Thread is the basic unit in CUDA structure, and these individual threads are typicallyorganized into thread blocks. The highest level is thread grid, which consists of several thread blocks.In addition, the memory type in CUDA is diverse, ranging from local memory to shared memory, andglobal memory. Each thread has its own private local memory. If the threads are in the same threadblock, they can communicate with each other via shared memory. The global memory is used forcommunication between each thread block and host [51]. In CUDA, the function that is called by CPUbut runs in GPU is named the kernel [52].
In this study, to make maximum use of computational resources, we assigned different tasks forCPU and GPU, respectively (Figure 2). The main coding workflow of GPU acceleration includes foursteps: preparing data in CPU, copying data to GPU, running kernel in GPU, and returning data toCPU. Firstly, we used CPU to load topography data and solar position parameters. Topography datalike hillshade, slope, and aspect are obtained from DSM data as raster format using ArcPy, which isa Python package for GIS analysis. In order to easily allocate the threads for each pixel, the shape ofthe raster data is changed from two dimension to one dimension. Before running kernel, data need tobe copied to the GPU global memory from the CPU dynamic random access memory (DRAM) throughCUDA-Python. After predetermining the size of thread grid and thread block, we can call the kernelfunction by CPU. The size of thread grid refers to the number of thread blocks in the thread structure.In this study, four thread blocks are employed to work collaboratively. Each block has its own distinct
17219
Remote Sens. 2015, 7, 17212–17233
job, including calculating the direct radiation, the diffuse radiation, the reflected radiation, and thesolar radiation duration. Because of the limited computation capability of GPU, the size of the threadblock is set to be 1024, which means that 1024 pixels are processed at the same time. Finally, the resultsneed to be transferred to CPU DRAM from GPU global memory and then saved in the hard disk, whilethe input data should be cleared to free the GPU memory.
3.2. Object-Based Method to Locate Suitable Roofs for Utilization of Solar Energy
In this study, we proposed an object-based method to locate suitable spaces where solarinstruments can most utilize the received solar radiation. Our method contains three key technicalcomponents: (1) extract building footprints by using an automated object identification method;(2) segment building roofs into individual roof planes; and (3) select suitable roof planes for enhancingutilization of solar energy.
3.2.1. Automated Extraction of Building Footprints
The urban landscape is a complex mosaic consisting of a diversity of man-made objects suchas high-rise buildings and skyscrapers as well as natural features such as trees. Such limited spacein the urban area makes building roofs the desirable places to install solar panels. In order to focuson the estimation of solar radiation on building roofs, we used an automated object identificationalgorithm [53] to extract a building footprint from original nDSM.
First, a threshold-based segmentation is used to transform the original nDSM to a segmentedbinary image by incorporating vegetation information from color infrared image and heightinformation from nDSM. Those pixels whose NDVI are equal and lower than 0 and relative heightare equal or larger than 3.5 m are recoded as the foreground pixels with a value of 1, while the pixelswhose NDVI are larger than 0 and relative height are less than 3.5 m are recoded as the backgroundpixels with a value of 0. The selection of appropriate threshold values for NDVI and relative heightwere demonstrated by Huang, et al. [24] and Yu, et al. [53], respectively. After segmentation, eachspatially interconnected region of foreground pixels is identified as an individual building object.Then, to eliminate the spurious objects and to smooth the rough boundaries of footprint objects, thefilling operation and closing operation are adopted to obtain reliable and clean building footprints.The extracted building footprints are indexed with a unique identification numbers.
3.2.2. Segmentation of Roof Planes
Traditionally, building roofs are composed of one or more flat planar surfaces, dependingon different roof types. Thus, pixels belonging to the same planar faces should have a similarorientation and topographic gradient, which can be estimated based on aspect and slope from nDSM.A region-growing algorithm [41] was utilized to segment building footprint objects into individual roofplanes. The first pixels of each building footprint object are seen as seed points for the region-growingprocess. If the neighbor pixel in eight directions of each seed point meets all the following threeconditions: (1) this pixel is unlabeled; (2) this pixel belongs to the same footprint object as seed point;(3) slope and aspect difference between this test neighbor pixel and the seed pixel is smaller thana specified threshold value, this neighbor pixel will be labeled and marked with the same identificationnumber as its corresponding seed pixel. After that, we search the new first pixels from the unlabeledpixels and repeat the abovementioned steps until all pixels are labeled. The detailed algorithm andpseudo-code for segmenting roof planes can be found in [41].
After segmentation with the region-growing algorithm, original building footprint objects aretransformed to individual roof planes with homogeneous aspect and slope. Being similar to theextraction of building footprints, a series of morphologic operations including filling operation andclosing operation are used to acquire the reliable roof planes.
17220

Remote Sens. 2015, 7, 17212–17233
3.2.3. Selection of Suitable Locations for Solar Panel Installation
Based on individual roof plane objects, we derived three sets of attributes for each roof plane:(1) geometric attributes; (2) topographic attributes; and (3) solar radiation attributes. Geometricattributes include the geographical location of plane centroid point, roof plane perimeter, and roof planearea. Topographic attributes include average slope and average aspect of roof plane. Solar radiationattributes include monthly, seasonal, and yearly average total solar radiation and solar illuminationduration. The numerical definitions of these attributes are shown in Table 1. These attributes togethergive a comprehensive description of roof solar energy potential in the urban environment.
Table 1. Definition of geometric, topographic, and solar radiation attributes of roof planes.
Attributes Definition
Geometric attributesRoof plane centroid point (xcp; ycp) xcp “ 1
n
nři“1
xi; ycp “ 1n
nři“1
yi
Roof plane perimeter (P) P “ ar ` ?2br
Roof plane area (S) S “ nr2
Topographic attributesAverage slope (A_slope) A_slope “ 1
n
nři“1
slopei
Average aspect (A_aspect) A_aspect “ 1n
nři“1
aspecti
Solar radiation attributes
Monthly average total solarradiation (MA_TSR)
MA_TSR “ 1n
nři“1
MA_TSRi
Seasonal average total solarradiation (SA_TSR)
SA_TSR “ 1n
nři“1
SA_TSRi
Yearly average total solarradiation (YA_TSR)
YA_TSR “ 1n
nři“1
YA_TSRi
Monthly average solarillumination duration (MA_SID)
MA_SID “ 1n
nři“1
MA_SIDi
Seasonal average solarillumination duration (SA_SID)
SA_SID “ 1n
nři“1
SA_SIDi
Yearly average solar illuminationduration (YA_SID)
YA_SID “ 1n
nři“1
YA_SIDi
where n is the number of cells consisting of roof plane, (xi , yi) are the row and column coordinates of the ith cellof the roof plane object, a is the number of boundary cells in horizontal or vertical orientation, b is the numberof boundary cells in diagonal step, r is the grid cell size, slopei is the slope value of the ith cell of the roof plane,aspecti is the aspect value of the ith cell of the roof plane, MA_TSRi is the monthly average total solar radiationof the ith cell of the roof plane, SA_TSRi is the seasonal average total solar radiation of the ith cell of the roofplane, YA_TSRi is the yearly average total solar radiation of the ith cell of the roof plane, MA_SIDi is themonthly average solar illumination duration of the ith cell of the roof plane, SA_SIDi is the seasonal averagesolar illumination duration of the ith cell of the roof plane, YA_SIDi is the yearly average solar illuminationduration of the ith cell of the roof plane.
To select suitable locations for solar panels, Chaves, et al. [54] presented a multi-criteria strategyto determine the desired characteristics of a suitable location, considering suitable elevation, aspect,slope, and high solar radiation. Their study aims to find rooftops facing south or flat and having nottoo steep a slope. In addition, the sites should receive at least some minimum threshold of yearlyaverage solar radiation. Huang, et al. [41] pointed out that the roof plane area is also an importantindicator when installing solar panels because of the installation cost. Besides those previous findings,we also incorporated the sunlight duration when choosing the desirable roof planes. Based on thecharacteristics of the Lujiazui region, we proposed the following desired requirements:
a. Suitable roof plane area. In terms of practical installation of the solar panel on roof planes, thearea of roof plane should not be too small. We defined 10 m2 as the threshold value for our casestudy. If the roof plane area is equal or larger than 10 m2, it will be considered as a potentialinstallation location.
17221

Remote Sens. 2015, 7, 17212–17233
b. Suitable roof plane slope. If the roof plane has a slope that is too steep, it is not appropriate toinstall solar panels. Thus, we chose roof planes whose slope is equal or lower than 45 degrees forinstalling solar panels.
c. Suitable roof plane aspect. As Shanghai is located in the North hemisphere, roof planes facingsouth receive a higher solar radiation than those north-facing. In this study, the aspect should besouth, southeast, southwest facing, or horizontal.
d. High yearly average total solar radiation. The selected positions should receive at least someminimum yearly average solar radiation. The yearly average total solar radiation of buildingrooftops in Lujiazui region ranges from 2.0 to 23.8 MJ/m2/day, and the mean value is around13.1 MJ/m2/day. Thus, we selected 10 MJ/m2/day as the threshold value for the yearly averagetotal solar radiation.
e. Long sunlight duration. To receive stable solar radiation for a long time, the desirable rooftopsshould have long average daily sunlight duration all year round. For building roofs in Lujiazuiregion, the maximum, minimum, and mean value of yearly average solar illumination durationis 11.9, 0, and 5.8 h, respectively. The sites that can receive more than 5 h sunlight are chosen aspotential locations.
4. Results and Discussion
4.1. Spatio-Temporal Distribution of Solar Radiation
By employing the SHORTWAVE-C model and the DSM from airborne LiDAR data, we computeddirect, diffuse, reflected solar radiation as well as the solar illumination duration for each grid cell forevery 10 min from December 2012 to November 2013. The calculated radiations and durations are thensummated from sunrise to sunset to obtain the total amount for one day. The daily solar radiation arefurther summated to get monthly and seasonal average radiation intensity. Figure 3 shows the spatialdistribution of monthly average total solar radiation (including direct, diffuse, and reflected radiation)for the Lujiazui region. To analyze the cloud influence on total solar radiation, we also calculated theseasonal mean total solar radiation simulated by using the SHORTWAVE model, and compared theradiation with the amount obtained from the SHORTWAVE-C model (Figure 4).
Figure 3. Monthly average total solar radiation distribution estimated by SHORTWAVE-C model inthe Lujiazui region.
17222
Remote Sens. 2015, 7, 17212–17233
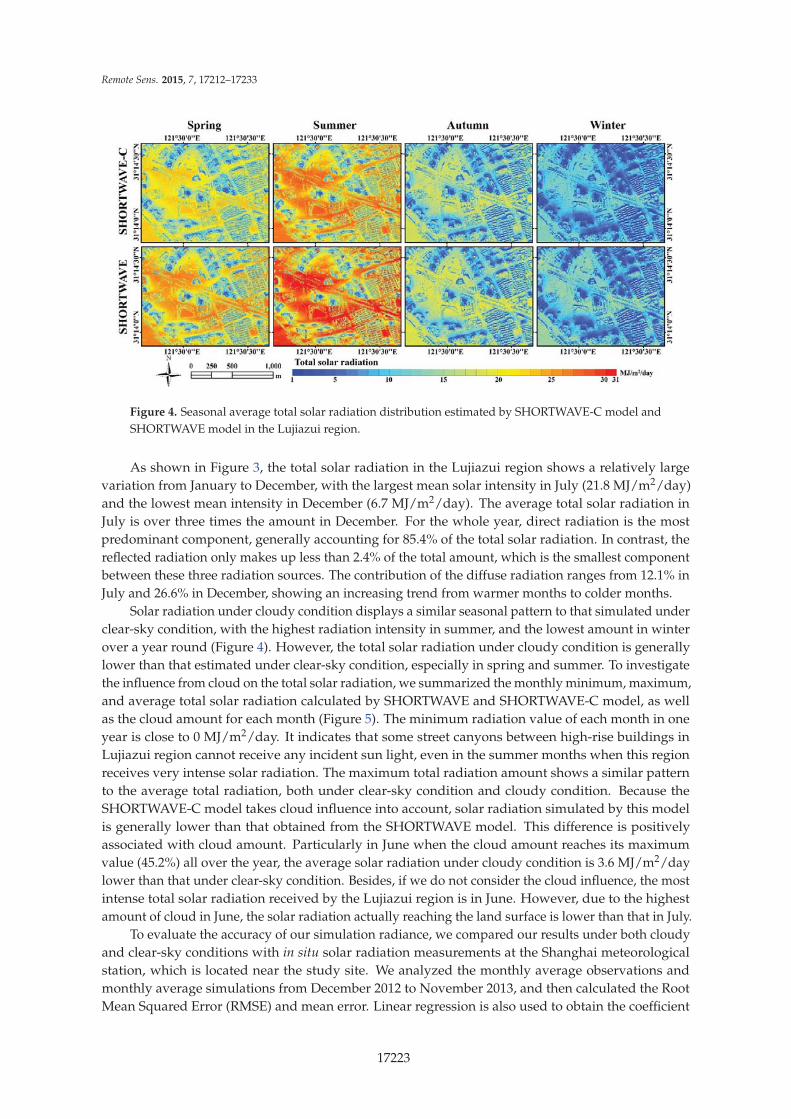
Figure 4. Seasonal average total solar radiation distribution estimated by SHORTWAVE-C model andSHORTWAVE model in the Lujiazui region.
As shown in Figure 3, the total solar radiation in the Lujiazui region shows a relatively largevariation from January to December, with the largest mean solar intensity in July (21.8 MJ/m2/day)and the lowest mean intensity in December (6.7 MJ/m2/day). The average total solar radiation inJuly is over three times the amount in December. For the whole year, direct radiation is the mostpredominant component, generally accounting for 85.4% of the total solar radiation. In contrast, thereflected radiation only makes up less than 2.4% of the total amount, which is the smallest componentbetween these three radiation sources. The contribution of the diffuse radiation ranges from 12.1% inJuly and 26.6% in December, showing an increasing trend from warmer months to colder months.
Solar radiation under cloudy condition displays a similar seasonal pattern to that simulated underclear-sky condition, with the highest radiation intensity in summer, and the lowest amount in winterover a year round (Figure 4). However, the total solar radiation under cloudy condition is generallylower than that estimated under clear-sky condition, especially in spring and summer. To investigatethe influence from cloud on the total solar radiation, we summarized the monthly minimum, maximum,and average total solar radiation calculated by SHORTWAVE and SHORTWAVE-C model, as wellas the cloud amount for each month (Figure 5). The minimum radiation value of each month in oneyear is close to 0 MJ/m2/day. It indicates that some street canyons between high-rise buildings inLujiazui region cannot receive any incident sun light, even in the summer months when this regionreceives very intense solar radiation. The maximum total radiation amount shows a similar patternto the average total radiation, both under clear-sky condition and cloudy condition. Because theSHORTWAVE-C model takes cloud influence into account, solar radiation simulated by this modelis generally lower than that obtained from the SHORTWAVE model. This difference is positivelyassociated with cloud amount. Particularly in June when the cloud amount reaches its maximumvalue (45.2%) all over the year, the average solar radiation under cloudy condition is 3.6 MJ/m2/daylower than that under clear-sky condition. Besides, if we do not consider the cloud influence, the mostintense total solar radiation received by the Lujiazui region is in June. However, due to the highestamount of cloud in June, the solar radiation actually reaching the land surface is lower than that in July.
To evaluate the accuracy of our simulation radiance, we compared our results under both cloudyand clear-sky conditions with in situ solar radiation measurements at the Shanghai meteorologicalstation, which is located near the study site. We analyzed the monthly average observations andmonthly average simulations from December 2012 to November 2013, and then calculated the RootMean Squared Error (RMSE) and mean error. Linear regression is also used to obtain the coefficient
17223

Remote Sens. 2015, 7, 17212–17233
of determination (R2) between the simulated radiation and in situ radiation (Figure 6). The resultsshow that the R2 between simulated value and in situ observations are 0.72 for SHORTWAVE-C and0.62 for SHORTWAVE. The RMSE values for SHORTWAVE-C and SHORTWAVE are 2.8 MJ/m2/dayand 4.1 MJ/m2/day, respectively. The mean error for cloudy results is 0.8 MJ/m2/day, which is1.4 MJ/m2/day lower than clear-sky results. This indicates that the reliability and accuracy of our solarradiation simulated by the SHORTWAVE-C model are significantly better than clear-sky solar estimates.
Figure 5. Monthly average total solar radiation simulated by SHORTWAVE-C and SHORTWAVEmodels, and monthly cloud amount in the Lujiazui region.
Figure 6. Comparison of in situ monthly total solar radiation and simulated monthly total solarradiation from December 2012 to November 2013. (a) Comparison with total solar radiation simulatedby SHORTWAVE-C; (b) Comparison with total solar radiation simulated by SHORTWAVE.
The spatial distribution of solar radiation in the Lujiazui region is largely influenced by complexurban morphology (Figures 3 and 4). For the open space consisting of streets and open plots with
17224
Remote Sens. 2015, 7, 17212–17233
sparsely distributed trees, the spatial variation of solar radiation is quite small, although the radiationshows apparent monthly and seasonal variations. In contrast, the dense skyscrapers and high-risebuildings obstruct sunlight, creating long shades and shadows in business districts and residentialareas, especially in winter months when the sun is located at a lower solar elevation angle. The solarradiation intensity received by skyscraper and residential building rooftops is different. Due tothe complex shape of the skyscraper rooftop itself and the different heights of the surrounding tallbuildings, the solar radiation on the skyscraper rooftop is different. In this case, parts of the skyscraperrooftop might be in shadow while other parts are in sunlight. However, solar radiation on residentialbuilding rooftops has moderate spatial variation for all seasons because of the relatively simple andregular structures.
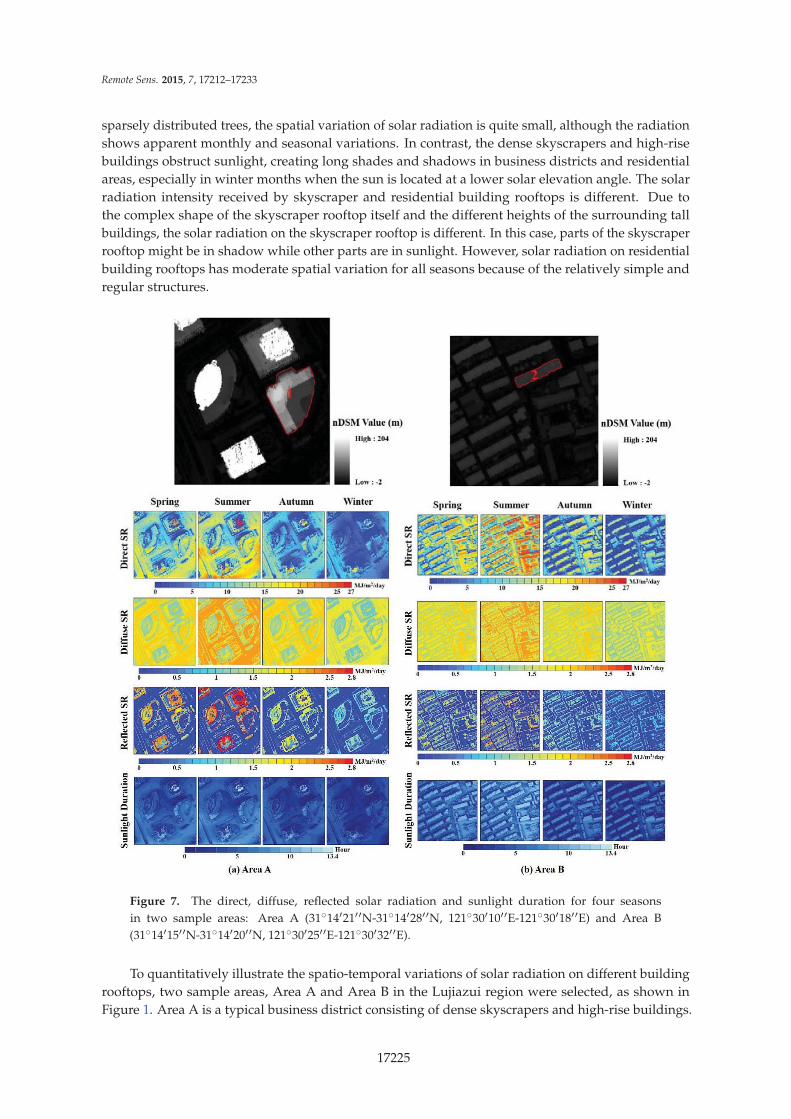
Figure 7. The direct, diffuse, reflected solar radiation and sunlight duration for four seasonsin two sample areas: Area A (31˝1412111N-31˝1412811N, 121˝3011011E-121˝3011811E) and Area B(31˝1411511N-31˝1412011N, 121˝3012511E-121˝3013211E).
To quantitatively illustrate the spatio-temporal variations of solar radiation on different buildingrooftops, two sample areas, Area A and Area B in the Lujiazui region were selected, as shown inFigure 1. Area A is a typical business district consisting of dense skyscrapers and high-rise buildings.
17225

Remote Sens. 2015, 7, 17212–17233
Area B is a part of residential district and with mid-rise buildings as major elements. Since we focusedon the radiance intensity on building rooftops, we also identified two building roofs, roof 1 in AreaA and roof 2 in Area B, to analyze the solar radiation variation. The direct, diffuse, and reflectedsolar radiance, as well as the daily sunlight duration were summarized for four seasons withinthese two sample areas (Figure 7). The results show that the direct radiation is the most importantradiation component both for skyscraper and residential rooftops over the four seasons. However, theresidential building rooftops can receive more direct sun light and longer hours of sun illuminationthan skyscraper rooftops. In summer, the direct radiance amount on rooftop 2 is 19.9 MJ/m2/day,more than 1.7 times higher than that received on rooftop 1. The difference of average daily solarillumination duration is over 4 h between roof 1 and roof 2. This is because the building heights in theresidential district are more similar than those in the business district. The smaller height differencebetween them allows the roof surfaces to receive more direct solar energy, avoiding shadows castby nearby higher-rise buildings. In addition, most of the street canyons and building boundaries inthe business and residential district show relatively lower direct solar radiation and short periods ofillumination duration. Since diffuse radiation is the indirect radiance intensity scattered by atmosphericconstituents, the skyscrapers and residential building rooftops show similar diffuse intensity during allfour seasons. Higher diffuse radiation is found on roof planar surfaces while a lower value is found onbuilding boundaries. In contrast, although the dense skyscrapers block direct sunlight, they contributeto a higher reflected radiance than that on residential rooftops. Even in winter, the reflected radiationof rooftop 1 accounts for 8.9% of the total solar radiation, presenting a higher percentage (+6.1%) incomparison with that of rooftop 2. This indicates that the distance and height difference betweenneighboring buildings, as well as the rooftop structure itself are important for the roof solar energyestimation and thermal environment analysis in down town areas.
4.2. Efficiency of GPU-Accelerated Solar Radiation Model
A general-purpose personal computer is used to test the parallel computational efficiency.The computer has an Intel Core™ 2 Quad CPU Q9400 (four cores and max clock rate is at 2.66 GHz),an NVIDIA GeForce GTX 650 GPU Card with 384 cores and 1024 MB global memory, and Windows 7Ultimate 64-bit Operation System. We computed solar radiation for one day (1 July 2013) using sixdifferent time intervals (ΔT = 5, 10, 15, 30 60 and 120 min), then compared the running time andspeedup ratio with or without CUDA, as shown in Table 2. Speedup ratio defines the ratio between thespeedup time (running time difference) with CUDA and running time duration without CUDA. A chart(Figure 8) was plotted to illuminate the relationship between the interval time and the running time.
Both Table 2 and Figure 8 indicate that using CUDA can significantly improve the computationalpower and increase computational efficiency. The CUDA is able to save more time as the interval timedecreases. When using 120 min as the interval time, the speedup ratio is around 32.2%. While it reaches46.3% when we select 10 min as time interval, which is 14.1% higher than 120 min. The speedup ratioincreases quickly when the interval time is larger than 60 min and becomes steady around 45%~46%when the interval time is less than 60 min. Lukac and Žalik [37] tested their GPU and multi-core CPUapproach on 0.73 km2 part of Maribor city in Slovenia. When they used 15 min time step and 1 m2
per cell resolution, the speedup (the ratio between the running time for CPU processors and GPUprocessors) was 37 times. In our case, when we used 15 min interval time and 1 m2 (1 m ˆ 1 m) percell resolution on the 3 km2 downtown Shanghai, the speedup was only about 1.9 times. The possiblereason for this lower speedup ratio might be that our solar radiation model called hillshade analysisusing ArcPy in ArcGIS for each time interval and cannot work in CUDA framework (Figure 2).Thus, most of the time cost in our model is to perform hillshade analysis multiple times a day. In thefuture, we will try to implement hillshade analysis in GPU to improve the calculation efficiency.
17226

Remote Sens. 2015, 7, 17212–17233
Table 2. Running time with or without Compute Unified Device Architecture (CUDA) andspeedup ratio.
Interval Time (min)Running Time (s)
Speedup Ratio (%)Without CUDA With CUDA
120 187.896 127.407 32.260 331.692 181.385 45.330 537.467 297.858 44.615 991.275 530.285 46.510 1447.410 776.731 46.35 2778.064 1529.491 44.9
Figure 8. Trend of running time with or without Compute Unified Device Architecture (CUDA).
4.3. Suitable Roofs for Utilization of Solar Energy in the Lujiazui Region
A total of 7698 roof planes were identified in the Lujiazui region. To help determine selectionrequirements for solar panels, we summarized and mapped the area, average slope, average aspect,yearly average total solar radiation, and yearly average solar illumination duration of individual roofplanes within the Lujiazui region (Figure 9). The roof planes area varies from 3 m2 to 2407 m2, withlarger plane area in skyscrapers near N Yincheng Rd, Dongyuan Rd, M Yincheng Rd, Dongcheng Rd,E Lujiazui Rd, and Huangyuan Shiqiao Rd (Figure 9a). For most of the residential buildings, their roofplane slope ranges from 0.7 degree to 55 degree, showing smaller variations compared to skyscrapersroof planes (Figure 9b). The mean aspect of roof planes illustrates that the skyscraper roof tops havea more complicated structure than traditional buildings (Figure 9c). In addition, the roof planes ofresidential buildings present higher solar radiation (+5~10 MJ/m2/day) and longer illuminationduration (+2~4 h) than high-rise buildings located in business districts (Figure 9d,e). Table 3 shows theminimum, maximum, and mean value of roof plane area, slope, yearly total solar radiation, and yearlyaverage solar illumination duration in the Lujiazui region. A set of appropriate threshold values wasdetermined to choose suitable roof planes for enhancing the utilization of solar energy, as mentionedin Part 2 Section 3.
Figure 10 shows the distribution and yearly average total solar radiation of suitable roof planes inthe Lujiazui region. 1729 roof planes were selected by considering desirable plane area, slope, aspect,solar radiation intensity, and solar illumination duration. Most of the sunward planes on residentialrooftops were identified as desirable positions to install solar panels, especially for the residentialdistricts near Jimo Rd, S Pudong Rd, Qixia Rd, Dongchang Rd, and Pucheng Rd. The yearly averagesolar radiance in these areas reaches as high as 18–23 MJ/m2/day. In contrast, there are less suitableroof planes on skyscraper rooftops because of the steeper slope and changing orientation. Besides that,
17227

Remote Sens. 2015, 7, 17212–17233
as we discussed before, the larger height differences between high-rise buildings in business districtsoften block direct sun light, causing long shades and shadows on street canyons and maybe parts ofthe rooftops. Thus, the skyscraper roof planes cannot receive more solar radiance than residentialrooftops. The selection results would be useful for providing strategies to improve energy efficiency inthe urban environment.
Figure 9. Five parameters of roof planes for identifying suitable places for rooftop solar panelinstallation in the Lujiazui region. (a) Area (S); (b) Average slope (A_slope); (c) Average aspect(A_aspect); (d) Yearly average total solar radiation (YA_TSR); and (e) Yearly average solar illuminationduration (YA_SID).
17228

Remote Sens. 2015, 7, 17212–17233
Table 3. The minimum, maximum, and mean value for roof plane attributes in the Lujiazui region.
Attributes Min Max Mean
S (m2) 3 2407 53A_slope (degree) 0.7 89.3 44.6
YA_TSR (MJ/m2/day) 2.4 23.0 13.3YA_SID (hours) 0 11.5 5.9
Figure 10. The distribution and yearly average total solar radiation of suitable roof planes in theLujiazui region.
5. Conclusions
Solar energy is becoming increasingly important as an alternative to traditional fossil fuel todeal with the worldwide energy crisis and environmental pollution. The potential of solar energyutilization in urban areas is largely influenced by solar position, atmospheric influence, complexurban 3D morphology, and the space available for mounting solar instruments. Thus, an efficientand accurate method to estimate solar radiation and select suitable places to install solar panels isfundamental in the urban environment. In this study, we proposed a GPU-based solar radiation model,named SHORTWAVE-C, to simulate solar radiation under various sky conditions. Cloud influenceacquired from FengYun-2F meteorological satellite data was integrated into our solar flux model.The GPU acceleration method was utilized to improve the solar radiation calculation. Besidesthat, an object-based method was adopted to locate suitable roof planes for enhancing utilization ofsolar energy.
17229

Remote Sens. 2015, 7, 17212–17233
By using airborne LiDAR data along with hourly cloud amount data from FengYun-2F, wesimulated direct, diffuse, and reflected solar radiation as well as the solar illumination duration inthe Lujiazui region with consideration of cloud influence. Then we summarized monthly, seasonal,and yearly solar radiation, and compared our results with the radiation amount calculated underclear-sky condition. The monthly average total solar radiation shows a relatively large variation fromJanuary to December, with the highest radiation intensity in July (21.8 MJ/m2/day) and the lowestintensity in December (6.7 MJ/m2/day). Direct radiation is the predominant component over a year,contributing more than 85% to the total solar radiation. Since we took cloud amount into account,our estimation presents relatively lower total solar radiation compared with results under clear-skycondition, especially in spring and summer. In addition, complex urban 3D morphology plays animportant role on the spatial distribution of solar radiation in the downtown area. Open space likestreets and open plots can receive more direct sunlight, showing higher total solar radiation than otherspaces. Since the skyscrapers and high-rise buildings obstruct sunlight and cause long shades andshadows, the street canyons among high-rise buildings often show relatively lower solar radiation,particularly in winter when the sun is located at a lower solar altitude angle. The solar radiationintensity on skyscraper rooftops and residential building rooftops is different. Due to the complexrooftop structure and large height difference among surrounding tall buildings, skyscrapers receiveless direct sun light and shorter hours of solar illumination than residential buildings. However, theyaccount for more than 6.1% reflected radiance compared with traditional buildings.
In our research, the GPU acceleration has proved to be a good solution to enhance the efficiencyof solar radiation estimation. Using CUDA is able to save more computation time as interval timedecreases. The speedup ratio reaches up to 46% when we use 10 min as interval time in our case.The results also show that the speedup ratio grows quickly if the interval time is larger than 60 min,but keeps steady (45%–46%) when the time step is less than 60 min.
An object-based method was adopted to segment roof planes and locate suitable planes forenhancing utilization of solar energy. In terms of suitable roof plane area, slope, aspect, total solarradiation, and solar illumination duration, 1729 roof planes were identified in the Lujiazui region.The spatial distribution of suitable locations for solar planes shows that the desirable positions aremostly located on the sunward roof planes in residential districts. The yearly average total solarradiation of those roof planes is more than 16 MJ/m2/day. There are less suitable roof planeson skyscrapers because of the complex rooftop structure and lower solar radiation received ontheir rooftops. This study provides useful strategic guidelines for urban energy planning andsustainable development.
There are still some limitations in our study. FengYun-2F data have been collected since 2012,while our LiDAR data was collected in 2006. So we have to use the DSM in 2006 to simulate solarradiation in 2013, which might have some differences to the real elevation information in 2013. Besidesthat, although our GPU-based SHORTWAVE-C model is effective and efficient, it called the hillshadeanalysis function from ArcGIS for each time interval, which takes a much longer time than directlyprocessing in GPU. In addition, we only employed five threshold-based criteria to select the suitableroofs for utilization of solar panels. In future research, we will try to adopt other algorithms foridentifying desirable roof planes, such as machine learning and object-based classification.
Acknowledgments: This study is supported by the National Natural Science Foundation of China (No. 41471449and No. 41301087), the Natural Science Foundation of Shanghai (No. 14ZR1412200), the Innovation Programof Shanghai Municipal Education Commission (No. 15ZZ026), and the Fundamental Research Funds for theCentral Universities of China. The authors thank China National Satellite Meteorological Center for providingthe FengYun satellite data and China Meteorological Data Sharing Service System for providing the in situ solarradiation measurements.
Author Contributions: Bailang Yu and Jianping Wu conceived and supervised this study. Yan Huang, Zuoqi Chen,Bin Wu, and Bailang Yu designed the data processing procedures. Yan Huang, Zuoqi Chen, Bin Wu, Weiqing Mao,Feng Zhao, and Junhan Wu processed the data. Yan Huang, Zuoqi Chen, Liang Chen, and Bailang Yu analyzedthe results and wrote the paper.
17230

Remote Sens. 2015, 7, 17212–17233
Conflicts of Interest: The authors declare no conflict of interest.
References
1. Van der Hoeven, M. World Energy Outlook 2013; International Energy Agency: Tokyo, Japan, 2013.2. Ramachandra, T.V.; Shruthi, B.V. Spatial mapping of renewable energy potential. Renew. Sustain. Energy Rev.
2007, 11, 1460–1480. [CrossRef]3. Bull, S.R. Renewable energy today and tomorrow. Proc. IEEE 2001, 89, 1216–1226. [CrossRef]4. Solangi, K.H.; Islam, M.R.; Saidur, R.; Rahim, N.A.; Fayaz, H. A review on global solar energy policy.
Renew. Sustain. Enery Rev. 2011, 15, 2149–2163. [CrossRef]5. British Petrol. Statistical Review of World Energy 2013; British Petrol: London, UK, 2013.6. Hassan, M.A.; Beliveau, Y. Design, construction and performance prediction of integrated solar roof collectors
using finite element analysis. Constr. Build. Mater. 2007, 21, 1069–1078. [CrossRef]7. Camargo, L.R.; Zink, R.; Dorner, W.; Stoeglehner, G. Spatio-temporal modeling of roof-top photovoltaic
panels for improved technical potential assessment and electricity peak load offsetting at the municipal scale.Comput. Environ. Urban Syst. 2015, 52, 58–69. [CrossRef]
8. Kumar, L.; Skidmore, A.K.; Knowles, E. Modelling topographic variation in solar radiation in a GISenvironment. Int. J. Geogr. Inf. Sci. 1997, 11, 475–497. [CrossRef]
9. Dubayah, R.; Rich, P.M. Topographic solar radiation models for GIS. Int. J. Geogr. Inf. Syst. 1995, 9, 405–419.[CrossRef]
10. Robinson, D. Urban morphology and indicators of radiation availability. Sol. Energy 2006, 80, 1643–1648.[CrossRef]
11. Li, D.H.W.; Wong, S.L. Daylighting and energy implications due to shading effects from nearby buildings.Appl. Energy 2007, 84, 1199–1209. [CrossRef]
12. Levinson, R.; Akbari, H.; Pomerantz, M.; Gupta, S. Solar access of residential rooftops in four Californiacities. Sol. Energy 2009, 83, 2120–2135. [CrossRef]
13. Zhai, X.Q.; Wang, R.Z. Experiences on solar heating and cooling in China. Renew. Sustain. Energy Rev.2008, 12, 1110–1128. [CrossRef]
14. Fu, P.; Rich, P.M. A geometric solar radiation model with applications in agriculture and forestry.Comput. Electron. Agric. 2002, 37, 25–35. [CrossRef]
15. Barazzetti, L.; Brumana, R.; Oreni, D.; Previtali, M.; Roncoroni, F. True-orthophoto generation from UAVimages: Implementation of a combined photogrammetric and computer vision approach. ISPRS Ann.Photogramm. Remote Sens. Spat. Inf. Sci. 2014, 1, 57–63. [CrossRef]
16. Szabó, S.; Enyedi, P.; Horváth, M.; Kovács, Z.; Burai, P.; Csoknyai, T.; Szabó, G. Automated registration ofpotential locations for solar energy production with Light Detection And Ranging (LiDAR) and small formatphotogrammetry. J. Clean. Prod. 2015. [CrossRef]
17. Gamba, P.; Houshmand, B. Digital surface models and building extraction: A comparison of IFSAR andLIDAR data. IEEE Trans. Geosci. Remote Sens. 2000, 38, 1959–1968. [CrossRef]
18. Priestnall, G.; Jaafar, J.; Duncan, A. Extracting urban features from LiDAR digital surface models.Comput. Environ. Urban Syst. 2000, 24, 65–78. [CrossRef]
19. Sun, S.; Salvaggio, C. Aerial 3D building detection and modeling from airborne LiDAR point clouds. IEEE J.Sel. Top. Appl. Earth Obs. Remote Sens. 2013, 6, 1440–1449. [CrossRef]
20. Sun, S. Automatic 3D Building Detection and Modeling from Airborne LiDAR Point Clouds. Ph.D. Thesis,Institute of Technology, New York, NY, USA, 2013.
21. Zhou, Q.Y.; Neumann, U. Fast and extensible building modeling from airborne LiDAR data. In Proceedingsof the 16th ACM SIGSPATIAL International Conference on Advances in Geograpic Information Systems,Irvine, CA, USA, 5–7 November 2008; pp. 1–8.
22. Lafarge, F.; Descombes, X.; Zerubia, J.; Pierrot-Deseilligny, M. Automatic building extraction from DEMsusing an object approach and application to the 3D-city modeling. ISPRS J. Photogramm. Remote Sens.2008, 63, 365–381. [CrossRef]
23. Arefi, H. Levels of detail in 3D building reconstruction from LiDAR data. Int. Arch. Photogramm. RemoteSens. Spat. Inf. Sci. 2008, 37, 485–490.
17231

Remote Sens. 2015, 7, 17212–17233
24. Huang, Y.; Yu, B.; Zhou, J.; Hu, C.; Tan, W.; Hu, Z.; Wu, J. Toward automatic estimation of urban greenvolume using airborne LiDAR data and high resolution remote sensing images. Front. Earth Sci. 2013, 7,43–54. [CrossRef]
25. Wu, B.; Yu, B.; Yue, W.; Shu, S.; Tan, W.; Hu, C.; Huang, Y.; Wu, J.; Liu, H. A voxel-based method forautomated identification and morphological parameters estimation of individual street trees from mobilelaser scanning data. Remote Sens. 2013, 5, 584–611. [CrossRef]
26. Yu, B.; Liu, H.; Wu, J.; Lin, W. Investigating impacts of urban morphology on spatio-temporal variations ofsolar radiation with airborne LIDAR data and a solar flux model: A case study of downtown houston. Int. J.Remote Sens. 2009, 30, 4359–4385. [CrossRef]
27. Santos, T.; Gomes, N.; Freire, S.; Brito, M.; Santos, L.; Tenedório, J. Applications of solar mapping in theurban environment. Appl. Geogr. 2014, 51, 48–57. [CrossRef]
28. Verso, A.; Martin, A.; Amador, J.; Dominguez, J. GIS-based method to evaluate the photovoltaic potentialin the urban environments: The particular case of Miraflores de la Sierra. Sol. Energy 2015, 117, 236–245.[CrossRef]
29. Martín, A.M.; Domínguez, J.; Amador, J. Applying LiDAR datasets and GIS based model to evaluate solarpotential over roofs: A review. AIMS Energy 2015, 11, 326–343. [CrossRef]
30. Jo, J.H.; Rose, Z.; Cross, J.; Daebel, E.; Verderber, A.; Kostelnick, J.C. Application of airborne LiDAR data andgeographic information systems (GIS) to develop a distributed generation system for the town of normal, IL.AIMS Energy 2015, 3, 173–183. [CrossRef]
31. Kim, D.; Ramanathan, V. Solar radiation budget and radiative forcing due to aerosols and clouds. J. Geophys.Res. Atmos. 2008, 113. [CrossRef]
32. Tooke, T.R.; Coops, N.C.; Christen, A.; Gurtuna, O.; Prevot, A. Integrated irradiance modelling in the urbanenvironment based on remotely sensed data. Sol. Energy 2012, 86, 2923–2934. [CrossRef]
33. Kasten, F. The linke turbidity factor based on improved values of the integral rayleigh optical thickness.Sol. Energy 1996, 56, 239–244. [CrossRef]
34. Lee, C.A.; Gasster, S.D.; Plaza, A.; Chang, C.I.; Huang, B. Recent developments in high performancecomputing for remote sensing: A review. IEEE J. Sel. Top. Appl. Earth Obs. Remote Sens. 2011, 4, 508–527.[CrossRef]
35. Zhang, J.; You, S. High-performance quadtree constructions on large-scale geospatial rasters using GPGPUparallel primitives. Int. J. Geogr. Inf. Sci. 2013, 27, 2207–2226. [CrossRef]
36. Hu, X.; Li, X.; Zhang, Y. Fast filtering of LiDAR point cloud in urban areas based on scan line segmentationand GPU acceleration. IEEE Geosci. Remote Sens. Lett. 2013, 10, 308–312.
37. Lukac, N.; Žalik, B. GPU-based roofs’ solar potential estimation using LiDAR data. Comput. Geosci. 2013, 52,34–41. [CrossRef]
38. Feng, Y.; Guo, R.; Cheng, Y. Research on three dimentional city model reconstruction based on LiDAR.Geomat. Spat. Inf. Technol. 2008, 31, 8–11. (In Chinese)
39. Zhang, K.; Chen, S.; Whitman, D.; Shyu, M.; Yan, J.; Zhang, C. A progressive morphological filter forremoving nonground measurements from airborne LiDAR data. IEEE Trans. Geosci. Remote Sens. 2003, 41,872–882. [CrossRef]
40. Hu, Z.; Wu, J.; Wu, B.; Shu, S.; Yu, B. Simulating and mapping the variations of solar radiation at the Lujiazuiregion of shanghai using airborne LiDAR data. In Proceedings of the 2010 International Conference onRemote Sensing, Hangzhou, China, 5–6 October 2010; pp. 305–308.
41. Huang, Y.; Yu, B.; Hu, Z.; Wu, J.; Wu, B. Locating suitable roofs for utilization of solar energy in downtownarea using airborne LiDAR data and object-based method: A case study of the Lujiazui region, Shanghai.In Proceedings of the 2012 Second International Workshop on Earth Observation and Remote SensingApplications (EORSA), Shanghai, China, 8–11 June 2012; pp. 322–326.
42. Zimmermann, N.E. Calculation of Direct Solar Radiation (n-lat_ corrected). Available online:http://www.wsl.ch/staff/niklaus.zimmermann/programs/aml.html (accessed on 20 October 2007).
43. Redweik, P.; Catita, C.; Brito, M. Solar energy potential on roofs and facades in an urban landscape. Sol. Energy2013, 97, 332–341. [CrossRef]
44. Ruiz-Arias, J.A.; Tovar-Pescador, J.; Pozo-Vázquez, D.; Alsamamra, H. A comparative analysis of DEM-basedmodels to estimate the solar radiation in mountainous terrain. Int. J. Geogr. Inf. Sci. 2009, 23, 1049–1076.[CrossRef]
17232

Remote Sens. 2015, 7, 17212–17233
45. Antonic, O. Modelling daily topographic solar radiation without site-specific hourly radiation data.Ecol. Model. 1998, 113, 31–40. [CrossRef]
46. Kreith, F.; Kreider, J.F. Principles of Solar Engineering; Hemisphere Publishing Corporation: Washington, DC,USA, 1978.
47. Cartwright, T.J. Modeling the World in a Spreadsheet: Environmental Simulation on a Microcomputer; JohnsHopkins University Press: Baltimore, MD, USA, 1993.
48. Duffie, J.A.; Beckman, W.A. Solar Engineering of Thermal Processes; Wiley: New York, NY, USA, 1980.49. Kasten, F.; Czeplak, G. Solar and terrestrial radiation dependent on the amount and type of cloud. Sol. Energy
1980, 24, 177–189. [CrossRef]50. Gul, M.S.; Muneer, T.; Kambezidis, H.D. Models for obtaining solar radiation from other meteorological data.
Sol. Energy 1998, 64, 99–108. [CrossRef]51. NVIDIA Corporation. NVIDIA Compute Unified Device Architecture Programming Guide Version 2.0; NVIDIA
Corporation: Santa Clara, CA, USA, 2008.52. Kirk, D. NVIDIA CUDA software and GPU parallel computing architecture. In Proceedings of the 6th
International Symposium on Memory management, Montreal, QC, Canada, 21–22 October 2007; pp. 103–104.53. Yu, B.; Liu, H.; Wu, J.; Hu, Y.; Zhang, L. Automated derivation of urban building density information using
airborne LiDAR data and object-based method. Landsc. Urban Plan. 2010, 98, 210–219. [CrossRef]54. Chaves, A.; Bahill, A.T. Locating sites for photovoltaic solar panels. ArcUser 2010, 13, 24–27.
© 2015 by the authors; licensee MDPI, Basel, Switzerland. This article is an open accessarticle distributed under the terms and conditions of the Creative Commons by Attribution(CC-BY) license (http://creativecommons.org/licenses/by/4.0/).
17233