ESTIMATING RED SALMON ESCAPEMENTS BY...
19
UNITED STATES DEPARTMENT OF THE INTERIOR, Stewart L. Udall, Secretary FISH AND WILDLIFE SERVICE, Clarence F. Pautzke, Commissioner BUREAU OF COMMERCIAL FISHERIES, Donald L. McKernan, Director ESTIMATING RED SALMON ESCAPEMENTS BY SAMPLE COUNTS FROM OBSERVATION TOWERS BY CLARENCE DALE BECKER FISHERY BULLETIN 192 From Fishery Bulletin of the Fish and Wildlife Service VOLUME 61 (Contribution No. 81, College of Fisheries, University of Washington] Published by the Fish and Wildlife Service. Washington. 1962 Printed at the U.S. Government Printing Office, Washington For sale by the Superintendent of Documents, U.S. Government Prlntlnil Office· . Washington 25, D.C. - Price 20 cents
Transcript of ESTIMATING RED SALMON ESCAPEMENTS BY...

UNITED STATES DEPARTMENT OF THE INTERIOR, Stewart L. Udall, Secretary
FISH AND WILDLIFE SERVICE, Clarence F. Pautzke, Commissioner
BUREAU OF COMMERCIAL FISHERIES, Donald L. McKernan, Director
ESTIMATING RED SALMON ESCAPEMENTS
BY SAMPLE COUNTS FROM
OBSERVATION TOWERS
BY CLARENCE DALE BECKER
FISHERY BULLETIN 192
From Fishery Bulletin of the Fish and Wildlife Service
VOLUME 61
(Contribution No. 81, College of Fisheries, University of Washington]
Published by the Fish and Wildlife Service. Washington. 1962Printed at the U.S. Government Printing Office, Washington
For sale by the Superintendent of Documents, U.S. Government Prlntlnil Office·. Washington 25, D.C. - Price 20 cents

Library of Congress catalog card for the series, Fishery Bulletin of the Fishand 'Vildlife Service:
u.s. Pish and Wlldlife 8erllice.Fishery Bulletin. v. 1-
Washington, U. S. Govt. Print. Off., 1881-19
v. in illus.. maps (part fold.) 23-28 em.
Some vols. issued in the congressional series as Senate or Housedocuments.
Bulletins COlllposing v. 47- also numbered 1-Title varies: v. 1-49, Bulletin.Vols. 1-49 issued by Bureau of Fisheries (called Fish Commission,
v.1-23)
1. Fisheries-U. S. 2. Fish-culture-U. S. I. Title.
SHll.A25
Library of Congress
639.206173
[59r55b1)
9-35239*

CONTENTS'Page
Method of observation____ _______ __ __________ _____ ____ ______ __ __ __ __ _________ 355Tower locations ~ ______________________________________ 357Background panels______________________________________________________ 358Turbulence reducers_ ____________________________________________________ 358Counting aids . • _____________ 359
Estimation of the runs ~ _________________________________________________ 360Method of sampling_ ____________________________________________________ 360Method of calculation ___________________________________________________ 361Resul ts . : ________________________ 361
Factors influencing visual counts_ _____________________________________________ 362Errors introduced by individual counters__ _________________________________ 362Errors associated with migration intensity ______________________________ 362Effect of weather conditions_ _____________________________________________ 363Effect of disrupted migration pattern_ _____________________________________ 364
Accuracy of estimates_ _______________________________________________________ 364Effect of interruptions in the counts_ ______________________________________ 364Population fluctuations ~ ~ ________________ 365Confidence limits of the 1959 escapement_ __________________________________ 366Effect of changing the sampling design · 367
Summary__________________________________________________________________ 368Literature cited' . ___ 369
III

.ABSTRACTThe method of estimating red-salmon escapements used from 1955 to 1959 on the
Kvichak River (Alaska) involved taking visually systematic sample counts as the fishpassed observation towers beside the paths of migration. The counts followed a. sampling design which fluctuated in extent of coverage with the intensity of the run. Thisreport describes in detail the method of sampling' and calCUlating the escapement estillIates, !lullIlllarizes the counts for each year, and discusses the accuracy of the estimates.

ESTIMATING RED SALMON ESCAPEMENTS BY SAMPLE COUNTS
FROM OBSERVATION TOWERSBy CLARENCE DALE BECKER, Fishery Biologist
Fisheries Research Institute, College of Fisheries,University of Washington, Seattle, Wash.
The Kvichnk River system of western Alaskais the foremost producer of red or sockeye salmon,Onco1'l/.:ynchu'S ne1'k(t ('Walbaum), for the BristolBay commercinl fishery. Since 1955, a series ofbiological investigations on the red salmon of thissystem has been eonducte(l by the Fisheries Research Institute of the University of ·Washington.A major aspect of the investigation has been toestimate the. numbers of adult red salmon whichcompose the annual spa.wning escapement.
The method of estimation developed by theInstitute involves systematic visual sample countsof the transient bands of migrants, taken in thenutin river after the fish have passed through thefishery and before they have dispersed throughoutthe spawning grounds. 'When the numbers of fishin the commercial catch are added, the total returncan be detel'lnined. In addition, when the dataare coupled with age analysis of scale samples fromboth the catch 'and the escapement, accurate estimates can be mnde of the number of adults in eachage gl'OUp retuming from a given year of spnwnin~ and from It given year of seaward migration.
It, is the j)mpose of this report to: (1) describein (letail the count.ing method, (2) summarize. thecounts from the years 1955 to 1959, and (3) discussthe factors influencing the estimation. The techniques discussed are the results of 5 years of research on the Kvichak.
This method of estimating a salmon esca.pementfrom towel' counts made from observation towersin Bristol Bay, Alasklt, was proposed by VV'. F.Thompson in the spring of 1953, and he organizedj'he initial experiment on the 'Vood River in thatsame summer (Fisheries Research Il1stitute, 1955;Thompson and Clancy, 1959). The success of thismethod prompte(l repetition the following year,
NOTE.-AllprO\·~d for puhlicutioll Jun. 30, 1961. Fishery Bul·letlu 192.
with expansion to the Kvichak River system in1955. 1111956 and 1957, the Bureau of CommercialFisheries, U.S. Fish and W'ildlife Service, compared estimates from tower counts with those fromthe weirs on the Egegik River and found insignificant differences in total numbers of fish (Bureau ofCommercial Fisheries, 1956 and 1957). In 1957,for the first time the escapements to all major redsalmon streams in Bristol Bay were assessed fromintermittent visual counts made from towers alongthe river banks.
The Kvichak River is about 57 miles long, draining from Iliamna Lake and following a twistingcourse through flat tundra country before flowinginto K vichak Ba:y (fig. 1). Its lower 43 miles isinfluenced by tides and the river has a mean depthof about 10 feet. From the head of tide.water, abroad area of numerous shallow channels calledthe Kaskanak Flats extends uprivel' 8 miles. Fromthe flats to the outlet of Iliamna Lake, a distance of4 miles, the river is restricted, to a deeper c.hannelthat contains a few islands and gravel bars.
The system drains a ,vat.ershed of 7,700 squaremiles, which includes a profusion of lal{es andconnect.ing or tributary streams. Iliamna Lakealone is 77 miles long and from 8 to 20 miles wide.Chtrk Lake, connected to Iliamna Lake by .t.heNewhalen .River, is 52 miles long and from 1. to4 miles wide (U.S. Army Corps of Engineers,1957). Extensive red salmon spawning groundsnre distributed in streams, in spring ponds, andon beaches throughout the area.
As the Kvichak River empties into t.he ocean itisjoined by first the .A:lagnak and then t.he Naknek.River. These st.reams each sustain their ownpopulations of red salmon, which mix as theyarrive from ocean feeding grounds and encounterthe commercial fishery in the Kvichak-Naknekdistrict.
855

356
N
FISHERY BULLETIN OF THE FISH AND WILDLIFE SERVICE
NEWHALEN
NAKNEK
FIGURE 1.-Kvichak River system: one of the principal spawning areas for red salmon in the Bristol Bay region ofwestern Alaska.
The Kvichak-Naknek district is one of severalareas in Bristol Bay in which commerical fishingis permitted. The fishery came into large production at the turn of t.he century. Continuouscatch and pack records since that time show tremendous fluctuations in abundance of red salmonfrom year to yen,r. These fluctuations haveformed a cyclic. pattem with penk catches usuallyoccurring every 4 or 5 years. From 1910 to 1958,the average annual catch was 9 million fish. Thepea.k catch was taken in 1938 when 21 million redsalmon were supplied to local canneries. Since1938, ho\vever, the cycles tended to decline, andthe cat.ch reached n 60-year low of 923,000 fish in1958.
Accurate estimat.es of escapements into theKvichak River system are lacking for the yearsprior to 1955.· In only one year was the entireescapement counted: in 1932, when the Bureau of
Fisheries p·assed 5,065,000 salmon througl~ a weiron the upper river (U.S. Bureau of Fisheries,1933). CO~ltinued enumeration by weirs provedimpractical because of excessive costs of construct.ion and maintenance, hence, their use wasdiscontinued.
Catches have been used in some areas as indicesto escapements. But catches in the KvichakNaknek district include fish destined ·for theKvichak, Na.Imek, and.Alagnak Rivers, and to alesser extent, the Egegik River. In addition, yearly changes in the distribution of gea.r, the intensityof the fishery, and contributions of the variousruns, all vary the relation between catch and escapement. For these reasons, the catches are poorindices to red salmon escapements up the KvichakRiver.
Estimates of the numbers of salmon on thespawning grounds, obtained from aerial surveys,

RED SALMON COUNTS FROM. OBSERVATION TOWERS 357
have also been used as means of determining theescapements. However, detailecl surveys of the.numerous and widely distributed spawning areasof Iliamna Lake in t.he past 5 years have failedto revea.! more than 20 percent. of t.he estimatedtotal Kvichak . migration as determined fromobservation-tower counts. This percent.age hasvaried from year to year; also t.he relative numberof t.ot.al spawners in each major spawning areahas varied from year to year, irrespective of thesize of the escapement. Hence, indices based oncounts of spawning fish in the Kvichak Riversystem appear t.o be highly unreliable.
METHOD OF OBSERVATION
The sample-co~Ult.method of estimating esca,pement.s is based on the migra.tory habits of redsa.lmon as they move up the I'iveI' t.oward the areain. which they originated. Salmon first appear inthe Kviehak River the latter part of June andcontinue t.o ..pass upriver throughout July, with amigration peak occurring near the middle of themonth. Onoo in t.he rivel' t.he fish seek places wherecurrents a·re reduced. Since areas of low currentsare usually found near t.he bot.tom and next. to thebanks, t.he migrants follow restricted paths closeto the shore where they can be readily observed.This habit is quite consistent in sections abovetidewater where the river is confined to a singlechannel and where there are swift midstreameurrents.
It has been found t.hat current velocities 6 inchesfrom t.he bottom at the sites where t.he counts aretaken range from 1.55 to 2.13 ft. a second, whilet.hose 6 inches from the surface range from 2.34to 3.34 it. a second. In 1959, the migrants passedupriver at. Illl average relative speed of 1.52 ft. asecond against the bottom eurrents. .
Varying water levels influence the paths takenby the fish. Red salmon generally follow the banksmore closely when the water level is high becauseof the relatively grenter area of deep and quietwater close to shore. Kvichak water levels at thefirst of July have varied more than 2 feet fromyear to year, and usually rise from 8 to 14 inchesduring that month.
Fish appear in small sepa.rat.e schools when thesize of the run is low. As the magnitude increases,the schools become larger and ext.end unt.il the fishare pa.ssing in continuous bands. Th~ separate
schools behave some.what erratically, but when themigration intensity is high the fish a·re less waryltnd follow t.he banks more closely. The dfrectionof lnigration is' usually continuously upriver.Qnly a. few fish return downstream at the K vichakcounting site, and t.hese occur invariably near theend of t.he migration. Slack wat.er areas andsloughs are utilized by some individuals to rest.These fish commonly bear injuries from gill :p.et.sa-n~ preda-tors in the ocean.
From extensive beach seining the Kvichak Rivereseapement.s have been found to consist almostentirely of red salmon. Ot.her species of salmonoccur in the seine samples largely near the end ofthe migration, and make. up less than 0.5 percentof t.he t.ot.a.l escapement.s. The other species areomitted from the counts when identified from thetowers, and therefore the possible error caused byincluding species other. than red salmon is verysmall. .
The visual eounts are taken from towers erectedat suit.able loeat.ions, aided by. use of baekgroundpanels to silhouette t.he fish, turbulence reducers t.osmooth the surface, a.nd ot.her special countingaids. Once all migration pat.hs can be observedclearly, it. is rela.t.ively simple to count during sampling periods of predet~rmined length and t.oest.imate t.he tot.al escapement·.wit.h a. high degreeof accuracy.
Tower Locations
'The migratory habits of the fish and the physical characteristics of the Kvichak River limit thenumber of suitable sites for observation towers.The river below.Kaskanak Flats is turbid and subject. to tides that periodically reverse current flow.Migrants filt.er through the channels of the flat.sin numerous locations.. Consequently, t.he· mostpractieal counting sites are limited to the areaabove the flats. The counting sites selected arenear the outlet of Iliamna Lake close t.o the villageof Igiugig and more than 50 'miles upriver (fig. 1).
For peak efficiency," towers should be locatedwhere the moving ba.nds of fish are constricted inwidth and pass without deviating from near thebase of the structures. Since the river near Igiugigis split by an island, three towers are required(fig. 2). TO'Yers No.1 and No.2 provide forsampling of the two prima.ry paths in the mainchannel, which has a width of 380 feet and amaximum depth of about 16 feet. Tower No.3

358 FISHERY BULLETIN OF THE FISH AND WILDLIFE SERVICE
covers a shallow secondary channel through whichthe fish migrate when the water level is high. Nofish passed through this secomhtry chttnnel in 1957and 1959 because of low water levels. The heaviest runs generally pass at tower No.1 where asteep gradient and swift midstream cun-ents tendto hold the salmon inshore where they pass in ana·rrow band.. At tow~r No.2, the gradient ismore moderate and currents are reduced. Consequently, the fish spread over a broader area, particularly after the tower has been erected.
Tower No.1 was constructed from spruce timbers on the right (west) bank of the river. TowerNo.2 was afloat, constructed of aluminum scaffolding and assembled on t.wo skiffs which werelashed together and anchored off the right side ofan island and on the left (east) side of the river(fig. 3). Tower No.3 was also of aluminum scaffolding, anci was located on the left (east) bankwhere the entire secondary channel could be observed.
., BARS OR SHALLOWS
,1"1
III~~ MIGRATION PATHS
11: 1
• COUNTING TOWERS
RIGHT (WEST) BANK
LEFT (EAST) BANK
,-{1/~ILIAMNA
LAKE
(}BAY N
f
FIGURE 2.-Towe-l" sites and paths of migrating fish on theKvlchak River, near Igiugig.
During sunny, calm days when the water isclear, salmon can be seen at any point in the riverbetween towers No. 1 and No.2. Only occasionally have they been seen near the middle and thennever in a migrating band. Hence, we are confident that the salmon seen near the towers represent closely the entire migration passing at a giventime.
Background Panels
Since fish blend with bottom contours makingaccurate counting difficult, panels were installedon the river bottom at the towers to silhouette. thesalmon passing. The blending is particularlycamouflaging under conditions of semiturbidwaters, overcast skies, and distorted river surfaces.· The panels were painted a, light gray tomake the salmon visible under an but the most adverse conditions. As a rule, the' fish will passreadily over any panel of dark or dull tones inpreference to panels of bright tones. Such panelsare particularly important for counting fish atnight when a,rtificiallights must be used.
In addition to revealing fish, panels must notstartle the migrants, must be easy to install, andmust resist deterioration in the current. Panelsof 16-gage woven-wire screen of ~-inchmesh haveproved satisfactory. These panels are 3 feet wide,10 feet long, and reinforced along the edges byI-inch iron pipe (fig. 4). When placed in position, the panels extend out and downstream acrossthe migration paths. Stakes of ~~inch iron pipe,18 inches long, are driven .through Inetal loops tohold the panels in position.
Turbulence Reducers
Surface distortions resulting from rain, wind,waves, and bottom contours detract from accuracyof counting by reducing visibility. Turbulencereducers, an arrangement of boards and logs utilized to eliminate surging currents and wave action (fig. 5), are used t.o smooth the surface ofthe water over the panels so that the migrantscan be readily seen. The wooden float is on thesurface of the river immediately upstream fromthe panels and should not startle the fish by bobbing in the current or with vibrating anchor lines.Normally 4 feet of water is necessary before fishpass undernea.th undisturbed.

RED SALMON COUNTS FROM OBSERVATION TOWERS 359
FIGURE 3.-Towt'r XI). 2. tht' floating towt'r from which migrating red salmon were counted on the Kvichak River.
FIGURE -t.-Background panel used on river bottom tosilhouette passing fish. Pin and driving l'od in f-oregl'ouml, (Photograph by E. F. Marten.)
Three types of. turbulence redu~l!s have beenused. The simplest was n log placed diagonally'aci;oss the current. The second" was a large vframe, constructed from two or more timbers andplaced with tlll~ apex upstream. TIle third andmost efficient. was a· moclification of the second, inwhich the effectivel1ess was inereased by addingvert.ical piekets about 18 inches long and 3 inches
595880 0-61-.-'-2
apltrt to straighten subsurface currents. The latter type was originally developed and tested bythe Fish and "Wildlife Serviee on the Naknek Riverin 1957.
Experiments t.o improve visibility have alsobeen 'conducted with a transparent plastic sheetwhich t.railed on thesurfaee of the water. Thesheet smoothed the surfaee and did not disturbt.he migrant.s under moderate., weather.condit.ions,but rain, winds, and waves destroyed its effectiveness.
Counting Aids
Accuraey of counts was further increased by theuse of (1) Polaroid glasses to reduce sun glareand surface reflection, (2) hand tallies to record
FmURE 5.-A large turbulence reducer without verticalpickets smoothing au area 40 feet wide.

360 FISHERY BULLETIN OF THE FISH AND WILDLIFE SERVICE
the migrants quickly and efficiently, (3) audibletimers to limit. the counting periods precisely andeliminate the need of watching a clock, (4) guiding devices to lead the migrants over the panels,and (5) spotlights to assist in night counts.
ESTIMATION OF THE RUNS
The sampling procedure WItS designed to obtain a reasonably' 'accurat.e est.imate of the totalescapement while staying within the limits of bothmanpower and budget. Most of the informationon which the initial sampling pIau was formulatedwas known from previous observations of red salmon moving upriver and through weirs. Usuallythe major peak of the migration occurred in a dayor two, nJtllOugh it was often preceded or followed by minor peaks. There were usuallymarked variations in numbers of fish from da.yto day and throughout a given day. In some locations near the fishery there were also markedchanges in the numbers with the opening andclosing of the fishing periods or with changingtides. It has since been noted at Igiugig on theKvichak River t.hat. the heaviest runs usually appeal' along one bank at. a time, with comparativelysmall numbers of fish passing along the opilositeshore. The major path of the run changes erratically during the season and from year toyear, but once a heavy run develops along onebank, it is usually maintained for several days.
A. typic.al migration up the Kvichak River wascounted continuously on .July 16, 1955, in frontof tower No. 1 (fig. 6). The fluctuations during
, 1&00
~G 1400~~
~ 1200
S!~ 1000
"e~ 800
"d! 600~
l; 400
t~ 200
0200 0400 0600 0800 1000 1200 1400 1600 1800
Hours
FIGURE 6.-Numerical fluctuations in migrating' ted sal-'~~(I11. from lO-minute continuous counts taken on July16. 1955, at tower No.1.
daylight ranged from about two-thirds of themean of 507 fish each 10 minutes to about oneand one-half times tlle mean. w'iui such variat.ions, it. is desirable to snmple every day andwithin each day to use a large number of shortcounting periods equally spaced in a systematicfashion.
Since the magnitude of the esca,pement fluctuates greatly, even in successive 10-minute counts,the estimates calculated from the samples arebasically point estimates. A single count depictsaccurately only the number of fish that lutppensto be l:iassing at the time. Frequent connts depict.accurately only the numbe~' of fish passing whenthe counts were taken, yet they al:e closely relatedto the total numbers in the fluctuating population.As a result, the daily estimates obtained from thecounts approximate the numbers of migrating salmon, with the accnracy depending on the magnitude and frequency of the fluctuations and thefrequeney and duration of the sample counts.
Method of SampJin~
The basic sample unit used in 1957, 1958, a,nd1959 consisted of 10-minute counts taken systematically each hour from each towel'. The initialsample counts in 1955 were of 2 hours' duration andtaken every 4 hours. In 1956, counts were eventua.lly reduced to 40 minutes and w.ere taken every3 hours. But the 10-minute counts were foundmost practica.l to obtain and to use in calculatingthe estimate. Any sampling procedure will beimproved if it is flexible enough t.o permit increases or decreases in tJle degree of coverage withthe int.ensity of the migration." Consequently, atthe beginning and end of the migration the countswere taken every 2, 3, or 4 hours. Also, at thepea.k of the migration or if a heavy run commenced along one bank, counts were increasedto 15 or 20 minut.es. This flexihi"lity placed emphasis on increasing the accuracy of the total estimates by concentrating the counts on the periodswith the heaviest escapements.
Counts were taken by natural light ItS eady inthe morning and as late at night as possible. Thehours of darkness normally extend from 2300 toO~OO, but often vary from day to day dependingon t.he ext.ent of sky overcast and the season. Accurate night count.s depend on seeing the fish bymeans of artifieial light from spotlamps. Theintensity of these lamps was controlled by a i'heo-
RED SALMON COUNTS FROM OBSERVATION TOWERS 361
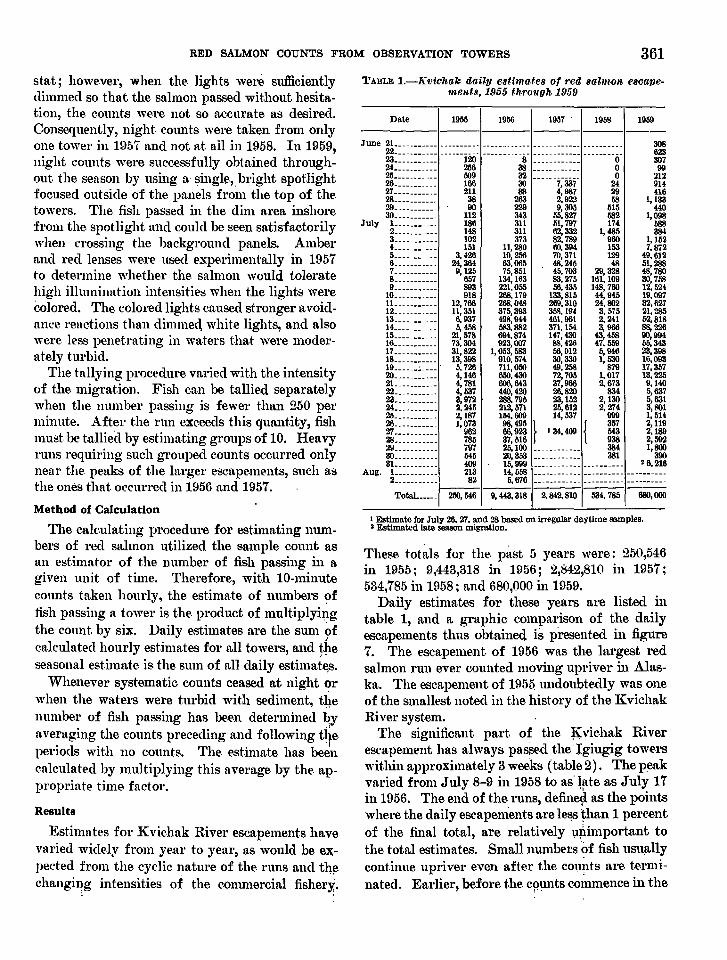
I Estimate for July 26, 27. and 28 based on irregular daytime samples., EstImated late season migration.
TABLE 1.-K'l'icILak daily e8timate8 of red 8almon. e8capemellts, 1955 througlL 1959
These tot;tls for the past 5 years were: 250,546in 1955; 9,443,318 in 1956; 2,842,810 in 1957;534,785 in 1958; and 680,000 in 1959.
Daily estimates for these years are listed intable 1, and a graphic comparison of the dailyescapements thus obtained is presented in figure7. The escapement of 1956 was the largest redsalmon run ever c.ounted moving uprive.r in Alaska. The escapement of 195(i undoubtedly was oneof the smallest noted in the history of the Kvic.hakRivel' system.
The significant pa.rt of the l\:vichak Riverescapement has always pas:3ed the Igiugig towerswithin approximately 3 weeks (table 2) . The p~akvaried from July 8-9 in 1958 to as' ~1tte as July 17in 1956. The end of the. runs, define~ as the pointswhere the daily escapenients are less than 1 perc.entof the final total, are relatively uPimportant tothe total estimates. Small numbers ?f fish usu~l1y
continue upriver even after the coupts are· terminated. Earlier, before the c~~ntseonuuence in the
June 21. .•• • . ._ ... __ .__ 30822 •• • ._ 62323. •• 120 8 0 30724.__________ 256 38 0 9925. ._ 509 32 ._____ 0 21226___________ 166 30 7,337 24 91427. •• __ ._ 211 88 4,987 29 41628.__________ 38 263 2,922 58 1,13329___________ 90 229 9,305 515 44030___________ 112 343 55.827 582 1,098
July 1.__________ 186 311 51,797 174 5882.__________ 148 311 62,332 1,485 3843. .____ 102 373 82,789 960 1,1524. .____ 151 11,280 1\0,394 153 7,8725. •• _ 3,426 10,256 70,371 129 49,6126___________ 24,364 63.065 48.245 48 51,2887 • 9,125 75,851 45,703 29,328 48,7808___________ 657 134,163 83,275 161,109 30,7589___________ 893 221,055 56,435 148,760 12,524
10___________ 918 268,179 133,815 44,945 19,09711 •• ____ 12, 766 268, 048 269, 310 24, 802 32, 62712.__________ 11,351 375,393 358,194 3,575 21,28513. •• 6, 937 498,944 461,961 2,241 52,81814.._________ 5, 4fi8 583,882 371,154 3, 966 88, 22615 •• 21,578 694,874 147,430 43,458 90,99416 ._____ 73,304 923,007 88,426 47,559 55,34317.__________ 31,822 1,053,583 56,012 6,946 23,39818 •• 13,398 910,574 30,330 1,530 16,09319. , · 5. 726 711,050 49.258 879 17,35720___________ 4,146 650,430 72,705 1,017 13,22521.._________ 4,781 006,&13 37,966 2,673 9,14022___________ 4,537 440,420 26,820 834 5,63723. ._____ 3,972' 288,795 23,152 2,130 5,63124.__________ 2,245 212,571 25,612 2,274 3,80125___________ 2,187 154,609 14,537 999 1,51426___________ 1,073 98,495 } {357 2,119'n .• 962 66,923 J 34,409 543 2,18928. .•• 785 37,516 938 2,59229___________ 797 25,100 384 1,80030___________ 545 20,353 381 39031.__________ 409 15,999 •• '6,216
Aug. 1.__________ 213 14,558 • •• _2___________ 82 6,676 . • _
---1----1--·-- -------TotaL••__ 250, 546 9, 443, 318 2,842,810 534, 785 680,000
195919&11957 .19561955Date
Results
Estimates for Kvichak River escapements havevaried widely from year to year, as would be ex;pected from the cyclic nature of the. runs and t1Wchangi11g intensities of the commercial fishery.
~ .
stat; however, when the lights were. sufficientlydimmed so that the salmon passed without hesitation, the counts were not so accurate as desired.Consequently, night counts were taken from onlyone tower in 1957 and not at all in 1958. In 1959,night counts were successfully obt.ained throughout the season by using a singh~,. bright spotlightfocused outside of the panels from the top of thetowers. The fish passed in the dim area inshorefrom the spotlight and could be seen satisfactorilywhen crossing the background panels. Amberand red lenses were used experimentally in 1957to determine whether the salmon would toleratehigh illumination intensities when the lights wereColored. The colored lights caused stronger avoidance reaetions than dimmecl white lights, and alsowere less penetrating in waters that were moderately turbid.
The tallying procedure varied with the intensityof the migration. Fish can be tallied separatelywhen the number passing is fewer than g50 perminute. After the run exceeds this quantity, fishmust be talliei:l by estimating groups of 10. Heavyruns requiring such grouped counts occurred onlynear the peaks of the larger escapements, such asthe ones that occurred in 1956 and 1957.
Method of Calculation
The eaIc.ulating procedure for estimating numbers of red salmon utilized the sample count asan estimator of the number of fish passing in agiven unit of time. Therefore, with 10-minutecounts taken hourly, the estimate of numbers offish passing a tower is the product of multiplyi~lg
the count by six. Daily estimates are the. sum 9fcalculated hourly estimates for all towe.rs, and theseasonal estimate. is the sum of all daily estimat~s.
Whenever systematic counts ceased at night ,?rwhen the waters were turbid with sediment, tl~e
number of fish passing has been determined byaveraging the counts preceding and following ti~e.
periods with no counts. The estimate has be~ncalculated by multiplying this average by the appropriate time factor.

FIGURE 7.-Daily escapements of red salmon up theKvichak River, 19.')5 through 1959.
- ,
Errors Introduced by Individual Counters
Counting errors ~re known to result from individual differences in seeing; counting, an~ record
,'"ing limilbers of p~~iJ1.gsalmon. I~ 1\)57, 32 counts'
FACTORS INFLUENCING VISUAL COUNTS
To a hirge ext~,lit" the accura.cy of the basicsample counts (~epe.114s ~n (1) iridividl~al counters,(2) migl'atioll,lntensity,. (3) weather conditions,and (4) disruljt~(l ili"igratiOli patterns. Once therelationships ';of t~lese' f!!-ctors to th~ counts arerecognized and J.~nderstood,they ca.n be taken intoconsideratiOli;i.I~improving the counting m~thod.
spring, a few fish migrate upriver; adult red salmon have been reported taken in gill nets on upperIliamna Lake as early o.s '.Tune 6.
There has been no apparelit correlation betweenthe duration and the size of the escapements. Themain part of the small 1955 and the large 1956escapements each })assed in 19 days, and neither thestart nor the end' of the migration in the 2 yearswas more than 3 da.ys apart.
Errors Associated With Migration Intensity
; As intensity of the migration increases, fish mustbe tallied more rapidly. An increa.se in migrationihtensity might indicate an increase in countingen'ors. The comparative data (fig. 8), however,s_how only a slight correlation between migrationintensity and percentage of counting va,riation,even though greater variations in total numbers offish counted did occur. This indicntes that countstaken during increasingly heavy runs do not necessarily injeet an increasing number of errors, intothe calculations. ,
The five comparative c~:nmtswith extreme varia-tions exc~eding a plus or minus 10 percent ap-
TABLE 2.-Size am" timing of Kt'ichak l'ed 8almon eaCQ,pementa Q.t Igiugig, 1955 through. 1959
of 5 minutes' duration were taken by 2 observerscounting simult.aneously from the same tower.One counter (A) participated in all counts, whilethe other counter was taken from a group of threemen designa.ted' XYZ. The data obtained arelisted in table 3, where the difference in numbers offish counted by XYZ is expressed as a plus orminus percentage of variation from A's count.
The range of variations between the 5-minutecounts of A and one of the other three counters extends from - 22.1 to +17.9 percent. By combiningtwo consecutive counts to form sta.ndard 10-minutecounts, the ra.nge is shortened from -7.8 to + 10.7percent. Furt,her reductions occur when thecounts are totaled and the differences calculated.For the two groups of 5-minute counts, the totaldifferences al;e but +3.5 and - 5.3 percent, respectively. The totals of all 32 couiltS differ by only-1.0 pel'Cent. Consequently, errors occurring incounts between paired observers, operating undera variety of observation conditions, tended to cancel out. Such counting errors, therefore, apparently occurred randomly and probably did notbias estimates of the escapement.
Size ofTiming of 95 percent of the escapement
Year escape-ment Start Peak Stop Range
(days)--- --
1955_______________ 250,546 July 5___ July 16______ July 23__ 191956_______________ 9,443,318 July 8___ July 16-18___ July 21\__ 191957_____________'__ 2,842.810 June 30_ July 12-14___ July2L 221958_______________ 534,785 July 7___ July 8-9_____ July 17__ 111959_______ . _______ 680,000 July 4___ July 14-15___ July 23__ 20
Aug.
24 28July
201612
FISHERY BULLETIN OF THE FISH AND WILDLIFE SERVICE
84
1959_
1958......
1957 •
1956_._
1955 __
!1\; .· \I .· ,, .· \, .· ,I '· ,, ii \i \. "I .. \
I .; \
rA \f! \ \., I •
Ii ~ \," \ \I .
r I \
i '\ \• r I •, I I \. I l .
f,1 \ \Y":J \ \.
_-. J.... A .. & \,....... .." . ",-, .,.' i· '" :t'./\ ,.........1 , . . 'a.;;: ..... _ ....__ ... "'-0-.-.
26 30June
3621000
900
800
700c::I)
.!E 600~~
~'tl 500
{;Iii
400~
~300
200
100

RED SALMON COUNTS FROM OBSERVATION TOWERS 363
TABLE 3.-00/llpari-son of cou-nts auring tl,·e same period by different obscn1ers
Number of fish counted Percentalre variation
1957 Tower No. Time Counter A Counters XYZ10 min.
5 min. 5 min. (total)5 min. 5 min. 10 min. 5 min. 5 min. 10 min.
(total) (total)
July 9_. __________ 1 -------iooo- 63 9 72 66 9 75 +4.8 0.0 +4.211. ___________ 1 ------i;02li- .228 228 ------. ~ _. -- 212 212-----·+7~ii-
-7.0 -7.02 1915 860 1,880 1,100 880 1,980 +2.3 +5.312____________ 1 1500 631 680 1,311 720 700 1,420 +1-1.0 +2.9 +8.32 1515 700 600 1,300 650 620 1.270 -7.1 +3.3 -2.31 0715 306 659 965 327 574 901 +6.9 -12.9 -6.613_ ••• ________ 2 1020 960 950 1,910 1,020 740 1,760 +6.3 -22.1 -7.814____________ 1 0900 688 745 1,433 658 703 1,361 -4.4 -5.6 -5.12 0915 487 510 997 574 ,';30 1,104 +17.9 +3. 9 +10.71 1700 760 653 1,413 755 560 1,315 -0.7 -14.2 -6.92 1715 413 440 853 395 443 838 -4.4 -0.7 -1.715. __ •________ I 1900 93 76 169 92 75 167 -1.1 -1.3 -1.22 1915 280 285 565 276 285 561 -1.4 0.0 -0.716. ___________ 1 1700 -- - -... -. --- 70 70 --------ioo- 67 67 --------ii~ii- -4.3 -4.32 1715 190 94 284 9S 288 +4.3 +1.417 _____________ 1 1700 36 50 86 34 48 82 -5.6 -4.0 -4.72 1715 18 106 124 18 99 117 0.0 -6.6 -5.6
TotaL ______ -- --- -- --- -- .---.---.--- 6,645 7,015 13, 660 6, 875 6, 643 13, 518 +3.5 -5.3 -1.0
peared when the migra.tion passed 450 fish per5-minute interval, but even these errors followeda random pattern and tended to average out.However, because of the greater magnitude andimportance of these eri'ors, it is imperative to increase the number of samples taken with an increase in intensity of the run. This greatly increases the reliability of the calculated estimates.
"Vhen extremely heavy runs occur and samplesmust be obtained by estimating groups of 10 fish,counting errors are undoubtedly greater thanwhen individual fish can be tallied. Heavy runsrequiring such counting procedures are infrequentand usually occur past one tower at a. time. Onthe Kvichak River, such runs appeared only during the intense 1956 escapement (July 11-21) andbriefly in 1957 (July 12-14). . .
FIGURE. S.-Relation between migration intensity andvariations between counters.
200 400 600 800 1000Number of Fish Counted /5 Minute Period
Effect of Weather Conditions
Sun glare, overcast skies, wind, and rain lowervisibility and increase the difficulties of obtainingaccurate sample counts. Glare may be troublesome during a 4-hou1" period daily when the sunis bright and low over the water. Overcast skiesimpart a dull appearance to the surface of thewater, while upriver winds and rain disturb thesurface and thereby distort the oiItlines of objectsunder the surface. The effects of these adverseconditions, combined with the normally turbulentwater surface, make turbulence reducers essential.Then, with the aid of Polaroid glasses, the observers can count the passing fish accurately atalmost any part of a given day.
Moderately turbid. water, which occurs irregularly t.hroughout the season, is the most importantfactor affecting the accuracy of the counts. Thisturbidity is the result of heavy breakers againstthe beach at the outlet of Iliamna Lake, whichoccur with strong east winds. The poundingcauses excessive amounts of silt to be suspended
•
••
•
• • • ••;.. • •• • •• •• •• • •
.....I~ 25~~
~ 20....§~e: 15e'0;;:
.~.0::: 10.~\:~
's 5~~
~ O...,..---''"I-----,....:.--r---=-,,....---.,.--

364 FISHERY BULLETIN OF THE FISH AND WILDLIFE SERVICE
in the water which then flows dowhriver and reduces visibility at the tower sites. Occasionallythe point is reached where counts are not possible.This is disc~lssed as high turbidity, under the section on "Accuracy of the Estimates."
'Vhen the wat;r is moderately turbid, the variation between comparative counts might be expected to increase. Yet the data presented intable 4 show that the variation hetween comparat.ive counts taken in moderately turbid water wasless (+ 1.7 percent) than those obtained in clearwater (-3.0 percent). This suggests that moderately turbid water did not increase the countingvariation between two counters. It. does not indicate that both counts were as accurate in turbidwater as in clear ,vater, especially on the fringeare·as of the migration paths.
Effect of Disrupted Migration Pattern
Migration past a tower is momentarily disrupted as the fish scatter into deep water whenthe skiff bea.ring the counter arrives. While thefish soon re-form their ranks and resume an apparently normal migration pattern,· it is possiblethat commencing the counts as soon as the counteris ready would inject directional errors.
A test of the timing' of the counts to the timeof the counter's arrival was made in 1957 by comparing the first and second 5-minute counts of841 samples (table 5). In most instances thesecoUl~ts were started as soon as the counter hadtied the skiff, climbed the tower, and readied hisequipment, a period of 1 or 2 minutes. Since thefirst count was higher than the second almost onehalf the time, i.e., neither consistently 'higher norlower, the counts were probably not biased. Thetime required in preparntion to commence thecounts, therefore, is evidently sufficient for themigration to assume a normal pattern.
TABLE 4.-Effec~ 01 turbid. 1cater OJ/. count 'L'ariatioll
Number offish counted In-
Counter Clear water !'"I0derately turbid water
1st 5 2d 5 Total 1st 5 2d5 Totalminutes minutes minutes minutes
--------,---A ___________ • _____ 3,988 3.988 7,976 2.657 3,027 5,684XYZ _____________ 4,078 3.658 7,735 2,797 2,986 5,783----------- -----
Percentvariation__ +1.3 -8.1 -3.0 +5.3 -1.4 +1. 7
ACCURACY OF ESTIMATES
Estimates of the totai migration are subject tostatistical error because of periods when the continuity of the sample counts is interrupted, andbecause of fluctuations in abundance of fish fromone counting period to another. At present wecan only guess at possible bias that may accruebecause of interruptions in the counts, but we canestimate precisely the possible statistical error forfluctuations of abundance. For example, it is possible to calculate confidence limits for each annualescapement to detennine the reliability of thesampling program. In addition, various mathematical tests can be applied to determine the effectsof changes in the length of the. samples and theinterspacing periods.
Effect of Interruptions in the Counts
Interruptions in counting have occurred becauseof high turbidity when no fish can be seen, alsobecause of darkness, especially before satisfactorylighting was developed.
Highly turbid water occurred 10.9, 3.7, 3.1, 6.2,and 5.5 percent of the time in the years from 1955to 1959, respectively. Once the river becomesturbid it normally remains in that condition forat least 24 hours, because the water takes about8 hours to clear after the east wind ceases. Theperiods when high turbidity prevailed, in relationto the magnit.ude of the escapement each year, areshown in figure 9. Only in 1957 did the water ,turn highly turbid when a heavy migration of redsa.1mon was passing the towers.
Beach seine hauis have been obtained occasionally to provide relative indications of migrationintensity in turbid waters. These hauls are probably more effective in turbid than in clear waterbecause of ina,bility of the fish to see the net. Yet,catches were low, indicating a low migration intensity. A systematic comparison of hauls in clearand in turbid water was made in 1958, where theaverage catch per haul along the right bank wascompared with the estimated number of fishmigrnting past tower No. 1 (fig. 10). The curveformed by this relationship indicated that fewfish were migrating in the highly turbid water.Therefore, calculations of the migration for theperiod of turbid water, based on an ave1'llge of lowcounts immediately preceding llnd following theturbid period, were busicnlly correct.

RED SALMON COUNTS FROM OBSERVATION TOWERS. . 365
TABLE 5.-Relaiion of 1st 5-minltte COUH.ts to 2d 5-minute cOfmts, K·!'ic1I.ak Ri-ver, 1957
CategoryCounter
Total
A B C D E F G H---------------1-------------------------------1st count Chillh) __ • -" _2d count (hl~h>- • . _Number times counted _
664399
8382
165
5446
100
8889
177
42" 49
91
5761
U8
68
14
51015
263662
417424841
49.641..933.342.948.346.249.754.050.356.6 .------------------------------Percent 1st count high. . _
•
• Hauls made in clear wattro Hauls made in highly turbid waters
Night counts were not taken in 1958 because ofdifficulty in counting the fish and the questionableaccuracy of counts made under floodlights. ·Instead, .estimates wei'e made on the a.ssumptionthat the migration was constant between the lastevening count and the first morning count. Thetota.} time lost to sampling by omitting nightcounts each day was 4 hours, 2300-0200. Estimates of the escapements 'based on systematicnight counts in 1957 and 1959 from tower No.1were compared with those calculated by averagingt.he 2200 and 0300 samples (table 6). In bothinsta.nces the escapements test-calculated by omitting night counts were high, 6.8 percent for the
25
•
50
•
•
75
FIGURE 9.-Relatlonsbip of periods of high turbidity tored salmon escapements. Kvlchak River. 1955 through1959.
FIGURE 10.-Relation between average numbers of redsalmon caught per seine haul and the calculated numberof fish paSsing tower No.1. Data computed on a lAl-daybasis, Kvichak River, July 7-17. 1958.
Population Fluctuations
Fluctuations in numbers of migrating fish fromseason to season, from day to day, and from hourto hour, are characteristic of Kvichak Riversalmon runs. Seasonally, the fluctuations ha.veranged from 1.4 to 9% million fish. Daily fluetu-'ations were dearly defined hi small escapements,less defined in large runs. ..
However, fluctuations taking pla~' :betweencounts are of the greatest importance to the estimates of the escapement.' The greater the freequency and magnitude of fluctuations from onesample to the next, the more' the calculated estimates are likely to deviate from the- true popula'tion passing upriver. Fluctuations from sampleto sample and between samples are the result, to
Average Number 01 Red Salmon I Seine Haul
larger 1957 run and 34.6 percent for the smaller1959 run. Consequently, it is necessary ·to obtainnight counts whenever possible to maintain"a highdegree of accuracy in the estimates.
•12 16 20 24
July
84June
30
20 1955 _ Highly turbid(250,544 Total) water
10
0
.... 5.1:!~ 0
c::\0a
II)a~
0....a...c:: 201\1
~1958
~(5"34,785
10 ,('toll
•

366 FISHERY BULLETIN OF THE FISH AND WILDLIFE SERVICE
a large extent, of the schooling habits of the fish.These schools are pll,rticularly noticeable whenthe migration intensity is low, bu.t even during aheavy run wide fluctuations in numbers continueto occur.
TABLE 6.-Determ.ination of possible error fron~ omittingaU nigh.t cou.nts from. tOWE'" No. I, 1957 and 1959
Night estimate
Percentage PercentegeYear A. By ex- B. By aver· error hy error In
pandlng aging 2200 method B dailyhourly and 0300 estimates
samples samples(used) (tested)
1957.-____________ 198,441 211,944 +6.8 +1.41959______________51.454 69,240 +34.6 +6.9--------TotaL _____ 249,895 281,184 +12.5 +2.5
The wid,th of the confidence intervals associatedwith a point estimate is influenced directly by thefluctuations in numbe.rs of fish. The width of suehintervals can be decreased by an inerease in sampling tiine, especially by increaf?ing the number ofsamples but also by expanding the length of thesample unit.
Confidence Limits of the 1959 Escapement
Confidence limits were determined for pointestimates of the annual red salmon escapements.!The method was applied to the 1959 counts to illustrate the procedures and to point out the aeeuracyachieved by the present sampling methods. Theeounts 'were of 15 minutes' duration and were takenevery 4 hours early in the season. A change to10-minute counts taken hourly was made on June29 as the migration increased. Daytime countswere increased to 15 minutes, some to 30 minutesor more ellch hour, near the peaks of the escapement. Then all counts were reduced to 10 minutesand taken every 4 hours near the end of the TIm.
Before confidence limits can be calculated., theseason must first be stratified, since the variancein the counts is associated with the mean numbersof fish for each segment of the escapement (tabl~
7). The total migration season from whieh the
1 The principal procedures hs\"e been used pre\'lously by O. A.lIIathlsen In anal)'sls ot Wood River escapement estimates: AStratified Sampling Program tor Visual T.ower Counting, 1957.University of Washington, Fisheries Research Institute, Seattle(Wasl1.). lIIanuscrlpt. 'Modifications In this procedure for application to Kvlchak River data were made with the assistanceof C. O. Junge. Jr., of tl1e Fisheries Researcho Institute.
four strata were drawIl extended from noon, June21 to August 1, a total of 39.5 days. This is equivalent to 79 days of total counting for the two towers.As intended by the sampling pl~n, an increase inthe percentage of sampling time occurred witheach strata in proportion to its numerieal importance; 7.8, 14.1, 22.1; and 24.8 percent with strataI to IV, respectively.
It is assumed, that the sample counts were takenrandomly throughout each stratum regardless ofsome extended COlUltS or occasional gaps and were,therefore, representative of the stratum fromwhich they were taken. The preliminary ealculations for the determination of the confidence limitsare summarized in tables 7 and 8, where-
N=total number of sampling units (10minute counts).
P=total fish passage (population).N;=total number of sampling units in the i th
stratum.n=total number of samples (10-minute
eounts) obtained.1/.;=total number of samples obtained in i th
stratum.X 4j =number of' fish in jth sample in i th
stratum.
X;=mean number of fish per sampl~ in i th
stratllnl from--
s~=variance of the samples in i th strlttum from--
Each stratum is weighted by lVi = ~i. The
weighted mean (.X') and the assoeiated. variance2..S X) lire then cltlculated from--
= 4_X=~X/·W/=60.62, also
1=1

RED SALMON COUNTS FROM OBSERVATION TOWERS 367
TABLE 7.-Stratification ot the Kt,ic1u;k escapement in1959
Average Number NumberStrata number Date and slta oC sampling samples Percent
ft"b escapement In stratum units obtained nicounted I (Nil (Di)
-- -----L ______
0-20 All UDItS Crom June 21 to 6,912 540 7.8July 30 other thannoted.IL____ 2(h'l() Tower No.1: July 4, 8,
}10, 12>J8, 19, 20, 21, 22. 1,872 264 14.1Tower 0.2: July 12, 17,18, 21 'N22•IlL___ 80-220 Tower '0. 1: July 6, 7,
}'11,17. I, 7"~ 382 22.1Tower No.2: July 5,6,7,8,9,10,14,16.
IV_____ 26lHiOO Tower No. I: July 5, 13, }14,15rJ6. 864 214 24.8Tower o. 2: July 15____ .-----
N=l1, 376 n=l,400 --------
I Determined as )G-minute counts Cor unllormity 01 calculation.
The final calculations of the confidence limits,with the level of significance set at 95 percent(t= 1.96), are made from-
(P, E)=N[X±t.05 ~~(Wn (~Ii) (NNt11'1)]
=11,376 [60·.62±1.96~]
=689,613± (11,376) (1.96) (.J1.5213)
=689,613± (22,297) (1.233)
=689,613±27,492
As calculated, the 95-percent confidence limitsfor the 1959 Kvichak River escapement are equivalent to ±3.99 percent (+-27,492) of the 689,613estimated total fish passage (P). Such narrowlimits point to the effectiveness of the samplecount estimation program in current use.
The sum of the daily estimates given in table 1(680,000) differs slightly from the estimate calculated from the stratified data. The tabulatedvalue is considered the best estimate, and is wellwithin the calculated confidence limits.
Effect of Changing the Sampling Design
The length of the counting period and the frequency of the samples are the two main variablesto be considered in formulating a sampling program. Increasing or decreasing either one influences the reliability of the calculated estimates.
To analyze these varin.bles, systematic test samples were drawn fr0m a continuous 48-hour 'count
09:1880 0-61--3
obtained in 1955. The lengths of the countingperiod of the samples tested were 10, 20, 30, 40,nnd 60 minutes, while the sampling frequencies,vere 1, 2, 3, and 4 hours. Generally, four differenttests were made with each relationship: sampleperiod length to sample frequency. Totals of thecalculated estimates were then compared with theactual total for the 48-hour period, and the percentage deviation plotted in figure 11.
The percentage of error tends to drop with anincrease in the length of the samples and witIr anincrease in the frequency of the samples. Shortcounts, under 40 minutes in length, llrovide reliable calcnlations when taken every 1 or 2 hours,usually ranging within a plus or minus 6 pe.rcent.These connts show a much wider range of errorwhen taken every 3 or 4 hours. This indicatesthat, for a. specific reduction in counting time, themost consistent results wonld be obtained withshort samples taken frequently. The 1955 and
.1956 estimates, based 011 infrequent larger samples,may have been less accurate than those in recentyears. However, in 1955, 73 percent of the escape-
••• •
4 hour sample frequency.
• •
sample frequency
2 hour sample frequency
I hour sample frequency
10 20 30 40 50 60 120Length of Samples in Minutes
'FIGURE H.-Distribution of sampling errors with various. sample period lengths and frequencies.

368 FISHERY BULLETIN OF THE FISH AND WILDLIFE SERVICE
TABLE S.-Preliminary calculation8 for th·e determ·ination of con·fidence Umit8 for the 1959 Kvicha·k e8capement
Strata (;)Weights
Wi wlni
S=i=1.5213
L________________________ 0.6076 0.369.178 84,6Il6 3,160 5.9 122.8 0.922 540 0.0774II.________________________ .1616 .027.093 1, 385, 36~ 13.995 53.0 2,446.7 .859 264 .2157TIL______________________ .1519 .023,074 12.684,729 56. 027 146.7 11,725.4 .779 382 .5524[V________________________ .0760 .005,776 32.187,143 73,290 342.5 33,272.4 .752 214 .6758
--- -1----1-----.:...::..:.=TotaL______________ 1.0001 __ • • . • • • _
ment was enumerated in a continuous count. In1956, the variation in number of fish from sampleto sample was low, evidently because of the greatermagnitude of the run. The basic sampling designof 10-minute counts taken hourly and supplemented by longer counts during a heavy run,therefore, appears to be highly efficient.
It is difficul~ to determine with any degree ofprecision the most efficient sampling design, sincethe size and nature of the migration vary fromyear to year. Such factors as the proper distribution of time, manpower, and equipment in obtailling accurate counts must also be considered.On the Kvichak River, short frequent counts haveproved practical to obtain adequate estimatesunder aU operating conditions.
SUMMARY
1. A method of estimating red salmon escapements by using systematic sample counts was developed and used on the Kvichak River, Alaska,from 1955 to 1959 by the Fisheries ResearchInstitute.
2. The method was based on the fact that migrating red salmon avoid swift midstream currentsand pass upriver in narrow bands close to theshores, where observation towers, backgroundpanels, turbulelice reducers, and other countingaids could be used to obtain accurate counts.
a. Statistically, migrating red salmon wereconsidered as a fluctuating finite population. Thedesign of the sampling proc,edure was aimed atobtaining a reasonab~y accurate estimate of thetotal run from properly distributed visual countsthroughout the migration season.
4. The basic sample unit consisted of 10-minutecounts taken systematically each hour from eachtower. This design was varied to provide increased or decreased coverage with the corresponding variations in the intensity of migration.
5. Estimates for a given period of time were obtained by multiplying the sample count by the appropriate factor. For longer perioc\s when nosamples were obtained, the estimates were interpolated by averaging the counts preceding and following the ga.p and multiplying by the. appropriate·time factor.
6. Daily estimates were calculated as the sumof all estimates for all towers each day, and thefinal escapement estimate was the sum of all dailyestimates.
7. Kvichak River escapements, as estimated bythe sample count method, amounted to 250,546 fishin 1955; 9,443,318 fish in 1956; 2,842,810 fish in1957; 534,785 fish in 1958; and 680,000 fish in 1959.
8. The accuracy of each sample count was affected by different counters, migration intensities,weather conditions, and disrupted migration patterns. However, the factors were not found toinject significant directional errors but showeddefinite tendencies to cancel out.
9. The accuracy of the calculated estimates wasaffected. by interruptions in the continuity of thecounts from highly turbid waters and darkness andby fluctuations in numbers of fish between samples.
10. A method of determining confidence limitswas illustrated. Applied to the 1959 KvichakRiver escapement, the confidence limits were esta.blished at a plus or minus 3.99 percent at a 95 percent level of significance.
11. The calculated estimates were influenced byvarying the lengths and frequencies of the samples. The percentage of error tended to drop withan increase in the length of the samples, and withan increase in the frequencies of the sampl~s.
Samples less than 40 minutes in length were foundto provide estimates usually within a plus or minus6 percent of error when taken every 1 or 2 hours.

RED SALMON COUNTS FROM OBSERVATION TOWERS 369
LITERATURE CITED
FISHERIES RESEARCH INSTITUTE, UNIVERSITY OF WASHINGTON.
1955. How shall we defend the concept of sustained~'ield conservation? Pacific Fisherman, vol. 53, No.6, pp. 1&-20.
THOMPSON, WILUA){ FRANCIS, and DAN WILEY OLANCY.
1959. Length measurement of migrati~g salmon bypaired underwater cameras.· PbotogrammetricEngineering, vol. 25, No.3, pp. 449-455. (University. of Washington, College of Fisheries, Con,tribution No. 54.)
o
U.S. ARMY CoRPs OF ENGINEERS.. 1957. Harbors and rivers in southwestern Aiaska.
89 pp., tabies, charts, maps. (84th Cong., 2d sess..House document 390.) Washington, D.C.
U.S. BUREAU OF FISHERIES.1923. Alaska fishery and fur-seal industries. in 1922,
by Ward T. Bower. Report of the Commissionerof Fisheries for 1923. Appendix 4, 118 pp., 16 figs.,tables. (Documl'nt 951.)
U.S. BUREAU OF COMMERCIAL FISHERIES.1956. Progrl'ss Report and Recolllmendations for
1957. 34: pp., 39 figs.. tabll'S. Junl'au, Alaska.
1957. Progress Report and Recommendations for1958. 26 pp., 37 figs., tables. Juneau, Alaska.