Estimating impact of potential regulatory constrains on future wood supply in Georgia based on...
31
Estimating impact of potential regulatory constrains on future wood supply in Georgia based on diverse sources of data Michal Zasada 1,2 , Chris J. Cieszewski 1 , Roger C. Lowe 1 , Don Reimer 3 1 Warnell School of Forest Resources, University of Georgia, Athens, GA, USA; 2 Department of Dendrometry and Forest Productivity, Faculty of Forestry, Warsaw Agricultural University, Poland; 3 DR Systems Inc., Nanaimo, BC, Canada 2004 Western Mensurationists Meeting, Warm Springs, OR
-
Upload
june-goodman -
Category
Documents
-
view
215 -
download
1
Transcript of Estimating impact of potential regulatory constrains on future wood supply in Georgia based on...

Estimating impact of potential regulatory constrains on future wood supply in Georgia based on diverse sources of data
Michal Zasada1,2, Chris J. Cieszewski1, Roger C. Lowe1, Don Reimer3
1Warnell School of Forest Resources, University of Georgia, Athens, GA, USA; 2Department of Dendrometry and Forest Productivity, Faculty of Forestry, Warsaw Agricultural University, Poland; 3DR Systems Inc., Nanaimo, BC,
Canada
2004 Western Mensurationists Meeting, Warm Springs, OR

Sustainability project “Long-term sustainability analysis of
forest resources in Georgia and assessment of potential effects of riparian zones and other regulatory and business constraints”
Granted in 2001 by the Georgia TIP3 committee
Already in its final stage

Why?
Forestry in the state of Georgia
Current situation of the region and the state

Georgia ~24 million acres of commercial
forests the highest area of commercial
forests in the US 66% of the total area of the state growing stock ~35 billion cf annual harvest over 1.5 billion cf
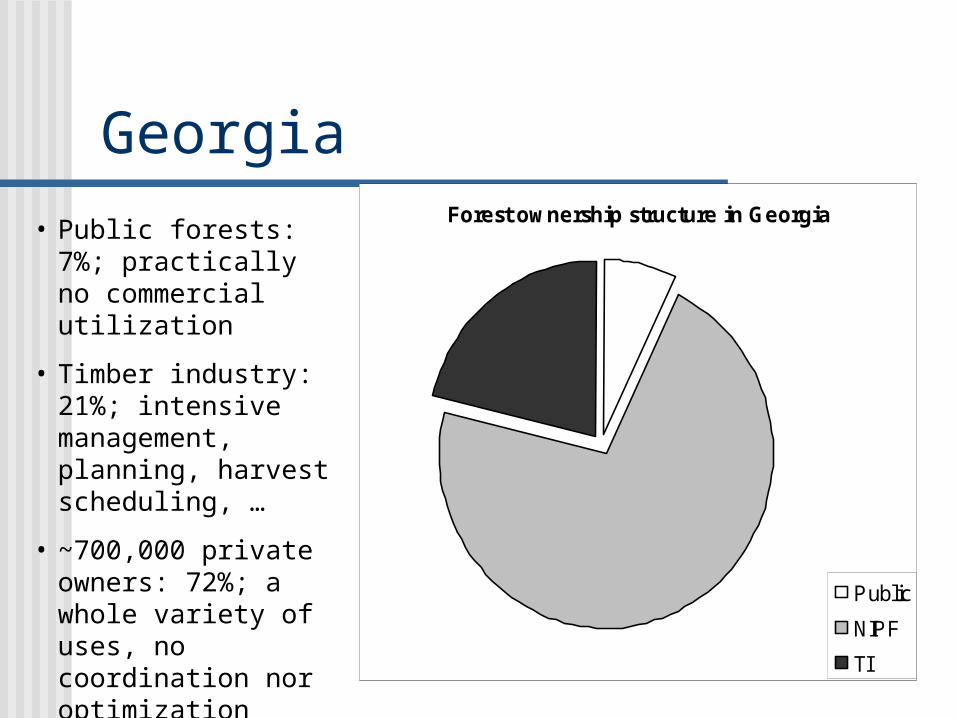
Forest ownership structure in Georgia
Public
NIPF
TI
Georgia• Public forests: 7%;
practically no commercial utilization
• Timber industry: 21%; intensive management, planning, harvest scheduling, …
• ~700,000 private owners: 72%; a whole variety of uses, no coordination nor optimization
• Changes: more TIMOs

Current situation Rapid changes to the US Southeast
harvesting limitations in public forests, shift of utilization to the Southeast
increasing demand on wood the region fast population growth with associated urban
and suburban development shifts in land uses increasing role of TIMOs increased growth rates of pine plantations and
significantly shortened rotation ages

Current situation
Questions related to the sustainability of future wood supply in the state
Impact of potential regulatory constraints affecting forest operations

Sustainability project Required elements:
Current inventory• Forest inventory • Spatial distribution
Rules of change• Models/yield tables• Ownership behavior
Simulation tool

Data Forest Inventory and Analysis data Proprietary industrial data Landsat TM5 Georgia GAP ecological data Various GIS data available from
state sources Published and unpublished research

Data

Data

Data Species group Age Site index class Volume per acre Management regime Other inventory information

Rules of change & software Models/yield tables for defined species
groups or simplified customized tables compiled from the FIA data if there are no models available; necessary adjustments
Management after harvesting: good guess + the only available research by Goetzl
Options, a forest estate planning and modeling application

Scenarios Sensitivity analysis (to assess
impact of certain actions / constraints / regulations / scenarios on wood supply, not to predict future forest inventory)
Base case (“current”) scenario - proof of concept
Modified base (“realistic”) scenario

Scenarios
Base (“current”, “no action”) scenario: Constant landbase Current management practices and
trends in their transition Constant harvesting of 1.5 billion cf/year Constant extent of intensive management
(30% of all existing pine plantations)

Scenarios
Modified base (“realistic”) scenario: as the base scenario, but
Gradually increasing cut (+50%/50years, from 1.5 to 2.25 billion cf/year in 2050)
Increasing extent of IMP (30% rate of conversion)

Sample results

Protective buffers
1976: U.S. Environmental Protection Agency recommended using of BMPs as a primary method for controlling non-point source pollution (NPSP)
“Georgia’s Best Management Practices For Forestry”, manual issued by Georgia Forestry Commission in 1999
Georgia chose a non-regulatory system of voluntary compliance
Possible introduction of mandatory BMPs

Buffer assessment
Forest Buffer Area % Volume %type regime [x10 3̂ ac] [x10 6̂ ft3]
Evergreen Primary 226 0.93 272 0.81Secondary 542 2.15 631 1.88
Mixed Primary 141 0.58 166 0.49Secondary 291 1.19 344 1.02
Deciduous Primary 613 2.51 1,015 3.01Secondary 1,296 5.31 2,147 6.38
Total Primary 980 4.01 1,453 4.32Secondary 2,112 8.65 3,122 9.27
Forest Buffer Area % Volume %type regime [x10 3̂ ac] [x10 6̂ ft3]
Evergreen Primary 401 1.64 482 1.43Secondary 964 3.95 1,160 3.45
Mixed Primary 225 0.92 265 0.79Secondary 521 2.13 615 1.83
Deciduous Primary 264 1.08 436 1.30Secondary 635 2.60 1,052 3.12
Total Primary 889 3.64 1,184 3.52Secondary 2,120 8.68 2,827 8.40
Stream Road

Buffer scenarios
Base and modified base scenario: Primary and Secondary buffers
Standing inventory Volume available for harvesting
(sum of volume of all stands that reached or passed their maturity age)

Base Modified base
No buffers
Primary
Secondary

Base Modified base
No buffers
Primary
Secondary

Buffers - discussion Costs of SMZ management Stream identification issue
Especially for small, intermittent At least doubled length comparing to reported
(mapped) in available sources – worth to perform a pilot study on the county level
Ownership impact on reported streams
Role of intensive management

Adjacency Rule 1: neighboring stand can be
harvested when a newly established stand reaches the average height of 5 feet
Rule 2: regeneration has to be at least 7 feet high, but harvesting cannot take place earlier than 3 years after harvesting of the adjacent stand

Adjacency
Base scenario, Rule 1, Rule 2: Volume available for harvesting
(sum of volume of all stands that reached or passed their maturity age)
Extent of deferred area and volume

No adjacency
Rule 1
Rule 2
Base Modified base

Area
0
5
10
15
20
2000 2010 2020 2030 2040 2050
Year
% Rule 1
Rule 2
Base Modified base
Volume
0
5
10
15
20
25
30
35
2000 2010 2020 2030 2040 2050
Year
% Rule 1
Rule 2
Area
0
5
10
15
20
25
2000 2010 2020 2030 2040 2050
Year
%
Rule 1
Rule 2
Volume
0
5
10
15
20
25
30
35
2000 2010 2020 2030 2040 2050
Year
%
Rule 1
Rule 2
Area
Volume

Adjacency - discussion harvesting and constraints pushed
harder – more noticeable impact small impact for large areas,
especially when harvesting is way below the resource capacity,
large impact on smaller areas, especially if other spatial constraints are considered

Adjacency - discussion Adjacency an affect wood availability
in the future, however this depends on the assumed rules
Effects can be significant especially with combination with other factors
Impact on particular owners, their management and additional costs is can be significant in any case

Future directions Final runs of complex scenarios Increased resolution Improved segmentation of satellite
imagery and data distribution Age identification Models Ownership layer Other related studies Spatial reports available online

Thank you!