Homelessness in Camden Dr Kristinn Tan Lead GP Camden Health Improvement Practice (CHIP)

ESTIMATING DIRECTION OF GAZE IN MULTI-MODAL CONTEXT
David B. Koons Kristinn R. Thórisson
The Media Laboratory Massachusetts Institute of Technology
20 Ames Street, E15-411 Cambridge, MA 02139
[email protected] [email protected]
ABSTRACT An eye tracking method is described that can estimate a user's absolute fixation point in three-space, and allows for free head motion within a half-sphere with a 1.5 m radius. The system is based on an infrared corneal-reflection eye tracker and a magnetic field system that together provide data about the position and orientation of the head in three-dimensional space, and the orientation of the eye within the head. Eye movement data is reduced by isolating periods of fixations and saccades. This data is combined to compute a three-dimensional vector in the direction of line-of-sight that can be intersected with the plane of a computer screen, to estimate the location of a user's fixation.
By time-stamping eye fixations, eye movements are combined with speech and gestures to disambiguate multi-modal references in the interaction between a user and the computer. The eye tracker described was designed as a research tool for interfaces that model human-to-human interaction, but has application in any situation that calls for free head motion.
KEYWORDS: Eye tracking, eye movements, line of gaze, human-computer interaction, multi-modal communication.
1. INTRODUCTION Eye gaze has been found to be an important factor in human-to-human interaction [Argyle & Cook 1975]. In the past, eye tracking has predominantly been used as a research tool in psychology and physiology. Recently, however, there has been an increasing interest in looking at the gaze of computer users as an indication of their interest and focus of attention—as a way to enhance interaction at the human-computer interface. Early efforts in using eye movements at the interface include work done at the Architecture Machine Group at M.I.T., using eye measurements to orchestrate multiple dynamic windows [Bolt 1984]. This system used a person's eye gaze as an indication of attention and interest, and controlled the display of information, both visual and auditory, according to eye behavior over time. A more recent example is described in Starker and Bolt [1990]; a gaze-responsive storytelling system that dynamically varied its monologue based on the user's interest. In this system, interest is a function of where a person's eye lingers at any instance and how it changes over time. Jacob [1990] has investigated the use of gaze as a direct manipulation tool for selection of menu items and icons on a display.

Prior research on "eyes as output" has generally spent little effort on integrating gaze with other interaction techniques, and the eyes have often been isolated from other natural modes of interaction—such as speech and gestures. At best, eyes have been combined with traditional input devices such as a mouse or a keyboard. We are exploring how gaze can be integrated efficiently into an interface that supports multiple modes of interaction: speech, gestures and gaze [Koons et al. in print, Bolt & Herranz 1992, Thorisson et al. 1992, Bolt 1985]. The eye tracking system described is currently used with an interface that interprets concurrent actions in speech, hand and eye [Thorisson et
al. 1992]. The goal of this research is an interface that takes advantage of the natural conventions of traditional human-to-human communication. The two most important factors when studying gaze in multi-modal interaction are unrestricted head movements and the person’s line-of-gaze. To meet the first requirement we use a head-mounted eye tracker. However, using a head-mounted camera to estimate a person's gaze within a three-dimensional (3-D) world in a real-time fashion presents the problem of integrating the geometry of the 3-D environment with the data supplied by the camera. To allow a person to turn their head and look about, we have combined the traditional corneal-reflection eye tracker with a magnetic-field system that can give the orientation and position of an object—in this case the person’s head—within a specified coordinate frame. The eye tracker itself provides data about the eye movements within the person’s head. Using the magnetic-field system a three-dimensional vector is computed for the line of sight and can subsequently be intersected with a graphics display or any other object of known location in the surroundings. 2. EYE MOVEMENT ANALYSIS 2.1 Eye Position Many technologies and methods exist to estimate a person's eye position. Among the most commonly used is the corneal reflection method: an infrared light shines onto the cornea; the reflected image is captured by a camera and analyzed for bright and dark regions [Young & Sheena, 1975]. The relative two-dimensional arrangement of these
Figure 1. Configuration of the head-mounted eye tracker camera and the infrared LED light source.
Camera
Infrared LED
Half-silvered mirror
Sensor cube

regions in the image can then be used to estimate the orientation of the eye. The corneal reflection method is a simple, non-intrusive method that is relatively accurate. We use the RK-426™ ISCAN® head-mounted eye tracker to estimate the position of the eye within the head. (Another recent video-based eye tracking system is described in [Myers et al. 1991].) The user looks through a half-silvered mirror, placed in front of the eye at a slant of approximately 45 degrees (Figure 1). The mirror reflects strongly in the infrared range but does not significantly affect the person’s view through the mirror. An infrared light-emitting diode (LED) is mounted above that shines onto the mirror and illuminates the
eye and causes a highlight to appear close to the iris. A miniature, infrared-sensitive camera captures the resulting eye-image off the mirror, and sends the video signal to a 286 AT computer. The ISCAN® system includes a plug-in board for the computer that performs image processing on the video signal, to provide data about the size and position of the pupil and the position of the highlight in the video image of the eye. It is the relative position of the pupil and the highlight that provide the basic data for the corneal reflection method [Young & Sheena, 1975]. As the user's eye moves, the difference between the center of the pupil and the center of the highlight gives a fairly good measure of the orientation of the eye within the head (Figure 2). The relative location of these two features is represented as the difference in both the horizontal and vertical dimensions of the video image (denoted [δxvideo, δyvideo] hereafter) and is available at a rate of 60 Hz in this particular system. When corneal reflection systems are used with a chin rest or bite-bar, the two-dimensional data provided by the eye tracker are mapped directly to the two dimensions of a computer screen (during a calibration process). The user is asked to successively fixate on a given number of points on the screen. Any intermediate values are then interpolated from these sampled points. Systems based on this technique require that the head is kept stationary (with the help of a chin rest) both during calibration and subsequent use.
Figure 2. The relationship of the highlight, created by the LED light source (falling on the cornea), and the center of the pupil, as the eye moves to the maximum δxvideo and δyvideo values. The nine eye positions shown correspond to the nine eye samples collected in the calibration procedure.

2.2 Head and Screen Position Problems arise with this simple mapping when we want to free the person’s head and allow them to look about. The position of the head is no longer in a constant relation to screen. We must now collect data on the dynamic configuration of the head and the screen. Magnetic devices exist that allow accurate estimation of an object’s position in three-dimensional space. We use a 3SPACE Isotrak™ system for this purpose. This system uses a magnetic field to determine the position, [x, y, z], and orientation, [θ, β, γ], of a sensor in relation to a source coordinate system ("Sensor" and "Source," Figure 3). The sensor is placed on the head-mounted eye tracker. The source is placed on a nearby non-metal surface. It is important that the source be kept away from the computer screen so that its magnetic field is not distorted by the magnetic field from the screen. The system can give the location and orientation of the head within the source-cube space (within a 1.5 m distancei of the source cube). Since the sensor cube cannot be mounted at the eye position, it is mounted near the eye. The difference in location is represented by a three-dimensional vector from the sensor cube to the eye (vector i in Figure 3). Vector i is an estimate based on an average person and is not sampled for each new user. In order to reduce the number of rotational transformations required, the sensor cube is mounted in an orientation that approximates the orientation of the head. Given the data provided by the Isotrak i As specified by the manufacturer, McDonnell Douglas Electronics Company—Polhemus Navigational Sciences Division, the Isotrak™ system is most reliable within 75 cm of the source cube. However, distances up to 150 cm are possible with diminishing accuracy.
Figure 3. Magnetic cubes and vectors for finding the head and the center of the eye.

system, we can locate and orient the user’s eye socket. The socket serves as a frame of reference for computing the azimuth and elevation angles of the eye, because the origin of the line-of-sight vector is at the center of the eye ball/eye socket system.
In addition to locating the head, the Isotrak™ system is used to locate the computer display. However, since the screen can easily be kept stationary in relation to the source cube, this data is not collected at each calibration session. Instead, the sensor cube is removed from the eye-tracker and used to collect position data for three corners of the screen. This gives three vectors from the origin to these corners of the screen (vectors a, b, and c, Figure 4), and the plane of the screen can be defined by two vectors, d and e : d = a - b e = b - c.
Because of magnetic interference between the screen and the sensor cube, it is necessary to place it at a constant offset in front of the screen (we use a 12 inch long ruler for this purpose). This constant offset can then be subtracted from each point, along a normal to the screen plane (as defined by the two vectors d and e). 2.3 Calibration The exact configuration of the eye tracker is different each time it is put on a person's head: it may be tilted back or slightly turned; the pupil and highlight may appear in a different location on the video image; etc. To account for such variations, each session begins by calibrating the system. The goal of the calibration process is to determine the mapping between the angles of the eye derived from the geometrical configuration of the system and the data extracted from the eye-tracking video camera. More specifically, we want to be able to find a mapping from [δxvideo, δyvideo] into angles around zsocket (azimuth) and ysocket (elevation).
Figure 5. Cartoon showing the user provide one of the nine calibration points: the upper right corner (imagine looking at the user from behind a transparent screen). The motion of the crosshair is shown by the dotted line (2 & 3). When the crosshairs have been lined up, a dot appears in the center of the crosshair (4) to indicate to the user that data collection is taking place.
1 2 3 4

As mentioned earlier, in allowing the user’s head to move relative to the computer screen, the calibration process is no longer a simple mapping from one two-dimensional space to another. In order to calibrate with a head-mounted eye-tracker, we must now take into account the orientation and three-dimensional position of the eye socket and the three-dimensional position of a target point (displayed on the plane
of the computer screen). By knowing the geometrical relationships between the socket, eye and target the azimuth and elevation angles of the eye can be computed (assuming the eye is directed at the target point) and associated with the data arriving from the eye tracker. One approach to the calibration process is to present target points that are at some known angle relative to the current position and orientation of the head. In other words, if we wish to collect data when the user’s eyes are looking 15 degrees up and 20 degrees to the right, we must present the target at these angles relative to the current position and orientation of the head. However, because people tend to turn toward the object they are looking at, the user could end up chasing the target off the screen (since the target maintains the same relationship to the head regardless of head movements). A second possible approach involves moving the head instead of the target. In this case the target point is fixed to some known three-dimensional position and the user is asked to orient his head while looking at the target. We have implemented this second approach in the following way: A white target crosshair is presented at a fixed location on the computer display. A second red crosshair is displayed that moves as the user moves his head. The user's task is now to align the two crosshairs. When they are aligned, the head is in the goal position and data about the eye position is collected from the eye-tracker (Figure 5). It is important to note that this, and any other eye tracking method, is based on the assumption that the user is looking at some known target point. We assume that at the moment the cross-hairs come together the user's eyes are directed at the center of the aligned crosses. (The user is informed about this beforehand.) A series of these alignment tasks are completed for different combinations of eye angles. The product is a calibration table; an array of data points
Figure 4. Vectors defining the plane of the computer screen.

covering the range of pre-determined eye orientations. These points are later used to interpolate from a given [δxvideo, δyvideo] into angles (see next section). The first step in the calibration process is to compute the position of the white target crosshair on the computer display. The user is asked to sit comfortably while facing the screen. The head position is sampled and a vector is created that approximates a straight and level line of sight. The white crosshair is placed at the intersection of this vector and the plane of the computer screen. This configuration of eye socket and target is used later as a reference for computing the eye angles. In other words, when the user’s head is in this position and orientation relative to the target cross, the eyes are assumed to be directed straight ahead (azimuth and elevation are set to 0.0). For each data point in the array collected during calibration, the user moves to align the second red crosshair with the white target cross. As an example, suppose we wish to collect the eye-tracker data when the eye is looking 15 degrees up and 20 degrees to the right (+15˚ elevation, +20˚ azimuth). To calculate a position for the red cross on the screen, the current head position and orientation data are collected from the sensor cube. A vector is defined from the center of the eye socket to the center of the white target cross. The azimuth and elevation of this vector in the socket coordinate system can now be computed. Within the eye socket coordinate system, the eye has two degrees of freedom; around the zeye (azimuth) and the yeye (elevation). Rotation around the xeye axis, the line of sight, can be ignored. These computed angles are compared to the goal angles (+20˚ azimuth, +15˚ elevation) and the difference is used to position the red cross relative to the white target cross on the screen.
Figure 6. Nine calibration points are obtained in the calibration. Here, the eye is shown looking at a point of 0° azimuth and -15° elevation.

Continuing with the example, if the current angles are found to be +5˚ elevation and +14˚ azimuth, the red cross would be displayed above and to the right of the white target cross. The user can align the crosses in this situation by tilting the head down (rotating the socket vector around ysocket) and turning to the left (rotating the socket vector around zsocket; refer to Figure 5). Keeping the eyes fixed at the crosshairs, they will now rotate in the opposite direction, moving closer to their goal angles. Once the crosses are aligned, several samples of [δxvideo, δyvideo] data are taken from the eye tracker, averaged and stored with the associated goal angles. These stored values represent known points in the mapping between the data from the video image and the corresponding angles of the eye within its socket. 2.4 Interpolating from Calibration Points to Angles As mentioned before, the data provided by the eye tracker represents the difference between the center of the pupil and the center of the highlight ([δxvideo, δyvideo]), calculated in the x, y coordinate system of the camera's video signal. A calibration table (the product of the calibration process) consists of nine [δxvideo, δyvideo] sample
Figure 7. Calibration points collected with the eye tracker. Azimuth values range from -20° to +20°, elevation from -15° to +15°, resulting in the general tilt observed for each axis. The corresponding δxvideo and δyvideo datapoints collected define four quadrants in a [δxvideo and δyvideo] plane. The points are used to split the plane into eight triangles, defining the "tiles" used to calculate intermediate values of azimuth and elevation.

points, one for each of the elevation and azimuth angle pairs in a 3x3 grid (Figures 2 and 6). By interpolating between the sampled points, the angle values for azimuth and elevation of the eye can be estimated. These angles, in turn, allow the construction of the line-of-sight vector in the three-dimensional environment. What is needed at this point is a function (applied to both azimuth and elevation) that accepts the data from the eye-tracking hardware and returns the estimated eye angle. The nine sample points collected during the calibration process define points on a three-dimensional surface (Figure 7). Given a [δxvideo, δyvideo] point, the associated eye angle is represented as the distance from that point to the surface, i.e. the vertical height at that coordinate. We approximate the surface by using the nine sample points to define a set of eight triangular planes or “tiles”. Given a new data point from the eye tracker, [δxvideo, δyvideo], we first find the triangle whose center is closest to this coordinate. This triangular plane is then used as a local approximation of the surface. The vector ωt, the vertical height at this coordinate, serves as the estimation of the corresponding eye angle. The scalar ω is found by:
(2)
(p r) • q (p r)(p r)
st•
•= -
ω×
×
×
Figure 8. Given a δxvideo and δyvideo pair, it must first be determined which trianlge plane to use for estimating azimuth and elevation. Here the point fell close to the center of one of the triangles (as defined by vector s). Vector t is scaled according to Equation 2. The resulting vector determines the angle in azimuth. This is done for elevation as well, using the same δxvideo and δyvideo values, producing a pair of angles, [γ, β], corresponding to rotation around zsocket and ysocket, respectively.
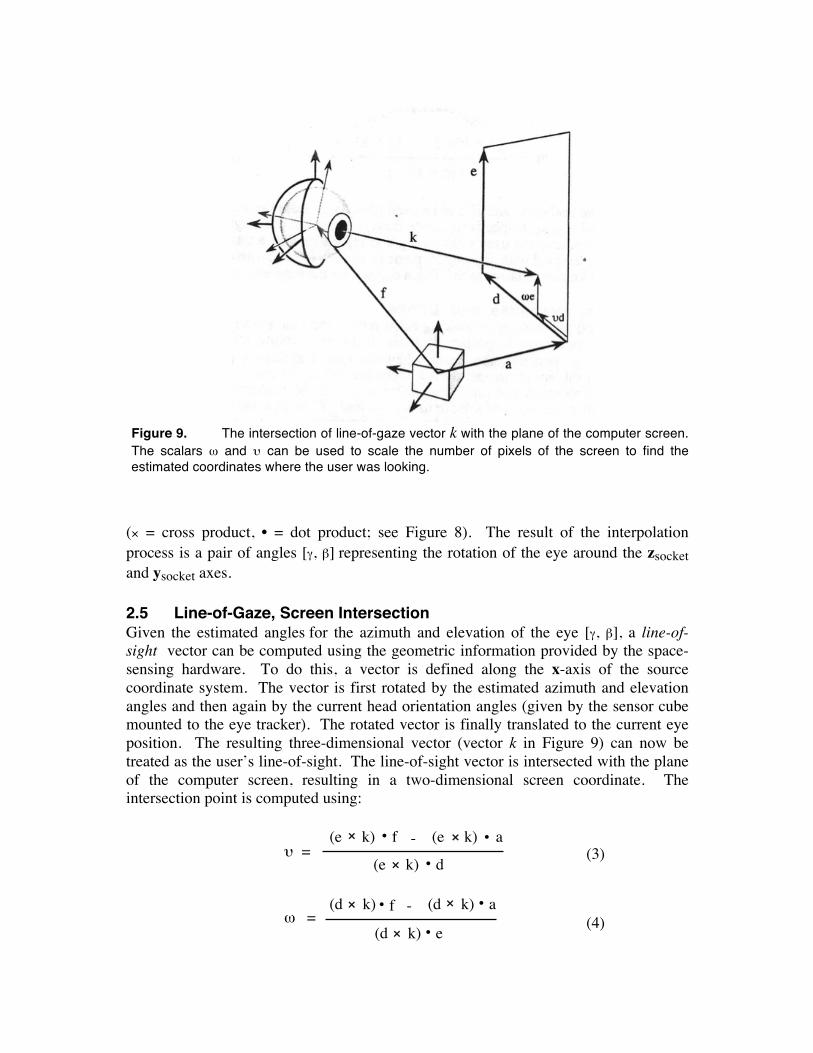
(× = cross product, • = dot product; see Figure 8). The result of the interpolation process is a pair of angles [γ, β] representing the rotation of the eye around the zsocket and ysocket axes. 2.5 Line-of-Gaze, Screen Intersection Given the estimated angles for the azimuth and elevation of the eye [γ, β], a line-of-sight vector can be computed using the geometric information provided by the space-sensing hardware. To do this, a vector is defined along the x-axis of the source coordinate system. The vector is first rotated by the estimated azimuth and elevation angles and then again by the current head orientation angles (given by the sensor cube mounted to the eye tracker). The rotated vector is finally translated to the current eye position. The resulting three-dimensional vector (vector k in Figure 9) can now be treated as the user’s line-of-sight. The line-of-sight vector is intersected with the plane of the computer screen, resulting in a two-dimensional screen coordinate. The intersection point is computed using:
(3)
(4)
(e k)υ
f=
d
a• •-•
(e k)×
(e k)××
(d k)
(d k)
aω =
f
e
• •-•×
×(d k)×
Figure 9. The intersection of line-of-gaze vector k with the plane of the computer screen. The scalars ω and υ can be used to scale the number of pixels of the screen to find the estimated coordinates where the user was looking.

(see Figure 9). The scalars υ and ω can be used directly to scale the number of screen pixels in xscreen and yscreen, respectively, since these are ratios of the lengths of vectors d and e. However, because the user’s line of sight is represented as a three-dimensional vector, it can be intersected with any object, plane or surface in three-space as long as the object's position is known, relative to the origin defined by the magnetic source cube. 2.6 Fixations, Saccades and Blinks The physiology and psychology of looking helps reduce the continuous stream of data from the eye: the two most important features in the eye motion are fixations and saccades.ii During fixations, the times when the eye is at rest, a person gathers information about the environment; during saccades, when the eye is in motion, the visual threshold is elevated and much less information can be gathered [Skavenski & Hansen 1978]. The advantages of this for us are twofold. First, as a method for infering a person's interest, only fixations would be of any significance. Second, the data from the hardware is available at rates up to 60 Hz. Calculating a line of sight at this rate could be fairly expensive. To diminish computational intensity, an efficient method is to ignore anything but the user's fixations. By simplification, this can be achieved by looking only at the image coming from the eye tracker camera. Alternatively, one could include head position in the calculations to account for biases caused by head-movement during fixations. However, this has not proven absolutely necessary for our purposes. A running estimation of the eye's velocity is computed by taking an average of the last n eye-position samples ([δxvideo, δyvideo]) and comparing it to a threshold. For increased noise resistance, two thresholds are used. One threshold determines whether the velocity is slow or fast, the other counts how many slow or fast velocity estimations have occured in a row. The fixation filter looks at the number of slow velocity computations that have happened in succession:
if velocity < Fix_vel_thrsh then Fix_count ← Fix_count + 1
else Fix_count ← 0
If Fix_count goes over the pre-determined Fix_count_thrsh, the state is assumed to be a fixation: a boolean variable is set to be the current state:
if velocity < Fix_vel_thrsh and Fix_count > Fix_count_thrsh then Fix_on ← true
else Fix_on ← false
While the boolean variable is true, the samples for eye-position are cumulated:
ii Smooth pursuit eye movements, which happen when the eyes follow a moving target, are not analyzed in the current implementation. However, this should be possible to implement by comparing the velocity of the eye to a typical velocity range.
if Fix_on then Cumulated_Dx_fix_samples[count] ← Dx
Cumulated_Dy_fix_samples[count] ← Dy
By using this filtering method for saccades and blinks as well, any data that doesn’t fit the parameters chosen for each type of movement will automatically be discarded.
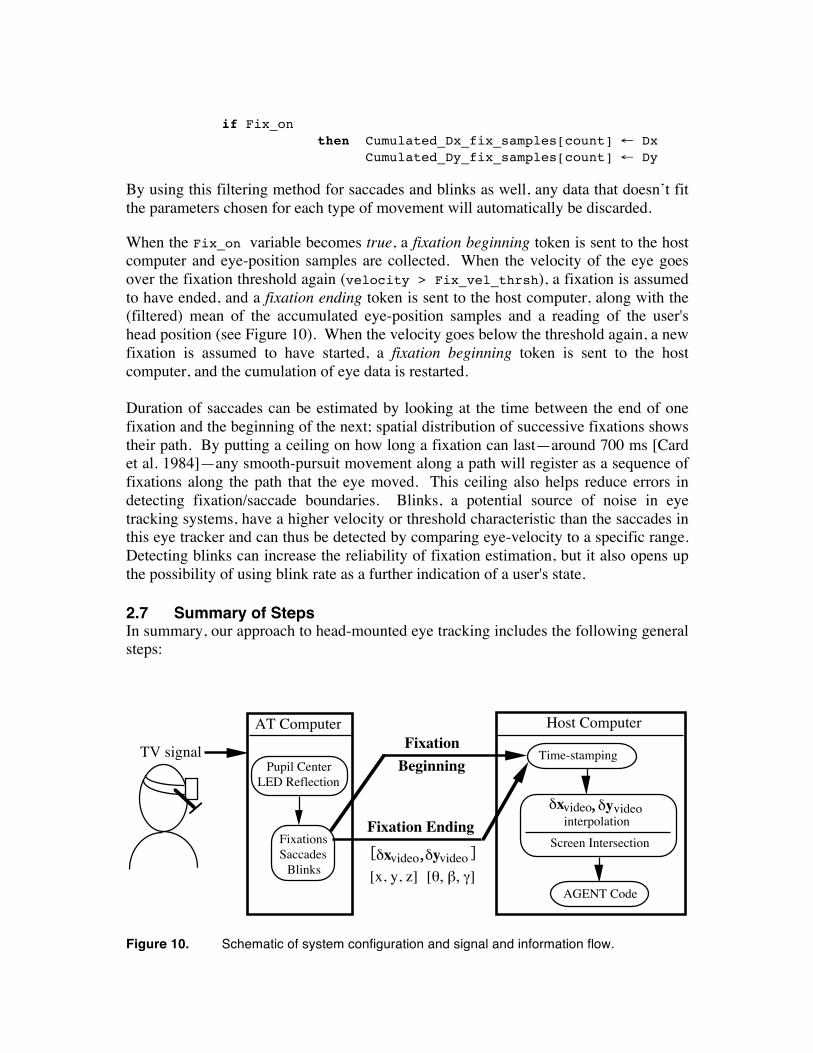
When the Fix_on variable becomes true, a fixation beginning token is sent to the host computer and eye-position samples are collected. When the velocity of the eye goes over the fixation threshold again (velocity > Fix_vel_thrsh), a fixation is assumed to have ended, and a fixation ending token is sent to the host computer, along with the (filtered) mean of the accumulated eye-position samples and a reading of the user's head position (see Figure 10). When the velocity goes below the threshold again, a new fixation is assumed to have started, a fixation beginning token is sent to the host computer, and the cumulation of eye data is restarted. Duration of saccades can be estimated by looking at the time between the end of one fixation and the beginning of the next; spatial distribution of successive fixations shows their path. By putting a ceiling on how long a fixation can last—around 700 ms [Card et al. 1984]—any smooth-pursuit movement along a path will register as a sequence of fixations along the path that the eye moved. This ceiling also helps reduce errors in detecting fixation/saccade boundaries. Blinks, a potential source of noise in eye tracking systems, have a higher velocity or threshold characteristic than the saccades in this eye tracker and can thus be detected by comparing eye-velocity to a specific range. Detecting blinks can increase the reliability of fixation estimation, but it also opens up the possibility of using blink rate as a further indication of a user's state. 2.7 Summary of Steps In summary, our approach to head-mounted eye tracking includes the following general steps:
Figure 10. Schematic of system configuration and signal and information flow.
AT Computer Host Computer
FixationsSaccades
Blinks
TV signalPupil Center
LED Reflection
Fixation Ending
Time-stamping
interpolation
Screen Intersection
AGENT Code
δxvideo δyvideo[θ, β, γ]
[ ],
[x, y, z]
δxvideo δyvideo,
Fixation Beginning

(1) The fixed geometric relations are sampled using the space sensing cubes. First, the relative positions of the head-mounted cube and the tracked eye are sampled for an “average” user and used to compute a translation vector (i in Figure 3). This vector is defined in the sensor cube coordinate system and thus allows us to determine the approximate position and orientation of the eye socket for any head orientation and position. Second, the positon of three corners of the computer display are sampled and represented as a three-dimensional plane in the source cube space (Figure 4).
(2) A calibration process collects and associates data from the eye tracker with
computed eye orientations. A target point, whose three-dimensional location is known, is presented on the computer display in front of the user. Assuming the user is looking at the target, the azimuth and elevation angles of the eye within its socket can be computed. These angles are stored together with the data derived from the video image of eye (Figure 3). A grid of eye orientations is sampled during the complete calibration process and is stored in a calibration table (Figure 6).
(3) The user’s line-of-sight can now be found by using the data in the calibration table.
Incoming data from the eye-tracker is mapped to an interpolated set of eye angles. With the current position and orientation of the head (eye socket), these angles are then used to construct a three-dimensional vector representing the user’s line of sight. The line of sight vector can be intersected with the computer screen (Figure 9) or any other previously defined object in the surrounding environment.
(4) In order to reduce the computational load, the data from the eye-tracker is pre-
processed for fixations, reducing the data rate from 60 hz down to 1.5-10 hz (section 2.6).
3. EYES IN MULTI-MODAL INTERACTION 3.1 Time Stamping When people interact with each other they have a general sense about the time at which disjoint actions happen: she says "That one!," and at the same time gazes over to the left. The obvious response of a spectator is to link the eye motion with what she said, and look in the general direction her eyes are now pointed. In multi-modal interaction with a computer many things can happen in concert, and here the same need for a common time base arises. For this we use a general time stamping method: when the host computer receives a fixation beginning token from the AT computer, the token is time-stamped and stored. When the corresponding fixation ending token is received, with eye- and head-position data (Figure 10), the time difference between the begin and fixation tokens gives duration of the fixation. The time information is crucial for synchronizing the incoming data from speech, eye and hand. It makes it possible to associate an utterance ("That one!") with the speaker’s direction of glance at that moment.

3.2 Accuracy People can judge the gaze of others fairly accurately [Gibson & Pick 1963]. The accuracy of our eye tracker is similar to a human estimator in a typical one-on-one scenario. With a good calibration, it can estimate the user's point of gaze (at a distance of about 70-100 cm) on a computer screen to about ±2 cm. That is approximately the area covered by the 2° angle of the fovea (2.4 - 3.5 cm at this distance). In a multi-modal context we need to deal with the input from the eyes in a more interpretive way than if it were literally a pointer with accuracies down to a pixel. In interactions between people, the eye is more an indication for focus of attention than a point that should be interpreted in absolute terms. This is approximately the level of accuracy needed in such a system. The power of eye tracking comes from integrating it with everything else in the multi-modal environment: gestures, speech, past events, common task, current focus of interest, etc. 3.3 Integration into the Multi-Modal Context We use eye gaze as a "deictic gesture" in our interface system to infer missing information in single- and multiple-reference acts. In this system, which is described in detail elsewhere [Koons et al. in print, Thorisson et al. 1992], speech, gestures and fixations all have common time stamps, and data in these three modes can thus be compared in time to find concurrent actions of the user. A collection of modules, termed the agent, receive this information and parse it in context. When information is missing from speech—if the user said for example "remove that helicopter"—the agent looks at the fixations around the time the utterance "that helicopter" was spoken and compares them to the spatial layout of all helicopters on the screen. The objects referenced by speech (a collection of helicopters) are given a score based on their proximity to those fixations, and if any single object receives a high enough score, that object is judged to be the referent. Coupled with pointing gestures (done by a user wearing data gloves), reliability can increase considerably. Usually several fixations occur over the period of a sentence, which further increases the reliability. If the data from speech, gestures and eye are not enough to resolve a reference, the agent will ask the user for the information needed to resolve it. 4. FUTURE DIRECTIONS The eyes are an important information channel for gathering information; there is no doubt that they are also important in giving feedback—as an "output" channel of information. Yarbus' work [1967] clearly shows that the eyes' movements are highly dependent on the context and the task that the user is performing. Evidence from studies of human interaction indicates that the eyes play a large role in controlling the flow of the conversation [Argyle & Cook 1975]. Among the essential issues in the design of a multi-modal interface is giving the computer agent more expressive ways to communicate its state and actions to the user, such as a face that can establish eye-contact [Thórisson 1993, Britton 1991]. We will also be looking more at how patterns
of looking can indicate what we are thinking and what state the conversation is in—with the goal of increasing the computer's sense about the role the eyes play in interaction, thus making interaction with computers more natural. 5. SUMMARY The eye tracking system we have described combines currently available technology with geometric methods for calculating a user's line of sight in a three-dimensional environment. The calculated vector can be intersected with objects of interest in the environment; we use a computer screen for this purpose. This system allows a user to move his head freely within a sphere of 1.5 m radius while wearing a head-mounted miniature camera. This approach makes it easy to intersect the line of gaze with multiple screens, screens of varying sizes, or any other three-dimensional objects with fixed locations. Eye movements can be considered to be one of the most ignored indicators of human intent and behavior at the computer interface. Although the current state of eye tracking is somewhat cumbersome, we hope that future eye tracking systems will solve these problems. In the mean time, the eye tracking method described has enabled us to evaluate interaction scenarios that we could not have done by using the traditional chin-rest eye tracking methods. ACKNOWLEDGEMENTS This research was done in the Advanced Human Intereface Group, MIT Media Laboratory, under the direction of Dr. Richard A. Bolt. The authors want to thank David Berger, Brent Britton, Edward Herranz, Carlton Sparrell and Christopher Wren for their help with this work. The work was supported by the Advanced Research Projects Agency under Rome Laboratories, contract F30602-89-C-0022. REFRERENCES Argyle, M. & Cook, M. Gaze and Mutual Gaze. Cambridge University Press,
Cambridge, England, 1976. Bolt, R. A. The Human Interface. Lifetime Learning Publications, Belmont, CA, 1984. Bolt, R. A. Conversing with Computers. Technology Review, February/March, 1985. Britton, B. C.J. Enhancing Computer-Human Interaction With Animated Facial
Expressions. Master's Thesis, Massachusetts Institute of Technology, Cambridge, Massachusetts, 1991.
Card, S. K., Moran, T. P. & Newell, A. The Psychology of Human-Computer
Interaction. Erlbaum, Hillsdale, NJ, 1983.

Gibson, J. J. & Pick, A. D. Perception of another person's looking behavior. American Journal of Psychology, 46, 1963, 386-94.
Bolt, R. A. & Herranz, E. Two-Handed Testure in Multi-Modal Natural Dialog.
Proceedings of UIST ‘92, Fifth Annual Symposium on User Interface Software and Technology, Monterey, CA, November 15-18, 1992.
Jakob, R. J. K. What you Look at is What You Get: Eye movement-based interaction
techniques. Proceedings of ACM CHI '90 Conference on Human Factors in Computing Systems, 1990, 11-18.
Koons, D. B., Sparrell, C. J. & Thorisson, K. R. Integrating Simultaneous Input from
Speech, Gesture and Gaze. To be published in M. T. Maybury (ed.), Intelligent Multi-Media Interfaces. AAAI Press.
Myers, G. A., Sherman, K. R. & Stark, L. Eye Monitor: Microcomputer-Based
Instrument Uses an Internal Model to Track the Eye. IEEE Computer, March, 1991.
Skavenski, A. A. & Hansen, R. M. Role of Eye Position Information in Visual Space
Perception. In Eye Movements and the Higher Psychological Functions, J. W. Senders, D. F. Fisher, & R. A. Monty (eds.), Erlbaum, Hillsdale, 1978.
Starker, I. & Bolt, R. A. A Gaze-Responsive Self-Disclosing Display. Proceedings of
ACM CHI '90 Conference on Human Factors in Computing Systems, 1990, 3-9.
Thórisson, K. R. Dialogue Control in Social Interface Agents. To be published in
Proceedings of InterCHI ‘93, Amsterdam, 1993. Thórisson, K. R., Koons, D. B. & Bolt, R. A. Multi-Modal Natural Dialogue. In
Proceedings of ACM CHI '90 Conference on Human Factors in Computing Systems, Monterey, CA, 653-4.
Yarbus, A. L. Eye Movements and Vision. Translated by B. Haig. Plenum Press, NY,
1967. Young, L. R. & Sheena, D. Methods & Design: Survey of Eye Movement Recording
Methods. In Behavior Research Methods & Instrumentation, 7(5), 1975, 397-428.