Estimating Crude Oil Production Carbon Intensity · PDF fileEstimating Crude Oil Production...
12
Estimating Crude Oil Production Carbon Intensity May 6, 2010 California Air Resources Board
Transcript of Estimating Crude Oil Production Carbon Intensity · PDF fileEstimating Crude Oil Production...
Estimating Crude Oil Production Carbon Intensity
May 6, 2010California Air Resources Board
2
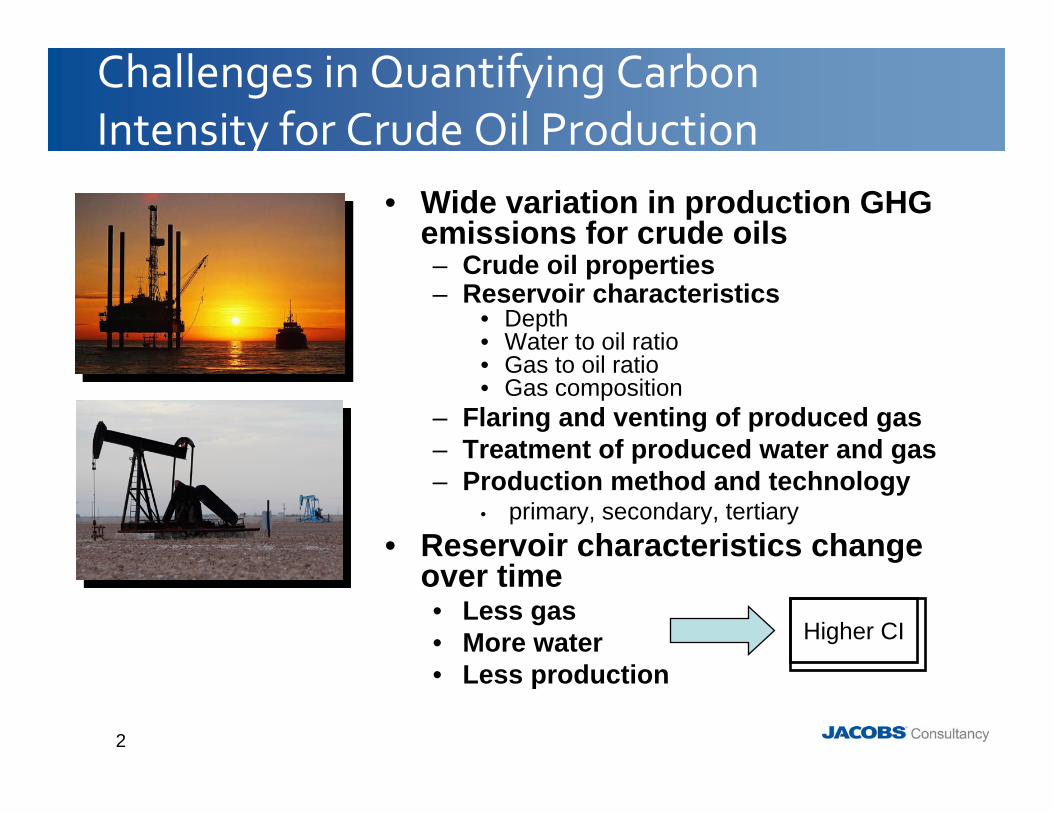
Challenges in Quantifying Carbon Intensity for Crude Oil Production
• Wide variation in production GHG emissions for crude oils– Crude oil properties– Reservoir characteristics
• Depth • Water to oil ratio• Gas to oil ratio• Gas composition
– Flaring and venting of produced gas– Treatment of produced water and gas– Production method and technology
• primary, secondary, tertiary• Reservoir characteristics change
over time• Less gas• More water• Less production
Higher CI
3
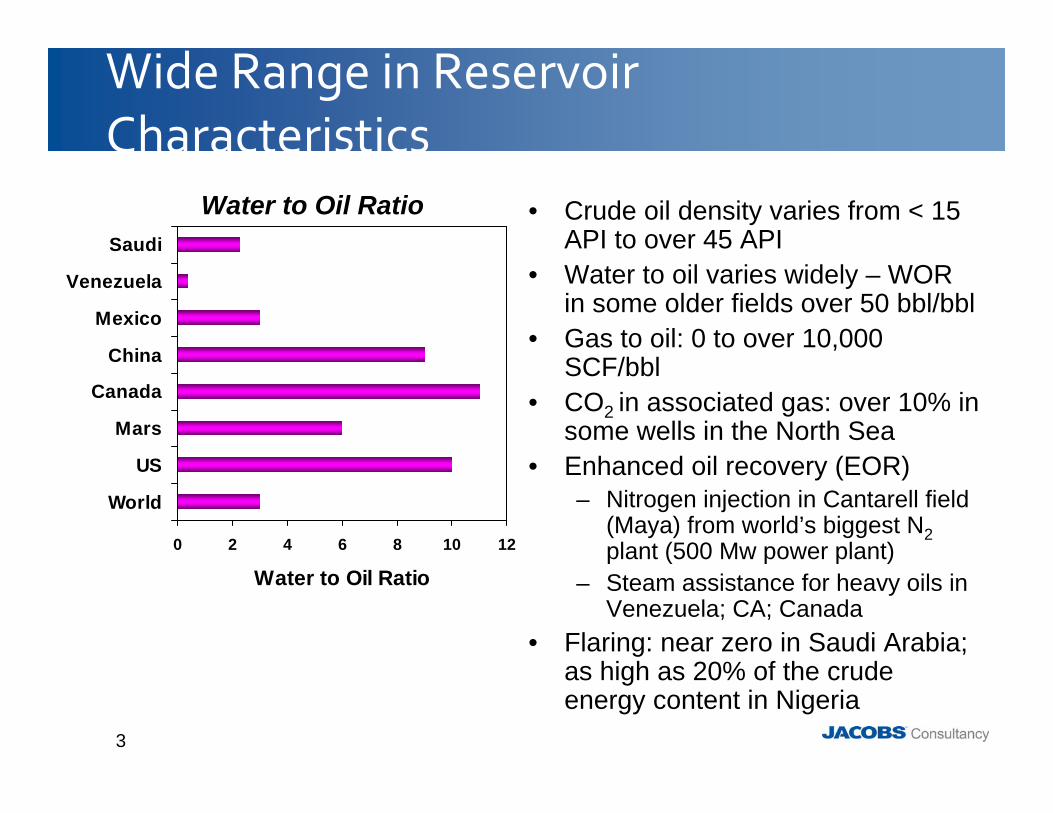
Wide Range in Reservoir Characteristics
0 2 4 6 8 10 12
World
US
Mars
Canada
China
Mexico
Venezuela
Saudi
Water to Oil Ratio
• Crude oil density varies from < 15 API to over 45 API
• Water to oil varies widely – WOR in some older fields over 50 bbl/bbl
• Gas to oil: 0 to over 10,000 SCF/bbl
• CO2 in associated gas: over 10% in some wells in the North Sea
• Enhanced oil recovery (EOR)– Nitrogen injection in Cantarell field
(Maya) from world’s biggest N2plant (500 Mw power plant)
– Steam assistance for heavy oils in Venezuela; CA; Canada
• Flaring: near zero in Saudi Arabia; as high as 20% of the crude energy content in Nigeria
Water to Oil Ratio
4
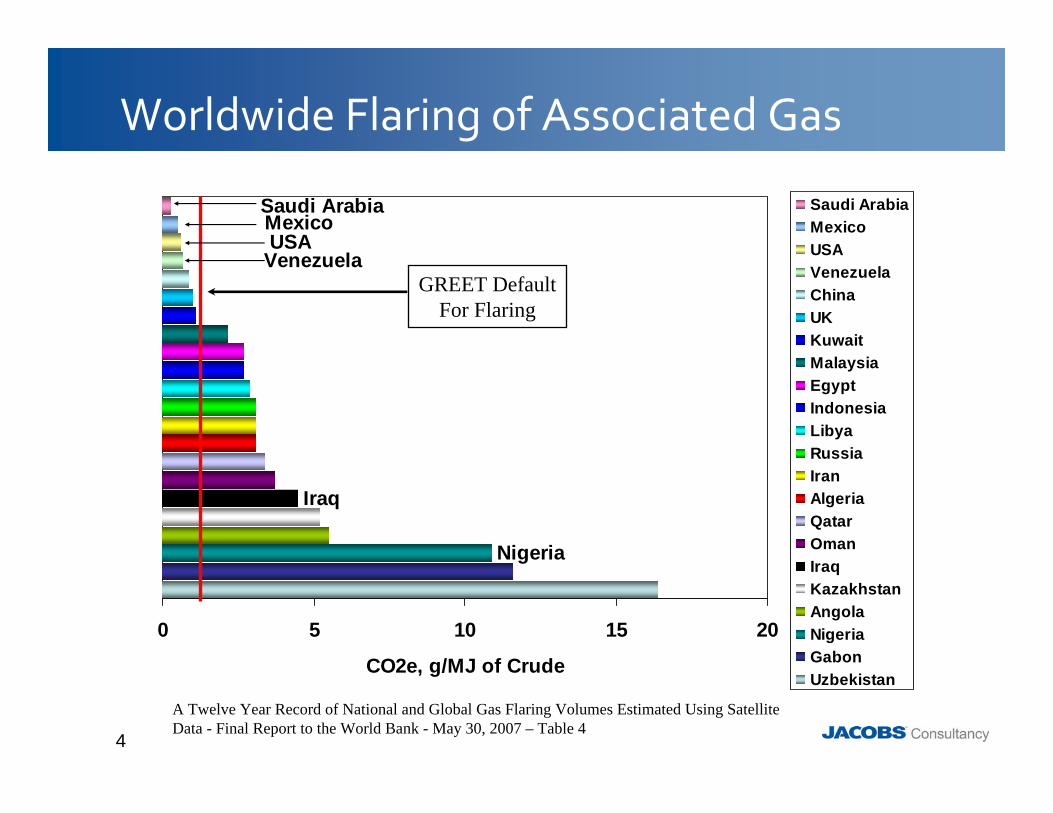
Nigeria
Iraq
Saudi ArabiaMexicoUSA
Venezuela
0 5 10 15 20
CO2e, g/MJ of Crude
Saudi ArabiaMexicoUSAVenezuelaChinaUKKuwaitMalaysiaEgyptIndonesiaLibyaRussiaIranAlgeria QatarOmanIraqKazakhstanAngolaNigeriaGabonUzbekistan
GREET DefaultFor Flaring
Worldwide Flaring of Associated Gas
A Twelve Year Record of National and Global Gas Flaring Volumes Estimated Using Satellite Data - Final Report to the World Bank - May 30, 2007 – Table 4
5
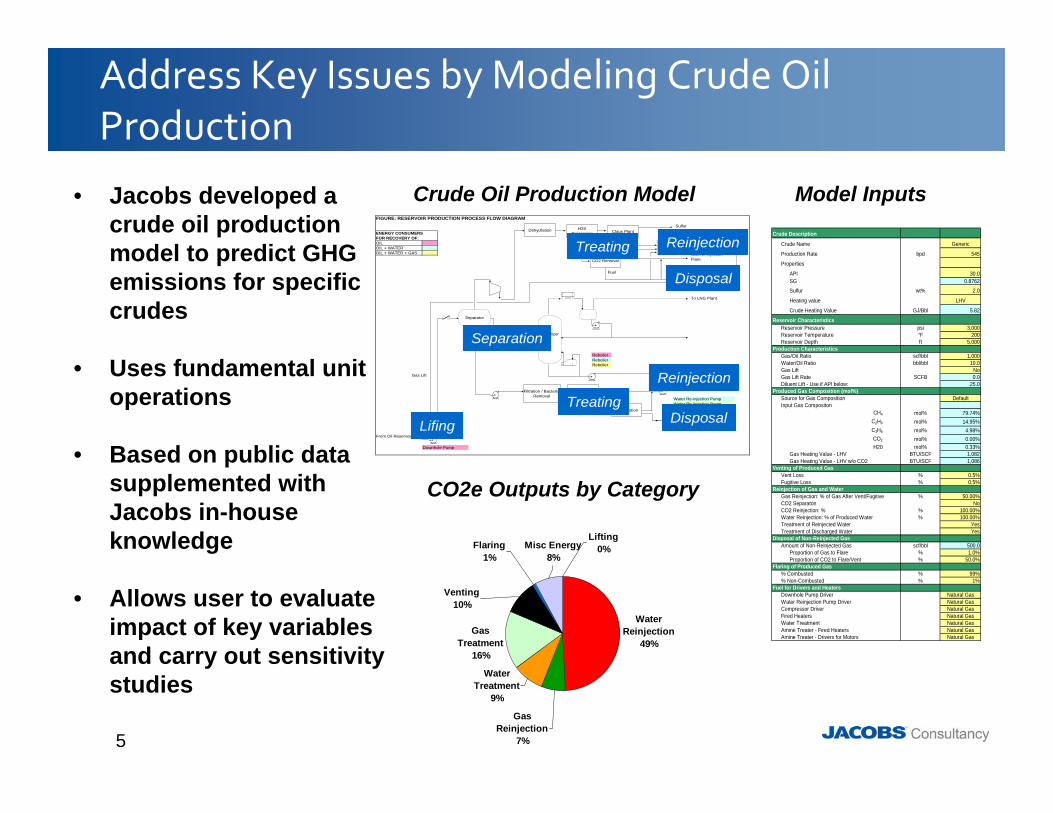
Address Key Issues by Modeling Crude Oil Production
FIGURE: RESERVOIR PRODUCTION PROCESS FLOW DIAGRAM
ENERGY CONSUMERS FOR RECOVERY OF: Gas Re-injection CompressorOILOIL + WATEROIL + WATER + GAS
ReboilerReboilerReboiler
Water Re-injection PumpDeaeration Water Re-injection PumpDeaeration
Downhole Pump
Dehydration
Separator
Stabilizer
Filtration / Bacteria Removal
Water Re-injection
To LNG Plant
Gas Re-injection
To Stock Tanks
From Oil Reservoir
H2S Processing Claus Plant
CO2 Removal Flare
Sulfur
CO2
SalesFuelEngines
Deaeration
Desalination
Disposal
Gas Lift
Lifing
Separation
Treating
Treating
Reinjection
Reinjection
Disposal
Disposal
Lifing
Separation
Treating
Treating
Reinjection
Reinjection
Disposal
Disposal
Crude Description
Crude Name Generic
Production Rate bpd 545
Properties
API 30.0SG 0.8762
Sulfur wt% 2.0
Heating value LHV
Crude Heating Value GJ/Bbl 5.82
Reservoir CharacteristicsReservoir Pressure psi 3,000Reservoir Temperature °F 200Reservoir Depth ft 5,000
Production CharacteristicsGas/Oil Ratio scf/bbl 1,000Water/Oil Ratio bbl/bbl 10.0Gas Lift NoGas Lift Rate SCFB 0.0Diluent Lift - Use if API below: 25.0
Produced Gas Composition (mol%)Source for Gas Composition DefaultInput Gas Compositon
CH4 mol% 79.74%C2H6 mol% 14.95%C3H8 mol% 4.98%CO2 mol% 0.00%H20 mol% 0.33%
Gas Heating Value - LHV BTU/SCF 1,082Gas Heating Value - LHV w/o CO2 BTU/SCF 1,086
Venting of Produced GasVent Loss % 0.5%Fugitive Loss % 0.5%
Reinjection of Gas and WaterGas Reinjection: % of Gas After Vent/Fugitive % 50.00%CO2 Separaton NoCO2 Reinjection: % % 100.00%Water Reinjection: % of Produced Water % 100.00%Treatment of Reinjected Water YesTreatment of Discharged Water Yes
Disposal of Non-Reinjected GasAmount of Non-Reinjected Gas scf/bbl 500.0
Proportion of Gas to Flare % 1.0%Proportion of CO2 to Flare/Vent % 50.0%
Flaring of Produced Gas% Combusted % 99%% Non-Combusted % 1%
Fuel for Drivers and HeatersDownhole Pump Driver Natural GasWater Reinjection Pump Driver Natural GasCompressor Driver Natural GasFired Heaters Natural GasWater Treatment Natural GasAmine Treater - Fired Heaters Natural GasAmine Treater - Drivers for Motors Natural Gas
• Jacobs developed a crude oil production model to predict GHG emissions for specific crudes
• Uses fundamental unit operations
• Based on public data supplemented with Jacobs in-house knowledge
• Allows user to evaluate impact of key variables and carry out sensitivity studies
Model InputsCrude Oil Production Model
Water Reinjection
49%
Gas Reinjection
7%
Water Treatment
9%
Gas Treatment
16%
Venting10%
Flaring1%
Misc Energy8%
Lifting0%
CO2e Outputs by Category
6
0
5
10
15
20
3 10 15 3 10 15 3 10 15
Water to Oil Ratio
Tota
l CO
2e, g
/MJ
of C
rude
Misc EnergyFlaringVentingGas TreatmentWater TreatmentGas ReinjectionWater ReinjectionLifting
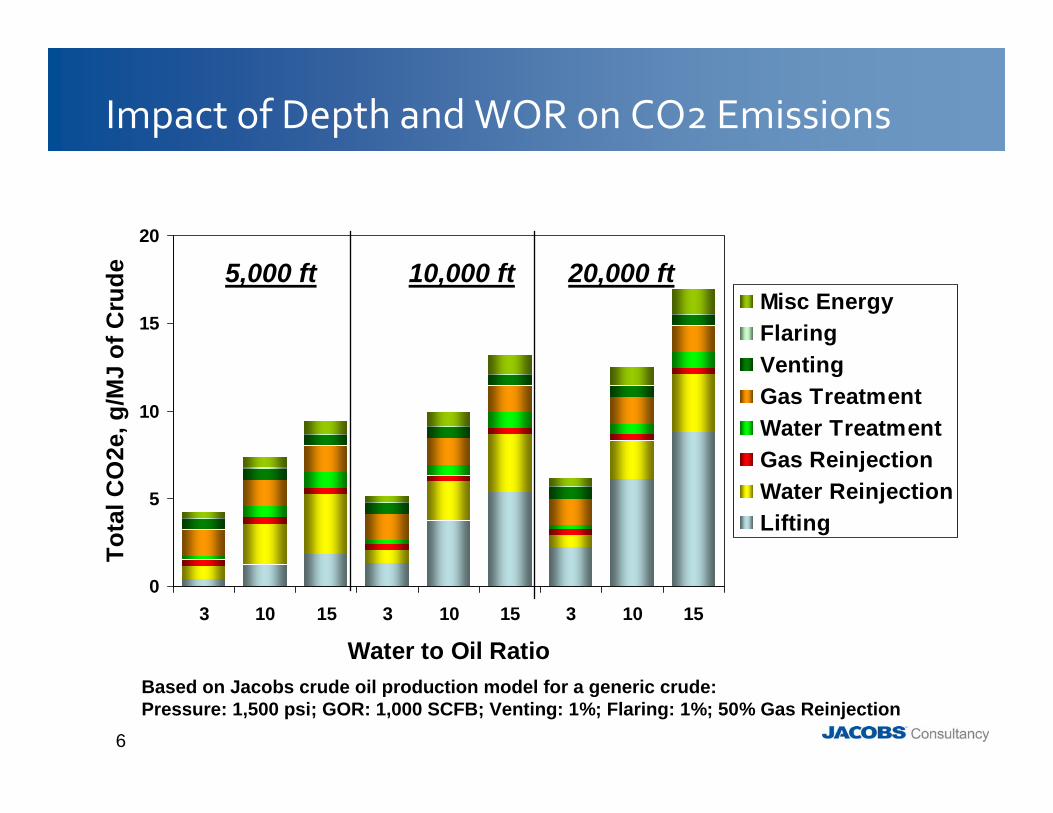
Impact of Depth and WOR on CO2 Emissions
5,000 ft 10,000 ft 20,000 ft
Based on Jacobs crude oil production model for a generic crude: Pressure: 1,500 psi; GOR: 1,000 SCFB; Venting: 1%; Flaring: 1%; 50% Gas Reinjection
7
0
5
10
15
20
Bachaq
uero Maya
ArabMed
MarsBonny L
tKirk
uk Blen
d
Tota
l CO
2e, g
/MJ
of C
rude
Nitrogen
Steam
Misc Energy
Venting
Gas Treatment
Water Treatment
Gas Reinjection
Water Reinjection
Lifting
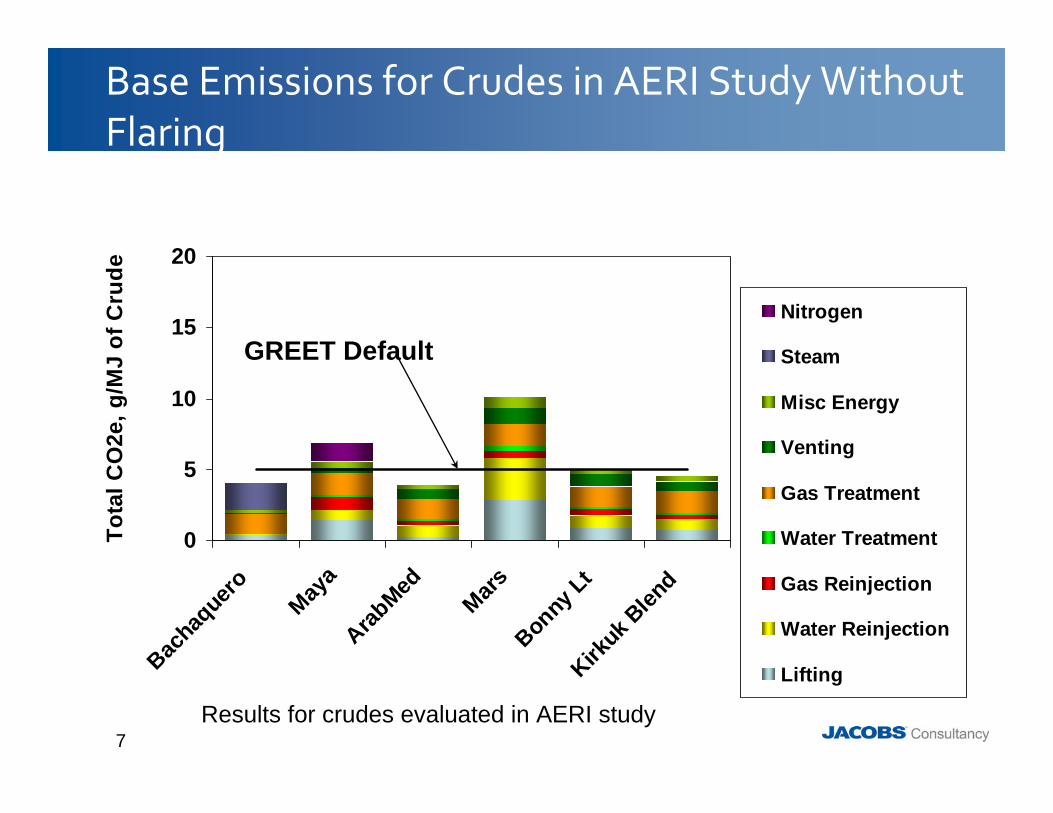
Base Emissions for Crudes in AERI Study Without Flaring
GREET Default
Results for crudes evaluated in AERI study
8
0
5
10
15
20
Bachaq
uero Maya
ArabMed
MarsBonny L
tKirk
uk Blen
d
Tota
l CO
2e, g
/MJ
of C
rude
Nitrogen
Steam
Misc Energy
Flaring
Venting
Gas Treatment
Water Treatment
Gas Reinjection
Water Reinjection
Lifting
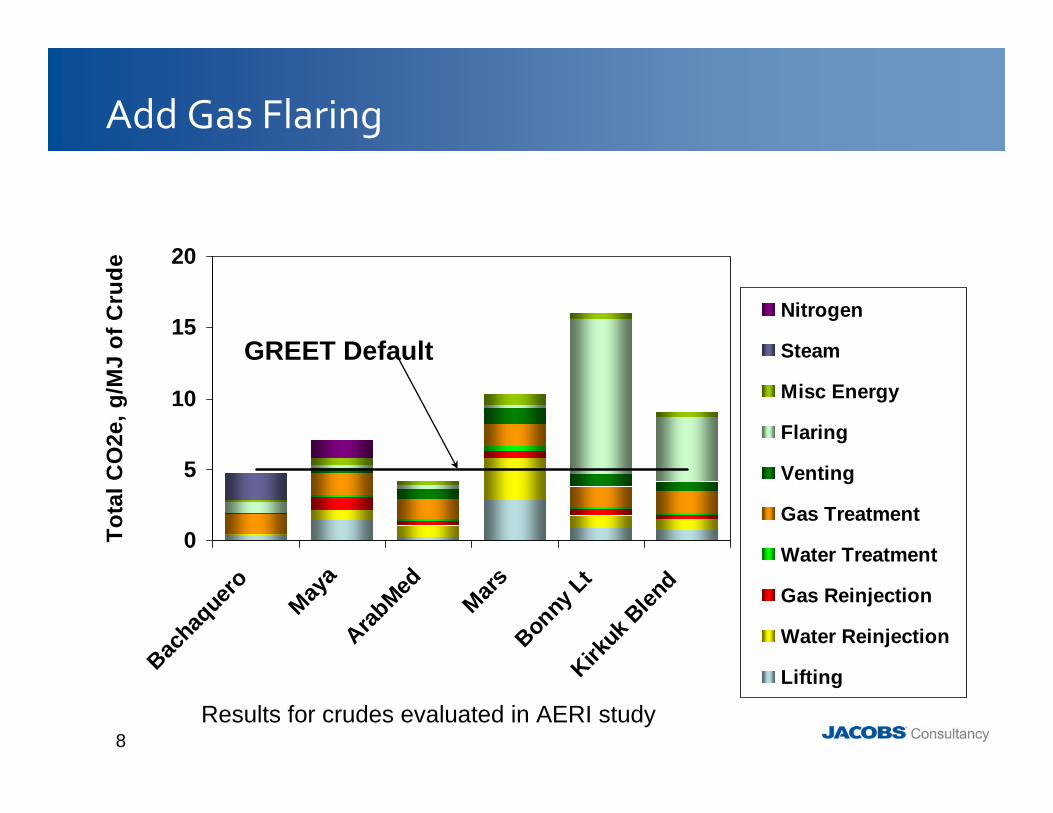
Add Gas Flaring
GREET Default
Results for crudes evaluated in AERI study
9
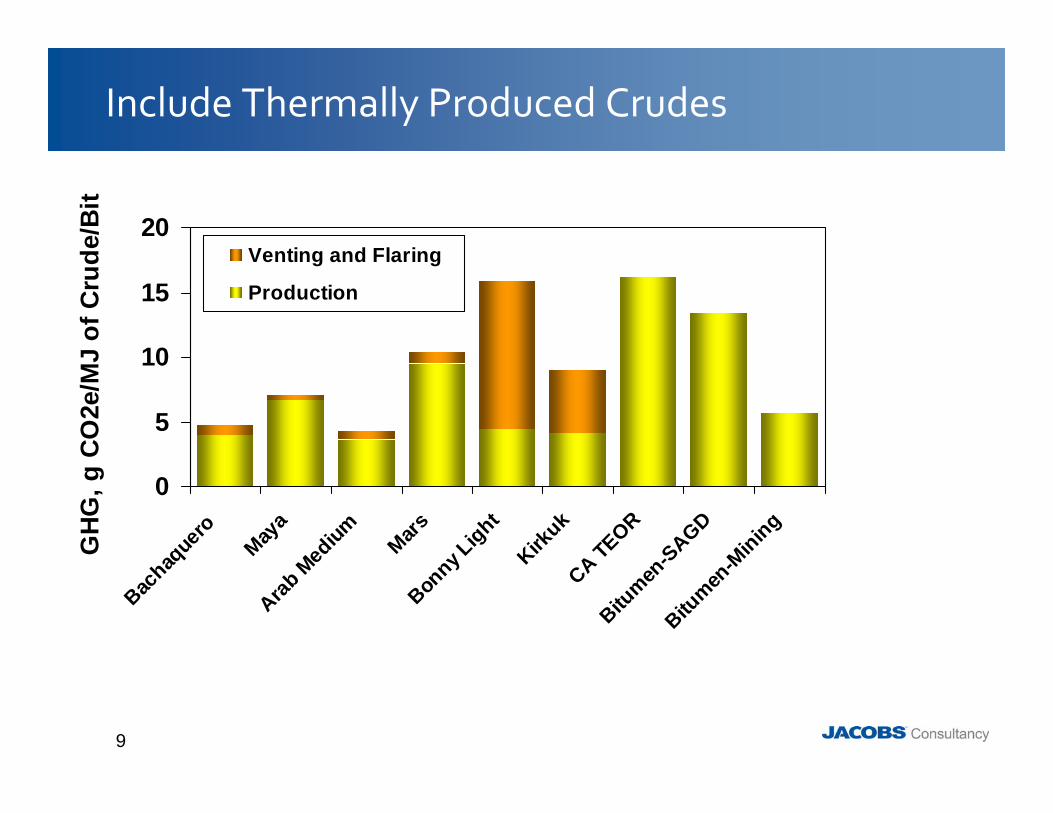
Include Thermally Produced Crudes
0
5
10
15
20
Bachaq
uero
Maya
Arab M
edium Mars
Bonny L
ightKirk
ukCA TE
ORBitu
men-S
AGDBitu
men-M
ining
GH
G, g
CO
2e/M
J of
Cru
de/B
it
Venting and Flaring
Production
10
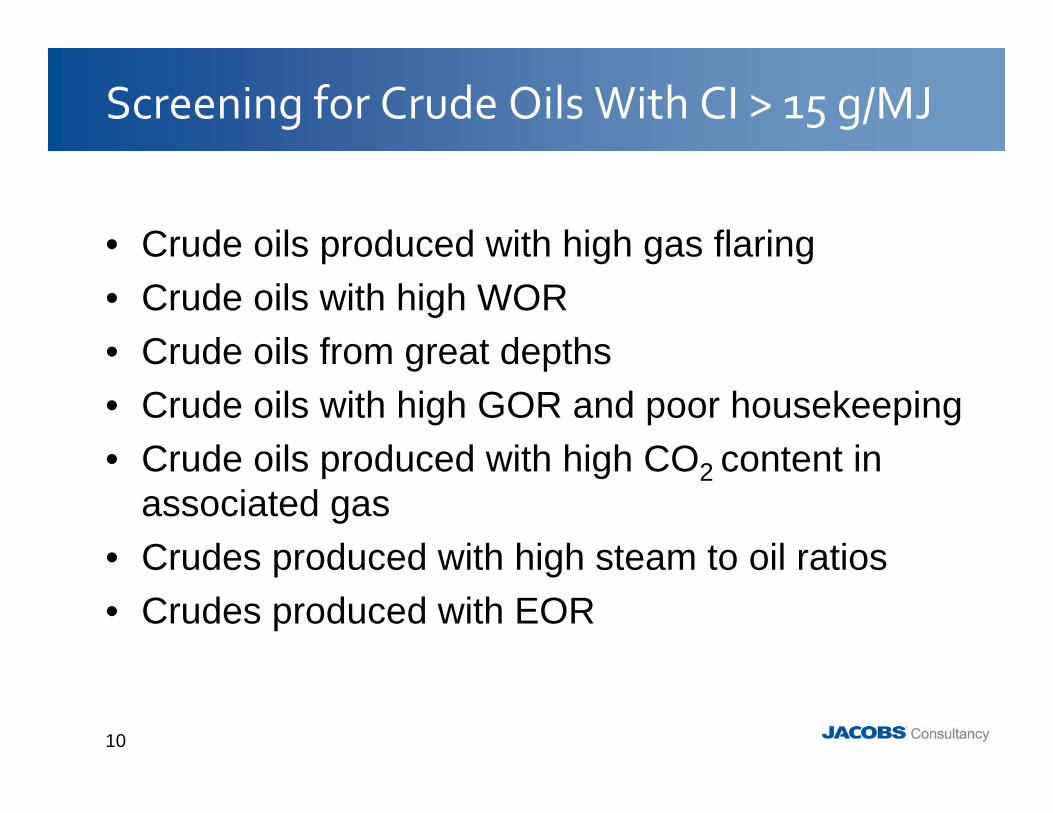
Screening for Crude Oils With CI > 15 g/MJ
• Crude oils produced with high gas flaring• Crude oils with high WOR• Crude oils from great depths• Crude oils with high GOR and poor housekeeping• Crude oils produced with high CO2 content in
associated gas• Crudes produced with high steam to oil ratios• Crudes produced with EOR
11
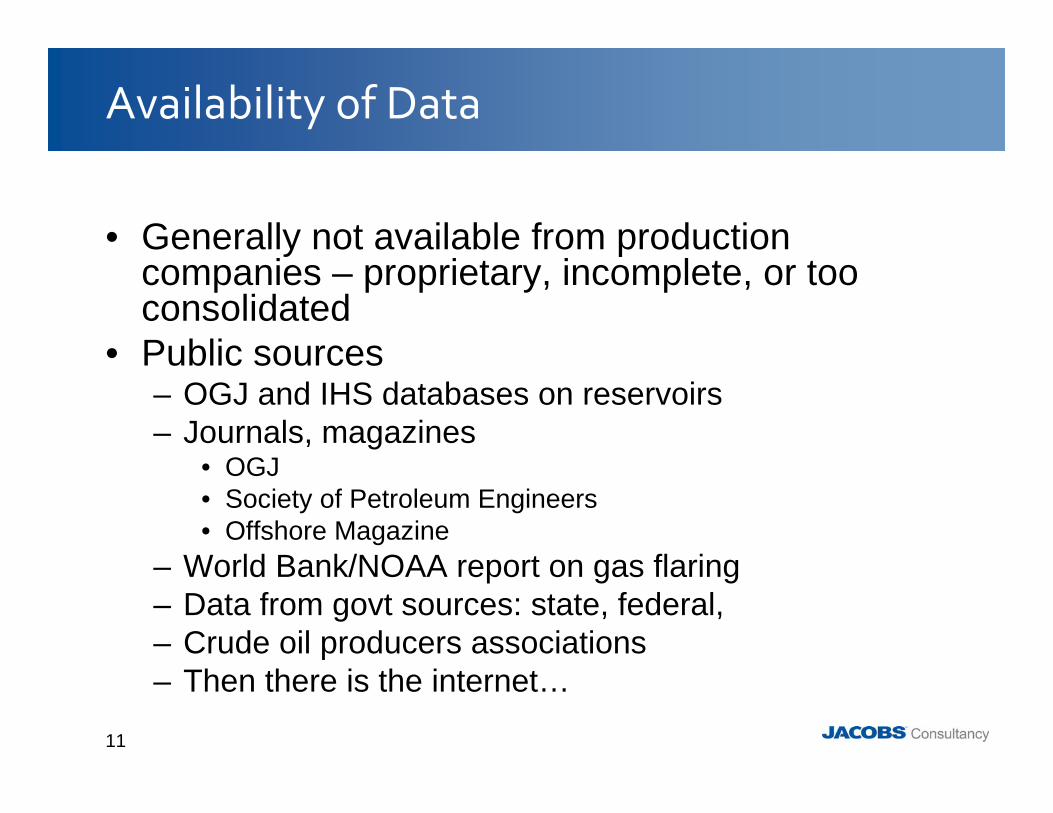
Availability of Data
• Generally not available from production companies – proprietary, incomplete, or too consolidated
• Public sources– OGJ and IHS databases on reservoirs – Journals, magazines
• OGJ• Society of Petroleum Engineers• Offshore Magazine
– World Bank/NOAA report on gas flaring– Data from govt sources: state, federal, – Crude oil producers associations– Then there is the internet…
12
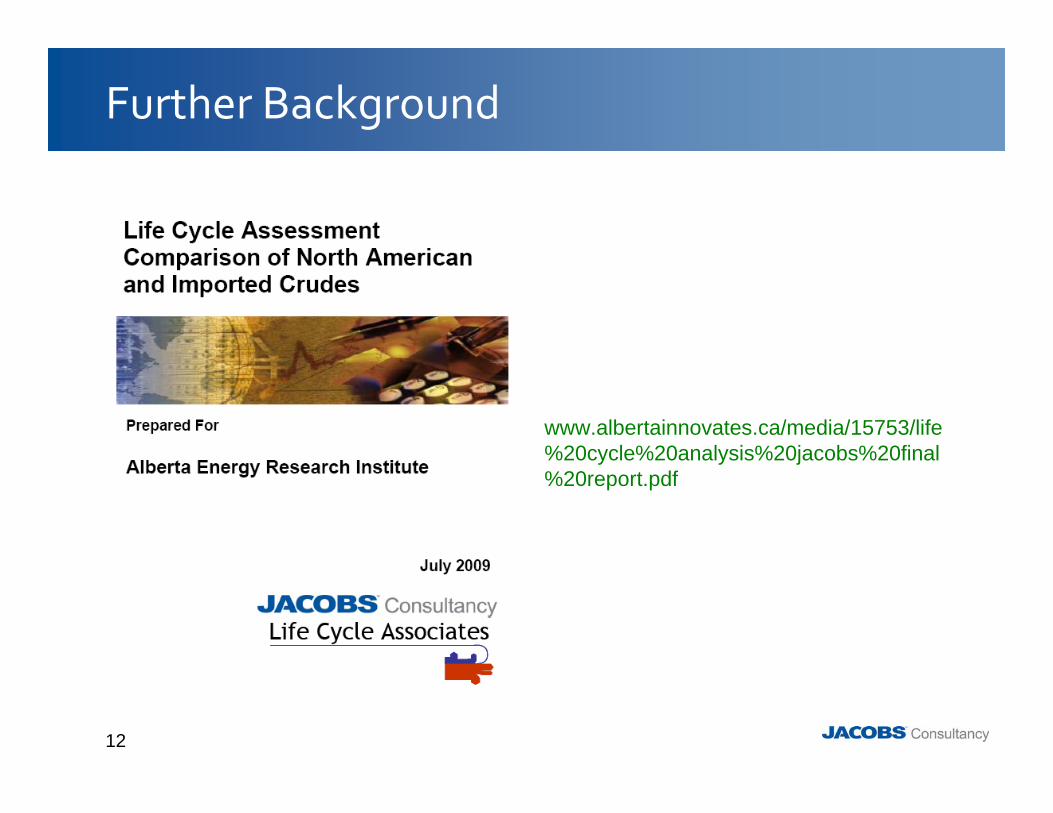
Further Background
www.albertainnovates.ca/media/15753/life%20cycle%20analysis%20jacobs%20final%20report.pdf