Estimating and monitoring the costs of building roads in ... · ESTImATING AND mONITORING THE COSTS...
50
REPORT BY THE COMPTROLLER AND AUDITOR GENERAL | HC 321 Session 2006-2007 | 15 March 2007 DEPARTMENT FOR TRANSPORT Estimating and monitoring the costs of building roads in England
Transcript of Estimating and monitoring the costs of building roads in ... · ESTImATING AND mONITORING THE COSTS...

REPORT BY THE COMPTROLLER AND AUDITOR GENERAL | HC 321 Session 2006-2007 | 15 March 2007
department for transport
Estimating and monitoring the costs of building roads in England

The National Audit Office scrutinises public spending on behalf of Parliament. The Comptroller and Auditor General, Sir John Bourn, is an Officer of the House of Commons. He is the head of the National Audit Office, which employs some 850 staff. He, and the National Audit Office, are totally independent of Government. He certifies the accounts of all Government departments and a wide range of other public sector bodies; and he has statutory authority to report to Parliament on the economy, efficiency and effectiveness with which departments and other bodies have used their resources. Our work saves the taxpayer millions of pounds every year. At least £8 for every £1 spent running the Office.

Layout and production byNAO Information CentreDG Ref: 7423VB
This report has been printed on Consort Royal Silk and is produced from a combination of ECF (Elemental Chlorine Free) and TCF (Totally Chlorine Free) wood pulp that is fully recyclable and sourced from carefully managed and renewed commercial forests. The range is manufactured within a mill which is registered under the BS EN ISO 9001 accreditation, which provides the highest standard of quality assurance.

LONDON: The Stationery Office £13.50
Ordered by the House of Commons
to be printed on 13 March 2007
department for transport
Estimating and monitoring the costs of building roads in England
REPORT BY THE COMPTROLLER AND AUDITOR GENERAL | HC 321 Session 2006-2007 | 15 March 2007

This report has been prepared under Section 6 of the National Audit Act 1983 for presentation to the House of Commons in accordance with Section 9 of the Act.
John Bourn Comptroller and Auditor General National Audit Office
9 March 2007
The National Audit Office study team consisted of:
Flo Ashley, Steve Bowstead, Jon Cable, Nicola Coy and Emma Marshall, assisted by Emma Moorton, under the direction of Geraldine Barker and Jill Goldsmith
This report can be found on the National Audit Office web site at www.nao.org.uk
For further information about the National Audit Office please contact:
National Audit Office Press Office 157-197 Buckingham Palace Road Victoria London SW1W 9SP
Tel: 020 7798 7400
Email: [email protected]
© National Audit Office 2007

sUmmarY 4
part one The costs of building roads are signifi cantly 10higher than initial estimates indicated
Targeted Programme of Improvement schemes 10are costing more than forecast
The Department’s funding of Local Transport Plan 12schemes has increased
part tWoCosts can be greater than estimated at 17each stage of road schemes
Some schemes approved for entry to the roads 18 programmes have not been suffi ciently developed to allow accurate early cost estimates
Higher than expected construction costs have 18accounted for the largest share of the actual and forecast increase in costs
The costs of preparatory work for construction 19have often been understated
The costs of land and liability for compensation 19have been underestimated in some cases
The costs of re-routing utilities have been 20signifi cantly underestimated
Photographs courtesy of The Highways Agency
part tHreeThe Department and Agency are taking 21steps to improve monitoring and control of costs
The Department and Agency are working to 21improve initial cost estimates
The Department has strengthened its appraisal 22and approval of schemes
The Agency is developing its procurement 23strategy but signifi cant cost risks remain
The Department and Agency are taking steps 25to improve their programme management
The Department and Agency could do more 26to share information and good practice with local authorities
appendICes
1 Study methods 28
2 Highways Agency Targeted Programme 34of Improvement
3 Local Transport Plan funded major 40road schemes
4 Schemes dropped or delayed through the 45Regional Funding Allocation process
5 Provisional Regional Funding Allocations 46
CONTENTS

SummARy
4 ESTImATING AND mONITORING THE COSTS OF BuILDING ROADS IN ENGLAND
1 This report examines how the costs of building and improving roads are estimated and monitored from early forecasts through to the final cost of schemes. The Department for Transport (the Department) has approved expenditure of over £11 billion between 1998 and 2021 for the development of new and existing trunk roads and motorways by the Highways Agency (the Agency)
(Figure 1 on page 8), and just under £1.7 billion on major road schemes which are proposed and developed by local authorities in five year Local Transport Plans (Figure 2 on page 9).1 This expenditure contributes to the Department’s Public Service Agreement Target to make journeys more reliable.
1 There are 103 schemes in the Highways Agency’s programme, seven of which are PFI projects let as Design, Build, Finance and Operate contracts. The Programme contained 113 schemes: six schemes have been dropped, one has been transferred to Transport for London and in our analysis we have counted the three A43 Silverstone schemes as one scheme and the two A1 Dishforth to Barton schemes as one scheme. There are 81 Local Transport Plan schemes two of which are planned to be PFI contracts.

SummARy
5ESTImATING AND mONITORING THE COSTS OF BuILDING ROADS IN ENGLAND
2 Schemes have cost more than initial estimates indicated. For the Targeted Programme of Improvement:
n By September 2006, 36 schemes had been completed and, after adjustments for changes in estimating methodology, had cost six per cent more than estimated;2
n The Department’s latest approved estimates of the current Agency schemes are five per cent more than estimated and the latest forecast for the final programme indicates a 27 per cent increase above the initial estimates.
For the Local Transport Plan:
n By July 2006 the 20 schemes completed had cost 18 per cent more than initially estimated and the Department’s funding contribution had increased by 14 per cent.
n The Department’s latest approved estimates of the 61 schemes currently in the plan show an overall increase of 11 per cent above the initial estimates. The Department’s funding contribution has also increased by 11 per cent. The latest local authority forecasts indicate that costs will increase further with the final cost likely to be 31 per cent more than the initial estimates.
n Unlike the Agency’s schemes local authority estimates were not adjusted to compensate for the tendency to underestimate costs. The Department considers that if such adjustments had been made the increases above would be substantially reduced.
Overall Conclusion3 Robust estimating is a key factor in delivering value for money from road schemes but represents a difficult and challenging task given the timescale of major road projects and the number of potential variables, some of which are outside of the Agency’s and local authorities’ direct control such as Public Inquiry outcomes. The Agency is taking action to improve its estimating processes, and the Department to improve its review of proposals put forward by local authorities. There is scope to further tighten procedures by improving ‘intelligent buyer’ skills through better evaluation of time and cost
variances on completed schemes and dissemination of lessons learned; development and utilisation by the Agency of more unit cost data for components of schemes, labour and materials; and by managing prudent contingency provisions so as not to disincentivise project managers from preparing realistic estimates and managing against them. Additionally the Department and Agency could improve programme monitoring by measuring progress on the Agency’s programme on a project by project basis rather than an overall target for all schemes and by comparing costs incurred not only to the overall project budget but also against those expected for the stage of completion.
Key findings1 Most schemes enter the roads programme at an early stage of their development and only have an indicative estimate of likely cost. Final costs were 17 per cent more than initial estimates for the Agency’s schemes entered as outline business cases, compared to seven per cent for schemes where the preferred route had been identified and three per cent for cases approved before the main works contract is let.
2 The Public Inquiry stage for a road scheme may require significant additional design work and major changes to design which make it difficult to produce accurate cost estimates before a Public Inquiry.
3 The biggest increases occur in the construction costs due to:
n inflation in construction costs which is higher than general inflation across the economy;
n design changes (for example where additional junctions are added to plans);
n costs of structures such as bridges and tunnels being underestimated;
n changes in interconnecting roads;
n meeting stakeholder requirements such as those of adjoining landowners;
n insufficient allowance being made for third party and other regulatory costs such as changes in safety standards;
2 Estimates for 35 of the 36 completed Targeted Programme of Improvement Schemes were prepared before 2003 and included a ten per cent contingency for risk but excluded non recoverable value added tax and inflation. From this base line, the actual costs were 40 per cent higher than these initial estimates. Since 2003 the Agency’s estimates have included both value added tax and inflation and in accordance with Treasury guidance issued in 2003 in “The Green Book”, have also been increased by between 3 and 45 per cent to compensate for the tendency to underestimate costs (known as ‘optimism bias’). The original estimates have been adjusted retrospectively, giving the increase of six per cent rather than 40 per cent.

SummARy
6 ESTImATING AND mONITORING THE COSTS OF BuILDING ROADS IN ENGLAND
n complexity of the scheme being underestimated such as where surveys carried out after preparation of initial estimates show ground conditions to be worse than expected; and
n unforeseen work such as discovery of archaeological remains.
4 There are other major factors behind differences between roads costs estimates and outturn including:
n costs of preparatory work for construction (site set up, erection of temporary offices, site transport etc) have been underestimated;
n the costs of land and liabilities for compensation have been underestimated, for example because more land is required than originally anticipated, there is greater than anticipated land and property value inflation, and delays in scheme progress can add to inflationary pressures; and
n costs of re-routing utilities (gas, water and electricity) have been significantly underestimated.
5 The Department and the Agency are taking steps to improve estimating, for example of inflation and land costs but it is too early to judge the success of such measures. Steps are also being taken to improve the understanding and accuracy of cost estimates.3
Additionally, the Department commissioned the Nichols Group to review the Agency’s approach to cost estimating and project management.
6 Estimating could be further enhanced by:
n Better evaluation of completed schemes. Until recently the Agency’s evaluations of roads after they open did not examine costs against budget or the scheme’s progress against timetable. The Agency introduced new procedures in December 2006. The Department has required evaluations by local authorities on schemes approved since early 2006 and has recently issued guidance on evaluating major local authority transport schemes. Neither the Agency nor the Department formally disseminates the lessons learned from scheme evaluations with each other or with local authorities. The Department has supported the establishment of an internet based network for sharing good practice between local authorities.
n Further work to develop and utilise unit costs for schemes. The Agency has made some progress on identifying the unit costs of the main components of schemes and the costs of labour and materials so that it can manage estimates and contracts more effectively. The Department has not undertaken any work to identify the unit costs of Local Transport plan schemes as it does not have access to the detailed breakdown of costs from contracts let by local authorities. Instead it now ensures that cost estimates are externally reviewed by technical experts.
n Reviewing the way provisions for contingencies are made. The Agency includes a contingency to compensate for underestimates in its budgets for individual schemes which whilst prudent may reduce the incentive for project leaders to provide realistic estimates. The Department seeks to mitigate this risk for local authority schemes by sharing any costs incurred above budget with the Local Authority.
7 The Department and the Agency have been able to absorb the increases in costs to date because of delays on some schemes and changes to the roads programmes but this may change.4
8 Monitoring of road schemes requires more rigour:
n The Department has monitored its and the Agency’s spending against annual expenditure limits within three year Government expenditure review periods. The Agency is responsible for developing and delivering schemes in accordance with budgets and the scope approved by Ministers.
n Improved processes have been put in place by the Agency since 2004, whereby expenditure is monitored monthly against budget on individual schemes and since August 2006, it has started to discuss this with the Department. The Agency is not required, however, to report on what proportion of a scheme has been delivered for the expenditure incurred.
n The Department has reviewed the progress of individual Local Transport Plan schemes at least annually and reviews scheme costs at each key decision stage. It is now introducing improved monitoring arrangements for local authority schemes as part of the process of introducing the regional funding allocations for transport schemes.
3 For example, the Department now requires a more comprehensive business case from local authorities, employs consultants to review cost estimates in new business cases, has introduced another approval stage for all projects to control costs during procurement and has introduced greater sharing of cost risks with local authorities. The Agency has introduced contracts which allow contractors to become involved earlier in schemes with the aim of reducing cost, promoting innovation and speeding up delivery.
4 For example of the 58 Targeted Programme of Improvement schemes forecast to have started construction before the end of 2005-06, 15 had not done so.

SummARy
7ESTImATING AND mONITORING THE COSTS OF BuILDING ROADS IN ENGLAND
RecommendationsTo build on recent improvements to the estimating and management of scheme costs
1 The Department should consider defining more clearly the time at which schemes are formally regarded as in its roads programmes which should reflect a time when the scheme development is sufficiently far advanced to allow costs to be estimated with reasonable certainty.
2 The Agency and the Department should examine critically scheme outturn costs against estimates to establish the reasons for the differences and use this information to produce a more informed range of contingency factors to compensate for under estimates and use the data in future appraisals. The contingency factors should be reviewed and updated as and when a significant number of new projects are completed to keep them timely.
3 To emphasise to project managers the importance of realistic and robust cost estimating, the Agency should retain centrally the contingency for underestimates and only allocate funds from this source to individual projects for project accountability purposes where they are satisfied cost variances could not have been foreseen.
4 The Agency should complete its work on establishing unit costs for all key schemes by the end of 2007, so that the Agency can set more realistic initial cost estimates and benchmark its performance against that of other organisations.
5 The Agency should monitor the market rates for key materials and pay rates used in roads construction to enable it to negotiate more competitive contracts with contractors or directly with suppliers.
To build on recent improvements in the monitoring and management of road schemes
6 From 2007-08 onwards, the Agency should publish an annual analysis of initial and updated cost estimates, outturn costs, and progress against target dates, for all road schemes within the Targeted Programme of Improvement.
7 The Agency’s post road opening evaluations should by June 2007, incorporate reviews of the scheme’s costs and progress against timetable compared to plans, identifying the reasons for variances, to ensure lessons are learnt to inform the planning, management and delivery of future schemes.
To enhance capability
8 By the end of 2007, the Agency should conduct a skills audit of its staff and based on the results take action to improve project and contract management skills.
9 The Department and the Agency should share more information between themselves and with local authorities to encourage best practice. This information should include identifying the factors that contribute to the successful delivery of schemes and improve the management of costs.

SummARy
8 ESTImATING AND mONITORING THE COSTS OF BuILDING ROADS IN ENGLAND
1 Location of current schemes in the Targeted Programme of Improvement as at July 2006
Source: National Audit Office
north West
m62 Junction 6 Improvement
m6 Carlisle to Guardsmill Extension
A66 Temple Sowerby & Improvement at Winderwath
A595 Parton – Lillyhall Improvement
A590 High & Low Newton Bypass
A5117/A550 Deeside Park Junctions Improvement
east
m1 Junction 6a – 10 Widening
m1 Junction 10 – 13 Widening
A505 Dunstable Northern Bypass
(A5 to m1 Link)
A47 Blofield to North Burlingham Dualling
A428 Caxton Common to Hardwick Improvement
A421 Great Barford Bypass
A421 Bedford to m1 Junction 13
A14 Haughley New St – Stowmarket Improvement
A14 Ellington – Fen Ditton Improvement
A11 Fiveways – Thetford Improvement
A11 Attleborough Bypass
midlands
m40 Junction 15 (Longbridge)
m1 J21-30
m1 J19 Improvement
A500 City Road & Stoke
A46 Newark – Widmerpool Improvement
A453 Widening (m1 J24 to A52 Nottingham)
A45/A46 Tollbar End Improvement
A1 Peterborough – Blyth Grade Separated Junctions
south West
A419 Blunsdon Bypass
A38 Dobwalls Bypass
A303 Stonehenge
A30/A382 merrymeet Junction
A30 Bodmin Indian Queens
A419 Commonhead Junction
north east & Yorkshire
m1 J39 to J42 Widening
m1 J37 to J39 Widening
m1 J34N to J37 Widening
m1 J32 to J34S Widening
m1 J31 to J32 Widening
m1 J31 to J32 Northbound Collector/Distributor
m1 J30 to J31 Widening
m62 J27 to J28 Widening
m62 J25 to J27 Widening
A63 melton Grade Separated Junction
A57/A628 mottram – Tintwistle Bypass
A1 Bramham – Wetherby (Including Wetherby Bypass)
A69 Haydon Bridge Bypass
A66 Long Newton Junction
A66 Greta Bridge to Stephen Bank Improvement
A66 Carkin moor to Scotch Corner Improvement
A19/A184 Testos Junction Improvement
A1/A19/A1068 Seaton Burn Junction Improvement
A1 Dishforth to Barton
London & south east
m40/A404 Handy Cross Junction Improvement
m27 J3 to J4 Widening
m27 J11 to J12 Climbing Lanes
m25 Junction 28/A12 Brook Street Interchange
m25 J5-7 Widening
m25 J27-30 Widening
m25 J23-27 Widening
m25 J16-23
m25 J1b-3 Widening
m20 Junction 10A
A3 Hindhead Improvement
A27 Southerham to Beddingham Improvement
A23 Handcross to Warninglid Widening
A21 Tonbridge to Pembury
A21 Kippings Cross to Lamberhurst Bypass
A2/A282 Dartford Improvement
A2 Bean – Cobham Phase 2

SummARy
9ESTImATING AND mONITORING THE COSTS OF BuILDING ROADS IN ENGLAND
2 Location of current Local Transport Plan major road schemes as at July 2006
Yorkshire & Humberside
Sheffield Northern Inner Relief Road
East Leeds Link Road
Leeds Inner Ring Road – Stage 7
A165 – Reighton Bypass
A631 – West Bawtry Road Improvements
A628 – Cudworth and West Green Link Road
A57 – m1 to Todwick Crossroads
Hemsworth to A1 Link
Glasshoughton Coalfields Link Road
Waverley Link Road
Beverley Integrated Transport Scheme
north east
Pegswood Bypass
Sunderland Southern Radial Route
Darlington Eastern Transport Corridor
A688 – Weatley Hill to Bowburn Link
A1056 – Northern Gateway Stage 2
North middlesborough Accessibility Improvements
north West
A58 – Blackbrook Diversion
A34 – Alderley Edge Bypass
A57 – Glossop Spur
Hall Lane Area Improvement Scheme
Carlisle Northern Development Route
New mersey Gateway
Liverpool Edge Lane West
Ashton Northern Bypass Stage 2
east midlands
A6096 Ilkeston-Awsworth Link
A612 – Gedling Integrated Transport Scheme
Oakham Bypass
markham Employment Growth Zone
A47 Earl Shilton Bypass
A509 – Isham Bypass
A1073 Spalding to Eye
A43 Corby Link Road
east
A1198 – Papworth Bypass
B1115 – Stowmarket Relief Road
A127/A1159 Priory Crescent, Southend on Sea
Ridgmont Bypass and Woburn Link Road
A6 – Bedford Western Bypass
south east
A228 Leybourne & West malling Corridor Improvement Scheme
A4146 – Stoke Hammond/Linslade Western Bypass
East Kent Access – Phase 1
East Kent Access Phase 2
m4 Junction 11 (Green Park Improvements) and mereoak Roundabout
Thames Gateway A13/A130
Bexhill to Hastings Link Road
Sittingbourne Northern Relief Road
south West
Barnstaple Western Bypass
Poole Bridge Regeneration Initiative Scheme
Taunton Third Way and Northern Inner and Distributor Road
A353/A354 – Weymouth Relief Road
West midlands
Selly Oak Relief Road
A38 - Northfield Regeneration
A429 - Barford Bypass
Rugeley Eastern Bypass Stage 2
Tunstall Northern Bypass
Cradley Heath Town Centre Strategy
Owen Street Level Crossing Relief Road
Rugby Western Relief Road
A 4123/A641 Junction Improvement Burnt Tree
Brierley Hill Access Network
Darlaston Strategic Development Area
Source: National Audit Office

10 ESTImATING AND mONITORING THE COSTS OF BuILDING ROADS IN ENGLAND
PART ONE1.1 The Department for Transport (the Department) has to date given approval to £13 billion of expenditure between 1998 and 2021, on building and widening roads in England. This contributes to the Department’s Public Service Agreement target to make journeys more reliable. The investment in roads is managed through:
n the Targeted Programme of Improvement (the Programme), which covers motorways and trunk roads and is delivered by the Highways Agency (the Agency) (Figure 1). It has approved costs, as at July 2006, of over £11 billion; and
n Local Transport Plans (Figure 2) for road schemes proposed, developed and managed by Local Authorities, which has approved costs, as at July 2006, of just under £1.7 billion.
Since 2006, all Local Transport Plan schemes over £5 million and some Targeted Programme of Improvement Schemes are managed through Regional Funding Allocations. This has been done so that regions can prioritise schemes and has resulted in all routes apart from most motorways and some high volume trunk roads being designated as being of regional rather than national significance. This part of our report examines how the costs of Targeted Programme of Improvement schemes and Local Transport Plan schemes were estimated and how these estimates compare with actual costs of completed schemes and with recent forecasts for those schemes still to be completed.
Targeted Programme of Improvement schemes are costing more than forecast
The cost of schemes listed on the Programme prior to 2003 were underestimated
1.2 The Targeted Programme of Improvement is a list of schemes to build new or widen existing trunk roads and motorways, which the Department identifies through regional planning processes. The Programme began in 1998 and currently covers schemes with a delivery date of up to 2021. There are 1035 schemes in the Programme, of which 36 had been completed by September 2006.
1.3 Prior to 2003 the Department submitted schemes to Ministers for approval for entry to the Programme, with estimates developed by the Agency which were based on current prices and included a ten per cent risk allowance but excluded Value Added Tax and inflation over the life of the project. We examined the final cost of all 36 completed Targeted Programme of Improvement schemes6 compared to these initial estimates and found that the outturn cost was 40 per cent higher. Five of the 36 schemes accounted for almost 40 per cent of the increases against initial estimates7 while one scheme had a large cost reduction following a decrease in scope (Appendix 2, Figure 9).
The costs of building roads are significantly higher than initial estimates indicated
5 The Programme contained 113 schemes: six schemes have been dropped, one has been transferred to Transport for London and in our analysis we have counted the three A43 Silverstone schemes as one scheme and the two A1 Dishforth to Barton schemes as one scheme.
6 All but one of these schemes had received approval prior to 2003.7 A500 Basford, Hough, Shavington Bypass, A41 Aston Clinton Bypass, A34 Chieveley/M4 J13 Improvement, A43 Silverstone Bypass/A43 Whitfield Turn
– Brackley Hatch Improvement/A43 M40 – B4031 Dualling, and A1 (M) Wetherby – Walshford schemes account for almost 40 per cent of the total cost increase.

PART ONE
11ESTImATING AND mONITORING THE COSTS OF BuILDING ROADS IN ENGLAND
1.4 In 2003, the Treasury issued “The Green Book” which provides guidance on adjusting estimates for bias and risks. In accordance with this guidance, since 2003 the Department has submitted estimates to Ministers which include non-recoverable value added tax, inflation initially at a rate of two and a half per cent but more recently at a higher rate to reflect recent inflation in construction costs and a variable percentage increase to compensate for the tendency for project appraisers to be overly optimistic and to under-estimate costs (optimism bias). The Agency revised the initial estimates for the 36 completed schemes retrospectively so that they were calculated in accordance with The Green Book guidance, including a contingency for underestimating costs ranging from three per cent to 45 per cent depending on each scheme’s stage of development on entry to the Programme (see Appendix 1 for further detail on the level of adjustment). On this basis the cost of the 36 schemes was six per cent more than the Agency’s revised estimates (Figure 3).
Latest approved estimates for current schemes are seven per cent higher than initial estimates and further increases are likely
1.5 The initial estimates for the 67 schemes in the Targeted Programme of Improvement which are still to be completed total £8,952 million when adjusted for inflation, VAT and a contingency to correct under-estimation (35 of these schemes were approved before 2003, if their initial estimates are used, the total cost would have been £8,043 million). The latest approved estimate for the 67 schemes is £9,356 million, an increase of five per cent. In July 2006, there was a further revision of the estimates for 43 of these schemes, which if confirmed and approved by Ministers would mean forecast costs of £11,410 million, an increase of 27 per cent above the initial estimates (Figure 4 overleaf)8. The Department told us that in many cases there is still uncertainty about these July 2006 estimates.9 The Agency will only seek Ministerial approval of these increases when it has reviewed them to identify efficiencies, is satisfied that the latest estimate is accurate and cannot be reduced further and that in the view of the Department and the Agency the scheme still offers good value for money. The Agency is urgently reviewing its approach to estimating and will produce revised estimates for all current schemes later in 2007.
1.6 The Department told us that the July 2006 forecast costs have since increased further. Our analysis found that 35 of the 67 current schemes entered the Programme after 2003 and are still at an early stage, for example, the preferred route has not yet been decided for 14 schemes. To date, revised estimates have only been approved for three of these 35 early schemes and these showed an increase of 22 per cent over initial estimates. This contrasts with estimates for 25 of the 32 more advanced schemes, which have an average increase of 37 per cent. Most of these schemes have progressed through the detailed design and planning stages; nine have been through public inquiry and 12 are in construction. The five largest schemes account for over half of the latest Ministerially approved budget and have an average increase in estimate of 30 per cent.
Cost (£ million)
TPI
1,800
1,600
1,400
1,200
1,000
800
600
400
200
0
Change in cost explained by other factors
Source: National Audit Office analysis of Highways Agency data
NOTE
To determine the extent of cost increases explained by the historical approach to estimating, cost estimates on entry to the programme were adjusted to include non-recoverable VAT and inflation and contingency for underestimates. For a full explanation of the adjustments see notes to Figure 9 at Appendix 2.
Contingency for underestimates
Non-recoverable VAT + inflation on initial estimate
Completed schemes cost six per cent more than early estimates indicated even when a contingency is added to compensate for underestimates
3
Initial programme entry estimate
94186
209
1,225
8 If the original estimates were used for schemes approved before 2003, this figure would increase to 42 per cent.9 Because of the uncertainty about these estimates we have not included these figures in Figures 10 and 11 of Appendix 1.

PART ONE
12 ESTImATING AND mONITORING THE COSTS OF BuILDING ROADS IN ENGLAND
1.7 This indicates that several current road schemes are likely to cost more than their initial estimates by a greater margin than those schemes which have been completed. Possible reasons for this may include that the earlier schemes were more straightforward or at a later stage when entering the Programme and so subject to fewer changes or they were subject to a lower rate of inflation than more recent schemes. The current programme also includes some particularly complex schemes, such as the A303 at Stonehenge and the Hindhead Improvements that have been in the programme for several years and where significant changes in scope have arisen.
The Department’s funding of Local Transport Plan schemes has increased
The Department increased its funding by 14 per cent for completed schemes
1.8 Local Transport Plans which cover five year periods, are produced by all County Councils, Unitary Authorities and Metropolitan Authorities in England. Major schemes promoted through Local Transport Plans embrace a range of transport projects including the building and developing of new roads, improvements to existing roads and proposals for other transport schemes such
as buses. Ministers ultimately decide what package of schemes represents the best use of the available budget in the light of local, regional and national objectives. The Department scrutinises business cases for major schemes, including cost estimates, and approves the funding at the Programme Entry stage. It also scrutinises the costs at a later stage before tenders are sought and when schemes are ready to start construction. Local authorities are responsible for designing the schemes, preparing cost estimates, taking them through consultation and the statutory processes such as Compulsory Purchase Orders, and for their procurement and delivery. The Department has no direct responsibility for estimating costs or for the management and delivery of schemes although it has an interest in the accuracy of estimates and subjects schemes to a full appraisal and value for money assessment based on business cases provided by local authorities at each approval stage.
1.9 Local Transport Plan road schemes have risen in cost compared with initial estimates as has the Department’s contribution. We found that the total cost of the 20 schemes completed by July 2006, increased by 18 per cent from when Ministers had approved them to enter the programme and that the Department’s contribution had increased by 14 per cent. The Department met 75 per cent of the total increase, with the remaining
Source: National Audit Office analysis of Highways Agency data
NOTE
1 To determine the extent of cost increases explained by differences in the approach to estimating, cost estimates on entry to the programme were adjusted to include non-recoverable VAT, inflation and an adjustment for under-estimation in accordance with revised Treasury guidance on investment appraisal issued in April 2003. For a full explanation of the adjustments see notes to Figures 9 and 10 at Appendix 2.
Cost (£ million)
Total
12,000
10,000
8,000
6,000
4,000
2,000
0
2,054
4049098,043
The July 2006 estimates for schemes are 27 per cent higher than initial estimates when adjusted to include allowance for inflation, VAT and underestimation
4
Latest estimate of outturn
Latest approved estimate
Initial estimate adjusted for non-recoverable VAT, inflation and underestimation
Initial programme entry estimateSchemes that
entered TPI after April 2003
1,49376
6,830
Schemes that entered TPI before
April 2003
328561
9091,213

PART ONE
13ESTImATING AND mONITORING THE COSTS OF BuILDING ROADS IN ENGLAND
increases being met by local authorities and developers (Figure 5). Nineteen of the 20 schemes showed increases in total costs, with the Department’s contributions for these schemes increasing by between less than one per cent and 40 per cent. (Appendix 3, Figure 12).
1.10 Local Authority estimates were not made on a standard basis; we found, for example, evidence of different assumptions being used about inflation. These schemes were also approved before the introduction of the Treasury’s Green Book guidance in 2003 and so the estimates were not increased to compensate for the tendency to underestimate costs (optimism bias). As stated in paragraph 1.4, under Treasury guidance after 2003, such scheme estimates could have been increased by between three and 45 per cent depending on their stage of development. Had these increases been applied retrospectively as they were for the Agency schemes, the revised estimates would have been very close to the actual cost. Since 2003, the Department has required Local Authorities to include an allowance for underestimation in their estimates for appraisal purposes but this is not included in the approved budgets to maintain the incentive to control costs.
The Department has increased its funding for current schemes by 11 per cent and costs are forecast to increase further
1.11 Initial estimates were that the 61 road schemes currently in the Local Transport Plans and still to be completed would cost just over £1.4 billion, and that the Department’s approved funding contribution would be just over £1.2 billion (86 per cent). The Department has now given approval to obtain tenders to 26 of these schemes, with latest approved estimates which are 38 per cent higher than initial estimates and which increase the Department’s contribution by 44 per cent. Even if the estimates for the other schemes do not increase, this would give a total approved cost of the programme of just under £1.6 billion and the Department’s contribution will have increased by 11 per cent (Figure 6 overleaf). Costs are likely to rise further though as the latest forecasts provided by local authorities to the Department suggest that the total cost of the current Local Transport Plan schemes would be just under £1.9 billion,10 31 per cent more than the initial estimate. As stated in paragraph 1.10, these initial estimates were not increased to compensate for the tendency to underestimate costs. The Department considers that such an adjustment would materially reduce the size of the identified cost increases.
Monitoring delivery of the Targeted Programme of Improvement to cost and time has been limited
1.12 Forward funding plans were initially established in 1998 for the Targeted Programme of Improvement and in 2000 for Local Transport Plan major schemes. Further indicative funding projections were made in the Government’s 10 Year Transport Plan issued in 2000 and in the Government Spending Reviews of 2002 and 2004. These Spending Reviews set indicative budgets for the next three years and, subject to agreed changes, it is against these budgets and within this three year time period that the Agency monitors its expenditure as does the Department. The Department also monitors the longer term costs of delivering schemes in the Targeted Programme of Improvement against indicative longer term funding profiles, currently up to 2015. The Agency is also accountable for delivering objectives agreed with the Department within the three year spending periods, for example, objectives to reduce congestion and improve journey reliability.
10 The increase of 31 per cent to £1,874 million is lower than the 48 per cent increase that the Department reported to Parliament in May 2006 because of the changes to the programme announced in July 2006 (paragraph 1.20).
Cost (£ million)
LTP
400
350
300
250
200
150
100
50
0
Source: National Audit Office analysis of DfT, Government Office for the Regions and local authority data
NOTE
The total of 345 differs from the total final cost figure in Appendix 3, Figure 12 because of rounding.
The 20 completed Local Transport Plan major road schemes cost 18 per cent more than indicated by initial estimates
5
133830
264Local authority/developers (additional contribution)
DfT (additional contribution)
Local authority/developers contribution (initial estimate)
DfT contribution (initial estimate)

PART ONE
14 ESTImATING AND mONITORING THE COSTS OF BuILDING ROADS IN ENGLAND
1.13 The Agency is responsible for developing and delivering schemes in accordance with budgets and the scope approved by Ministers when the scheme entered the Programme and within Spending Review periods it is required to deliver a programme of schemes approved by Ministers within an agreed budget. It is accountable to Ministers for all cost increases above the Agency’s delegated financial limits. In recent years it has improved
its financial systems so that it can monitor costs more effectively. Since 2004, it has kept and reviewed monthly records of actual costs and it has produced a detailed monthly report of expenditure against budget. Since August 2006, the Department has regularly discussed the estimated cost of schemes with the Agency. In addition all schemes which experience cost increases in excess of the Agency’s delegated financial limits are subject to a re-appraisal by the Department before being submitted to Ministers for a decision on whether to approve the increase. The Agency is not required, however, to report on what proportion of a scheme it has delivered for the expenditure it has incurred and does not monitor this.
1.14 The Agency has maintained a spreadsheet which it shares with the Department and updates regularly that shows the progress of schemes through the key stages of the delivery process. A progress points system is used to monitor delivery of the overall Targeted Programme of Improvement. Each scheme under development can earn a maximum of 100 points, with points awarded for achieving key events such as the start of construction. The Department sets an overall target for the number of points the Agency must earn within a three year period to provide the Agency with some flexibility in its programme management. Measuring achievement against this target does not identify which schemes are running late or which are on time.
1.15 In 2000, the Agency stated that it was a priority to deliver projects more quickly and set a target in 2002 to reduce the time taken to deliver new road schemes to between five and seven years. The Agency does not monitor whether it is achieving this target. We analysed data for completed schemes that entered the Targeted Programme of Improvement before the public inquiry stage and found that they took six years on average to complete the various stages from programme entry (Figure 7). Some schemes have progressed more slowly.
Cost (£ million)
Current LTP schemes
2,000
1,800
1,600
1,400
1,200
1,000
800
600
400
200
0
Source: Analysis of Government Office for the Regions and local authority data
NOTE
Local Authorities’ latest cost estimates for the schemes were provided in May 2006 and, for schemes that entered the programme following Regional prioritisation, in July 2006. Most of these estimates have not yet been approved by Ministers.
The 61 current Local Transport Plan major road schemes have approved cost estimates 11 per cent higher than their initial estimates
6
286
17
198136
1,237
Local authority/developers (additional contribution)
DfT (additional contribution)
Local authority/developers contribution (initial estimate)
DfT contribution (initial estimate)
Latest estimate of outturn
7 The Agency aims to complete the various stages of a road scheme in an average of seven years
Source: National Audit Office analysis of Highways Agency data
10 months
Identify possible routes
Public consultation and preferred route
announcement
Programme entry and contract award (ECI)
Further design of preferred route
1 year, 5 months
2 years, 3 months
2 years, 10 months
Target time taken to reach each stage (cumulative)

PART ONE
15ESTImATING AND mONITORING THE COSTS OF BuILDING ROADS IN ENGLAND
For example, the A2 Bean to Cobham Phase 2 and the A2/A282 Dartford Improvement schemes both entered the Programme in July 1998 but construction only started at the end of 2006. The current forecast date for these schemes opening to traffic is early 2008, almost 10 years after entry to the programme.
The Agency has been able to absorb cost increases because of delays on some schemes and changes to the roads programmes
1.16 Despite the increases in costs of completed schemes and rising forecast costs the Agency has been able to absorb these increases as some schemes have slipped against their original timetable. For example, of the 58 schemes forecast to have started construction before the end of 2005-06 as of 31 March 2006, 15 had yet to start. Of these 15, one has been dropped from the Programme and four still do not have confirmed dates for construction.
The level of funding for the Targeted Programme of Improvement is set in each spending review
1.17 Funding for the Targeted Programme of Improvement up to 2007-08 was agreed in the 2004 Spending Review and the Agency announced the programme of schemes it planned to take forward. In July 2006, as a result of deciding priorities for Regional Funding Allocations it was decided that six regional schemes in the Programme would not be funded before 2015-16 and timetables for a further seven schemes would be altered. When the Agency reviewed the programme’s funding in July 2006 it concluded that after these changes had taken place, its programme could, if all the remaining schemes went ahead, result in expenditure from 2005-06 to 2020-21 of £13.4 billion. Funding beyond 2007-08 will be considered within the 2007 Comprehensive Spending Review.
The Department does not monitor delivery of Local Transport Plan road schemes in detail against original timetables
1.18 Under the Local Transport Plan local authorities are responsible for the delivery of approved road schemes. There is no separate budget for roads within the overall budget for Local Transport Plan major schemes which also cover other schemes such as public transport. To date the Department has had sufficient funding available to fund the road schemes under development. We analysed the Department’s data and found that between 2001-02 and 2004-05 the Department spent £430 million on major road schemes which was £134 million less than the allocated funding of £564 million for that period because of slippage in Local Authorities’ planned delivery timetables while in 2005-06 there was a further underspend. The Department told us that with the introduction of Regional Funding Allocations (paragraph 1.20) it will obtain cost information from local authorities on a quarterly basis and has set out a process for holding six monthly meetings with each region to monitor progress.
1.19 The Department’s principal responsibility is for the allocation and management of funding for the local authority major schemes and therefore does not monitor in detail or maintain data analysing whether schemes are being completed in accordance with local authorities’ original timetables. Our work indicates that local authorities are taking longer to deliver some schemes than they originally expected. For example, we examined four completed schemes in more detail and found that they had an average delay of four months while the seven current schemes we examined are due to open to traffic nearly four years later than the original expected date. Such delays have helped to reduce cost pressures on the Department’s budget for major schemes.
Publish draft Orders and
Environmental Statement
Public inquiryServe Orders and approve final design
ConstructionRoad open to
traffic
3 years, 3 months
4 years 6 months
5 years, 1 month
7 years 1 month
Target time taken to reach each stage (cumulative)

PART ONE
16 ESTImATING AND mONITORING THE COSTS OF BuILDING ROADS IN ENGLAND
The introduction of the Regional Funding Allocations has changed the composition of the roads’ programmes
1.20 Following an announcement in 2005 that regions would have a role in deciding priorities for regional and local transport schemes, in July 2006 changes were made to the roads programmes. Under the terms of the new Regional Funding Allocations seven new local road schemes, as well as 10 other local transport schemes, have been approved for entry into the regional programme. In turn, as stated in paragraph 1.17, six regional road schemes in the Agency’s Targeted Programme of Improvement and eight road schemes (and one other transport project) previously in Local Transport Plans will not now be funded during the period to 2015-16 while a further seven Agency schemes will now proceed to a significantly different timetable to that previously planned.11 In addition to the schemes that have already been approved the Department expects there to be further headroom in the Programmes in future years. The Secretary of State announced in July 2006 that he expected at least a further 90 transport schemes would be added to the programmes over the next ten years.
1.21 There is currently significant over-programming between 2006-07 and 2011-12, of up to 21 per cent each year and under-programming in later years, which the Department told us, was in expectation of scheme slippage. Four of the eight regions are over-programmed while two regions, the South East and West Midlands currently have substantially less schemes allocated than funding provisionally allocated in the later years (Appendix 5).12 The Department has indicated to the regions that it is retaining the authority to manage budgets across the Regional Funding Allocation programmes to ensure that spending is in balance across the total programme, taking account of regional views on the sequencing and timing of schemes. The Department told us that the introduction of Regional Funding Allocations in 2006 has significantly enhanced its capacity to monitor cost increases on Local Transport Plan schemes and it will be more able to identify slippage on schemes and the implications that this may have for scheme budgets.
11 These schemes are listed in Appendix 4.12 The South East only prioritised its schemes for the first five years. The Department tells us that it has received their advice for the second five years recently.
Note: Appendix 5 includes expenditure on all Local Transport Plan transport schemes including roads.

PART TWO
17ESTImATING AND mONITORING THE COSTS OF BuILDING ROADS IN ENGLAND
2.1 Costs can be higher than estimated at each stage of the development and delivery of road schemes although estimates should become more robust as schemes go through the various stages of the development process. The Department and the Agency have investigated the reasons for cost increases on individual schemes but until 2006 the Department and the Agency had not collected aggregated data on the reasons for cost increases. We examined 13 schemes (seven from the Targeted Programme of Improvement and six Local Transport Plan schemes)13, reviewed the results of exercises the Agency has undertaken14 and information from stakeholders, to identify the factors driving actual and forecast cost increases compared to the initial estimates. We found that the cost of construction work accounted for nearly 50 per cent of total cost increases while the cost of buying land and paying compensation to landowners contributed over a quarter of the overall increase on schemes (Figure 8).
2.2 In August 2006, the Agency employed consultants to identify the underlying reasons for cost increases compared with the estimates made when schemes were approved into the Targeted Programme of Improvement. The consultants were able to obtain sufficient data to analyse 35 of the Programme’s 103 schemes. In contrast to the approach adopted by ourselves and the Agency in their submission to the Transport Select Committee, the consultants stripped out the effects of past and likely future inflation which they calculated accounted for 45 per cent of the increases. Of the remaining 55 per cent they found that the biggest increases were caused by changes in the
scope of the project and weaknesses in estimates. The consultants examined these two factors in more detail and found that within these headings the five biggest increases were in preparatory work before construction, design and supervision, earthworks, drainage and structures. These factors in total accounted for over 27 per cent of cost increases while the effects of time delays accounted for a further 14 per cent.
8 Works costs are the largest contributor to cost increases for major and local road schemes
Cost element Breakdown of average costs by cost percentage elements for a of cost typical tpI increases on tpI road scheme and Ltp road schemes by cost element
Works costs 54 48
Costs of preparatory 23 10work before construction
Design and supervision 9 9
Cost of land and 7 26paying compensation
Statutory undertakers 7 7
total 100 100
Source: National Audit Office analysis of Highways Agency and Department for Transport data
13 Initially we selected four completed and eight current schemes from both the Targeted Programme of Improvement and the Local Transport Plan programme but were only able to find sufficient data for 13 schemes to enable us to calculate the cost increases attributable to each element.
14 The Agency reviewed seven schemes in the current Targeted Programme of Improvement to examine the main reasons for the latest cost estimates being greater than the estimates on entry to the programme, other than the differences explained by the revised approach to estimating, and reported the results to the Transport Committee for its report in July 2006. The Agency also engaged consultants in February 2006 to carry out an in-depth cost audit and investigation of three projects in the current Targeted Programme of Improvement (A2 Bean to Cobham improvement, A2/A282 Dartford Improvement, M6 Carlisle to Guardsmill Extension) and that the Agency is delivering under the Early Contractor Involvement form of contract.
Costs can be greater than estimated at each stage of road schemes

PART TWO
18 ESTImATING AND mONITORING THE COSTS OF BuILDING ROADS IN ENGLAND
Some schemes approved for entry to the roads programmes have not been sufficiently developed to allow accurate early cost estimates2.3 The level of development of a scheme at the point of entry to the roads programmes has varied, and the earlier the schemes have been included the more likely it has been that further changes are needed to the schemes’ design and design costs have increased. We analysed 3515 of the 36 completed Targeted Programme of Improvement schemes and found that outturn costs increased from the estimate at programme entry16 by 17 per cent for schemes that entered at the earliest stage (outline business case), by seven per cent for schemes where the preferred route had been identified and by three per cent for schemes that entered before the letting of the main works contract (Appendix 2, Figure 10).
2.4 All roads schemes’ initial appraisals examine the expected environmental impact of the scheme, to identify potential difficulties from the outset. The Department’s guidance requires the Agency and local authorities to consult statutory environmental bodies (Natural England, English Heritage and the Environment Agency) throughout the design process of all schemes. The Agency does this before schemes enter the Targeted Programme of Improvement; the Department also consults these bodies and other non governmental environmental organisations on the environmental appraisals for proposed Local Transport Plan major road schemes. Despite these procedures the risk remains that the Public Inquiry stage for a road scheme will require significant additional design work, and major changes to the design, which makes it difficult to produce accurate costs estimates before a Public Inquiry. In some of the cases we reviewed, the Public Inquiry stage had a very significant impact on the design costs of the schemes. For example, on the A1073 Spalding to Eye scheme the Inspector required the local authority to investigate and cost seven alternative routes provided by objectors at the 2004 Public Inquiry.
Higher than expected construction costs have accounted for the largest share of the actual and forecast increase in costs 2.5 The biggest increases occurred in construction costs. In 2005, consultants reported to the Agency that inflation in the highways sector has been and will continue to be above the general rate of inflation and has been a significant factor in increases in construction costs. Other factors which have led to increased actual and forecast costs are:
Design changes:
n to achieve the initial or revised objectives. For example, costs increased by £4.3 million (five per cent) on the A46 Newark to Widmerpool Improvement scheme to incorporate an upgrade of three junctions not considered necessary when the initial estimate was made. The Agency’s consultants also found that the cost of structures such as bridges and tunnels were often underestimated. For example, the original estimate for the M6 Carlisle to Guardsmill extension assumed a single span bridge. Scheme costs increased by £7.9 million (17 per cent) when, during detailed design, the Agency decided a three span bridge was needed. Delays can increase the risk of changes to designs, for example, to take account of revised traffic projections or other transport needs;
n to address changes in interconnecting roads. In two of our Local Transport Plan case examples, costs increased because the Agency required additional work. For example, the Darlington Eastern Transport Corridor scheme estimate increased by £1.8 million after the Agency requested junction improvements and localised widening of the A66; and
n to meet stakeholder requirements. For example, the inclusion of a bridge across the Lamberhurst Bypass to reduce the impact on National Trust land increased costs by £2 million. In another case study costs had increased because of a change in Network Rail’s requirements relating to a bridge.
15 We did not include the completed A1(M) Ferrybridge-Hook Moor Design Build Finance and Operate scheme in the analysis as this scheme was funded on a different basis.
16 These figures are based on scheme costs when they entered the Programme adjusted for inflation, non recoverable VAT and optimism bias.

PART TWO
19ESTImATING AND mONITORING THE COSTS OF BuILDING ROADS IN ENGLAND
Regulatory requirements:
n initial estimates made insufficient allowance for third party and other regulatory costs. For example, changes in safety standards added £0.7 million to the cost estimate for the A1 Peterborough to Blyth Grade Separated Junctions for wider slip roads.
Other factors:
n the complexity of the work was underestimated. In some cases, surveys carried out after the preparation of initial estimates sometimes show the ground conditions are worse than expected requiring further work to prepare the site for construction. For example, complications in drainage works increased the cost of the M1 Junction 6a 10 widening scheme by £11 million.
n unforeseen work. For example, on the Barnstaple Western and Papworth Everard Bypasses the costs of archaeology work were underestimated.
The costs of preparatory work for construction have often been understated2.6 Local authorities typically add between 12 and 20 per cent of the construction work costs to cover the preparatory work for construction (preliminaries), including site set up, erection of temporary offices, site transport, temporary works, traffic management, large plant and insurance. Historically, the Agency has estimated these costs at a standard 16 per cent of the construction cost for Targeted Programme of Improvement schemes although this figure can vary considerably. For example, the Agency’s consultants found on three schemes that such costs ranged between 28 to 30 per cent of the construction cost.
The costs of land and liability for compensation have been underestimated in some cases2.7 For the construction of new roads and some road widening schemes the Agency and local authorities need to purchase land and compensate the owners of land compulsorily purchased and others affected by the scheme. The Agency and local authorities often include specific estimates for land and compensation claims but these have not always been sufficient to cover actual costs. The Agency obtains estimates of the cost of land at current market values and six monthly revaluations from the Valuation Office17 and its consultant surveyors. The Valuation Office’s estimates take account of factors that could impact on land and property values during the scheme’s development. The Agency’s land teams check these estimates for reasonableness. They then add a set percentage of 2.5 per cent per year to the base compensation to allow for risks such as movements in interest rates and housing market inflation rates being above the general inflation rate. They also make a further addition which is a percentage of the interest bearing element of the compensation. The Agency’s lands teams do not hold professional qualifications and an internal Departmental review in August 2004 noted that the teams’ capacity to support project teams varied between regions. Some local authorities also rely on external valuations of land for their schemes although others are large enough to have their own teams of chartered surveyors to perform the land valuations.
2.8 Estimates for land and compensation can be exceeded because:
n more land is required than originally anticipated, because the scope of a scheme is changed, or the road needs to take a different route owing to adverse ground conditions, or following a public inquiry;
n there is greater than anticipated land and property value inflation. This also affects the level of compensation payable for disruption and loss of property values. As claims cannot be submitted until a year after a road has opened to traffic the Agency and local authorities have to estimate the final level of claims some years in advance; and
n delays on schemes add to the impact of inflation on land costs and compensation, as the Agency and local authorities have to pay interest on the compensation calculated from the date of the first claim to the date of the award (statutory interest).
17 The Valuation Office Agency is an executive Agency of HM Revenue and Customs. One of its main functions is to provide statutory and non-statutory property valuation services in England, Wales and Scotland.

PART TWO
20 ESTImATING AND mONITORING THE COSTS OF BuILDING ROADS IN ENGLAND
The costs of re-routing utilities have been significantly underestimated2.9 Both the Agency and local authorities have often underestimated the costs associated with routing or re-routing essential services, such as gas, water and electricity. The Agency’s and local authorities’ design consultants liaise with utility companies to inform initial scheme cost estimates but the Agency and authorities told us that despite this they often have insufficient information on which to make sound estimates. At the detailed design stage, once the route for the road has been confirmed, the Agency and authorities pay the utility companies for a detailed cost estimate, which generally exceeds the estimates. For example, on the A421 Great Barford scheme the Agency’s cost estimate increased by £3.2 million following the receipt of revised estimates for work from gas and water suppliers, accounting for 15 per cent of the approved increase in the scheme’s cost, and bringing the cost of the utilities work to 12 per cent of the total scheme cost.
2.10 The utility companies generally undertake the rerouting work and recharge it to the Agency or local authority. The Comptroller and Auditor General reported in 2004, in relation to cost increases on light rail schemes18, that there may be little incentive for utility companies to progress work quickly or control costs, and recommended that the Department should require promoters of light rail schemes to more actively manage the risk and that it should itself re-assess whether the transport schemes are paying a fair proportion of the cost of the diversion (92.5 per cent). The Department has asked UKTram to develop better guidance on the management of utilities costs for promoters of tram schemes. It has not, however, addressed the issue’s impact on road scheme costs.
18 Improving public transport in England through light rail, HC 518, Session 2003-04.

PART THREE
21ESTImATING AND mONITORING THE COSTS OF BuILDING ROADS IN ENGLAND
3.1 In March 2006, the Agency reported to the Transport Select Committee that it was seeking to improve its management of roads schemes by developing a costs database together with guidance on improving scheme estimates. In July 2006, the Secretary of State announced that he had asked the Nichols Group to review the Agency’s approach to cost estimating and project management and make recommendations on how the Agency should assess, monitor and report on risks to its cost estimates. This part of the report examines the Department’s and Agency’s work to improve:
n the estimation of road scheme costs;
n the approval of schemes;
n procurement;
n programme management; and
n the evaluation of lessons learned from road schemes.
The Department and Agency are working to improve initial cost estimates
In August 2006 the Agency introduced revised inflation assumptions
3.2 It is important for the Agency to use the most accurate forecasts of inflation in scheme estimates and to revise those estimates in accordance with the latest market intelligence. As early as September 2003, the Agency recognised that the Treasury estimates of inflation that it had used from June 2003 (of 2.5 per cent from 2003 and 2.7 per cent from 2007-08) did not reflect actual inflation in the construction sector. In 2005, consultants reported to the Agency that the annualised rate of inflation for a typical motorway widening project had been 6.6 per cent between 2001 and 2005 with the main drivers being price rises for labour, bitumen, plant, steel and fuel. Other consultants also reported in 2005 that continuing global
rises in the prices of oil and steel and the 2012 London Olympics would mean that inflation in the highways sector would approach five per cent between 2006 and 2009, and fall to 3.8 per cent in 2010. The Agency revised its cost estimates in August 2006 to include these latter inflation rates.
3.3 Unlike other major developers, such as Network Rail, the Agency has not identified whether it could obtain better value than its contractors by centralising its purchase of key raw materials. The Agency has recently begun discussions with major suppliers of, for example, oil and steel, to identify whether it could take better advantage of its market position. In 2006, the Department examined how external factors contribute to risk in construction budgets, including those for roads. The review identified the reasons for, and estimated future cost increases in the constituent parts of construction expenditure such as materials (for example, steel and concrete) and specialist labour. The Department plans to use the findings to determine the likely impact of future cost increases and the extent to which it can manage the impact of external price movements.
The Department has issued guidance on inflation to local authorities but has not been prescriptive
3.4 In October 2006, the Department issued revised guidance on cost estimating which stated that the inflation rates used to form cost estimates should be higher than the Retail Price Index and giving a range within which inflation might be expected to fall but without being prescriptive about the rate to be used. The guidance suggests that the same inflation rates are unlikely to apply to all schemes and does not therefore prescribe the actual inflation rates to be used, but indicates that wage rate inflation has been in the region of four per cent and construction cost inflation has ranged between five and seven per cent. Leaving it to local authorities to determine
The Department and Agency are taking steps to improve monitoring and control of costs

PART THREE
22 ESTImATING AND mONITORING THE COSTS OF BuILDING ROADS IN ENGLAND
the inflation rate appropriate to the scheme might produce a more realistic estimate of inflation but will require the Department to review the rate applied in each scheme as part of the approval process, adding marginally to the time and cost involved.
Increasing budgets to compensate for underestimates may reduce incentives to prepare realistic estimates
3.5 As explained in paragraph 1.4, since 2003 initial estimates of schemes in the Targeted Programme of Improvement are increased by between three and 45 per cent to compensate for the risk of underestimation. These sums are included in the budgets for schemes delivered by the Agency. As the scheme progresses and costs become firmer and specific risks are identified and costed, the contingency sum for underestimation is reduced until finally for most schemes it is capped at three per cent. This means that the final budget will include specific sums to cover known risks as well as a three per cent contingency for underestimation. While the adjustments are prudent, incorporating them into the scheme budget can reduce the incentive for Highways Agency project leaders to prepare realistic estimates and manage costs. Since November 2005, the Agency has reserved centrally five per cent of this contingency for underestimation to use across all schemes in the Targeted Programme of Improvement as necessary.
3.6 Local authorities are required to adjust their initial estimates in the same way as the Agency for the purpose of scheme appraisal, but the Department does not include the contingency for underestimation in the approved scheme budget. In April 2006, the Department consulted on proposals which would allow local authorities to include 50 per cent of the proposed contingency in the approved budget, but the Department will only fund 50 per cent of any of the contingency used. If costs increase above the level of the contingency, local authorities are expected to pay the full amount, although the Department will consider bids on a case by case basis.
The Department has strengthened its appraisal and approval of schemes3.7 In the early years of the roads programmes Departmental officials including economists and traffic modellers reviewed scheme appraisals and made recommendations to Ministers on a scheme by scheme basis for both Targeted Programme of Improvement and Local Transport Plan funded schemes. From February 2006,
the Department has established a new Roads and Local Transport Investment Decision Committee to introduce additional challenge to schemes’ appraisals, according to their estimated cost and level of risk.
3.8 The Department has also strengthened its monitoring of forecast costs during a road scheme’s life. Local Transport Plan schemes have traditionally had two approval stages – Provisional Approval, before a scheme started its statutory processes, and Full Approval which was generally before procurement had started. In April 2005, the Department issued draft guidance which introduced an intermediate approval stage before procurement commences with Final Approval now only being given once the procurement process is completed and a firm cost has been agreed with the selected contractor. This provides the Department with the opportunity to withdraw funding before any significant expenditure is incurred with the contractor. On completed Local Transport Plan schemes, 34 per cent of the total cost increases occurred during procurement.
3.9 The three revised Approval stages are:
n Programme Entry Approval – which replaces Provisional Approval;
n Conditional Approval – before procurement starts (formerly Full Approval); and
n Full Approval which is now given only when a firm contract price is in place.
For scheme bids submitted since July 2005, the Department has also required a more comprehensive business case from local authorities. Other key changes introduced are requirements for the larger and more risky schemes to undergo an Office of Government Commerce Gateway Review and for a clear project plan with milestones against which progress can be monitored. Since July 2005, as part of the approval process the Department assesses the quality of local authorities’ project management which will include ensuring that the risk register for the scheme is maintained and regularly reviewed.
3.10 For the higher value local authority projects the Department may employ consultants to examine a particular aspect of the business case such as traffic modelling, costs and risk or financing. Since July 2005, the Department has also employed consultants to check the reasonableness and robustness of each of the scheme cost estimates provided by local authorities seeking Programme Entry Approval for Local Transport Plan major scheme funding.

PART THREE
23ESTImATING AND mONITORING THE COSTS OF BuILDING ROADS IN ENGLAND
3.11 In 2005-06, the Department clarified its approach to approving cost increases for both local authority and Agency schemes. For local authority schemes, requests for approval of cost increases up to the lesser of 30 per cent or £10 million may be made to Ministers by a Departmental director. Cost increases above those limits have to be submitted to the Roads and Local Transport Investment Committee which makes a recommendation to Ministers. For Agency schemes, the Agency’s new Operating Framework allows it to approve cost increases on schemes of up to 10 per cent or £20 million whichever is the lower, from the figure last agreed by Ministers. Where the cost increase is above those delegations the project also has to be submitted to the Roads and Local Transport Investment Committee which makes a recommendation to Ministers. All decisions on cost increases are made in the light of a re-appraisal of the scheme and an assessment as to whether the scheme continues to offer value for money, including a re-appraisal of the scheme if necessary. Final decisions on cost increases on schemes that have been prioritised by a region continue to be made by Ministers.
3.12 Agency schemes do not require further Ministerial funding approval once a scheme is accepted on the Targeted Programme of Improvement unless there has been a significant cost increase which exceeds the Agency’s delegated limits. We found that the Agency with the Department’s agreement has interpreted such an increase as being one which would take the cost of the scheme above the budget including the contingency for under-estimation (minus the five per cent held centrally) which forms part of the agreed scheme budget. The Department requires the Agency to seek approval for cost increases at the next key stage in a scheme’s development.
The Agency is developing its procurement strategy but significant cost risks remain3.13 The Department does not advise the Agency or local authorities on procurement strategies apart form schemes which are proposed for delivery under the Private Finance Initiative. The Agency’s approach has evolved from traditional contracting in the early years of the programme, to the use of Design and Build contracts, and since 2001 to the extensive use of Early Contractor Involvement contracts. Local authorities deliver most of their road schemes using traditional contracting, although some authorities are also adopting an Early Contractor Involvement approach and two schemes are being delivered through the Private Finance Initiative.
The Agency has moved away from traditional contracting methods
3.14 Under traditional contracting, works only contracts were awarded, on the basis of lowest price, to deliver an agreed design. The Agency found that contractors submitted a low bid to secure the contract but subsequently submitted claims to cover additional costs leading to cost increases during the construction phase above the agreed contract price. The Agency found that often they did not know the final cost of a scheme until three years or more after the work had been completed. To attempt to address this problem the Agency introduced Design and Build contracts under which the contractor is commissioned to carry out detailed design and construction. This form of contract sought to transfer much of the risk to the contractor, however, the Agency believes that in many cases it paid a premium for that risk transfer that may not have offered best value and because it only received a total price for the project, it was not able to obtain robust information on the costs of the various elements of the work.
The Agency has made some use of Design, Build, Finance, and Operate contracts
3.15 Since the start of the Targeted Programme of Improvement the Agency has delivered three completed schemes and has four19 projects in the current programme using Design, Build, Finance and Operate contracts. Here a contractor is responsible for designing and building a road and for maintaining it over 30 years. The Comptroller and Auditor General reported in January 199820 that for such arrangements the key construction risks to costs transfer to the private sector when the contract is let, except for external factors and changes in design or delays owing to decisions by the Secretary of State, while the allocation of risk associated with action by protestors varies from project to project.
3.16 The Agency has used Design, Build, Finance and Operate contracts for some of its largest projects and these schemes account for a large part of increased estimates in the current programme. The A1 (M) Wetherby – Walshford scheme increased by over 30 per cent compared to its initial estimate (Appendix 2, Figure 9), and the July 2006 estimates for the four M25 schemes, a planned single Design, Build, Finance and Operate contract, are 43 per cent higher than initial estimates (Appendix 2, Figure 11). This latest estimate has not yet been approved by Ministers.
19 These are four schemes for widening various sections of the M25 (Junctions 5–7, 16–23, 23–27, 27–30), which the Agency intends to let as one large contract.
20 The Private Finance Initiative: The First Four Design, Build, Finance and Operate Roads Contracts (HC 476, 1997 98).

PART THREE
24 ESTImATING AND mONITORING THE COSTS OF BuILDING ROADS IN ENGLAND
3.17 The Agency is looking to improve value for money from the M25 schemes by: requiring the contractor to invite competitive tenders from financial institutions for financing the scheme and subjecting this to scrutiny by the Agency, the Office of Government Commerce and the Treasury; and making payments to the contractor take account of the number of vehicle kilometres driven, lane availability, the condition of the road and performance measures such as safety, journey time reliability and incident clear up. It will be important to assess the value for money of this large contract when it has progressed further.
The Agency has introduced Early Contractor Involvement contracts to share cost risks with contractors
3.18 In 2001, the Agency moved from using traditional contracting methods to Early Contractor Involvement contracts in line with recommendations in construction industry reviews21 and to meet the mandatory standards for construction organisations issued by the Office of Government Commerce. The Agency is currently the only central Government construction organisation to achieve the Chartered Client status required by the Office of Government Commerce. Under Early Contractor Involvement contracts, the Agency enters into a form of partnering with the contractor and awards the contract at an early stage to the contractor it considers is best able to deliver the scheme. Agreement on a final contract cost is done after the detailed design has been completed and just before the construction phase begins. If the actual cost achieved is less than this the contractor and Agency share the ‘gain’ and if it is above the final contract cost, the parties share the additional cost.
3.19 The Agency considers there are a number of potential benefits to using Early Contractor Involvement contracts:
n the contractor and key members of the supply chain can contribute their skills and expertise earlier;
n these contracts can facilitate greater innovation;
n there is scope for better understanding and management of the risks;
n there is more commercial input enabling greater certainty of costs. For Targeted Programme of Improvement schemes completed before December 2005, contract outturn costs were some 10 per cent higher than the tender prices. All these contracts would, however, have pre-dated the introduction of Early Contractor Involvement contracts and the Agency considers this change will significantly reduce the likelihood of such increases;
n improved management of the design phase of the project; and
n avoiding lengthy and costly legal disputes resulting from contractors issuing claims when changes or additional work were required.
3.20 As the Agency only started to use Early Contractor Involvement contracts in 2001, some of the recently completed schemes have been delivered under the old contracting procedures and so it is too early for us to judge whether better value for money is being realised. The Agency still bears the risk of cost increases that occur up to the time it sets the final target cost for a scheme and the success of the Early Contractor Involvement contracts depends on a realistic and challenging final target cost being set for the scheme. Our analysis of Early Contractor Involvement contracts to date shows that final target costs have been on average 11 per cent higher than initial target costs. To date the Agency has awarded almost 80 per cent of Early Contractor Involvement contracts by value (£2,018 million) to seven contractors, with 20 per cent (£561 million) awarded to one contractor.22
The Agency uses Employers’ Agents to help check contractors estimates and claims
3.21 Employers’ Agents act as the Agency’s project manager on site and provide an independent check that estimates and costs claimed by contractors are accurate and reasonable. Employers’ Agents also audit the quality of contractors’ design and work. There are risks that Employers’ Agents are not incentivised or empowered to challenge contractors’ design decisions and costs. The contracts between the Agency and its 14 Agents require the Agents to provide services for a set cost but do not link the Agents’ terms to delivery, the outturn cost of the
21 In particular, Constructing the Team, Sir Michael Latham, 1994 and Rethinking Construction, Sir John Egan, 1998.22 Based on data provided by the Agency for the initial and final target costs of 38 schemes for which contracts had been awarded. The seven contractors who
were awarded almost 80 per cent by value of Early Contractor Involvement contracts were Alfred McAlpine, AMEC, Balfour Beatty, Costain, Edmund Nuttall, Mowlem and Skanska, with Balfour Beatty being awarded almost 20 per cent.
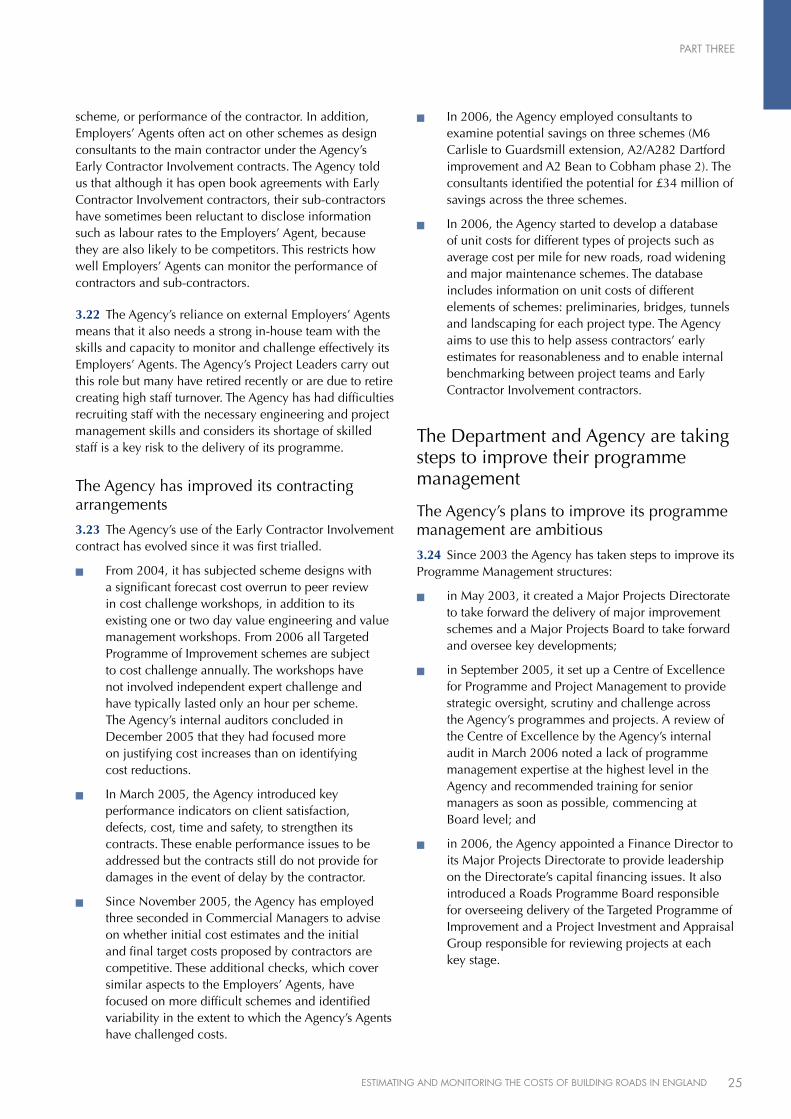
PART THREE
25ESTImATING AND mONITORING THE COSTS OF BuILDING ROADS IN ENGLAND
scheme, or performance of the contractor. In addition, Employers’ Agents often act on other schemes as design consultants to the main contractor under the Agency’s Early Contractor Involvement contracts. The Agency told us that although it has open book agreements with Early Contractor Involvement contractors, their sub-contractors have sometimes been reluctant to disclose information such as labour rates to the Employers’ Agent, because they are also likely to be competitors. This restricts how well Employers’ Agents can monitor the performance of contractors and sub-contractors.
3.22 The Agency’s reliance on external Employers’ Agents means that it also needs a strong in-house team with the skills and capacity to monitor and challenge effectively its Employers’ Agents. The Agency’s Project Leaders carry out this role but many have retired recently or are due to retire creating high staff turnover. The Agency has had difficulties recruiting staff with the necessary engineering and project management skills and considers its shortage of skilled staff is a key risk to the delivery of its programme.
The Agency has improved its contracting arrangements
3.23 The Agency’s use of the Early Contractor Involvement contract has evolved since it was first trialled.
n From 2004, it has subjected scheme designs with a significant forecast cost overrun to peer review in cost challenge workshops, in addition to its existing one or two day value engineering and value management workshops. From 2006 all Targeted Programme of Improvement schemes are subject to cost challenge annually. The workshops have not involved independent expert challenge and have typically lasted only an hour per scheme. The Agency’s internal auditors concluded in December 2005 that they had focused more on justifying cost increases than on identifying cost reductions.
n In March 2005, the Agency introduced key performance indicators on client satisfaction, defects, cost, time and safety, to strengthen its contracts. These enable performance issues to be addressed but the contracts still do not provide for damages in the event of delay by the contractor.
n Since November 2005, the Agency has employed three seconded in Commercial Managers to advise on whether initial cost estimates and the initial and final target costs proposed by contractors are competitive. These additional checks, which cover similar aspects to the Employers’ Agents, have focused on more difficult schemes and identified variability in the extent to which the Agency’s Agents have challenged costs.
n In 2006, the Agency employed consultants to examine potential savings on three schemes (M6 Carlisle to Guardsmill extension, A2/A282 Dartford improvement and A2 Bean to Cobham phase 2). The consultants identified the potential for £34 million of savings across the three schemes.
n In 2006, the Agency started to develop a database of unit costs for different types of projects such as average cost per mile for new roads, road widening and major maintenance schemes. The database includes information on unit costs of different elements of schemes: preliminaries, bridges, tunnels and landscaping for each project type. The Agency aims to use this to help assess contractors’ early estimates for reasonableness and to enable internal benchmarking between project teams and Early Contractor Involvement contractors.
The Department and Agency are taking steps to improve their programme management
The Agency’s plans to improve its programme management are ambitious
3.24 Since 2003 the Agency has taken steps to improve its Programme Management structures:
n in May 2003, it created a Major Projects Directorate to take forward the delivery of major improvement schemes and a Major Projects Board to take forward and oversee key developments;
n in September 2005, it set up a Centre of Excellence for Programme and Project Management to provide strategic oversight, scrutiny and challenge across the Agency’s programmes and projects. A review of the Centre of Excellence by the Agency’s internal audit in March 2006 noted a lack of programme management expertise at the highest level in the Agency and recommended training for senior managers as soon as possible, commencing at Board level; and
n in 2006, the Agency appointed a Finance Director to its Major Projects Directorate to provide leadership on the Directorate’s capital financing issues. It also introduced a Roads Programme Board responsible for overseeing delivery of the Targeted Programme of Improvement and a Project Investment and Appraisal Group responsible for reviewing projects at each key stage.

PART THREE
26 ESTImATING AND mONITORING THE COSTS OF BuILDING ROADS IN ENGLAND
3.25 Between February and August 2006, the Agency developed a wide-ranging action plan to manage costs on its major projects more effectively. The plan, which the Agency aimed to implement by December 2006, covers initiatives that have the potential to improve the accuracy of scheme estimation and better address cost increases. Initiatives include closer control over changes to schemes to reduce scope creep, development of improved management information to enable it to track cost and time on its schemes, and discussions with major suppliers to better use the Agency’s buying power in the civil engineering market place. The Agency also plans to develop new procedures for producing estimates for land and statutory undertakers’ costs to improve their accuracy. The Agency has not set a target for the impacts its plan should achieve nor how it will evaluate success.
The Department has introduced greater sharing of cost risks with local authorities
3.26 Local contributions to scheme costs can encourage stronger ownership at a local level. However, unlike for light rail projects, where the Department requires a local contribution of 25 per cent of scheme costs, no specific local contribution is currently set for other major schemes included in Local Transport Plans. Local authorities’ and other developers’ contributions averaged 12 per cent of total costs for completed schemes and are contributing an average of 13 per cent towards schemes in the current programme although this can vary quite widely between schemes. The Department told us that this reflects differences in the opportunities for securing local contributions for light rail and road schemes, particularly from other regional and local stakeholders. Under the Department’s revised arrangements for Local Transport Plan major schemes on which it recently consulted every scheme will require a local funding contribution of at least 10 per cent of total cost to gain Programme Entry and, as explained in paragraph 3.6, local authorities will be expected to contribute funding to any cost increases.
3.27 In considering authorities’ applications for additional funding the Department has focussed on value for money, whether cost increases have already been approved and whether authorities have taken sufficient steps to address the causes of cost increases. The Department did not always have readily available detailed scheme level data showing applications for additional funding and decisions taken for some of the earlier schemes, but reported to us that it increased its funding contribution after full approval to 12 schemes from 2001 to 2006. The Department provided some examples of applications for further funding it had refused, but did not provide information on the
number of applications it had refused because this would have involved investigating a large amount of historic scheme information. No schemes have been removed from either of the roads programmes except following the outcome of regional prioritisation in July 2006 although the A303 Stonehenge scheme is under review following a large cost increase.
Regional Funding Allocations have introduced new programme management challenges
3.28 The Department has indicated that it is retaining responsibility for managing the new Regional Funding Allocation budget, taking account of regional views on the sequencing and timing of schemes. The Agency’s programme management responsibility for the regional schemes that it is delivering is therefore removed and it is unclear whether this may reduce the Agency’s scope for applying good programme management across the schemes it is delivering. The Department told us that it and the Agency are developing arrangements to ensure that this operates effectively. The extent of Regions’ responsibility for monitoring schemes’ costs is also being developed by the Department. The Department told us that it intends to hold six monthly meetings with the regions to discuss progress on the delivery of schemes.
The Department and Agency could do more to share information and good practice with local authorities 3.29 In the early years of the Targeted Programme of Improvements individual schemes were managed by staff in the Agency’s regional offices and the Agency had no arrangements to ensure that it learnt project management lessons from across the Programme. Until recently its post project evaluations of major road schemes covered their impact on traffic volumes, travel times and accidents, but not whether they have been delivered to time and cost or the reasons for cost increases or delays. The Agency introduced new procedures in December 2006. The Agency has increased its efforts to identify lessons on project management:
n from August 2005, it has analysed the lessons from the Office of Government Commerce Gateway reviews of Targeted Programme of Improvement schemes. The Agency identified 60 issues such as business case preparation, cost control, programme and project management, and assigned each issue to a member of staff to develop a strategy to tackle the problem. By September 2006 it had completed the identified tasks on only a few of these.

PART THREE
27ESTImATING AND mONITORING THE COSTS OF BuILDING ROADS IN ENGLAND
n From January 2006, the Agency applied its “Way-we-Work” initiative to Targeted Programme of Improvement schemes. This provides staff with instructions and guidance on how to improve project delivery, requires Project Leaders to certify when they reach a key milestone that the “Way-we-Work” processes have been followed and to provide feedback on the project team’s lessons learned.
3.30 In 2004, the Department launched WebTAG which put onto the web the Department’s guidance on the appraisal of transport projects and advice on scoping and carrying out transport studies. The Department also supported an internet-based forum (the Local Transport Planning Network) for sharing good practice between local authorities. The site includes the Department’s guidance on major road schemes but provides limited good practice information, for example, on cost estimation, contracting or project management. In October 2006, the Department issued guidance on the estimation and treatment of scheme costs for transport projects on WebTAG.
3.31 The Department has not to date actively encouraged local authorities to draw and disseminate lessons from post project evaluations and although some have done so, they have not made the results available to others through inclusion on the Local Transport Planning Network. The Department has recently published guidance for local authorities on evaluating major transport schemes and since early 2006 has included a requirement for scheme evaluations as a condition of all funding approvals. The Agency has not shared with other organisations lessons from its reviews, for example on inflation, or lessons learnt from Gateway reviews.
3.32 We did not find examples of the Agency benchmarking its performance against other organisations involved in road building or construction more generally or of the Department benchmarking the performance of the Local Transport Plan schemes in this way. The Office of Government Commerce recommended in February 2004 that the Agency should take forward work to identify realistic and relevant comparators. Such assessment could provide useful comparators for the Agency and Department in terms of both scheme costs and time taken to deliver. The Agency and Department need to collect and analyse better quality data on scheme delivery timescales and on the unit cost of different types of road schemes being delivered by the Agency, to allow them to compare performance.

28 ESTImATING AND mONITORING THE COSTS OF BuILDING ROADS IN ENGLAND
1 We scoped our fieldwork around three key issues:
n the extent of cost increases in road building schemes in England;
n the reasons for cost increases; and
n whether the Agency and the Department have effective arrangements for estimating and monitoring costs.
2 Major road building schemes in England are delivered through two programmes: the Agency’s Targeted Programme of Improvement and the Department’s funded Local Transport Plan major schemes programme. For each programme, we used a variety of methods to collect sufficient, reliable and relevant data to address the three key audit issues above. We carried out the fieldwork between March and September 2006.
Targeted Programme of ImprovementProgramme summary
Duration of programme: The programme began in 1998 and currently includes schemes that are scheduled to be completed between 2006 and 2021.
Organisations involved: The programme is funded and managed by the Highways Agency, an Executive Agency of the Department for Transport, which is responsible for managing England’s strategic network of motorways and trunk roads.
Number of schemes in the programme: 103, of which 36 had been completed by September 2006.23
Estimated value of schemes in the programme: The programme currently has approved costs of over £11 billion.
Validation of Highways Agency financial data
3 We worked with the Agency to determine the extent to which the different approach to estimating introduced in April 2003 could explain the cost increases in completed and current Targeted Programme of Improvement schemes. Our work involved reviewing and advising on the Agency’s methodology for adjusting the initial cost estimates and reviewing the Agency’s quality assurance of the adjustment calculations. We validated the calculations for a sample of schemes, including those marked (1) in Appendix 2, Figure 10 where the Agency used a slightly different approach.
4 The Agency adjusted the programme entry cost estimates of Targeted Programme of Improvement schemes that entered the programme before April 2003 for non-recoverable VAT, a contingency against under-estimation, a common price base (Quarter 3, 2001) and inflation, so that the estimates would be directly comparable with the latest cost estimates and outturn costs for the schemes. We initially validated these adjustments by performing the following checks for a sample of 10 schemes. Following the Agency’s quality assurance exercise we performed the checks on a further 10 schemes.
Non-recoverable VAT
5 The Agency made an allowance for non-recoverable VAT on the works cost. The other key elements of scheme costs (preparation and supervision, and land) are for the majority of cases fully VAT recoverable. To calculate the allowance the initial estimate was broken down between the different elements, and the following adjustments made:
APPENDIX ONE Study methods
23 The Programme contained 113 schemes: six schemes have been dropped, one has been transferred to Transport for London and in our analysis we have counted the three A43 Silverstone schemes as one scheme and the two A1 Dishforth to Barton schemes as one scheme.

29ESTImATING AND mONITORING THE COSTS OF BuILDING ROADS IN ENGLAND
n The Agency approximated how much of the expected works cost on programme entry was susceptible to non-recoverable VAT and the expected non-recoverable VAT charge. Dividing non-recoverable VAT by the works cost gives a percentage which can be applied to the initial works estimate to give an approximation of the expected non-recoverable VAT charge upon programme entry. This approach assumes that the scope of the project has not changed significantly.
n For some schemes the elementary breakdown was not available. In these cases the Agency applied the calculated non-recoverable VAT percentage to the total works cost (including preparation and supervision, and land). This will have had the effect of overstating the initial cost estimate, and therefore understating the extent of cost increases.
6 To validate the Agency’s figures we:
n checked that the Agency’s elementary cost breakdown matched the original scheme brief; and
n recalculated the non-recoverable VAT percentage using the information on scheme cost estimates in submissions to Ministers and compared it with the percentage the Agency had calculated.
Contingency for under-estimation (optimism bias)
7 The Agency bases its approach to adjusting for optimism bias on Chief Highway Engineer Memorandum 121/03 “H.M. Treasury’s New Green Book on Appraisal and Evaluation in Central Government”. For a ‘standard’ scheme (usually non-controversial new road, bypass or widening projects costing more than £5 million – all but three of the Targeted Programme of Improvement schemes fit this profile), the following levels of adjustment for optimism bias should be added to the initial estimate depending on the stage the project was at upon programme entry:
8 The A303 Stonehenge, A3 Hindhead Improvement and M6 Carlisle to Guardsmill are classed as complex by the Highways Agency, and use higher rates of adjustment for optimism bias (up to 65 per cent).
9 Prior to 2003, the Agency added 10 per cent to all initial estimates for risk and contingency, in place of a detailed risk assessment. It was reasonable therefore to apply the higher levels of adjustment for optimism bias in the table at paragraph 7 when adjusting the initial estimates. However, as the higher levels of adjustment for optimism bias include an allowance for risk, the 10 per cent added by the Agency needed to be removed prior to the optimism bias adjustment. The optimism bias adjustment is applied to the total cost, comprising works, site supervision, scheme design, land and non-recoverable VAT.
10 To validate the Agency’s figures we:
n confirmed the stage of each scheme at programme entry from the original scheme brief; and
n reperformed the Agency’s calculations.
Price base to Quarter 3 2001
11 The latest Ministerially approved budgets are expressed in Quarter 3, 2001 prices, which is the price base that the Agency has used for all its scheme estimates since April 2003. To be directly comparable the programme entry costs needed to be expressed in the same price base. The Agency used the Road Construction Tender Price Index to inflate all of the programme entry costs to Quarter 3, 2001 prices.
12 To validate the Agency’s figures we re-performed the Agency’s calculations with referral to each scheme’s original brief/assessment and the Road Construction Tender Price Index.
Inflation
13 Since 2003 the Agency has included in its scheme estimates an allowance for inflation at the rate of 2.5 per cent per year for 2001-2002 to 2007-2008 and 2.7 per cent thereafter. To make the pre-2003 estimates upon programme entry comparable with latest estimates, the same inflation allowance must be included. To calculate the allowance, the Agency profiled scheme costs in line with the expected timetable at programme entry and applied the annual inflation percentage. The Agency assumed that 90 per cent of total scheme costs occur during the construction years and 10 per cent during the preparation years.
stage of preparation Contingency factor on scheme cost estimate (%)
Risk Assessment Risk Assessment done not done
Outline Business Case/ 15 45 Scheme Conception
Public Consultation/ 5 25 Preferred Route Decision
Order Publication 5 20
Works Commitment 3 15
APPENDIX ONE

30 ESTImATING AND mONITORING THE COSTS OF BuILDING ROADS IN ENGLAND
14 To validate the Agency’s figures we:
n ensured that the scheme costs had been profiled correctly by reference to the original scheme brief and other documents on the Agency’s scheme files; and
n re-performed the Agency’s calculations.
Outcome of validation
15 In our initial sample of 10 schemes we found a number of errors, mainly in the profiling of the scheme across its anticipated life at programme entry. For one scheme the Agency had used the wrong stage of scheme at programme entry and had therefore adjusted for optimism bias incorrectly. We raised these concerns with the Agency, following which it performed a quality assurance exercise which involved checking every figure entered into its calculation spreadsheet back to source documentation. This exercise highlighted a number of other errors which were corrected. Following this exercise we examined a further 10 schemes and found no errors.
Completed schemes
16 Estimated costs at programme entry for completed schemes which entered the programme prior to June 2003 (35 of the 36) did not include an allowance for non-recoverable VAT, adjustment for optimism bias or inflation. The Agency wanted to present these estimates in the same format as estimates prepared after July 2003 by including these allowances. To do so the Agency:
n calculated the non-recoverable VAT allowance by performing the calculation at paragraph 5;
n adjusted for optimism bias by performing the calculation at paragraphs 7 to 9; and
n calculated the inflation allowance by performing the calculation at paragraph 13.
17 To validate these adjustments we followed the same procedures outlined at paragraphs 6, 10 and 14 for a sample of 10 completed schemes. We found no errors in this sample.
18 As the estimated costs at programme entry for completed schemes were to be compared with actual outturn costs rather than latest cost estimates, the Agency did not make any adjustments to the price bases of the estimates at programme entry.
19 The outturn cost for completed schemes in Appendix 2, Figure 9 is the Asset under Construction cost at the date the road is open for traffic. This includes all spend on a scheme including that incurred before programme entry. The Asset under Construction balances are audited as part of the NAO annual audit of the Highways Agency’s financial statements.
20 Based on this work we are satisfied that the data in Appendix 2 has been validated.
Schemes studied in more detail
21 To obtain an insight into the reasons for cost increases, we examined twelve schemes in more detail: four completed schemes and eight in the current programme. We selected schemes representing the range of schemes that form the Targeted Programme of Improvement in terms of value, type, progress and geographical region:
22 More detailed information was available for four of our sampled schemes, which we combined with three additional schemes that the Agency had analysed and six Local Transport Plan major road schemes to determine an indicative breakdown of the reasons for cost increases.
APPENDIX ONE
Completed In current programme
A5 Weeford – A2 Bean – Cobham Widening Fazely Improvement
A41 Aston – m6 Carlisle to Guardsmill Extension Clinton Bypass
A500 Basford Hough A428 Caxton Common to Shavington Bypass Hardwick Improvement
A21 Lamberhurst Bypass A421 Great Barford Bypass
m1 Junction 6a – 10 Widening1
m60 Junction 5 – 8 Widening
A46 Newark – Widmerpool Improvement
A1 Peterborough to Blyth Grade Separated Junction
NOTE
1 This scheme has since been completed.

31ESTImATING AND mONITORING THE COSTS OF BuILDING ROADS IN ENGLAND
Interviews with key people at the Highways Agency
23 We used semi-structured interviews with key staff within the Agency’s Major Projects Directorate and the Bedford Regional Office. We also obtained and reviewed supporting documents, files and management information to collaborate, challenge and triangulate the interview evidence.
Data analysis
24 We obtained and analysed the following financial data from the Agency and the Department:
n The data on scheme estimates and outturn at Appendix 2 to determine the extent of cost increases on the Targeted Programme of Improvement covering latest Ministerially approved cost estimates and the Agency’s latest forecasts of scheme costs.
n Actual and forecast spend for each year of the programme and future spend forecasts until 2020-21, to provide an understanding of the impact of cost increases on individual schemes on the programme as a whole.
n Data on the companies to which Early Contractor Involvement contracts had been awarded.
n Data on initial scheme budgets, final agreed target costs and contract outturn for Early Contractor Involvement contracts to ascertain the extent to which design bonuses and construction bonuses were being achieved by contractors.
n Data on construction tender price and contract outturn since the start of the Targeted Programme of Improvement to determine the extent of escalation in works costs.
25 We also analysed Highways Agency data on scheme progression against intended timetables and the stage of development of individual schemes when they entered the programme.
Local Transport Plan major schemesProgramme summary
Duration of programme: The programme began in 2000 and currently includes road schemes that are scheduled to be completed between 2006 and 2016. As well as road schemes, Local Transport Plan major schemes include other transport projects such as bus and light rail schemes.
Organisations involved: Local authorities manage schemes on the network of local roads in England, which includes all publicly owned roads not managed by the Highways Agency. The Government Offices for the Regions monitor scheme progress. The Department for Transport funds on average 86 per cent of scheme costs, with local authorities and scheme developers providing additional funding.
Number of schemes in the programme: 81, of which 20 had been completed by July 2006.
Estimated value of schemes in the programme: The programme currently has approved costs of just under £1.7 billion.
Highways agency major projects directorate
Who we interviewed: The major Projects Director, the major Projects Business Controller, The major Projects Centre of Excellence Business Controller, the major Projects Commercial Project Controller, the major Projects Finance Director, and other members of the major Projects team.
topics covered: The Highways Agency’s review of estimates and costs, the funding and impact of cost overruns, the role of the major Projects Directorate in managing cost escalation, the changing procurement strategy and the Agency’s approach to risk transfer, liaison with the construction industry, how lessons learned and best practice are shared across project teams, the Agency’s approach to internal and external benchmarking, action taken by the Agency to reduce cost escalation and the Agency’s plans for improving cost control.
Highways agency Bedford regional office
Who we interviewed: The Director of major Projects South and two Project Leaders for the schemes we had selected to study in more detail.
topics covered: The role of the Regional Office in project management, Regional Office perspectives on the roles of the major Projects Directorate and the Department in managing cost increases, the main reasons for cost increases, and ways in which the accuracy of cost estimates and cost control could be improved.
APPENDIX ONE

32 ESTImATING AND mONITORING THE COSTS OF BuILDING ROADS IN ENGLAND
Validation of scheme data for Local Transport Plan major road schemes
26 The Department holds records of initial cost estimates, subsequent approvals and latest forecast outturn data for current major road schemes in receipt of Local Transport Plan funding but for the completed schemes some of the records we required were not readily available. We worked with the Department, which drew on information from local authorities and Government Offices for the Regions (Government Offices), to compile a full set of data on estimated and actual scheme costs and the extent to which the Department funds them. This data is at Appendix 3.
27 We sought to validate this data for half of all the schemes, including both those completed and current, against documentation such as Ministerial approval letters. This proved difficult as the Department did not always have ready access to this documentation for older schemes, as the Department told us that it was held by Government Offices. In validating the data, we found a number of errors in some of the information, which have now been corrected. We cannot be certain therefore of the accuracy of the figures presented at Appendix 3 for schemes not included in our sample. The Department has improved its records and maintains scheme folders with cost estimates, scheme appraisals and funding decisions made since 2003.
28 We attempted to determine the extent to which cost increases on Local Transport Plan schemes were due to differences in the approach to estimating. We analysed a sample of 12 schemes and found that information on the approach used by local authorities to estimate costs could not always be retrieved from the Department’s records. Where we found evidence, it indicated that costs are not calculated on a consistent basis between schemes, and that authorities sometimes use different price bases and inflation assumptions at different stages of an individual scheme’s approval. Submissions from local authorities since April 2003 contained a more detailed breakdown of costs and information on how estimates had been determined but the approaches adopted by local authorities were not always consistent. This meant that we were not able to adjust the data to ensure it was compiled on a consistent basis particularly in relation to assumptions on inflation and contingency for underestimation, as the Agency had done for Targeted Programme of Improvement schemes. Thus it was not possible to determine how much
of the increase in actual and estimated costs of Local Transport Plan funded schemes was due to differences in local authorities’ approaches to estimating and how much was due to other factors.
Schemes studied in more detail
29 To obtain more insight into the reasons for cost increases, we examined twelve schemes in more detail: four completed schemes and eight in the current programme. We selected the schemes to represent the range of schemes that form the Local Transport Plan major road schemes programme in terms of value, type, progress and geographical region. As the Department did not hold a file for each individual scheme, in the early years of the major schemes, for some of our sample it located information from a variety of sources for us to review:
30 More detailed information was available for six of our sampled schemes, which we combined with data on four of our Targeted Programme of Improvement case study schemes and three additional Targeted Programme of Improvement schemes that the Highways Agency had analysed to determine an indicative breakdown of the reasons for cost increases.
APPENDIX ONE
NOTE
1 This scheme has since been dropped from the programme following the minister’s announcement of the Regional Funding Allocations in 2006.
In current programme
Barnstaple Western Bypass
Darlington Eastern Transport Corridor
Sheffield Northern Inner Relief Road
Poole Bridge Regeneration
A1073 Spalding to Eye
A391 St. Austell to A30 Link1
A127/A1159 Priory Crescent, Southend
Papworth Everard Bypass
Completed
A617 mansfield to Ashfield Regeneration Route
A228 Ropers Lane
A167 Chilton Bypass
A57 Cadishead Way (Brinell Drive to City Boundary)
33ESTImATING AND mONITORING THE COSTS OF BuILDING ROADS IN ENGLAND
Interviews with key people at the Department for Transport
31 We used semi-structured interviews with key staff in the Department’s Regional and Local Major Projects Division.
Liaison with Government Office for the Regions and Local Authorities
Data analysis
32 We obtained and analysed the following financial data:
n Data on scheme estimates and outturn contained at Appendix 3 to determine the extent of cost increases on the Local Transport Plan major roads programme.
n Actual versus forecast spend for each year of the programme and also future spend forecasts up until 2015-16, the period covered by the Regional Funding Allocations, to provide an understanding of the impact of cost increases on individual schemes on the programme as a whole. Also to determine the extent to which the schemes prioritised by the Regions are in balance with available funding.
Discussions with stakeholders and other organisations
33 We invited comments from interested parties and met with representatives of Road Block and Transport 2000. We also received comments from other stakeholders including the Countryside Agency and Friends of the Lake District and had discussions with the Treasury.
the department for transport’s regional and Local major projects division
Who we interviewed: Head of major Projects and Economics Division, Head of Roads Policy, Head of Local Transport Policy. In addition, we interviewed the Head of Transport Economic Appraisal.
topics covered: The Department’s review and monitoring of project estimates and costs, the relationships between the Department, Government Offices and Local Authorities, the funding and impact of cost overruns, action taken by the Department to reduce cost increases, the role of the Department in managing cost increases, how lessons learned and best practise are shared across Local Authorities, regional funding allocation exercise.
Government office for the east of england
Who we interviewed: Team Leader, Transport
topics covered: The Government Office’s working relationship with the Department, other Government Offices and local authorities, what information the Government Office holds on each scheme, how the Government Office evaluates new applications for funding and monitors the progress of each scheme, what the Government Office considers are the main causes of cost increases in road schemes.
Cambridgeshire County Council
Who we interviewed: Roads Project manager
topics covered: Department for Transport guidance on preparing applications for funding, the Council’s working relationship with the local Government Office, how the Council prepares cost estimates for schemes, the reasons for cost increases including the impact of delays and inadequate early estimates and what action the Council has taken to address these issues.
APPENDIX ONE

34 ESTImATING AND mONITORING THE COSTS OF BuILDING ROADS IN ENGLAND
scheme
A27 Polegate Bypass
A6 Clapham Bypass
A66 Stainburn & Great Clifton Bypass
A6 Great Glen Bypass
A1 Willowburn – Denwick Improvement
A5 Nesscliffe Bypass
A11 Roudham Heath – Attleborough Improvement
A500 Basford, Hough, Shavington Bypass
A46 Newark-Lincoln Improvement
A6 Rushden & Higham Ferrers Bypass
A6 Rothwell – Desborough Bypass
A41 Aston Clinton Bypass
APPENDIX TWO
H Completion
date
Jun 02
Dec 02
Dec 02
Feb 03
mar 03
mar 03
mar 03
mar 03
Jul 03
Aug 03
Aug 03
Oct 03
G = f/e Percentage increase in cost
compared to adjusted programme entry cost
–11.39
+16.63
+19.69
+2.65
–1.64
+14.72
+18.25
+22.88
+3.80
+8.89
+38.19
+33.10
f = B - e Change in cost
explained by other factors
(£m)
–3.72
6.26
2.38
0.54
–0.15
2.59
7.74
10.11
1.49
1.28
5.24
11.03
e Programme entry cost adjusted to include inflation,
non-recoverable
VAT and contingency (optimism
bias) (£m)
32.65
37.64
12.09
20.35
9.13
17.59
42.42
44.19
39.24
14.40
13.72
33.32
d Programme entry cost adjusted to include inflation and non-
recoverable VAT2
(£m)
31.25
34.22
11.56
19.44
8.35
16.12
32.04
33.45
35.98
13.16
12.55
25.17
C = B - a Total cost increase
(£m)
3.23
12.90
4.87
4.10
1.88
6.72
23.26
26.29
10.73
4.08
8.23
23.05
B Outturn cost1
(£m)
28.93
43.90
14.47
20.89
8.98
20.18
50.16
54.30
40.73
15.68
18.96
44.35
a Estimated
cost at programme
entry
(£m)
25.70
31.00
9.60
16.79
7.10
13.46
26.90
28.01
30.00
11.60
10.73
21.30
Highways Agency Targeted Programme of Improvement
9 Completed schemes
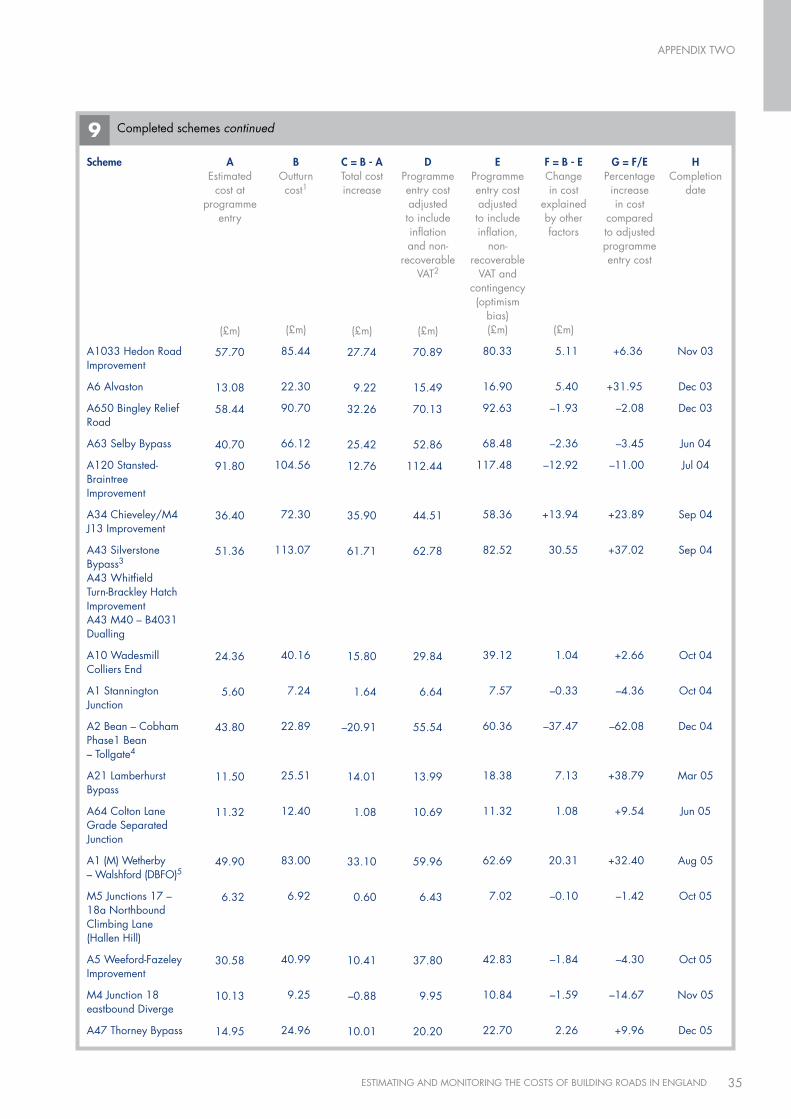
35ESTImATING AND mONITORING THE COSTS OF BuILDING ROADS IN ENGLAND
scheme
A1033 Hedon Road Improvement
A6 Alvaston
A650 Bingley Relief Road
A63 Selby Bypass
A120 Stansted-Braintree Improvement
A34 Chieveley/m4 J13 Improvement
A43 Silverstone Bypass3 A43 Whitfield Turn-Brackley Hatch Improvement A43 m40 – B4031 Dualling
A10 Wadesmill Colliers End
A1 Stannington Junction
A2 Bean – Cobham Phase1 Bean – Tollgate4
A21 Lamberhurst Bypass
A64 Colton Lane Grade Separated Junction
A1 (m) Wetherby – Walshford (DBFO)5
m5 Junctions 17 – 18a Northbound Climbing Lane (Hallen Hill)
A5 Weeford-Fazeley Improvement
m4 Junction 18 eastbound Diverge
A47 Thorney Bypass
H Completion
date
Nov 03
Dec 03
Dec 03
Jun 04
Jul 04
Sep 04
Sep 04
Oct 04
Oct 04
Dec 04
mar 05
Jun 05
Aug 05
Oct 05
Oct 05
Nov 05
Dec 05
G = f/e Percentage increase in cost
compared to adjusted programme entry cost
+6.36
+31.95
–2.08
–3.45
–11.00
+23.89
+37.02
+2.66
–4.36
–62.08
+38.79
+9.54
+32.40
–1.42
–4.30
–14.67
+9.96
f = B - e Change in cost
explained by other factors
(£m)
5.11
5.40
–1.93
–2.36
–12.92
+13.94
30.55
1.04
–0.33
–37.47
7.13
1.08
20.31
–0.10
–1.84
–1.59
2.26
e Programme entry cost adjusted to include inflation,
non-recoverable
VAT and contingency (optimism
bias) (£m)
80.33
16.90
92.63
68.48
117.48
58.36
82.52
39.12
7.57
60.36
18.38
11.32
62.69
7.02
42.83
10.84
22.70
d Programme entry cost adjusted to include inflation and non-
recoverable VAT2
(£m)
70.89
15.49
70.13
52.86
112.44
44.51
62.78
29.84
6.64
55.54
13.99
10.69
59.96
6.43
37.80
9.95
20.20
C = B - a Total cost increase
(£m)
27.74
9.22
32.26
25.42
12.76
35.90
61.71
15.80
1.64
–20.91
14.01
1.08
33.10
0.60
10.41
–0.88
10.01
B Outturn cost1
(£m)
85.44
22.30
90.70
66.12
104.56
72.30
113.07
40.16
7.24
22.89
25.51
12.40
83.00
6.92
40.99
9.25
24.96
a Estimated
cost at programme
entry
(£m)
57.70
13.08
58.44
40.70
91.80
36.40
51.36
24.36
5.60
43.80
11.50
11.32
49.90
6.32
30.58
10.13
14.95
APPENDIX TWO
9 Completed schemes continued

36 ESTImATING AND mONITORING THE COSTS OF BuILDING ROADS IN ENGLAND
scheme
m25 J12 – 15 Widening
A1 (m) Ferrybridge – Hook moor (DBFO)
A14 Rookery Crossroads
m60 J5 – 8 Widening
m5 Junctions 19 – 20 Southbound Climbing Lane
m5 Junctions 19 – 20 Northbound Climbing Lane
A249 Iwade – Queenborough Improvement (DBFO)
totals
H Completion
date
Dec 05
Jan 06
mar 06
Jun 06
Jun 06
Jun 06
Jul 06
G = f/e Percentage increase in cost
compared to adjusted programme entry cost
–1.62
0.00
+100.00
+5.00
–9.09
+112.50
+2.53
+5.79
f = B - e Change in cost
explained by other factors
(£m)
–1.92
0.00
6.70
6.00
–1.00
9.00
2.00
93.85
e Programme entry cost adjusted to include inflation,
non-recoverable
VAT and contingency (optimism
bias) (£m)
118.59
160.00
6.70
120.00
11.00
8.00
79.00
1,619.56
d Programme entry cost adjusted to include inflation and non-
recoverable VAT2
(£m)
109.16
160.00
5.97
111.00
9.00
6.00
79.00
1,433.56
C = B - a Total cost increase
(£m)
22.67
0.00
8.40
44.00
1.00
11.00
2.00
488.28
B Outturn cost1
(£m)
116.67
160.00
13.40
126.00
10.00
17.00
81.00
1,713.41
a Estimated
cost at programme
entry
(£m)
94.00
160.00
5.00
82.00
9.00
6.00
79.00
1,225.13
Source: National Audit Office analysis of Highways Agency data
NOTES
1 Outturn cost based on Asset under Construction (AuC) cost. This includes all spend on a scheme including that incurred before programme entry.
2 The programme entry cost was adjusted by:
n making an allowance for non-recoverable VAT on the works cost. The other key elements of scheme costs (preparation and supervision, and land) are for the majority of cases fully VAT recoverable.
n The TPI entry cost has been adjusted to Quarter 3, 2001 prices using the Road Construction Tender Price Index (based on price rates contained in accepted tenders for public sector road schemes). The latest ministerially approved budgets are all at Quarter 3, 2001 prices. All estimates are therefore on a common price base.
n Inflation has been applied to the TPI entry cost at a rate of 2.5 per cent per year for 2001-2002 to 2007-2008 and 2.7 per cent thereafter in line with Treasury guidance. To apply inflation the scheme costs were profiled in line with the expected timetable at TPI entry. Ten per cent of the scheme cost was profiled over the preparation years and 90 per cent across the construction years.
n making an allowance for contingency (optimism bias) as required from April 2003 in the Treasury Green Book on investment appraisal. Optimism bias is the tendency of those appraising a new project, and those engaged in bidding for its operation, to over-estimate the benefits and to under-estimate the costs and the risks associated with delivery. To counter this tendency, scheme cost estimates are expected to include an allowance for contingency (optimism bias), set at between three per cent and 45 per cent depending on the quality of the risk assessment and the stage and complexity of the scheme. The level of contingency (optimism bias) decreases as a scheme progresses and has therefore been applied according to the stage of each scheme at TPI entry and the complexity of the scheme (more complex schemes require a higher level of contingency (optimism bias)).
3 A43 Silverstone Bypass/A43 Whitfield Turn-Brackley Hatch Improvement/A43 m40-B4031 Dualling – Accelerated completion in time for Grand Prix. The Agency counts these schemes as three separate schemes within the Targeted Programme of Improvement.
4 Scope of A2 Bean to Cobham Phases 1 & 2 adjusted after programme entry.
5 A1 (m) Wetherby – Walshford (DBFO) and A249 Iwade-Queenborough Improvement (DBFO) – Column B = non-cash equivalent capital value.
6 The figures included for the A1 (m) Ferrybridge to Hookmoor DBFO scheme represents the financed capital cost of the scheme.
7 All data as at July 2006.
8 This table has been validated by the National Audit Office.
APPENDIX TWO
9 Completed schemes continued

37ESTImATING AND mONITORING THE COSTS OF BuILDING ROADS IN ENGLAND
scheme
A2 Bean – Cobham Phase 2
A2/A282 Dartford Improvement
A303 Stonehenge (1)
A421 Great Barford Bypass
A500 City Road & Stoke
A11 Attleborough Bypass
A11 Fiveways – Thetford Improvement
m6 Carlisle to Guardsmill Extension
A63 melton Grade Separated Junction
A14 Haughley New St – Stowmarket Improvement
A3 Hindhead Improvement (1)
A38 Dobwalls Bypass
A595 Parton – Lillyhall Improvement
A1 Peterborough – Blyth Grade Separated Junctions
m62 Junction 6 Improvement
A46 Newark – Widmerpool Improvement
A30 Bodmin Indian Queens
A5117/A550 Deeside Park Junctions Improvement
A419 Blunsdon Bypass
A66 Temple Sowerby & Improvement at Winderwath
A1 Dishforth to Barton (1)2
A1 Bramham – Wetherby (Including Wetherby Bypass)
m40/A404 Handy Cross Junction Improvement
A47 Blofield to North Burlingham Dualling
A66 Greta Bridge to Stephen Bank Improvement
A66 Carkin moor to Scotch Corner Improvement
e = B - d Change in
cost estimate explained by other factors
(£m)
54
61
–61
21
21
5
7
35
6
14
54
3
1
29
–8
63
8
11
21
11
–28
–7
1
1
2
1
d Programme entry cost adjusted
for different approach to estimating
(£m)
68
59
284
37
34
24
53
140
16
18
185
33
29
54
46
157
85
32
44
29
353
58
12
14
8
10
C = B - a Total increase
in cost estimates
(£m)
87
82
98
33
31
15
30
129
11
22
132
19
12
52
14
138
44
21
36
21
100
13
3
5
4
4
B Latest
ministerially approved
budget cost
(£m)
122
120
223
58
55
29
60
175
22
32
239
36
30
83
38
220
93
43
65
40
325
51
13
15
10
11
a Estimated cost at programme
entry
(£m)
35
38
125
25
24
14
30
46
11
10
107
17
18
31
24
82
49
22
29
19
225
38
10
10
6
7
APPENDIX TWO
10 Schemes that entered the programme prior to April 2003 and have not yet been completed, for which initial and latest estimates had not been prepared on a comparable basis

38 ESTImATING AND mONITORING THE COSTS OF BuILDING ROADS IN ENGLAND
Source: Highways Agency
NOTES
1 The extent of escalation explained by the revised approach to estimating (Column D) is the programme entry cost for each scheme adjusted to include contingency (optimism bias), VAT and inflation so that it is calculated on the same basis as the latest ministerially approved budget cost (Column B) as follows:
n making an allowance for non-recoverable VAT on the works cost. The other key elements of scheme costs (preparation and supervision, and land) are for the majority of cases fully VAT recoverable. For schemes marked (1) in Table 1 the cost breakdown between these elements was not available so non-recoverable VAT has been applied to the total cost inclusive of land and preparation and supervision thus marginally overstating the TPI entry cost.
n making an allowance for contingency (optimism bias) as required from April 2003 in the Treasury Green Book on investment appraisal. Optimism bias is the tendency of those appraising a new project, and those engaged in bidding for its operation, to over-estimate the benefits and to under-estimate the costs and the risks associated with delivery. To counter this tendency, scheme cost estimates are expected to include an allowance for contingency (optimism bias), set at between 3 per cent and 45 per cent depending on the quality of the risk assessment and the stage and complexity of the scheme. The level of contingency (optimism bias) decreases as a scheme progresses and has therefore been applied according to the stage of each scheme at TPI entry and the complexity of the scheme (more complex schemes require a higher level of contingency (optimism bias)).
n The TPI entry cost has been adjusted to Quarter 3, 2001 prices using the Road Construction Tender Price Index (based on price rates contained in accepted tenders for public sector road schemes). The latest ministerially approved budgets are all at Quarter 3, 2001 prices. All estimates are therefore on a common price base.
n Inflation has been applied to the TPI entry cost at a rate of 2.5 per cent per year for 2001-2002 to 2007-2008 and 2.7 per cent thereafter in line with Treasury guidance. To apply inflation the scheme costs were profiled in line with the expected timetable at TPI entry. 10 per cent of the scheme cost was profiled over the preparation years and 90 per cent across the construction years.
2 The Agency counts the Dishforth to Barton scheme as two schemes in the Targeted Programme of Improvement.
3 All data as at July 2006.
4 This table does not include the Agency’s latest estimates of scheme costs because of uncertainty about the reliability of these estimates.
5 This table has been validated by the National Audit Office.
scheme
A428 Caxton Common to Hardwick Improvement
A30/A382 merrymeet Junction
A66 Long Newton Junction
A69 Haydon Bridge Bypass
A419 Commonhead Junction (1)
m1 J19 Improvement
totals
e = B - d Change in
cost estimate explained by other factors
(£m)
10
0
4
–2
–1
–9
328
d Programme entry cost adjusted
for different approach to estimating
(£m)
45
12
8
26
17
132
2,122
C = B - a Total increase
in cost estimates
(£m)
33
5
6
10
4
23
1,237
B Latest
ministerially approved
budget cost
(£m)
55
12
12
24
16
123
2,450
a Estimated cost at programme
entry
(£m)
22
7
6
14
12
100
1,213
APPENDIX TWO
10 Schemes that entered the programme prior to April 2003 and have not yet been completed, for which initial and latest estimates had not been prepared on a comparable basis continued

39ESTImATING AND mONITORING THE COSTS OF BuILDING ROADS IN ENGLAND
scheme
A14 Ellington – Fen Ditton Improvement
A57/A628 mottram – Tintwistle Bypass
A45/A46 Tollbar End Improvement
m1 Junction 6a to 10 Widening
m1 Junction 10 to 13 Widening
A1/A19/A1068 Seaton Burn Junction Improvement
A19/A184 Testos Junction Improvement
A505 Dunstable Northern Bypass (A5 to m1 Link)
A421 Bedford to m1 Junction 13
A21 Tonbridge to Pembury
m40 Junction 15 (Longbridge)
A590 High & Low Newton Bypass
m20 Junction 10A
A27 Southerham to Beddingham Improvement
m1 J21 – 30
m25 J1b – 3 Widening
m25 J5 – 7 Widening (1)
m25 J16 – 23 (1)
m25 J23 – 27 Widening (1)
m25 J27 – 30 Widening (1)
A21 Kippings Cross to Lamberhurst Bypass
A23 Handcross to Warninglid Widening
A453 Widening (m1 J24 to A52 Nottingham)
m25 Junction 28/A12 Brook Street Interchange
m27 J11 to J12 Climbing Lanes
m27 J3 to J4 Widening
m1 J30 to J31 Widening
m1 J31 to J32 Widening
m1 J32 to J34S Widening
m1 J34N to J37 Widening
m1 J37 to J39 Widening
m1 J39 to J42 Widening
m1 J31 to J32 Northbound Collector/Distributor
m62 J25 to J27 Widening
m62 J27 to J28 Widening
totals
percentage increase
%
0
18
0
20
0
–3
0
0
0
0
0
59
0
0
0
0
0
0
0
0
0
0
0
0
0
0
0
0
0
0
0
0
0
0
0
Latest ministerially agreed budget cost
(£m)
490
106
57
289
382
29
21
48
171
65
57
35
46
19
1,915
66
214
496
419
402
68
41
90
8
27
52
135
20
139
246
224
202
29
215
83
6,906
APPENDIX TWO
estimated cost at programme entry
(£m)
490
90
57
241
382
30
21
48
171
65
57
22
46
19
1,915
66
214
496
419
402
68
41
90
8
27
52
135
20
139
246
224
202
29
215
83
6,830
Source: Highways Agency
NOTES
1 The Agency plans to let these four schemes as one Design, Build, Finance and Operate contract.
2 All costs at Quarter 3, 2001 prices.
3 All data as at July 2006.
4 This table does not include the Agency’s latest estimates of scheme costs because of uncertainty about the reliability of these estimates.
5 This table has been validated by the National Audit Office.
11 Schemes that entered the programme after April 2003 and have not yet been completed, for which initial and latest estimates had been prepared on a comparable basis

40 ESTImATING AND mONITORING THE COSTS OF BuILDING ROADS IN ENGLAND
APPENDIX THREE
scheme estimated cost at estimated cost at final cost Completion programme entry latest ministerial approval date
Total DfT contribution Total DfT contribution Total DfT contribution (£m) (£m) (£m) (£m) (£m) (£m)
Great Leighs Bypass1 19.527 15.142 19.527 15.142 23.162 17.162 2002
Broome-Ellingham Bypass1 7.088 7.088 7.088 7.088 7.723 7.575 2002
Bridgewater Northern 5.942 4.414 5.942 4.414 5.942 4.914 2003 Distributor Road1
A689 Sedgefield-Wynyard 8.993 8.993 9.017 9.017 9.394 9.394 2003 Integrated Transport Scheme
South Thames Development 14.983 14.983 14.983 14.983 17.253 16.000 2003 Route – Phase 4
West Thurrock 7.950 3.975 10.320 5.070 10.320 5.070 2004 Regeneration Route
A617 – mansfield – Ashfield 29.854 23.454 31.766 27.818 34.268 28.083 2004 Regeneration Route
A228 – Ropers Lane 15.200 9.900 18.060 11.860 18.410 12.210 2004
South Bradford Integrated 10.072 10.072 10.072 10.072 12.426 11.364 2004 Transport Scheme1
A350 Semington to 11.566 10.105 14.368 10.820 14.368 10.820 2004 melksham Diversion
Rearsby Bypass 5.860 5.860 7.390 7.003 7.390 7.003 2004
South Stockton Link1 31.455 24.762 31.455 26.477 34.504 26.986 2005
A57 – Cadishead Way 19.905 19.905 19.905 19.905 20.094 19.905 2005
A167 – Chilton Bypass 7.640 7.640 9.089 8.364 9.245 8.364 2005
A158/C541 – Partney Bypass 5.648 5.648 6.305 6.305 8.700 6.305 2005
Nar Ouse Regeneration 7.731 7.731 7.752 7.752 7.752 7.752 2005
A142 – Fordham Bypass 12.068 12.068 12.821 12.571 12.757 12.711 2005
Scotswood Rd, Newcastle 12.700 12.700 13.200 13.200 13.200 13.200 2006
A505 – Baldock Bypass 33.821 33.821 47.330 47.330 47.408 47.330 2006
Local Transport Plan funded major road schemes
12 Completed Schemes

41ESTImATING AND mONITORING THE COSTS OF BuILDING ROADS IN ENGLAND
scheme estimated cost at estimated cost at final cost Completion programme entry latest ministerial approval date
Total DfT contribution Total DfT contribution Total DfT contribution (£m) (£m) (£m) (£m) (£m) (£m)
South Lowestoft Relief Road 25.440 25.440 30.621 29.621 30.621 29.621 2006 and Associated measures
total 293.443 263.701 327.011 294.812 344.932 301.769
Source: National Audit Office analysis of Department for Transport, Government Offices for the Regions and local authority data
NOTES
1 These schemes went straight to Full Approval when they entered the programme. Therefore the cost at programme entry is the same as the cost at full approval.
2 All costs at outturn prices.
3 All data as at July 2006.
4 Our sample testing (outlined at Appendix 1, paragraph 27) revealed a number of errors in the data originally provided to us, which have subsequently been corrected. We cannot therefore be certain of the accuracy of the figures in this table for schemes not included in our sample.
scheme estimated cost at Latest approved amount1 Latest estimate programme entry
Total DfT contribution Total DfT contribution Total DfT contribution (£m) (£m) (£m) (£m) (£m) (£m)
Selly Oak Relief Road 36.100 15.679 49.600 21.369 49.600 21.369
A6096 Ilkeston – Awsworth Link 8.606 7.383 12.400 10.400 11.395 10.4
A612 – Gedling Integrated Transport Scheme 7.067 6.350 11.664 7.490 11.664 7.490
A165 – Reighton Bypass 6.550 6.550 6.550 6.550 6.564 6.550
A228 Leybourne & West malling Corridor 27.940 19.940 29.000 20.470 28.470 20.470 Improvement Scheme
A58 – Blackbrook Diversion 7.899 7.899 8.450 8.450 8.586 8.450
East Kent Access – Phase 1 12.954 12.954 23.248 18.000 23.248 18.000
Pegswood Bypass 8.140 8.140 9.375 9.375 9.375 9.375
Oakham Bypass 8.618 7.650 11.666 9.796 11.666 9.796
A1198 – Papworth Bypass 5.400 2.769 8.740 5.460 9.240 5.460
Cradley Heath Town Centre Strategy 6.335 4.335 10.761 6.769 10.761 6.769
A38 – Northfield Regeneration 12.060 8.060 19.380 15.282 19.380 15.282
A429 – Barford Bypass 6.910 6.910 10.110 9.050 10.110 9.050
Rugeley Eastern Bypass Stage 2 17.454 8.550 22.844 19.688 22.844 19.688
Sheffield Northern Inner Relief Road 30.007 20.007 58.489 55.989 62.557 55.989
A4146 – Stoke Hammond/Linslade 42.045 32.401 43.076 40.576 52.842 40.576 Western Bypass
Barnstaple Western Bypass 30.400 30.400 39.954 37.954 43.078 37.954
Sunderland Southern Radial Route 17.026 17.026 23.198 21.348 28.720 21.348
APPENDIX THREE
13 Current Schemes with Full or Conditional Approval
12 Completed Schemes continued

42 ESTImATING AND mONITORING THE COSTS OF BuILDING ROADS IN ENGLAND
scheme estimated cost at Latest approved amount1 Latest estimate programme entry
Total DfT contribution Total DfT contribution Total DfT contribution (£m) (£m) (£m) (£m) (£m) (£m)
A127/A1159 Priory Crescent, 3.500 3.500 3.500 3.500 16.108 3.500 Southend on Sea2
East Leeds Link Road2 20.700 9.500 31.900 14.800 32.489 14.800
Leeds Inner Ring Road – Stage 72 35.576 35.576 50.538 50.358 50.538 50.358
Tunstall Northern Bypass3 6.730 2.640 7.557 3.127 7.557 3.127
markham Employment Growth Zone3 21.500 14.500 23.600 14.500 23.600 14.500
A631 – West Bawtry Road Improvements3 5.028 5.028 5.028 5.028 5.420 5.028
Darlington Eastern Transport Corridor3 5.700 5.700 12.500 12.040 12.500 12.040
Ridgmont Bypass and Woburn Link Road 7.745 7.745 17.438 15.616 17.438 15.616
total 397.990 307.192 550.566 442.985 585.750 442.985
Source: National Audit Office analysis of Department for Transport, Government Offices for the Regions and local authority data
NOTES
1 The latest approved amount is the estimated cost when the scheme was fully approved unless further cost increases have been approved since. This occurred in two cases: East Leeds Link Road and Leeds Inner Ring Road. Note 2 explains that the estimated cost at programme entry in the above table for both these schemes is the amount when the scheme was fully approved.
2 These schemes went straight to Full Approval when they entered the programme. Therefore the cost at programme entry is the same as the cost at full approval.
3 These schemes have not yet been Fully Approved but have reached the status of ‘Conditional Approval’. This is an additional stage introduced by the Department for Transport in 2004. At Conditional Approval (which falls between Programme Entry and Full Approval) the costs of the scheme are more clearly defined and less likely to change than previously between Programme Entry and Full Approval.
4 All costs at outturn prices.
5 All data as at July 2006 except for latest cost estimates, most of which are as at may 2006.
6 Our sample testing (outlined at Appendix 1, paragraph 27) revealed a number of errors in the data originally provided to us, which have subsequently been corrected. We cannot therefore be certain of the accuracy of the figures in this table for schemes not included in our sample.
APPENDIX THREE
13 Current Schemes with Full or Conditional Approval continued

43ESTImATING AND mONITORING THE COSTS OF BuILDING ROADS IN ENGLAND
scheme estimated cost at Latest estimate programme entry
Total DfT contribution Total DfT contribution (£m) (£m) (£m) (£m)
New mersey Gateway1 209.000 209.000 209.000 209.000
Waverley Link Road1 8.130 8.130 8.130 8.130
A4123/A461 Junction Improvement Burnt Tree1 10.303 10.303 10.303 10.303
A47 Earl Shilton Bypass1 15.979 14.797 15.979 14.797
Taunton Third Way and Northern Inner and Distributor Road1 27.660 13.740 27.660 13.740
Beverley Integrated Transport Scheme1 29.370 24.847 29.370 24.847
Thames Gateway A13/A1301 63.625 63.625 63.625 63.625
East Kent Access Phase 21 64.000 64.000 64.000 64.000
Liverpool Edge Lane West 15.850 15.850 15.850 15.850
Bexhill to Hastings Link Road 47.120 47.120 51.650 47.120
Sittingbourne Northern Relief Road 43.500 29.000 43.500 29.000
Brierley Hill Access Network 24.310 17.370 24.350 17.370
Darlaston Strategic Development Area 10.100 9.600 10.100 9.600
A353/A354 – Weymouth Relief Road 54.567 54.567 77.000 54.567
A509 – Isham Bypass 13.900 13.900 14.600 13.900
A1073 – Spalding to Eye 44.590 44.590 71.400 44.590
A1056 – Northern Gateway Stage 2 9.916 9.516 16.178 9.516
North middlesborough Accessibility Improvements 10.930 10.930 12.220 10.930
Ashton Northern Bypass Stage 2 7.740 7.740 8.300 7.740
A43 – Corby Link Road 12.717 12.717 15.200 12.717
Poole Bridge Regeneration Initiative Scheme 34.000 14.141 46.880 14.141
A34 – Alderley Edge Bypass 37.900 37.900 53.000 37.900
A628 – Cudworth and West Green Link Road 17.198 17.198 17.198 17.198
A57 – m1 to Todwick Crossroads 6.264 6.264 14.774 6.264
m4 Junction 11 (Green Park Improvements) and mereoak Roundabout 43.320 36.320 69.610 36.320
Hemsworth to A1 Link 11.261 11.261 23.583 11.261
Glasshoughton Coalfields Link Road2 6.820 4.215 12.129 5.792
A57 – Glossop Spur 7.180 7.180 8.081 7.180
Owen Street Level Crossing Relief Road 8.810 7.560 17.100 7.560
Rugby Western Relief Road 20.280 8.060 30.500 8.060
Hall Lane Area Improvement Scheme 9.000 9.000 12.200 9.000
APPENDIX THREE
14 Current Schemes with Provisional Approval only

44 ESTImATING AND mONITORING THE COSTS OF BuILDING ROADS IN ENGLAND
scheme estimated cost at approved increase in cost Latest estimate programme entry
Total DfT contribution Total DfT contribution Total DfT contribution (£m) (£m) (£m) (£m) (£m) (£m)
Glasshoughton Coalfields Link Road 6.820 4.215 8.392 5.792 12.129 5.792
B1115 - Stowmarket Relief Road 9.766 2.763 13.200 7.505 17.695 7.505
scheme estimated cost at Latest estimate programme entry
Total DfT contribution Total DfT contribution (£m) (£m) (£m) (£m)
A688 – Wheatley Hill to Bowburn Link 6.241 6.241 10.215 6.241
A6 – Bedford Western Bypass 17.900 2.916 24.812 2.916
B1115 – Stowmarket Relief Road2 9.766 2.763 17.695 7.505
Carlisle Northern Development Route3 77.812 77.812 142.080 77.812
total 1,037.059 930.173 1,288.272 936.492
NOTES
1 New programme entry in 2006 therefore latest estimate taken as being programme entry cost.
2 These schemes are still only at programme entry level but since first entering the programme they have received an approved increase in funding allocation from the Department for Transport (Table 4).
3 This is scheme is funded under the Private Finance Initiative. The Department gave the scheme Full Approval in 2004 at £78 million PFI credits. Since then, Cumbria County Council has requested additional funding of some £65 million and therefore the Department has effectively withdrawn Full Approval while it considers the Council’s latest application.
4 All costs at outturn prices.
5 All data as at July 2006 except for latest cost estimates, most of which are as at may 2006.
APPENDIX THREE
14 Current Schemes with Provisional Approval only continued
15 Current PFI schemes

45ESTImATING AND mONITORING THE COSTS OF BuILDING ROADS IN ENGLAND
Six Targeted Programme of Improvement schemes droppedA30 Carland Cross to Chiverton Cross
A30 Temple to Higher Carblake Improvement
A482 Pant – Llanymynech Bypass
A1 Dualling – Adderstone to Belford
A1 Dualling – Morpeth to Felton
A64 Rilington Bypass
Seven Targeted Programme of Improvement schemes delayedScheme Extent of delay
A57 Mottram to Tintwistle Start of works slipped to 2012-13
A5 Dunstable Northern Bypass Start of works slipped to 2011-12
A46 Newark – Widerpool Start of works slipped to 2012-13
A453 Widening Start of works slipped to 2009-10
A47 Blofield to North Burlingham Start of works slipped to 2011-12
A11 Fiveways to Thetford Start of works slipped to 2012-13
A19 Seaton Burn Start of works slipped to 2011-12
Eight Local Transport Plan schemes droppedA391 St Austell to the A30 Link
A24 Ashington to Southwater Improvement
The Wigan Inner relief Road
Sunderland Central Route
A24 Horsham to Capel improvement
The Kiln Lane Link, Epsom
A39 Camelford Road
The Brunel Link and Harnham Relief Road
Schemes dropped or delayed through the Regional Funding Allocation processAPPENDIX FOuR

46 ESTImATING AND mONITORING THE COSTS OF BuILDING ROADS IN ENGLAND
APPENDIX FIVE
2006-07 – 2008-09 2009-10 – 2011-12 2012-13 – 2015-16
Region Forecast Funding Over programming/ Forecast Funding Over programming/ Forecast Funding Over programming/ ten year expenditure (under programming) expenditure (under programming) expenditure (under programming) total over programming (under programming)
East 375.9 288.0 87.9 369.8 308 61.8 427.3 444 (16.7) 133.0
East 254.9 223.0 31.9 187.3 237 (49.7) 473.1 340 133.1 115.3 midlands
North East 136.1 130.0 6.1 153.1 136 17.1 150.0 191 (41.0) (17.8)
North West 370.7 351.0 19.7 423.5 369 54.5 486.9 525 (38.1) 36.1
South East 620.8 423.0 197.8 585.5 451 134.5 110.2 648 (537.8) (205.5)
South West 326.6 264.0 62.6 420.1 282 138.1 473.0 405 68.0 268.7
West 290.3 275.0 15.3 270.6 291 (20.4) 175.4 413 (237.6) (242.7) midlands
yorkshire & 249.1 260.0 (10.9) 245.1 275 (29.9) 370.7 392 (21.3) (62.1) Humberside
total 2,624.4 2,214.0 410.4 2,655.0 2,349.0 306.0 2,666.6 3,358.0 (691.4) 25.0
NOTES
These allocations do not only include road schemes.
This appendix is discussed in paragraph 1.21.
16 Provisional Regional Funding Allocations
Provisional Regional Funding Allocations

47ESTImATING AND mONITORING THE COSTS OF BuILDING ROADS IN ENGLAND
2006-07 – 2008-09 2009-10 – 2011-12 2012-13 – 2015-16
Region Forecast Funding Over programming/ Forecast Funding Over programming/ Forecast Funding Over programming/ ten year expenditure (under programming) expenditure (under programming) expenditure (under programming) total over programming (under programming)
East 375.9 288.0 87.9 369.8 308 61.8 427.3 444 (16.7) 133.0
East 254.9 223.0 31.9 187.3 237 (49.7) 473.1 340 133.1 115.3 midlands
North East 136.1 130.0 6.1 153.1 136 17.1 150.0 191 (41.0) (17.8)
North West 370.7 351.0 19.7 423.5 369 54.5 486.9 525 (38.1) 36.1
South East 620.8 423.0 197.8 585.5 451 134.5 110.2 648 (537.8) (205.5)
South West 326.6 264.0 62.6 420.1 282 138.1 473.0 405 68.0 268.7
West 290.3 275.0 15.3 270.6 291 (20.4) 175.4 413 (237.6) (242.7) midlands
yorkshire & 249.1 260.0 (10.9) 245.1 275 (29.9) 370.7 392 (21.3) (62.1) Humberside
total 2,624.4 2,214.0 410.4 2,655.0 2,349.0 306.0 2,666.6 3,358.0 (691.4) 25.0
NOTES
These allocations do not only include road schemes.
This appendix is discussed in paragraph 1.21.
16 Provisional Regional Funding Allocations
Printed in the UK for the Stationery Office Limited on behalf of the Controller of Her Majesty’s Stationery Office
5535036 03/07 7333
APPENDIX FIVE