Estimated Index Values of New Ships - Transport & · PDF fileEstimated Index Values of New...
36
Estimated Index Values of New Ships Analysis of EIVs of Ships That Have Entered The Fleet Since 2009 Rapport Delft, March 2015 Author(s): Jasper Faber Maarten ‘t Hoen Marnix Koopman Dagmar Nelissen Saliha Ahdour
Transcript of Estimated Index Values of New Ships - Transport & · PDF fileEstimated Index Values of New...

Estimated Index Values of
New Ships
Analysis of EIVs of Ships That Have Entered
The Fleet Since 2009
Rapport Delft, March 2015
Author(s): Jasper Faber
Maarten ‘t Hoen
Marnix Koopman
Dagmar Nelissen
Saliha Ahdour

2 March 2015 7.E50.1 - Estimated Index Values of New Ships
Publication Data
Bibliographical data:
Jasper Faber, Maarten ’t Hoen, Marnix Koopman, Dagmar Nelissen, Saliha Ahdour
Estimated Index Values of New Ships
Analysis of EIVs of Ships That Have Entered The Fleet Since 2009
Delft, CE Delft, March 2015
Ships / Energy efficiency / Innovation / Regulation / Standards
FT: Design
Publication code: 15.7E50.14
CE publications are available fromwww.cedelft.eu
Commissioned by: Seas At Risk and Transport & Environment.
Further information on this study can be obtained from the contact person, Jasper Faber.
© copyright, CE Delft, Delft
CE Delft
Committed to the Environment
Through its independent research and consultancy work CE Delft is helping build a
sustainable world. In the fields of energy, transport and resources our expertise is
leading-edge. With our wealth of know-how on technologies, policies and economic
issues we support government agencies, NGOs and industries in pursuit of structural
change. For 35 years now, the skills and enthusiasm of CE Delft’s staff have been
devoted to achieving this mission.
3 March 2015 7.E50.1 - Estimated Index Values of New Ships
Preface
This study has been commissioned by Transport & Environment and
Seas at Risk. We have presented preliminary findings to a number of people
from shipping industries in May 2013 and later at the 67th session of the
Marine Environment Protection Committee (MEPC) of the International
Maritime Organisation (IMO) in October 2014. We thank the participants at
those meetings for comments received. If, despite their valuable comments,
errors remain, they can only be attributed to us.
The authors

4 March 2015 7.E50.1 - Estimated Index Values of New Ships

5 March 2015 7.E50.1 - Estimated Index Values of New Ships
Contents
Summary 7
1 Introduction 9 1.1 Policy context 9 1.2 Objective of the study 9 1.3 Methodology of the study 10 1.4 Scope of the study 11 1.5 Outline 11
2 The relation between EEDI and EIV 13 2.1 Matching ships from Clarksons Register and IMO EEDI database 13 2.2 Correlation between EEDI and EIV 13
3 Design efficiency of ships 2009-2014 15 3.1 Bulkers 15 3.2 Containerships 18 3.3 Tankers 20 3.4 Gas Carriers 22 3.5 General Cargo Carriers 24 3.6 Combination Carriers 25 3.7 Adjustment of the results for specific fuel consumption 26
4 Conclusions 29
5 Bibliography 31
Annex A Data 33
Annex B Analytics for bulkers, tankers, containerships based on SOFC 35

6 March 2015 7.E50.1 - Estimated Index Values of New Ships

7 March 2015 7.E50.1 - Estimated Index Values of New Ships
Summary
As of January 1st 2013, all new ships have to meet a minimum value for their
Energy Efficiency Design Index (EEDI). The EEDI value ships have to meet is a
function of ship type and size of the ship. It is based on an empirical regression
line of the efficiency of ships built between 1999 and 2009 which is called the
reference line. The reference lines were calculated using publicly available
data to construct a simplified version of the EEDI called the Estimated Index
Value (EIV).
There is little publicly available information on how the design efficiency of
ships that have entered the fleet since 2009 has developed. The IMO has
published the EEDI of a limited number of ships launched since 2012, but the
sample of ships is small and the time period limited. The published data show
clearly, however, that EIVs and EEDIs of ships are well correlated.
This report analyses the EIV of over 9,000 new ships that have entered the
fleet between January 2009 and July 2014. By way of an example, Figure 1
shows the analysis for container ships. Their design efficiency has improved
considerably between 2009 and 2014. In 2013 and 2014, approximately 90% of
new container ships had EIVs below the reference line.
Figure 1 EIVs of Containerships built in 2009-2014
The detailed analysis of ship types shows many ships have an EIV 10% or more
below the reference line. This is the case for about a fifth of tankers, gas
carriers and combination carriers, over a quarter of bulk carriers, and over
three quarters of container ships and general cargo ships that have entered
the fleet since 2013. Taking into account that the EIV is an overestimation of
the EEDI, this result suggests many ships already exceed the EEDI required
from 2015.
The EIV improvements have, for a number of ship categories, coincided with
increases in average design speed and decreases in main engine power.
This suggests that hull or propulsion efficiency has been improved.
These findings also suggest that, if design speeds were kept constant, even
larger improvements in design efficiency would have been possible.
0
5
10
15
20
25
30
35
0 50.000 100.000 150.000 200.000 250.000
2009
2010
2011
2012
2013
2014
Reference line

8 March 2015 7.E50.1 - Estimated Index Values of New Ships

9 March 2015 7.E50.1 - Estimated Index Values of New Ships
1 Introduction
1.1 Policy context
As of January 1st 2013, all new ships have to meet a minimum value for their
Energy Efficiency Design Index (EEDI). The EEDI is a measure of a ship’s
efficiency under standardized conditions, expressed by the amount of
CO2 emissions per tonne-mile.
The EEDI value ships have to meet is a function of ship type and size of the
ship. It is based on an empirical regression line of the efficiency of ships built
between 1999 and 2009 which is called the reference line. The reference lines
were calculated by the IMO using publicly available data to construct a
simplified version of the EEDI called the Estimated Index Value (EIV).
For 2013 and 2014, the EEDI of new ships cannot exceed the reference line;
between 2015 and 2019, ships need to have an EEDI that is at least 10% better
than the reference line and this improvement is set to increase over time up
to 30% after 2025. Small ships are either exempted or have a relaxed
stringency requirement.
MEPC 67 decided to conduct a 2015 review of the status of technological
developments relevant to implementing phase 2 of the EEDI regulation as
required under regulation 21.6 of MARPOL Annex VI.
In the past, there have been large changes in the efficiency of ships. However,
they have not been well documented in terms relevant to the EEDI, except for
one qualitative graph in the 2nd IMO GHG Study 2009 (Buhaug, et al., 2009).
Economic logic would suggest that fuel prices have been a major driver of
efficiency changes.
As fuel prices increased over the last decade and were projected to increase
even further, there has presumably been an incentive to improve the energy
efficiency of both new and existing ships. Discussions within the IMO regulatory
framework on the curbing of GHG emissions of international maritime
transport and the current economic crisis may have given added impetus to
economize on fuel use.
1.2 Objective of the study
The aim of this study is to analyse how the design efficiency of ships has
changed over time. More specifically, this report answers the following
questions:
1. What is the relationship between the EEDI and the EIV?
2. How has the EIV of ships that have entered the fleet since 2009 changed
and how have changes in the EIV been achieved?

10 March 2015 7.E50.1 - Estimated Index Values of New Ships
1.3 Methodology of the study
We calculate Estimated Index Values in conformity with resolution
MEPC.215(63) (MEPC, 2012) EIVs should not be mistaken for EEDI scores.
The EIV is more a measure of the design efficiency than of fuel efficiency of
ships as there are a number of simplifying assumptions used in the calculation.
In line with resolution MEPC.215(63) (MEPC, 2012), the following assumptions
have been made in calculating the EIV:
1. The carbon emission factor is constant for all engines,
i.e. CF,ME = CF,AE = CF = 3.1144 g CO2/g fuel.
2. The specific fuel consumption for all ship types is constant for all main
engines, i.e. SFCME = 190 g/kWh.
3. PME(i) is main engines power and is 75% of the total installed main power
(MCRME(i)).
4. The specific fuel consumption for all ship types is constant for all auxiliary
engines, i.e. SFCAE = 215 g/kWh.
5. PAE is the auxiliary power and is calculated according to paragraphs
2.5.6.1 and 2.5.6.2 of the annex to MEPC.212(63).
6. No correction factors on ice class, voluntary structural enhancement,
etc. are used.
7. Innovative mechanical energy efficiency technology, shaft motors and
other innovative energy efficient technologies are all excluded from the
calculation, i.e. PAEeff = 0, PPTI = 0, Peff = 0.
This results in the following formula:
Capacity is defined as 70% of dead weight tonnage (dwt) for containerships and
100% of dwt for other ship types. Vref refers to design speed. In conformity with
the reference line calculations (MEPC.215(63) (MEPC, 2012), only ships of 400
GT or above are included.
Reference line values have been calculated according to the guidelines set out
in MEPC.203(62) Annex 19 (MEPC, 2011). Each ship type has a different
reference line that is an exponential function of dwt. These functions are
shown in Table 1 and in the graphs in the second chapter.
Table 1 Reference line value for different ship types
Ship type Reference line value
Bulker 961.79*(dwt)-0.477
Gas carrier 1120*(dwt)-0.456
Tanker 1218.8*(dwt)-0.488
Container ship 174.22*(dwt)-0.201
General Cargo ship 107.48*(dwt)--0.216
Combination carrier 1219*(dwt)-0.488

11 March 2015 7.E50.1 - Estimated Index Values of New Ships
The calculations are presented in a graphical and tabular manner. The EIVs of
ships are compared with the reference line value in a graph for each ship type.
We expect most EIVs to lie below the reference line as ships built since 2009
should be more fuel efficient than ships built between 1999 and 2009.
We also calculated the mean and median deviation of the EIV from the
reference line value for each ship type and its standard deviation. The median
deviation is more useful as a central measure when observations are not
spread evenly around the mean or when there are many outliers in the data.
The standard deviation is a measure of the variation in the EIV.
We expect the mean and median deviation to be positive as this indicates that
the fuel efficiency performance of ships built since 2009 is on average better
than that of ships of the same capacity built in the years 1999-2009.
We further expect that the mean and median deviation have increased in the
years 2009-2014 as ships built in 2011 and 2012 may have been ordered when
fuel prices were relatively high and freight rates relatively low. We also
present the number and percentage of ships whose EIVs exceed their reference
line values in the years 2009-2014 to double check the assumptions.
1.4 Scope of the study
All ship types for which an EEDI reference line has been published have been
included in the study (see Table 1). This excludes specific ship types such as
Lakers, landing craft, passenger ships or Ro-Ro vessels. Furthermore, results
for reefers are not presented as only ten such ships have entered the fleet
since 2009 (and eight of them have EIVs in excess of their reference line
value).
Shipping data has been obtained from Clarksons World Fleet Register. In order
to weed out improbable results, the data have been processed in four ways:
1. Ships with exceptionally high or low engine power, capacity or design
speed have been identified. The data (ship type, main engine power,
capacity and speed) on these ships has been cross checked with other
sources and the ships have been excluded from the analysis if the data did
not match. The reference values calculated for these ships have been
compared with values of similar ships.
2. The calculated EIVs have been compared with the published graphs and
statistics on reference lines. When values were significantly above or
below the range of published values, they have been analysed in more
detail.
3. Outliers have been analysed in more detail and omitted if data was
corrupted or when values seemed improbable.
4. Small ships that do not have to comply with the EEDI have been excluded
from the analysis.
1.5 Outline
Chapter 2 establishes that the EIV is strongly correlated with the EEDI and can
therefore be considered a good indicator of the design efficiency of ships.
The analysis of the EIV of recent ships is presented in Chapter 3.
Chapter 4 concludes.

12 March 2015 7.E50.1 - Estimated Index Values of New Ships

13 March 2015 7.E50.1 - Estimated Index Values of New Ships
2 The relation between EEDI and EIV
2.1 Matching ships from Clarksons Register and IMO EEDI database
Clarksons World Fleet Register comprises all ships in the world fleet and
contains information that allows the calculation of the EIV of most of them.
MEPC 67/INF.4 (IMO, 2014) provides the EEDI (Energy Efficiency Design Index)
for 158 ships, together with their year of build and deadweight tonnage.
In some cases, the combination of deadweight tonnage and year of build is
unique and allows for linking both datasets. In other cases a direct match was
not possible because the datasets disagreed on date or size of the ship, but an
internet search allows to match the ships anyway. In total, we have found
154 matches.
2.2 Correlation between EEDI and EIV
After linking the ships in Clarksons Register to the IMO database, the
relationship between the EEDI and EIV is studied. Figure 2 shows the
relationship between these parameters and a clear linear trend is shown with
a coefficient of determination (R2) of 0.92. On average, the EEDI value is
smaller than the EIV or, in other words, the EIV is an overestimation of the
EEDI.
Figure 2 Relationship between EEDI and EIV for all types of ships
A closer look per ship type reveals that there is a good correlation for all ship
types, but the strength of the correlation is smaller for bulkers than for
example. container ships and tankers.
y = 0.8612xR² = 0.9179
0
5
10
15
20
25
30
0 5 10 15 20 25 30 35
EED
I
EIV
Relation between EEID and EIV

14 March 2015 7.E50.1 - Estimated Index Values of New Ships
Table 2 Coefficient of determination per ship type
Shiptype Number of ships R2
Bulk carrier 75 0.66
Combination carrier 17 0.73
Containership 35 0.73
Gas carrier 7 0.91
Tanker 20 0.88
All shiptypes 154 0.92

15 March 2015 7.E50.1 - Estimated Index Values of New Ships
3 Design efficiency of ships 2009-2014
This chapter analyses how the EIV of ships that have entered the fleet since
2009 has changed and how these changes have been achieved. Various ship
types show different patterns, which are discussed separately in Sections 3.1
through 3.6. Section 3.7 analyses the impact of the specific fuel consumption
on the EIV and on the results of the analysis.
3.1 Bulkers
The Estimated Index Values and reference line values of 4,326 bulk carriers
built in the years 2009-2014 have been calculated. Figure 3 illustrates the
outcome for each bulker. Deadweight tonnage is on the horizontal axis.
Observations below the continuous yellow curve refer to bulkers whose EIV is
better than the reference line; observations above the same curve imply that
the design efficiency of these bulkers is worse than the reference line.
An improvement in fuel efficiency performance between 1999-2009 and
2009-2014 should become visible through a majority of observations being
below the yellow curve and an improvement between 2009 to 2014 would be
evidenced by fewer EIVs in excess of the reference line value for later launch
years. However, such developments are not immediately apparent from the
figure.
Figure 3 EIVs of Bulkers built in 2009-2014
Further details on the EIVs of bulk carriers are presented in Table 3. The mean
and median deviation are given in terms of the EIV minus the reference line
value. The standard deviation is a measure for the variation in the EIV.
0
2
4
6
8
10
12
14
16
18
20
0 100.000 200.000 300.000 400.000
2009
2010
2011
2012
2013
2014
Reference line

16 March 2015 7.E50.1 - Estimated Index Values of New Ships
We calculated the share of ships with an EIV below the reference line value
and the share of ships for which the EIV is below the objectives for 2015-2025.
Based on the stated assumptions, we expect efficiency improvements in the
period under study resulting in lower EIVs. The analysis however shows that
this is not the case for the years 2009 through 2012, but that the EIVs of
bulkers improved considerably in 2013 and during the first half of 2014.
Table 3 shows that in 2013 and 2014, over half of the ships had EIVs below the
reference line and over a quarter had EIVs more than 10% below the reference
line.
Table 3 Analytics for bulkers 2009-2014
2009-
2014
2009 2010 2011 2012 2013 2014
EIV Mean 5.4 5.6 5.4 5.4 5.4 5.1 4.9
%deviation
from
reference
line
Mean 5% 5% 6% 7% 6% 2% -3%
Median 5% 5% 6% 6% 5% -1% -6%
Standard
deviation
15% 14% 14% 14% 17% 16% 20%
Number of
ships
Total number 4,482 545 960 1,105 1,023 614 235
With EIVs under
reference
line (in %)
34% 30% 29% 23% 35% 53% 68%
With EIVs 10%
under reference
line (in %)
13% 9% 8% 8% 11% 25% 36%
With EIVs 20%
under reference
line (in %)
2% 1% 1% 1% 2% 3% 8%
With EIVs 30%
under reference
line (in %)
0% 0% 0% 0% 0% 0% 1%
Bulkers have improved their EIV despite increasing design speed as becomes
clear when we analyse the development of the different factors of the EIV and
disaggregate the bunkers into size brackets.
New bulkers between 40,000 and 60,000 dwt are a prime example.
They had on average a higher speed in 2014 than in 2012, but lower engine
power (see Table 4 and Figure 4). On average, they were slightly smaller.
This seems to suggest that the design of the ships has improved: their hull
form, propulsion system, and other design elements, allowed them to sail at a
higher speed with less engine power than previously. A similar pattern, though
somewhat less pronounced, can be seen for larger bulk carriers up to
200,000 dwt, while the largest size category shows a very pronounced pattern.

17 March 2015 7.E50.1 - Estimated Index Values of New Ships
Table 4 Development of speed, engine power, size and EIV of bulkers
Size (dwt) EIV relative
to reference
line
Main
engine
power
Size Speed Remarks
10,000–20,000 +- +- -+ + Only 5 and 3 ships in 2013-2014
20,000-40,000 0- + + +
40,000-60,000 - - 0 0+
60,000-150,000 - - - 0
150,000-200,000 - 0 0 +
> 200,000 0 +- - +
Figure 4 Development of speed, engine power, size and EIV of bulkers
-2,0
-1,5
-1,0
-0,5
0,0
0,5
1,0
1,5
2,0
60
70
80
90
100
110
120
130
140
2009 2010 2011 2012 2013 2014
Bulk carrier: 10000 - 20000 dwt
Pme Dwt Vref Degree of excess
-2,0
-1,5
-1,0
-0,5
0,0
0,5
1,0
1,5
2,0
60
70
80
90
100
110
120
130
140
2009 2010 2011 2012 2013 2014
Bulk carrier: 20000 - 40000 dwt
Pme Dwt Vref Degree of excess
-2,0
-1,5
-1,0
-0,5
0,0
0,5
1,0
1,5
2,0
60
70
80
90
100
110
120
130
140
2009 2010 2011 2012 2013 2014
Bulk carrier: 40000 - 60000 dwt
Pme Dwt Vref Degree of excess
-2,0
-1,5
-1,0
-0,5
0,0
0,5
1,0
1,5
2,0
60
70
80
90
100
110
120
130
140
2009 2010 2011 2012 2013 2014
Bulk carrier: 60000 - 150000 dwt
Pme Dwt Vref Degree of excess
-2,0
-1,5
-1,0
-0,5
0,0
0,5
1,0
1,5
2,0
60
70
80
90
100
110
120
130
140
2009 2010 2011 2012 2013 2014
Bulk carrier: 150000 - 200000 dwt
Pme Dwt Vref Degree of excess
-2,0
-1,5
-1,0
-0,5
0,0
0,5
1,0
1,5
2,0
60
70
80
90
100
110
120
130
140
2009 2010 2011 2012 2013 2014
Bulk carrier: 200000 - dwt
Pme Dwt Vref Degree of excess

18 March 2015 7.E50.1 - Estimated Index Values of New Ships
3.2 Containerships
The EIVs and reference line values for 1,162 containerships built in the years
2009-2014 are presented in Figure 5. It is apparent from this chart that all
large container ships have EIVs well below their reference line values
(i.e. considerably better design efficiency than ships built in the decade
beginning in 1999). It is clear that a reference line calculated on the basis of
ships that entered the fleet in the period 2009–2014 would have quite different
parameters than the reference line based on ships entering the fleet between
1999 and 2009 that was used to determine EEDI requirements. One possible
explanation is that energy efficiency improvements since 2009 have
concentrated more on large container ships, leading to a reduction in their
EIVs but not in the EIVs of small and medium-sized ships.
Figure 5 EIVs of Containerships built in 2009-2014
Further analysis in Table 5 reveals that between 60 and 70% (depending on
their launch year) of new container ships built in the years up until 2012 have
EIVs that are below their reference line values. This share increases to 87-95%
for 2013-2014.
0
5
10
15
20
25
30
35
0 50.000 100.000 150.000 200.000 250.000
2009
2010
2011
2012
2013
2014
Reference line

19 March 2015 7.E50.1 - Estimated Index Values of New Ships
Table 5 Analytics for Containerships 2009-2014
2009-
2014
2009 2010 2011 2012 2013 2014
EIV Mean 18.2 20.3 19.3 17.8 18.2 15.6 14.2
%deviation
from
reference
line
Mean -8% -2% -2% -8% -9% -21% -29%
Median -8% -2% -1% -8% -10% -24% -29%
Standard
deviation
15% 10% 10% 14% 15% 17% 16%
Number of
ships
Total number 1,162 259 255 181 195 192 80
With EIVs under
reference
line (in %)
70% 64% 57% 63% 73% 87% 95%
With EIVs 10%
under reference
line (in %)
41% 16% 21% 43% 52% 72% 84%
With EIVs 20%
under reference
line (in %)
20% 5% 5% 14% 20% 51% 61%
With EIVs 30%
under reference
line (in %)
10% 2% 1% 6% 9% 26% 34%
In contrast to bulkers, containerships have generally reduced their design
speed and engine power to a larger extent, while slightly increasing their size.
This has resulted in an improvement of the EIV, as is apparent from Table 6
and Figure 6.
Table 6 Development of speed, engine power, size and EIV of container ships
Size (dwt) EIV relative
to reference
line
Main
engine
power
Size Speed Remarks
10,000-15,000 ~ 0 0 0 Only 3 (2014)
15,000-30,000 +- + + 0 Only 6 (2014)
30,000-70,000 - - + -
70,000-200,000 - - + -
Figure 6 Development of speed, engine power, size and EIV of container ships
-3,0
-2,0
-1,0
0,0
1,0
2,0
3,0
60
70
80
90
100
110
120
130
140
2009 2010 2011 2012 2013 2014
Containership: 10000 - 15000 dwt
Pme Dwt Vref Degree of excess
-3,0
-2,0
-1,0
0,0
1,0
2,0
3,0
60
70
80
90
100
110
120
130
140
2009 2010 2011 2012 2013 2014
Containership: 15000 - 30000 dwt
Pme Dwt Vref Degree of excess
20 March 2015 7.E50.1 - Estimated Index Values of New Ships
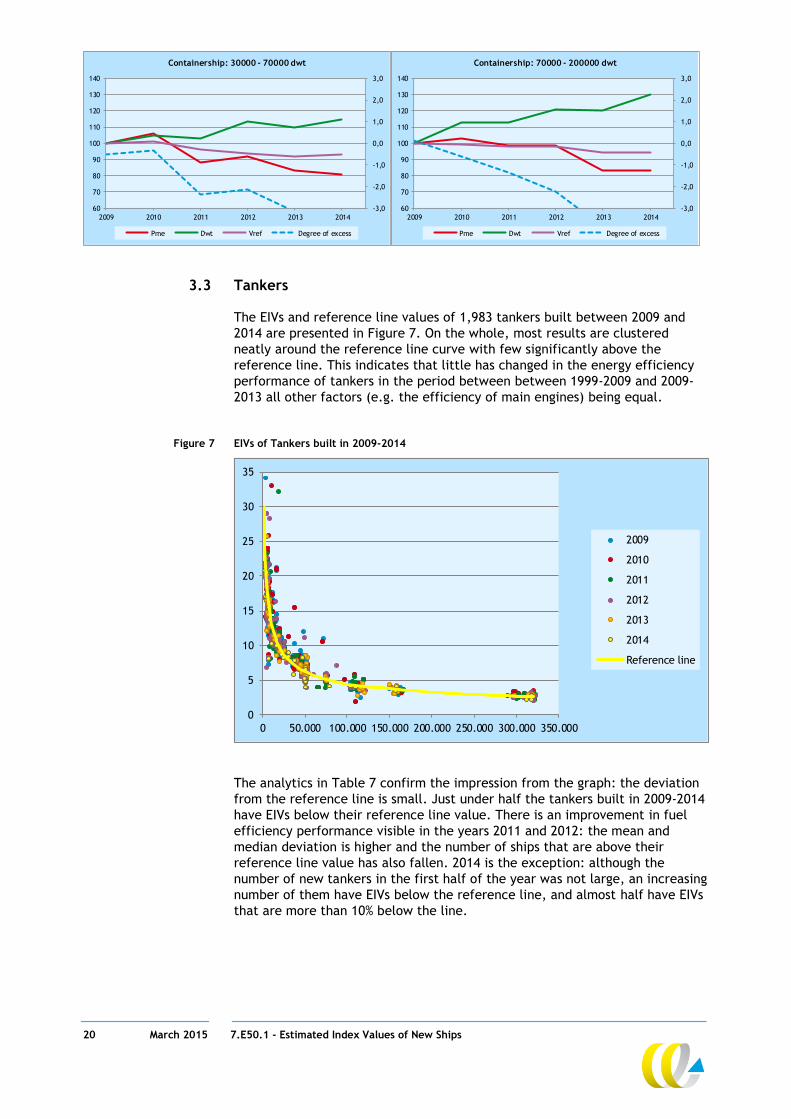
3.3 Tankers
The EIVs and reference line values of 1,983 tankers built between 2009 and
2014 are presented in Figure 7. On the whole, most results are clustered
neatly around the reference line curve with few significantly above the
reference line. This indicates that little has changed in the energy efficiency
performance of tankers in the period between between 1999-2009 and 2009-
2013 all other factors (e.g. the efficiency of main engines) being equal.
Figure 7 EIVs of Tankers built in 2009-2014
The analytics in Table 7 confirm the impression from the graph: the deviation
from the reference line is small. Just under half the tankers built in 2009-2014
have EIVs below their reference line value. There is an improvement in fuel
efficiency performance visible in the years 2011 and 2012: the mean and
median deviation is higher and the number of ships that are above their
reference line value has also fallen. 2014 is the exception: although the
number of new tankers in the first half of the year was not large, an increasing
number of them have EIVs below the reference line, and almost half have EIVs
that are more than 10% below the line.
-3,0
-2,0
-1,0
0,0
1,0
2,0
3,0
60
70
80
90
100
110
120
130
140
2009 2010 2011 2012 2013 2014
Containership: 30000 - 70000 dwt
Pme Dwt Vref Degree of excess
-3,0
-2,0
-1,0
0,0
1,0
2,0
3,0
60
70
80
90
100
110
120
130
140
2009 2010 2011 2012 2013 2014
Containership: 70000 - 200000 dwt
Pme Dwt Vref Degree of excess
0
5
10
15
20
25
30
35
0 50.000 100.000 150.000 200.000 250.000 300.000 350.000
2009
2010
2011
2012
2013
2014
Reference line

21 March 2015 7.E50.1 - Estimated Index Values of New Ships
Table 7 Analytics for Tankers 2009-2014
2009-
2014
2009 2010 2011 2012 2013 2014
EIV Mean 8.9 9.0 8.9 8.7 10.3 8.0 7.4
%deviation
from
reference
line
Mean 1% 2% 2% 2% -1% -1% -10%
Median 1% 2% 0% 0% 0% 0% -6%
Standard
deviation
21% 20% 21% 20% 22% 15% 25%
Number of
ships
Total number 1,983 696 513 345 224 151 54
With EIVs under
reference
line (in %)
46% 43% 47% 45% 49% 48% 63%
With EIVs 10%
under reference
line (in %)
16% 14% 15% 15% 18% 16% 46%
With EIVs 20%
under reference
line (in %)
4% 3% 2% 2% 6% 5% 26%
With EIVs 30%
under reference
line (in %)
1% 1% 1% 1% 2% 1% 11%
For tankers, different trends are visible for different size categories.
The smallest tankers are getting smaller, have less engine power and sail at a
slower speed. Tankers in the weight class 20,000–60,000 dwt have become
larger and have reduced their engine power while keeping their design speed
constant. Large tankers have remained pretty constant in their size, engine
power and speed, and therefore in their EIV.
Table 8 Development of speed, engine power, size and EIV of tankers
Size (dwt) EIV relative
to reference
line
Main
engine
power
Size Speed Remarks
4,000-20,000 - - - -
20,000-60,000 - - + 0
60,000-100,000 Unclear results, only 1 ship 2014
100,000-150,000 0 0 0 0 Only 2 ships 2014
150,000-200,000 0 0 0 0- Only 2 ships 2014
> 200,000 0 0 0 0 Only a few ships (2013-2014)

22 March 2015 7.E50.1 - Estimated Index Values of New Ships
Figure 8 Development of speed, engine power, size and EIV of tankers
3.4 Gas Carriers
The EIVs and reference line values of 259 gas carriers built in 2009-2014 are
presented in Figure 9. It seems as if the fuel efficiency performance of newly
built gas carriers has deteriorated over time. This trend seems primarily due to
carriers with a capacity of about 80,000 to 100,000 dwt as these ships have
EIVs that are consistently above their reference line values.
-2,0
-1,5
-1,0
-0,5
0,0
0,5
1,0
1,5
2,0
60
70
80
90
100
110
120
130
140
2009 2010 2011 2012 2013 2014
Tanker: 4000 - 20000 dwt
Pme Dwt Vref Degree of excess
-2,0
-1,5
-1,0
-0,5
0,0
0,5
1,0
1,5
2,0
60
70
80
90
100
110
120
130
140
2009 2010 2011 2012 2013 2014
Tanker: 20000 - 60000 dwt
Pme Dwt Vref Degree of excess
-2,0
-1,5
-1,0
-0,5
0,0
0,5
1,0
1,5
2,0
60
70
80
90
100
110
120
130
140
2009 2010 2011 2012 2013 2014
Tanker: 60000 - 100000 dwt
Pme Dwt Vref Degree of excess
-2,0
-1,5
-1,0
-0,5
0,0
0,5
1,0
1,5
2,0
60
70
80
90
100
110
120
130
140
2009 2010 2011 2012 2013 2014
Tanker: 100000 - 148000 dwt
Pme Dwt Vref Degree of excess
-2,0
-1,5
-1,0
-0,5
0,0
0,5
1,0
1,5
2,0
60
70
80
90
100
110
120
130
140
2009 2010 2011 2012 2013 2014
Tanker: 148000 - 200000 dwt
Pme Dwt Vref Degree of excess
-2,0
-1,5
-1,0
-0,5
0,0
0,5
1,0
1,5
2,0
60
70
80
90
100
110
120
130
140
2009 2010 2011 2012 2013 2014
Tanker: 200000 - dwt
Pme Dwt Vref Degree of excess

23 March 2015 7.E50.1 - Estimated Index Values of New Ships
Figure 9 EIVs of Gas carriers built in 2009-2014
The assumption is confirmed in the analysis in Table 9. Depending on the
launch year, between 60 and 70% of gas carriers built in 2009-2013 have EIVs
above the reference line. Only in 2014, do more gas carriers have EIVs below
the reference line than above. To some extent this is due to the relatively
small number of large ships built in that year.
Table 9 Analytics for Gas carriers 2009-2014
2009-
2014
2009 2010 2011 2012 2013 2014
EIV Mean 16.5 13.5 15.9 18.6 21.5 15.9 16.4
%deviation
from
reference
line
Mean 5% 6% 6% 5% 4% 10% -5%
Median 4% 5% 8% 3% 1% 6% -3%
Standard
deviation
19% 17% 18% 14% 13% 24% 26%
Number of
ships
Total number 259 59 55 42 32 48 23
With EIVs under
reference
line (in %)
42% 44% 38% 33% 41% 42% 61%
With EIVs 10%
under reference
line (in %)
14% 12% 13% 5% 3% 17% 43%
With EIVs 20%
under reference
line (in %)
4% 2% 4% 2% 0% 6% 13%
With EIVs 30%
under reference
line (in %)
3% 0% 4% 2% 0% 4% 9%
0
5
10
15
20
25
30
35
0 50.000 100.000 150.000 200.000
2009
2010
2011
2012
2013
2014
Reference line

24 March 2015 7.E50.1 - Estimated Index Values of New Ships
3.5 General Cargo Carriers
The EIVs and reference line values of 618 general cargo carriers built in
2009-2014 are presented in Figure 10. The spread in EIVs is large, reflecting
the heterogeneous nature of this particular ship type. The figure further
suggests that the fuel efficiency of general cargo carriers improved relative to
the 1999-2009 period as most observations are below the curve.
Figure 10 EIVs of General cargo carriers built in 2009-2014
The analysis for general cargo carriers built in 2009-2014 is shown in Table 10.
The vast majority of new carriers have EIVs below their reference line values.
However, the mean and median deviation from the reference line value
decreased in the years 2009-2014 while the number of general cargo carriers
whose EIV exceeds their reference line value rose from about 10 to 20%
between 2009 and 2012. In 2013 and 2014 these percentages fell to around
10% and almost 0%.
0
5
10
15
20
25
30
35
0 5.000 10.000 15.000 20.000 25.000 30.000
2009
2010
2011
2012
2013
2014
Reference line

25 March 2015 7.E50.1 - Estimated Index Values of New Ships
Table 10 Analytics for General cargo carriers 2009-2014
2009-
2014
2009 2010 2011 2012 2013 2014
EIV Mean 13.6 13.3 14.2 13.9 13.7 12.5 11.0
%deviation
from
reference
line
Mean -19% -27% -15% -15% -17% -22% -34%
Median -19% -25% -18% -17% -17% -20% -28%
Standard
deviation
29% 28% 33% 31% 23% 17% 21%
Number of
ships
Total number 618 141 147 137 121 58 14
With EIVs under
reference
line (in %)
83% 89% 82% 78% 78% 91% 100%
With EIVs 10%
under reference
line (in %)
67% 74% 62% 62% 63% 81% 79%
With EIVs 15%
under reference
line (in %)
57% 65% 59% 52% 49% 66% 50%
With EIVs 30%
under reference
line (in %)
24% 33% 22% 20% 22% 22% 43%
3.6 Combination Carriers
The EIVs and reference line values of 674 combination carriers built in 2009-
2014 are presented in Figure 11. Like general cargo carriers, combination
carriers are clearly a heterogeneous ship type. The chart suggests that the fuel
efficiency of combination carriers has not improved appreciably over time.
Figure 11 EIVs of Combination carriers built in 2009-2014
0
5
10
15
20
25
30
35
0 10.000 20.000 30.000 40.000 50.000 60.000
2009
2010
2011
2012
2013
2014
Reference line

26 March 2015 7.E50.1 - Estimated Index Values of New Ships
The analytics for combination carriers built in 2009-2014 in Table 11 confirm
this. About 60% of combination carriers built since 2009 have EIVs above their
reference line values. It would also seem that ships built in 2009 have a better
fuel efficiency performance than ships built after that year. A sizable fraction
of combination carriers have EIVs that deviate far from the reference line,
both above and below the line.
Table 11 Analytics for combination carriers 2009-2014
2009-
2014
2009 2010 2011 2012 2013 2014
EIV Mean 14,3 15,0 14,4 14,7 13,7 12,8 14,4
%deviation
from
reference
line
Mean 8% 5% 11% 9% 6% 11% 17%
Median 8% 4% 7% 7% 9% 11% 19%
Standard
deviation
24% 25% 25% 21% 22% 29% 22%
Number of
ships
Total number 674 142 140 168 134 74 16
With EIVs under
reference
line (in %)
37% 39% 35% 35% 38% 39% 25%
With EIVs 10%
under reference
line (in %)
18% 20% 11% 18% 23% 20% 19%
With EIVs 20%
under reference
line (in %)
8% 10% 4% 5% 10% 11% 13%
With EIVs 30%
under reference
line (in %)
2% 4% 1% 0% 4% 3% 0%
3.7 Adjustment of the results for specific fuel consumption
Clarksons’ database further contains the specific fuel consumption of the main
engine for 7,992 vessels (87% of the 9,179 ships built between 2009 and 2014
that were analysed in this Chapter). The average specific fuel consumption for
these ships is close to 175 g/kWh, which is much lower than the constant value
of 190 g/kWh set by MEPC.215(63) (MEPC, 2012) for calculating the EIV. In the
preceding sections, we have consistently used the 190 g/kWh in order to
establish a trend.
In order to assess which share of ships is likely to meet the EEDI, it is relevant
to use the actual value of the SFOC. Using this average fuel consumption
value, 67% of vessels are able to meet the reference line value once actual
fuel consumption is used in the calculation, whereas only 42% met this
requirement with the value set at 190 g/kWh. This result indicates that the
EEDI of ships is likely to be significantly better than the EIV.

27 March 2015 7.E50.1 - Estimated Index Values of New Ships
Figure 12 % of ships with EIVs above and below reference line value SFCME=190 g/kWh
Figure 13 % of ships with EIVs above and below reference line value SFCME≈175 g/kWh
0%
10%
20%
30%
40%
50%
60%
70%
80%
90%
100%
Bulk carrier Combinationcarrier
Containership Gas carrier General cargoship
Tanker
SOFC = 190 g/kWh
EIV ref value =< ref line EIV ref value > EIV ref line
0%
10%
20%
30%
40%
50%
60%
70%
80%
90%
100%
Bulk carrier Combinationcarrier
Containership Gas carrier General cargoship
Tanker
SOFC from database (~175 g/kWh)
EIV ref value =< ref line EIV ref value > EIV ref line

28 March 2015 7.E50.1 - Estimated Index Values of New Ships

29 March 2015 7.E50.1 - Estimated Index Values of New Ships
4 Conclusions
This study has analysed how the design efficiency of new ships has changed
between 2009 – the first year that ship values were not included in the
calculation of the EEDI reference line – and mid 2014 – the last year of data
used for this study.
The analysis shows that container ships have improved their design efficiency
since 2009, bulkers since 2013, and tankers possibly in 2014, although the
sample of ships in that year was quite small. For all ship types, the majority of
ships have an EIV below the reference line. Additionally, 25% of all new
tankers and 61% of all new container ships have EIVs of at least 20% below the
reference line. If one would take the actual specific fuel consumption of new
engines into account, rather than the value prescribed in the EIV formula, the
share of ships below the reference lines would be larger.
The EIV improvements have, for a number of size categories, coincided with
increases in average design speed and decreases in main engine power.
This suggests that hull or propulsion efficiency have been improved.
These findings also suggest that, if design speeds were kept constant, even
larger improvements in design efficiency would have been possible.
Our analysis indicates that the current and future EEDI limit values are
achievable for all major ship types, as many ships in all size categories already
meet and exceed them.

30 March 2015 7.E50.1 - Estimated Index Values of New Ships

31 March 2015 7.E50.1 - Estimated Index Values of New Ships
5 Bibliography
Buhaug, Ø., Corbett, J., Endresen, Ø. & et al., 2009. Second IMO Study 2009,
London: IMO.
IMO, 2014. Air Pollution and Energy efficiency : EEDI database – Review of
status of technological development, (MEPC 67/INF.4, s.l.: Marine
Environment Protection Committee (MEPC).
MEPC, 2011. Amendments to the annex of the protocol of 1997 to amend the
International Convention for the prevention of pollution from ships, 1973, as
modified by the protocal of 1978 relating thereto MEPC 203(62), s.l.: The
Marine Environment Protection Committee (MEPC).
MEPC, 2012. Guidelines for Calculation of Reference Lines for use with the
Energy Efficiency Design Index (EEDI) MEPC 215(63), s.l.: Marine Environment
Protection Agency (MEPC).

32 March 2015 7.E50.1 - Estimated Index Values of New Ships

33 March 2015 7.E50.1 - Estimated Index Values of New Ships
Annex A Data
Data on ship type, design speed, capacity, launch year, ice-class and
propulsion power has been gathered from Clarkson Research World Fleet
Register. In conformity with reference line calculations (MEPC.215(63) (MEPC,
2012), only ships of 400 GT or above are included in the dataset. Ships with
zero or missing data on power, reference speed and/or capacity have been
deleted. Speed was adjusted for one ship, dead weight tonnage for seven ships
on the basis of other sources. Two ships with very low engine power were
omitted. Thirteen outliers turned out to be ship types not included in the
reference line calculations. These were omitted as well.
The number of vessels of the six IHSF ship types included in the calculation of
reference lines built in the period 2009-2014is 9,786 of which 9,179 are
included in the dataset. Of these, 1,842 (20%) were built in 2009, 2,070 (23%)
in 2010, 1,978 (22%) in 2011, 1,729 (19%) in 2012, 1,137 (12%) in 2013 and 423
(5%) in 2014. Bulk carriers account for 4,483 (45%), gas carriers for 259 (2%),
tankers for 1.983 (24%), containerships for 1,162 (13%), combination carriers
for 674 (8%) and general cargo ships for 618 (8%) of observations in the
dataset.
Figure 14 Clarkson Research shipping data 2009-2014
0 1000 2000 3000 4000 5000
Bulk carrier
Combination carrier
Containership
Gas carrier
General cargo ship
Tanker
data available
observations

34 March 2015 7.E50.1 - Estimated Index Values of New Ships

35 March 2015 7.E50.1 - Estimated Index Values of New Ships
Annex B Analytics for bulkers, tankers, containerships based on SOFC
Table 12 Analytics for Bulkers 2009-2014
2009-
2014
2009 2010 2011 2012 2013 2014
EIV Mean 5.0 5.1 5.0 5.0 5.0 4.7 4.5
%deviation
from
reference
line
Mean 6% 7% 7% 8% 7% 1% -2%
Median 5% 6% 6% 7% 5% -1% -6%
Standard
deviation
16% 14% 14% 15% 18% 17% 22%
Number of
ships
Total number 4,326 522 939 1,077 993 590 205
With EIVs under
reference
line (in %)
59% 56% 60% 54% 57% 70% 79%
With EIVs 10%
under reference
line (in %)
23% 19% 14% 14% 24% 47% 58%
With EIVs 20%
under reference
line (in %)
7% 3% 2% 4% 7% 18% 25%
With EIVs 30%
under reference
line (in %)
1% 0% 0% 0% 1% 2% 3%
Table 13 Analytics for Tankers 2009-2014
2009-
2014
2009 2010 2011 2012 2013 2014
EIV Mean 7.5 7.5 7.5 7.3 8.2 7.6 6.5
%deviation
from
reference
line
Mean 2% 5% 2% 3% 0% -2% -14%
Median 1% 2% 1% 1% 1% 0% -13%
Standard
deviation
20% 21% 17% 23% 17% 12% 30%
Number of
ships
Total number 1,632 572 439 297 167 119 38
With EIVs under
reference
line (in %)
77% 74% 76% 74% 87% 89% 89%
With EIVs 10%
under reference
line (in %)
33% 33% 34% 32% 28% 35% 68%
With EIVs 20%
under reference
line (in %)
7% 5% 5% 5% 7% 10% 53%
With EIVs 30%
under reference
line (in %)
2% 0% 1% 1% 1% 3% 26%

36 March 2015 7.E50.1 - Estimated Index Values of New Ships
Table 14 Analytics for Containerships 2009-2014
2009-
2014
2009 2010 2011 2012 2013 2014
EIV Mean 16.4 18.7 17.8 16.1 16.1 13.8 122
%deviation
from
reference
line
Mean -9% -2% -2% -9% -12% -25% -36%
Median -9% -1% -1% -10% -15% -25% -37%
Standard
deviation
16% 11% 11% 15% 17% 18% 17%
Number of
ships
Total number 1,048 228 242 170 170 165 73
With EIVs under
reference
line (in %)
93% 87% 92% 96% 93% 98% 99%
With EIVs 10%
under reference
line (in %)
62% 46% 42% 62% 71% 87% 95%
With EIVs 20%
under reference
line (in %)
38% 10% 15% 41% 51% 69% 88%
With EIVs 30%
under reference
line (in %)
16% 2% 1% 7% 15% 49% 62%