Estimated CVP Operations Mar 90% Exceedance · Estimated CVP Operations Mar ... months of September...
15
-
Upload
trinhkhanh -
Category
Documents
-
view
220 -
download
0
Transcript of Estimated CVP Operations Mar 90% Exceedance · Estimated CVP Operations Mar ... months of September...


Estimated CVP Operations Mar 90% Exceedance
StoragesFederal End of the Month Storage/Elevation (TAF/Feet)
Apr May Jun Jul Aug Sep Oct Nov Dec Jan Feb MarTrinity 1844 1964 1893 1782 1679 1555 1439 1409 1390 1400 1432 1518 1615
Elev. 2338 2333 2325 2318 2308 2298 2295 2294 2295 2297 2305 2313Whiskeytown 207 238 238 238 238 238 230 206 206 206 206 206 206
Elev. 1209 1209 1209 1209 1209 1207 1199 1199 1199 1199 1199 1199Shasta 3880 4132 4011 3656 3077 2630 2351 2226 2221 2351 2548 2895 3351
Elev. 1052 1048 1035 1011 991 977 970 970 977 987 1003 1023Folsom 817 793 904 825 591 449 402 345 296 256 306 412 576
Elev. 449 459 452 427 410 403 395 386 379 388 405 426New Melones 2019 1977 1946 1922 1848 1784 1740 1709 1721 1735 1747 1770 1789
Elev. 1050 1047 1045 1038 1032 1028 1025 1026 1027 1028 1031 1033San Luis 876 773 574 266 88 8 72 198 382 526 666 699 762
Elev. 510 485 445 421 399 414 431 451 476 491 493 505Total 9877 9567 8689 7521 6665 6234 6093 6215 6474 6905 7500 8298
State End of the Month Reservoir Storage (TAF)Oroville
San Luis 898 849 761 652 609 510 566 593 605 719 746 723 803Total San Luis (TAF) 1774 1622 1335 919 697 518 638 791 986 1245 1411 1422 1565
Monthly River Releases (TAF/cfs)
Trinity TAF 36 92 47 28 53 52 23 18 18 18 17 18cfs 600 1,498 783 450 857 870 373 300 300 300 300 300
Clear Creek TAF 13 13 17 9 9 9 12 12 12 12 11 12cfs 218 216 288 150 150 150 200 200 200 200 200 200
Sacramento TAF 297 492 625 799 645 476 369 268 200 200 180 200cfs 5000 8000 10500 13000 10500 8000 6000 4500 3250 3250 3250 3250
American TAF 506 77 167 293 204 107 92 89 92 61 56 77cfs 8500 1250 2811 4768 3311 1798 1500 1500 1500 1000 1005 1250
Stanislaus TAF 83 96 56 18 18 18 49 12 12 14 13 12cfs 1400 1555 940 300 300 300 797 200 200 232 236 200
Feather TAF 208 92 119 215 123 108 77 74 77 77 69 108cfs 3500 1500 2000 3500 2000 1815 1250 1250 1250 1250 1250 1759
Trinity Diversions (TAF)Apr May Jun Jul Aug Sep Oct Nov Dec Jan Feb Mar
Carr PP 39 67 85 80 71 62 16 21 12 3 2 15Spring Crk. PP 10 60 70 70 60 60 30 15 12 10 20 30
Delta Summary (TAF)Apr May Jun Jul Aug Sep Oct Nov Dec Jan Feb Mar
Tracy 93 61 53 225 260 262 265 250 190 190 120 200USBR Banks 0 0 0 18 18 18 0 0 0 0 0 0Contra Costa 12.7 12.7 9.8 11.1 12.7 14.0 16.8 18.4 18.3 14.0 14.0 12.7
Total USBR 106 74 63 254 291 294 282 268 208 204 134 213State Export 77 31 47 121 64 150 151 106 186 190 127 200
Total Export 182 105 110 375 355 444 433 374 394 394 261 413COA Balance 25 25 0 0 0 87 87 87 87 87 46 46
Old/Middle River Std.Old/Middle R. calc. -164 146 -1,354 -4,912 -4,693 -5,945 -5,221 -4,877 -4,978 -4,960 -3,536 -5,040
Computed DOI 30476 9516 7900 6507 4002 3009 4067 4572 6767 9728 11400 12379Excess Outflow 19079 1610 0 0 0 0 65 67 2261 3725 0 976 % Export/Inflow 8% 11% 13% 35% 40% 54% 54% 52% 47% 41% 29% 34% % Export/Inflow std. 35% 35% 35% 65% 65% 65% 65% 65% 65% 65% 45% 35%
Hydrology
Trinity Shasta Folsom New MelonesWater Year Inflow (TAF) 627 3,621 2,352 972Year to Date + Forecasted % of mean 52% 65% 86% 92%
4/18/2018

Estimated CVP Operations Mar 50% Exceedance
StoragesFederal End of the Month Storage/Elevation (TAF/Feet)
Apr May Jun Jul Aug Sep Oct Nov Dec Jan Feb MarTrinity 1844 1878 1860 1773 1659 1514 1381 1343 1330 1360 1425 1535 1629
Elev. 2332 2331 2325 2316 2304 2293 2290 2288 2291 2297 2306 2314Whiskeytown 207 238 238 238 238 238 230 206 206 206 206 206 206
Elev. 1209 1209 1209 1209 1209 1207 1199 1199 1199 1199 1199 1199Shasta 3880 4167 4117 3801 3266 2874 2647 2552 2601 2792 3198 3682 4240
Elev. 1054 1052 1040 1019 1002 991 987 989 998 1016 1036 1056Folsom 817 823 946 831 660 598 538 489 460 449 477 530 595
Elev. 452 463 452 435 428 421 415 411 410 414 420 428New Melones 2019 1999 2017 2021 1961 1898 1857 1815 1832 1855 1887 1941 1918
Elev. 1052 1054 1054 1049 1043 1039 1035 1037 1039 1042 1047 1045San Luis 876 804 582 389 200 97 150 268 449 656 801 918 966
Elev. 512 481 454 428 414 436 462 493 524 524 536 543Total 9909 9760 9052 7984 7219 6802 6673 6878 7318 7994 8812 9554
State End of the Month Reservoir Storage (TAF)Oroville
San Luis 898 844 716 627 563 544 685 829 974 1131 985 1021 1062Total San Luis (TAF) 1774 1648 1297 1015 763 642 835 1097 1423 1787 1786 1939 2028
Monthly River Releases (TAF/cfs)
Trinity TAF 36 92 47 28 53 52 23 18 18 18 17 18cfs 600 1,498 783 450 857 870 373 300 300 300 300 300
Clear Creek TAF 13 13 17 9 9 9 12 12 12 15 11 12cfs 218 216 288 150 150 150 200 200 200 240 200 200
Sacramento TAF 268 461 625 799 645 476 369 268 200 200 278 307cfs 4500 7500 10500 13000 10500 8000 6000 4500 3250 3250 5000 5000
American TAF 476 154 252 250 136 132 123 119 123 123 208 246cfs 8000 2500 4229 4067 2217 2226 2007 2000 2000 2000 3750 4000
Stanislaus TAF 83 96 56 18 18 18 49 12 12 14 13 93cfs 1400 1555 940 300 300 300 797 200 200 232 236 1521
Feather TAF 208 92 149 246 246 119 108 104 108 108 97 108cfs 3500 1500 2500 4000 4000 2000 1750 1750 1750 1750 1750 1750
Trinity Diversions (TAF)Apr May Jun Jul Aug Sep Oct Nov Dec Jan Feb Mar
Carr PP 35 24 71 84 85 76 26 25 9 0 2 35Spring Crk. PP 15 25 60 75 75 75 40 20 12 20 35 60
Delta Summary (TAF)Apr May Jun Jul Aug Sep Oct Nov Dec Jan Feb Mar
Tracy 129 74 219 273 273 261 265 254 260 205 215 221USBR Banks 0 0 0 24 24 24 0 0 0 0 0 0Contra Costa 12.7 12.7 9.8 11.1 12.7 14.0 16.8 18.4 18.3 14.0 14.0 12.7
Total USBR 142 86 229 308 310 299 282 272 278 219 229 234State Export 105 18 106 141 183 261 298 275 260 50 215 187
Total Export 247 105 335 449 493 560 580 547 538 269 444 421COA Balance 25 25 0 0 16 153 230 224 224 224 224 224
Old/Middle River Std.Old/Middle R. calc. -483 281 -3,941 -5,605 -6,217 -7,257 -6,923 -6,927 -6,577 -3,086 -4,826 -3,440
Computed DOI 33838 13388 7900 6507 4002 3009 4002 4505 8329 17569 23954 25849Excess Outflow 22441 4441 0 0 0 0 0 0 3823 11566 12553 14445 % Export/Inflow 10% 9% 33% 40% 50% 62% 62% 62% 50% 20% 25% 20% % Export/Inflow std. 35% 35% 35% 65% 65% 65% 65% 65% 65% 65% 45% 35%
Hydrology
Trinity Shasta Folsom New MelonesWater Year Inflow (TAF) 539 3,864 2,536 1080Year to Date + Forecasted % of mean 45% 70% 93% 102%
4/18/2018

April 18, 2018
Upper Sacramento River – April 2018 Preliminary Temperature Analysis Summary of Temperature Results by Month (Monthly Average Temperature °F)
Initial
Compliance Location (°F DAT)
APR MAY JUN JUL
AUG SEP
OCT Late Sep-
Oct
Uncertainty
Estimation
March 90%-Exceedance Outlook – 10% Historical Meteorology
Keswick Dam KWK 52.8 52.0 52.5 53.4 53.9 54.2 52.7 54 - 57
Sac. R. abv Clear Creek CCR 53.0 52.6 53.1 54.0 54.3 54.5 52.6 54 - 58
Balls Ferry BSF 55.3 56.0 56.0 56.0 56.0 56.0 53.7 55 - 59
March 90%-Exceedance Outlook – 50% Historical Meteorology
Keswick Dam KWK 52.3 52.4 52.9 53.8 54.0 53.9 52.7 53 - 56
Sac. R. abv Clear Creek CCR 52.3 52.9 53.4 54.2 54.4 54.1 52.4 54 - 57
Balls Ferry BSF 54.1 56.0 56.0 56.0 56.0 55.5 53.0 55 - 58
March 50%-Exceedance Outlook – 10% Historical Meteorology
Keswick Dam KWK 52.9 51.7 52.4 53.4 53.9 54.1 52.7 54 - 57
Sac. R. abv Clear Creek CCR 53.1 52.4 53.1 54.0 54.3 54.4 52.6 54 - 58
Balls Ferry BSF 55.4 56.0 55.9 56.0 56.0 56.0 53.6 55 - 59
March 50%-Exceedance Outlook – 50% Historical Meteorology
Keswick Dam KWK 52.3 52.0 52.7 53.8 54.0 54.6 51.7 53 - 55
Sac. R. abv Clear Creek CCR 52.3 52.7 53.3 54.2 54.3 54.7 51.5 53 - 57
Balls Ferry BSF 54.3 56.0 55.9 56.0 56.0 56.0 52.2 54 - 58
* The HEC5Q model output is displayed above for the months April through October. Based on past analysis, the temperature model
does not perform well in late September and October. One factor is that the modeled release temperatures are cooler than has
historically been achieved when all release is through the side gates (lowest gates), especially when there’s a large temperature
gradient between the pressure relief gates (PRG) and the side gates. For the months of September and October, an uncertainty

estimate is provided based on the Fall Temperature Index (graphics below). This is based on a historical relationship between end-of-
September Lake Shasta Volume less than 56°F and likely downstream temperature performances for the early fall months. The range
represents the 90% confidence interval based on that data. Refinement of the concepts for those estimates is underway.
Temperature Model Inputs, Assumptions, Limitations and Uncertainty:
1. The latest available profiles for Shasta, Trinity, and Whiskeytown were taken on April 3, April 4, and April 3 respectively. Model
results are sensitive to initial reservoir temperature conditions and the model performs best under highly stratified conditions. The
April 2018 temperature profile does not yet exhibit conditions for ideal model computations (still nearly isothermal conditions
although warming will initiate stratification). The model performs well after the reservoir stratifies, typically in late spring. The
concern this year is assuming over or under estimations with variable hydrologic and meteorological conditions and not capturing the
stratification with sufficient detail to project.
2. Guidance on forecasted flows from the creeks (e.g., Cow, Cottonwood, Battle, etc.) between Keswick Dam and Bend Bridge are
not available beyond 5 days. Creek flows developed from the historical record that most closely reflects current conditions were used
for all model runs. The resulting low creek flows cause significant additional warming in the upper Sacramento River during spring.
3. Operation is based on the April 2018 Operation Outlooks and DWR Bulletin 120 inflow projections (monthly flows, reservoir
release, and end-of-month reservoir storage) for the 90%- and 50%-exceedances. Trinity Lake inflows are updated with the CNRFC
90% runoff exceedance for the 90% runoff exceedance studies.
4. Although mean daily flows and releases are temperature model inputs, they are based on the mean monthly values from the
operation outlooks. Mean daily flow patterns are user defined and are generalized representations. It is important to note that these
outlooks do not suggest a certain actual future outcome, but rather the statistical likelihood of an event occurring, including, but not
limited to, projected storage and releases. Thus, the outlooks do not provide exact end of month storages or flow rates but general
projections that will likely fall within the range of uncertainty based on the different hydrologic runoff conditions between the 90%
and 50% runoff exceedance hydrology.
5. Cottonwood Creek flows, Keswick to Bend Bridge local flows, and ACID diversions are mean daily synthesized flows based on the
available historical record for a 1922-2002 study period. Inflows were adjusted to a 95% historical exceedance for both the 90% and
50% runoff exceedance studies.
6. Meteorological inputs represent NOAA NWS Climate Prediction Center L3MTO (based on historical 1961 – 2005 monthly mean
equilibrium temperature exceedance at 10% and 50% patterned after like months on a 6-hour time-step). Assumed inflow temperature
remain static inputs and do not vary with the assumed meteorology. Efforts to extend to more recent years are under way.
7. Meteorology, as well as the flow volume and pattern, significantly influences reservoir inflow temperatures and downstream
tributary temperatures; and consequently, the development of the cold-water pool during winter and early spring.
8. Modified model coefficients more closely represent actual Keswick Dam temperatures. As a result, temperature predictions
downstream of Keswick Dam are likely to be warmer than actual. Model re-calibrations efforts are underway.

Model Run Date April 16, 2018
Temperature Analysis Results:
Modeling runs explore Sacramento River compliance performance above Clear Creek confluence and Balls Ferry locations by varying
hydrology and meteorology. The temperature results for the Sacramento River between Keswick Dam and Balls Ferry are shown in
Figures 1 through 4. The fall uncertainty estimation relationship between end-of-September lake volume below 56°F and a Balls
Ferry compliance through fall is based on the Figure 5.
Model Run End of September
Cold Water Pool
<56°F (TAF)
First Side Gate Full Side Gates
90% Hydro, 10%L3MTOMet 558 9/7 10/5
90% Hydro, 50% L3MTOMet 699 9/25 NA
50% Hydro, 10% L3MTOMet 587 9/5 10/4
50% Hydro, 50% L3MTOMet 778 10/4 10/26

Figure 1
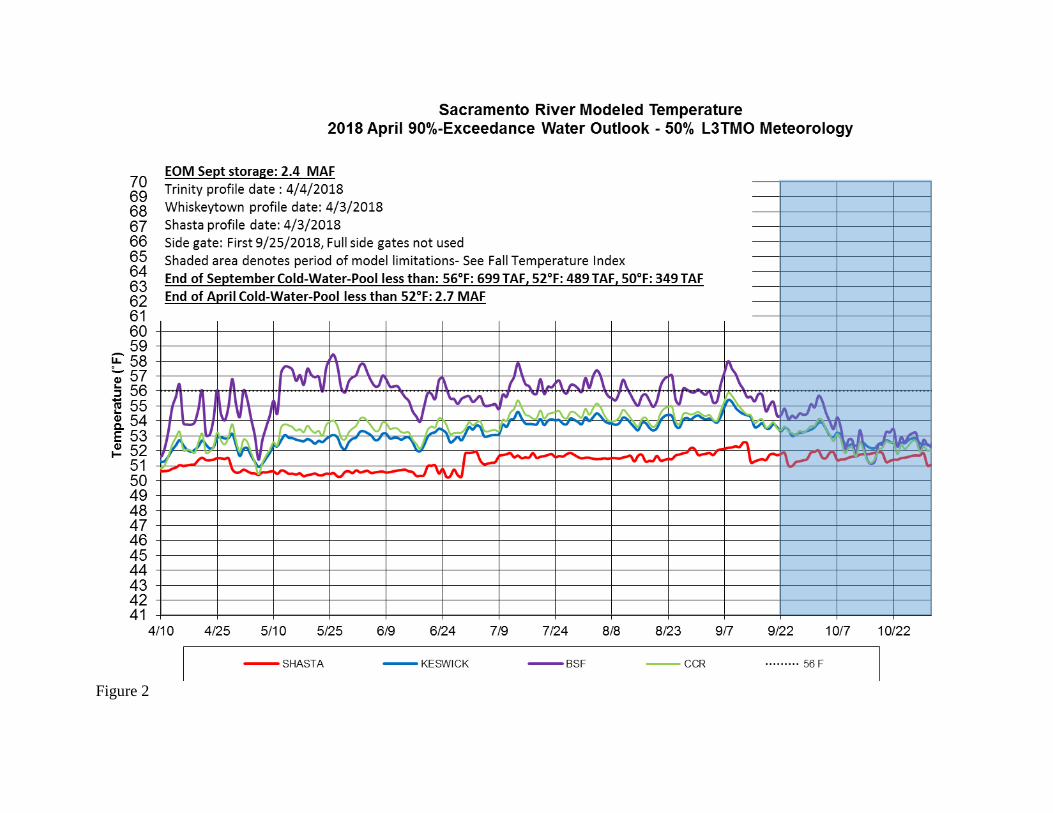
Figure 2

Figure 3

Figure 4

Figure 5 Model Performance and Fall Temperature Index:
1. Based on past analyses, the temperature model does not perform well in late September and October. One factor is that the modeled release
temperatures are cooler than has historically been achieved when all release is through the side gates (lowest gates), especially when there’s a large
temperature gradient between the pressure relief gates (PRG) and the side gates.
2. Based on historical records, the end-of-September Lake Shasta volume below 56˚F can be used as an indicator of fall water temperature in the
river reach to Balls Ferry.
3. Based on these records and estimates, the index below illustrates a range of uncertainty in the ability to meet for river temperatures not to
exceed 56 ˚F downstream based on the end-of-September lake volume less than 56˚F; see charts below.
4. Refinement of these estimates and concepts is currently underway.