estadístico year book 2009 - inac.uy · ingreso promedio fue de 2.486 USD ton pc, que es un valor...
23
anuario estadístico 2009 Instituto Nacional de Carnes National Meat Institute Dirección de Información y Análisis Económico Economic Analysis & Information Division ESPAÑOL/ENGLISH STOCK / LIVESTOCK FAENA / SLAUGHTER year book PRECIOS Y VALORES / PRICES AND VALUES EXPORTACIÓN / EXPORTS U r u g u a y
Transcript of estadístico year book 2009 - inac.uy · ingreso promedio fue de 2.486 USD ton pc, que es un valor...

anuarioestadístico
2009
Instituto Nacional de CarnesNational Meat Institute
Dirección de Información y Análisis EconómicoEconomic Analysis & Information Division
ESPAÑOL/ENGLISH
STOCK / LIVESTOCK
FAENA / SLAUGHTER
EXPORTACIÓN / EXPORTS
year book
PRECIOS Y VALORES / PRICES AND VALUES
EXPORTACIÓN / EXPORTS
U r u g u a y

INSTITUTO NACIONAL DE CARNESNATIONAL MEAT INSTITUTEDirección de Información y Análisis EconómicoEconomic Analysis & Information Division
Rincón 545/549 - C.P. 11.000Montevideo – UruguayTels.: (598-2) 916 0430 (598-2) 916 1989Fax: (598-2) 917 0874 (598-2) 916 [email protected]@inac.gub.uywww.inac.gub.uy
IMPORTANTE: La reproducción total o parcial de la información contenida en esta publicación es libre, bajo condición de indicar la fuente.
IMPORTANT: Total or partial reproduction of information held within this publication is free, conditioned to mentioning the source.
Diseño y Producción Gráfi ca:
grafi [email protected]
Impreso en Mastergraf S.R.L.Depósito Legal Nº 350.207/09Comisión del Papel.Edición amparada al Decreto 218/96.


Una rica historia de respeto a la naturaleza.
Nuestra Herencia – Nuestro Legado
A rich history of respect for nature.
Our heritage - Our legacy.
Carnes uruguayas. De la naturaleza a su mesa.Uruguayan meat. From nature to consumer.

STOCK
El stock de bovinos registrado al 30 de junio de 2009 alcanzó la cifra de 11.736 miles de cabe-zas, lo cual signifi ca un 0,3% superior al año 2008. Los ovinos decrecen por tercer año conse-cutivo, llegando a 8.637 miles de cabezas en stock lo que representa una disminución del 8% respecto al año anterior.
FAENA
• Faena por especie
La faena industrial de bovinos fue de 2.325.671 cabezas. Esta cifra es un 5% superior a la fae-na de bovinos del año anterior (2008) donde se registró un total de 2.213.277 cabezas
La faena industrial de ovinos fue de 2.132.767 cabezas. Esta cifra es casi un 20% superior a la faena de ovinos del año anterior (2008) donde se registró un total de 1.779.705 cabezas.
Las faenas de equinos (39.088 cabezas) y de porcinos (168.164 cabezas) se mantuvieron en niveles históricos.
La sequía que sufrió el país en el primer trimestre del 2009 tuvo una mayor infl uencia en la composición de la faena de bovinos que en el número global, dado que no hubo un proceso fuerte de liquidación de stock. En términos generales se puede califi car al año 2009 como de faena normal con tendencia al alza.
• Composición de la faena de bovinos
El año 2009 es atípico en la composición de la faena, fundamentalmente por el efecto de la sequía. Las pasturas estuvieron en muy mala condición en el primer trimestre del año aunque luego tuvieron una gran recuperación por la normalización del régimen de lluvias.
Los dos elementos destacables en la faena de bovinos fueron: se invierte la importancia del primer y segundo semestre en el total y también aumenta la proporción de hembras en la faena.
En el primer semestre del 2009 se faenaron 1.139.389 bovinos, cifra inferior a la registrada en el primer semestre del 2008 (1.280.347). Esta relación se invierte en el segundo semestre del 2009 donde se faenan más animales que en el segundo semestre del 2008.
El segundo elemento destacable es la alta proporción de hembras en la faena. Si se toman en conjunto las vaquillonas, vacas de 6 dientes y vacas de dentición completa, éstas representa-ron el 52.6 % de la faena en el año 2009, cifra que contrasta notoriamente con lo ocurrido
Análisis Anuario 2009
6 INAC - Anuario Estadístico - 2009
el año anterior (2008- 44.2%) y con los promedios históricos. En términos absolutos, hay una diferencia de más de 240 mil hembras faenadas este año en relación al año anterior.
Por el contrario, los novillos en la faena representaron solamente el 45.2%, lo que contrasta fuertemente con el año anterior (2008-53.4%) y con los registros históricos. En términos ab-solutos esto quiere decir que se faenaron 130 mil novillos menos que el año anterior.
Para encontrar valores similares al 2009 en cuanto a composición de la faena hay que retro-traerse al año 1989, cuando también se observó una sequía generalizada de similares carac-terísticas.
PRECIOS Y VALORES
• Precios de hacienda
Los precios promedio del total de los novillos faenados en el país fue para el 2009 de 1,12 USD/kg en pie y 2,11 USD/kg en 4ta balanza, observándose un crecimiento prácticamente durante todo el año de los valores mensuales. En el caso de las vacas (incluyendo el conjunto de vaquillonas, vacas de 6 dientes y vacas de dentición completa) los valores tuvieron un com-portamiento similar a lo largo del año alcanzando un valor promedio de 0.89 USD/kg en pie y 1,80 USD/kg en 4ta balanza.
Los ovinos faenados en plantas industriales mostraron diferencias importantes entre los pre-cios obtenidos en el primer y segundo semestre del 2009. Los corderos tuvieron un creci-miento de cerca del 37% en los valores de la carne, cerrando el 2009 con un valor promedio mensual para le total de corderos de 2,43 USD/kg en gancho.
• Valor promedio del Novillo Tipo
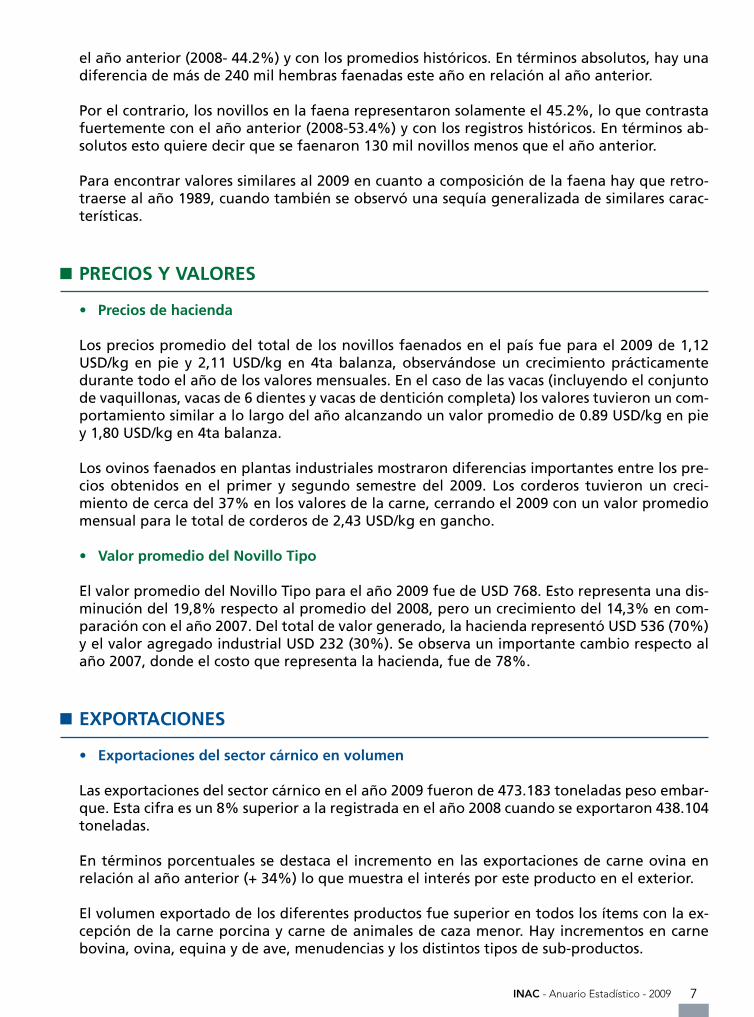
El valor promedio del Novillo Tipo para el año 2009 fue de USD 768. Esto representa una dis-minución del 19,8% respecto al promedio del 2008, pero un crecimiento del 14,3% en com-paración con el año 2007. Del total de valor generado, la hacienda representó USD 536 (70%) y el valor agregado industrial USD 232 (30%). Se observa un importante cambio respecto al año 2007, donde el costo que representa la hacienda, fue de 78%.
EXPORTACIONES
• Exportaciones del sector cárnico en volumen
Las exportaciones del sector cárnico en el año 2009 fueron de 473.183 toneladas peso embar-que. Esta cifra es un 8% superior a la registrada en el año 2008 cuando se exportaron 438.104 toneladas.
En términos porcentuales se destaca el incremento en las exportaciones de carne ovina en relación al año anterior (+ 34%) lo que muestra el interés por este producto en el exterior.
El volumen exportado de los diferentes productos fue superior en todos los ítems con la ex-cepción de la carne porcina y carne de animales de caza menor. Hay incrementos en carne bovina, ovina, equina y de ave, menudencias y los distintos tipos de sub-productos.
7INAC - Anuario Estadístico - 2009

• Exportaciones del sector cárnico en valores
En el año 2009 se exportaron productos cárnicos por un valor total de 1.222.468 miles de USD. Esta cifra es la más alta en la historia del país, con la excepción del año anterior (2008) donde se totalizaron 1.478.500 miles de USD1.
En relación al año anterior hay una disminución del ingreso cercana al 17,3% en el total de exportaciones del sector cárnico, por efecto de la crisis económica internacional que alteró completamente los mercados a partir de setiembre del 2008.
En cuanto a la composición de ingresos el gran cambio se da en la caída de los ingresos de la carne bovina que pasa de 1,222 millones de USD en el 2008 a 971 millones de USD en el 2009. Por el contrario, la carne ovina aumenta sus ingresos por exportaciones en más del 15%, pa-sando de casi 71 millones de USD en el 2008 a más de 81 millones de USD en el 2009.
La carne bovina fue el producto que más se favoreció con el alza de precios del 2008 y lógica-mente también fue la que más sintió el cambio de contexto a partir de setiembre del 2008. La carne ovina no se benefi ció tanto en el momento de las subas y no sufrió tanto la reversión de los mercados en la caída de valores.
• Comparación de desempeño en exportaciones de carne bovina y ovina
En el año 2009 se exportaron 390.667 toneladas equivalente peso canal de carne bovina (ton pc). Esto es un 3.9% superior a las 376.106 ton pc de carne bovina exportadas en el 2008. El ingreso promedio fue de 2.486 USD ton pc, que es un valor 23.5% inferior al del 2008 (3.249 USD ton pc) pero un 17,3% superior al valor promedio del 2007 (2.120 USD ton pc)2.
El destino principal para la carne bovina (en volumen) ha continuado siendo la Federación Rusa con el 26.7%, seguido por la Unión Europea con el 23.3%. En relación al año 2008 hay un descenso de la Federación Rusa, un ligero incremento de la Unión Europea y de Venezuela como los fenómenos más destacables.
En relación a las exportaciones de carne ovina, en el 2009 totalizaron 31.926 ton pc que sig-nifi can casi un 30% más que el año anterior (2008- 24.730 ton pc). El ingreso promedio fue de 2.557 USD ton pc, lo que signifi ca un 10% menos que el año anterior (2.861 USD ton pc). Como se observa se ha retornado al tendencia histórica donde el ingreso promedio por ex-portaciones de carne ovina era superior al ingreso promedio de carne bovina.
En relación a los mercados para carne ovina lo más destacado es el notorio incremento de Jordania que pasa del 2.8% del volumen en el 2008 al 17.4% en el 2009. La Federación Rusa incrementa también su participación llegando casi al 7% y hay ligeros aumentos en Arabia Saudita y otros destinos. Los dos destinos principales (Unión Europea y el Mercosur) descien-den su participación porcentual pasando a 23.8% y 21.2% respectivamente, lo que muestra una estructura más diversifi cada.
1 Debe recordarse que el valor promedio del dólar (mensual, interbancario) fue de 20,9 pesos por dólar en el 2008 y de 22,6 pesos por dólar en el 2009, por lo que en pesos la diferencia es menor.
2 El dólar tuvo importantes fl uctuaciones en los últimos años. Las cotizaciones medias (mensual, interbancario) fueron: 2007-23.5; 2008-20.9; 2009-22.6.
8 INAC - Anuario Estadístico - 2009

Yearbook Analysis 2009
STOCK
Bovine stock registered on June 30, 2009, reached 11,736,000 heads, 0.3% higher than 2008. The amount of sheep decreased for the third year running, reaching 8,637,000 heads, repre-senting a decrease of 8% in respect to 2008.
SLAUGHTER
Slaughter by species
Industrial slaughter of cattle reached 2,325,671 heads. This fi gure is 5% higher than the cattle slaughter of the previous year (2008) when a total of 2,213,277 heads were slaughtered.
Industrial slaughter of sheep reached 2,132,767 heads. This fi gure is almost 20% higher that the sheep slaughter of the previous year (2008) when a total of 1,779,705 heads were slaughtered.
Slaughter of horses (39,088 heads) and of pigs (168,164 heads) remained at historical levels.
The drought suffered by the country during the fi rst quarter of 2009 affected the composi-tion of the cattle slaughter to a greater extent than it affected the global number of heads slaughtered since there was no strong process of stock liquidation. In general, the 2009 had normal fi gures of slaughter showing an increasing trend.
Composition of cattle slaughter
The composition of slaughter in 2009 was atypical mostly as a consequence of the drought. Pastures were in bad conditions during the fi rst quarter of the year, although later they reco-vered to a great extent owing to the fact that the rainfall regime returned to normal.
The two outstanding elements of cattle slaughter were: the importance of the fi rst and se-cond semester of the year in the total slaughter fi gure was reversed, and the total proportion of females increased.
During the fi rst semester of 2009, 1,139,389 heads were slaughtered, fi gure that is lower to that of the fi rst semester of 2008 (1,280,347). This relationship was reversed in the second half of 2009, when more animals were slaughtered than during the second half of 2008.
The second outstanding element is the high proportion of females slaughtered. If heifers, 6-toothed cows and cows with full dentition are considered jointly, the accounted for 52.6%
9INAC - Anuario Estadístico - 2009

of the slaughter in 2009, a number which signifi cantly contrasts with what occurred in the previous year (2008 – 44.2%) and with the historical averages. In absolute terms, there is a difference of over 240 thousand females more slaughtered this year than the previous year.
On the contrary, steers accounted for only 45.2% of the slaughter, which strongly contrasts with the previous year (2008 – 53.4%) and with the historical averages. In absolute terms, this means that 130 thousand less steers were slaughtered than the previous year.
To fi nd fi gures similar to those of 2009 as to the composition of slaughter it is necessary to go back to 1989, when there was also a generalized drought of similar characteristics.
PRICES AND VALUES
Cattle prices
Average prices of the total steers slaughtered in the country was 1.12 USD/kg liveweight and 2.11 USD/kg at the fourth scale, showing a monthly increase during all the year. In the case of cows (including heifers, 6-toothed cows and cows with full dentition) the prices had a similar behaviour during the year reaching an average price of 0.89 USD/kg liveweight and 1.80 USD/kg at the fourth scale.
Slaughter of sheep in industrial plants showed important differences between the prices ob-tained in the fi rst and second semester of 2009. Lambs had an increase of 37% in meat prices, closing 2009 with an average monthly price of 2.43 USD/kg for the total amount of lambs.
Average Standard Steer Price
The average Standard Steer Price for 2009 was USD 768. This represents a decrease of 19.8% with respect to 2008, but is 14.3% higher than that of 2007. Cattle represents USD 536 (70%) of the total generated price, and the industrial added price USD 232 (30%). There is an impor-tant change with regard to 2007, where the cost represented by the cattle was 78%.
EXPORTS
Exports of the meat sector expressed in volume
Considered in shipped weight tons, exports of the meat sector in 2009 were 473,183 tons. This fi gure is 8% higher than that of 2008, when 438,104 tons were exported.
In terms of percentage, the increase of sheep meat export in regard with the previous year (+34%) is to be pointed out, which shows the interest existing abroad for this product.
The volume of the different products exported was larger for all items, except for pig meat and small game meat. The volume of beef, sheep meat, horse meat, poultry, offal and bypro-ducts increased.
10 INAC - Anuario Estadístico - 2009

Exports of the meat sector expressed in value
In 2009, meat products were exported for a total value of 1,222,468 thousand dollars. This fi gure is the highest in the history of the country, except for that of the previous year (2008), when exports reached a total of 1,478.500 thousand dollars1.
Compared to the previous year, meat exports income fell by approximately 17.3%, due to the effect of the global economic crisis that completely altered markets as of September 2008.
As to the composition of income, the greatest change occurred in the fall of beef income, which went from 1,222 million dollars in 2008 to 971 million dollars in 2009. On the other hand, sheep meat exports income increased in more than 15%, going from nearly 971 million dollars in 2008 to more than 81 million dollars in 2009.
Beef was the product that most benefi ted from the rising prices of 2008 and logically, the one which most suffered the change of context as of September 2008. Sheep meat did not benefi t that much from increasing prices, and therefore, it was not so much affected by the fall of prices in the different markets.
Comparison of beef and sheep meat exports performance
In 2009, 390,667 carcass weight equivalent tons of beef were exported (cw tons). This is 3.9% higher than the 376.106 cw tons of beef exported in 2008. The average income was of 2,486 USD/cw ton, which is 23.5% lower than that of 2008 (3,249 USD/cw ton) but 17.3% higher than the average value of 2007 (2,120 USD/cw ton)2.
The main destination for beef (in volume) has continued to be the Russian Federation with 26.7%, followed by the European Union with 23.3%. In comparison with 2008, the volume imported by the Russian Federation fell, and there was a slight increase of imports from the European Union and from Venezuela as noticeable facts.
As regards to sheep meat exports, in 2009 they reached 31,926 cw tons, which means there was almost a 30% increase in comparison to the previous year (2008 – 24,730 cw tons). The average income was of 2,557 USD /cw tons, which means it was 10% lower than the previous year (2,861 USD / cw ton). As it is noticeable, the country has returned to the historical trend by which the average income of sheep meat exports was higher than the beef exports ave-rage income.
In regard to markets for sheep meat, the most outstanding fact is the signifi cant increase of imports from Jordan, which went from 2.8% of the volume in 2008 to 17.4% in 2009. The Rus-sian Federation also increased its share reaching almost to 7%, and Saudi Arabian and other destinations also showed slight increases. The percentage share of the two main destinations (European Union and Mercosur) fell to 23.8% and 21.2% respectively, which shows a more diversifi ed market structure.
1 It should be remembered that the average value of US dollar (monthly, Interbank) was 20,9 pesos per US dollar in 2008 and 22,6 pesos per US dollar in 2009, whereby the difference in UY pesos is less.
2 The US dollar has suffered signifi cant fl uctuations in the last years. Average quotations (monthly, interbank) were: 2007 – 23,5; 2008 – 20,9; 2009 – 22,6.
11INAC - Anuario Estadístico - 2009

CONTEENNIDO
Cuadro 1.1 – Stock bovino – existencias al 30 de junio – 2007/2009 ..................................................................................... 21
Cuadro 1.2 – Stock ovino – existencias al 30 de junio – 2007/2009 ....................................................................................... 22
Gráfi co 1.1 – Existencias de bovinos y ovinos – al 30 de junio – 2007/2009 .......................................................................... 23
Gráfi co 1.2 – Existencias de bovinos y ovinos – al 30 de junio – 2000/2009 .......................................................................... 23
Gráfi co 1.3 – Existencias de bovinos – al 30 de junio – 2000/2009 ........................................................................................ 23
Gráfi co 1.4 – Existencias de ovinos – al 30 de junio – 2000/2009 .......................................................................................... 23
1. STOCK ............................................................................................................................ 19
2. FAENA .............................................................................................................................25
Cuadro 2.1 – Faena de bovinos – por mes – 2007/2009 ......................................................................................................... 27
Gráfi co 2.1 – Faena de bovinos – por mes – 2007/2009 ......................................................................................................... 27
Cuadro 2.2 – Faena de bovinos – por categoría – por año – 2000/2009 ................................................................................. 28
Gráfi co 2.2 – Faena de bovinos – por año – 2000/2009.......................................................................................................... 28
Gráfi co 2.3 – Participación porcentual de la faena de novillos y vacas – 2000/2009 (líneas) .................................................. 28
Gráfi co 2.4 – Participación porcentual de la faena de novillos y vacas – 2000/2009 (barras apiladas) ................................... 28
Cuadro 2.3 – Faena de ovinos – por mes – 2007/2009 ........................................................................................................... 29
Gráfi co 2.5 – Faena de ovinos – por mes – 2007/2009 ........................................................................................................... 29
Cuadro 2.4 – Faena de ovinos – por categoría – por año – 2000/2009 ................................................................................... 30
Gráfi co 2.6 – Faena de ovinos – por año – 2000/2009............................................................................................................ 30
Gráfi co 2.7 – Participación porcentual de ovejas, capones y corderos – 2000/2009 (líneas) .................................................. 30
Gráfi co 2.8 – Participación porcentual de ovejas, capones y corderos – 2000/2009 (barras apiladas) ................................... 30
Cuadro 2.5 – Faena de porcinos y equinos – por mes – 2007/2009 ....................................................................................... 31
Gráfi co 2.9 – Faena de porcinos y equinos – 2007/2009 ........................................................................................................ 31
Cuadro 2.6 – Faena de porcinos y equinos – por categoría – por año – 2000/2009 ............................................................... 32
Gráfi co 2.10 – Faena de porcinos y equinos – por año – 2000/2009 ........................................................................................ 32
Cuadro 2.7 – Faena de bovinos – por edad – por mes – 2009 ................................................................................................ 33
Gráfi co 2.11 – Faena de novillos – por edad – por mes – 2009 ................................................................................................ 34
Gráfi co 2.12 – Faena de vacas – por edad – por mes – 2009 ................................................................................................... 34
Gráfi co 2.13 – Faena de novillos y vacas – por mes – 2009 ..................................................................................................... 34
Gráfi co 2.14 – Participación porcentual de la faena de bovinos – 2009 .................................................................................... 34
Cuadro 2.8 – Faena de bovinos – por edad – por año – 2000/2009 ........................................................................................ 35
Gráfi co 2.15 – Faena de novillos – por edad – por año – 2000/2009 ........................................................................................ 35
Gráfi co 2.16 – Faena de vacas – por edad – por año – 2000/2009 ........................................................................................... 35
Cuadro 2.9 – Faena de ovinos – por categoría – por mes – 2009 ........................................................................................... 36
Gráfi co 2.17 – Faena de ovinos – por categoría – por mes – 2009 ........................................................................................... 36
Cuadro 2.10 – Faena de porcinos y equinos – por categoría – por mes – 2009........................................................................ 37
Gráfi co 2.18 – Faena de porcinos – por categoría – por mes – 2009 ........................................................................................ 37
Gráfi co 2.19 – Faena de equinos – por categoría – por mes – 2009 ......................................................................................... 37
Cuadro 2.11 – Faena de bovinos – por establecimiento – 2009 ................................................................................................ 38
12 INAC - Anuario Estadístico - 2009

CONTTEENIDO
Cuadro 2.12 – Faena de ovinos – por establecimiento – 2009 .................................................................................................. 39
Cuadro 2.13 – Faena de porcinos y equinos – por establecimiento – 2009 .............................................................................. 40
Cuadro 2.14 – Peso promedio de haciendas bovinas – novillos y vacas – 2009 ....................................................................... 41
Cuadro 2.15 – Peso promedio de haciendas bovinas – terneros y toros – 2009 ...................................................................... 41
Cuadro 2.16 – Peso promedio de haciendas bovinas – promedio especie bovina .................................................................... 42
Gráfi co 2.20 – Peso promedio de haciendas bovinas en 4ª balanza (puesto 4) – 2009 ............................................................ 42
Cuadro 2.17 – Peso promedio de haciendas ovinas – ovejas y capones – 2009 ....................................................................... 43
Cuadro 2.18 – Peso promedio de haciendas ovinas – borregos y corderos – 2009 ................................................................. 43
Cuadro 2.19 – Peso promedio de haciendas ovinas – carneros y promedio especie ovina ....................................................... 44
Gráfi co 2.21 – Peso promedio de haciendas ovinas en gancho – 2009 .................................................................................... 44
Cuadro 2.20 – Peso promedio de haciendas porcinas – cerdos y lechones – 2009 .................................................................. 45
Cuadro 2.21 – Peso promedio de haciendas porcinas – promedio especie porcina – 2009 ...................................................... 45
Gráfi co 2.22 – Peso promedio de haciendas porcinas en gancho – 2009 ................................................................................. 46
3. PRECIOS Y VALORES ......................................................................................................47
Cuadro 3.1 – Precio promedio de haciendas bovinas – novillos en pie – 2009....................................................................... 49
Cuadro 3.2 – Precio promedio de haciendas bovinas – novillos en 4ª balanza (puesto 4) – 2009 .......................................... 49
Cuadro 3.3 – Precio promedio de haciendas bovinas – vacas en pie – 2009 .......................................................................... 50
Cuadro 3.4 – Precio promedio de haciendas bovinas – vacas en 4ª balanza (puesto 4) – 2009 ............................................. 50
Cuadro 3.5 – Precio promedio de haciendas bovinas – terneros en pie – 2009 ...................................................................... 51
Cuadro 3.6 – Precio promedio de haciendas bovinas – terneros en 4ª balanza (puesto 4) – 2009 ......................................... 51
Cuadro 3.7 – Precio promedio de haciendas bovinas – toros en pie – 2009........................................................................... 52
Cuadro 3.8 – Precio promedio de haciendas bovinas – toros en 4ª balanza (puesto 4) – 2009 .............................................. 52
Cuadro 3.9 – Precio promedio de haciendas bovinas – promedio especie bovina – 2009 ...................................................... 53
Cuadro 3.10 – Precio promedio de haciendas ovinas – ovejas – 2009 ..................................................................................... 54
Cuadro 3.11 – Precio promedio de haciendas ovinas – capones – 2009 .................................................................................. 54
Cuadro 3.12 – Precio promedio de haciendas ovinas – borregos – 2009 ................................................................................. 55
Cuadro 3.13 – Precio promedio de haciendas ovinas – corderos – 2009 ................................................................................. 55
Cuadro 3.14 – Precio promedio de haciendas ovinas – carneros – 2009 ................................................................................. 56
Cuadro 3.15 – Precio promedio de haciendas ovinas – promedio especie ovina – 2009 .......................................................... 56
Cuadro 3.16 – Precio promedio de haciendas porcinas – cerdos y cachorros – 2009 .............................................................. 57
Cuadro 3.17 – Precio promedio de haciendas porcinas – lechones – 2009 .............................................................................. 57
Cuadro 3.18 – Precio promedio de haciendas porcinas – promedio especie porcina – 2009 ................................................... 58
Gráfi co 3.1 – Precio promedio de haciendas bovinas en 4ª balanza (puesto 4) – 2009 .......................................................... 59
Gráfi co 3.2 – Precio promedio de haciendas ovinas en gancho – 2009 .................................................................................. 59
Gráfi co 3.3 – Precio promedio de haciendas porcinas en gancho – 2009 ............................................................................... 59
Cuadro 3.19 – Valor promedio del novillo tipo – 2007/2009..................................................................................................... 60
Gráfi co 3.4 – Evolución mensual del valor promedio del novillo tipo, valor de hacienda y valor agregado industrial – 2007/2009 ............................................................................... 60
13INAC - Anuario Estadístico - 2009

Cuadro 4.1 – Exportaciones totales del sector cárnico – por mes – 2007/2009 ..................................................................... 63
Gráfi co 4.1 – Exportaciones totales del sector cárnico – por mes – 2007/2009 ..................................................................... 63
Cuadro 4.2 – Exportaciones totales del sector cárnico – por producto – 2007/2009 .............................................................. 64
Gráfi co 4.2 – Exportaciones totales del sector cárnico – por producto – 2007/2009 .............................................................. 64
Cuadro 4.3 – Exportaciones totales del sector cárnico – por año – 2000/2009 ...................................................................... 65
Gráfi co 4.3 – Exportaciones de carne bovina – por año – 2000/2009 ..................................................................................... 65
Gráfi co 4.4 – Exportaciones de carne ovina – por año – 2000/2009 ....................................................................................... 65
Cuadro 4.4 – Exportaciones de carne bovina – por mes – 2007/2009 .................................................................................... 66
Gráfi co 4.5 – Exportaciones de carne bovina – por mes – 2007/2009 .................................................................................... 67
Cuadro 4.5 – Exportaciones de carne bovina – por producto – 2007/2009 ............................................................................ 68
Cuadro 4.6 – Exportaciones de carne ovina – por producto – 2007/2009 .............................................................................. 71
Cuadro 4.7 – Exportaciones totales del sector cárnico – por exportador ................................................................................ 73
Cuadro 4.8 – Exportaciones de carne bovina – por destino – volumen (peso embarque), Tons. – 2007/2009 ....................... 76
Cuadro 4.9 – Exportaciones de carne bovina – por destino – volumen (peso canal), Tons. – 2007/2009 ............................... 82
Cuadro 4.10 – Exportaciones de carne bovina – por destino – importe FOB, miles de dólares – 2007/2009 ............................ 88
Gráfi co 4.6 – Exportaciones de carne bovina – por destino – 2009 ........................................................................................ 94
Cuadro 4.11 – Exportaciones de carne ovina – por destino – volumen (peso embarque), Tons. – 2007/2009 ......................... 96
Cuadro 4.12 – Exportaciones de carne ovina – por destino – volumen (peso canal), Tons. – 2007/2009 ............................... 100
Cuadro 4.13 – Exportaciones de carne ovina – por destino – importe FOB, miles de dólares – 2007/2009 ............................ 104
Cuadro 4.14 – Exportaciones de carne equina – por destino – volumen (peso embarque), Tons. – 2007/2009 ..................... 108
Cuadro 4.15 – Exportaciones de carne equina – por destino – volumen (peso canal), Tons. – 2007/2009 ............................. 109
Cuadro 4.16 – Exportaciones de carne equina – por destino – importe FOB, miles de dólares – 2007/2009 .......................... 110
Cuadro 4.17 – Exportaciones de carne porcina – por destino – volumen (peso embarque), Tons. – 2007/2009 .................... 111
Cuadro 4.18 – Exportaciones de carne porcina – por destino – importe FOB, miles de dólares – 2007/2009 ........................ 112
Cuadro 4.19 – Exportaciones de carne de ave – por destino – volumen (peso embarque), Tons. – 2007/2009 ..................... 113
Cuadro 4.20 – Exportaciones de carne de ave – por destino – importe FOB, miles de dólares – 2007/2009 .......................... 115
Cuadro 4.21 – Exportaciones de carne de animales de caza menor – por destino – volumen (peso embarque), Tons. – 2007/2009 ...................................................................... 117
Cuadro 4.22 – Exportaciones de carne de animales de caza menor – por destino – importe FOB, miles de dólares – 2007/2009 ........................................................................... 117
Gráfi co 4.7 – Exportaciones totales del sector cárnico – por destino – 2009 ........................................................................ 118
Cuadro 4.23 – Exportaciones totales del sector cárnico – por producto – 2009 ..................................................................... 120
SIGNOS CONVENCIONALES:
(.) Indica que la magnitud no alcanza a la mitad del último dígito utilizado.
SIGLAS: DI.CO.SE. Dirección de Contralor de Semovientes, Frutos del País, Marcas y Señales (dependiente del Ministerio de Ganadería Agricultura y Pesca).
FUENTE: La fuente de los cuadros sólo se indica en aquellos casos en que los datos no pertenecen, total o parcialmente, al Instituto Nacional de Carnes.
NOTAS: Los totales pueden no coincidir con la suma de parciales por razones de redondeo de cifras.
La participación porcentual y los ingresos promedios de exportación son calculados sobre valores en unidades de kilos y de dólares.
CONTEENNIDO
4. EXPORTACIÓN ...............................................................................................................61
14 INAC - Anuario Estadístico - 2009

CONNTTENTS
Table 1.1 – Bovine livestock – by june 30 – 2007/2009 ............................................................................21
Table 1.2 – Sheep livestock – by june 30 – 2007/2009 .............................................................................22
Chart 1.1 – Bovine and sheep livestock – by june 30 – 2007/2009 ...............................................................23
Chart 1.2 – Bovine and sheep livestock – by june 30 – 2000/2009 ...............................................................23
Chart 1.3 – Bovine livestock – by june 30 – 2000/2009 ............................................................................23
Chart 1.4 – Sheep livestock – by june 30 – 2000/2009 .............................................................................23
1. LIVESTOCK ......................................................................................................................19
2. SLAUGHTER ....................................................................................................................25
Table 2.1 – Bovine slaughter – by month – 2007/2009 .............................................................................27
Chart 2.1 – Bovine slaughter – by month – 2007/2009 .............................................................................27
Table 2.2 – Bovine slaughter – by class – by year – 2000/2009 ..................................................................28
Chart 2.2 – Bovine slaughter – by year – 2000/2009 ...............................................................................28
Chart 2.3 – Steer and cow slaughter in percentage – 2000/2009 (lines) ........................................................28
Chart 2.4 – Steer and cow slaughter in percentage – 2000/2009 (bars) ........................................................28
Table 2.3 – Sheep slaughter – by month – 2007/2009 ..............................................................................29
Chart 2.5 – Sheep slaughter – by month – 2007/2009 ..............................................................................29
Table 2.4 – Sheep slaughter – by class – by year – 2000/2009 ...................................................................30
Chart 2.6 – Sheep slaughter – by year – 2000/2009 ................................................................................30
Chart 2.7 – Ewes, wethers and lambs slaughter in percentage – 2000/2009 (lines) ..........................................30
Chart 2.8 – Ewes, wethers and lambs slaughter in percentage – 2000/2009 (bars) ...........................................30
Table 2.5 – Swine and horse slaughter – by month – 2007/2009 .................................................................31
Chart 2.9 – Swine and horse slaughter – by month – 2007/2009 .................................................................31
Table 2.6 – Swine and horse slaughter – by class – by year – 2000/2009 ......................................................32
Chart 2.10 – Swine and horse slaughter – by year – 2000/2009 ...................................................................32
Table 2.7 – Bovine slaughter – by age – by month – 2009 .........................................................................33
Chart 2.11 – Steer slaughter – by age – by month – 2009 ...........................................................................34
Chart 2.12 – Cow slaughter – by age – by month – 2009 ............................................................................34
Chart 2.13 – Steer and cow slaughter – by month – 2009 ...........................................................................34
Chart 2.14 – Bovine slaughter in percentage – 2009 (pie) ..........................................................................34
Table 2.8 – Bovine slaughter – by age – by year – 2000/2009 ....................................................................35
Chart 2.15 – Steer slaughter – by age – by year – 2000/2009 ......................................................................35
Chart 2.16 – Cow slaughter – by age – by year – 2000/2009 .......................................................................35
Table 2.9 – Sheep slaughter – by class – by month – 2009 ........................................................................36
Chart 2.17 – Sheep slaughter – by class – by month – 2009 ........................................................................36
Table 2.10 – Swine and horse slaughter – by class – by month – 2009 ...........................................................37
Chart 2.18 – Swine slaughter – by class – by month – 2009 ........................................................................37
Chart 2.19 – Horse slaughter – by class – by month – 2009 ........................................................................37
Table 2.11 – Bovine slaughter – by abattoir – 2009 ..................................................................................38
15INAC - Anuario Estadístico - 2009

CONTEENNTS
Table 2.12 – Sheep slaughter – by abattoir – 2009 ...................................................................................39
Table 2.13 – Swine and horse slaughter – by abattoir – 2009 ......................................................................40
Table 2.14 – Bovine average weight – steers and cows – 2009 ....................................................................41
Table 2.15 – Bovine average weight – calves and bulls – 2009 ....................................................................41
Table 2.16 – Bovine average weight – bovine average ..............................................................................42
Chart 2.20 – Bovine average weight 4th. scale (point 4) – 2009 ...................................................................42
Table 2.17 – Sheep average weight – ewes and wethers – 2009 ..................................................................43
Table 2.18 – Sheep average weight – hoggets and lambs – 2009 .................................................................43
Table 2.19 – Sheep average weight – rams and sheep average ....................................................................44
Chart 2.21 – Sheep average weight dressed – 2009 .................................................................................44
Table 2.20 – Swine average weight – pigs and piglets – 2009 .....................................................................45
Table 2.21 – Swine average weight – swine average – 2009 .......................................................................45
Chart 2.22 – Swine average weight dressed – 2009 .................................................................................46
3. PRICES AND VALUES ......................................................................................................47
Table 3.1 – Bovine average prices – live steers – 2009 ............................................................................49
Table 3.2 – Bovine average prices – 4th. scale (point 4) steers – 2009 .........................................................49
Table 3.3 – Bovine average prices – live cows – 2009 .............................................................................50
Table 3.4 – Bovine average prices – 4th. scale (point 4) cows – 2009 ..........................................................50
Table 3.5 – Bovine average prices – live calves – 2009 ...........................................................................51
Table 3.6 – Bovine average prices – 4th. scale (point 4) calves – 2009 ........................................................51
Table 3.7 – Bovine average prices – live bulls – 2009 .............................................................................52
Table 3.8 – Bovine average prices – 4th. scale (point 4) bulls – 2009 ..........................................................52
Table 3.9 – Bovine average prices – bovine average prices – 2009 .............................................................53
Table 3.10 – Sheep average prices – ewes – 2009 ...................................................................................54
Table 3.11 – Sheep average prices – wethers – 2009................................................................................54
Table 3.12 – Sheep average prices – hoggets – 2009................................................................................55
Table 3.13 – Sheep average prices – lambs – 2009 ..................................................................................55
Table 3.14 – Sheep average prices – rams – 2009 ...................................................................................56
Table 3.15 – Sheep average prices – sheep average prices – 2009 ...............................................................56
Table 3.16 – Swine average prices – pigs – 2009 ....................................................................................57
Table 3.17 – Swine average prices – piglets – 2009 .................................................................................57
Table 3.18 – Swine average prices – swine average prices – 2009 ...............................................................58
Chart 3.1 – Bovine average price 4th. scale (point 4) – 2009 .....................................................................59
Chart 3.2 – Sheep average prices dressed – 2009 ..................................................................................59
Chart 3.3 – Swine average prices dressed – 2009 ..................................................................................59
Table 3.19 – Average value of standard steer 2007 - 2009 .........................................................................60
Chart 3.4 – Monthly evolution of standard steer value, steer value and industrial added value. 2007 - 2009 ...........60
16 INAC - Anuario Estadístico - 2009

CONNTTENTS
CONVENTIONAL SIGNS
(.) Indicates the quantity does not reach half the last digit in use.
SIGLAS: DI.CO.SE. Control Administration of Farm Animals, Agricultural Products, Branding and Marking (subordinate to the Ministery of Agriculture, Cattle and Fisher).
SOURCE: Data source is indicated in those cases in which they don´t belong total o partially to the INAC.
NOTES: Grand totals might not coincide with exact data addition due to round-up of numbers.
Percentage share and average export income are calculated in units of kgs and USD.
Table 4.1 – Total meat exports – by month – 2007/2009 ...........................................................................63
Chart 4.1 – Total meat exports – by month – 2007/2009 ...........................................................................63
Table 4.2 – Total meat exports – by product – 2007/2009 .........................................................................64
Chart 4.2 – Total meat exports – by product – 2007/2009 .........................................................................64
Table 4.3 – Total meat exports – by year – 2000/2009 .............................................................................65
Chart 4.3 – Beef exports – by year – 2000/2009 .....................................................................................65
Chart 4.4 – Ovine meat exports – by year – 2000/2009 ............................................................................65
Table 4.4 – Beef exports – by month – 2007/2009 ..................................................................................66
Chart 4.5 – Beef exports – by month – 2007/2009 ..................................................................................67
Table 4.5 – Beef exports – by product – 2007/2009 ................................................................................68
Table 4.6 – Ovine meat exports – by product – 2007/2009 ........................................................................71
Table 4.7 – Total meat exports – by exporter ........................................................................................73
Table 4.8 – Beef exports – by destination – quantity (shipped weight), Tons. – 2007/2009 .................................76
Table 4.9 – Beef exports – by destination – quantity (carcase weight), Tons. – 2007/2009 .................................82
Table 4.10 – Beef exports – by destination – FOB value, Thousand dollars – 2007/2009 ......................................88
Chart 4.6 – Beef exports – by destination – 2009 ...................................................................................94
Table 4.11 – Ovine meat exports – by destination – quantity (shipped weight) and FOB Value – 2007/2009 ...............96
Table 4.12 – Ovine meat exports – by destination – quantity (carcase weight), Tons. – 2007/2009 ....................... 100
Table 4.13 – Ovine meat exports – by destination – FOB value, Thousand dollars – 2007/2009............................ 104
Table 4.14 – Horse meat exports – by destination – quantity (shipped weight), Tons. – 2007/2009 ....................... 108
Table 4.15 – Horse meat exports – by destination – quantity (carcase weight), Tons. – 2007/2009 ....................... 109
Table 4.16 – Horse meat exports – by destination – FOB value, Thousand dollars – 2007/2009 ........................... 110
Table 4.17 – Pork exports – by destination – quantity (shipped weight), Tons. – 2007/2009 ............................... 111
Table 4.18 – Pork exports – by destination – FOB value, Thousand dollars – 2007/2009 .................................... 112
Table 4.19 – Poultry meat exports – by destination – quantity (shipped weight), Tons. – 2007/2009 ..................... 113
Table 4.20 – Poultry meat exports – by destination – FOB value, Thousand dollars – 2007/2009 ......................... 115
Table 4.21 – Small game meat exports – by destination – quantity (shipped weight), Tons. – 2007/2009 ............... 117
Table 4.22 – Small game meat exports – by destination – FOB value, Thousand dollars – 2007/2009 .................... 117
Chart 4.7 – Exportaciones totales del sector cárnico – by destination – 2009 .............................................. 118
Table 4.23 – Exportaciones totales del sector cárnico – by product – 2009................................................... 120
4. EXPORTS .........................................................................................................................61
17INAC - Anuario Estadístico - 2009


STOCKLIVESTOCK
19INAC - Anuario Estadístico - 2009

BOLETÍN SEMANAL DIGITAL - ESTADÍSTICA MENSUAL DIGITAL
Herramientas fundamentales para el análisis de los negocios.Son publicaciones de acceso libre y se encuentran disponibles en nuestro sitio web:www.inac.gub.uy / Sector INFORMACIÓN DE MERCADO
BOLETÍN SEMANAL DIGITAL
Presenta una SÍNTESIS DE LA INFORMACIÓN de faena, exportaciones y precios actualizada a la semana anterior.Adicionalmente se incluye un archivo en formato Excel que permite a los distintos usuarios trabajar directamente con los datos y realizar cálculosy operaciones.
ESTADÍSTICA MENSUAL DIGITAL
Nueva herramienta digital que incorpora y estructura en forma óptima la información relativa a Faena, Precios y Exportaciones. Es un Interactivo de estadísticas con cierre mensual, de acceso libre en formato pdf lo cual permite imprimir, consultar o almacenar.
Publicaciones digitalesSemanal - Mensual
20 INAC - Anuario Estadístico - 2009

Stock bovino - Existencias al 30 de junioBOVINE LIVESTOCK - BY JUNE 302007 - 2009
Miles de cabezasThousand heads
Cuadro / Table 1.1
CATEGORÍA Y EDAD / CLASS AND AGE 2009 % 2008 % 2007 %
TOROS 163 1,4 167 1,4 170 1,5
BULLS
VACAS DE CRÍA (ENTORADAS) 3.894 33,2 4.152 35,5 4.119 35,5
BREEDING COWS
VACAS DE INVERNADA 484 4,1 369 3,2 387 3,3
FEEDER COWS
TOTAL VACAS 4.378 37,3 4.521 38,6 4.506 38,9
TOTAL COWS
NOVILLOS DE 1 A 2 AÑOS 1.215 10,4 1.158 9,9 1.164 10,0
STEERS 1 - 2 YEARS
NOVILLOS DE 2 A 3 AÑOS 856 7,3 849 7,3 843 7,3
STEERS 2 - 3 YEARS
SUB-TOTAL NOVILLOS DE 1 A 3 AÑOS 2.072 17,7 2.007 17,1 2.007 17,3
SUB-TOTAL STEERS 1 - 3 YEARS
NOVILLOS DE MÁS DE 3 AÑOS 515 4,4 468 4,0 499 4,3
STEERS + 3 YEARS
TOTAL NOVILLOS 2.587 22,0 2.475 21,1 2.507 21,6
TOTAL STEERS
VAQUILLONAS DE 1 A 2 AÑOS 1.271 10,8 1.224 10,5 1.214 10,5
HEIFERS 1 - 2 YEARS
VAQUILLONAS + 2 AÑOS SIN ENTORAR 590 5,0 526 4,5 525 4,5
HEIFERS + 2 YEARS
TOTAL VAQUILLONAS 1.860 15,9 1.749 14,9 1.739 15,0
TOTAL HEIFERS
TERNEROS / TERNERAS 2.748 23,4 2.790 23,8 2.668 23,0
CALVES
TOTAL 11.736 100,0 11.703 100,0 11.590 100,0
Fuente / Source: MGAP - DICOSE
21INAC - Anuario Estadístico - 2009

Stock ovino - Existencias al 30 de junioSHEEP LIVESTOCK - BY JUNE 302007 - 2009
Miles de cabezasThousand heads
Cuadro / Table 1.2
CATEGORÍA Y EDAD / CLASS AND AGE 2009 % 2008 % 2007 %
CARNEROS 175 2,0 189 2,0 209 2,0
RAMS
OVEJAS DE CRÍA (ENCARNERADAS) 4.443 51,4 4.855 51,7 5.266 51,0
BREEDING EWES
OVEJAS DE DESCARTE (CONSUMO) 294 3,4 302 3,2 348 3,4
CULLED SHEEP FOR CONSUMPTION
TOTAL OVEJAS 4.737 54,8 5.156 54,9 5.614 54,4
TOTAL EWES
CAPONES 753 8,7 908 9,7 909 8,8
WETHERS
BORREGAS 2 A 4 DIENTES SIN ENCARNERAR 434 5,0 474 5,0 534 5,2
HOGGETS 2 - 4 TEETH
CORDERAS / CORDEROS DIENTES DE LECHE 2.202 25,5 2.248 23,9 2.640 25,6
LAMBS MILK TEETH
CORDEROS / CORDERAS (MAMONES) 336 3,9 421 4,5 416 4,0
SUCKLING LAMBS
TOTAL 8.637 100,0 9.395 100,0 10.323 100,0
Fuente / Source: MGAP - DICOSE
22 INAC - Anuario Estadístico - 2009

13.18413.184
12.08512.085
10.98610.986
9.9269.926 9.7679.767
10.84810.84811.08911.089
10.32310.323
9.3959.395
8.6378.637
Stock bovino y ovino - Existencias al 30 de junioBOVINE AND SHEEP LIVESTOCK - BY JUNE 30 Miles de cabezas
Thousand heads
Fuente / Source: MGAP - DICOSEFuente / Source: MGAP - DICOSE
11.59011.590
10.32310.323
11.70311.703
9.3959.395
11.73611.736
8.6378.637
Gráfi co / Chart 1.1
Existencias de bovinos y ovinos - al 30 de junioBovine and sheep livestock - by june 30 / 2007 - 2009
7.000
8.000
9.000
10.000
11.000
12.000
13.000
2007 2008 2009
OVINOS / SHEEP BOVINOS / BOVINE
Gráfi co / Chart 1.4
Existencias de ovinos - al 30 de junio / Sheep livestock - by june 30 / 2000 - 2009
8.0002000 2001 2002 2003 2004 2005 2006 2007 2008 2009
9.000
10.000
11.000
12.000
14.000
Gráfi co / Chart 1.2
Existencias de bovinos y ovinos - al 30 de junioBovine and sheep livestock - by june 30 / 2000 - 2009
8.000
9.000
10.000
11.000
12.000
13.000
14.000
2000 2001 2002 2003 2004 2005 2006 2007 2008 2009
OVINOS / SHEEP BOVINOS / BOVINE
10.34310.343
10.59810.598
11.11511.115
11.52811.528
11.96211.962 11.95811.958
11.69911.69911.59011.590
11.70311.703 11.73611.736
Gráfi co / Chart 1.3
Existencias de bovinos - al 30 de junio / Bovine livestock - by june 30 / 2000 - 2009
9.5002000 2001 2002 2003 2004 2005 2006 2007 2008 2009
10.000
10.500
11.000
12.000
12.500
11.500
13.000
Fuente / Source: MGAP - DICOSE
Fuente / Source: MGAP - DICOSE
23INAC - Anuario Estadístico - 2009