Establishment of Threshold Effects for the Forest County ...
76
Establishment of Threshold Effects for the Forest County Potawatomi Community (FCPC) Class I Air Quality Related Values (AQRV) Final Report Timothy J. Sullivan E&S Environmental Chemistry, Inc. P.O. Box 609 Corvallis, OR 97339 May, 31, 2012 Revised October 11, 2013
Transcript of Establishment of Threshold Effects for the Forest County ...

Establishment of Threshold Effects for the
Forest County Potawatomi Community (FCPC)
Class I Air Quality Related Values (AQRV)
Final Report
Timothy J. Sullivan
E&S Environmental Chemistry, Inc.
P.O. Box 609
Corvallis, OR 97339
May, 31, 2012 Revised October 11, 2013

ii
Table of Contents
List of Figures ................................................................................................................................ iii
List of Tables ................................................................................................................................. iv
Executive Summary ........................................................................................................................ v
1. Background.............................................................................................................................. 1
1.1. Introduction .................................................................................................................... 1
1.2. Effects of Atmospheric Deposition in the Northern Great Lakes Region ...................... 2
1.2.1. Mercury .............................................................................................................. 2
1.2.2. Acidification of Terrestrial Ecosystems ........................................................... 20
1.2.3. Acidification of Aquatic Ecosystems ............................................................... 20
1.2.4. Nutrient Enrichment ......................................................................................... 23
2. Designation of AQRVs for FCPC Class I Lands .................................................................. 28
2.1. Importance of Water Quality and Aquatic System AQRVs to the FCPC .................... 29
2.2. FCPC Study Area ......................................................................................................... 30
2.3. Protection Against Methylation of Hg ......................................................................... 33
2.4. Protection Against Acidification .................................................................................. 40
2.5. Protection Against Fertilization of Water and Soils ..................................................... 41
3. Critical Load .......................................................................................................................... 42
3.1. Critical Load to Protect Against Hg Methylation ........................................................ 42
3.2. Critical Load to Protect Waters Against Acidification ................................................ 42
3.3. Critical Load to Protect Terrestrial Resources ............................................................. 43
4. Establishment of Background Levels and threshold Effects Levels ..................................... 44
4.1. Sulfur and Mercury Deposition as Related to Hg Methylation .................................... 46
4.2. Sulfur and Nitrogen Deposition as Related to Acidification and Fertilization of
Water and Soils ............................................................................................................ 50
5. Summary................................................................................................................................ 51
6. Literature Cited ...................................................................................................................... 57

iii
LIST OF FIGURES
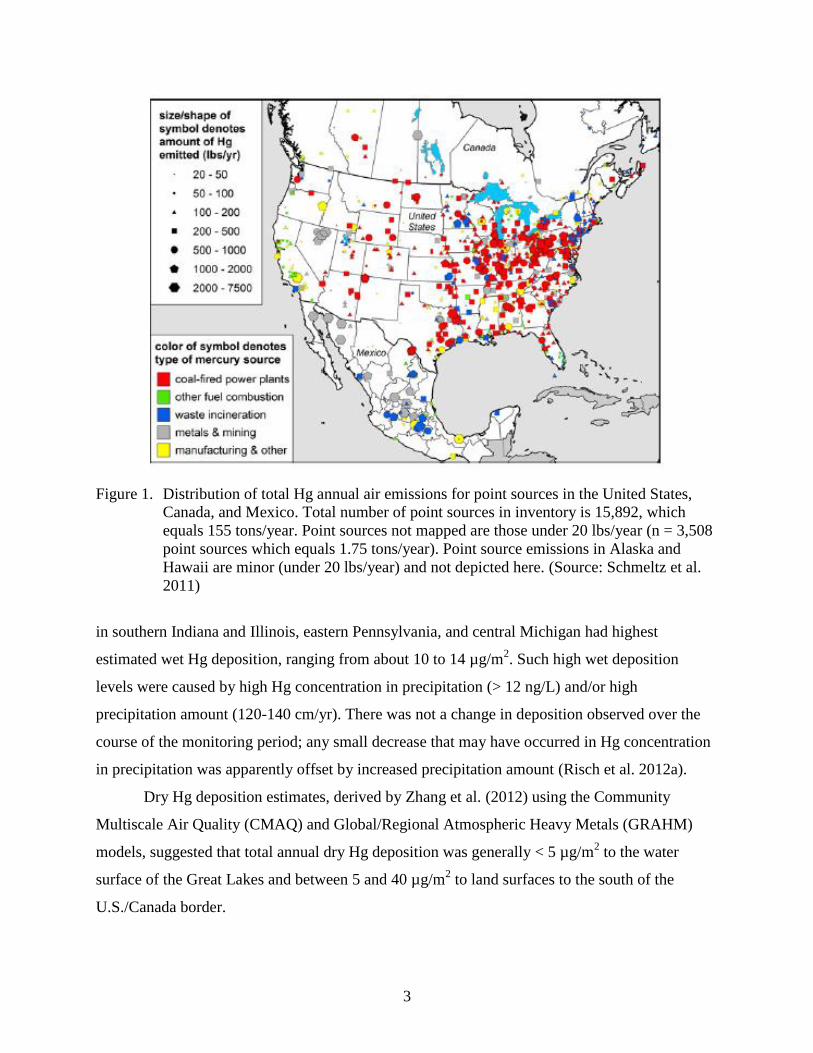
Figure 1. Distribution of total Hg annual air emissions for point sources in the United
States, Canada, and Mexico. ........................................................................................ 3
Figure 2. Temporal trends in herring gull egg mercury concentrations (averaged by year
across multiple sites in the Great Lakes region) and fish fillet mercury
concentrations (walleye and largemouth bass, averaged by year across multiple
sites in the Great Lakes and inland water bodies in the U.S. Great Lakes states
and the province of Ontario). ..................................................................................... 16
Figure 3. Study area for evaluation of FCPC air quality related values, as determined by
mapping all drainage water contributing areas that drain into surface waters
that occur on FCPC lands .......................................................................................... 31
Figure 4. Land cover in the FCPC study area, based on National Land Cover Data ................ 32
Figure 5. Box plots showing the distribution of lake water DOC, sulfate and alkalinity at
FCPC lake monitoring sites ....................................................................................... 36
Figure 6. Box plots showing the distribution of stream water DOC, sulfate and alkalinity
at FCPC stream monitoring sites ............................................................................... 37
Figure 7. Total Hg concentrations in skin-on fillets of all sampled fish species, by lake. ........ 38
Figure 8. Total Hg concentrations in skin-on fillets of fish species sampled in A) all
lakes located within the study area and B) Devils Lake only. ................................... 39

iv
LIST OF TABLES
Table ES-1. Deposition analysis thresholds (DATs) for FCPC lands. ........................................... vi
Table 1. Proportion of lakes in three nutrient limitation classes (N limited, P limited,
and N and P co-limited) based on ratios of dissolved inorganic nitrogen (DIN;
NO3- + NH4
+ ) to total phosphorus (TP) ................................................................... 28
Table 2. Measured values of annual wet deposition at the NADP NTN/MDN
monitoring site near Devils Lake and estimated dry deposition based on dry-to-
wet deposition ratios at the CASTNET site PRK134 for the period 2006-2010. ...... 33
Table 3. List of lake and stream water quality sampling sites. Site ID and initial year of
available water quality data are specified. ................................................................. 35
Table 4. Number of fish samples and date ranges for which skin-on fillet total Hg
samples are available, by species ............................................................................... 38
Table 5. Lake and stream DOC, alkalinity and calculated ANC values for two sampling
occasions represented by data necessary (major base cations and strong
mineral acid anions) for determining the calculated ANC ........................................ 41
Table 6. Deposition analysis thresholds (DATs) for FCPC lands. .......................................... 49

v
EXECUTIVE SUMMARY
At the request of the Forest County Potawatomi Community (FCPC), the U.S.
Environmental Protection Agency (EPA) redesignated the FCPC Reservation as a non-federal
Class I area in April, 2008. The FCPC agreed, in the Class I Agreement with the State of
Wisconsin, to list and protect air quality related values (AQRVs).
The FCPC has designated Water Quality and Aquatic Systems as AQRVs to be protected
against air pollution degradation. The FCPC selected these as AQRVs for a number of reasons,
including the following:
tribal members rely on fish as part of their traditional subsistence way of life,
pure water is important to the tribe’s cultural, medicinal, and religious practices, and
recreational fishing is important to the tourism economy in and around the FCPC
reservation, upon which the FCPC depends.
These AQRVs can be adversely impacted by atmospheric deposition of Hg, S, and N. In
particular, adverse effects include Hg methylation (which is related to both Hg and S deposition),
acidification (which is related to both S and N deposition), and fertilization of water and soils
(which is related to N deposition). The primary concern for protection of these AQRVs is the
potential Hg methylation in Devils Lake and other water bodies in the 393 km2 study area (which
includes all land area from which surface water drains onto or within FCPC reservation lands).
To protect the AQRVs from adverse impacts, the FCPC has agreed to establish threshold
effects levels. Threshold effects levels generally represent the amount of additional (above
ambient) deposition from a proposed new or modified source below which an adverse effect will
not occur. In addition, once atmospheric deposition of Hg, S, or N is high enough that a
deposition concern threshold has been reached, which is true for Hg levels in Devils Lake and
other water bodies in the study area, any further increase in emissions that would contribute
additional deposition is considered to adversely impact the AQRV.
The threshold effects levels identified in this report are shown in Table ES-1. These
levels are based on and consistent with extensive studies of FCPC surface waters and surface
waters elsewhere in Wisconsin and the broader northern Great Lakes region, Federal Land
Managers Air Quality Related Values Work Group (FLAG) guidance (as amended), U.S. Forest
Service (USFS) designated concern thresholds, and USFS and National Park Service deposition
analysis thresholds (DATs).

vi
Table ES-1. Deposition analysis thresholds (DATs) for FCPC lands.
Atmospherically Deposited
Pollutant Purpose of DAT DAT Value
N or S Protect against water acidification or
eutrophication
0.01 kg/ha/yr
S Protect against Hg methylation 0.0012 kg/ha/yr
Hg Protect against Hg methylation 0.0032 µg/m2/yr
The foregoing DAT levels satisfy FCPC’s obligations under the 1999 Class I Agreement
and, more importantly, help to protect FCPC’s essential resources for current members and
future generations.

1
1. BACKGROUND
1.1. Introduction
The Forest County Potawatomi Community (FCPC) is a federally recognized tribe with
headquarters near Crandon, Wisconsin. At the request of the FCPC, the U.S. Environmental
Protection Agency (EPA) redesignated the FCPC Reservation as a non-federal Class I area in
April, 2008. The FCPC agreed, in the Class I Agreement with the State of Wisconsin, to list and
protect air quality related values (AQRVs).
This report identifies appropriate threshold effects levels for water quality and aquatic
systems AQRVs on FCPC lands. The primary concern for protection of these AQRVs is the
potential for increases in methylmercury (MeHg) in Devils Lake and other water bodies on
FCPC Class I lands that could be caused by increased atmospheric deposition of either sulfur (S)
or mercury (Hg). The most important route of entry of Hg into remote ecosystems in the Great
Lakes region is atmospheric deposition of inorganic Hg (Fitzgerald et al. 1998). However, the
most important source of the neurotoxic MeHg found in fish and other biota is via microbially
mediated methylation of inorganic Hg (Ullrich et al. 2001).
Other important concerns for AQRV protection on FCPC lands include acidification of
soil and surface water caused by atmospheric deposition of S and nitrogen (N) and nutrient
enrichment of aquatic and terrestrial systems caused by atmospheric deposition of N.
In accordance with the Prevention of Significant Deterioration (PSD) permit application
process and the Class I Agreement, the Wisconsin Department of Natural Resources (WDNR)
will notify FCPC of all major emissions source permit applications located within a 62-mile
radius of the reservation. As part of the permit application process, an applicant may be required
by WDNR to conduct an air quality impact analysis that will assess the impacts of its proposed
emissions on the FCPC Class I area. FCPC will then assess whether the proposed air emissions
will adversely impact the designated AQRVs. If FCPC determines that an adverse impact is
likely, FCPC will notify WDNR that it has made an adverse impact finding for the proposed
source; this finding will be considered by WDNR in its permitting decisions.

2
1.2. Effects of Atmospheric Deposition in the Northern Great Lakes Region
1.2.1. Mercury
Based on published research findings and spatial patterns in pollutant load and resource
sensitivity and effects nationwide, the air pollution effects of greatest concern in the northern
Great Lakes region appear to be Hg methylation, lake acidification, and nutrient enrichment. The
most thoroughly studied toxic agent that affects Class I lands in the northern Great Lakes region
via atmospheric deposition pathways is Hg. It is a heavy metal that occurs naturally in several
forms. Elemental Hg is released from sources in the earth’s crust into the global environment
through volcanic and geothermal activity and the weathering of rocks. It is also emitted by
human emissions sources. Once released into the atmosphere, Hg can be deposited to the earth’s
surface and transformed through natural processes into a toxic form that can bioaccumulate in
food webs. Contamination of aquatic ecosystems by Hg has reduced the benefits provided by
fisheries resources in many inland and coastal waters throughout the United States.
Within the northern Great Lakes region, Hg is well known as constituting a risk to the
health of wildlife and humans, including members of the FCPC, who consume large quantities of
fish. Much of the landscape is Hg-sensitive. The major source of Hg in the watersheds of this
region is atmospheric deposition (Mason and Sullivan 1997, Rolfhus et al. 2003, Wiener et al.
2006), most of which originates from human-caused sources (Swain et al. 1992, Lorey and
Driscoll 1999, Lamborg et al. 2002).
Mercury emissions and deposition tend to be relatively high in some portions of the
northern Great Lakes region (Figure 1). Initial scientific focus on Hg contamination in the Great
Lakes region was directed at industrial point sources such as pulp and paper mills and chlor-
alkali plants (Turner and Southworth 1999; Wiener et al. 2003, 2012a). However, point source
release of Hg into surface waters decreased substantially in the 1980s, and atmospheric
deposition is now the main source of Hg to watersheds in the Great Lakes region. The region
contains a number of anthropogenic atmospheric emissions sources that collectively emit more
than 50 kg per year of Hg (Wiener et al. 2012a). Watershed characteristics in portions of the
region that contain abundant wetlands and forests facilitate Hg watershed inputs via dry
deposition processes, methylation, transport, and biomagnification.
Risch et al. (2012a) reported wet Hg deposition throughout the Great Lakes region during
the period 2002-2008, based on data from three Hg and precipitation monitoring networks. Areas
3
Figure 1. Distribution of total Hg annual air emissions for point sources in the United States,
Canada, and Mexico. Total number of point sources in inventory is 15,892, which
equals 155 tons/year. Point sources not mapped are those under 20 lbs/year (n = 3,508
point sources which equals 1.75 tons/year). Point source emissions in Alaska and
Hawaii are minor (under 20 lbs/year) and not depicted here. (Source: Schmeltz et al.
2011)
in southern Indiana and Illinois, eastern Pennsylvania, and central Michigan had highest
estimated wet Hg deposition, ranging from about 10 to 14 µg/m2. Such high wet deposition
levels were caused by high Hg concentration in precipitation (> 12 ng/L) and/or high
precipitation amount (120-140 cm/yr). There was not a change in deposition observed over the
course of the monitoring period; any small decrease that may have occurred in Hg concentration
in precipitation was apparently offset by increased precipitation amount (Risch et al. 2012a).
Dry Hg deposition estimates, derived by Zhang et al. (2012) using the Community
Multiscale Air Quality (CMAQ) and Global/Regional Atmospheric Heavy Metals (GRAHM)
models, suggested that total annual dry Hg deposition was generally < 5 µg/m2 to the water
surface of the Great Lakes and between 5 and 40 µg/m2 to land surfaces to the south of the
U.S./Canada border.
4
Mercury is highly volatile and is easily transported in the atmosphere from human
sources to remote regions. Most Hg in the atmosphere is gaseous elemental Hg (Hgo). It can be
photochemically oxidized to form reactive Hg (Hg(II); Schroeder and Munthe 1998). The
reactive Hg is water soluble and can become dissolved in precipitation or deposited as dry
deposition that is subsequently transported to the forest floor in throughfall or litterfall (St. Louis
et al. 2001).
Although some Hg is released to the atmosphere from natural sources, a sizeable fraction
of the total atmospheric Hg burden is a result of human activities (Driscoll et al. 2007).
Anthropogenic Hg emissions are primarily due to the combustion of fossil fuels and secondarily
to waste incineration. Depending on the source, Hg emissions to the atmosphere can be
comprised of a combination of three inorganic forms: elemental, reactive gaseous (“oxidized”),
and particulate.
Although atmospheric Hg deposition has been well studied, it is difficult to establish total
Hg deposition rates. Wet deposition in the United States is generally estimated to range from
about 2 to 20 μg/m2-yr, and tends to be highest in summer (Mercury Deposition Network
[MDN]: http://nadp.sws.uiuc.edu/MDN/why.aspx). Wet Hg deposition tends to be especially
high in Indiana, Ohio, Illinois, and portions of Pennsylvania, Michigan, and Wisconsin (Risch et
al. 2012a, Wiener et al. 2012a). Dry deposition of Hg is poorly known, but is likely in the range
of the wet values or slightly higher (Risch et al. 2012b).
Dry deposition of Hg is difficult to measure and the associated uncertainty is high (St.
Louis et al. 2001, Lyman et al. 2007, Graydon et al. 2008, Zhang et al. 2009). Inferential
methods are commonly used to estimate dry deposition, based on assumed dry deposition
velocities and measured ambient concentrations of the principal Hg species found in the
atmosphere: gaseous elemental Hg (GEM), gaseous oxidized Hg (GOM), and particulate bound
Hg (PBM) at hourly time scales (Engle et al. 2010, Zhang et al. 2012).
The complexities of Hg deposition were illustrated by Graydon et al. (2006) who found
that a portion of wet deposited Hg(II) to forest canopies may be photo-reduced to gaseous Hg(0)
that is then re-emitted to the atmosphere. Gustin et al. (2006) showed that re-emission of
deposited Hg from soil can be affected by environmental conditions such as soil moisture,
temperature, light, the presence of atmospheric oxidants, and Hg concentrations in air (U. S.
EPA 2009b).

5
The dry deposition velocity for each atmospheric Hg species can be two to five times
higher to forest surfaces as compared with non-forested vegetated and unvegetated surfaces
(Zhang et al. 2009, Risch et al. 2012a). Risch et al. (2012a) measured the concentration of Hg in
autumn litterfall collected during three years from 23 Hg deposition monitoring stations across
15 eastern states. Forests were primarily hardwood. On average, the ratio of dry (estimated from
litterfall) to measured wet Hg deposition was 1.3 to 1.0.
Deposited Hg(II) can revolatilize back to the atmosphere, be methylated in the soil, or be
transported to a water body via runoff and leaching. Methylation can also occur within the water
body, and either Hg(II) or methyl Hg can be reintroduced from the water back to the atmosphere.
Mercury deposited to the O horizon of the soil can be strongly retained, and then re-emitted to
the atmosphere with burning (Dicosty et al. 2006).
The importance of atmospheric deposition of Hg as a source of aquatic contamination in
the upper Midwest was further established when a study of lake sediments illustrated that wet
atmospheric Hg deposition could explain most of the observed sediment Hg loadings (Sorensen
et al. 1990, Glass and Sorensen 1999). Analyses of lake sediment cores reported by Swain et al.
(1992) suggested that the rate of Hg accumulation in lake sediments in the Upper Midwest had
nearly tripled since preindustrial time.
Stratigraphic data from eight lakes in rural Minnesota indicated that atmospheric Hg
deposition in this region peaked in the 1960s and 1970s, followed by decreases attributable to
decreased emissions from regional sources (Engstrom and Swain 1997). Based on comparison
with data from remote lakes in southeastern Alaska, the authors estimated that global Hg
emissions in the Northern Hemisphere could account for about 7.4 µg/m2 of annual Hg
deposition in rural Minnesota. The remaining deposition (about 5.1 µg/m2, or 40% of the total)
was estimated to derive mainly from regional anthropogenic Hg sources in the upper Midwest
and eastern United States. It has been estimated that about 60% of the Hg in lake sediments in
Voyageurs National Park (VOYA) was derived from atmospheric sources (Sorensen et al. 1990,
Wiener et al. 2006). Some of that deposited Hg probably originated in Asia (Pittman et al. 2011).
The Hg that has accumulated historically in lake sediments provides an index of changes
over time in Hg inputs from atmospheric deposition and other sources. Drevnick et al. (2012)
analyzed 91 sediment cores collected from relatively undisturbed inland lakes in the Great Lakes
region. Inferred rates of Hg accumulation in these lakes increased about 7-fold from pre-

6
industrial times to a peak in about the 1980s. Over the past two to three decades, inferred inputs
declined about 20%. This recent decrease in sediment Hg is consistent with documented trends
in Hg deposition (Drevnick et al. 2012).
Since 1990, anthropogenic emissions of Hg in the United States have decreased
dramatically, from 246 tons in 1990 to 101 tons in 2005 (U.S. EPA 2000, 2005). This decrease
has largely been attributed to controls on municipal and medical waste incinerators (Butler et al.
2008). The largest single type of emissions source in 2005 was coal-fired power plants (52.3 tons
emitted), followed by other boilers, cement manufacturing, and electric arc furnaces (Schmeltz et
al. 2011).
1.2.1.1. Bioaccumulation
Bioaccumulation is the progressive accumulation of chemicals with increasing trophic
level (LeBlanc 1995). Organic Hg is the most likely metal to bioaccumulate, in part because
organisms can efficiently assimilate MeHg and it is slowly eliminated (Reinfelder et al. 1998,
Croteau et al. 2005).
Although any form of Hg can be considered toxic, the greatest threat to the environment,
wildlife, and people is exposure to MeHg. Methylmercury is a persistent bioaccumulative toxin
that is formed when certain bacteria convert inorganic Hg into MeHg. It can enter through the
digestive systems of animals and bind to proteins. It bioaccumulates as each successive predator
in the aquatic food chain consumes higher concentrations of MeHg. Low levels of MeHg in
surface water (less than about 1 part per trillion) can bioaccumulate over a million-fold and reach
toxic levels in fish (Driscoll et al. 2007; MDN: http://nadp.sws.uiuc.edu/MDN/why.aspx).
Predatory fish, piscivorous birds, and mammals (including humans) that eat contaminated fish
can be exposed to toxic levels of MeHg.
In anaerobic environments in wetlands and lake or stream sediments, Hg(II) can be
methylated to MeHg (Wiener et al. 2003, Hall et al. 2005). Sulfate (SO42-
)-reducing bacteria are
responsible for production of MeHg from inorganic Hg (Compeau and Bartha 1985, Gilmour et
al. 1992). Relatively low concentrations of inorganic Hg in surface water can contribute to
substantial Hg bioaccumulation in aquatic ecosystems when and where environmental conditions
favor methylation, which is largely carried out by SO42–
reducing microbes. Organic MeHg is

7
among the most toxic and widespread environmental contaminants that affect aquatic ecosystems
within remote areas (cf., Brumbaugh et al. 2001).
The bioavailability of MeHg in the environment is also of particular importance to
humans who can accumulate high levels of MeHg from eating contaminated fish. Avoiding
exposure to Hg is particularly important for pregnant women and nursing mothers. Mercury
poisoning can cause neurological impairment in children, leading to effects on memory, visual
and spatial ability, information processing, and general intelligence (Mahaffey 2005).
Because atmospheric Hg must be methylated in order to bioaccumulate in the food web,
significant efforts have been made to understand the bacteria responsible for this chemical
transformation. Sulfate-reducing bacteria have been shown to be the main agents of Hg
methylation in sediments (Gilmour et al. 1992) and wetlands (St. Louis et al. 1994, Branfireun et
al. 1999). In ecosystems that are SO42-
-poor, the total amount of biologically-available S controls
the activity of these bacteria, and thereby the rate of MeHg production. Atmospheric SO42-
deposition, leading to the stimulation of SO42-
-reducing bacteria and increased Hg methylation
may have caused or contributed to the observed post-industrial amplification of MeHg
concentrations in fish (Jeremiason et al. 2006). Studies have demonstrated increased levels of
MeHg production with experimental addition of SO42-
(Gilmour and Henry 1991, Gilmour et al.
1992, Branfireun et al. 1999, Jeremiason et al. 2006). In addition, fish have shown increased
MeHg burdens in lakes acidified by atmospheric S deposition as compared with non-acidified
lakes receiving similar atmospheric Hg deposition (Gilmour and Henry 1991). Thus, atmospheric
S deposition is an important driver of Hg methylation and subsequent biomagnification, and
reduced SO42-
emissions and deposition may be expected to cause a corresponding reduction in
Hg methylation and bioavailability (Jeremiason et al. 2006).
In large part because of the common occurrence of wetlands, Hg methylation and
bioaccumulation are important concerns within the northern Great Lakes region. This is also true
on FCPC lands. Swackhamer and Hornbuckle (2004) assessed air quality and air pollutant
impacts in two of the national parks within this region (Isle Royale [ISRO] and VOYA) in a
report to the National Park Service (NPS). They concluded that Hg was one of the air pollutants
of most concern in these two parks. Exposure of wildlife to Hg occurs largely through fish
consumption, and may be linked to reproductive, neurological, and developmental problems.

8
Inputs of Hg to national park ecosystems are primarily atmospheric, attributable mostly to long
range transport.
Mercury binds to organic matter. As a consequence, dissolved organic carbon (DOC) is
an important parameter affecting Hg bioavailability and transport through watersheds (Grigal
2002). Methylation is critical to the effects of Hg on aquatic biota. Methylating bacteria require
SO42-
to carry on their metabolic activities (Galloway and Branfireun 2004, ICF International
2006, Jeremiason et al. 2006). Methylation is also correlated with water acid-base chemistry
(Wiener et al. 2006, Driscoll et al. 2007). The northern Great Lakes region, and eastward into
northern New York, is especially sensitive to Hg bioaccumulation, due in part to relatively high
Hg deposition and in particular due to watershed and lake characteristics that exacerbate Hg
transport, methylation, and bioaccumulation (Evers et al. 2011a). Such characteristics also apply
to Devils Lake within the FCPC study area.
The distribution and magnitude of the impacts of Hg contamination of natural ecosystems
in the Great Lakes region is more substantial than previously recognized, with concentrations of
Hg exceeding risk thresholds in many species of fish and wildlife across the region (Evers et al.
2011a). Many species of fish in the inland waters of the Great Lakes region, including FCPC’s
Devils Lake, have average Hg concentration in fillets above risk thresholds for piscivorous
wildlife (0.27 ppm).
Much of the research that has been conducted in the United States on Hg methylation, the
influence of SO42-
on methylation rates, and controls on Hg transport within watersheds has been
conducted in the northern Great Lakes region (cf., Watras et al. 1998, 2000; Hrabik and Watras
2002; Wiener et al. 2006). Wetlands constitute important features of the landscape in this region.
Wetlands act as important sources of MeHg to fresh water ecosystems. This is likely due in large
part to two characteristics of wetlands:1) high availability of DOC, and 2) anaerobic conditions
in sediments. Both enhance methylation rates, and DOC also enhances the transport of MeHg to
downstream receiving waters. As a consequence of these wetland influences on Hg methylation
and transport, the percentage of wetland areas within watersheds is commonly correlated with
MeHg flux (Grigal 2002).
Wetlands are important sources of organic matter (OM) and associated Hg and also are
active sites for methylation. The MeHg produced in wetlands can bind with OM and be

9
transported to hydrologically connected lakes (St. Louis et al. 1996, Sellers et al. 2001, Grigal
2002).
Hg in Fish
Wiener et al. (2012b) synthesized data on 6,400 yellow perch (Perca flavescens) from the
Great Lakes and associated inland lakes and reservoirs in and around the northern Great Lakes
region. Yellow perch from 6.5% of the waters examined had average whole fish concentrations
of Hg high enough to cause adverse effects on fish. Concentrations of Hg were higher in fish at
higher trophic levels.
Mercury loads in fish collected in the northern Great Lakes region tended to be higher in
inland waters (e.g., median Hg in yellow perch fillets 0.14 ppm [ww1]) than in the Great Lakes
themselves (median Hg in yellow perch fillets 0.09 ppm (ww); Wiener et al. 2012b). Similarly,
Hg concentrations in fish from the Great Lakes were about 55% lower for walleye (Stizostedion
vitreum) and 25% lower for largemouth bass (Micropterus salmoides; Monson et al. 2011) as
compared with concentrations in fish collected from inland waters within the region.
Gorski et al. (2003) investigated bioaccumulation of Hg in northern pike (Esox lucius) in
two inland lakes in ISRO: one Hg advisory lake (Sargent Lake) and one non-advisory lake (Lake
Richie). Concentrations of total and MeHg were analyzed in water, zooplankton,
macroinvertebrates, and fish. Although concentrations of total Hg were significantly higher in
pike collected from Sargent Lake, concentrations in open water were slightly higher in Lake
Richie. Analyses of stable isotopes of carbon and N in biota indicated that pike from the two
lakes were positioned at approximately the same trophic level (4.2 and 4.3). However, the food
web in Sargent Lake was more pelagic-based, whereas in Lake Richie it was more benthic-based.
Gorski et al. (2003) speculated that the pelagic food web in Sargent Lake may enhance
bioaccumulation. For example, Campbell et al. (2000) showed by 13
C analysis that
organochlorines can bioaccumulate to a greater extent in pelagic food webs. It remains difficult
to identify a priori lakes where Hg concentrations in fish will exceed health thresholds for
humans or wildlife without direct measurement of Hg content in fish.
1 ww refers to wet weight, reflecting the basis for reporting the concentration of Hg in fish tissue

10
The concentration of Hg in fish tissue is often positively correlated with lake and/or
watershed area, and negatively correlated with pH, acid neutralizing capacity (ANC), and
zooplankton density (Chen et al. 2005, Driscoll et al. 2007). Lake types that are generally
associated with the most Hg bioaccumulation are poorly buffered, low in pH and productivity,
and have forested watersheds and little human development within the watershed (Chen et al.
2005). Such lakes and watersheds are common throughout the northern Great Lakes region. Lake
pH, SO42-
concentration, and extent of wetland connectivity were the major factors identified by
Wiener et al. (2006) controlling Hg bioaccumulation in predatory fish within VOYA. Low-ANC,
low-pH lakes are common in VOYA. Such lakes are prone to having high levels of Hg in fish
(Swain and Helwig 1989, Wiener and Spry 1996). The review of Evers (2005) classified Hg-
sensitive surface waters as those having:
high SO42-
concentrations,
low pH and ANC,
extensive wetlands,
large watershed area relative to lake area,
fluctuating water level, and
low nutrient concentration
The USGS sampled 20 lakes in VOYA during the period 2000-2002 and analyzed the
water and fish for Hg. Near-surface water samples had MeHg concentrations ranging from below
the method detection level of 0.04 ng/L to concentrations that were more than an order of
magnitude higher. In near-by Ontario, Scheuhammer and Blancher (1994) estimated that 30% of
the studied lakes had prey-size fish that had Hg concentrations sufficiently high as to cause
reproductive impairment of common loons (Gavia immer) that consumed those fish.
Changes in atmospheric Hg deposition can have an important influence on Hg
concentrations in fish. Hrabik and Watras (2002) found approximately a 30% reduction in fish
Hg concentrations between 1994 and 2000 in a Wisconsin seepage lake in response to decreased
atmospheric Hg deposition of about 10% per year between 1995 and 1999 (Watras et al. 2000). It
must be noted, however, that seepage lakes, such as the lake studied by Hrabik and Watras
(2002), might be expected to respond more markedly and quickly to decreased atmospheric Hg
loading (Harris et al. 2007), compared with drainage lakes that typically receive a large portion
of their water and Hg input via the watershed.

11
VOYA contains many lakes that vary in size, productivity, and fish Hg content (Sorensen
et al. 2005b, Wiener et al. 2006). Within VOYA, lakes with extremely low and extremely high
fish Hg content are situated within a few kilometers of each other. Fish collected from Ryan
Lake and Mukooda Lake in VOYA had some of the highest and lowest Hg concentrations
recorded in Minnesota for northern pike (Rolfhus et al. 2011). These two lakes receive nearly
identical Hg inputs in atmospheric deposition (Wiener et al. 2006, Rolfhus et al. 2011). Thus,
lake- and watershed-specific factors have large influence on Hg bioaccumulation.
Within the Great Lakes region, walleye and largemouth bass exhibited increasing Hg
concentrations from south to north and from west to east. Portions of the region having highest
concentrations were forested and contained substantial wetland area (Evers et al. 2011a).
Sorensen et al. (2005a) reported results of a monitoring study of Hg concentrations in
young-of-the-year (YOY) yellow perch and water level fluctuations in 14 lakes in northeastern
Minnesota, including 6 lakes in or adjacent to VOYA. Twelve years of monitoring data were
collected for Sand Point Lake, and three years for each of the other lakes. Over the three-year
period of record across all lakes, mean fish Hg concentrations varied in each lake by nearly a
factor of 2, on average. For the 12-year monitoring period at Sand Point Lake, values ranged
from 38 ng/g (ww) in 1998 to 200 ng/g (ww) in 2001. Annual water level fluctuation was
correlated with Hg concentrations in YOY perch. Because the Hg concentration measurements
were made on YOY fish at the end of each growing season, they represented water conditions
and bioaccumulation for each year individually. The researchers concluded that annual water
level fluctuations in the reservoir systems in VOYA have significant influence on Hg
bioaccumulation in perch.
Bioaccumulation of Hg and the factors that control it have been topics of considerable
research in VOYA. Results of a key study were reported by Wiener et al. (2006), who studied Hg
concentrations and bioaccumulation in 17 lakes in the park. They assessed the importance of
atmospheric and geologic sources of Hg to interior lakes and their watersheds and identified
factors associated with lake-to-lake variation in MeHg contamination of lacustrine food webs.
Geologic sources were judged to be small. Most Hg found in the upper O and A soil horizons
was of atmospheric origin, primarily from anthropogenic sources. The most important factors
influencing MeHg concentrations in lake water and fish were identified as lake pH, SO42-
concentration in lake water, and total organic C in lake water, which largely reflects wetland
12
influence. The area of connected wetlands adjoining the 17 study lake watersheds represented
from 3.5 to 20% of total watershed area (Wiener et al. 2006).
Northern pike from some lakes in VOYA have contained the highest concentrations of
Hg reported in Minnesota (Wiener et al. 2006). Concentrations of Hg in northern pike collected
in VOYA varied almost 10-fold among the small lakes in the park (Wiener et al. 2006). This
reflects the importance of lake and watershed characteristics, in addition to atmospheric
deposition, as controlling factors in the cycling and bioaccumulation of Hg. There was no
indication in the deposition measurements or distribution of local Hg emissions sources that the
atmospheric loading of Hg would explain these spatial differences.
Mean concentrations of total Hg in one-year-old yellow perch (n = 612) varied more than
5-fold across the 17 study lakes of Wiener et al. (2006; 182 ng/g [dw]) in Mukooda Lake to 942
ng/g [dw] in Ryan Lake). A model with pH and lake SO42-
concentration explained 53% of the
variation in total Hg concentration in yellow perch. A model with SO42-
concentration, TOC, and
[TOC]2 explained 60% of the variation in total Hg. The model judged best, based on the Akaike
Information Criteria (AIC), for predicting MeHg concentration in lake water included SO42-
,
TOC and [TOC]2, and explained 79% of the variation in MeHg concentration in water (Wiener et
al. 2006).
Ryan and Tooth lakes had both the highest concentrations of Hg in yellow perch and the
highest concentrations of lake SO42-
(up to 74 µeq/L) among the studied lakes. Fish Hg
concentrations were lowest in the three lakes (Little Trout, Mukooda, O’Leary) that had pH > 7.0
(Wiener et al. 2006), a pattern observed previously (Grieb et al. 1990, Spry and Wiener 1991).
Piscivorous Wildlife
Relatively high levels of Hg have been documented in many species of bird and mammal,
in addition to fish, at multiple trophic positions in a variety of habitats across the Great Lakes
region (Evers et al. 2011a). Fish constitute an important pathway for transferring MeHg to wild
mammals and birds. Monitoring of fish for Hg in this region has often focused on both small
prey fish and large, older piscivorous fish for evaluating trophic transfer of Hg. The former are
expected to respond quickly to changes in Hg exposure and reflect trophic transport of
contaminants in food webs (Wiener et al. 2007). The latter respond more gradually to Hg
bioavailability, and are influenced by such factors as fish age, fish size, nutrient input, and inter-

13
species competition (Mason et al. 2005). Thus, fish monitoring is often targeted at both the mid-
trophic level omnivorous prey fish and the higher-trophic level predatory fish in order to capture
the full range of fish Hg conditions (Kamman et al. 2005).
In the southern portions of the Great Lakes region, agricultural land uses predominate and
nutrient inputs from fertilizer use and livestock waste have contributed to increased algal
populations. The abundant algae biodilute MeHg in the food web, resulting in lower
concentrations in fish and wildlife at higher trophic levels (Evers et al. 2011a).
Analyses of soil, bedrock, and lake sediments indicated that atmospheric deposition was
the primary source of Hg to 17 study lakes in VOYA (Wiener et al. 2006). Bedrock and lower
soil horizon material contained much lower Hg concentrations than upper A and O soil horizons.
Within the A horizon, Hg concentration was positively correlated with organic content (r2
=
0.82). Lake sediment cores showed patterns of low background concentration in sediments
deposited before 1860 (47 to 167 ng/g [dw2]) to maximum values in the late 1900s (102 to 364
ng/g [dw]). Sediment Hg concentrations were lowest in the lake cores that exhibited the highest
sedimentation rates, suggesting dilution of sediment Hg concentration by sediment flux. The
ratio of recent Hg concentration in sediment divided by preindustrial Hg concentration was
relatively consistent among lakes (mean ± SD: 2.1 ±0.1). Measured Hg fluxes represented in lake
sediment cores collected from five lakes were not controlled mainly by atmospheric Hg
deposition. Rather, they were strongly influenced by sedimentation patterns within the lakes and
watershed characteristics that control runoff, including watershed-to-lake area ratio and the
percent of the watershed covered by wetlands.
Analyses conducted by Wiener et al. (2006) confirmed that both watershed and in-lake
processes affect the concentrations of Hg in lacustrine food webs in the northern Great Lakes
region. The concentration of SO42-
, TOC, and pH in water are robust indicators of the sensitivity
of lake watersheds to Hg inputs in landscapes affected by atmospheric Hg deposition.
Elevated MeHg accumulation in fish-eating birds in both Wisconsin and in the
northeastern United States has been linked to lake acidification (Meyer et al. 1995, Hrabik and
Watras 2002, Evers et al. 2007). This form of Hg accumulates in top predators to levels of
concern for both human health and the environment (Evers et al. 2007). Several piscivorous bird
and mammal species have been suggested as biomonitors of Hg bioaccumulation in the
2 dw signifies that the concentration is reported on a dry weight basis

14
Northeast and the northern Great Lakes region (Wolfe et al. 2007). The common loon and bald
eagle (Haliaeetus leucocephalus) are especially good indicators of Hg risk to wildlife (Evers
2006). Increased concentrations of Hg have been found to be associated with behavioral,
physiological, and reproductive effects on these bird species (Burgess and Meyer 2008, Evers et
al. 2008). The common loon has become established as one of the main avian indicators for
evaluating the exposure and effects of MeHg in the United States (Evers 2006; Evers et al. 2008,
2009, 2011b).
Acidic deposition contributes to Hg toxicity in fish-eating birds, including the common
loon, in part because SO42-
addition to wetland and lake sediment environments stimulates the
production of MeHg, thereby increasing lake water concentrations of MeHg (Jeremiason et al.
2006). Kramar et al. (2005) determined that the extent of wetland located in close proximity (less
than 150 m) to loon territory was positively correlated with Hg concentrations in loon blood.
The Lowest Observed Adverse Effect Level (LOAEL) provides a benchmark for
quantifying potential injury to wildlife from Hg exposure. For example, the LOAEL for the
common loon has been established as 3.0 µg/g of Hg in adult loon blood (Evers et al. 2007,
2008). This level of Hg is associated with reproductive effects such as reduced fledgling success
(Burgess and Meyer 2008). However, loon Hg exposure data can include either sex; different
ages, locations, and time periods; and can be derived from analysis of blood, tissue or eggs. It
has therefore been difficult to standardize the data regarding MeHg availability. Evers et al.
(2011b) developed linkages among loon Hg measurements in eggs, blood, and fish prey in the
Great Lakes region. Data were normalized into standard loon tissue units. Use of a standard unit
of measure that combines multiple tissues of a high profile species and its principal prey items
facilitates examination of spatial gradients in pollution effects (Evers et al. 2011b). Based on
analysis of over 8,000 male loon units (MLUs), seven biological Hg hotspots were identified in
the region. The average MLU concentration across the Great Lakes region was 1.8 µg/g; 82%
were above 1 µg/g and 9.8% were above the LOAEL of 3 µg/g. At a given lake, MLUs tend to
have higher Hg concentration than female loon units (FLUs). This is because male loons are
typically 21% larger than female loons (Evers et al. 2010) and therefore eat larger fish (Barr
1996). These larger fish tend to have higher Hg concentration (Sandheinrich and Wiener 2011).
Evers et al. (2011b) identified two biological Hg hotspots within the northern Great
Lakes region for which rationales were well described for the observed high concentrations of

15
Hg in loons: northeastern Minnesota and northern Wisconsin/upper Michigan. Both were
characterized by mixed deciduous and coniferous forest (79% and 61%, respectively)
interspersed with scrub-shrub and emergent wetland (12% and 20%, respectively). In the
northeastern Minnesota hotspot, high MLUs were further associated with reservoir
impoundments characterized by fluctuating water levels and with small natural lakes having low
pH and high SO42-
and DOC concentration. Some of these high MLU lakes were located in
VOYA (Wiener et al. 2006) and nearby Superior National Forest. In northern Wisconsin/upper
Michigan, high MLUs were associated with low lake ANC (Cope et al. 1990; Meyer et al. 1995,
1998) and interactions with SO42-
and DOC (Watras and Morrison 2008).
Although the common loon has been well studied as an example of Hg bioaccumulation
in wildlife, this species is actually relatively insensitive (LC 50 of MeHg injected into eggs > 1
ppm [ww]) to adverse effects of Hg compared with other avian species. For example, American
kestrel (Falco sparverius), white ibis (Eudocimus albus), snowy egret (Egretta thula), osprey
(Pandion haliaetus), and tricolored heron (Egretta tricolor) are all thought to be much more
sensitive (LC 50 of MeHg injected into eggs < 0.25 ppm [ww]), based on research by Heinz et
al. (2009) and Kenow et al. (2011).
The NPS is monitoring environmental contaminants in bald eagle nestlings at three
national park units (APIS, MISS, and SACN) in the upper Great Lakes region (Route et al.
2011). Monitoring includes heavy metals, agricultural pesticides, and industrial chemicals.
Contaminant levels in 288 eaglets were associated with proximity to municipal and industrial
waste. Mercury was highest where wetlands influenced water chemistry.
Total Hg concentrations in mink in the Great Lakes region have been in many cases high
enough to suggest the likelihood of subclinical effects (Basu et al. 2007b). In one survey, Hg
concentrations in mink were highest in wetlands along impounded rivers that had fluctuating
water levels and that were downstream of large historical point sources (Hamilton et al. 2011).
Similarly, bald eagles in this region accumulated sufficient Hg as to suggest subclinical
neurological damage. An estimated 14% to 27% of the eagles studied had Hg tissue
concentration above the proposed risk threshold for liver toxicity of 16.7 ppm (Zillioux et al.
1993, Rutkiewicz et al. 2011).
The concentration of Hg in fish and birds of the Great Lakes region have declined during
recent decades. From 1967 to 2009, Hg concentrations in walleye, largemouth bass, and the eggs

16
of herring gulls throughout the Great Lakes region decreased substantially (Figure 2; Evers et al.
2011a, Monson et al. 2011, Weseloh et al. 2011). This decrease can at least partly be attributed to
decreases in atmospheric Hg deposition.
Figure 2. Temporal trends in herring gull egg mercury concentrations (averaged by year across multiple
sites in the Great Lakes region; Weseloh et al. 2011) and fish fillet mercury concentrations
(walleye and largemouth bass, averaged by year across multiple sites in the Great Lakes and
inland water bodies in the U.S. Great Lakes states and the province of Ontario; Monson et al.
2011). These data are characteristic of the regional trend of decreasing mercury concentrations
in fish and wildlife in recent decades. Much of this decrease has been attributed to reductions
in regional mercury emissions, although there may be other contributing factors as well
(Weseloh et al. 2011). (Source: Evers et al. 2011a)
In spite of the multidecadal decline in Hg concentrations in fish and wildlife of the Great
Lakes region, there has also been evidence of a more recent increase in Hg concentrations for
some species at some locations. This has been shown for walleye from Ontario, walleye and
northern pike from Minnesota (Monson 2009, Monson et al. 2011), walleye from Lake Erie
(Bhavsar et al. 2010, Zananski et al. 2011), loon blood from northern Wisconsin (Meyer et al.
2011), and bald eagles from VOYA (Pittman et al. 2011). The cause of this recent increase in Hg
concentrations in fish and wildlife is not known, but may be related to lower water levels and
increased exposed shoreline associated with changing climatic conditions (Meyer et al. 2011),
effects of introduced exotic species (Monson et al. 2011), or decreased nutrient loading
(Zananski et al. 2011).
Rolfhus et al. (2011) evaluated the results of ten studies in the western Great Lakes
region to document the trophic transfer efficiency of MeHg in the pelagic food webs of lakes.

17
The largest increases in MeHg (largest biomagnification) were found at the base of the food web,
between water and suspended particles. The observed similarity in the efficiency of trophic
transfer suggested that the aqueous supply of MeHg controls much of the bioaccumulation in
pelagic food webs in this region.
Bald eagles in the United States have been found to contain substantial amounts of Hg in
feathers, eggs, liver, and brain (cf., Wood et al. 1996, Bechard et al. 2007, Scheuhammer et al.
2008). Impacts of Hg toxicity on eagle reproduction and survival can affect individual and
population condition. It is therefore important to identify markers of subclinical effects of Hg on
the brains of eagles and other piscivorous bird species as early warning signals. Rutkiewicz et al.
(2011) evaluated Hg exposure to bald eagles collected in Iowa, Michigan, Minnesota, Ohio, and
Wisconsin. Levels of Hg in eagle brains were associated with neurochemical receptors and
enzymes. Results suggested that bald eagles in this region are exposed to Hg at levels high
enough to cause subclinical neurological damage (Rutkiewicz et al. 2011). The concentrations of
total Hg in bald eagle brain and liver tissues were lowest in Ohio and Wisconsin, and highest in
Michigan, Iowa, and Minnesota.
Feathers from nestling bald eagles in VOYA have been collected over the past two
decades and analyzed for Hg content. This monitoring has focused on nesting sites near three
impoundments: Rainy, Kabetogama, and Namakan (included together with Crane and Sand
Pointe) lakes. The VOYA environment has high potential for Hg methylation because wetlands
are abundant (Grim and Kallemeyn 1995). Since 1999, the water levels of these impoundments
have been stabilized to more closely match natural conditions. The lake level stabilization was
ordered by the International Joint Commission because research had shown that large changes in
lake stage can increase MeHg concentrations in lake water (Rudd 1995, St. Louis et al. 2004,
Sorensen et al. 2005a). Apparently in response to this control order, the annual geometric mean
of Hg concentrations in bald eagle nestling feathers decreased 74.4% from 1989 to 2010
(Pittman et al. 2011).
1.2.1.2. Effects of Atmospherically Deposited Mercury
Increased body burdens of Hg in fish can lead to decreased reproductive success and
behavioral alterations. Yellow perch are often studied as a primary indicator species for Hg
contamination in the environment. Ecological effects thresholds for Hg concentration in fish prey

18
have been proposed at levels lower than human health thresholds. Reproduction effects on fish-
eating birds have been reported at fish Hg levels as low as 0.16 ppm (Fenn et al. 2011).
As more research has been conducted during the last few decades, high concentrations of
Hg have been increasingly documented in more species of wildlife across the Great Lakes region
and into the northeastern United States. Recent research has also decreased estimates of effects
level, suggesting sublethal effects on wildlife (including effects on reproduction and biochemical
processes) at whole-fish concentrations of 0.2 to 0.3 ppm (Beckvar et al. 2005, Dillon et al. 2010,
Sandheinrich and Wiener 2011). All 50 states issued Hg advisories for human fish consumption
in 2008 (Fenn et al. 2011). That represented an increase in lake area under advisory of 19% and
an increase in river length under advisory of 42% compared with 2006. These increases are
likely due mainly to increased availability of measured data, rather than increases in Hg
deposition or methylation (Fenn et al. 2011). The U.S. EPA (2001) recommended a human
health criterion of 0.3 ppm in fish and shellfish tissue to protect the general population. More
stringent restrictions may be appropriate for women of child-bearing age and children. Some
states, including Maine and Minnesota, use a more restrictive human health standard of 0.2 ppm.
The National Environmental Justice Advisory Council (NEJAC; 2002) issued a report on
fish contamination and consumption and environmental justice that addressed the issue of
improvement of the quality of aquatic ecosystems in order to protect the health and safety of
people who consume fish, aquatic plants, and wildlife. Those affected by contaminated and
depleted aquatic ecosystems are disproportionately communities of color, low income, tribes,
and other indigenous peoples. The report recommended that EPA work expeditiously to prevent
and reduce the generation and release of contaminants that pose the greatest risk of harm to
human health and aquatic resources, including Hg. Aquatic ecosystem health is key to addressing
issues of environmental justice. Tribes and other indigenous peoples depend to a greater extent
than the general population on healthy aquatic ecosystems and the fish and wildlife that these
ecosystems support. In addition, harm caused by degradation of aquatic habitats and depletion of
fisheries affect not only the present tribal generations, but also future generations and the transfer
of knowledge from one generation to the next. This knowledge transfer includes ecological
knowledge, customs and traditions surrounding the harvest, and preparation and consumption of
fish and other aquatic resources (NEJAC 2002). Depletion of aquatic environments and

19
contamination of aquatic resources threaten tribal subsistence, economic, traditional, cultural,
and religious practices.
Methylmercury causes damage to the vertebrate central nervous system. Embryos are the
most sensitive life forms of vertebrates (Scheuhammer 1991, Clarkson 1992). Low-level dietary
Hg exposures that cause no measureable effects on adult birds can impair egg fertility, hatchling
survival, and reproductive success (Scheuhammer 1991). In reproducing females of fish, birds,
and piscivorous mammals, MeHg passes directly to developing egg or embryo (Evers et al. 2003,
Hammerschmidt and Sandheinrich 2005, Heinz et al. 2010). These early life stages are more
sensitive than adults to the adverse effects of MeHg exposure (Evers et al. 2003, Wiener et al.
2003, Scheuhammer et al. 2007).
In piscivorous birds, including loons and bald eagles, Hg poisoning can lead to brain
lesions, reduced reproductive success, increased chick mortality, spinal cord collapse, and
neuromuscular problems. The common loon has been widely used as a Hg bioaccumulation
indicator for risk to piscivorous birds (Evers et al. 2008, 2011b). It is listed as threatened in
Michigan and as a species of special concern in Wisconsin. Because loons feed almost
exclusively on fish and crayfish and are relatively long-lived, they can bioaccumulate a
substantial amount of Hg (Evers et al. 2011a). Nevertheless, common loons are considered less
sensitive to Hg than some other piscivorous birds. They do, however, concentrate Hg in their
blood to levels that are high enough to impair reproduction at some locations (Burgess and
Meyer 2008, Evers et al. 2011a).
Mink (Neovison vison) has been proposed as a sentinel species indicating toxic
contaminant exposure (Basu et al. 2007a, Martin et al. 2011). This species constitutes a good
candidate for biomonitoring due to its wide distribution and abundance, trophic status, and
availability of tissue samples from trappers (Mason and Wren 2001). Symptoms of Hg toxicity in
mink include decreased coordination, loss of weight, and splaying of hind legs (Wobeser et al.
1976, Wren et al. 1987).
In its Risk and Exposure Assessment for Review of the Secondary National Ambient Air
Quality Standards for Oxides of Nitrogen and Oxides of Sulfur, the U.S. EPA (2009a) concluded
the following:
The production of the large majority of MeHg is mediated by SO42-
-reducing
bacteria (SRB), and changes in SO42-
deposition have resulted in changes in both
Hg methylation and Hg concentration in fish (pg. 6-3).

20
Experimental evidence has established that only inconsequential amounts of
MeHg can be produced in the absence of SO42-
(pg. 6-4).
Elevated Hg levels in fish can only occur where substantial amounts of MeHg are
present (pg. 6-4).
Evidence is sufficient to infer a causal relationship between S deposition and
increased Hg methylation in wetlands and aquatic environments (pg. 6-11).
Decreases in SO42-
deposition have already shown promising reductions in MeHg
(pg. 6-13).
Reducing SOx emissions could have a beneficial effect on levels of MeHg in
many waters of the United States (pg. 6-13).
1.2.2. Acidification of Terrestrial Ecosystems
Data are generally not available regarding the sensitivity of terrestrial ecosystems to
acidification in the northern Great Lakes region or the extent to which terrestrial acidification has
occurred. Nevertheless, sugar maple occurs in the region and is known to be sensitive to
acidification on base-poor soils. It is not known whether soil acidification has occurred
sufficiently within the region to cause damage to this, or other, sensitive plant species.
Possible effects of atmospherically deposited S and toxic metals have been the focus of
research interest at ISRO for several decades (cf., Bennett 1995). Subtle patterns of slightly
elevated elements in two lichen species collected in ISRO suggested potential impacts from
atmospheric deposition. Lichens collected from areas having higher exposures were found to
have higher element concentrations of S, Mn, Se, and other heavy metals (Bennett 1995).
1.2.3. Acidification of Aquatic Ecosystems
Atmospheric emissions and deposition of S and N vary dramatically across the Upper
Midwest, with relatively low values to the northwest and higher values to the southeast. The
Upper Midwest contains numerous lakes created by glaciation. They have been the subject of
extensive research on lake acidification (cf., Cook and Jager 1991, NAPAP 1991). The region
has little topographic relief and due to a deep glacial overburden, it also has little exposed
bedrock.
Acid-sensitive surface waters in the Upper Midwest are mainly groundwater recharge
seepage lakes and small dilute drainage lakes (Eilers et al. 1983). Most drainage lakes and some
of the seepage lakes (the flow-through type) in the Upper Midwest region receive substantial

21
inflow from groundwater, which is generally high in base cation concentrations from dissolution
of carbonate and silicate minerals. Relatively high concentrations of base cations in many of
these lakes make them insensitive to acidification from acidic deposition. The seepage lakes that
have low base cation concentrations, and that are therefore acid-sensitive, generally receive most
of their water input from precipitation directly on the lake surface (Baker et al. 1991). These
groundwater recharge seepage lakes can be identified on the basis of having Si concentration less
than about 1 mg/L (Baker et al. 1991). The acid-sensitivity of streams within the region has not
been well studied.
1.2.3.1. Current Status
Based on the EPA’s Eastern Lakes Survey (ELS), the Upper Midwest region had a large
population of low ANC lakes (Linthurst et al. 1986a, 1986b). Low-ANC lakes in this region are
primarily small, shallow, seepage lakes that are hydrologically isolated from the surrounding
terrain and that have low concentrations of base cations and Al and moderate SO42-
concentrations. Some are small drainage lakes. Groundwater flow-through seepage lakes in that
region generally have high pH and ANC, due to groundwater inputs of base cations (e.g., Baker
et al. 1991). Based on results from the ELS survey, only 6% of the groundwater flow-through
seepage lakes had ANC ≤ 50 μeq/L. In contrast, the more acid-sensitive groundwater recharge
seepage lakes sampled by the ELS constituted 71% of the seepage lakes in the region and were
frequently low pH and ANC. Nine percent had pH ≤ 5.5. Such lakes tend to be susceptible to
acidification from acidic deposition.
Lakewater concentrations of inorganic N reported by the ELS were low throughout the
Upper Midwest. In addition, snowmelt would not be expected to provide any significant nitrate
(NO3-) influx to lakes in the Upper Midwest because most snowmelt in this region infiltrates the
soil before reaching the drainage lakes, and because snowmelt input of N into seepage lakes
would be limited mainly to the snow on the lake surface and immediate near-shore environment
(Cook and Jager 1991).
1.2.3.2. Past Acidification
Space-for-time substitution analysis was used by Sullivan (2000) to infer the general
levels of past change in lake water acid-base chemistry in the Great Lakes region. The

22
concentration of lakewater (calcium [Ca2+
] + Magnesium [Mg2+
]) also decreased with increasing
acidic deposition across the region, probably due to hydrologic differences and to lower levels of
base cation deposition and greater amounts of precipitation in the eastern portion of the region.
Atmospheric deposition is an important source of base cations for groundwater recharge seepage
lakes because of minimal groundwater inputs. In the eastern portion of the region, such lakes are
more sensitive to pH and ANC depression in response to either elevated SO42-
or DOC. The
spatial patterns for low ANC groundwater recharge lakes in the region are consistent with the
following hypotheses (Sullivan 1990, 2000):
1. Sensitivity to mineral and organic acidity increased from west to east because of
decreasing lakewater base cation concentrations, and this may have been due, in part,
to changes in base cation deposition and precipitation volume along this gradient.
2. High concentrations of DOC were responsible for the acidic conditions in some of
the lakes, and DOC may have decreased in response to acidic deposition.
3. Many of the groundwater recharge seepage lakes in the eastern portion of the Upper
Peninsula of Michigan, and some in Wisconsin, were acidic (ANC ≤ 0 µeq/L)
because of high SO42-
relative to base cation concentration, and had probably been
acidified by acidic deposition.
1.2.3.3. Recent Trends
Regional trends analyses for long-term monitoring lakes in the Upper Midwest during the
period 1990 to 2000 suggested that SO42-
declined in lakewater by 3.63 µeq/L/yr, whereas
lakewater NO3- concentrations were relatively constant (Stoddard et al. 2003). The large decrease
in SO42-
concentration in lake water was mainly balanced by a combination of a large decrease in
base cation concentrations (-1.42 µeq/L/yr) and an increase in ANC (+1.07 µeq/L/yr). All of
these trends were significant at p < 0.01 (Stoddard et al. 2003). An estimated 80 of 251 lakes in
the Upper Midwest region that were acidic in the mid-1980s were no longer acidic in 2000. This
change was probably caused by decreased S deposition (Stoddard et al. 2003).
Whole lake experiments and artificial stream channel experiments have shown that
acidification can lead to loss of fish species. Work at Little Rock Lake in Wisconsin suggested
that rock bass suffered recruitment failure at pH 5.6 or below. Artificial channel studies showed
poor survival and reproductive success for fathead minnow at pH 5.9 to 6.0.
One decade after cessation of the experimental acidification of Little Rock Lake in
Wisconsin, recovery of the zooplankton community was complete (Frost et al. 2006). Recovery

23
did not follow the same trajectory as the initial acidification, however, indicating a substantial
hysteresis in zooplankton community recovery. About 40% of the zooplankton species in the
lake exhibited a lag of 1 to 6 years to recover to levels noted in the neutral reference basin.
1.2.4. Nutrient Enrichment
1.2.4.1. Terrestrial Ecosystems
Reduced species richness and biodiversity of terrestrial and wetland ecosystems in
response to N addition are of concern, in large part because of the potential interactions among
diversity and ecosystem processes and functioning. A species-poor plant community may be
more likely to exhibit compromised ecosystem functioning as compared with a species-rich
community.
In terrestrial ecosystems, changes in plant species occurrence in response to increased N
deposition should be most obvious in ecosystems that are naturally deficient in N. This is
because species that are adapted to low N supply will often be more readily outcompeted by
species that have higher N demand (Aerts 1990, Tilman and Wedin 1991, Krupa 2003). Plant
species having high N-demand are often non-native and invasive (Dukes and Mooney 1999). As
a consequence, some native species can be extirpated by N-enhanced eutrophication and
potentially replaced by non-native, often invasive species. (Ellenberg 1985; Falkengren-Grerup
1986, 1989; Roelofs 1986; Stevens et al. 2004).
Experimental N addition at > 50 kg N/ha/yr to tallgrass prairie increased productivity and
decreased species richness, probably as a consequence of reduced light penetration and increased
litter biomass (Baer et al. 2003). Wedin and Tilman (1996) presented results of 12 years of
experimental N addition to 162 grassland plots in Minnesota. N loading dramatically changed
plant species composition, decreased species diversity, and increased aboveground productivity
in the experimental plots. Species richness declined by more than 50% across the N-deposition
gradient, with the greatest losses at levels of N input of 10 to 50 kg N/ha/yr. This loss of richness
was accompanied by large changes in plant species composition, with C4 grasses declining and
the weedy Eurasian C3 quackgrass (Agropyron repens) becoming dominant at high N addition
rates (Wedin and Tilman 1996). The authors concluded that N loading is a major threat to
grassland ecosystems and causes loss of diversity, increased abundance of non-native species,
and disruption of ecosystem functioning. A major uncertainty, however, is the rate of N loading

24
at which such changes may be manifested. Total N loading to ecosystems in the northern Great
Lakes region is lower than the loading rates typically used in experimental treatments, such as
those of Wedin and Tilman (1996).
Effects of N fertilization on vegetation, in turn, can influence faunal populations. For
example, fertilization in a Minnesota old-field at relatively low rates (≤ 20 kg N/ha/yr) for 14
years resulted in decreased species diversity of insects in response to decreased diversity of plant
food sources. Plant species richness decreased, and quackgrass and Kentucky bluegrass (Poa
pratensis) became dominant in response to the N addition (Haddad et al. 2000). Changes in the
abundance of insect functional groups were also observed. Herbivores (especially the dominant
species) increased in numbers; parasitoid insect species decreased. Over the long term, changes
in plant species composition would be expected to either increase or decrease insect herbivore
activity, depending on whether there is a shift toward or away from herbivore-preferred plant
species (Throop et al. 2004, Clark 2011).
Forests can also be responsive to nutrient addition. Northern hardwood forests that
predominate in the northern portions of Minnesota, Wisconsin, and Michigan are expected to
show growth enhancement by some, but not all, tree species in response to N addition. Eastern
hardwood forests from Wisconsin to Maine and south to Virginia were shown to have
experienced increased growth with increasing N deposition across a depositional gradient from
about 3 to 11 kg N/ha/yr (Thomas et al. 2010). Nevertheless, responses were species-specific.
Growth increases were most pronounced for red maple (Acer rubrum), sugar maple (Acer
saccharum), white ash (Fraxinus americana), yellow poplar (Liriodendron tulipifera), black
cherry (Prunus serotina), balsam fir (Abies balsamea), pignut hickory (Carya glabra), eastern
white pine (Pinus strobus), quaking aspen (Populus tremuloides), northern red oak (Quercus
rubra), and scarlet oak (Quercus coccinea). Other tree species showed negative response to N
addition. Growth decreased by a statistically significant amount with increasing deposition for
red pine (Pinus resinosa), red spruce (Picea rubens), and northern white cedar (Thuja
occidentalis). Mortality increased with increasing deposition for yellow birch (Betula
alleghaniensis), eastern white pine, basswood (Tilia spp.), quaking aspen, bigtooth aspen
(Populus grandidentata), scarlet oak, chestnut oak (Quercus prinus), and northern red oak. At
higher rates of N supply on nutrient-poor sites, tree growth might be expected to decline (Pardo
et al. 2011a).

25
Eastern hardwood forests can also respond to increased N deposition with a decrease in
herbaceous plant biodiversity (Gilliam et al. 2006). The response of the herbaceous layer of the
forest can be pronounced, with initial increases in herbaceous plant cover, followed by decreases
in species richness and species evenness, two components of biodiversity. The response time is
typically shorter if ambient N deposition is relatively high (Gilliam et al. 2006, 2011; Fraterrigo
et al. 2009; Royo et al. 2010). Because the plants in the herbaceous layer of eastern hardwood
forests tend to have foliage with relatively high nutrient content, herbaceous plants in these
forests influence N cycling to a level that is disproportionate to their biomass (Muller 2003,
Moore et al. 2007, Welch et al. 2007, Gilliam et al. 2011).
Lichens have also been heavily impacted throughout the eastern hardwood forests. High
levels of air pollution, including both S and N, has played an important role in causing such
impacts (McCune 1988, Wetmore 1988).
1.2.4.2. Wetland Ecosystems
Wetlands are common throughout the northern Great Lakes region. They contribute to
high production of organic matter which is reflected in high DOC concentrations (higher than
about 5 mg/L) in many lakes. Wetlands considered sensitive to nutrient enrichment from N
deposition typically contain plants species that have evolved under N-limited conditions (U.S.
EPA 2008). It is believed that the competitive balance among plant species in some sensitive
wetland ecosystems can be altered by N addition, with resulting displacement of some species by
others that can utilize the excess N more efficiently (U.S. EPA 1993, 2008). This effect has been
well documented in heathlands in The Netherlands, where heather (Calluna vulgaris) has been
replaced by grass species (Heil and Bruggink 1987, Tomassen et al. 2003). It is important to
note, however, that N deposition in The Netherlands has been much higher (about 20 to 60 kg
N/ha/yr) than levels commonly encountered in wetland areas in the Great Lakes region (usually
less than 10 to 15 kg N/ha/y).
There is a great deal of diversity in terms of types of wetlands and how they respond to N
addition. Ombotrophic bogs are typically acidic and are dominated by mosses. They are
especially common in northern boreal forested regions and develop where precipitation is higher
than evapotranspiration in areas that exhibit an impediment to downward drainage in the soil
(Mitsch and Gosselink 2000). Freshwater marshes develop where water inputs in groundwater

26
plus surface water inflow approximate precipitation input (Koerselman 1989). Vegetation
primarily consists of tall graminoid plants. Freshwater swamps have hydrological conditions that
are generally similar to marshes, but vegetation is forested (Greaver et al. 2011).
The response of freshwater wetlands to N addition varies with hydrological conditions.
Bogs that receive much of their water input from precipitation are especially sensitive to the
effects of N input (Morris 1991). Ombotrophic bogs receive most of their nutrient supply from
precipitation; as a consequence plants are adapted to low inputs of N and other nutrients (Shaver
and Melillo 1984, Bridgham et al. 1995). Peat-forming bog ecosystems are among the most
sensitive wetland ecosystems to the effects of N deposition. In the conterminous United States,
peat-forming bogs are most common in areas that were glaciated, especially in portions of the
Northeast and Upper Midwest (U.S. EPA 1993). Bogs can host several federally listed rare and
endangered plant species. These include multiple species of quillworts (Isoetes spp.), sphagnum
mosses (Sphagnum spp.), and the green pitcher plant (Sarracenia oreophila; Greaver et al.
2011).
Increased N availability in nutrient-poor wetland environments may lead to a decrease in
species diversity and increased risk of extinction for some of the more sensitive and rare species
(Moore et al. 1989). As a consequence, peatlands and bogs are among the most vulnerable
transitional ecosystems to adverse nutrient-enrichment effects of N deposition (Krupa 2003). The
sensitivity of peatland Sphagnum species to elevated atmospheric N deposition is well
documented in Europe (Berendse et al. 2001, Tomassen et al. 2004). Sphagnum squarrosum and
S. fallax have been observed to be negatively affected by experimentally elevated atmospheric N
and S inputs in Europe (Kooijman and Bakker 1994). Roundleaf sundew (Drosera rotundifolia)
is also susceptible to elevated atmospheric N deposition (Redbo-Torstensson 1994).
In other studies, wetland species such as heather can successfully compete with grasses
even at relatively high rates of N deposition, as long as the vegetative canopies are closed (Aerts
et al. 1990). However, N deposition causes nutrient imbalances, including increase in the shoot-
to-root ratio, and therefore increases in the sensitivity of shrubs to drought stress, frost stress, and
attack by insect pests (Heil and Diemont 1983). These can result in gaps in the canopy of the
shrub layer, which can then be readily invaded by grasses that are more efficient in using the
additional N and therefore gain a competitive advantage (Krupa 2003).

27
Data are not available with which to evaluate the extent to which wetlands in the northern
Great Lakes region have been affected by nutrient enrichment from N deposition. Wetlands are
widely distributed, including within some areas that receive moderate levels of N deposition.
This N deposition may or may not be sufficiently high to cause species shifts in wetland plants.
If such effects do occur, they are most likely in wetlands such as bogs that normally receive most
of their nutrients from atmospheric inputs. These wetlands have been shown in Europe to
experience changes in plant species composition in response to high levels of atmospheric N
deposition. Such ecosystems tend to occur in portions of the northern Great Lakes region that
receive much lower levels of N deposition than do many of the affected wetlands in Europe
(Bobbink et al. 2010). It is not clear to what extent such effects occur under ambient N
deposition levels in Wisconsin. The risk of species composition change is important, in part
because wetland ecosystems often contain relatively large numbers of rare plant species (U.S.
EPA 2009a).
Greaver et al. (2011) estimated that the critical load (CL) of atmospheric N deposition to
protect peatlands in the United States from increased productivity was in the range of 2.7 to 13
kg N/ha/yr. This estimate was based on consideration of the results of the studies of Aldous et al.
(2002), Moore et al. (2004), Rochefort et al. (1990), and Vitt et al. (2003).
1.2.4.3. Surface Water Ecosystems
Atmospheric inputs of N can change the productivity of N-limited fresh water
ecosystems, altering the make-up of phytoplankton communities. In lakes that are limited in their
biological activity by N, increased atmospheric N deposition can cause phytoplankton species
that use N most efficiently to dominate the lake. Species that use N less efficiently can be
extirpated. However, many lakes and streams are limited by phosphorus (P), light, or some other
critical constituent. In such waters that are not N-limited, addition of atmospheric N is unlikely
to cause nutrient enrichment (eutrophication) impacts. The degree to which lakes and streams in
the Upper Midwest might be N-limited is not well known. However, Baron et al. (2011)
estimated, based on measured N:P ratios in the U.S. EPA’s Eastern Lakes Survey conducted in
1984, that 37% of Upper Midwestern lakes were N-limited and an additional 31% were either
co-limited by N and P or limited by something else other than P (Table 1).

28
Table 1. Proportion of lakes in three nutrient limitation classes (N limited, P limited, and N and
P co-limited) based on ratios of dissolved inorganic nitrogen (DIN; NO3- + NH4
+ ) to
total phosphorus (TP). Data are from the Eastern Lakes Survey (Linthurst et al.
1986b), conducted in the fall of 1984. (Source: Baron et al. 2011)
Region
Number of
Lakesa
Number of N
Limited Lakes
(%)b
Number of P
Limited Lakes
(%)c
Number of Lakes with
Co-limited N:P
(%)d
Upper Midwest 8,755 3,142 (37%) 2,787 (32%) 2,646 (31%) a The Eastern Lakes Survey was a stratified random sample of lakes; estimates of the number of lakes in the
region are based on the target population size for the survey. b Lakes with DIN:TP ratios (by weight) less than four were characterized as N limited, based on the work of
Morris and Lewis (1988). c Lakes with DIN:TP ratios (by weight) greater than 12 were characterized as P limited, based on the work of
Morris and Lewis (1988). d Lakes with DIN:TP ratios (by weight) between 4 and 12 could not be assigned to nutrient limitation class, and
are characterized as either co-limited or limited by something other than N or P.
2. DESIGNATION OF AQRVS FOR FCPC CLASS I LANDS
Atmospheric pollutant thresholds are addressed in the Federal Land Managers (FLM)
AQRV Work Group (FLAG) Phase I report, initially drafted in 2000 (USFS et al. 2000) and
more recently revised (USFS et al. 2010, 2011). The purpose of the FLAG Phase I report is to
assist permit applicants, state authorities, and land managers to develop more consistent and
objective approaches to the evaluation of AQRVs. This is needed for evaluation of air pollution
effects, caused by new or modified emissions sources, on AQRVs in Class I areas under the New
Source Review (NSR) program, especially in the review of PSD air quality permit applications.
The FLAG Phase I report and its modifications provide background information on effects levels
and screening tools to determine if effects are expected to be negligible based on the planned
quantity of emissions, the distance between the proposed source and the Class I area, and
dose/response relationships. Among the primary issues of concern to FLMs and tribal land
managers are the effects of pollutant deposition (including S, N, and Hg) on soils and surface
waters.
As part of the review of a PSD application for a new or modified emissions source, an
AQRV impact analysis is conducted to ensure that the identified AQRVs in the Class I area will
not be adversely impacted by the proposed increased emissions. The AQRV impact analysis is
conducted partly by the permit applicant and partly by the land manager. The applicant
29
calculates the changes in pollutant concentrations, deposition amounts, or visibility extinction
that will result from the proposed project emissions. The land manager assesses the extent to
which these changes in pollution level will affect sensitive resources and have an adverse impact
on an AQRV. As part of this process, the land manager will, to the extent allowable by available
data:
identify AQRVs
identify data and studies that constitute the basis for identification of AQRVs
identify sensitive receptors and pollutants of concern that can potentially impact
those receptors
identify pollutant concentrations or loads above which adverse impacts are
expected
recommend methods for predicting pollutant concentrations, loads, and related
impacts
suggest screening level values to assess whether the proposed emissions would
have a de minimis impact on AQRVs
The FCPC has designated Water Quality and Aquatic Systems as AQRVs to be protected
against air pollution degradation. These AQRVs can be adversely impacted by atmospheric
deposition of Hg, S, and N. Important effects include Hg methylation (which is related to both
Hg and S deposition), acidification (which is related to both S and N deposition), and
fertilization of water and soils (which is related to N deposition). In order for the FCPC to
determine whether any future emissions source would adversely impact the designated AQRVs,
The FCPC must establish threshold effects levels, which represent the amount of additional
(above ambient) deposition from a proposed new, or modified existing, source below which an
adverse effect will not occur. Such thresholds are proposed herein. Once atmospheric deposition
of S, N, or Hg is high enough that a deposition concern threshold has been reached, any further
increase in emissions that would contribute additional deposition and cause increased adverse
effects is considered unlikely to be acceptable. This is especially true for a process such as Hg
methylation because MeHg bioaccumulates in fish, sometimes to toxic levels.
2.1. Importance of Water Quality and Aquatic System AQRVs to the FCPC
Potawatomi tribal members have a close link to the natural environment, including its
water quality and wildlife. Elements of the natural environment are important to religious rituals,

30
ceremonies, and medicines. Contamination of tribal waters, including entry of Hg into the food
web, jeopardizes the tribe’s cultural and religious beliefs and practices and threatens public
health. The FCPC designated water quality and aquatic systems as AQRVs because:
tribal members rely on fish as part of their traditional subsistence way of life,
pure water is important to the tribe’s cultural and religious practices, and
recreational fishing is important to the tourism economy in and around the FCPC
reservation, upon which the FCPC depends.
The traditional subsistence way of life followed by many FCPC tribal members relies heavily on
fish, clean water, and other natural resources. A Wisconsin state-wide fish advisory was issued
by WDNR due to Hg contamination of fish
(http://dnr.wi.gov/fish/consumption/FishAdvisoryweb2011.pdf). Thus, Hg contamination
threatens tribal public health. Because many tribal members consume large quantities of fish
compared to the general population, they are at heightened risk of Hg contamination.
The FCPC is the largest employer in Forest County and is dependent on tourism focused
on outdoor recreation. Contamination of fish and other aquatic resources with Hg discourages
recreational fishing and threatens the economic well-being of the FCPC and its tribal members.
2.2. FCPC Study Area
The 393 km2 FCPC study area designated for this AQRV evaluation is comprised of all
land area from which surface water drains onto or within FCPC reservation lands (Figure 3).
Primary drainages within the study area include Otter Creek, Rat River, and North Branch
Oconto River. Wetlands, which are strongly associated with Hg methylation, are abundant in the
study area and throughout the state of Wisconsin. More than 5 million acres (15.5% of total land
area) of wetland exist within Wisconsin. The study area is located in the southern portion of
Forest County, which is ranked 9th
among all 72 Wisconsin counties in wetland percentage, with
almost one-quarter of the land area mapped as wetland (data from
WDNR;http://dnr.wi.gov/wetlands/acreage.html). The 2006 National Land Cover Database
(NLCD; U.S. EPA 2011) estimates that 27.2% of the study area is classified as wetland (Figure
4). The abundance of wetlands within the study area increases sensitivity to Hg methylation,
especially in surface waters such as Devils Lake that are high in DOC and low in ANC.
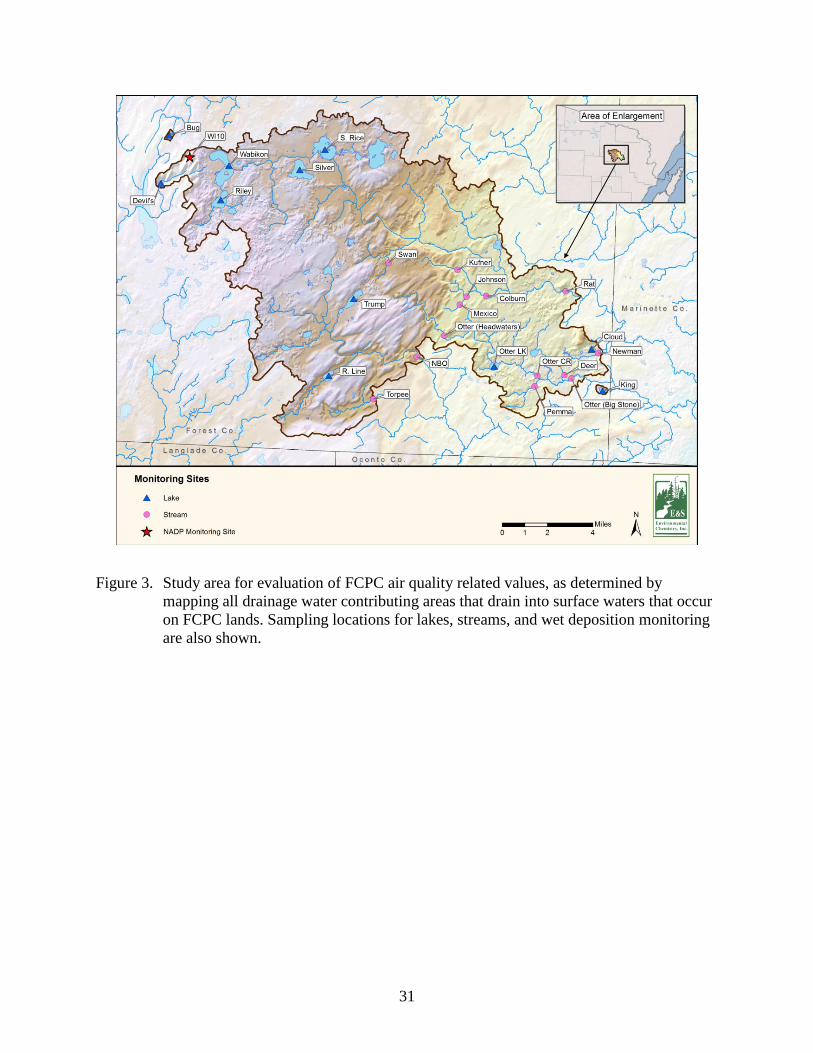
31
Figure 3. Study area for evaluation of FCPC air quality related values, as determined by
mapping all drainage water contributing areas that drain into surface waters that occur
on FCPC lands. Sampling locations for lakes, streams, and wet deposition monitoring
are also shown.

32
Figure 4. Land cover in the FCPC study area, based on National Land Cover Data. Note:
“Other” includes: Barren land, Shrub/Scrub and Grassland/Herbaceous.
Estimates of annual wet and dry deposition of N, S, and Hg to the FCPC study area are
summarized in Table 2. Measured wet N, S and Hg deposition data were derived from the
National Acid Deposition Program/National Trends Network (NADP/NTN)/MDN deposition
monitoring site located in the northwestern portion of the study area near Devils Lake (WI10;
elevation 570 m). Dry N and S deposition were estimated using measurements of wet deposition
combined with dry-to-wet ratios calculated at the nearest Clean Air Status and Trends Network
(CASTNET) dry deposition monitoring site (PRK134; elevation 472 m) located approximately
144 km ESE of the study area. Dry Hg deposition is less well known, but is probably equal to, or
slightly higher than, wet Hg deposition.

33
Table 2. Measured values of annual wet deposition at the NADP NTN/MDN monitoring site near Devils Lake
and estimated dry deposition based on dry-to-wet deposition ratios at the CASTNET site PRK134 for
the period 2006-2010.
Annual Wet Deposition Dry-to-Wet Deposition Ratios Total Deposition
S
(kg/ha/yr)
N
(kg/ha/yr)
Hg
(µg/m2/yr)
S N Hg
S
(kg/ha/yr)
N
(kg/ha/yr)
Hg
(µg/m2/yr)
1.83 3.41 6.4 0.24 0.17 1.31 2.27 3.99 14.7
1 Dry deposition of Hg is poorly known, but is estimated to range up to about 1.3 times wet Hg deposition (Risch et
al. 2012a)
Annual average wet S and N deposition amounts at NADP/NTN monitoring station WI10
(Devils Lake) for the five-year period 2006 through 2010 were 1.83 kg S/ha/yr and 3.41 kg
N/ha/yr (Table 2). The dry-to-wet ratios for S and N averaged over the most recent available
five-year period at the nearest CASTNET dry deposition monitoring station were 0.24 and 0.17,
respectively. Thus, estimated total (wet plus dry) deposition on FCPC lands is currently
approximately 2.27 kg S/ha/yr and 3.99 kg N/ha/yr. Measured annual wet Hg deposition,
averaged across the same five-year period was 6.4 µg/m2/yr. Dry Hg deposition is not commonly
measured, but has been estimated to approximately equal or exceed wet deposition by about 30%
(Risch et al. 2012a). Assuming that dry Hg deposition equals 1.3 times the wet deposition level,
the estimated current annual average total Hg deposition on FCPC lands is 14.7 µg/m2/yr.
2.3. Protection Against Methylation of Hg
Because of its cultural and recreational importance, Devils Lake has been sampled and
tested for Hg contamination since 1995 by the FCPC (Horsley & Witten 2003). Devils Lake is
heavily used by the Potawatomi Tribe as a fishing and recreation site. In 2006, Devils Lake plus
three other lakes on the reservation (Bug, Cloud, and King lakes) were sampled to determine the
concentrations of Hg in fish tissue. High concentrations of Hg were found in fish, especially in
largemouth bass.
Published total Hg concentration in water for Devils Lake and its inlet stream suggest
epilimnetic concentrations in the lake near 3 ng/L; both hypolimnetic concentrations in the lake
and concentrations in the stream have been measured to be three- to four-fold higher (Eckley et
al. 2005, Watras et al. 2005). Such conditions of relatively low pH and ANC and relatively high
DOC and Hg concentrations are considered highly susceptible to Hg methylation and
bioaccumulation.

34
Studies of FCPC surface waters and surface waters elsewhere in Wisconsin and the
broader northern Great Lakes region have documented that many water bodies are contaminated
with high levels of Hg. This is especially true for Devils Lake, which is of great cultural,
recreational, and spiritual importance to the Tribe. As a consequence of high levels of Hg found
in fish tissue tested from Devils Lake, the Tribe issued a fish advisory to limit human
consumption of fish from Devils Lake. Because Hg is already at unsafe levels in Devils Lake and
other water bodies in and near the FCPC reservation, the collective CLs of S and Hg deposition
for protecting these impacted watersheds against Hg methylation have already been exceeded.
Additional sources of either S or Hg are considered unacceptable because of the likelihood of
enhanced Hg methylation that this would cause. Additional inputs of either S or Hg to FCPC
lakes would contribute to further diminishment of the water bodies’ significance to the Tribe,
impair the natural ecosystem, and impair the quality of Tribal members’ and visitor’s
experiences. Based on guidance from the FLMs provided in the FLAG Phase I Report (USFS et
al. 2010), such effects are unacceptable.
Devils Lake and other water bodies on and near the FCPC Class I area contain levels of
Hg that are considered to be unsafe for protecting human health and fish-eating wildlife. Any
increase in the atmospheric deposition of either S or Hg would likely increase MeHg production
within the Class I area, thereby causing additional Hg contamination of fish and wildlife. For that
reason, the threshold effects level for additional atmospheric deposition of both S and Hg should
be set at zero in order to prevent further Hg methylation and bioaccumulation.
Lakes and streams sampled for water quality by the FCPC are mapped in Figure 3. These
water quality data confirm that sampled lakes and streams on and around the FCPC reservation
are wetland-influenced, with DOC concentrations typically higher than 10 mg/L. Surface water
acid-base chemistry is commonly reflected in the variable ANC, which can be determined in a
laboratory by titration (sometimes called titrated alkalinity) or can be calculated (sometimes
called calculated ANC, or CALK) by subtracting the sum of the concentrations of mineral acid
anions from the sum of the concentrations of base cations:
CALK = (Ca2+
+ Mg2+
+ Na+ + K
+) – (SO4
2- +NO3
- + Cl
-) (1)
Titrated and calculated ANC values for a given water sample are generally similar. However, in
water that contains substantial concentrations of DOC, the titrated ANC can be appreciably
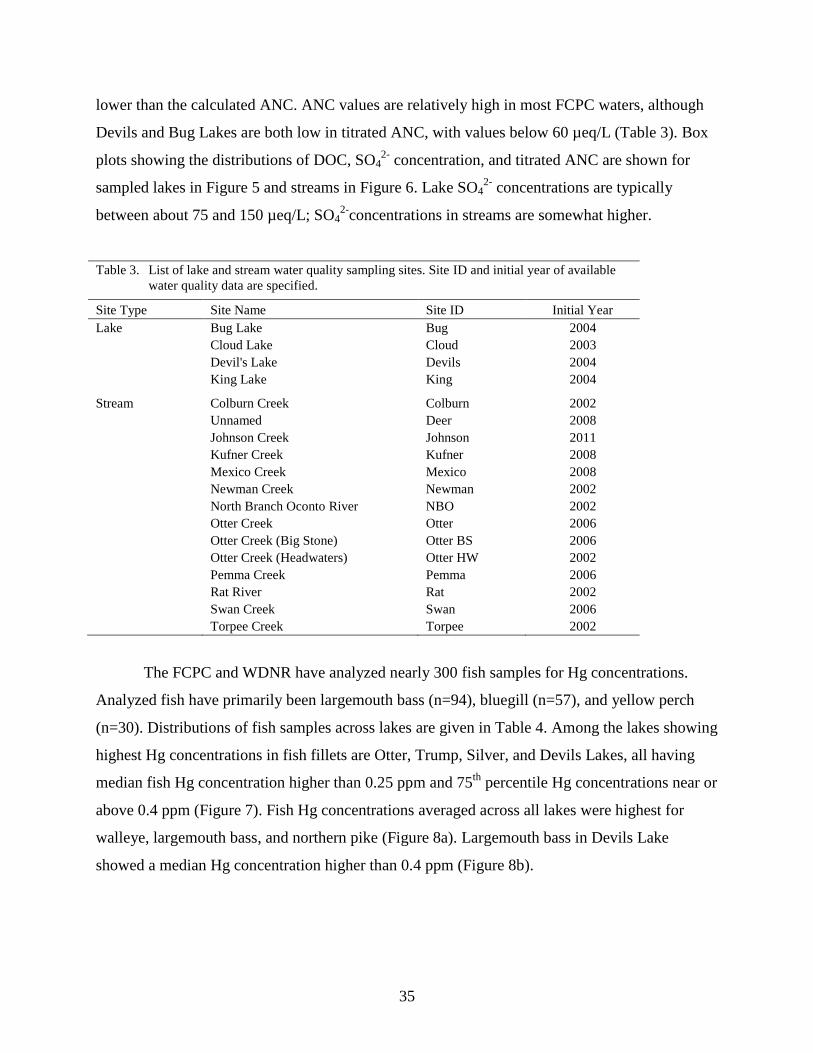
35
lower than the calculated ANC. ANC values are relatively high in most FCPC waters, although
Devils and Bug Lakes are both low in titrated ANC, with values below 60 µeq/L (Table 3). Box
plots showing the distributions of DOC, SO42-
concentration, and titrated ANC are shown for
sampled lakes in Figure 5 and streams in Figure 6. Lake SO42-
concentrations are typically
between about 75 and 150 µeq/L; SO42-
concentrations in streams are somewhat higher.
Table 3. List of lake and stream water quality sampling sites. Site ID and initial year of available
water quality data are specified.
Site Type Site Name Site ID Initial Year
Lake Bug Lake Bug 2004
Cloud Lake Cloud 2003
Devil's Lake Devils 2004
King Lake King 2004
Stream Colburn Creek Colburn 2002
Unnamed Deer 2008
Johnson Creek Johnson 2011
Kufner Creek Kufner 2008
Mexico Creek Mexico 2008
Newman Creek Newman 2002
North Branch Oconto River NBO 2002
Otter Creek Otter 2006
Otter Creek (Big Stone) Otter BS 2006
Otter Creek (Headwaters) Otter HW 2002
Pemma Creek Pemma 2006
Rat River Rat 2002
Swan Creek Swan 2006
Torpee Creek Torpee 2002
The FCPC and WDNR have analyzed nearly 300 fish samples for Hg concentrations.
Analyzed fish have primarily been largemouth bass (n=94), bluegill (n=57), and yellow perch
(n=30). Distributions of fish samples across lakes are given in Table 4. Among the lakes showing
highest Hg concentrations in fish fillets are Otter, Trump, Silver, and Devils Lakes, all having
median fish Hg concentration higher than 0.25 ppm and 75th
percentile Hg concentrations near or
above 0.4 ppm (Figure 7). Fish Hg concentrations averaged across all lakes were highest for
walleye, largemouth bass, and northern pike (Figure 8a). Largemouth bass in Devils Lake
showed a median Hg concentration higher than 0.4 ppm (Figure 8b).

36
Figure 5. Box plots showing the distribution of lake water DOC, SO42-
, and alkalinity at FCPC
lake monitoring sites. Each site is represented by at least 76 water samples.
Bug Cloud Devils King
0
500
1000
1500
2000
2500
Alk
alin
ity (
µeq/L
)
Bug Cloud Devils King
0
5
10
15
DO
C (
mg/L
)
Bug Cloud Devils King
0
70
140
210
280
350
Sulfate
(µ
eq/L
)

37
Figure 6. Box plots showing the distribution of stream water DOC, SO42-
, and alkalinity at
FCPC stream monitoring sites. Each site is represented by at least 40 samples, except
Johnson Creek which only had 4 recent samples.
Bug
Clo
ud
Colb
urn
Deer
Devils
Johnson
Kin
g
Kufn
er
Mexic
o
NB
O
New
man
Ott
er
Ott
er
BS
Ott
er
HW
Pem
ma
Rat
Sw
an
Torp
ee
0
2000
4000
6000
Alk
alin
ity (
µeq/L
)
Colb
urn
De
er
Jo
hnso
n
Kufn
er
Me
xic
o
NB
O
Ne
wm
an
Ott
er
Ott
er
BS
Ott
er
HW
Pe
mm
a
Ra
t
Sw
an
To
rpee
0
10
20
30
40
50
60
70D
OC
(m
g/L
)
Colb
urn
De
er
Jo
hnso
n
Kufn
er
Me
xic
o
NB
O
Ne
wm
an
Ott
er
Ott
er
BS
Ott
er
HW
Pe
mm
a
Ra
t
Sw
an
To
rpee
0
200
400
600
Sulfa
te (
µeq/L
)

38
Table 4. Number of fish samples and date ranges for which skin-on fillet total Hg samples are
available, by species. Data were compiled from the Forest County Potawatomi
Community (Steinbach 2011) and the Wisconsin Department of Natural Resources
databases.
Species ID Species
Number of
Samples
Years for Which Data Are
Available
B. Trout Brook trout 4 2006
Bluegill Bluegill 57 2006-2010
Crappie Black crappie 15 2006-2010
L. Bass Largemouth bass 94 1998-2010
N. Pike Northern pike 24 1998-2010
Pumpkin Pumpkinseed 14 2006-2010
R. Bass Rock bass 15 2006-2010
R. Trout Rainbow trout 2 2010
S. Bass Smallmouth bass 2 1998
W. Sucker White sucker 9 2006-2010
Walleye Walleye 11 1998-2010
Y. Bull Yellow bullhead 1 2006
Y. Perch Yellow perch 30 2006-2010
Bug
Clo
ud
Devils
Kin
g
Ott
er
LK
R.
Lin
e
Rile
y
S.
Ric
e
Silv
er
Tru
mp
Wabik
on
0.0
0.2
0.4
0.6
0.8
1.0
Merc
ury
(ppm
)
Figure 7. Total Hg concentrations in skin-on fillets of all sampled fish species, by lake.

39
A)
B)
Figure 8. Total Hg concentrations in skin-on fillets of fish species sampled in A) all lakes
located within the study area and B) Devils Lake only.
B.
Tro
ut
Blu
egill
Cra
ppie
L.
Bass
N.
Pik
e
Pum
pkin
R.
Bass
W.
Sucker
Walle
ye
Y.
Perc
h
0.0
0.2
0.4
0.6
0.8
1.0
Merc
ury
(ppm
)
Bluegill Crappie L. Bass
0.0
0.2
0.4
0.6
0.8
1.0
Merc
ury
(ppm
)

40
Reported fish Hg content risk thresholds for protecting piscivorous wildlife against
sublethal effects range between about 0.2 and 0.3 ppm (ww, reported in fish fillets [Evers et al.
2011a]) or whole fish (Beckvar et al. 2005, Dillon et al. 2010, Sandheinrich and Wiener 2011).
Measured values in fish collected from several of the sampled lakes on FCPC lands and
elsewhere within the study area (Figure 7) were substantially higher than these threshold effects
levels. Furthermore, concentrations of Hg measured in fish from Devils Lake were substantially
higher than the median Hg concentrations reported for yellow perch collected throughout the
northern Great Lakes region by Wiener et al. (2012b; 0.14 ppm, ww).
The USFS designated concern thresholds for Hg in fish in two federal Class I areas in
reasonable proximity to the FCPC lands that are the subject of the analysis reported here: the
Boundary Waters Canoe Area Wilderness, MN and the Rainbow Lakes Wilderness, WI. The
concern threshold for Hg in fish tissue is 0.05 ppm (ww, skin-on fillet;
http://www.fs.fed.us/air/technical/class_1/wilds.php?recordID=6) in both wilderness areas. This
level is exceeded in all monitored FCPC lakes (Figure 7).
2.4. Protection Against Acidification
The USFS designated concern thresholds for surface water ANC in the Boundary Waters
Canoe Area Wilderness and Rainbow Lakes Wilderness. The threshold for maintaining healthy
biological functioning in lakes and streams requires chronic ANC ≥ 25 µeq/L. Thus, FLMs have
adopted a screening level for lake ANC equal to 25 µeq/L to evaluate the likelihood of adverse
impacts of acidification on lake ecosystems. This screening level is applied here to measured
data for lakes on FCPC lands.
Water chemistry has been measured by FCPC in 4 lakes and 12 streams over the last
decade (Table 5). Published surface water titrated ANC has been near 25 µeq/L in Devils Lake
(Eckley et al. 2005). Titrated ANC in Devils Lake measured by FCPC was 20 µeq/L in 2006 and
30 µeq/L in 2010 (Table 5). Published water chemistry data for the Devils Lake watershed are
consistent with an interpretation of generally acid-sensitive, high-DOC water having pH below
6.0, ANC near the Forest Service screening level of 25 µeq/L, and DOC near 10 mg/L (Eckley et
al. 2005, Watras et al. 2005).

41
Table 5. Lake and stream DOC, alkalinity and calculated ANC values for two sampling occasions represented by
data necessary (major base cations and strong mineral acid anions) for determining the calculated ANC
(see text for the definition of calculated ANC).
July 2006 Sampling October 2010 Sampling
Site
Type SITE
DOC
(mg/L)
Titrated
ANC
(µeq/L)
Calculated
ANC (µeq/L)
DOC
(mg/L)
Titrated
ANC
(µeq/L)
Calculated
ANC (µeq/L)1
Lake Bug 4.6 60 109 5.1 58 114
Cloud 10.0 1,080 1,139 8.9 1,220 1,239
Devils 10.0 20 129 10.0 30 118
King 6.5 1,460 1,423 6.2 1,520 1,447
Stream Colburn 39.0 900 1,343 37.0 940 2,345
Deer No Data 48.0 760 1,243
Kufner No Data 30.0 660 2,275
Mexico No Data 50.0 840 2,615
NBO 13.0 1,680 1,832 18.0 1,600 2,365
Newman 19.0 1,980 2,117 23.0 1,720 2,422
Otter 14.0 1,920 2,043 19.0 1,680 2,302
Otter BS 20.0 1,520 1,570 21.0 1,540 2,161
Otter HW 11.0 1,960 2,135 12.0 2,000 2,551
Pemma 38.0 580 913 44.0 600 1,825
Rat 15.0 1,480 1,562 20.0 1,540 1,997
Swan 6.2 120 2,549 25.0 1,620 2,880
Torpee 27.0 1,720 1,969 19.0 2,000 2,689 1 It was necessary to combine data from two sampling occasions (Oct 13th and 25th, 26th, or 27th) to calculate
ANC values representative of 2010.
2.5. Protection Against Fertilization of Water and Soils
It is not known to what extent surface waters on FCPC lands are N-limited and therefore
susceptible to nutrient enrichment impacts due to atmospheric N deposition. It is also not known
whether atmospheric inputs of N have been sufficient to cause changes in plant species
distributions or abundance due to nutrient enrichment. Current atmospheric N deposition to
FCPC lands in the range of 4 kg N/ha/yr (Table 2) is at the low end of the range suggested by
Greaver et al. (2011) to protect peatlands in the United States from effects associated with
changes in productivity. Peatlands are among the plant community types expected to be most
sensitive to nutrient enrichment. Thus, fertilization effects on FCPC lands are possible for the
most sensitive plant communities under current N loading.

42
3. CRITICAL LOAD
The CL is the threshold of air pollution deposition that causes harm to sensitive
resources. If harm has been caused, then by definition the CL has been exceeded in the short
term. In other words, it is exceeded based on ambient conditions, rather than based on long-term
steady-state conditions. The CL is usually calculated as a steady-state value, representing the
deposition level that can be sustained over the long term without experiencing ecosystem harm.
3.1. Critical Load to Protect Against Hg Methylation
The CL approach has not yet been applied in the scientific literature to the topic of
atmospheric Hg deposition or for protecting ecosystems against Hg methylation caused by
atmospheric S deposition. Nevertheless, the basic principles remain the same. The observation
that fish Hg levels in FCPC lakes exceed thresholds for protection of wildlife and human health
indicate that short-term CLs of Hg and S deposition for protection against Hg methylation have
been exceeded. In other words, methylation of Hg is already so high that the health of wildlife
and humans who consume fish is threatened. Any further increases in the air pollutants that
contribute to methylation is considered to be unacceptable.
3.2. Critical Load to Protect Waters Against Acidification
The CL to protect against acidification can be calculated using an acid-base chemistry
model such as the Model of Acidification of Groundwater in Catchments (MAGIC) or the
Photosynthesis and EvapoTranspiration-Biogeochemical (PnET-BGC) model, or using a simple
mass balance model such as the Steady State Water Chemistry (SSWC) model. The CL can also
be derived from empirical dose-response data. The CL can be calculated to protect particular
sensitive resources from harm, and these can include, for example, fish presence, fish species
richness, concentration of Hg in fish or wildlife, lake zooplankton, stream benthic invertebrates,
terrestrial plant biodiversity, etc. Nevertheless, the fact that lakewater alkalinity in Devils Lake
has been reported near or below 25 µeq/L indicates that the CL to protect against water
acidification may have been exceeded in the Devils Lake watershed, at least in the short term.
Long-term steady-state CL values might be higher or lower. Dynamic models can also calculate
the target load (TL) which is specific to a particular point of time, such as for example to protect
fish species richness in the year 2100. This may require emissions reductions to achieve that goal

43
by 2100 for already-damaged resources or to prevent damage from occurring by 2100 for
resources as yet undamaged.
The CL of S, N, or acidity to protect against soil or water acidification can be calculated
by simple steady-state models, empirical models, or process-based dynamic models. Such
calculations are available at locations throughout much of the United States. Minnesota
established a state-wide deposition standard of 3.7 kg S/ha/yr in 1982, which is higher than the
estimated total S deposition on FCPC lands (Table 2). The intention with the Minnesota standard
was to protect lakes having ANC < 50 µeq/L from acidification damage. In an area where there
are multiple proposed new sources or where resources are already impaired, the DAT approach
may not be completely protective, and the CL approach may be more appropriate. In considering
the potential for adverse impact, the land manager considers the nature of the sensitive AQRVs,
CLs, ambient deposition levels, and/or expected impacts due to the proposed source. Where
adequate information is not available, the FLAG report (USFS et al. 2010) recommended use of
data from nearby, or ecologically similar, areas.
Critical and target loads have not yet been calculated in a formal manner for protecting
lake or stream resources on FCPC lands against damages caused by acidic deposition inputs.
Nevertheless, the fact that water ANC near or below 25 µeq/L has been reported in Devils Lake
indicates that the short-term CL to protect against water acidification may have already been
exceeded in the Devils Lake watershed.
3.3. Critical Load to Protect Terrestrial Resources
Pardo et al. (2011b) reviewed available empirical CL data for ecoregions across the
United States to protect against adverse impacts to terrestrial resources attributable to
atmospheric N deposition. They concluded that the CL for both hardwood and conifer forest
soils in the Northern Forests ecoregion (which includes FCPC lands) could be set at 8 kg N/ha/yr
to protect against NO3- leaching, which can contribute to surface water and soil acidification
(Aber et al. 2003). The empirical CL to protect against negative tree growth response in this
ecoregion was estimated by Pardo et al. (2011b) to be 3 kg N/ha/yr, based on research findings
of Thomas et al. (2010) documenting effects on tree growth. On this basis, the CL to protect
against NO3- leaching in the FCPC study area has not been exceeded, but the CL to protect
against decreased tree growth has been exceeded by ambient N deposition (Table 2).

44
4. ESTABLISHMENT OF BACKGROUND LEVELS AND THRESHOLD EFFECTS
LEVELS
Proposed emissions sources are assessed by FLMs for evaluation of acidification and
nutrient enrichment effects at locations near (within 50 km) and distant (> 50 km) from Class I
areas. The U.S. EPA introduced a screening criterion as part of the Regional Haze Rule (RHR),
based on the annual emissions strength of a proposed new emissions source and its distance from
a Class I area. The FLAG Phase I report (USFS et al. 2010) adopted a similar approach. A new
source location > 50 km from a Class I area is deemed to have negligible impact on the acid or
nutrient status of Class I AQRVs if its total sulfur dioxide, nitrogen oxides (NOx), particulate
matter, and sulfuric acid annual emissions (in tons/yr based on 24 hr maximum allowable
emissions), divided by the distance (in km) from the Class I area (Q/D), is 10 or less. Such a
screening criterion may not be appropriate for evaluation of potential effects of Hg and/or S
deposition on Hg methylation, especially because the tipping point for protecting against Hg
methylation is already exceeded in many FCPC lakes and because of the toxic and
bioaccumulative nature of MeHg.
Recent FLAG documents (USFS et al. 2010, 2011) provided the following guidance
regarding determination of potential acidification or nutrient enrichment effects from a new or
modified emissions source in a Class I area where the CL has not been exceeded:
1. If the source is further than 50 km from the Class I area, effects are considered
negligible if annual emissions in tons/yr (based on 24-hr maximum allowable
emissions, Q) divided by distance (D) in km from the Class I area is 10 or less (Q/D
< 10).
2. If Q/D > 10, but the source’s predicted contribution to deposition in kg/ha/yr in the
Class I area is less than the DAT (defined below), the source is presumed to be
negligible.
3. If a refined analysis suggests that the source’s inputs would not cause or contribute
to harm in the Class I area (i.e., CL not exceeded) or that the source would provide
some ancillary environmental benefits, as described in the FLAG Phase I report
(USFS et al. 2010), the impacts are presumed to not be adverse.
4. If there are mitigation strategies that could alleviate the potential adverse impact, a
more detailed process could be applied (USFS et al. 2010).

45
If a source’s contribution to increased deposition in a Class I area is predicted to exceed
the DAT, a refined analysis may be warranted. This refined analysis would address questions
such as the following:
1. Are AQRVs in the Class I area sensitive to deposition?
2. Are AQRVs currently impacted by deposition?
3. Have critical or target loads been developed?
4. If so, does the modeled deposition exceed the critical or target load?
Each of these questions is examined below with respect to potential impacts of S, N, and Hg
deposition on the Potawatomi tribal lands that are the subject of this report.
Are AQRVs sensitive to deposition?
As outlined in the previous sections of this report, AQRVs associated with aquatic
resources on FCPC lands are sensitive to atmospheric deposition of S, Hg, and potentially N.
This sensitivity is supported by extensive scientific research conducted throughout the northern
Great Lakes region, including within the FCPC area that is the focus of this report.
Are AQRVs currently impacted by deposition?
AQRVs on FCPC lands are clearly impacted by recent and current levels of S and Hg
deposition. This is reflected in the high concentrations of Hg in fish collected from FCPC lakes
and to a lesser extent in the low ANC of Devils Lake. Lake ANC in this lake is influenced by
both moderate lakewater SO42-
concentration contributed by atmospheric S deposition and
naturally occurring high DOC.
Have critical or target loads been developed?
Critical and target loads have not been formally developed for atmospheric deposition of
S, Hg, or N to watersheds on FCPC lands. Nevertheless, the demonstrated impacts reflected in
high Hg concentrations in fish and low lake ANC indicate that CLs have been exceeded, at least
in the short term.

46
Does current deposition exceed the critical or target load?
Current deposition exceeds the critical or target load for protecting aquatic ecosystems on
FCPC lands against Hg methylation and at least on occasion also the critical or target load for
protecting aquatic ecosystems against acidification. It is not known if critical or target loads are
exceeded for protection of aquatic, terrestrial, or transitional ecosystems against nutrient
enrichment. Such impacts are possible for the most sensitive ecosystems.
4.1. Sulfur and Mercury Deposition as Related to Hg Methylation
Various indicators can be used to evaluate whether atmospheric deposition is high
enough to trigger adverse eutrophication, acidification or nutrient enrichment effects. The NPS
and U.S. Fish and Wildlife Service (USFWS) developed DATs for S and N in response to
requests by permitting authorities and permit applicants to develop consistent, predictable permit
review processes. A DAT is defined as the additional amount of S or N deposition within a Class
I area below which estimated impacts from a proposed new or modified source are considered
insignificant. The DAT represents total (wet plus dry) deposition. It is compared with the
estimated amount of additional deposition resulting from the proposed source, as modeled using
an atmospheric transport model.
A DAT for Hg has not been developed on the basis of assumed background Hg
deposition by the FLMs, probably in part because background Hg deposition is less well known.
Nevertheless, an alternative DAT for wet deposition can also be expressed on the basis of the
minimum concentration that can be detected in precipitation in the analytical laboratory. Using
this approach, an increase in wet deposition is considered significant if the increase in
precipitation concentration, and associated wet deposition, is measurable in the deposition
monitoring network. This approach for specifying a DAT based on what is measurable in the
analytical laboratory has been followed by USFS (2000) for the James River Face Class I
Wilderness. It constitutes an alternate approach for calculating the DAT for Hg and S for
protecting against Hg methylation in view of the lack of data regarding background Hg
deposition.
Using this approach, the minimum detectable level of increase in S or Hg wet deposition
to FCPC lands to protect against Hg methylation can be calculated using the following equation:
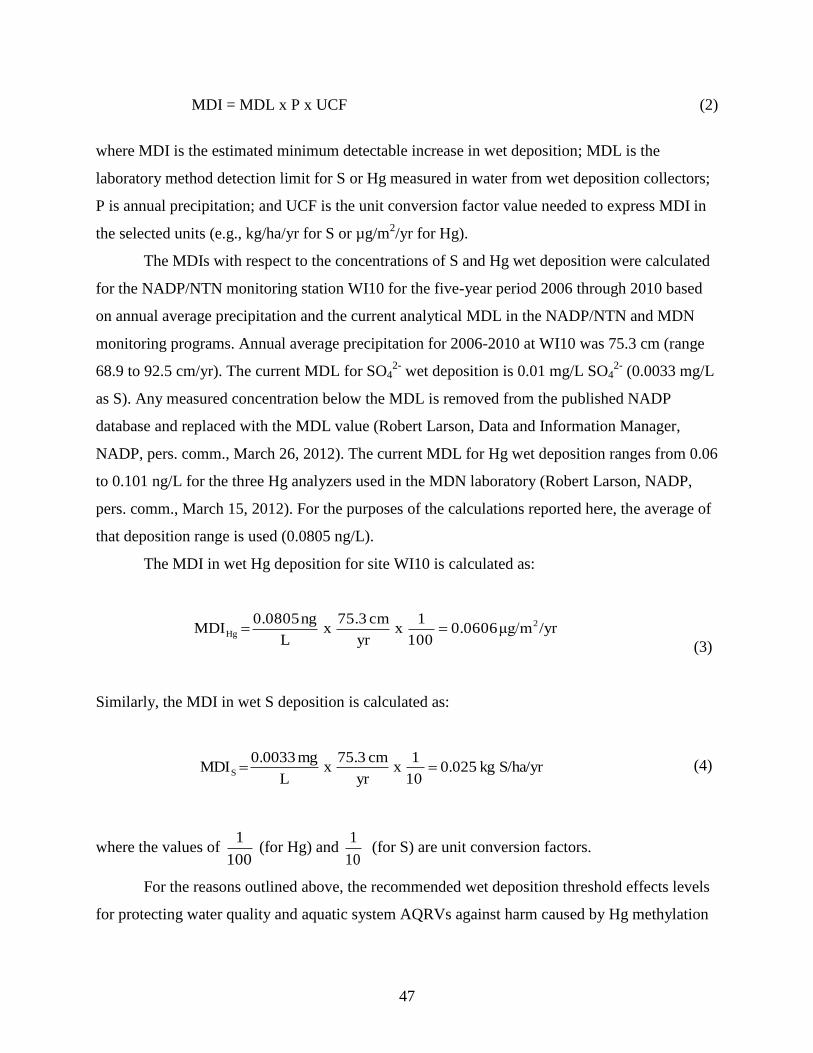
47
MDI = MDL x P x UCF (2)
where MDI is the estimated minimum detectable increase in wet deposition; MDL is the
laboratory method detection limit for S or Hg measured in water from wet deposition collectors;
P is annual precipitation; and UCF is the unit conversion factor value needed to express MDI in
the selected units (e.g., kg/ha/yr for S or µg/m2/yr for Hg).
The MDIs with respect to the concentrations of S and Hg wet deposition were calculated
for the NADP/NTN monitoring station WI10 for the five-year period 2006 through 2010 based
on annual average precipitation and the current analytical MDL in the NADP/NTN and MDN
monitoring programs. Annual average precipitation for 2006-2010 at WI10 was 75.3 cm (range
68.9 to 92.5 cm/yr). The current MDL for SO42-
wet deposition is 0.01 mg/L SO42-
(0.0033 mg/L
as S). Any measured concentration below the MDL is removed from the published NADP
database and replaced with the MDL value (Robert Larson, Data and Information Manager,
NADP, pers. comm., March 26, 2012). The current MDL for Hg wet deposition ranges from 0.06
to 0.101 ng/L for the three Hg analyzers used in the MDN laboratory (Robert Larson, NADP,
pers. comm., March 15, 2012). For the purposes of the calculations reported here, the average of
that deposition range is used (0.0805 ng/L).
The MDI in wet Hg deposition for site WI10 is calculated as:
/yrμg/m0.0606100
1x
yr
cm75.3x
L
ng0.0805MDI 2
Hg
(3)
Similarly, the MDI in wet S deposition is calculated as:
S/ha/yrkg0.02510
1x
yr
cm75.3x
L
mg0.0033MDIS (4)
where the values of 100
1 (for Hg) and
10
1 (for S) are unit conversion factors.
For the reasons outlined above, the recommended wet deposition threshold effects levels
for protecting water quality and aquatic system AQRVs against harm caused by Hg methylation
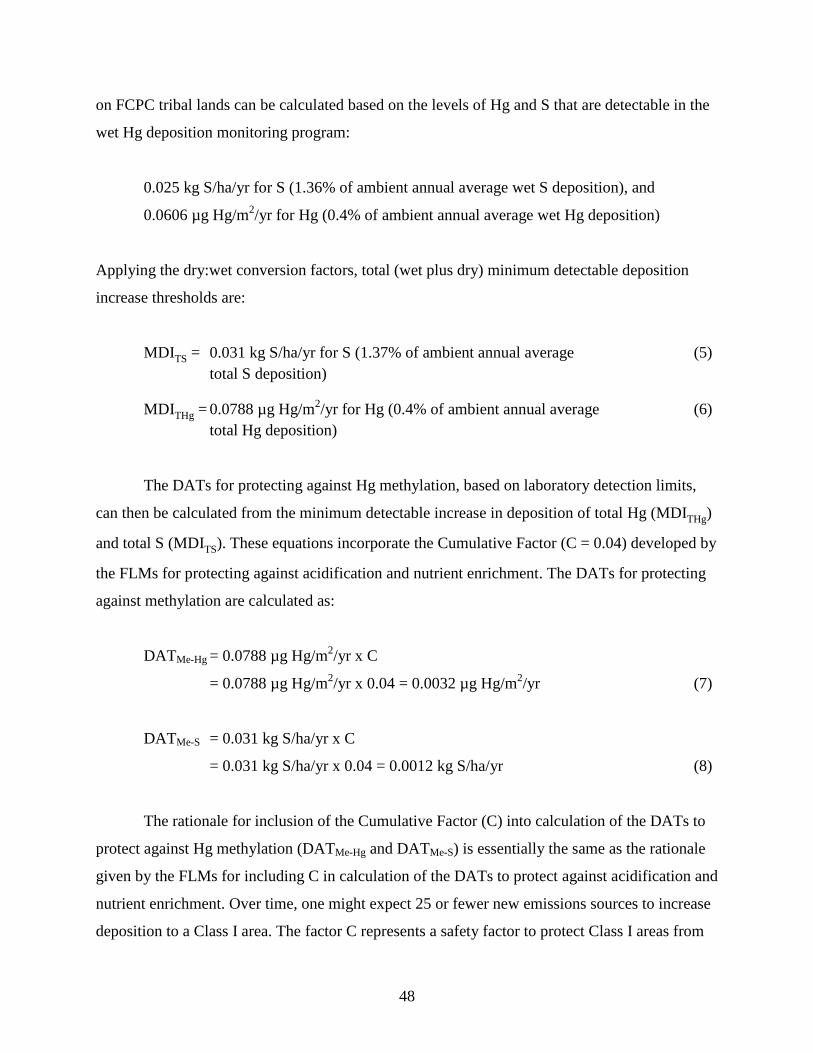
48
on FCPC tribal lands can be calculated based on the levels of Hg and S that are detectable in the
wet Hg deposition monitoring program:
0.025 kg S/ha/yr for S (1.36% of ambient annual average wet S deposition), and
0.0606 µg Hg/m2/yr for Hg (0.4% of ambient annual average wet Hg deposition)
Applying the dry:wet conversion factors, total (wet plus dry) minimum detectable deposition
increase thresholds are:
MDITS = 0.031 kg S/ha/yr for S (1.37% of ambient annual average (5)
total S deposition)
MDITHg = 0.0788 µg Hg/m2/yr for Hg (0.4% of ambient annual average (6)
total Hg deposition)
The DATs for protecting against Hg methylation, based on laboratory detection limits,
can then be calculated from the minimum detectable increase in deposition of total Hg (MDITHg)
and total S (MDITS). These equations incorporate the Cumulative Factor (C = 0.04) developed by
the FLMs for protecting against acidification and nutrient enrichment. The DATs for protecting
against methylation are calculated as:
DATMe-Hg = 0.0788 µg Hg/m2/yr x C
= 0.0788 µg Hg/m2/yr x 0.04 = 0.0032 µg Hg/m
2/yr (7)
DATMe-S = 0.031 kg S/ha/yr x C
= 0.031 kg S/ha/yr x 0.04 = 0.0012 kg S/ha/yr (8)
The rationale for inclusion of the Cumulative Factor (C) into calculation of the DATs to
protect against Hg methylation (DATMe-Hg and DATMe-S) is essentially the same as the rationale
given by the FLMs for including C in calculation of the DATs to protect against acidification and
nutrient enrichment. Over time, one might expect 25 or fewer new emissions sources to increase
deposition to a Class I area. The factor C represents a safety factor to protect Class I areas from

49
cumulative impacts. These impacts from new or modified sources are not necessarily limited to
local sources. They can be caused by other regional and/or distant sources. The approach
proposed here allocates 4% of the “allowable” (without exceeding what is measurable) increase
in deposition to the proposed new (or modified existing) source and 96% to potential other new
or expanded sources.
For the purpose of protecting FCPC resources against Hg methylation in response to
increased Hg or S deposition, this report recommends following the approach described above
using the DATs given in Table 6. Model estimates of either increased S or Hg deposition above
these thresholds due to a new or modified existing emissions source would be considered to be
above the threshold effects level for protecting against Hg methylation on FCPC lands and would
therefore be unacceptable.
Table 6. Deposition analysis thresholds (DATs) for FCPC lands.
Atmospherically Deposited
Pollutant Purpose of DAT DAT Value
N or S Protect against water acidification or
eutrophication
0.01 kg/ha/yr
S Protect against Hg methylation 0.0012 kg/ha/yr
Hg Protect against Hg methylation 0.0032 µg/m2/yr
Class I land managers must take into consideration site-specific information regarding
each Class I area, not just in relation to the DAT or the MDI, but also in relation to other factors,
including whether adverse impacts have been documented, or are suspected (NPS and USFWS
2002). Because MeHg concentration are unacceptably high in fish from FCPC lakes, posing risk
to humans who consume fish and to piscivorous wildlife, it is clear that the CLs of S and Hg
deposition to protect against Hg methylation are exceeded in the short term, based on ambient
conditions. For that reason, and because of the toxic and bioaccumulative nature of MeHg, DATs
based on the MDI approach are more appropriate than DATs based on assumed background
deposition. This is because the aquatic ecosystems are already damaged and no additional S or
Hg input to these damaged aquatic ecosystems is acceptable. Further increase in MeHg will
increase toxicity to people and wildlife who consume fish.

50
Biomagnification of Hg is also an important DAT issue. An increase in S and/or Hg
deposition that is too small to detect in a precipitation sample may nevertheless biomagnify to a
detectable level in fish. I do not have a basis for quantifying that effect. Nevertheless, this
complication provides additional support for the need to be conservative in setting DATs for
protecting against Hg methylation.
4.2. Sulfur and Nitrogen Deposition as Related to Acidification and Fertilization of
Water and Soils
The DAT calculation reported by FLAG (USFS et al. 2011) relies on an estimate of
Natural Background Deposition, B, developed from the peer-reviewed scientific literature and
expert judgment. This natural background estimate is modified by including a Variability factor,
V and a Cumulative Factor, C:
DAT = B x V x C (9)
Values of B equal to 0.5 kg/ha/yr for the East and 0.25 kg/ha/yr for the West were selected by
NPS and USFWS (NPS and USFWS 2002) for both S and N as representative of the low end of
the regional range of reasonable estimated natural background deposition values.
The variability factor, V = 0.5, was selected with the reasoning that a total increase in
deposition from all sources by an amount greater than 50% of natural background deposition
would trigger management concerns. Thus, an additional 50% of natural background deposition
could be added to existing natural plus anthropogenic deposition and still be considered
insignificant. The FLMs made the determination that it was appropriate to consider that all
combined anthropogenic sources could contribute up to 50% of natural background deposition
without triggering concerns regarding resource impacts because the estimates of natural
background S and N deposition were very conservative and the range of natural variability in
deposition could be plus or minus 50% (USFS et al. 2011). For specifying a DAT for Hg using
this or a related approach, the estimate of background Hg deposition or alternative parameter
should be similarly conservative.
The Cumulative Factor (C) adjusts for the concern that cumulative effects from multiple
relatively small sources could produce impacts even if a single source, on its own, would not.
The federal land managers (FLMs) applied the 4% value used by EPA in determining Class I

51
increment levels of significant impact. Thus, C = 0.04, and C represents a 4% safety factor to
protect Class I areas from cumulative deposition impacts. This assumes that, over time, one
might expect 25 or fewer new local sources or an equivalent increase from more distant sources
to increase deposition in a Class I area. The FLMs reserved the right to modify the DAT in the
event that emissions from multiple existing and proposed new sources are higher than expected
(USFS et al. 2011).
For Class I parks and refuges east of the Mississippi, the DAT is calculated as:
DAT = 0.5 kg/ha/yr x 0.5 x 0.04 = 0.01 kg/ha/yr of N or S (10)
The FLMs adopted this approach and resulting values in the Federal Land Managers’
Interagency Guidance for Nitrogen and Sulfur Deposition Analyses (USFS et al. 2011). On this
basis, the USFS has adopted DATS for both S and N deposition to protect against water
acidification equal to 0.01 kg/ha/yr of S or N
(http://www.fs.fed.us/air/technical/class_1/wilds.php?recordID=6) at Boundary Waters Canoe
Area Wilderness, MN and at Rainbow Lakes Wilderness, WI.
For the purposes of protecting FCPC resources against acidification damage or
fertilization of water, this report recommends following the approach used by the NPS and USFS
and using a DAT of 0.01 kg/ha/yr of N or S (Table 6).
The DAT, MDI, and CL approaches provide different tools that can be used to evaluate
ecosystem protection issues. Any or all of these tools can be used to screen proposed emissions
sources to determine the likelihood of adverse impact.
5. SUMMARY
This report identifies appropriate threshold effects levels for water quality and aquatic
systems AQRVs on FCPC lands. The primary concern for protection of these AQRVs is the
potential for increases in MeHg in Devils Lake and other water bodies on FCPC Class I lands
that could be caused by increased atmospheric deposition of either S or Hg. The most important
route of entry of Hg into remote ecosystems in the region that includes FCPC lands is
atmospheric deposition of inorganic Hg. However, the most important source of the neurotoxic
MeHg to aquatic ecosystems is via microbially mediated methylation of inorganic Hg.
52
Atmospheric pollutant thresholds are addressed in the FLAG Phase I report, initially
drafted in 2000 and more recently revised in 2010 and 2011. The purpose of the FLAG Phase I
report is to assist permit applicants, state authorities, and land managers to develop more
consistent and objective approaches to the evaluation of AQRVs. This is needed for evaluation
of air pollution effects, caused by new or modified emissions sources, on AQRVs in Class I areas
under the New Source Review program, especially in the review of Prevention of Significant
Deterioration air quality permit applications. The FLAG Phase I report and its modifications
provide background information on effects levels and screening tools to determine if effects are
expected to be negligible based on the planned quantity of emissions, the distance between the
proposed source and the Class I area, and dose/response relationships. Among the primary issues
of concern to FLMs and tribal land managers are the effects of pollutant deposition (including S,
N, and Hg) on soils and surface waters.
The FCPC has designated Water Quality and Aquatic Systems as AQRVs to be protected
against air pollution degradation on tribal lands. These AQRVs can be adversely impacted by
atmospheric deposition of Hg, S, and N. Important effects include Hg methylation (which is
related to both Hg and S deposition), acidification (which is related to both S and N deposition),
and fertilization of water and soils (which is related to N deposition). In order for the FCPC to
determine whether any future emissions source would adversely impact the designated AQRVs,
The FCPC must establish threshold effects levels, which represent the amount of additional
(above ambient) deposition from a proposed new, or modified existing, source below which an
adverse effect will not occur. Such thresholds are proposed herein. Once atmospheric deposition
of S, N, or Hg is high enough that a deposition concern threshold has been reached, any further
increase in emissions that would contribute additional deposition is considered unlikely to be
acceptable.
Studies of FCPC surface waters and surface waters elsewhere in Wisconsin and the
broader northern Great Lakes region have documented that many water bodies are contaminated
with high levels of Hg. This is especially true for Devils Lake, which is of great cultural,
recreational, and spiritual importance to the Potawatomi Tribe. As a consequence of high levels
of Hg found in fish tissue tested from Devils Lake, the Tribe issued a fish advisory to limit
human consumption of fish from Devils Lake. Because Hg is already at unsafe levels in Devils
Lake and other water bodies in and near the FCPC reservation, the collective CLs of S and Hg
53
deposition for protecting these impacted watersheds against Hg methylation have already been
exceeded. Additional sources of either S or Hg are considered unacceptable because of the
likelihood of enhanced Hg methylation that this would cause. Additional inputs of either S or Hg
to FCPC lakes would contribute to further diminishment of the water bodies’ significance to the
Tribe, impair the natural ecosystem, and impair the quality of Tribal members’ and visitor’s
experiences. Based on guidance from the FLMs provided in the FLAG Phase I Report, such
effects are unacceptable.
Devils Lake and other water bodies on and near the FCPC Class I area contain levels of
Hg that are considered to be unsafe for protecting human health and fish-eating wildlife. Any
increase in the atmospheric deposition of either S or Hg would likely increase MeHg production
within the Class I area, thereby causing additional Hg contamination of fish and wildlife. For that
reason, the threshold effects level for additional atmospheric deposition of both S and Hg should
be set at zero in order to prevent further Hg methylation and bioaccumulation.
Reported fish Hg content risk thresholds for protecting piscivorous wildlife against
sublethal effects range between about 0.2 and 0.3 ppm (wet weight) in fish fillets or whole fish.
Measured values in fish collected from several of the sampled lakes on FCPC lands and
elsewhere within the study area were substantially higher than these threshold effects levels.
Furthermore, concentrations of Hg measured in fish from Devils Lake were substantially higher
than the median Hg concentrations reported for yellow perch collected throughout the northern
Great Lakes region (0.14 ppm, wet weight [ww]).
The USFS designated concern thresholds for Hg in fish in two federal Class I areas in
reasonable proximity to the FCPC lands that are the subject of the analysis reported here: the
Boundary Waters Canoe Area Wilderness, MN and Rainbow Lakes Wilderness, WI. The
concern threshold for Hg in fish tissue was established as 0.05 ppm (ww, skin-on fillet) in both
wilderness areas. This level is exceeded in all monitored FCPC lakes.
The USFS also designated concern thresholds for surface water ANC in the Boundary
Waters Canoe Area Wilderness and the Rainbow Lakes Wilderness. The threshold for
maintaining healthy biological functioning in lakes and streams requires chronic ANC ≥ 25
µeq/L. Thus, FLMs have adopted a screening level for lake ANC equal to 25 µeq/L to evaluate
the likelihood of adverse impacts of acidification on lake ecosystems. This screening level is
applied here to measured data for lakes on FCPC lands. Water chemistry has been measured by

54
FCPC in 4 lakes and 12 streams over the last decade. Published surface water ANC has been
below 25 µeq/L in Devils Lake and its inlet stream.
It is not known to what extent surface waters on FCPC lands are N-limited and therefore
susceptible to nutrient enrichment impacts due to atmospheric N deposition. It is also not known
whether atmospheric inputs of N have been sufficient to cause changes in plant species
distributions or abundance due to nutrient enrichment. Current atmospheric N deposition to
FCPC lands in the range of 4 kg N/ha/yr is at the low end of the range suggested to protect
peatlands in the United States from effects associated with changes in productivity. Peatlands are
among the plant community types expected to be most sensitive to nutrient enrichment. Thus,
fertilization effects on FCPC lands are possible for the most sensitive plant communities under
current N loading.
Potawatomi tribal members have a close link to the natural environment, including its
water quality and wildlife. Elements of the natural environment are important to religious rituals,
ceremonies, and medicines. Contamination of tribal waters, including entry of Hg into the food
web, jeopardizes the tribe’s cultural and religious beliefs and practices and threatens public
health. The FCPC designated water quality and aquatic systems as AQRVs because:
tribal members rely on fish as part of their traditional subsistence way of life,
pure water is important to the tribe’s cultural and religious practices, and
recreational fishing is important to the tourism economy in and around the FCPC
reservation, upon which the FCPC depends.
The traditional subsistence way of life followed by many FCPC tribal members relies heavily on
fish, clean water, and other natural resources.
AQRVs associated with aquatic resources on FCPC lands are sensitive to atmospheric
deposition of S, Hg, and potentially N. As documented in this report, this sensitivity is supported
by extensive scientific research conducted throughout the northern Great Lakes region. AQRVs
on FCPC lands are clearly impacted by recent and current levels of S and Hg deposition. This is
reflected in the high concentrations of Hg in fish collected from FCPC lakes and to a lesser
extent in the low ANC of Devils Lake. The ANC of this lake is influenced by both moderate
lakewater SO42-
concentration, likely contributed by atmospheric S deposition, and naturally
occurring high DOC associated with wetlands within the watershed.

55
Critical and target loads have not been formally developed for atmospheric deposition of
S, Hg, or N to watersheds on FCPC lands. Nevertheless, the demonstrated impacts reflected in
high Hg concentrations in fish and low lake ANC indicate that CLs have been exceeded, at least
in the short term.
Current deposition exceeds the critical or target load for protecting aquatic ecosystems on
FCPC lands against Hg methylation and at least on occasion also the critical or target load for
protecting aquatic ecosystems against acidification. It is not known if critical or target loads are
exceeded for protection of aquatic, terrestrial, or transitional ecosystems against nutrient
enrichment. Such impacts are possible for the most sensitive ecosystems.
Various indicators can be used to evaluate whether atmospheric deposition is high
enough to trigger adverse acidification or nutrient enrichment effects. The NPS and USFWS
developed DATs for S and N in response to requests by permitting authorities and permit
applicants to develop consistent, predictable permit review processes. A DAT is defined as the
additional amount of S or N deposition within a Class I area below which estimated impacts
from a proposed new or modified source are considered insignificant. The DAT represents total
(wet plus dry) deposition. It is compared with the estimated amount of additional deposition
resulting from the proposed new or modified existing source, as modeled using an atmospheric
transport model. The DAT calculation reported by FLAG in 2011 relies on an estimate of
Natural Background Deposition developed from the peer-reviewed scientific literature and expert
judgment. This natural background estimate is modified in calculating the DAT by including a
Variability factor and a Cumulative Factor.
The variability factor (V = 0.5) was selected with the reasoning that a total increase in
deposition from all sources by an amount greater than 50% of natural background deposition
would trigger management concerns. Thus, an additional 50% of natural background deposition
could be added to existing natural plus anthropogenic deposition and still be considered
insignificant. The Cumulative Factor (C = 0.04) adjusts for the concern that cumulative effects
from multiple relatively small sources could produce impacts even if a single source, on its own,
would not. The FLMs applied the 4% value used by EPA in determining Class I increment levels
of significant impact. Thus, C represents a 4% safety factor to protect Class I areas from
cumulative deposition impacts. This assumes that, over time, one might expect 25 or fewer new
local sources or equivalent increase from distant sources to increase deposition in a Class I area.

56
The FLMs reserved the right to modify the DAT in the event that emissions from multiple
existing and proposed new sources are higher than anticipated.
For Class I parks and refuges east of the Mississippi, the DAT is calculated as:
DAT = 0.5 kg/ha/yr x 0.5 x 0.04 = 0.01 kg/ha/yr of N or S (11)
The FLMs adopted this approach and resulting values in the Federal Land Managers’
Interagency Guidance for Nitrogen and Sulfur Deposition Analyses. On this basis, the USFS has
adopted DATS for both S and N deposition to protect against water acidification equal to 0.01
kg/ha/yr of S or N at Boundary Waters Canoe Area Wilderness, MN and at Rainbow Lakes
Wilderness, WI. For the purposes of protecting FCPC resources against acidification damage or
fertilization of water, this report recommends following the approach used by the NPS and USFS
and using a DAT of 0.01 kg/ha/yr of N or S.
A DAT for Hg has not been developed on the basis of assumed background Hg
deposition by the FLMs, probably in part because background Hg deposition is less well known.
Nevertheless, an alternative DAT for wet deposition can be expressed on the basis of the
minimum concentration that can be detected in precipitation in the analytical laboratory. Using
this approach, an increase in wet deposition is considered significant if the increase in
precipitation concentration, and associated wet deposition, is measurable in the deposition
monitoring network. This approach for specifying a DAT based on what is measurable in the
analytical laboratory has been followed by USFS for the James River Face Class I Wilderness. It
constitutes an alternate approach for calculating the DATs for Hg methylation in view of the lack
of information regarding background Hg deposition.
Using this approach, the minimum detectable level of an increase in S or Hg wet
deposition to FCPC lands to protect against Hg methylation can be calculated using the
following equation:
MDI = MDL x P x UCF (12)
where MDI is the estimated minimum detectable increase in wet deposition; MDL is the
laboratory method detection limit for S or Hg measured in water from wet deposition collectors;
P is annual precipitation; and UCF is the unit conversion factor value needed to express MDI in
the selected units (e.g., kg/ha/yr for S or µg/m2/yr for Hg).

57
The MDIs with respect to the concentrations of S and Hg in wet deposition were
calculated for the NADP/NTN monitoring station WI10 located within the Potawatomi study
area for the five-year period 2006 through 2010 based on annual average precipitation and the
current analytical MDL in the NADP/NTN and MDN monitoring programs.
The DATs for protecting against Hg methylation, based on laboratory detection limits,
can then be calculated from the minimum detectable increase in deposition of total Hg (MDITHg)
and total S (MDITS). These equations incorporate the Cumulative Factor (C = 0.04) developed by
the FLMs for protecting against acidification and nutrient enrichment:
DATMe-Hg = 0.0788 µg Hg/m2/yr x C (13)
= 0.088 µg Hg/m2/yr x 0.04 = 0.0032 µg Hg/m
2/yr
DATMe-S = 0.031 kg S/ha/yr x C (14)
= 0.031 kg S/ha/yr x 0.04 = 0.0012 kg S/ha/yr
The CLs, DATs, and MDIs constitute tools that can be used individually or collectively
to evaluate the likelihood that a proposed new, or modified existing, emissions source might
adversely impact AQRVs in the Class I area. These tools can be used to screen proposed
emissions sources for more in-depth analyses to evaluate potential adverse impacts.
6. LITERATURE CITED
Aber, J.D., C.L. Goodale, S.V. Ollinger, M.-L. Smith, A.H. Magill, M.E. Martin, R.A. Hallett,
and J.L. Stoddard. 2003. Is nitrogen deposition altering the nitrogen status of northeastern
forests? BioScience 53(4):375-389.
Aerts, R. 1990. Nutrient use efficiency in evergreen and deciduous species from heathland.
Oecologia 84:391-397.
Aerts, R., F. Berendse, H. De Caluwe, and M. Schmits. 1990. Competition in heathland along an
experimental gradient of nutrient availability. Oikos 57:310-318.
Aldous, A.R. 2002. Nitrogen retention by Sphagnum mosses: responses to atmospheric nitrogen
deposition and drought. Can. J. Bot. 80(7):721-731.
Baer, S.G., J.M. Blair, S.L. Collins, and A.K. Knapp. 2003. Soil resources regulate productivity
and diversity in newly established tallgrass prairie. Ecology 84:724-735.
Baker, L.A., A.T. Herlihy, P.R. Kaufmann, and J.M. Eilers. 1991. Acidic lakes and streams in
the United States: the role of acidic deposition. Science 252:1151-1154.
Baron, J.S., C.T. Driscoll, and J.L. Stoddard. 2011. Inland Surface Water. In L.H. Pardo, M.J.
Robin-Abbott and C.T. Driscoll (Eds.). Assessment of Nitrogen Deposition Effects and

58
Empirical Critical Loads of Nitrogen for Ecoregions of the United States. General
Technical Report NRS-80. U.S. Forest Service, Newtown Square, PA. pp. 209-228.
Barr, J.F. 1996. Aspects of common loon (Gavia immer) feeding biology on its breeding ground.
Hydrobiology 32:119-144.
Basu, N., A.M. Scheuhammer, S. Bursian, K. Rouvinen-Watt, J. Elliott, and H.M. Chan. 2007a.
Mink as a sentinel in environmental health. Environ. Res. 103:130-144.
Basu, N., A.M. Scheuhammer, K. Rouvinen-Watt, N. Grochowina, R.D. Evans, M. O’Brien, and
H.M. Chan. 2007b. Decreased N-methyl-Daspartic acid (NMDA) receptor levels are
associated with mercury exposure in wild and captive mink. Neurotoxicology 28:587-
593.
Bechard, M.J., D.N. Perkins, G.S. Kaltenecker, and S. Alsup. 2007. Mercury contamination in
Idaho bald eagles, (Haliaeetus leucocephalus). Bull. Environ. Contam. Toxicol. 83:698-
702.
Beckvar, N., T.M. Dillon, and L.B. Read. 2005. Approaches for linking wholebody fish tissue
residues of mercury or DDT to biological effects thresholds. Environ. Toxicol. Chem.
24:2094-2105.
Bennett, J.P. 1995. Abnormal chemical element concentrations in lichens of Isle Royale National
Park. Environ. Exp. Bot. 35(3):259-277.
Berendse, F., N. van Breemen, H. Rydin, A. Buttler, M. Heijmans, M.R. Hoosbeek, J.A. Lee, A.
Mitchell, T. Saarinen, H. Vassander, and B. Wallen. 2001. Raised atmospheric CO2
levels and increased N deposition cause shifts in plant species composition and
production in Sphagnum bogs. Glob. Change Biol. 7(5):591-598.
Bhavsar, S.P., S.B. Gewurtz, D.J. McGoldrick, M.J. Keir, and S.M. Backus. 2010. Changes in
mercury levels in Great Lakes fish between 1970s and 2007. Environ. Sci. Technol.
44:3273-3279.
Bobbink, R., K. Hicks, J. Galloway, T. Spranger, R. Alkemade, M. Ashmore, M. Bustamante, S.
Cinderby, E. Davidson, F. Dentener, B. Emmett, J.-W. Erisman, M. Fenn, F.S. Gilliam,
A. Nordin, L. Pardo, and W. De Vries. 2010. Global assessment of nitrogen deposition
effects on terrestrial plant diversity: a synthesis. Ecol. Appl. 20(1):30-59.
Branfireun, B.A., N.T. Roulet, C.A. Kelly, and W.M. Rudd. 1999. In situ sulphate stimulation of
mercury methylation in a boreal peatland: toward a link between acid rain and
methylmercury contamination in remote environments. Glob. Biogeochem. Cycles
13(3):743-750.
Bridgham, S.D., J. Pastor, C.A. McClaugherty, and C.J. Richardson. 1995. Nutrient-use
efficiency: a litterfall index, a model, and a test along a nutrient-availability gradient in
North Carolina peatlands. Amer. Natur. 145:1-21.
Brumbaugh, W.G., D.P. Krabbenhoft, D.R. Helsel, J.G. Weiner, and K.R. Echols. 2001. A
National Pilot Study of Mercury Contamination of Aquatic Ecosystems Along Multiple
Gradients—Bioaccumulation in Fish. Biological Sciences Report, USGS/BRD/BSR–
P2001–0009. U.S. Dept. of the Interior, U.S. Geological Survey.
Burgess, N.M. and M.W. Meyer. 2008. Methylmercury exposure associated with reduced
productivity in common loons. Ecotoxicology 17(2):83-91.
Butler, T.J., M.D. Cohen, F.M. Vermeylen, G.E. Likens, D. Schmeltz, and R.S. Artz. 2008.
Regional precipitation mercury trends in the eastern USA, 1998–2005: declines in the
Northeast and Midwest, no trend in the Southeast. Atmos. Environ. 42:1582-1592.

59
Campbell, L.M., D.W. Schindler, D.C.G. Muir, D.B. Donald, and K.A. Kidd. 2000.
Organochlorine transfer in the food web of subalpine Bow Lake, Banff National Park.
Can. J. Fish. Aquat. Sci. 57:1258-1269.
Chen, C.Y., R.S. Stemberger, N.C. Kamman, B.M. Mayes, and C.L. Folt. 2005. Patterns of Hg
bioaccumulation and transfer in aquatic food webs across multi-lake studies in the
Northeast US. Ecotoxicology 14:135-147.
Clark, C.M. 2011. Great Plains. In L.H. Pardo, M.J. Robin-Abbott and C.T. Driscoll (Eds.).
Assessment of Nitrogen Deposition Effects and Empirical Critical Loads of Nitrogen for
Ecoregions of the United States. General Technical Report NRS-80. U.S. Forest Service,
Newtown Square, PA. pp. 117-132.
Clarkson, T.W. 1992. Mercury—Major issues in environmental health. Environ. Health Perspect.
100:31-38.
Compeau, G.C. and R. Bartha. 1985. Sulfate-reducing bacteria: principal methylators of mercury
in anoxic estuarine sediment. Appl. Environ. Microbiol. 50(2):498-502.
Cook, R.B. and H.I. Jager. 1991. Upper Midwest: The effects of acidic deposition on lakes. In
D.F. Charles (Ed.) Acidic deposition and aquatic ecosystems: regional case studies.
Springer-Verlag, Inc., New York.
Cope, W.G., J.G. Wiener, and R.G. Rada. 1990. Mercury accumulation in yellow perch in
Wisconsin seepage lakes: relation to lake characteristics. Environ. Toxicol. Chem. 9:931-
940.
Croteau, M.N., S.N. Luoma, and A.R. Stewart. 2005. Trophic transfer of metals along freshwater
food webs: Evidence of cadmium biomagnification in nature. Limnol. Oceanogr.
50(5):1511-1519.
Dicosty, R.J., M.A. Callaham Jr., and J.A. Stanturf. 2006. Atmospheric deposition and re-
emission of mercury estimated in a prescribed forest-fire experiment in Florida, USA.
Water Air Soil Pollut. 176(1-4):77-91.
Dillon, T., S. Beckvar, and J. Kern. 2010. Residue-based dose–response in fish: an analysis using
lethality-equivalent endpoints. Environ. Toxicol. Chem. 29:2559-2565.
Drevnick, P.E., D.R. Engstrom, C.T. Driscoll, E.B. Swain, S.J. Balogh, N.C. Kamman, D.T.
Long, D.G.C. Muir, M.J. Parsons, K.R. Rolfhus, and R. Rossmann. 2012. Spatial and
temporal patterns of mercury accumulation in lacustrine sediments across the Laurentian
Great Lakes region. Environ. Pollut. 161:252-260.
Driscoll, C.T., Y.-J. Han, C.Y. Chen, D.C. Evers, K.F. Lambert, T.M. Holsen, N.C. Kamman,
and R.K. Munson. 2007. Mercury contamination in forest and freshwater ecosystems in
the northeastern United States. BioScience 57(1):17-28.
Dukes, J.S. and H.A. Mooney. 1999. Does global change increase the success of biological
invaders? Trends Ecol. Evol. 14(4):135-139.
Eckley, C.S., C.J. Watras, H. Hintelmann, K. Morrison, A.D. Kent, and O. Regnell. 2005.
Mercury methylation in the hypolimnetic waters of lakes with and without connection to
wetlands in northern Wisconsin. Can. J. Fish. Aquat. Sci. 62:400-411.
Eilers, J.M., G.E. Glass, K.E. Webster, and J.A. Rogalla. 1983. Hydrologic control of lake
susceptibility to acidification. Can. J. Fish. Aquat. Sci. 40:1896-1904.
Ellenberg, H. 1985. Veränderungen der floa mitteleuropas unter dem einfluss von düngung und
immissionen. Schweiz. Z. Forstw. 136:19-39.
Engle, M.A., M.T. Tate, D.P. Krabbenhoft, J.J. Schauer, A. Kolker, J.B. Shanley, and M.H.
Bothner. 2010. Comparison of atmospheric mercury speciation and deposition at nine

60
sites across central and eastern North America. Journal of Geophysical Research -
Atmospheres 115, D18306. doi:10.1029/2010JD014064.
Engstrom, D.R. and E.B. Swain. 1997. Recent declines in atmospheric mercury deposition in the
Upper Midwest. Environ. Sci. Technol. 31.
Evers, D., M. Duron, D.E. Yates, and N. Schoch. 2009. An Exploratory Study of Methylmercury
Availability in Terrestrial Wildlife of New York and Pennsylvania, 2005-2006. 10-03.
New York State Energy Research and Development Authority, Albany, NY.
Evers, D.C., K.M. Taylor, A. Major, R.J. Taylor, R.H. Poppenga, and A.M. Scheuhammer. 2003.
Common loon eggs as bioindicators of methylmercury availability in North America.
Ecotoxicology 12:69-81.
Evers, D.C. 2005. Mercury connections: The extent and effects of mercury pollution in
northeastern North America. BioDiversity Research Institute, Gorham, ME.
Evers, D.C. 2006. Loons as biosentinels of aquatic integrity. Environmental Bioindicators 1:18-
21.
Evers, D.C., Y. Han, C.T. Driscoll, N.C. Kamman, M.W. Goodale, K.F. Lambert, T.M. Holsen,
C.Y. Chen, T.A. Clair, and T. Butler. 2007. Biological mercury hotspots in the
northeastern United States and southeastern Canada. BioScience 57(1):29-43.
Evers, D.C., L.J. Savoy, C.R. DeSorbo, D.E. Yates, W. Hanson, K.M. Taylor, L.S. Siegel, J.H.
Cooley, Jr.., M.S. Bank, A. Major, K. Munney, B.F. Mower, H.S. Vogel, N. Schoch, M.
Pokras, M.W. Goodale, and J. Fair. 2008. Adverse effects from environmental mercury
loads on breeding common loons. Ecotoxicology 17:69-81.
Evers, D.C., J.D. Paruk, J.W. Mcintyre, and J.F. Barr. 2010. Common loon (Gavia immer). In A.
Poole (Ed.) The Birds of North America. Cornell Laboratory of Ornithology, Ithaca, NY.
Evers, D.C., J.G. Wiener, C.T. Driscoll, D.A. Gay, N. Basu, B.A. Monson, K.F. Lambert, H.A.
Morrison, J.T. Morgan, K.A. Williams, and A.G. Soehl. 2011a. Great Lakes Mercury
Connections: The Extent and Effects of Mercury Pollution in the Great Lakes Region.
Report BR1 2011-18. Biodiversity Research Institute, Gorham, ME.
Evers, D.C., K.A. Williams, M.W. Meyer, A.M. Scheuhammer, N. Schoch, A. Gilbert, L. Siegel,
R.J. Taylor, R. Poppenga, and C.R. Perkins. 2011b. Spatial gradients of methylmercury
for breeding common loons in the Laurentian Great Lakes region. Ecotoxicology
20:1609-1625.
Falkengren-Grerup, U. 1986. Soil acidification and vegetation changes in deciduous forest in
southern Sweden. Oecologia 70:339-347.
Falkengren-Grerup, U. 1989. Soil acidification and its impact on ground vegetation. Ambio
18:179-183.
Fenn, M.E., K.F. Lambert, T. Blett, D.A. Burns, L.H. Pardo, G.M. Lovett, R.A. Haeuber, D.C.
Evers, C.T. Driscoll, and D.S. Jefferies. 2011. Setting Limits: Using Air Pollution
Thresholds to Protect and Restore U.S. Ecosystems. Issues in Ecology, Report No. 14.
Ecological Society of America.
Fitzgerald, W.F., D.R. Engstrom, R.P. Mason, and E.A. Nater. 1998. The case for atmospheric
mercury contamination in remote areas. Environ. Sci. Technol. 32:1-7.
Fraterrigo, J.M., S.M. Pearson, and M.G. Turner. 2009. The response of understory herbaceous
plants to nitrogen fertilization in forests of different landuse history. For. Ecol. Manage.
257:2182-2188.

61
Frost, T.M., J.M. Fischer, J.L. Klug, S.E. Arnott, and P.K. Montz. 2006. Trajectories of
zooplankton recovery in the Little Rock Lake whole-lake acidification experiment. Ecol.
Appl. 16(1):353-367.
Galloway, M.E. and B.A. Branfireun. 2004. Mercury dynamics of a temperate forested wetland.
Sci. Total Environ. 325:239-254.
Gilliam, F.S., A.W. Hockenberry, and M.B. Adams. 2006. Effects of atmospheric nitrogen
deposition on the herbaceous layer of a central Appalachian hardwood forest. J. Torrey
Bot. Soc. 133:240-254.
Gilliam, F.S., C.L. Goodale, L.H. Pardo, L.H. Geiser, and E.A. Lilleskov. 2011. Eastern
Temperate Forests. In L.H. Pardo, M.J. Robin-Abbott and C.T. Driscoll (Eds.).
Assessment of Nitrogen Deposition Effects and Empirical Critical Loads of Nitrogen for
Ecoregions of the United States. General Technical Report NRS-80. U.S. Forest Service,
Newtown Square, PA. pp. 99-116.
Gilmour, C.C. and E.A. Henry. 1991. Mercury methylation in aquatic systems affected by acid
deposition. Environ. Pollut. 71:131-169.
Gilmour, C.C., E.A. Henry, and R. Mitchell. 1992. Sulfate stimulation of mercury methylation in
freshwater sediments. Environ. Sci. Technol. 26(11):2281-2287.
Glass, G.E. and J.A. Sorensen. 1999. Six-year trend (1990-1995) of wet mercury deposition in
the Upper Midwest, U.S.A. Environ. Sci. Technol. 33(3303-3312).
Gorski, P.R., L.B. Cleckner, J.P. Hurley, M.E. Sierszen, and D.E. Armstrong. 2003. Factors
affecting enhanced mercury bioaccumulation in inland lakes of Isle Royale National
Park, USA. Sci. Tot. Environ. 304:327-348.
Graydon, J.A., V.L.S. Louis, S.E. Lindberg, H. Hintelmann, and D.P. Krabbenhoft. 2006.
Investigation of mercury exchange between forest canopy vegetation and the atmosphere
using a new dynamic chamber. Environ. Sci. Technol. 40(15):4680-4688.
Graydon, J.A., V.L. St. Louis, H. Hintelmann, S.E. Lindberg, K.A. Sandilands, J.W.M. Rudd,
C.A. Kelly, and L.D. Mowat. 2008. Long-term wet and dry deposition of total and methyl
mercury in the remote boreal ecoregion of Canada. Environ. Sci. Technol. 42:8345-8351.
Greaver, T., L. Liu, and R. Bobbink. 2011. Wetlands. In L.H. Pardo, M.J. Robin-Abbott and C.T.
Driscoll (Eds.). Assessment of Nitrogen Deposition Effects and Empirical Critical Loads
of Nitrogen for Ecoregions of the United States. General Technical Report NRS-80. U.S.
Forest Service, Newtown Square, PA.
Grieb, T.M., C.T. Driscoll, S.P. Gloss, C.L. Schofield, G.L. Bowie, and D.B. Porcella. 1990.
Factors affecting mercury accumulation in fish in the Upper Michigan Peninsula.
Environ. Toxicol. Chem. 9:919-930.
Grigal, D.F. 2002. Inputs and outputs of mercury from terrestrial watersheds: a review. Environ.
Rev. 10:1–39.
Grim, L.H. and L.W. Kallemeyn. 1995. Reproduction and distribution of bald eagles in
Voyageurs National Park, Minnesota, 1973–1993. Biological Report 1. U.S. Department
of the Interior, National Biological Service, Washington, DC.
Gustin, M.S., M. Engle, J. Ericksen, S. Lyman, J. Stamenkovic, and M. Xin. 2006. Mercury
exchange between the atmosphere and low mercury containing substrates. Appl.
Geochem. 21:1913-1923.
Haddad, N.M., J. Haarstad, and D. Tilman. 2000. The effects of long-term nitrogen loading on
grassland insect communities. Oecologia 124:73-84.

62
Hall, B.D., H. Manolopoulos, J.P. Hurley, J.J. Schauer, V.L. St. Louis, D. Kenski, J. Graydon,
C.L. Babiarz, L.B. Cleckner, and G.J. Keeler. 2005. Methyl and total mercury in
precipitation in the Great Lakes region. Atmos. Environ. 39:7557-7569.
Hamilton, M., A. Scheuhammer, and N. Basu. 2011. Mercury, selenium, and neurochemical
biomarkers in different brain regions of migrating common loons from Lake Erie,
Canada. Ecotoxicology 20(7):1677-1683.
Hammerschmidt, C.R. and M.B. Sandheinrich. 2005. Maternal diet during oogenesis is the major
source of methylmercury in fish embryos. Environ. Sci. Technol. 39:3580-3584.
Harris, R.C., J.W.M. Rudd, M. Amyot, C.L. Babiarz, K.G. Beaty, P.J. Blanchfield, R.A. Bodaly,
B.A. Branfireun, C.C. Gilmour, J.A. Graydon, A. Heyes, H. Hintlemann, J.P. Hurley,
C.A. Kelly, D.P. Krabbenhoft, S.E. Lindberg, R.P. Mason, M.J. Paterson, C.L. Podemski,
A. Robinson, K.A. Sandilands, G.R. Southworth, V.L. St. Louis, and M.T. Tate. 2007.
Whole-ecosystem study shows rapid fish-mercury response to changes in mercury
deposition. Proc. Nat. Acad. Sci. 104(42):16586-16591.
Heil, G.W. and W.H. Diemont. 1983. Raised nutrient levels change heathland in grassland.
Vegetation 53:113-120.
Heil, G.W. and M. Bruggink. 1987. Competition for nutrients between Calluna vulgaris (L.)
Hull and Molinia caerulea (L.) Moench. Oecologia 73:105-108.
Heinz, G.H., D.J. Hoffman, J.D. Klimstra, K.R. Stebbins, S.L. Konrad, and C.A. Erwin. 2009.
Species differences in the sensitivity of avian embryos to methylmercury. Arch. Environ.
Contam. Toxicol. 56:129-138.
Heinz, G.H., D. Hoffman, J.D. Klimstra, and K.R. Stebbins. 2010. Predicting mercury
concentrations in mallard eggs from mercury in the diet or blood of adult females and
from duckling down feathers. Environ. Toxicol. Chem. 29:389-392.
Horsley & Witten Inc. 2003. Devil's Lake Summary Report: Water Years 1996 to 2002.
Sandwich, MA.
Hrabik, T.R. and C.J. Watras. 2002. Recent declines in mercury concentration in a freshwater
fishery: isolating the effects of de-acidification and decreased atmospheric mercury
deposition in Little Rock Lake. Sci. Total Environ. 297:229-237.
ICF International. 2006. Mercury transport and fate through a watershed. Synthesis report of
research from EPA’s Science to Achieve Results (STAR) grant program. Prepared for US
EPA, Office of Research and Development, Washington, DC.
Jeremiason, J.D., D.R. Engstrom, E.B. Swain, E.A. Nater, B.M. Johnson, J.E. Almendinger, B.A.
Monson, and R.K. Kolka. 2006. Sulfate addition increases methylmercury production in
an experimental wetland. Environ. Sci. Technol. 40(12):3800-3806.
Kamman, N.C., N.M. Burgess, C.T. Driscoll, H.A. Simonin, W. Goodale, J. Linehan, R.
Estabrook, M. Hutcheson, A. Major, A.M. Scheuhammer, and D.A. Scruton. 2005.
Mercury in freshwater fish of northeast North America – A geographic perspective based
on fish tissue monitoring databases. Ecotoxicology 14:163-180.
Kenow, K.P., M.W. Meyer, R. Rossmann, A. Gendron-Fitzpatrick, and B.R. Gray. 2011. Effects
of injected methylmercury on the hatching of common loon (Gavia immer) eggs.
Ecotoxicology 20:1684-1693.
Koerselman, W. 1989. Groundwater and surface water hydrology of a small groundwater-fed
fen. Wetl. Ecol. Manage. 1:31-43.
Kooijman, A.M. and C. Bakker. 1994. The acidification capacity of wetland bryophytes as
influenced by simulated clean and polluted rain. Aquat. Bot. 48(2):133-144.

63
Kramar, D., W.M. Goodale, L.M. Kennedy, L.W. Carstensen, and T. Kaur. 2005. Relating land
cover characteristics and common loon mercury levels using geographic information
systems. Ecotoxicology 14:253-262.
Krupa, S.V. 2003. Effects of atmospheric ammonia (NH3) on terrestrial vegetation: a review.
Environ. Pollut. 124(179-221).
Lamborg, C.H., W.F. Fitzgerald, A.W.H. Damman, J.M. Benoit, P.H. Balcom, and D.R.
Engstrom. 2002. Modern and historic atmospheric mercury fluxes in both hemispheres:
global and regional mercury cycling implications. Global Biogeochem. Cycles 16:1104-
1114.
LeBlanc, G.A. 1995. Trophic-level differences in the bioconcentration of chemicals:
Implications in assessing environmental biomagnification. Environ. Sci. Technol. 29:154-
160.
Linthurst, R.A., D.H. Landers, J.M. Eilers, D.F. Brakke, W.S. Overton, E.P. Meier, and R.E.
Crowe. 1986a. Characteristics of Lakes in the Eastern United States. Volume I.
Population Descriptions and Physico-chemical Relationships. EPA/600/4-86/007a. U.S.
Environmental Protection Agency, Washington, D.C.
Linthurst, R.A., D.H. Landers, J.M. Eilers, P.E. Kellar, D.F. Brakke, W.S. Overton, R. Crowe,
E.P. Meier, P. Kanciruk, and D.S. Jeffries. 1986b. Regional chemical characteristics of
lakes in North America Part II: eastern United States. Water Air Soil Pollut. 31:577-591.
Lorey, P. and C.T. Driscoll. 1999. Historical trends of mercury deposition in Adirondack lakes.
Environ. Sci. Technol. 33(5):718-722.
Lyman, S.N., M.S. Gustin, E.M. Prestbo, and F.J. Marsik. 2007. Estimation of dry deposition of
atmospheric mercury in Nevada by Direct and Indirect Methods. Environ. Sci. Technol.
41:1970-1976.
Mahaffey, K.R. 2005. NHANES 1999-2002 Update on mercury. Presentation at the September
2005 EPA Fish Forum. http://www.epa.gov/waterscience/fish/forum/2005.
Martin, P.A., T.V. McDaniel, K.D. Hughes, and B. Hunter. 2011. Mercury and other heavy
metals in free-ranging mink of the lower Great Lakes basin, Canada, 1998-2006.
Ecotoxicology 20:1701-1712.
Mason, C.F. and C.D. Wren. 2001. Carnivora. In R.F. Shore and B.A. Rattner (Eds.).
Ecotoxicology of Wild Mammals. Wiley, Chichester, England. pp. 315-370.
Mason, R.P. and K.A. Sullivan. 1997. Mercury in Lake Michigan. Environ. Sci. Technol.
31:942-947.
Mason, R.P., M.L. Abbott, R.A. Bodaly, O.R. Bullock Jr, C.T. Driscoll, D. Evers, S.B. Lindberg,
M. Murray, and E.B. Swain. 2005. Monitoring the response to changing mercury
deposition. Environ. Sci. Technol. 39:14A-22A.
McCune, B. 1988. Lichen communities along O3 and SO2 gradients in Indianapolis. Bryologist
91(3):223-228.
Meyer, M.W., D.C. Evers, T. Daulton, and W.E. Braselton. 1995. Common loons (Gavia immer)
nesting on low pH lakes in northern Wisconsin have elevated blood mercury content.
Water Air Soil Pollut. 80:871-880.
Meyer, M.W., D.C. Evers, J.J. Hartigan, and P.S. Rasmussen. 1998. Patterns of common loon
(Gavia immer) mercury exposure reproduction and survival in Wisconsin, USA. Environ.
Toxicol. Chem. 17:184-190.

64
Meyer, M.W., P.W. Rasmussen, C.J. Watras, B.M. Fevold, and K.P. Kenow. 2011. Bi-phasic
trends in mercury concentrations in blood of Wisconsin common loons during 1992-
2010. Ecotoxicology 20(7):1659-1668.
Mitsch, W.J. and J.G. Gosselink. 2000. Wetlands. John Wiley & Sons, Inc., New York, NY. 936
pp.
Monson, B.A. 2009. Trend reversal of mercury concentrations in piscivorous fish from
Minnesota lakes: 1982–2006. Environ. Sci. Technol. 43:1750-1755.
Monson, B.A., D.F. Staples, S.P. Bhavsar, T.M. Holsen, C.S. Schrank, S.K. Moses, D.J.
McGoldrick, S.M. Backus, and K.A. Williams. 2011. Spatiotemporal trends of mercury
in walleye and largemouth bass from the Laurentian Great lakes region. Ecotoxicology
20:1555-1567.
Moore, D.R.J., P.A. Keddy, C.L. Gaudet, and I.C. Wisheu. 1989. Conservation of wetlands: do
infertile wetlands deserve a higher priority? Biol. Cons. 47:203-217.
Moore, P.T., H. Van Miegroet, and N.S. Nicholas. 2007. Relative role of understory and
overstory carbon and nitrogen cycling in a southern Appalachian spruce-fir forest. Can. J.
For. Res. 37:2689-2700.
Moore, T., C. Blodau, J. Turenen, N. Roulet, and P.J.H. Richard. 2004. Patterns of nitrogen and
sulfur accumulation and retention in ombrotrophic bogs, eastern Canada. Glob. Change
Biol. 11:356-367.
Morris, D.P. and W.M. Lewis. 1988. Phytoplankton nutrient limitation in Colorado mountain
lakes. Freshw. Biol. 20:315-327.
Morris, J.T. 1991. Effects of nitrogen loading on wetland ecosystems with particular reference to
atmospheric deposition. Annual Review of Ecology and Systematics 22:257-279.
Muller, R.N. 2003. Nutrient relations of the herbaceous layer in deciduous forest ecosystems. In
F.S. Gilliam and M.R. Roberts (Eds.). The Herbaceous Layer in Forests of Eastern North
America. Oxford University Press, New York. pp. 15-37.
National Acid Precipitation Assessment Program (NAPAP). 1991. Integrated assessment report.
National Acid Precipitation Assessment Program, Washington, DC.
National Environmental Justice Advisory Council (NEJAC). 2002. Fish Consumption and
Environmental Justice. Report prepared for the U.S. Environmental Protection Agency.
National Park Service and U.S. Fish and Wildlife Service. 2002. Guidance on Nitrogen and
Sulfur Deposition Analysis Thresholds. Submitted by letter to S. W. Becker, Executive
Director, STAPPA/ALAPCO, from C. L. Shaver, Air Resources Division, National Park
Service, and S. V. Silva, Air Quality Branch, U.S. Fish and Wildlife Service.
Pardo, L.H., C.L. Goodale, E.A. Lilleskov, and L.H. Geiser. 2011a. Northern forest. In L.H.
Pardo, M.J. Robin-Abbott and C.T. Driscoll (Eds.). Assessment of Nitrogen Deposition
Effects and Empirical Critical Loads of Nitrogen for Ecoregions of the United States.
General Technical Report NRS-80. U.S. Forest Service, Newtown Square, PA. pp. 61-74.
Pardo, L.H., M.J. Robin-Abbott, and C.T. Driscoll (Eds.). 2011b. Assessment of Nitrogen
Deposition Effects and Empirical Critical Loads of Nitrogen for Ecoregions of the United
States. General Technical Report NRS-80. U.S. Forest Service, Newtown Square, PA.
Pittman, H.T., W.W. Bowerman, L.H. Grim, T.G. Grubb, and W.C. Bridges. 2011. Using
nestling feathers to assess spatial and temporal concentrations of mercury in bald eagles
at Voyageurs National Park, Minnesota, USA. Ecotoxicology 20:1626-1635.
Redbo-Torstensson, P. 1994. The demographic consequences of nitrogen fertilization of a
population of sundew, Drosera rotundifolia. Acta Bot. Neerl. 43(2):175-188.

65
Reinfelder, J.R., N.S. Fisher, S.N. Luoma, J.W. Nichols, and W.-X. Wang. 1998. Trace element
trophic transfer in aquatic organisms: A critique of the kinetic model approach. Sci. Total
Environ. 219:117-135.
Risch, M.R., J.F. DeWild, D.P. Krabbenhoft, R.K. Kolka, and L. Zhang. 2012a. Litterfall
mercury dry deposition in the eastern USA. Environ. Pollut. 161:264-290.
Risch, M.R., D.A. Gay, K.K. Fowler, G.J. Keeler, S.M. Backus, P. Blanchard, J.A. Barres, and
J.T. Dvonch. 2012b. Spatial patterns and temporal trends in mercury concentrations,
precipitation depths, and mercury wet deposition in the North American Great Lakes
region. Environ. Pollut. 161:261-271.
Rochefort, L., D.H. Vitt, and S.E. Bayley. 1990. Growth, production and decomposition
dynamics of Sphagnum under natural and experimentally acidified conditions. Ecology
71(5):1986-2000.
Roelofs, J.G.M. 1986. The effect of airborne sulphur and nitrogen deposition on aquatic and
terrestrial heathland vegetation. Experientia 42:372-377.
Rolfhus, K.R., H.E. Sakamoto, L.B. Cleckner, R.W. Stoor, C.L. Babiarz, R.C. Back, H.
Manolopoulos, and J.P. Hurley. 2003. The distribution and fluxes of total and
methylmercury in Lake Superior. Environ. Sci. Technol. 37:865-872.
Rolfhus, K.R., B.D. Hall, B.A. Monson, A.M. Paterson, and J.D. Jeremiason. 2011. Assessment
of mercury bioaccumulation within the pelagic food web of lakes in the western Great
Lakes region. Ecotoxicology 20:1520-1529.
Route, B., P.W. Rasmussen, R. Key, M.L. Meyer, and M. Martell. 2011. Spatial patterns of
environmental contaminants in bald eagles from three parks in the Upper Midwest.
Abstract. In George Wright Society Conference on Parks, Protected Areas, & Cultural
Sites, New Orleans, LA.
Royo, A.A., R. Collins, M.B. Adams, C. Kirschbaum, and W.P. Carson. 2010. Pervasive
interactions between ungulate browsers and disturbance regimes promote temperate
forest herbaceous diversity. Ecology 91(1):93-105.
Rudd, J.W.M. 1995. Sources of methyl mercury to freshwater ecosystems: A review. Water Air
& Soil Pollution 80:697-713.
Rutkiewicz, J., D.-H. Nam, T. Cooley, K. Neumann, I.B. Padilla, W. Route, S. Strom, and N.
Basu. 2011. Mercury exposure and neurochemical impacts in bald eagles across several
Great Lakes states. Ecotoxicology 20:1669-1676.
Sandheinrich, M.B. and J.G. Wiener. 2011. Methylmercury in freshwater fish: recent advances in
assessing toxicity of environmentally relevant exposures. In W.N. Beyer and J.P. Meador
(Eds.). Environmental Contaminants in Biota: Interpreting Tissue Concentrations. CRC
Press, Boca Raton. pp. 169-190.
Scheuhammer, A.M. 1991. Acidification-related changes in the biogeochemistry and
ecotoxicology of mercury, cadmium, lead and aluminum: overview. Environ. Pollut.
71:87-90.
Scheuhammer, A.M. and P.J. Blancher. 1994. Potential risk to common loons (Gavia immer)
from methylmercury exposure in acidified lakes. Hydrobiologia 279/280:445-455.
Scheuhammer, A.M., M.W. Meyer, M.B. Sandheinrich, and M.W. Murray. 2007. Effects of
environmental methylmercury on the health of wild birds, mammals, and fish. Ambio
36(1):12-18.
Scheuhammer, A.M., N. Basu, N.M. Burgess, J.E. Elliott, G.D. Campbell, M. Wayland, L.
Champoux, and J. Rodrigue. 2008. Relationships among mercury, selenium, and

66
neurochemical parameters in common loons (Gavia immer) and bald eagles (Haliaeetus
leucocephalus). Ecotoxicology 17:93-101.
Schmeltz, D., D.C. Evers, C.T. Driscoll, R. Artz, M. Cohen, D. Gay, R. Haeuber, D.P.
Krabbenhoft, R. Mason, K. Morris, and J.G. Wiener. 2011. MercNet: a national
monitoring network to assess responses to changing mercury emissions in the United
States. Ecotoxicology 20:1713-1725.
Schroeder, W.H. and J. Munthe. 1998. Atmospheric mercury—an overview. Atmos. Environ.
32(5):809–822.
Sellers, P., C.A. Kelly, and J.W.M. Rudd. 2001. Fluxes of methylmercury to the water column of
a drainage lake: the relative importance of internal and external sources. Limnol.
Oceanogr. 46:623-631.
Shaver, G.R. and J.M. Melillo. 1984. Nutrient budgets of marsh plants - efficiency concepts and
relation to availability. Ecology 655:1491-1510.
Sorensen, J.A., G.E. Glass, K.W. Schmidt, J.K. Huber, and G.R.J. Rapp. 1990. Airborne mercury
deposition and watershed characteristics in relation to mercury concentrations in water,
sediments, plankton, and fish of eighty northern Minnesota lakes. Environ. Sci. Technol.
24(11):1716-1727.
Sorensen, J.A., L.W. Kallemeyn, and M. Sydor. 2005a. Relationship between mercury
accumulation in young-of-the-year yellow perch and water-level fluctuations. Environ.
Sci. Technol. 39:9237-9243.
Sorensen, J.A., L.W. Kallemyn, and M. Sydor. 2005b. Relationship between mercury
accumulation in young-of-the-year yellow perch and water-level fluctuations. Environ.
Sci. Technol. 39:9237-9243.
Spry, D.J. and J.G. Wiener. 1991. Metal bioavailability and toxicity to fish in low-alkalinity
lakes: a critical review. Environ. Pollut. 71:243-304.
St. Louis, V.L., J.W.M. Rudd, C.A. Kelly, K.G. Beaty, N.S. Bloom, and R.J. Flett. 1994.
Importance of wetlands as sources of methylmercury to boreal forest ecosystems. Can. J.
Fish. Aquat. Sci. 51(5):1065-1076.
St. Louis, V.L., J.W.M. Rudd, C.A. Kelly, K.G. Beaty, R.J. Flett, and N.T. Roulet. 1996.
Production and loss of methylmercury and loss of total mercury from boreal forest
catchments containing different types of wetlands. Environ. Sci. Technol. 30(9):2719 -
2729.
St. Louis, V.L., J.W.M. Rudd, C.A. Kelly, B.D. Hall, K.R. Rolfhus, K.J. Scott, S.E. Lindberg,
and W. Dong. 2001. Importance of the forest canopy to fluxes of methyl mercury and
total mercury to boreal ecosystems. Environ. Sci. Technol. 35(15):3089-3098.
St. Louis, V.L., J.W.M. Rudd, C.A. Kelly, R.A. Bodaly, J.M. Paterson, K.G. Beaty, R.H.
Hesslein, A. Heyes, and A. Majewski. 2004. The rise and fall of mercury methylation in
an experimental reservoir. Environ. Sci. Technol. 38:1348-1358.
Steinbach, M. 2011. FY2009/FY2010 Water Quality Assessment Report. Clean Water Act
Section 106. Grant # I-00E55801-0. Forest County Potawatomi Community.
Stevens, C.J., N.B. Dise, O.J. Mountford, and D.J. Gowing. 2004. Impact of nitrogen deposition
on the species richness of grasslands. Science 303:1876-1878.
Stoddard, J., J.S. Kahl, F.A. Deviney, D.R. DeWalle, C.T. Driscoll, A.T. Herlihy, J.H. Kellogg,
P.S. Murdoch, J.R. Webb, and K.E. Webster. 2003. Response of surface water chemistry
to the Clean Air Act Amendments of 1990. EPA 620/R-03/001. U.S. Environmental

67
Protection Agency, Office of Research and Development, National Health and
Environmental Effects Research Laboratory, Research Triangle Park, NC.
Sullivan, T.J. 1990. Historical changes in surface water acid-base chemistry in response to acidic
deposition. State of the Science, SOS/T 11. National Acid Precipitation Assessment
Program, Washington, DC.
Sullivan, T.J. 2000. Aquatic Effects of Acidic Deposition. Lewis Publ., Boca Raton, FL. 373 pp.
Swackhamer, D.L. and K.C. Hornbuckle. 2004. Assessment of air quality and air pollutant
impacts in Isle Royale National Park and Voyageurs National Park. Report prepared for
the U.S. National Park Service.
Swain, E.B. and D.D. Helwig. 1989. Mercury in fish from northeastern Minnesota lakes:
historical trends, environmental correlates, and potential sources. J. Minn. Acad. Sci
55(1):103-109.
Swain, E.B., D.R. Engstrom, M.E. Brigham, T.A. Henning, and P.L. Brezonik. 1992. Increasing
rates of atmospheric mercury deposition in midcontinental North America. Science
257:784-787.
Thomas, R.Q., C.D. Canham, K.C. Weathers, and C.L. Goodale. 2010. Increased tree carbon
storage in response to nitrogen deposition in the US. Nature Geoscience 3:13-17.
Throop, H.L., E.A. Holland, W.J. Parton, D.S. Ojima, and C.A. Keough. 2004. Effects of
nitrogen deposition and insect herbivory on patterns of ecosystem-level carbon and
nitrogen dynamics: results from the CENTURY model. Glob. Change Biol.
2004(10):1092-1105.
Tilman, D. and D. Wedin. 1991. Dynamics of nitrogen competition between successional
grasses. Ecology 72:1038-1049.
Tomassen, H.B., A.J. Smolders, J. Limpens, L.P. Lamers, and J.G. Roelofs. 2004. Expansion of
invasive species on ombrotrophic bogs: desiccation or high N deposition? J. Appl. Ecol.
41(1):139-150.
Tomassen, H.B.M., A.J.P. Smolders, L.P.M. Lamers, and J.G.M. Roelofs. 2003. Stimulated
growth of Betula pubescens and Molinia caerulea on ombrotrophic bogs: role of high
levels of atmospheric nitrogen deposition. J. Ecol. 91:357-370.
Turner, R.R. and G.W. Southworth. 1999. Mercury contaminated industrial and mining sites in
North America: an overview with selected case studies. In R. Ebinghaus, R.R. Turner,
L.D. Lacerda, O. Vasiliev and W. Salomons (Eds.). Mercury Contaminated Sites.
Springer, Berlin.
U.S. Environmental Protection Agency. 1993. Air quality criteria for oxides of nitrogen.
EPA/600/8-91/049aF-cF.3v. Office of Health and Environmental Assessment,
Environmental Criteria and Assessment Office, Research Triangle Park, NC.
U.S. Environmental Protection Agency. 2000. National Air Pollutant Emission Trends, 1900-
1998. EPA 454/R-00-002. US Environmental Protection Agency, Office of Air Quality,
Planning and Standards.
U.S. Environmental Protection Agency. 2001. Water quality criterion for the protection of
human health—Methylmercury. EPA-823-R-01-001. Office of Science and Technology,
Office of Water, U.S. EPA, Washington, DC.
U.S. Environmental Protection Agency. 2005. National Air Toxics Assessment.
U.S. Environmental Protection Agency. 2008. National Air Quality Status and Trends through
2007. EPA-454/R-08-006. U.S. Environmental Protection Agency, Office of Air Quality
Planning and Standards, Air Quality Assessment Division, Research Triangle Park. NC.

68
U.S. Environmental Protection Agency. 2009a. Risk and Exposure Assessment for Review of the
Secondary National Ambient Air Quality Standards for Oxides of Nitrogen and Oxides of
Sulfur: Final. EPA-452/R-09-008a. Office of Air Quality Planning and Standards, Health
and Environmental Impacts Division, Research Triangle Park, NC.
U.S. Environmental Protection Agency. 2009b. Integrated Science Assessment for Particulate
Matter (Final Report). EPA/600/R-08/139F. U.S. Environmental Protection Agency,
Washington, DC.
U.S. Environmental Protection Agency. 2011. Integrated Science Assessment for Ozone and
Related Photochemical Oxidants (First External Review Draft). EPA/600/R-10/076a.
U.S. Environmental Protection Agency, Washington, DC.
U. S. Forest Service. 2000. Preliminary air quality related screening values for the James River
Face Wilderness, a class I area in Virginia. Available from
http://www.fs.fed.us/r6/aq/natarm/document.htm. Nov. 2000.
U.S. Forest Service, National Park Service, and U.S. Fish and Wildlife Service. 2000. Federal
Land Managers' Air Quality Related Values Workgroup (FLAG) Phase I Report. U.S.
Forest Service – Air Quality Program, National Park Service – Air Resources Division,
U.S. Fish and Wildlife Service – Air Quality Branch.
U.S. Forest Service, National Park Service, and U.S. Fish and Wildlife Service. 2010. Federal
land managers’ air quality related values work group (FLAG): phase I report—revised
(2010). Natural Resource Report NPS/NRPC/NRR—2010/232. National Park Service,
Denver, CO.
U.S. Forest Service, National Park Service, and U.S. Fish and Wildlife Service. 2011. Federal
land managers’ interagency guidance for nitrogen and sulfur deposition analyses:
November 2011. NPS/NRSS/ARD/NRR—2011/465. National Park Service, Denver, CO.
Ullrich, S.M., T.W. Tanton, and S.A. Abdrashitova. 2001. Mercury in the aquatic environment: a
review of factors affecting methylation. Crit. Rev. Environ. Sci. Tech. 31:241-293.
Vitt, D.H., K. Wieder, L.A. Halsey, and M. Turetsky. 2003. Response of Sphagnum fuscum to
nitrogen deposition: a case study of ombrogenous peatlands in Alberta, Canada.
Bryologist 106(2):235-245.
Watras, C.J., R.C. Back, S. Halvorsen, R.J.M. Hudson, K.A. Morrison, and S.P. Wente. 1998.
Bioaccumulation of mercury in pelagic freshwater food webs. Sci. Tot. Environ.
219:183-208.
Watras, C.J., K.A. Morrison, R.J.M. Hudson, T.M. Frost, and T.K. Kratz. 2000. Decreasing
mercury in northern Wisconsin: temporal patterns in bulk precipitation and a
precipitation-dominated lake. Environ. Sci. Technol. 34(19):4051-4057.
Watras, C.J., K.A. Morrison, A. Kent, N. Price, O. Regnell, C. Eckley, H. Hintelmann, and T.
Hubacher. 2005. Sources of methylmercury to a wetland-dominated lake in northern
Wisconsin. Environ. Sci. Technol. 39(13):4747-4758.
Watras, C.J. and K.A. Morrison. 2008. The response of two remote, temperate lakes to changes
in atmospheric mercury deposition, sulfate, and the water cycle. Can. J. Fish. Aquat. Sci.
65:100-116.
Wedin, D. and D. Tilman. 1996. Influence of nitrogen loading and species composition on the
carbon balance of grasslands. Science 274:1720-1723.
Welch, N.T., J.M. Belmont, and J.C. Randolph. 2007. Summer ground layer biomass and
nutrient contribution to aboveground litter in an Indiana temperate deciduous forest.
American Midland Naturalist 157:11-26.

69
Weseloh, D.V.C., D.J. Moore, C.E. Hebert, S.R. deSolla, B.M. Braune, and D.J. McGoldrick.
2011. Current concentrations and spatial and temporal trends in mercury in Great Lakes
herring gull eggs, 1974-2009. Ecotoxicology 20(7):1644-1658.
Wetmore, C.M. 1988. Lichens and air quality in Indian Dunes National Lakeshore. Mycotaxon
33:25-39.
Wiener, J.G. and D.J. Spry. 1996. Toxicological significance of mercury in freshwater fish. In
W.N. Beyer, G.H. Heinz and A.W. Redmon (Eds.). Environmental Contaminants in
Wildlife: Interpreting Tissue Concentrations. Lewis Publishers, Boca Raton, FL. pp. 297-
339.
Wiener, J.G., D.P. Krabbenhoft, G.H. Heinz, and A.M. Scheuhammer. 2003. Ecotoxicology of
mercury. In D.J. Hoffman, B.A. Rattner, G.A. Burton and J. Cairns (Eds.). Handbook of
Ecotoxicology (2nd ed.). CRC Press, Boca Raton, Florida. pp. 409-463.
Wiener, J.G., B.C. Knights, M.B. Sandheinrich, J.D. Jeremiason, M.E. Brigham, D.R. Engstrom,
L.G. Woodruff, W.F. Cannon, and S.J. Balogh. 2006. Mercury in soils, lakes, and fish in
Voyageurs National Park (Minnesota): importance of atmospheric deposition and
ecosystem factors. Environ. Sci. Technol. 40(20):6261-6268.
Wiener, J.G., R.A. Bodaly, S.S. Brown, M. Lucotte, M.C. Newman, D.B. Porcella, R.J. Reash,
and E.B. Swain. 2007. Monitoring and evaluating trends in methylmercury accumulation
in aquatic biota. In R.C. Harris, D.P. Krabbenhoft, R.P. Mason, M.W. Murray, R.J. Reash
and T. Saltman (Eds.). Ecosystem Responses to Mercury Contamination: Indicators of
Change. SETAC, CRC Press, Taylor and Francis Group, Boca Raton, FL. pp. 87-122.
Wiener, J.G., D.C. Evers, D.A. Gay, H.A. Morrison, and K.A. Williams. 2012a. Mercury
contamination in the Laurentian Great Lakes region: Introduction and overview. Environ.
Pollut. 161:243-251.
Wiener, J.G., M.B. Sandheinrich, S.P. Bhavsar, J.R. Bohr, D.C. Evers, B.A. Monson, and C.S.
Schrank. 2012b. Toxicological significance of mercury in yellow perch in the Laurentian
Great Lakes region. Environ. Pollut. 161:350-357.
Wobeser, G.A., N.O. Nielsen, and B. Schiefer. 1976. Mercury and mink. II. Experimental methyl
mercury intoxication. Canadian Journal of Comparative Medicine 40:34-45.
Wolfe, M.F., T. Atkeson, W. Bowerman, K. Burger, D.C. Evers, M.W. Murray, and E. Zillioux.
2007. Wildlife indicators. In R.C. Harris, D.P. Krabbenhoft, R.P. Mason, M.W. Murray,
R.J. Reash and T. Saltman (Eds.). Ecosystem Responses to Mercury Contamination:
Indicators of Change. SETAC, CRC Press, Taylor and Francis Group, Boca Raton, FL.
pp. 123-189.
Wood, P.B., J.H. White, A. Steffer, J.M. Wood, C.F. Facemire, and F. Percival. 1996. Mercury
concentrations in tissues of Florida bald eagles. J. Wildl. Manage. 60:178-185.
Wren, C.D., D.B. Hunter, J.F. Leatherland, and P.M. Stokes. 1987. The effects of
polychlorinated biphenyls and methylmercury, singly and in combination, on mink. I:
uptake and toxic responses. Arch. Environ. Contam. Toxicol. 16:441-447.
Zananski, T.J., T.M. Holsen, P.K. Hopke, and B.S. Crimmins. 2011. Mercury temporal trends in
top predator fish of the Laurentian Great Lakes. Ecotoxicology 20(7):1568-1576.
Zhang, L., L.P. Wright, and P. Blanchard. 2009. A review of current knowledge concerning dry
deposition of atmospheric mercury. Atmos. Environ. 43:5853-5864.
Zhang, L., P. Blanchard, D. Johnson, A. Dastoor, A. Ryzhkov, C.J. Lin, K. Vijayaraghavan, D.
Gay, T.M. Holsen, J. Huang, J.A. Graydon, V.L.S. Louis, M.S. Castro, E.K. Miller, F.

70
Marsik, J. Lu, L. Poissant, M. Pilote, and K.M. Zhang. 2012. Assessment of modeled
mercury dry deposition over the Great Lakes region. Environ. Pollut. 161:272-283.
Zillioux, E.J., D.B.B. Porcella, and B.J. M. 1993. Mercury cycling and effects in freshwater
wetland ecosystems. Environ. Toxicol. Chem. 12:2245-2264.