Establishment of an Aircraft Antenna Cali.brati.on ... · The effect of frequency modulation (FM)...
50
Establishment of an Aircraft Antenna Cali.brati.on Facility at the Federal Aviation Administration Technical Center Martin A. Badinelli -- ... ,.:iUN Rtcti ti ioUiti. mNrVS8 Ci fr;. N.J. • J: DOT/FAA/CT-TN88/23 Document is on tile at the Technical Center Library, Atlantic City International Airport, N.J. 08405 u.s. DeporTmenr of Tronsporrohon F1tderaI Av1atlon Administration TechnICal Cent... Atlentlc City Internetlone. Airpon. 084ClS
Transcript of Establishment of an Aircraft Antenna Cali.brati.on ... · The effect of frequency modulation (FM)...

Establishment of an Aircraft Antenna Cali.brati.on Facility at the Federal Aviation Administration Technical Center
Martin A. Badinelli
--... ,.:iUN 1~ Rtcti
~H~l ~£.:i} ti ioUiti. mNrVS8Cifr;. N.J. • J: DOT/FAA/CT-TN88/23
Document is on tile at the Technical Center Library, Atlantic City International Airport, N.J. 08405
u.s. DeporTmenr of Tronsporrohon
F1tderaI Av1atlon Administration
TechnICal Cent...
Atlentlc City Internetlone. Airpon. N.~. 084ClS

I I
•
I
i>
FAA Technical Center
IIIIIIIIIIIIIIIIIIIIIIIIIIII~IIIIII"IIIIIIIIIII *00016432*

I, 1. Repo,t No.
; DOT!FAA/CT-TN88/23
.. . 4. Titl. ond S"btitl.
Tech"ical R.,.rt Documentation Page
I 3. Reci"e"t', Cot.IOI No. I I i
5. Rett." O.t.
ESTABLIsm·~NT OF AN AIRCRAFT ANTENNA CALIBRATION June 1988 FACILITY AT THE FEDERAL AVIATION ADMINISTRATION 6. p.,fona'''' O"oni I.tio" Code
TECHNICAL CENTER ~~~~~~~~~~~~~~~~~~~~~~~~~~~~~~~~•. P.,f.~i",O".ftil.~o"A.~,t No.
7. Au",o,',) DOT/FAA/CT-TN88/23Martin A. Badinelli
Federal Aviation Administration Technical Center Atlantic City International Airport, New Jersey 08405
10. Wona U"it No. CTAAIS)
1'. C.ftt,.ct., G,Oft' No. F18-04A
13. T". of Ae,o,t _"d P.,iod Covet.d
12. $tJOft••,in, Ag."cy H.... ..4 Aet4ll,••• Technical NoteU.S. Department of Transportation
Federal Aviation Administration 14. Stte"••" It, A,."cy eoet.Technical Center
Atlantic City International Airnort. New Jersev 08405
16. At..ft.ct
This report describes the es tab lishment of an Aircraft Antenna Cal ibrat ion Faci 1i ty capab Ie of' calibrat ing very high frequency (VHF) omnid i rect ional rad io range (VOR) / localizer, VHF communications, glide slope, and ultra high frequency (UHF) communications antennas. The effect of frequency modulation (FM) band frequencies on these antennas is also measured.
The calibration procedure used a calibrated, tunable dipole antenna as the primary standard and a biconical antenna as a secondary standard. The biconical antenna, which is broadband and does not require tuning, made an automated facility possible. The facility was established by measuring the antenna factors of the biconical antenna using the calibrated dipole antenna. The calibrated biconical antenna was then used to derive the antenna factors of the aircraft antenna.
Test results indicate the location of the antenna on the airc'raft may affect the calibration. This is due to signal shielding of either the direct or reflected wave by the aircraft. It is recommended that additional antenna calibrations be performed using Federal Aviation Administration out-of-band, FM, and television band signals.
17. Key W.,d. Antenna Antenna Calibration Antenna Factors Calibration
II. Di.tri~ti... St......,
Document is on file at the Technical Center Library, Atlantic City International Airport, New Jersey 08405
21. Ho. of P .... 22. P,ic.3). Security C1...... C.f thi. , ...)19. S.cu,ity CI•••if. <of "". ,...,d
48Unclassified Unclassified
Fo'''' DOT F 1700.7 (1-72) R",,,"ct..... f c....I.t.ct , ... _tho,t ae4


TABLE OF CONTENTS
Page
INTRODUCTION 1
Purpose 1 Background 1
TEST DESIGN 1
Approach Test Procedures and Results
12
TEST RESULTS AND ANALYSIS 4
Biconical Antenna Calibration Results 4 Aircraft Antenna Calibration Results 5
CONCLUSIONS 8
RECOMMENDATIONS 8
REFERENCES 8
iii

LIST OF ILLUSTRATIONS
Figure Page
1 Antenna Calibration Setup -- Block Diagram 9
(Original Frequencies) -- Horizontal Polarization
(Original Frequencies) -- Vertical Polarization
(New Frequencies) -- Horizontal Polarization
(New Frequencies) -- Vertical Polarization
2 Antenna Calibration Lobe Structure 10
3 Biconical Antenna Factor Versus VOR/LOC Frequency 11
4 Biconical Antenna Factor Versus VHF Communications Frequency 12
5 Biconical Antenna Factor Versus Glide Slope Frequency 13
6 Biconical Antenna Factor Versus UHF Communications Frequency 14
7 Biconical Antenna Factor Versus FM Band Frequency 15
8 Biconical Antenna Factor Versus FM Band Frequency 16
9 Biconical Antenna Factor Versus FM Band Frequency 17
10 Biconica1 Antenna factor Versus FM Band Frequency 18
11 N-50 VOR/LOC Antenna Factors at Four Orientations 19
12 N-50 VHF Communications Antenna Factors at Four Orientations 20
13 N-50 Glide Slope Antenna Factors at Three Orientations 21
14 N-91 VOR/LOC Antenna Factors at Four Orientations 22
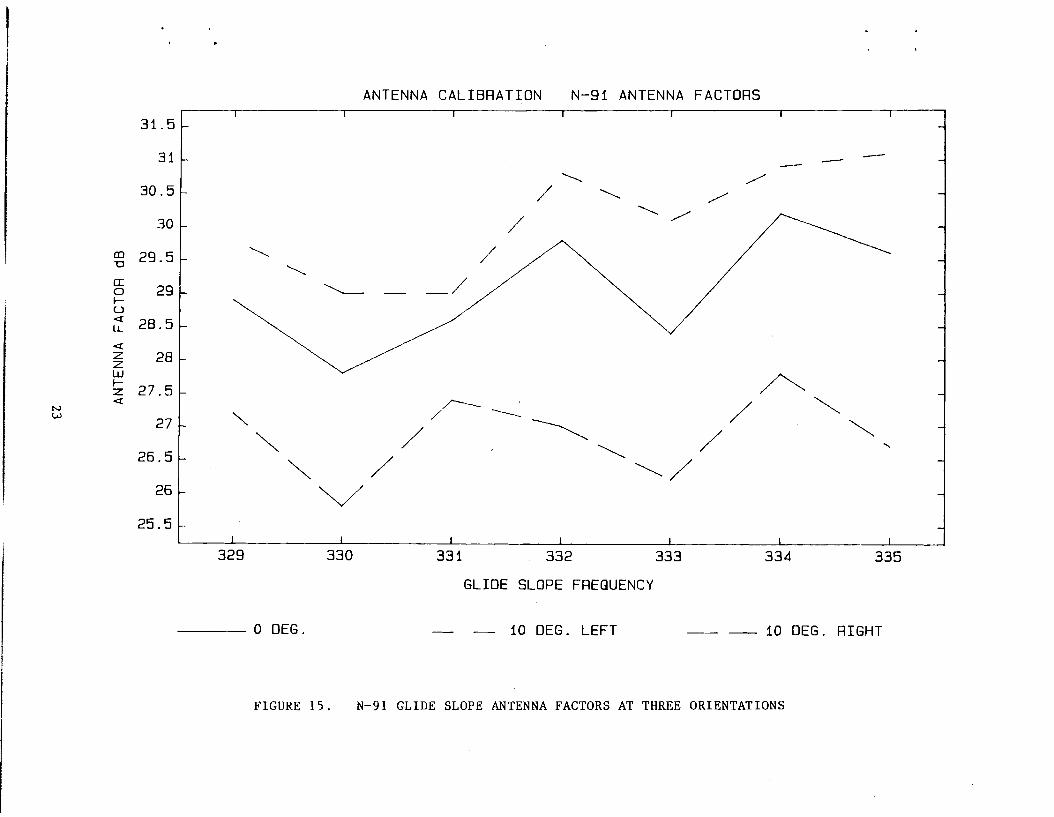
15 N-91 Glide Slope Antenna Factors at Three Orientations 23
16 N-91 VHF Communications Antenna Factors at Four Orientations 24
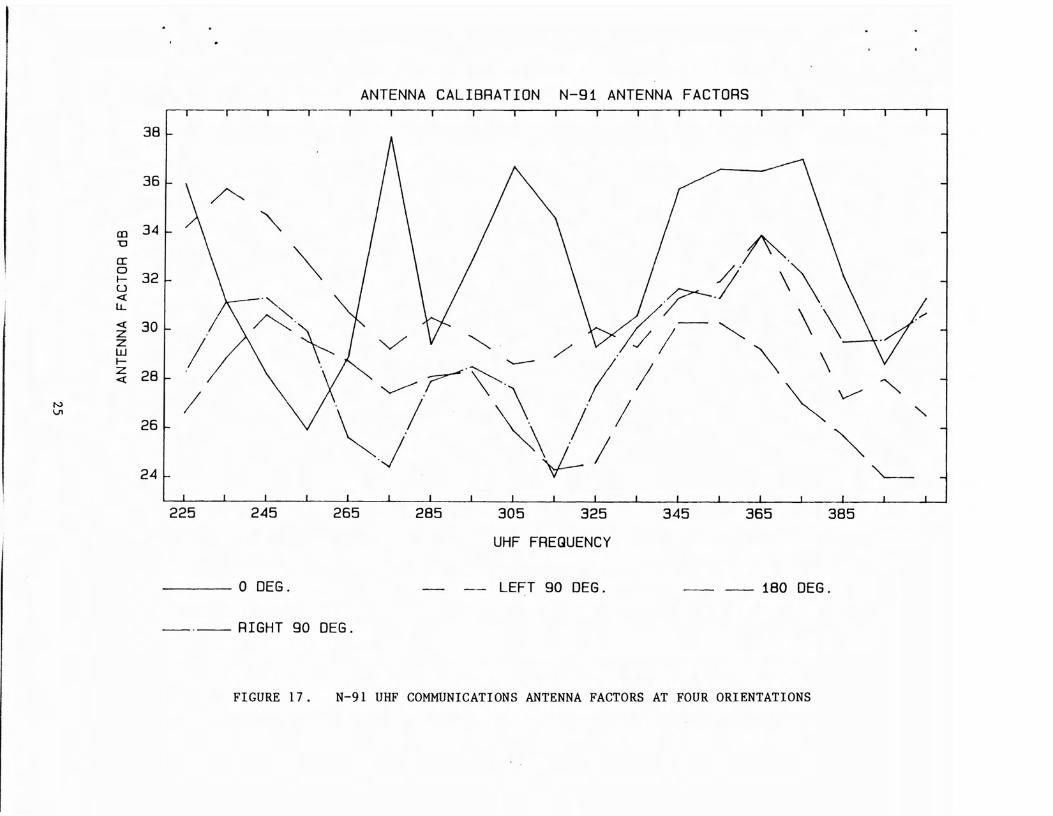
17 N-91 UHF Communications Antenna Factors at Four Orientations 25
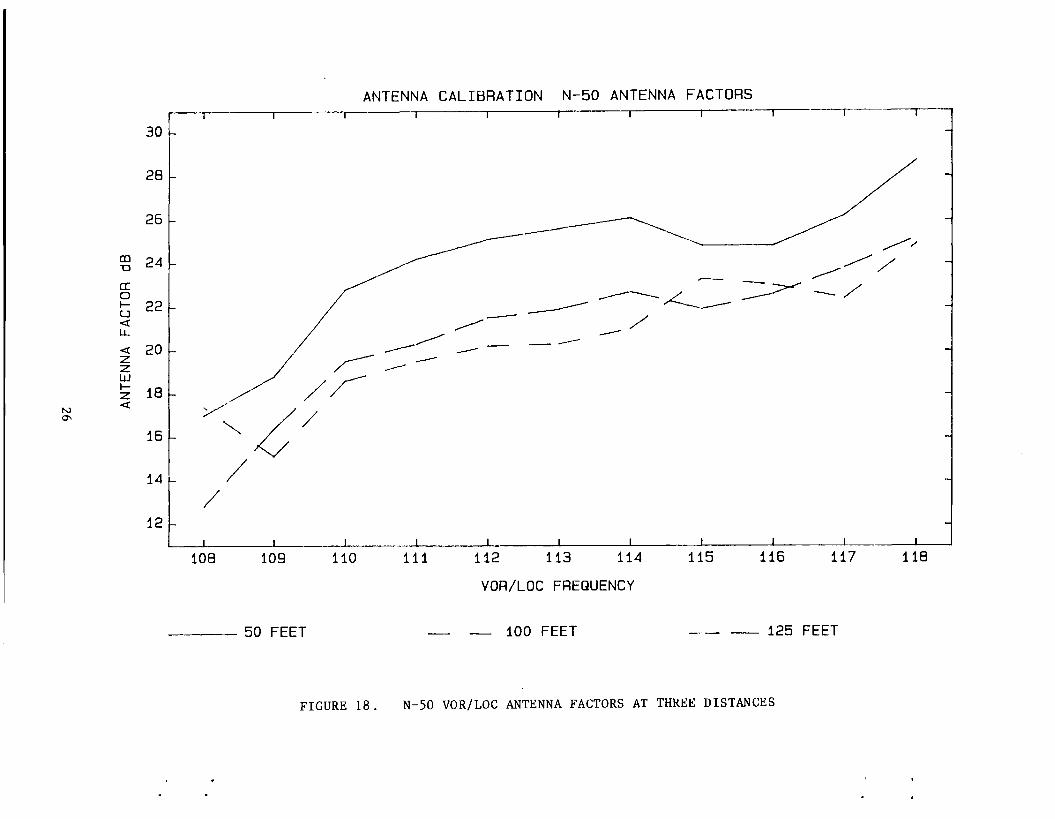
18 N-SO VOR/LOC Antenna Factors at Three Distances 26
19 N-50 Glide Slope Antenna Factors at Three Distances 27
20 Diagram of Shielding Caused by Aircraft 28
21 N-SO VHF Communications Antenna Factors at Three Distances 29
IV

LIST OF ILLUSTRATIONS (Continued)
. . Figure Page
22 N-50 VHF Communications Antenna Factors at Three Distances 30 With Different Antenna Heights
23 N-50 VOR/LOC Antenna Factors when Exposed to FM Band 31 Frequencies
24 N-50 VHF Communications Antenna Factors when Exposed to 32 FM Band Frequencies
25 N-9l VOR/LOC Antenna Factors when Exposed to FM Band 33 Frequencies
26 N-9l VHF Communications Antenna Factors when Exposed to 34 FM Band Frequencies
LIST OF TABLES
Table P~ge
1 Biconical Antenna Locations for VOR/Localizer Band 35 Frequencies
2 Biconical Antenna Locations for VHF Communications Band 35 Frequencies
3 Biconical Antenna Locations for Glide Slope Band Frequencies 36
4 Biconical Antenna Locations for UHF Communications Band 36 Frequencies
5 Biconical Antenna Locations for FM Band Frequencies with 37 Antenna Horizontally Polarized - Original Frequencies
6 Biconical Antenna Locations for FM Band Frequencies with 37 Antenna Vertically Polarized - Original Frequencies
7 Biconical Antenna Locations for FM Band Frequencies with 38 Antenna Horizoritally Polarized - New Frequencies
8 Biconical Antenna Locations for FM Band Frequencies with 38 Antenna Vertically Polarized - New Frequencies
v

LIST OF TABLES (Continued)
Table Page
9 Original and New FM Band Frequencies 39
N-SO VHF Communications Calibration
10 Aircraft Antenna and Location 40
11 Comparison of Old and New Transmit Antenna Heights for 41
Vl

INTRODUCTION
PURPOSE.
This project was conducted to establish an Aircraft Antenna Calibration Facility at the Federal Aviation Administration (FAA) Technical Center. The facility was to be capable of calibrating very high frequency (VHF) omnidirectional radio range (VOR)/localizer, VHF communications, ultra high frequency (UHF) communications, and glide slope (GS) antennas on FAA aircraft. The effects of frequency modulation (FM) band frequencies (88-108 megahertz (MHz)) on these antennas were also evaluated. Since aircraft downtime was an important consideration, an automated system was developed.
BACKGROUND.
FAA aircraft often measure the field strength of interfering signal sources. When subsequent measurements by other FAA or contractor aircraft yield different results, it is impossible to determine whether the field strength changed or the second aircraft's antenna responded differently to the signal. To eliminate this problem, the Spectrum Engineering Division, AES-500, requested the FAA Technical Center's Spectrum Engineering Branch, ACT- 590, to develop an aircraft antenna calibration facility. With calibrated antennas, repeatable measurements should be more likely.
TEST DESIGN
APPROACH.
The antenna calibration uses the methods prescribed in Federal Communications Commission (FCC) Bulletin OST 55 (reference 1) and Transport Canada (TC) reports TP-26l0, TP-7877E, and TP-7942E (references 2, 3, and 4). Although these documents cover procedures only for horizontally polarized signals, the same principles will be applied to the vertically polarized signals. This method first measures the field strength using an antenna with known antenna factors. This antenna is our primary calibration standard. At the exact same position that the field strength was measured, a second antenna is substituted. The antenna factors of this antenna can then be determined. The first antenna was a dipole which requires tuning at each frequency change. The second antenna was a biconical type which is broadband and does not require tuning. This makes an automated system possible.
The antenna calibration facility requires an open area with a uniform reflecting surface free of interfering signals and reflecting objects, such as buildings and vehicles. An area at the ~outh end of the FAA Technical Center's ramp was selected because it appeared to meet these requirements. Numerous antenna calibrations were performed in this area using the dipole and biconical antennas to establish the uniformity of the reflecting surface and the presence of interfering signals. The reflecting surface proved to be uniform; however, there was some radio frequency (RF) interference which was overcome by increasing our transmit sign~l level. The signal level for the FM band testing could not be increased to overcome the local FM station interference due to restrictions imposed by FCC part 15. The FM station interference problem was reduced by first selecting 21 unused frequencies in the FM band and collecting data. Where interference was found, a frequency 100 kilohertz (kHz) away was used. If interference was still a problem, a frequency 200 kHz away
1
--_ ..._---------- .....__.__.__
was used. Eventually, 12 of the original 21 frequencies were changed. After the area had been established as a good location, aircraft antenna calibrations were begun.
To calibrate an aircraft antenna, the field strength is measured with the biconical antenna at a location where its antenna factors have been previously determined. The aircraft is then moved into location with its antenna in the same position just occupied by the biconica1 antenna. The antenna factors of the aircraft antenna can then be computed. These antenna factors will be added to the signal levels measured by the aircraft receiver to compute the actual field strength of unknown signals.
'TEST PROCEDURES AND RESULTS.
The facility was configured as shown in figure 1. The HP-8660C signal generator, which was used as our transmitter, fed a log periodic antenna. The generator was stepped in 1-MHz increments for the VHF communications, VOR/10ca1izer, and glide slope bands and in 10-Mhz increments for the UHF communications band. It was found that a +10-decibels above 1 milliwatt (dBm) signal level overcame the RF interference problem. The FM band frequencies were stepped in approximate l-MHz steps. The log periodic antenna was used as the transmit antenna because it could cover the required frequency range and has good directivity. The directivity was important to limit reflections which may affect our data.
As with any calibration, the response of the device (antenna) under test is measured while a known signal is applied. With the antenna calibration facility a· known, field strength must.be established by transmitting ~ signal and measuring it with an antenna with known antenna factors. A tunable dipole, which is the primary standard, is used for this purpose. This antenna was adjusted for each frequency step of the signal generator in the VHF communications, VOR/10calizer, UHF communications, and FM band. For the glide slope band, the antenna was tuned for the center frequency but retuning for each frequency step was not necessary due to the narrow (7 MHz) glide slope band.
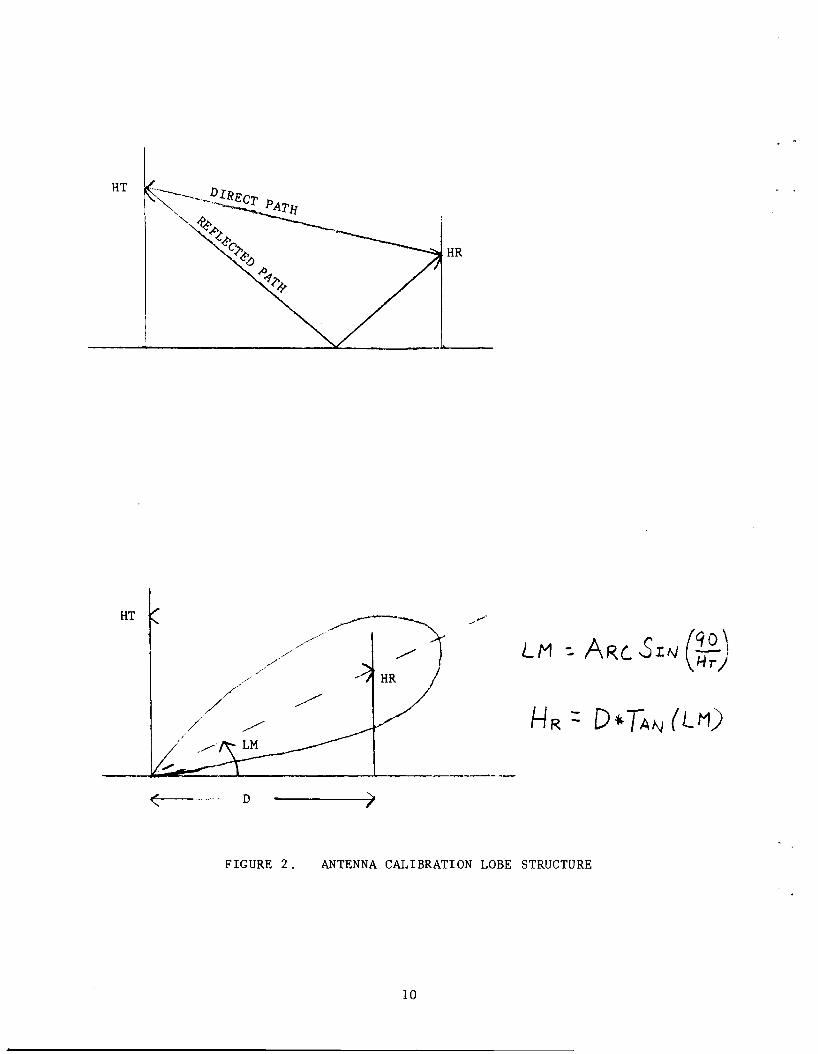
Since the calibration must be done at the same location where the aircraft antenna will be located (see figure 2), the transmit antenna height (HT) required to put the maximum of the lobe at the receive antenna height (HR) must be calculated. The lobe structure is the result of the summing and canceling of the direct and reflected waves. For example, if the distance between the transmit and receive antenna (D) is 100 feet and the receive antenna (aircraft antenna) is 15 feet above the ground, the maximum lobe angle (LM) is:
tan(LM) HR/D = 15/100 0.15 LM = 8.53 degrees
Using the relation 90 HTsin(LM) we can solve for HT.
HT - 90/sin(LM) = 90/sin(8.53) HT 607 electrical degrees
For glide slope frequencies: 1 foot = 121 electrical degrees so HT 5 feet.
2
Once the field strength has been measured for each frequency at a specific HR and D with the tuned dipole, a broadband biconical antenna is substituted and the antenna factors for this antenna are established by measuring this same signal. With these antenna factors, it is possible to measure the field strength at this location at any time in the future without tuning the antenna. This is important because the field strength must be measured just prior to placing the aircraft in this location.
The receive antenna was one of the following:
1. Compliance Design Roberts Antenna: FCC Bulletin OST 55 recommends the use of dipole antennas as the primary standard for antenna calibrations. The Roberts antenna is a dipole antenna that was originally designed by the FCC to most closely resemble the ideal isotropic antenna which permits measuring the field strength with greater accuracy than is possible with other type antennas. This antenna is tuned by adjusting the dipole length at each frequency.
2. Biconical Antenna: FCC bulletin OST 55 also permits the use of biconical type antennas provided they are correlated to a dipole antenna. The biconical antenna is a broadband antenna that was calibrated using the Roberts dipole antenna. It replaces the Roberts as our reference antenna because it does not require frequency tuning and therefore makes an automated antenna calibration facility possible. It is a secondary standard.
3. Aircraft Antenna: This is the antenna the facility was developed to calibrate. It may be a VOR/localizer, VHF communications, glide slope, or UHF communications antenna.
The spectrum analyzer was used as a receiver to measure the signal at the output of the receive antenna/cable combination. The computer stepped the signal generator through the frequency band and insured that the spectrum analyzer followed it. In addition, it collected all the data and computed the antenna factor.
The antenna factors are found by subtracting the voltage at the output of the receive antenna from the signal strength. Cable loss must also be considered. The antenna factor is defined as:
Antenna Factor - Field Strength - Receive Voltage - Cable Loss
This is why it is important to first accurately determine the field strength at the measurement location. The receive voltage is measured with the spectrum analyzer.
The calibration procedure used is as follows:
1. Using the signal generator and log periodic antenna, radiate a signal and step through the frequency band.
2. Determine the field strength at each frequency using the Roberts dipole antenna. Since the antenna factors of this antenna are known, the field strength can be found by measuring the receive voltage at the output of the Roberts antenna and using the following relationship.
Roberts Field Strength - Roberts Antenna Factor + Receive Voltage + Cable Loss
3

3. Determine the antenna factors of the biconica1 antenna by using the field strengths measured with the Roberts antenna in step 2. Placing the biconica1 antenna at the same location used in step 2 exposes it to the same field strength.
Biconica1 Antenna Factor = Roberts Field Strength - Receive Voltage - Cable Loss
4. At the time an aircraft is to be calibrated, first measure the field strength with the now calibrated biconica1 antenna at the same location used in step 3. The biconica1 antenna factors are those developed in step 3.
Biconica1 Field Strength = Biconica1 Antenna Factor + Receive Voltage + Cable Loss
5. Determine the antenna factors of the aircraft antenna by using the field strength measured by the biconica1 antenna in step 4. Position the aircraft so the antenna under test is at the same location used in steps 2, 3, and 4.
Aircraft Antenna Factors = Biconica1 Field Strength - Receive Voltage - Cable Loss
As can be seen from the above equations, if the same cables are used, the cable loss term is canceled out of the equations.
TEST RESULTS AND ANALYSIS
BICONICAL ANTENNA CALIBRATION RESULTS.
The antenna factors for the biconical antenna were established at numerous locations on the ramp by using the Roberts dipole tD measure field strength. These data provide valuable information on interference effects and the stability of the ramp as a calibration location and also provide information on the repeatability of data at this location and confirms that antenna height and distance are not a factor. This is important because if antenna factor changes with distance or antenna height, it would be impossible to have a meaningful calibration. Figure 3 shows the effect on antenna factor in the VOR/localizer band as the Roberts dipole and biconica1 antennas were moved around the ramp. It can be seen that the most the antenna factor varies is approximately 1.8 decibel (dB) at 109 MHz as distance and antenna heights are changed. Since the FCC considers a difference of less than 3 dB as acceptable, our 1.8 dB variation is very good. It should be noted that the 1.8 dB is the worst case and most data points are within a 0.75 dB spread. These data are also within approximately 0.5 dB of the manufacturer's specification for the biconica1 antenna. Table 1 tabulates the antenna heights and distances for the data plotted in figure 3. Note that some of the locations are repeated and that these data were repeatable.
The VHF communications data are shown in figure 4. Most of the data recorded repeat within 2 dB. One data run produced a large peak at 126 MHz which was 3.3 dB above the lowest data recorded at this frequency. This exceeded the FCC 3 dB criterion and was probably caused by interference. This same run also indicates interference at 121 and 131 MHz. Antenna height and distance information are both given in table 2. These data are also within 0.5 dB of the manufacturer's specification.
I...

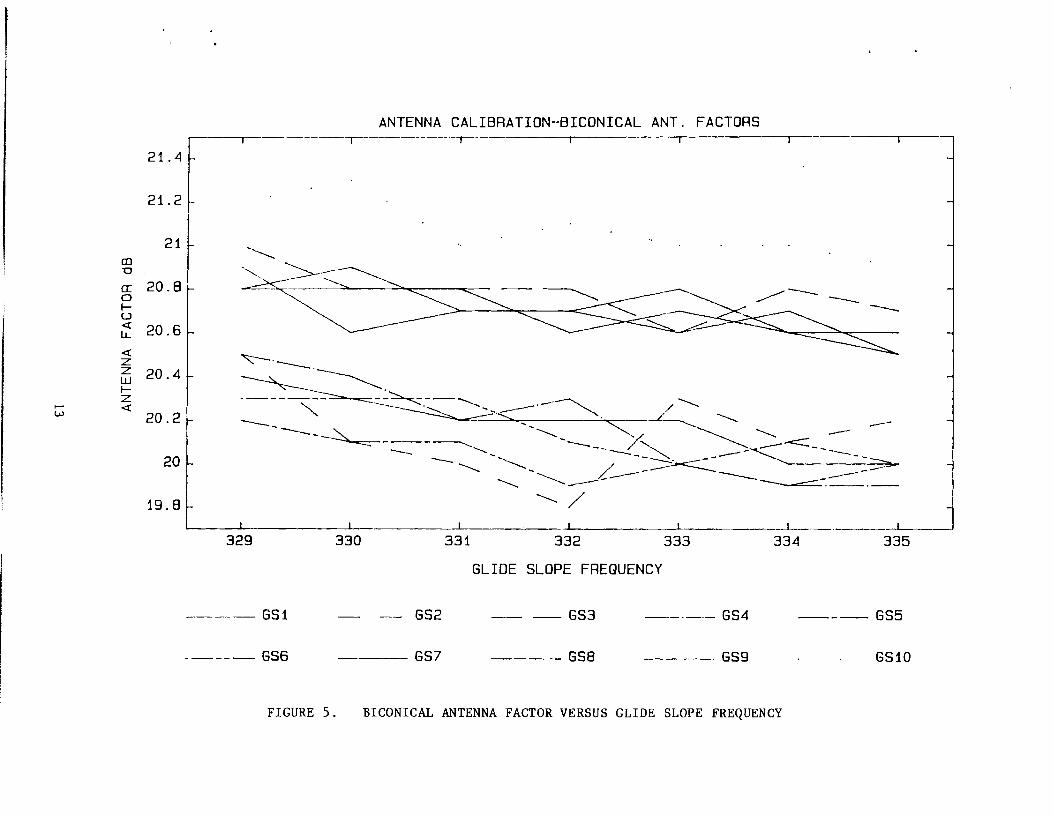
Glide slope antenna data are plotted in figure 5 and tabulated in table 3. A maximum 1.3 dB variation is seen at 332 MHz. No interference was noted. These results were within 0.5 dB of the manufacturer's data.
A maximum 2.2 dB at 365 MHz variation is seen in the UHF communications data shown in figure 6. See table 4 for antenna location data.
FM band data were collected using the Roberts dipole and biconical antennas in both the horizontally and vertically polarized modes. To comply with FCC part 15 requirements, the transmit signal level used was lower than used in the FAA frequency bands which produced a lower signal plus noise-to-noise ratio and increased the effect of interference on the data.
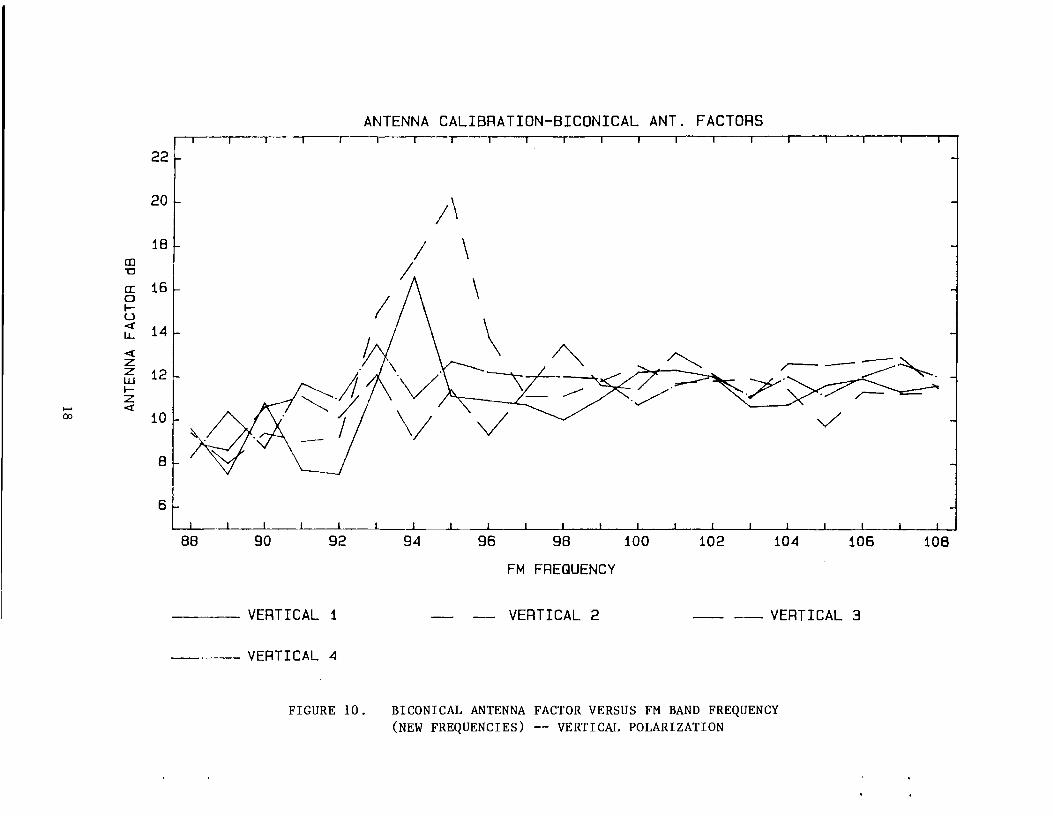
The antenna factors found with the biconical antenna in the FM band are shown in figure 7 for the horizontally polarized signals and in figure 8 for the vertically polarized. Variations as great as 10 dB are noted. Data were collected twice at each location to analyze how intermittent interference effected repeatability. For example, in figure 7, horizontal 3 and 4 show data collected at the same location only minutes apart. While the antenna factor changed by 3 dB at 97 MHz, repeatability was better at most other frequencies. This indicates that over short time periods, the interference is relatively constant. Over longer time frames, as seen by comparing horizontal 1/2 to horizontal 3/4, the interference effect was much greater. Horizontal 3/4 data were collected about 30 minutes after horizontal 1/2. Since the transmit level could not be increased, the noisier frequencies were changed by 100 to 200 kHz. In all, 12 frequencies were changed and additional data were recorded. The data with the new frequencies are plotted in figures 9 and 10 for horizontally and vertical,ly polarized signals, respectively. A significant improvement is seen in the repeatability of the antenna factor. To further eliminate the effect of interference, an average of each polarization was used for calibrating the aircraft in the FM band. This eliminated the interference seen at 101 and 106 MHz in the horizontal mode and 94 and 95 MHz in the vertical mode. The horizontal data are used when calibrating the horizontally polarized VOR/localizer and glide slope aircraft antennas. The vertical data are for the vertically polarized VHF and UHF communications antennas. The antenna locations for figures 7 through 10 are shown in tables 5 through 8, respectively. The original and new frequencies are listed in table 9.
AIRCRAFT ANTENNA CALIBRATION RESULTS.
For this project, an Aero Commander (N-50) and a Convair 580 (N-9l) were calibrated. The aircraft antenna used and its location are shown in table 10.
The calibration was performed with the aircraft oriented with the nose pointed towards the transmit antenna and then turned +/- 900 and 1800 with respect to the transmit antenna. This was done for the VOR/localizer, VHF communications, UHF communications antennas, and FM band tests. The Aero Commander is not UHFcommunications equipped. The glide slope antenna was calibrated with the aircraft nose directed towards the transmit antenna and then angled +/- 100 . The glide slope was done at +/- 100 because normally glide slopes are flown straight in and 100 would be the 'furthest off-course the aircraft would typically fly.
The Aero Commander data is shown in figure 11 through 13. To evaluate the possibility of moving the transmit antenna instead of the aircraft, the Aero Commander data was taken with the aircraft stationary and the transmi t antenna
5
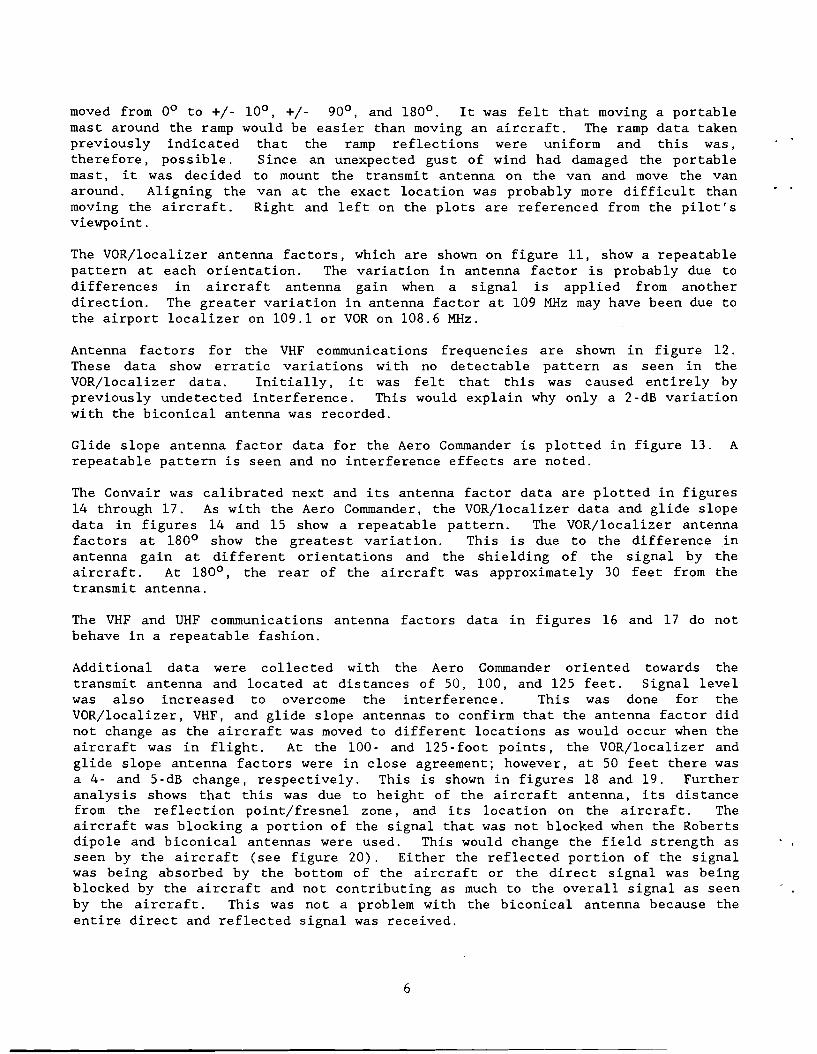
moved from 00 to +/- 100 , +/- 900 , and 1800 . It was felt that moving a portable mast around the ramp would be easier than moving an aircraft. The ramp data taken previously indicated that the ramp reflections were uniform and this was, therefore, possible. Since an unexpected gust of wind had damaged the portable mas t , it was dec ided to mount the transmi t antenna on the van and move the van around. Aligning the van at the exact location was probably more difficult than moving the aircraft. Right and left on the plots are referenced from the pilot's viewpoint.
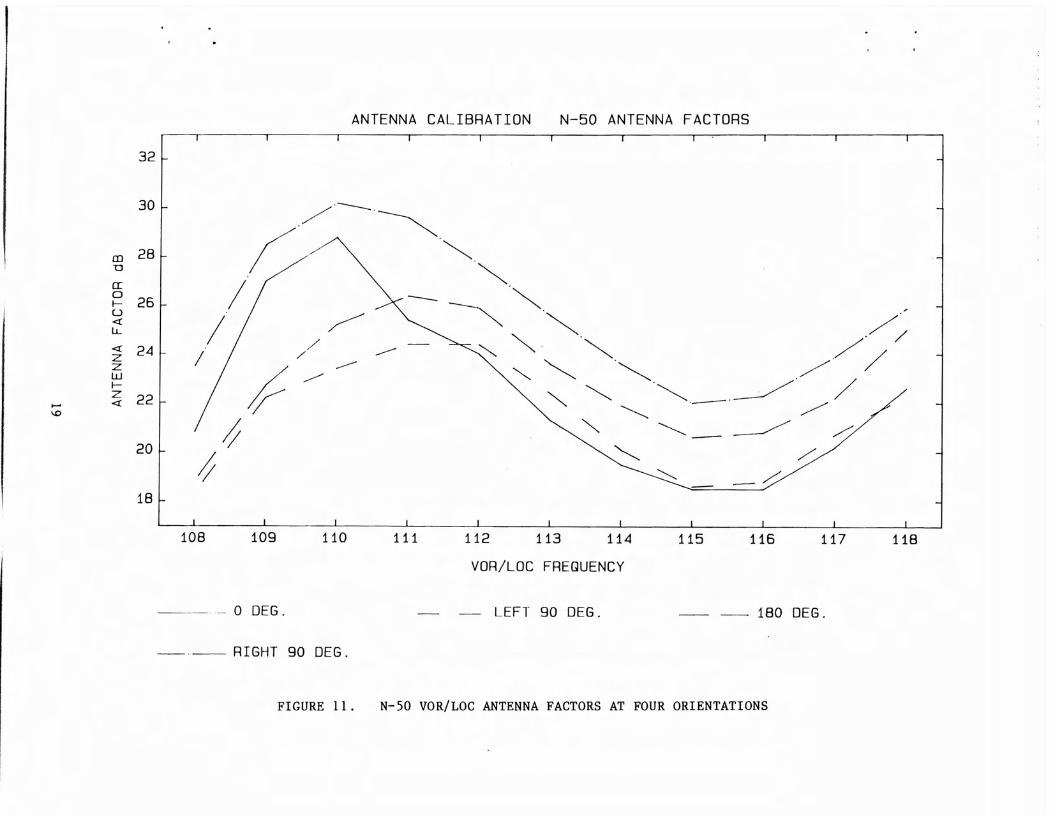
The VOR/localizer antenna factors, which are shown on figure 11, show a repeatable pattern at each orientation. The variation in antenna factor is probably due to differences in aircraft antenna gain when a signal is applied from another direction. The greater variation in antenna factor at 109 MHz may have been due to the airport localizer on 109.1 or VOR on 108.6 MHz.
Antenna factors for the VHF communications frequencies are shown in figure 12. These data show erratic variations with no detectable pattern as seen in the VOR/localizer data. Initially, it was felt that this was caused entirely by previously undetected interference. This would explain why only a 2-dB variation with the biconical antenna was recorded.
Glide slope antenna factor data for the Aero Commander is plotted in figure 13. A repeatable pattern is seen and no interference effects are noted.
The Convair was calibrated next and its antenna factor data are plotted in figures 14 through 17. As with the Aero Commander, the VOR/localizer data and glide slope data in figures 14 and 15 show a repeatable pattern. The VOR/localizer antenna factors at 1800 show the greatest variation. This is due to the difference in antenna gain at different orientations and the shielding of the signal by the aircraft. At 1800 , the rear of the aircraft was approximately 30 feet from the transmit antenna.
The VHF and UHF communications antenna factors data in figures 16 and 17 do not behave in a repeatable fashion.
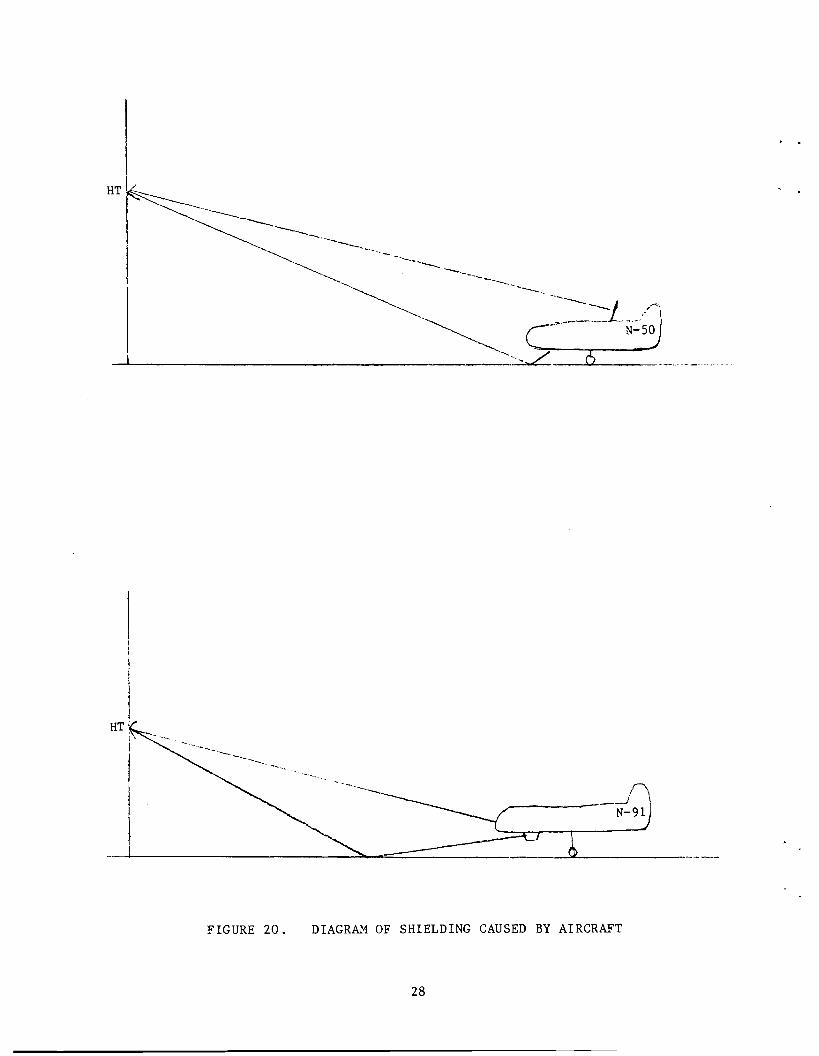
Additional data were collected with the Aero Commander oriented towards the transmit antenna and located at distances of 50, 100, and 125 feet. Signal level was also increased to overcome the interference. This was done for the VOR/localizer, VHF, and glide slope antennas to confirm that the antenna factor did not change as the aircraft was moved to different locations as would occur when the aircraft was in flight. At the 100- and l25-foot points, the VOR/localizer and glide slope antenna factors were in close agreement; however, at 50 feet there was a 4- and 5-dB change, respectively. This is shown in figures 18 and 19. Further analysis shows that this was due to height of the aircraft antenna, its distance from the reflection point/fresnel zone, and its location on the aircraft. The aircraft was blocking a portion of the signal that was not blocked when the Roberts dipole and biconical antennas were used. This would change the field strength as seen by the aircraft (see figure 20). Either the reflected portion of the signal was being absorbed by the bottom of the aircraft or the direct signal was being blocked by the aircraft and not contributing as much to the overall signal as seen by the aircraft. This was not a problem with the biconical antenna because the entire direct and reflected signal was received.
6

The VHF communications antenna factors shown in figures 21 appear very erratic and not repeatable. For example, at 130 Mhz, the antenna factor at 50 feet would be 12.5 dB; at 100 feet, 2.5 dB; and at 125 feet, 18.5 dB. The difference between 100 and 125 feet was 16 dB. Clearly this would not be a satisfactory antenna calibration.
Since the VOR/10ca1izer, VHF communications, and glide slope antenna factors were all affected by antenna locations, it was decided to calibrate the Aero Commander at a location where the reflection point would be closer to the transmit antenna and thus further from the aircraft. This would prevent the reflected portion of the signal from being absorbed by the aircraft and give a truer representation of the signal measured by the Roberts dipole and biconica1 antenna. To do this, lower transmit antenna heights were used which moved the reflecting point away from the aircraft (towards the transmit antenna) but at the same time, moved the maximum of the lobe upwards. The aircraft antenna was now located at point in the radiation pattern one-third the height of the radiation pattern maximum. An area near the maximum of the lobe had been desired because maximum signal would be received here which would help prevent interference effects. Variations in signal also are less pronounced here than at the edge of the lobe. The VHF communications antenna was selected because it represented the worst case. A comparison of the old and new transmit antenna heights and the effect on reflection points for the VHF communications antenna heights is shown in table 11.
It is seen that with the old locations, the geometric reflection point was beneath the aircraft which caused these signals to be absorbed by the plane. At a distance of 50 feet, the fresnel zone center was also beneath the aircraft. With the new locations, both. points are in front of the aircr.aft, however, at a distance of 50 feet they are still fairly close to the nose.
Data were again collected for the Aero Commander at 50, 100, and 125 feet and is plotted in figure 22. Only the VHF communications antenna was tested this time. A vast improvement in antenna factor repeatability was found. A suitable transmit antenna height at the 50-foot distance which would provide a direct and reflected signal could not be found. The transmit antenna height had been reduced from 16 to 5 feet to achieve these results. Any further lowering of the transmit antenna would affect the direct wave path since the VHF communications antenna is only 6 feet above the ground on the Aero Commander. The data show good repeatability for the 100- and 125-foot distances but some variations at 50 feet. Although the antenna factor was not entirely repeatable at 50 feet, it at least followed the same pattern.
Both aircraft responses to FM band frequencies are shown in figures 23 through 26. Figures 24 and 25 show no data for the 1800 -orientation because only noise was received and no measurable signal. The glide slope and UHF communications antennas were also tested with FM band frequencies but they are not plotted because they did not respond to signals so far out of band. The signal received by the VOR/10ca1izer and VHF communications antenna was at best only 5 to 10 dB above the noise level. This low signal plus noise - to-noise ratio made data collection difficult. Typically, the aircraft antennas did not respond to FM band interference till it reached 98 MHz. Below 98 MHz, the plots show the effect of noise.
7
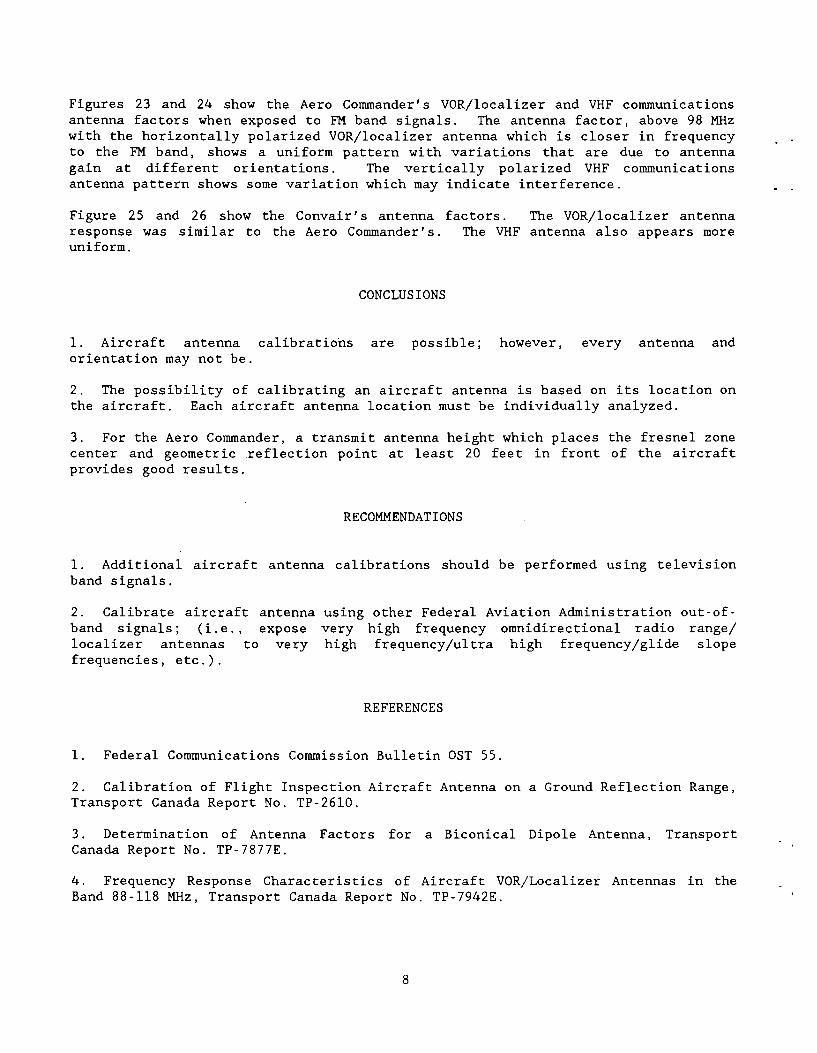
Figures 23 and 24 show the Aero Commander's VOR/localizer and VHF communications antenna factors when exposed to FM band signals. The antenna factor, above 98 MHz with the horizontally polarized VOR/localizer antenna which is closer in frequency to the FM band, shows a uniform pattern with variations that are due to antenna gain at different orientations. The vertically polarized VHF communications antenna pattern shows some variation which may indicate interference.
Figure 25 and 26 show the Convair's antenna factors. The VOR/localizer antenna response was similar to the Aero Commander's. The VHF antenna also appears more uniform.
CONCLUSIONS
1. Aircraft antenna calibrations are possible; however, every antenna and orientation may not be.
2. The possibility of calibrating an aircraft antenna is based on its location on the aircraft. Each aircraft antenna location must be individually analyzed.
3. For the Aero Commander, a transmit antenna height which places the fresnel zone center and geometric .reflection point at least 20 feet in front of the aircraft provides good results.
RECOMMENDATIONS
1. Additional aircraft antenna calibrations should be performed using television band signals.
2. Calibrate aircraft antenna using other Federal Aviation Administration out-ofband signals; (i.e., expose very high frequency omnidirectional radio range/ localizer antennas to very high frequency/ultra high frequency/glide slope frequencies, etc.).
REFERENCES
1. Federal Communications Commission Bulletin OST 55.
2. Calibration of Flight Inspection Aircraft Antenna on a Ground Reflection Range, Transport Canada Report No. TP-26l0.
3. Determination of Antenna Factors for a Biconical Dipole Antenna, Transport Canada Report No. TP-7877E.
4. Frequency Response Characteristics of Aircraft VOR/Localizer Antennas in the Band 88-118 MHz, Transport Canada Report No. TP-7942E.
8

TRANSMIT RECEIVE ANTENNA
IC \ V \ 1/
..,. COMPUTER "
PRINTER
'"
SIGNAL GENERATOR
(TRANSMITTER)
SPECTRUM .... ANALYZER "
(RECEIVER)
FIGURE 1. ANTENNA CALIBRATION SETUP -- BLOCK DIAGRAM
HR
__.........-=:::;;.;~_....L- -........ ,__
D
FIGURE 2. ANTENNA CALIBRATION LOBE STRUCTURE
10

12.5
12.25
12
aJ 11.75 u
a: 0 11.5 r-u < 1..L 11.25 <{
z z 11 w t-z 10.75<....
10.5
10.25
10
ANTENNA CALIBRATION-BICONICAL ANT. FACTORS .- I I I -.- I
\ \
\ \
~~ / -/~ ~ ~
\ ---~ - - ~/--. \ / -- --",~------- --- '" \~ -~
__ ~ /'" ~. ~__~L \ <,>-~ " ~ ~~~~:. '"
I I \././~'>...
~/ I
I / /
''''... /'
'" "''''V'
108 109
-- VOR1
---- VOR6
110 111
VOR2
VOR7
112
VOR
-
113 114 115 116 117 118
LOC FREQUENCY
- VOR3 -_.- VOR4 -- VOR5
FIGURE 3. BICONICAL ANTENNA FACTOR VERSUS VOR/LOC FREQUENCY

- -
ANTENNA CALIBRATION-BICONICAL ANT. FACTORS 13.75 I I --I
13.5 13.25
13 12.75 12.5
0
CD
12 0. ~ "0 12.25 /_.-----.a: .u4: 11.75 LL 11.5 ~ 11.25z w 11t-
/ ...... ~ 10.75 t'...,)
10.5 10.25
10 9.75 9.5
- I
118 122 124 126 128 130 132 134
VHF FREQUENCY
--- VHF1 VHF2 -- - VHF3 -_.- VHF4 --- VHF5
----- VHF6 VHF7
FIGURE 4. BICONICAL ANTENNA FACTOR VERSUS VHF COMMUNICATIONS FREQUENCY
----
I 21.4~
ANTENNA CALIBRATION-BICONICAL I._,-
ANT. FACTORS T-~-- -~--- 1
21.2
I 21
OJ u
IT: 0 JU <r l.L
20.8
20.6
...... w
4: Z z w r-z <t
20.4
20.2
20
19.8
~
'''., ~-
~'--'-------""" .-~ ~/ -----........~. -~- --- -- ""'. -'/ --- -=::::- - *----~-~-- ~- - -- -~--............_-~--. .-............ ""'" ---........ . --- --~ -------=.. "'--- " ------- / ......., --- --------~--~ ----......... __- " ----.......-- L', - --..-.
" - - --- ......... _~--------~ '-=---:-. - .--
--- --- / I I
329 330 331 332 333 334 335
GLIDE SLOPE FREQUENCY
GS1 GS2 -GS3 _.-_._-- GS4 --- G55
---
----- GS6 ~--GS7 --GS8 ----- GS9 8510
FIGURE 5. BICONICAL ANTENNA FACTOR VERSUS GLIDE SLOPE FREQUENCY

22
21.5
21
rn 20.5 u
a: 20 0 I-u 19.5 4: l..L
« 19 z z 18.5w I-z 18«
~
+"" 17.5
17
16.5
ANTENNA CALIBRATION-BICONICAL ANT. FACTORS ~-.- I r I I I I r -- I
22.5
16 I I I I I I I .......L..--I ' " 225 245 265 285 305 325 345 365 385
UHF FREQUENCY
UHF1 UHF2 - UHF3 -_.- UHF4 --- UHF5
----- UHF6 ---UHF7 --- UHF8
FIGURE 6. BICONICAL ANTENNA FACTOR VERSUS UHF COMMUNICATIONS FREQUENCY

16 ~ 1 I r I I
ANTENNA I I
CALIBRATION-BICONICAL ANT. I I I I I
I I
FACTORS I I
15
14~ ;\
l~ \ \ ."",f"-\lD 13
u
II
D
\ r y/ /v(i:/~ 0 12 u \
<{
I-
11L \ \ \ . \ / /ll..
<{ \zz 10 ~ '-" \ \ \/ II~ ".JUJ I Z
...... <{ 9 V1
I, \1/;\ ij V
\ \ h \8
7 \/ \f 6
I I L.-.-..J
88 90 92 94 96 98 100 102 104 106 108
FM FREQUENCY
-- HORIZONTAL 1 HORIZONTAL 2 - --- HORIZONTAL3
---.-- HORIZONTAL 4
FIGURE 7. BICONICAL ANTENNA FACTOR VERSUS FM BAND FREQUENCY (ORIGINAL FREQUENCIES) - HORIZONTAL POLARIZATION

ANTENNA CALIBRATION-BICONICAL ANT. FACTORS
18
16
Ii14
.~.>< jf \\.~ .OJ 12 'C ""'.,j} ~./~~./a: a 10 r-u \ ~ \/« 8l.L
« \z 6z .-UJ
z 4<{ ..... '\
/ r--\ ~
0" I2
or \V \ I
-2L. v J
!.",.i~ ~.//.:-- . ..L-~ . -- --~.>? ~~~.
/-=
-j 88 92 94 96 98 100 102 104 106 108
FM FREQUENCY
-------- VERTICAL 1 VERTICAL 2 - - VERTICAL 3
---.---- VERTICAL 4
FIGURE 8. BICONICAL ANTENNA FACTOR VERSUS FM BAND FREQUENCY (ORIGINAL FREQUENCIES) - VERTICAL POLARIZATION

ANTENNA CALIBRATION-BICONICAL ANT. FACTORS
.~ .1\
~ \'~."'/'\' A \ /V A\
.1t\"L \
~/ '\L:~
96
FM
98
FREQUENCY
100 102 108
---HOR 1 - - HOR 2 - - HOR 3 --. HOR 4 -- HOR 5
---- HOA6
FIGURE 9. BICONICAL ANTENNA FACTOR VERSUS FM BAND FREQUENCY (NEW FREQUENCIES) -- HORIZONTAL POLARIZATION
ANTENNA CALIBRATION-BICONICAL ANT. FACTORS
22
20
18 a:l U
a: 16 a
« lJ.... 14 u ~
\<{ z z 12 .UJ ~ Z
....... <{ ex> 10 V
8 1
sL.
~~ 07~------0 ..--~.
. ~
V
88 1- l--l
90 92 ~_ .. L __.~ __ I
9694 t
FM
J 1
98
FREQUENCY
_1_ ..
100 1 ..._..._1
102 1_ . ...1.
104 I ,
106 108
-------- VERTICAL 1 VERTICAL 2 - - VERTICAL 3
_.-- VERTICAL 4
FIGURE 10. BICONICAL ANTENNA (NEW FREQUENCIES)
FACTOR VERSUS FM BAND FREQUENCY - VERTICAL POLARIZATION
32
30
m 28 D
IT 0 f 26 u <l: LL
<l: z 24 z W f
....... z <l: 22
\0
20
18
ANTENNA CALIBRATION N-50 ANTENNA FACTORS
// /
/ //
1
/-- .
. ~ ~. .",
~-- .~ ~ "",.~
// -- ~ ""'. ~ /~--- ""~ ~
1/ '" ~ .~._.~ ~
""" ~-~ ~
~ -~
/
/
/
//~
/' /
// ~
108 109 110 111 112 113 114
VOR/LOC FREQUENCY
115 116 117 118
------ 0 DEG. - LEFT 90 DEG. -- -- 180 DEG.
---.-- RIGHT 90 DEG.
FIGURE 11. N-SO VOR/LOC ANTENNA FACTORS AT FOUR ORIENTATIONS

i
ANTENNA CALIBRATION N-50 ANTENNA FACTORS
28 r- f ----... I I I I I , Iii iii iii
t--.> 0
en "0
IT 0 ~ U <t l.L
<t z z w.z 4:
26
24
22
20
18
16
14
12
/'
--.....,...-
---- ~
-- / - --
.------------
.- -
--- -- -- ~
/ ~
~ /~
"\ ~.----._.~~-----.././.--.~.~ ?-:::./ ,
,>--,-'" /""'.~.
\ ~
"
10
8
118 120 122 124 126 128 130 132 134
VHF FREQUENCY
--- a DEG. LEFT 90 DEG. 180 DEG.
---.---- RIGHT 90 DEG.
FIGURE 12. N-SO VHF COMMUNICATIONS ANTENNA FACTORS AT FOUR ORIENTATIONS

ANTENNA CALIBRATION N-50 ANTENNA FACTORS
33.6 /
CD n
a: 0 IU <t: 1.L
33.4
33.2l
32.6
-----
-- ~
----~\
'" \
'" \ ~
~ \ //
/ /
/ /
/
<t: Z z 32.4
~y/ ~
~
w
N ~
l-Z <t: 32.2
~
'" '" /
/
32 / ~
31.8
31.6
329 330 331 332 333 334 335
GLIDE SLOPE FREQUENCY
---0 DEG. - 10 DEG. LEFT - - 10 DEG. RIGHT
FIGURE 13. N-50 GLIDE SLOPE ANTENNA FACTORS AT THREE ORIENTATIONS

--------
-- -----
ANTENNA CALIBRATION N-91 ANTENNA FACTORS --~.
38 ,/
36 / 34 .--/
~32 £I]
--- --- ~ u 30a: ~ ~//0
u t-
28 <t l.L -~ ~
26<! z wz
24 '" .",.z
~ '--.... N
<{ 22 /=-.----.~ ----.--------.------.. /
.-N .~. - - -------. /
20 ~. --- ~
18
16
108 109 110 111 112 113 114
VOR/LOC FREQUENCY
115 116 117 118
---ODEG.
---.---- RIGHT 90 DEG.
- LEFT 90 DEG. --- -- 180 DEG.
FIGURE 14. N-91 VOR/LOC ANTENNA FACTORS AT FOUR ORIENTATIONS
ANTENNA CALIBRATION N-91 ANTENNA FACTORS'
31.5 I I I I I
31 -
~
§ ~ u ~
30.5 ~
30 I
29.5 t 29
28.5
~
~
"'-- - _/ /
/ / ~
~
"/ /
/
N LV
<C z z
~ 28
27.5 t 27
26.5 I
26 r '" '" '" V/
/ / ~~
. ~~ ~/
/ / ~
'" '" '"
25.5
329 330 331 332 333 334 335
GLIDE SLOPE FREQUENCY
---ODEG. - 10 DEG. LEFT - - 10 DEG. RIGHT
FIGURE 15. N-91 GLIDE SLOPE ANTENNA FACTORS AT THREE ORIENTATIONS

35
32.5
30
N ~
CD u
a:: 0 fu <t LL
<! z z w t-z <t
27.5
25
22.5
20
17.5
15
12.5
10
7.5
ANTENNA CALIBRATION N-91 ANTENNA FACTORS --.----1 r ---. - -I I - 1 T T - - r - 1 Ir
....-- -" -- /;:"\./ ""~ ---- / ~-~ //
/ '\ 0 \/
/ o---~ / "
~o~ /
/ --~
- - ~/ ~ --- -- --0-·-'---. //' .,,------ . ~.-- r°.---
/'
118 120 122 124 126' 128
VHF FREQUENCY
130 132 134
---ODEG. - ~EFT 90 DEG. ~ - 180 DEG.
---.---- RIGHT 90 DEG.
FIGURE 16. N-91 VHF COMMUNICATIONS ANTENNA FACTORS AT FOUR ORIENTATIONS
'" ~ -.--.\:'-.-.. ~
. / \\1 /~j ~\ /
ANTENNA CALIBRATION N-91 ANTENNA FACTORS I I , , I I I I I I I I ur
.-0.~.
///1 ./ v// /- ""
\\ \ 0\
'\ \ / ~ \/ "" \,L-/ ~ "
~
265 285 305 325
UHF FREQUENCY
345 365 385
---ODEG. - LEFT 90 DEG. - -- 180 DEG.
---0_- RIGHT 90 DEG.
FIGURE 17. N-91 UHF COMMUNICATIONS ANTENNA FACTORS AT FOUR ORIENTATIONS
--- - ---
30 [ I I
ANTENNA I
CALIBRATION I
N-50 I
ANTENNA I
FACTORS I I
28
26 I ---~ ~ ~
~/ OJ u 24 ~ a: 0 tu 22 <{
LL
<t Z z w t-z
20
18 /
/"
-----~ ~ -//--
N Q'\
«
16 /~'" /
14 ~ / /
12 [ I I I I
108 109 110 111
50 FEET -
- ~/ ~
==-~ --- /----------~--- -----------
/ ----~
I I I I I I I
112 113 114 115 116 117 118
VOR/LOC FREQUENCY
- 100 FEET - - 125 FEET
FIGURE 18. N-SO VOR/LOC ANTENNA FACTORS AT THREE DISTANCES

ANTENNA CALIBRATION N-50 ANT. FACTORS
39
38.5
38
37.5
37 (I) 'C
36.5a: 0 J-u 36 <{
1.L 35.5«
z z w 35.z <1: 34.5
N -....J
34
33.5 ~
33 .--- --- --
~
~~- ---........... - ~ ---------- -----_<:-~~ --32.5 ---
I I 1 _ I I J
329 330 331 332 333 334 335
GLIDE SLOPE FREQUENCY
50 FEET - 100 FEET -- -- 125 FEET
FIGURE 19. N-SO GLIDE SLOPE ANTENNA FACTORS AT THREE DISTANCES
---
HT
------------------~----- -"-, -~-------'---------
-...........~ -. ----------L ,J....,
'-~ C~----- N:~~ --6 ~:.::.L ___'6~__- ,__.. _._ ... _
,I I I I
HT ! i i
I ................. '-.............. ~. --.
- ......- ...........
FIGURE 20. DIAGRAM OF SHIELDING CAUSED BY AIRCRAFT
28

25 -.
ANTENNA I I
CALIBRATION I I I
N-50 I I
ANTENNA I I
FACTORS I I I-'-~ I
22.5
N \0
CD "0
a: 0 r-u <{ l.L
<{
z z w t-Z «
20
12.5
10 [
7.5
5~
....
/'
/
~ J ;<..~
/
/
'\/r-; --- ~ ---
- -- \ vI \
\
'" "\ 2.5 1
0
118 120 122 I
124 I I
126 I I
128 I
"'~ I
130 132 134
VHF FREQUENCY
~-- 50 FEET 100 FEET - - 125 FEET
FIGURE 21. N-50 VHF COMMUNICATIONS ANTENNA FACTORS AT THREE DISTANCES
'"'"'"-
/ /
,/' /
~
I

ANTENNA CALIBRATION N-50 ANTENNA FACTORS 28 r I I I I I I I I I I I I I m,- ----,-- I
26
24
22 LD u rr 0 tu « l.L
~ z Z
20
18
16 I
VJ o
~ 4:
14 [
12
10 ~
~
~
~
,,--~--
118
I
8~I6 - I
120 I I
124122
\.,.--~
I II __
128126 ---L_---JIL--_-JI"----:-:I~I I
130 I
132
J ---1.-1__~
I
134
I I I I
VHF FREQUENCY
-- 50 FEET - 100 FEET - - 125 FEET
FIGURE 22. N-SO VHF COMMUNICATIONS ANTENNA FACTORS AT THREE DISTANCES WITH DIFFERENT ANTENNA HEIGHTS
\ ~

I
35
ANTENNA CALIBRATION N-50 ANTENNA FACTORS I 1 J J .- -~- -~- I I
32.5 ;"
\ \30 \
(IJ u 27.5 a: \ .-0
u 25 f~ ~"« 1..L
« 22.5 "" '-- \ / ~ " z wz ~ ~ \ ? ~ J / \~ / '- _ 'z « r 20
.~.~~~-~\ ~ ~/' V.~ j .~ :><.w ..- 17.5 . // A L/'. .~ 15
\; v
12.5~ I I
88 90 92 94 96 98 100 102 104 106 108
FM FREQUENCY VOR/LOC ANTENNA
----- a DEG. - - LEFT 90 DEG. - - 180 DEG.
---.---- RIGHT 90 DEG.
FIGURE 23. N-SO VOR/LOC ANTENNA FACTORS WHEN EXPOSED TO FM BAND FREQUENCIES

I
30
ANTENNA CALIBRATION N-50 ANTENNA FACTORS I I I I I ~--
32' 1 ~
A r--\ 28 ;\ I \!\ / \m
-c 26a: I \/ ~/ \ ~(a
t u « lJ... 24 '" 'v / 1\ \ -<{
Z / \ ,Z
'I '" /
\ \;~jw 22 t-Z \j / \«W
N ~20 \
\ \ 18
~ 16
88 90 92 94 96 98 100 102 104 106 108
FM FREQUENCY VHF ANTENNA
o DEG. - --- LEFT 90 DEG. -- - RIGHT 90 DEG.
FIGURE 24. N-50 VHF COMMUNICATIONS ANTENNA FACTORS WHEN EXPOSED TO FM BAND FREQUENCIES

ANTENNA CALIBRATION N-91 ANTENNA FACTORS -~-T --- ~1 - I -,------- T - J
40 f I I -,-----.
37.5 , /
35 I '" / /
/ \\ \
'0 32.5 ~ \ / \ a:
(I]
""'''7a r- 30 J\u I A« \I..L. j,,- / < 27.5 Z Z /" /""~\ X / /
"
UJ r 25 .z --..........
w < ~ - / "-.w
22.5 \ / 20 \j
17.5 I I 1__ I I 1 _ _I I I
88 90 92 94 96 98 100 102 104 106 108
FM FREQUENCY VOR/LOC ANTENNA
---- 0 DEG. - - LEFT 90 DEG. --- RIGHT 90 DEG.
FIGURE 25. N-91 VOR/LOC ANTENNA FACTORS WHEN EXPOSED TO FM BAND FREQUENCIES
~

35
32.5
30
27.5 (]J 'C 25 a: a 22.5r-u <: LL 20 <{
-Z 17.5 z UJ t 15z <t
12.5 VJ ~ 10
7.5
5
ANTENNA CALIBRATION N-91 ANTENNA FACTORS I 1 I
.~ f\
;1""'.;/ \. / L /' \ i"
.r---~. / ~~"'- '\L .. -r--/ .~ V
f ~ / ---- -" . .A. ;1-// ""Vi / --- --- >.~ /. 1 m y ~1~~ ~
'J
---ODEG.
---.---- RIGHT 90 DEG.
94
FM
96 98
FREQUENCY
LEFT 90
100 102
VHF ANTENNA
DEG. -
104
180
106
DEG.
108
FIGURE 26. N-91 VHF COMMUNICATIONS ANTENNA FACTORS WHEN EXPOSED TO FM BAND FREQUENCIES

TABLE 1. BICONICAL ANTENNA LOCATIONS FOR VOR/LOCALIZER BAND FREQUENCIES
Plot Name J!L --H!L --1L
VOR 1 15.0 15.0 100.0
VOR 2 15.0 7.5 50.0
VOR 3 15.0 15.0 100.0
VOR 4 15.0- 15.0 100.0
VOR 5 9.1 12.7 100.0
VOR 6 8.8 12.7 50.0
VOR 7 21.5 12.7 125.0
TABLE 2. BICONICAL ANTENNA LOCATIONS FOR VHF COMMUNICATIONS BAND FREQUENCIES
Plot Name J!L --H!L --1L
VHF 1 15.0 5.0 100.0
VHF 2 16.8 5.0 45.0
VHF 3 12.5 15.0 100.0
VHF 4 12.5 7.5 50.0
VHF 5 16.0 6.1 50.0
VHF 6 39.8 6.1 125.0
VHF 7 31.8 6.1 100.0
35

TABLE 3. BICONICAL ANTENNA LOCATIONS FOR GLIDE SLOPE BAND FREQUENCIES
Plot Name JfL -...!!R...- -lL
GS 1 7.1 10.5 100.0
GS 2 10.0 5.0 100.0
GS 3 7.1 10.5 100.0
GS 4 10.0 7.5 100.0
GS 5 8.0 6.5 75.0
GS 6 8.0 8.0 100.0
GS 7 8.0 4.5 100.0
GS 8 6.1 12.7 100.0
GS 9 5.0 12.7 50.0
GS 10 7.3 12.7 125.0
TABLE 4. BICONICAL ANTENNA LOCATIONS FOR UHF COMMUNICATIONS BAND FREQUENCIES
Plot Name JfL -...!!R...- -lL
UHF 1 15.7 5.0 100.0
UHF 2 10.0 7.5 100.0
UHF 3 10.0 4.0 50.0
UHF 4 15.0 7.8 150.0
UHF 5 15.0 3.8 75.0
UHF 6 15.0 5.2 100.0
UHF 7 8.5 4.5 50.0
UHF 8 15.7 5.0 100.0
36
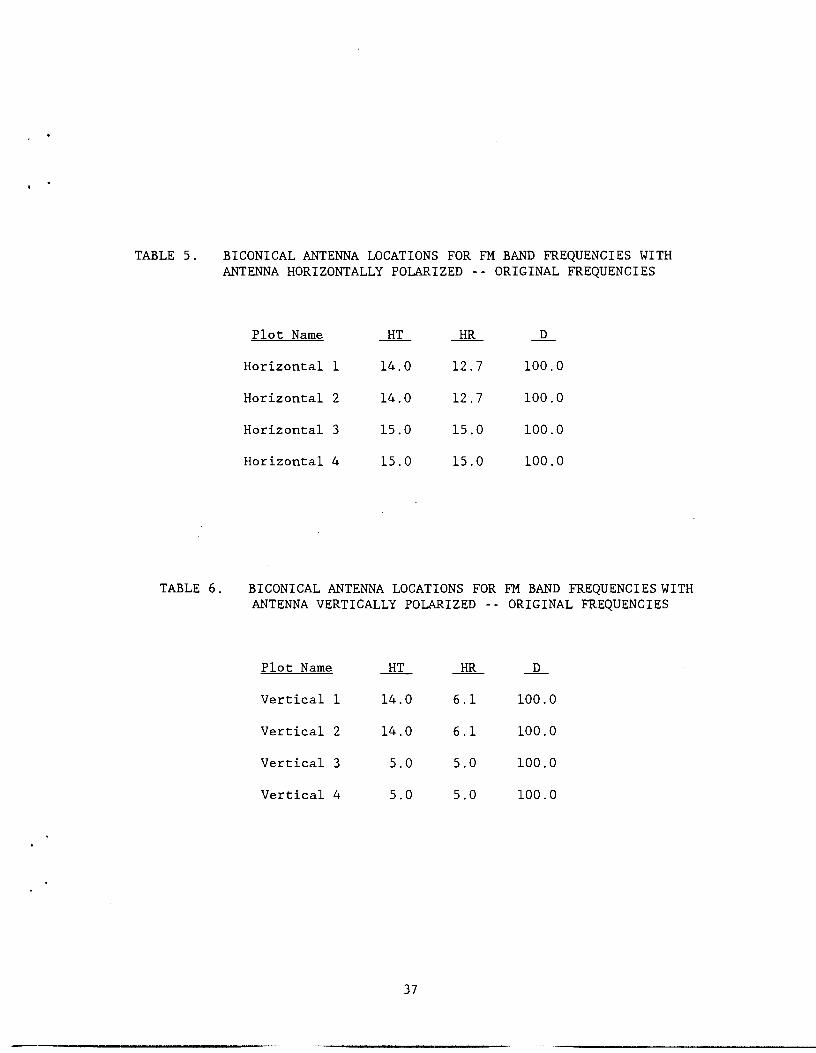
TABLE 5. BICONICAL ANTENNA LOCATIONS FOR FM BAND FREQUENCIES WITH ANTENNA HORIZONTALLY POLARIZED -- ORIGINAL FREQUENCIES
Plot Name
Horizontal 1 14.0 12.7 100.0
Horizontal 2 14.0 12.7 100.0
Horizontal 3 15.0 15.0 100.0
Horizontal 4 15.0 15.0 100.0
TABLE 6. BICONICAL ANTENNA LOCATIONS FOR FM BAND FREQUENCIES WITH ANTENNA VERTICALLY POLARIZED -- ORIGINAL FREQUENCIES
Plot Name
Vertical 1 14.0 6.1 100.0
Vertical 2 14.0 6.1 100.0
Vertical 3 5.0 5.0 100.0
Vertical 4 5.0 5.0 100.0
37
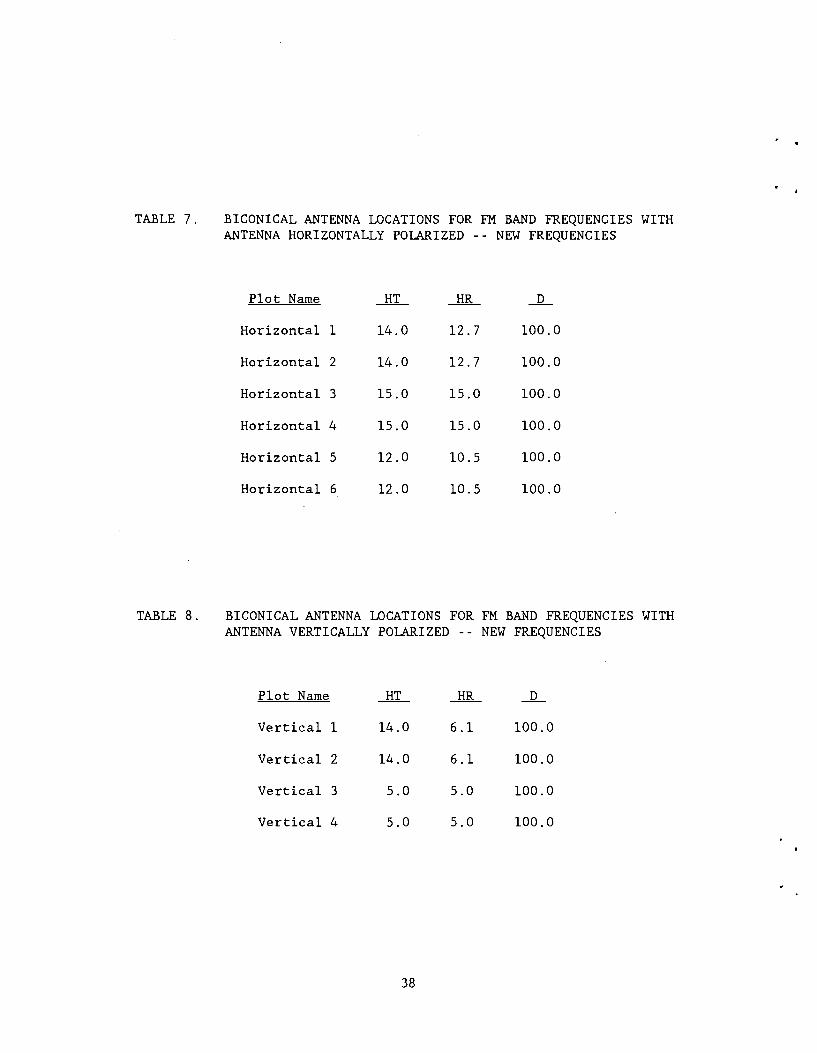
TABLE 7. BICONICAL ANTENNA LOCATIONS FOR FM BAND FREQUENCIES WITH ANTENNA HORIZONTALLY POLARIZED - NEW FREQUENCIES
Plot Name
Horizontal 1
Horizontal 2
Horizontal 3
Horizontal 4
Horizontal 5
Horizontal 6
.....!:IT...
14.0
14.0
15.0
15.0
12.0
12.0
--illL
12.7
12.7
15.0
15.0
10.5
10.5
-lL
100.0
100.0
100.0
100.0
100.0
100.0
TABLE 8. BICONICAL ANTENNA LOCATIONS FOR FM BAND FREQUENCIES WITH ANTENNA VERTICALLY POLARIZED - NEW FREQUENCIES
Plot Name
Vertical 1
Vertical 2
Vertical 3
Vertical 4
14.0
14.0
5.0
5.0
6.1
6.1
5.0
5.0
100.0
100.0
100.0
38

TABLE 9. ORIGINAL AND NEW FM BAND FREQUENCIES
Original Frequency
88.0
89.0
90.0
91.0
92.0
93.0
94.0
95.0
96.0
97.0
98.0
99.0
100.0
101.0
102.0
103.0
104.0
105.0
106.0
107.0
108.0
New Frequency
88.1
89.0
90.0
91.1
92.0
93.0
93.9
94.8
96.0
97.1
98.0
99.0
100.0
101.0
101.9
103.1
104.2
105.1
105.9
107.2
107.9
39

Aircraft
N-SO
N-SO
N-SO
N-91
N-91
N-91
N-91
TABLE 10. AIRCRAFT ANTENNA AND
Type Antenna Antenna
VHF Comm. VHF 112 15ARC
VOR/LOC DMN 42-1
Glide Scope DMN 42-1
VHF Comm. 37R2U
UHF Comm. 37R2U
VOR/LOC VOR-1 37J-3
Glide Scope GS-2 37-P-S
LOCATION
Location
Station 242
Station 324
Station 324
Station 209
Station 209
Station 90
Station OORS
40

TABLE 11. COMPARISON OF OLD AND NEW TRANSMIT ANTENNA HEIGHTS FOR N-50 VHF COMMUNICATIONS CALIBRATION
Old VHF Communications Antenna Heights
-lL --.!:IT...- ~ -EL --SHL FZ-N
50 16.0 36.2 31. 2 -6.2 -1. 2 100 31. 8 83.9 71. 9 -3.9 +8.1 125 39.8 108.4 93.9 -3.4 +11.1
New VHF Communications Antenna Heights
-lL --.!:IT...- ~ -EL --SHL FZ-N
50 5.0 22.5 24.4 +7.5 +5.6 100 10.0 62.1 53.1 +17.9 +27.1 125 12.0 82.9 67.6 +22.1 +37.9
Where: d distance from transmit antenna to geometric
reflection point.
FZ - distance from transmit antenna to center of fresnel zone.
d-N - distance from d to nose of aircraft.
FZ-N = distance from FZ to nose of aircraft.
All distances are in feet.
A minus sign (-) indicates the location is beneath the aircraft.
A plus sign (+) means the point is in front of the aircraft.
The Aero Commander's VHF communications antenna is 20 feet behind the nose.
41