Creating and Sustaining Healthy Organizations February 25, 2013 Larry D. Roper.

Establishing & Sustaining Healthy Nursing Workplace Environments:
Understanding Financial Management of Staffing Resources
Organization of Nurse Leadersof
New Jersey
November 17, 2017
Prepared and presented by:Judy Caruso, DNP, MBA, RN, NEA-BC, FACHE
President & Healthcare ConsultantCaruso Consulting, Inc.
“Skill and Passion to Link Financial and Clinical Data for Organization Improvement”

Disclosures_______________________________• There is no commercial or non commercial
support for this program. • Planning committee members have no affiliations
with commercial interests to disclose.• I am a ONL/NJ Board member and presenting this
seminar today at no fee.• Successful completion of the nursing contact
hours awarded requires participants to sign in, attend entire program and complete an evaluation form.
• Certificates will be issued upon receipt of a completed evaluation.
2

3
Session Objectives________________________________________
• Discuss how appropriate staffing is one factor in a health work environment.
• Understand how to budget FTEs and positions for a proposed staffing pattern
• Identify how staffing patterns and staff ratios determine hours of care
• Identify how your work environment impacts appropriate staffing and patient outcomes

NJ Legislation Proposed on Staff Ratios__________________________
• 2017Assembly Bill A750/S1280 Minimum Professional Registered Nurse Staffing Standards– Ratio regulation is not the answer to safe and effective
staffing– Organization of Nurse Leaders of NJ (ONL/NJ), the
NJSNA, and the NJ Council of Magnet Organizations (NJCOMO), and the NJ Nursing Leadership Council (NJ CLC) do not support this bill A647 with mandated ratios
• They are addressing the bigger issue for the best healthy workforce environment
• Support hospital based staffing committees of nursing leadership and care providers to discuss resource allocation based on evidenced based practices and competencies for optimal patient outcomes.
4
NJ Legislation Proposed on Staff Ratios_(cont’d)__________________
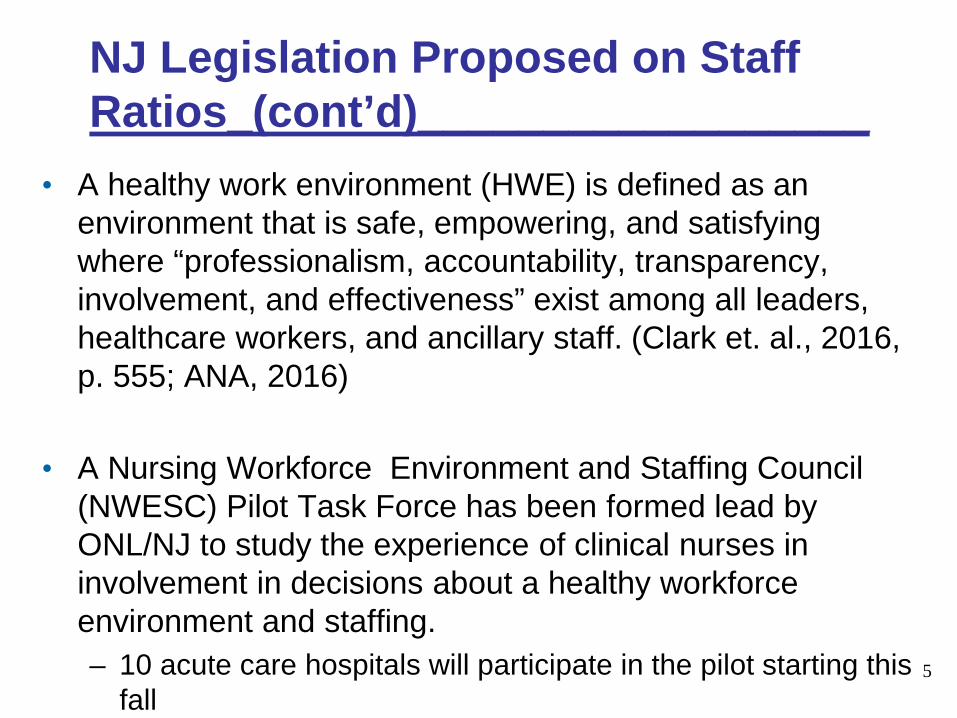
• A healthy work environment (HWE) is defined as an environment that is safe, empowering, and satisfying where “professionalism, accountability, transparency, involvement, and effectiveness” exist among all leaders, healthcare workers, and ancillary staff. (Clark et. al., 2016, p. 555; ANA, 2016)
• A Nursing Workforce Environment and Staffing Council (NWESC) Pilot Task Force has been formed lead by ONL/NJ to study the experience of clinical nurses in involvement in decisions about a healthy workforce environment and staffing.– 10 acute care hospitals will participate in the pilot starting this
fall5

AACN Synergy Model of Patient Care_(AACN, 2016; Pinkerton, 2005)____
6

Focus on Appropriate Staffing_____
• Clinical Excellence– Optimal Patient Outcomes
– Healthy Work Environment:• The six standards for successful establishment of a
health work environment:– Skilled Communications– Authentic Leadership– True Collaboration– Effective Decision Making– Meaningful Recognition– Appropriate Staffing
7

Appropriate Staffing _______________________________
• Effective staffing is the core of quality, safe patient care (O’Rourke & White, 2011, p. 183)
• Excellence in staffing-– “a dynamic, evidence-driven process that results in the
efficient, effective use of qualified staff and the stewardship of resources to achieve the best possible outcomes for patients, their families, the workforce, and the organization in which care is delivered.” (Douglas, 2008, p.3)
• Staffing that achieves a balance between quality, safety, labor costs, and staff satisfaction is incredibly complex. (Crist-Grundman & Mulrooney, 2011, p. 195)
8

Appropriate Staffing (cont’d)_______________________________
• Staffing must ensure the effective match between patient needs and nurse competencies.
• Shared governance models have developed staffing committees or staffing councils to accomplish the following:– Educate staff about staffing and budgeting models– Understand the impact of organizational benchmarks in
staffing– Obtain staff input into unit staffing plans– Evaluate impact of patient intensity into staffing needs– Utilize understanding of staff education, knowledge, and
experience when developing staffing plans– Evaluate staffing models with clinical outcomes to achieve best
patient outcomes9

Appropriate Staffing (cont’d)_____________________________
• Unit based scorecards should reflect several dimensions:– Staffing Metrics:
• Productivity (Hours of care)• Cost of care (Hourly rates)
– Human Resource Factors• Vacancy rates• Leave of Absences (LOA)• Staff turnover• Overtime premium• Certification of staff• New hires
10

Appropriate Staffing (cont’d)_____________________________
• Unit based scorecards should reflect several dimensions: (cont’d)
– Patient data• Length of Stay (LOS)• Case mix index
– Quality and Safety Measures• NDNQI data• Patient satisfaction• Staff satisfaction• Injuries• Adverse events
11

Appropriate Staffing (cont’d)_____________________________
• Unit based scorecards should reflect several dimensions: (cont’d)
– Patient data• Length of Stay (LOS)• Case mix index
– Quality and Safety Measures• NDNQI data• Patient satisfaction• Staff satisfaction• Injuries• Adverse events
12

Data-Driven Model for Evidence and Excellence in Staffing (Anderson, et al, 2014)__________________________________________________
13
Environment of Care
Quality, Safety, and Outcomes
Technology Financing
Patients/Users of Care
Providers/ Care team
Delivery of Care

14
Overview of Financial Terms____________________________________________
Fundamentals of Finance
Personnel Budgets
Relationship Between Planning, Budgeting & Control
Variance Analysis
Flexible Budget Reporting

15
Fundamentals of Finance
16
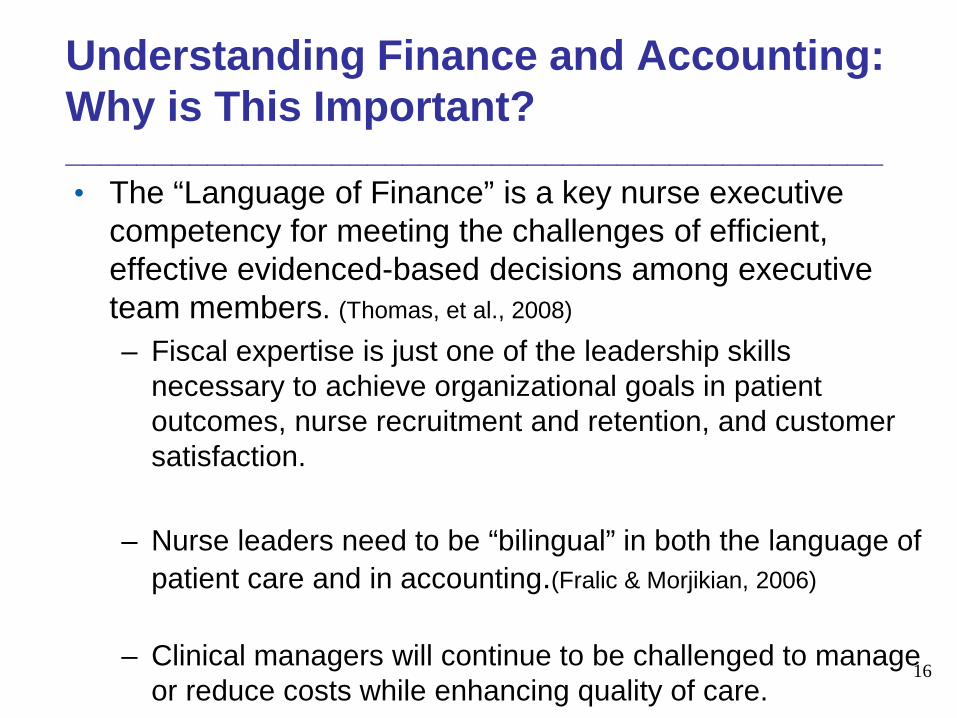
Understanding Finance and Accounting: Why is This Important? ______________________________________________• The “Language of Finance” is a key nurse executive
competency for meeting the challenges of efficient, effective evidenced-based decisions among executive team members. (Thomas, et al., 2008)
– Fiscal expertise is just one of the leadership skills necessary to achieve organizational goals in patient outcomes, nurse recruitment and retention, and customer satisfaction.
– Nurse leaders need to be “bilingual” in both the language of patient care and in accounting.(Fralic & Morjikian, 2006)
– Clinical managers will continue to be challenged to manage or reduce costs while enhancing quality of care.

17
Understanding Finance and Accounting: Why is This Important? (cont’d)______________________________________________• A transformational leader is competent in many roles,
financial management being one of them.– Transformational leaders understand that hospitals are
complex systems with each unit being a microsystem.
– Complexity science represents the next step in understanding how complex systems work.
• Finance and nursing have inter-dependent relationships, appreciating their connectedness.
• Each see their own microsystem through their own “lenses.”
• The team efforts of finance and nursing can achieve more than the sum of their parts.

A Culture of Financial Excellence_____________________________
• A culture of safety, quality and customer satisfaction is not in conflict with a culture of financial excellence.
• Financial excellence drives us to work more effectively with less hassle and work in ways that save time.
• The current and future health care systems are driving for increased economic accountability.
• “Value” is the key word in today’s health care system spoken by payers and customers.
Value = QualityCost 18
19
Fundamentals of Finance______________________________________________
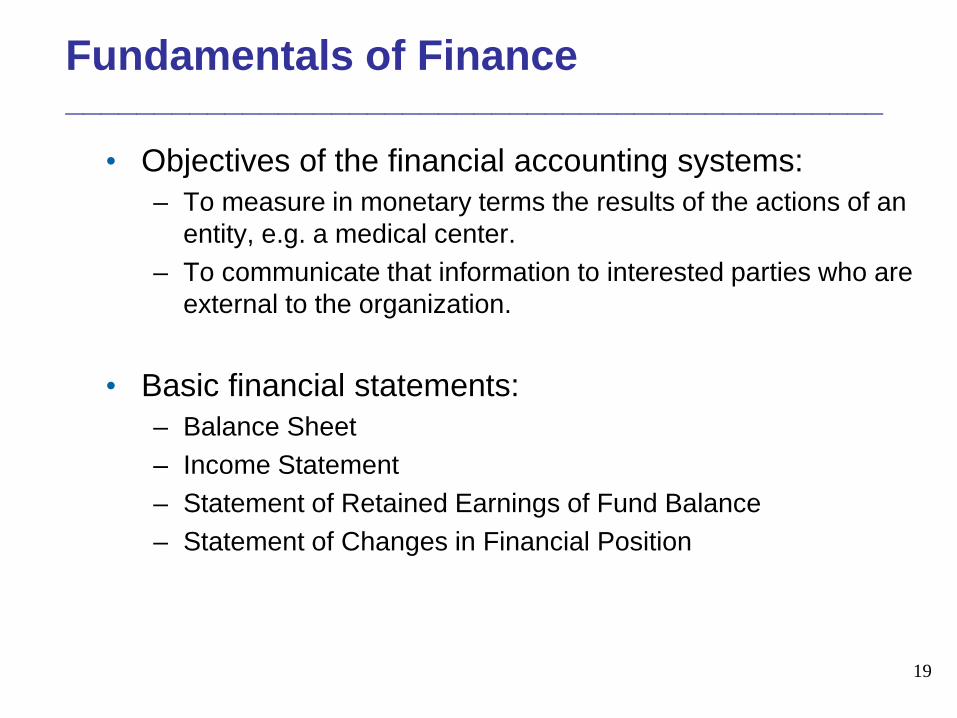
• Objectives of the financial accounting systems:– To measure in monetary terms the results of the actions of an
entity, e.g. a medical center.– To communicate that information to interested parties who are
external to the organization.
• Basic financial statements:– Balance Sheet– Income Statement– Statement of Retained Earnings of Fund Balance– Statement of Changes in Financial Position

20
Income Statement____________________________________________
• The income statement is also called the “Profit and Loss Statement.”– The “P&L.”– It is a record of the money coming into the organization and
the money that leaves the organization, expressed over a period of time.
– It measures the results of the operations of the organization over some specified time interval, e.g. for a one year fiscal period.
– Net income from operations is often called the “bottom line.”– The operating margin is expressed in terms of a
percentage.

21
Income Statement: 1/01/17-12/31/17 _______________________________________________
Gross Patient Service Revenue• Routine patient services• Ancillary services
– Deductions from Revenue: Provision for bad debt, charity care, contractual
allowances and adjustments
Net Patient Service Revenue
Total Operating Expenses• Salaries & benefits, supplies, professional fees, purchased
services, maintenance & utilities, insurance, interest, depreciation, etc.

22
Income Statement________________________________________________
Net Patient Service Revenue – Total Operating Expenses
Net Income (Loss) from Operations+
Any additional income (loss) =
TOTAL NET INCOME (LOSS)

23
Profit or Loss________________________________________________
The income statement will indicate whether the “bottom line” was a profit or a loss:
• Profit = Net Revenue – Net Expenses(Revenues > Expenses)
• (Loss) = Net Expenses –Net Revenue(Expenses > Revenues)

24
Operating Margin______________________________________________
The operating margin is the percentage of profit that the organization makes from the operation of its business.
• Operating Margin for Hospitals = Net Income from OperationsNet Revenue from Patient Care
• What’s your organization’s projected operating margin for fiscal year 2017?

25
Income Statement: 1/01/17- 12/31/17Example
Gross Patient Service Revenue• Routine patient services $ 50,000,000 • Ancillary services $ 2,000,000
– Deductions from Revenue: $ (1,000,000)Net Patient Service Revenue $51,000,000
Total Operating Expenses• Salaries & benefits $ 45,900,000• Other $ 4,590,000
Total Operating Expenses $ 50,490,000
Net income or (Loss)from Patient Services: $510,000
Other Income or (Loss): $(10,000) Total Net Income or (Loss) $500,000
Operating Margin for Patient Services: Net income from Patient Services $510,000 = 1%Net revenue from Patient Services $51,000,000

26
Budget Process

27
Major Steps of the Budget Process__________________________________________________
• Assumptions about the future based on understanding the past
• Setting operational objectives• Preparation of budget manuals• Preparation of project packages• Completion of departmental budgets• Departmental budget reviews• Presenting the hospital’s budget to the Finance
Committee• Implementation of the operational budget• Analysis of budget variances• Year-end evaluation and environmental assessment

28
Budget Perspective: Benchmarking_________________________________________________
• Benchmarking should be the cornerstone of the budgeting process.
• Areas for benchmarking:– FTEs per occupied bed– Labor hours per unit of service (UOS)– Cost of goods/supplies
• Per patient day• Per procedure• Per case
– Capital costs– Contracted services– Financial ratios – Clinical pathways– LOS– Outcomes
• Benchmarking is intended to improve both the financial and clinical sides.

29
The Operating Budget_________________________________________________• The operating budget is a plan and control for day-to-day
operating revenue and expense over a one year period.
• The operating budget contains 3 parts:– Statistical Budget
• Assumptions about expected volumes and the scope of activities upon which revenue and expenses are based.
– Revenue Budget• Converts the expected unit of service into predicted revenue dollars.
– Expense Budget• Converts the expected work into predicted personnel and
supply/service expense dollars.
• Annual budgets then are divided into monthly budgets in order to have an adequate basis to control costs during the year.

30
Preparation of the
Patient Care Unit’s Operating Budget

31
Communication and Data are Key _________________________________________________
“The Definitions”
CaregiverUnit of Service
Hours Per Patient DayHours Per ED VisitHours Per OR Case
Why is This Important?

32
Key Terms – Hours of Care Per Patient Day (HPPD)________________________________________________ HPPD – Hours Per Patient Day Hours of care measured are selected by the
organization. For example: Nursing Care Hours Per Patient Day (NCHPPD)
This would include all nurses and techs providing direct patient care.
Worked Hours Per Patient Day (WHPPD)This would include all direct care givers plus clerical
and administrative staff.
Paid Hours Per Patient Day (PHPPD)This would include all worked hours for direct care
givers and others as well as their benefit hours.

33
Key Terms – Hours of Care Per Patient Day (HPPD)________________________________________________
HPPD – Hours Per Patient Day (cont’d) Hours of care are calculated by dividing labor
hours for care by patient days. Both hours and patient days need to be for the
same time period:Annual hours divided by annual patient days
Pay period (two weeks) hours divided by pay period (two weeks) patient days
Daily hours divided by daily patient days

34
Key Terms – Full Time Equivalent __________________________________ FTE – Full Time Equivalent (1.0 FTE) The hours of a FTE are based on the organization’s
pay structure:
A Full Time Equivalent = 1.0 FTE The 1.0 FTE could be 40 hours per week (52 weeks X 40 hours= 2,080 annual hours)
OR
The 1.0 FTE could be 37.5 hours per week (52 week X 37.5 hours= 1,950 annual hours)

35
Key Terms – Full Time Equivalent ________________________________________________ FTE – Full Time Equivalent (1.0 FTE) (cont’d) 1.0 FTE could be made up of one full time employee who
works 40 hrs. per week or two or more part-timers to total 40 hrs. per week.
Is a 12 hour shift employee working three (3) 12 hour shifts considered “1.0 FTE”? Not usually Why not? 36 hours per week divided by 40 hours=.9 FTE
(If the 1.0 FTE work week is 40 hours.)
36 hours per week divided by 37.5 hours=.96 FTE(If the 1.0FTE work week is 37.5 hours.)

36
Key Terms - Unit of Service________________________________________________
UOS – Unit of Service Units of services are determined by the patient
activity:Patient days for bedded unitsPatient visits for outpatient activity of visit activity,
e.g. ED visits, ambulatory care visitsPatient minutes or hours for areas where hours for
cases are measured, e.g. OR hoursPatient births or birth “equivalents”, e.g. for labor &
delivery birthing patients Therefore, your unit of service can be substituted for
patient days if you are determining care hours for your unit of services.

37
Key Terms - Unit of Service________________________________________________ Hours of care are calculated by dividing labor hours for care
by your units of service. Both hours and units of service need to be for the
same time period:
Annual hours divided by annual units of services, e.g. ED visits, patient births, or OR hours or cases.
Pay period (two weeks) hours divided by pay period (two weeks) units of services, e.g. ED visits, patient births, or OR hours or cases.
Daily hours divided by daily units of services, e.g. ED visits, patient births, or OR hours or cases.

38
Key Terms- (cont’d)________________________________________________
Position Control The list of budgeted filled and unfilled positions by
FTE based on your annual budget. May be maintained by finance, human resources
or nursing. Who maintains your position control report at your
organization?
Caregiver Caregivers may be identified as direct care givers,
e.g. Register Nurses, LPNs, care technicians.

39
The Unit’s Expense Budget________________________________________________
• Supply & Expense Budgets– Planning for patient care and other expenses at a unit level
include expenses such as: • Med/surg supplies• IV solutions & supplies• Other patient supplies• Office and administrative supplies• Dues, books, subscriptions, conferences• Maintenance and repairs
• Personnel Budgets– Usually the greatest expenditure in a unit’s operating budget.

Structure of Evidence-Based Budget_________________________________
40
• Your staffing budgets should be designed with qualitative and quantitative evidence:- Qualitative
• Inclusive open dialogue• Transparency between nursing and finance
- Quantitative• Built on internal and external benchmarks• Continuously focuses on productivity improvement• Budget formula driven with data
‾ Reporting tools must report budget to actual

Process of Evidence-Based Budget_________________________________• Process
– Nursing /finance collaborated on the development of the budgets
– “Real-time” decisions must be made with the budget in mind with patient care considerations
– Timely bi-weekly variance reports are provided measuring budget metrics against actual performance
– Variance reporting needs action plans developed, actions taken, and measured for improvement
– Is staffing and time & attendance technologies utilized to the fullest?
– Is further education needed to fully understand the unit budget to better meet these metrics?
41

42
The Personnel Budget_______________________________________________
• Personnel Budgets
– Productive FTE Requirements• Based on the staffing patterns reflective of the workload
of the unit.
– Nonproductive FTE Requirements• Based on the anticipated paid benefit time.
43
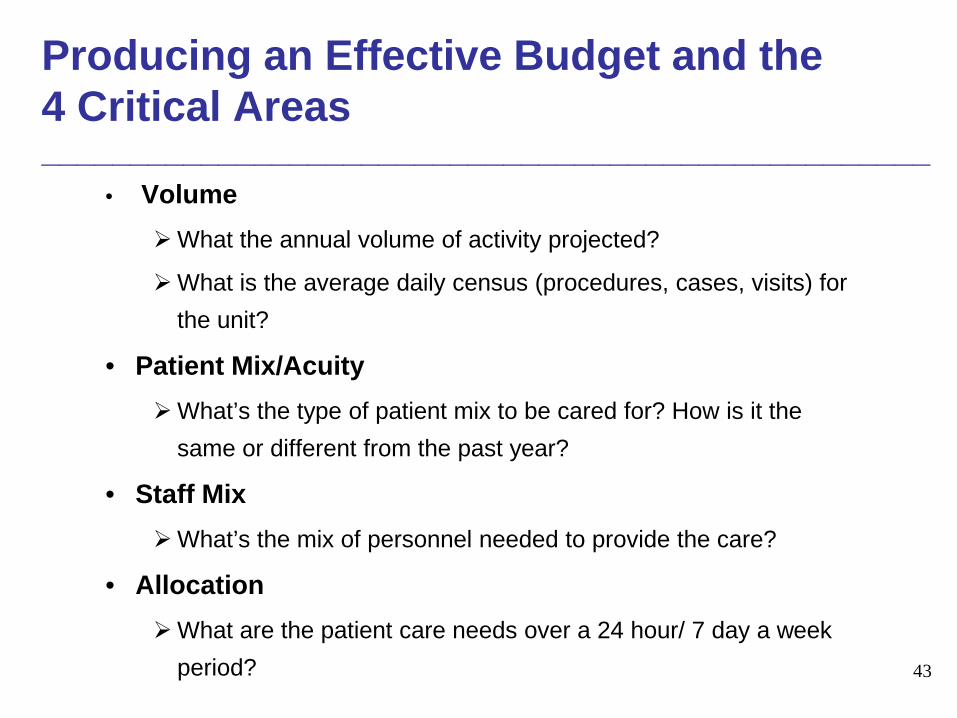
Producing an Effective Budget and the 4 Critical Areas__________________________________________________
• VolumeWhat the annual volume of activity projected?
What is the average daily census (procedures, cases, visits) for the unit?
• Patient Mix/AcuityWhat’s the type of patient mix to be cared for? How is it the
same or different from the past year?
• Staff MixWhat’s the mix of personnel needed to provide the care?
• AllocationWhat are the patient care needs over a 24 hour/ 7 day a week
period?

44
Components of the Personnel Staffing Budget Process_________________________________________________
• Review of prior year budget and past performance as compared to budget: Review of personnel. Review past Unit of Service (UOS). Review current staffing plans.
• Determine if current staffing methodology is appropriate.
• Determine if quality standards/patient outcomes support the desired labor hours per unit of service.
• Determine if the number of staff is adequate.
Budget Perspective: Benchmarking_________________________________________________
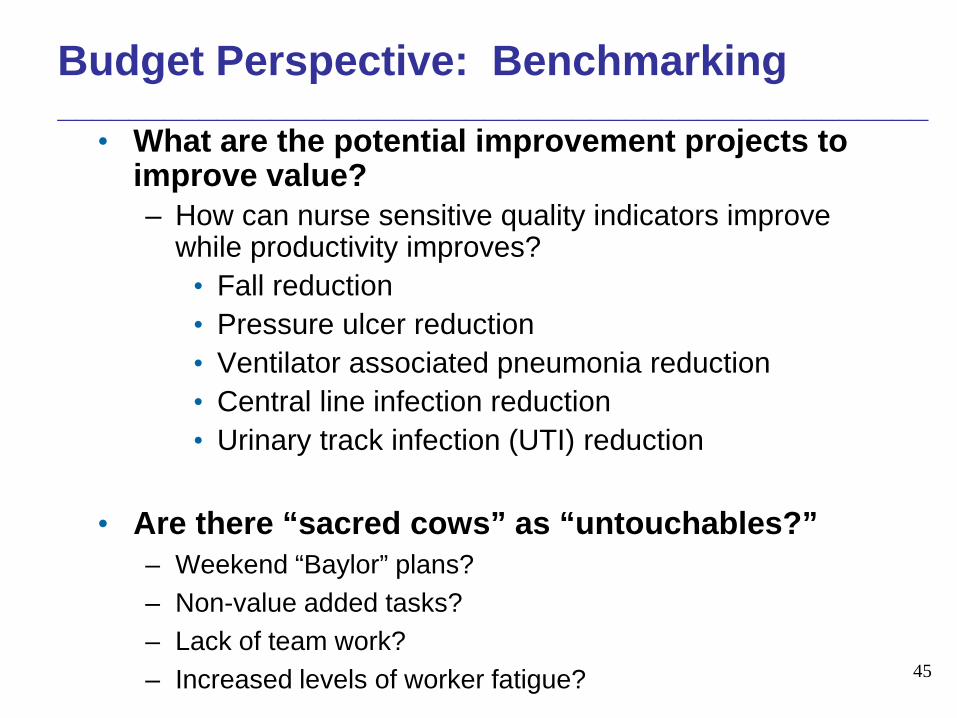
• What are the potential improvement projects to improve value?– How can nurse sensitive quality indicators improve
while productivity improves?• Fall reduction• Pressure ulcer reduction• Ventilator associated pneumonia reduction• Central line infection reduction• Urinary track infection (UTI) reduction
• Are there “sacred cows” as “untouchables?”– Weekend “Baylor” plans?– Non-value added tasks?– Lack of team work?– Increased levels of worker fatigue? 45

46
Components of the Personnel Staffing Budget Process_______________________________________________
• Tie budgeted hours and FTEs by cost center while determining actual vacancy rate.
• Establish budgetary salary dollar needs.
• Monitor budget on a concurrent basis.
47
Potential Salary Cost Drivers_________________________________________________
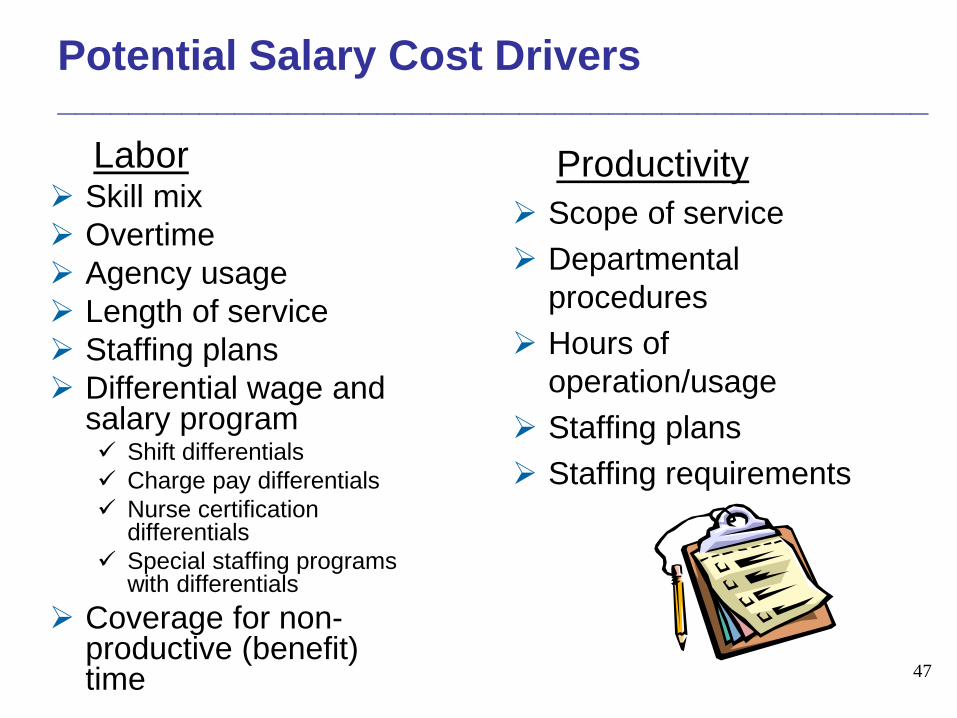
Labor Skill mix Overtime Agency usage Length of service Staffing plans Differential wage and
salary program Shift differentials Charge pay differentials Nurse certification
differentials Special staffing programs
with differentials Coverage for non-
productive (benefit) time
Productivity Scope of service Departmental
procedures Hours of
operation/usage Staffing plans Staffing requirements

48
Staffing Goals_________________________________________________
• Targeted skill mix• Targeted # of Full Time Equivalents (FTEs)
Correct positions within those FTEs for coverage
• Targeted paid hours of care per unit of service Hours of care Per Patient Visit (HPPV)
Hours of care Per Patient Day (HPPD)
Hours of care Per Patient Surgical Case (HPPSC)
Hours of care Per Patient Birth (HPPB)

49
FTEs vs. Positions______________________________________________
• Once the FTEs are determined, then the number of positions can be determined.
• Usually on nursing units, the number of positions is higher than the number of FTEs, due to mix of part-time and full-time employees needed for 24 hour and 7 day a week coverage.

50
FTEs vs. Positions- (Cont’d)________________________________________________
• Factors to consider to determine positions:– Weekend coverage
• What’s the weekend work pattern?– Every other weekend?– Every third weekend?
• Are there “scheduled” weekend employees?
– What mix of full-time versus part-time staff is desired and available in the marketplace?
– What’s the availability of per diem personnel for coverage?

51
Position Control______________________________________________
• After final approval of the FTEs, these FTEs then are converted into the appropriate “positions” for that unit.
• The “position control” is the listing by full-time, part-time, and per diem FTEs needed for staffing.
• The “position control” is the guide for hiring determinations.– Based on the position control report, vacancy rates are
determined.

52
Questions to be addressed by Finance and Nursing_________________________________________________
Did Finance and Nursing budget appropriately?
Are the staffing levels appropriate in order to deliver quality care for quality patient outcomes?

53
Sample Staffing Plan & FTEs: 8hr Shifts
________________________________________________ See Handout
How many shifts of RNs are needed to work the 7am-3:30pm shift?
How many RN FTEs are needed for the 7am-3:30pm shift?

54
Sample Staffing Plan & FTEs:8 hr Shifts (cont’d)
_________________________________________________ See Handout
How many shifts of RNs are needed to work the 7am-3:30pm shift? Add up all of the shifts needed each day for the seven (7) days
of the week. 42 shifts are needed
How many RN FTEs are needed for the 7am-3:30pm shift? Assumption: All RNs work 8.5 hour shifts with a 30 minutes
unpaid meal break. Paid work time is 8 hours a day.

55
Sample Staffing Plan & FTEs:8 hr Shifts (cont’d)
_______________________________________________
See Handout
How many shifts of RNs are needed to work the 7am-3:30pm shift? Add up all of the shifts needed each day for the seven (7)
days of the week. 42 shifts are needed
How many RN FTEs are needed for the 7am-3:30pm shift? (All RNs work 8 hour shifts.)
42 shifts = 8.4 FTEs5 shifts (per 1.0 FTE)*
*(5 shifts X 8hrs each = 40 hours = 1.0 FTE)

56
Sample Position Control: 8 hr Shifts (cont’d)
_________________________________________________ See Handout
What are the total positions needed for the 8.4 FTEs of 8hr shift RNs on 7am-3:30pm shift? Assumptions: All RNs work every other weekend. There are no weekend only workers.
Sun Mon Tues Wed Thurs Fri Sat6 6 6 6 6 6 6

57
Sample Position Control:8 hr Shifts (cont’d)
__________________________________________________ See Handout
What are the total positions needed for the 8.4 FTEs of 8hr shift RNs on 7am-3:30pm shift? Assumptions: All RNs work every other weekend. There are no weekend only workers.
Sun Mon Tues Wed Thurs Fri Sat6 6 6 6 6 6 6
A total of 12 positions would be needed in order to have 6 RNs on and 6 RNs off every weekend.

58
Sample Position Control:8 hr Shifts (cont’d)
_________________________________________________ Sun Mon Tues Wed Thurs Fri Sat
6 6 6 6 6 6 6
A total of 12 positions would be needed in order to have 6 RNs on and 6 RNs off every weekend for 8.4 FTEs. An example of these positions could be:
1) 1.0 FTE 7) .6 FTE2) 1.0 FTE 8) .4 FTE3) 1.0 FTE 9) .8 FTE 4) 1.0 FTE 10) .4 FTE5) 1.0 FTE 11) .2 FTE6) .6 FTE 12) .4 FTE

59
Sample Staffing Plan & FTEs: Understanding Your Work Sheets
________________________________________________Patient Days and ADC=
Hospital Name: My Hospital Caruso Consulting
Unit Cost Center ICU 1.0 FTE= 40 hrs/wk or 2, 080 hrs/yr
STAFFING
Budget Assumptions:
Beds Available: 12
Average Daily Census (ADC): 11.68 Patient Days: 4,264
% Occupancy: 97%

60
Sample Staffing Plan & FTEs: Focus on Staffing Patterns
________________________________________________Staffing Patterns:DIRECT CARE GIVERS
SUN MON TUE WED THUR FRI SAT SHIFTS FTESRN: Patient
Ratio7A-3PPCT 1 1 1 1 1 1 1 7 1.40US 1 1 1 1 1 1 1 7 1.40
3P-11PPCT 1 1 1 1 1 1 1 7 1.40US 1 1 1 1 1 1 1 7 1.40
11P-7APCT 1 1 1 1 1 1 1 7 1.40US
7A-7PM (12 hour shift)RN 6 6 6 6 6 6 6 42 12.60 1.95
7PM-7AM (12 hour shift)RN 6 6 6 6 6 6 6 42 12.60 1.95
TOTAL PRODUCTIVE DIRECT CARE RN FTEs 25.20 FTEsTOTAL PRODUCTIVE DIRECT CARE FTEs (RNs,PCTs) 29.40 FTEs
Direct Hours per Patient Day (RNs) ((RN FTEs X 2080)/patient days 12.29 RN Hrs Per PDDirect Hours per Patient Day (RNs,PCTs) 14.34 RN & PCT Hrs Per PDWorked Hours Per Patient Day (includes all positions) 15.71 Worked Hrs Per PDPaid Hours Per Patient Day (includes all positions for productive and Non-productive FTES) 18.02 Paid Hrs per PD
NOTE: Annual hours of care per patient day= ((FTEs x 2,080) divided by patient days)
61
Sample Staffing Plan & FTEs: Focus on FTEs and Hours of Care _______________________
RN FTEs and Care Hours:
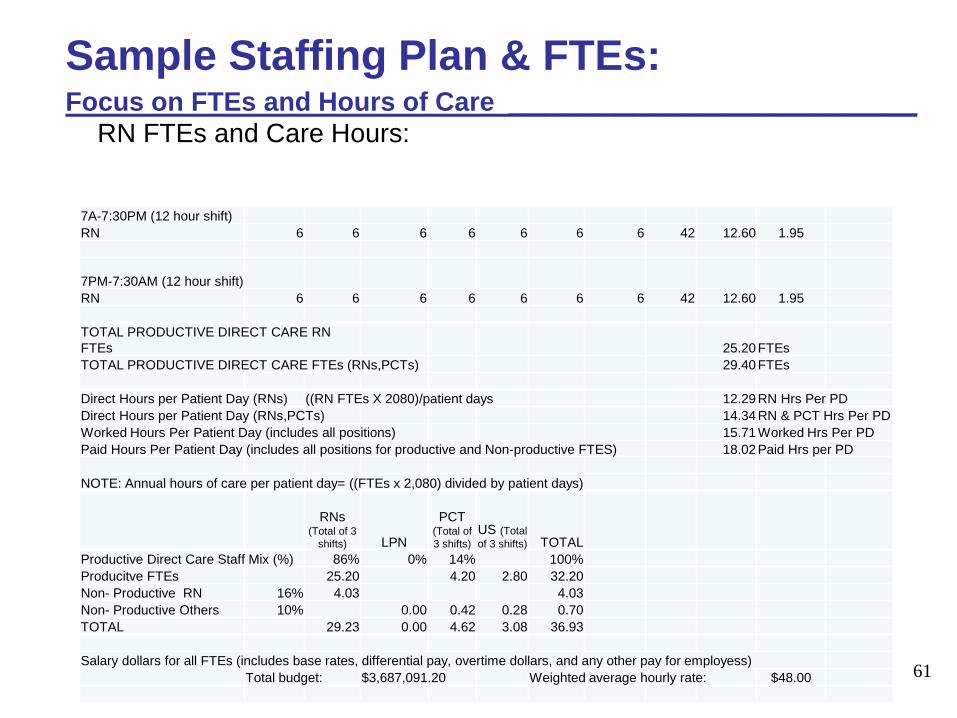
7A-7:30PM (12 hour shift)RN 6 6 6 6 6 6 6 42 12.60 1.95
7PM-7:30AM (12 hour shift)RN 6 6 6 6 6 6 6 42 12.60 1.95
TOTAL PRODUCTIVE DIRECT CARE RN FTEs 25.20 FTEsTOTAL PRODUCTIVE DIRECT CARE FTEs (RNs,PCTs) 29.40 FTEs
Direct Hours per Patient Day (RNs) ((RN FTEs X 2080)/patient days 12.29 RN Hrs Per PDDirect Hours per Patient Day (RNs,PCTs) 14.34 RN & PCT Hrs Per PDWorked Hours Per Patient Day (includes all positions) 15.71 Worked Hrs Per PDPaid Hours Per Patient Day (includes all positions for productive and Non-productive FTES) 18.02 Paid Hrs per PD
NOTE: Annual hours of care per patient day= ((FTEs x 2,080) divided by patient days)
RNs (Total of 3
shifts) LPN
PCT (Total of 3 shifts)
US (Total of 3 shifts) TOTAL
Productive Direct Care Staff Mix (%) 86% 0% 14% 100%Producitve FTEs 25.20 4.20 2.80 32.20Non- Productive RN 16% 4.03 4.03Non- Productive Others 10% 0.00 0.42 0.28 0.70TOTAL 29.23 0.00 4.62 3.08 36.93
Salary dollars for all FTEs (includes base rates, differential pay, overtime dollars, and any other pay for employess)Total budget: $3,687,091.20 Weighted average hourly rate: $48.00

62
Sample Staffing Plan & FTEs: 12hr Shifts
_______________________________________________
See Handout
How many shifts of RNs are needed to work the 7am-7:30pm 12 hour shift?
How many RN FTEs are needed for the 7am-7:30pm shift? Assumption: All RNs work 12.5 hour shifts with a 30
minutes unpaid meal break. Paid work time is 12 hours a day.

63
Sample Staffing Plan & FTEs:12 hr Shifts (cont’d)
_____________________________________________
See Handout
How many shifts of RNs are needed to work the 7am-7:30pm shift? Add up all of the shifts needed each day for the
seven (7) days of the week. 42 shifts are needed.
How many RN FTEs are needed for the 7am-7:30pm shift? (All RNs work 12 hour shifts.) Assumption: All RNs work 12.5 hour shifts with a 30 minutes
unpaid meal break. Paid work time is 12 hours a day.

64
Sample Staffing Plan & FTEs:12 hr Shifts (cont’d)
_____________________________________________ See Handout
How many shifts of RNs are needed to work the 7am-7:30pm shift? Add up all of the shifts needed each day for the seven (7) days of the week.
42 shifts are needed
How many RN FTEs are needed for the 7am-7:30pm shifts. (All RNS work 12 hour shifts.)
42 shifts = 14 X .9 FTE** = 12.6 FTEs 3 shifts
(**Note: 3 X 12 hr. shifts= 36 hours. 36 hours = .9 FTE)40 hours
Assumption: All RNs work 12.5 hour shifts with a 30 minutes unpaid meal break. Paid work time is 12 hours a day.

65
Sample Position Control: 12 hr Shifts
_________________________________________________ See Handout
What are the total positions needed for the 12.6 FTEs of 12hr shift RNs on 7am-7:30pm shift? Assumptions: All RNs work every third weekend. There are no weekend only workers.
Sun Mon Tues Wed Thurs Fri Sat6 6 6 6 6 6 6

66
Sample Position Control:12 hr Shifts (cont’d)
_________________________________________________ See Handout What are the total positions needed for the 12.6 FTEs of
12 hr. shift RNs on 7am-7:30pm shift? Assumptions: All RNs work every third weekend. There are no weekend only workers.
Sun Mon Tues Wed Thurs Fri Sat6 6 6 6 6 6 6
A total of 18 positions would be needed in order to have 6 RNs on and 12 RNs off every weekend.

67
Sample Position Control:12 hr Shifts (cont’d)
__________________________________________________
Sun Mon Tues Wed Thurs Fri Sat6 6 6 6 6 6 6
A total of 18 positions would be needed in order to have 6 RNs on and 12 RNs off every weekend for 12.6 FTEs. For example:
1) .9 FTE 7) .9 FTE 13) .6 FTE2) .9 FTE 8) .9 FTE 14) .6FTE3) .9 FTE 9) .9 FTE 15) .3 FTE4) .9 FTE 10) .9 FTE 16) .3 FTE5) .9 FTE 11) .6 FTE 17) .3 FTE6) .9 FTE 12) .6 FTE 18) .3 FTE
68
Non-Productive Time Coverage_________________________________________________
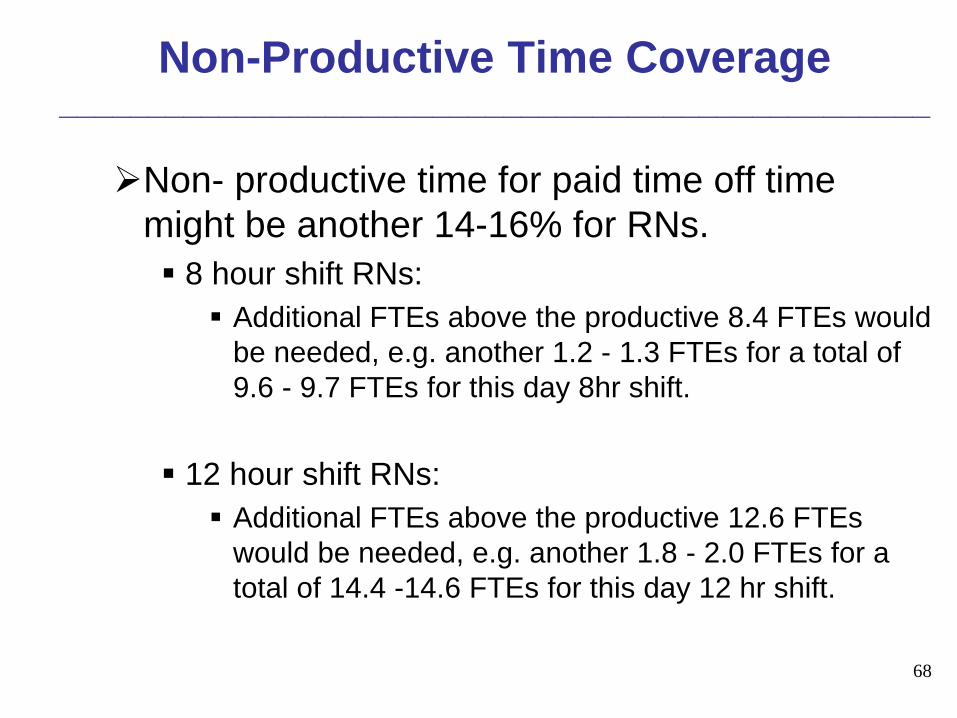
Non- productive time for paid time off time might be another 14-16% for RNs. 8 hour shift RNs: Additional FTEs above the productive 8.4 FTEs would
be needed, e.g. another 1.2 - 1.3 FTEs for a total of 9.6 - 9.7 FTEs for this day 8hr shift.
12 hour shift RNs: Additional FTEs above the productive 12.6 FTEs
would be needed, e.g. another 1.8 - 2.0 FTEs for a total of 14.4 -14.6 FTEs for this day 12 hr shift.

69
Non-Productive Time Coverage (cont’d)
__________________________________________________
An example of calculating % of Non- Productive Time for 8 hour shift RNs:
160 hours (4 weeks vacation)16 hours (2 educational days)32 hours (4 paid Holidays)24 hours (3 Floating Holidays)24 hours ( 3 sick days)
256 hours
2,080 hours - 256 hours = 1,824 Productive worked hours
Non-productive hours = 256 = 14%Productive worked Hours 1,824

70
Non-Productive Time Coverage (cont’d)
_________________________________________________
Hospitals vary with their budgeting for this non-productive time . Hospitals also have varying policies and procedures
regarding if they hire into this non-productive time at all and/or how much is permitted to be hired into.
If hiring into some non-productive time, some of the part-time positions may then be hired into as full time positions to have the needed coverage.
The need to hire into non-productive may be dependent on your float pool and per diem staff available.

71
Relationship Between Planning, Budgeting & Control
72
Controlling Operating Results______________________________________________
• Will your organization reach the expected operating margin projected for the annual budget?
NO MARGIN : NO MISSION

73
Controlling the Operating Budget_____________________________________________
• The operating budget is a static budget.– It does not change as the actual events of the year
unfold.
• Variances are the differences between the amount budgeted and the amount incurred.
• Understanding variances– Why did the variance occur?
• External Causes– Prices, volume, regulations, availability of
personnel• Internal Causes
– Availability of personnel, technology, efficiency, policies, standards, acuity

74
Variance Analysis

75
Controlling Operating Results_________________________________________________
Variance analysis is key to success!!• “Budgeting”
The process to develop a plan.
• “Budget” The plan.
• “Variance” The difference between the amount budgeted and the
amount incurred.• Favorable variance: Spent less than expected• Unfavorable variance: Spent more than expected
• Reporting Tools The proper timely reports are vital for managing
resources.

76
Better Variance Understanding and Control______________________________________• What can nurse managers influence and control? • How do systems work in the manager’s absence?A manager is paid for 40hr/week and responsible for
24/7, which is 168 hrs./week.
Therefore, that manager is only onsite 24% of the time but has 24/7 responsibility.
What needs to “work right” when the manager is not here 76% of the time?
What are the challenges that others deal with when the manager is not present?

Challenges in Staffing Resource Management_______________________________• What are the challenges you face in staffing
resources to meet budget?• Examples:
– Overstaffed?• How are staff cancelled in advance?• Prioritizing if staff need to be sent home
– Clocking out late?• Brief “huddles” during the shift to assess staff who
are overwhelmed/behind/need some support earlier in the shift
– Staffing for 1:1 situations– Other challenges faced…
77

Maximizing Use of Technology_______________________________• Using reports from your time and attendance system
– Daily?– Weekly?
– Biweekly?
– Tools for predictive modeling based on documentation to outcomes in the EHR
• Acuity trending• Assigning staff to acuity needs• Predicting needs based on past acuity trends by DRG per
patient and LOS
• And more…
78

79
Flexible Budget Reporting

80
Concept of the Flexible Budget____________________________________________
• The flexible budget variance analysis allows for a comparison of actual costs to what the costs should have been, given the workload encountered.
• Budget Variance Analysis Components– Volume variance
– Price or rate variance
– Use variance

81
Flexible Budget Reporting _________________________________________________• “Looking back” to determine how your hospital handles
the “real-time” management of resources.
• Developing reports on a pay period basis for more timely feedback.
• Understanding variances so they can be better controlled in the future.
Reaching organizational goals:Clinical and Financial!

82
Flexible Budget Reporting: Better Variance Understanding and Control (cont’d)______________________________________Questions for discussion:– Are positions correct for the FTEs needed and weekend coverage?
• What needs changing?
– Did staff punch in early and punch out late?• If a 12 shift RN works 40 hrs of regular time each week, those
extra 4 hrs are 11% over budgeted hours of 36 hours.)– Why?– How can time be better managed?– What processes need to change to assure staff get out on time?
– How is your actual overtime use compared to budget?• Why is it different?

83
Flexible Budget Reporting: Better Variance Understanding and Control (cont’d)______________________________________Questions for discussion:
Is the skill mix different than the budgeted skill mix?Why?
How did you budget for sitters or companions? How are you handling their use?
Other questions and concerns…

84
Understanding the Tools for Flexible Budget Reporting at Your Hospital_______________________________________________What are the next steps as a transformational
organization to meet the challenges for budget control?
– Are your reports meaningful?
– Are your reports timely?
– Are your reports “management tools?”
85
Thank You______________________________________
Thank you for the opportunity to provide you with some education to increase your financial and staff budgeting understanding and competencies.
I hope that this helped to fill your “Nursing Leadership Toolbox” with more fiscal understanding and staffing tools!

86
Judy Caruso, DNP, MBA, RN, NEA-BC, FACHEPresident & CEO
Caruso Consulting, Inc.Skill and Passion to Link Financial and Clinical Data for Patient Outcomes and
Organizational Improvement51 Mt. Bethel Road, PO Box 4227
Warren, NJ 07059
cell 908-672-1467Email: [email protected]

87
Key References________________________________
• Agency for Healthcare Research and Quality(AHRQ). (2007). Nurse staffing and quality patient care. (Evidence Report/Technology Assessment. Number 151. Publication No. 07-E005). Rockville: U.S. Department of Health and Human Services.
• Aiken, L., Clarke, S.P., Cheung, T.B., Sloane, D.M. & Silber, J.H. (2003). Educational levels of hospital nurses and surgical patient mortality. JAMA, 290 (12), 1617-1623.
• Aiken, L.H., Cimiotti, J.P., Sloane, D.M., Smith, H.L., Flynn, L. & Neff, D.F (2011). Effect of nurse staffing and nurse education on patient deaths in hospitals with different nurse work environments. Medical Care, 49(12), 1047-1053.
• American Nurses Association. (2012). Principles for Nurse Staffing, 2nd
Ed., Silver Spring: American Nurses Association.• American Nurses Association (2016). Healthy Work Environment.
Retrieved from http:llwww.nursingworld.org./MainmenuCategories/WorkplaceSafety/health-Work-Environment

88
Key References________________________________
• American Association of Critical-Care Nurses (2016). AACN Standards for Establishing and Sustaining Healthy Work Environment: A Journey to Excellence (2nd ED>). Retrieved from https://www.aacn.org/nursing-excellence/standards/aacn-standards-for-establishing-and-sustaining-healthy-work-environments.
• American Association of Critical-care Nurses. (2005) AACN standards for establishing and sustaining healthy work environments: a journey to excellence. American Journal for Critical Care, 14(3), 187-197.
• Anderson, R., Ellerbe, S., Haas, S., Kerfoot, K., Kirby, K. & Nickitas, D. (2014). In J. Mensik (Ed.), Excellence and evidence in staffing: A data-driven model for excellence in staffing.2nd edition. Nursing Economic$, 32 (3,Suppl.), 1-36.
• . H. (2004). 10 ways to improve healthcare cost management. Healthcare Financial Management, August 2004, 76-80.
• Buerhaus, P.I. (2009). Avoiding mandatory hospital nurse staffing ratios: an economic commentary. Nursing Outlook, 57 (2), 107-112.
• Buerhaus, P.I. (2010). It’s time to stop the regulation of hospital nurse staffing dead in its tracks. Nursing Economic$, 28 (2), 110-113.
89
Key References (cont’d)________________________________
• Burnes Bolton, L., Aydin, C.E., Donaldson,, N., Store Brown, D., Sandhu, M., Fridman, M., & Udin Aronow, H, November) Mandated nurse staffing ratios in California: a comparison of staffing and nurse sensitive outcomes pre-and post-regulations. Policy, Politics, & Nursing Practice, 8(4), 238-250.
• Clark, C.M., Sattler, V.P., & Barbosa-Leiker, C.(2016). Development and testing of the Healthy Work Environment Inventory: A reliable tool for assessing work environment health and satisfaction. Journal of Nursing Education, 55(10), 555-562.
• Cohen, J. (2010). How many nurses does your hospital need? Nursing Management, 41 (6), 20-25.
• Crist-Mundman, D. & Mulrooney, G. (2011) Effective workforce management starts with leveraging technology, while staffing optimization requires true collaboration. Nursing Economic$, 29 (4), 195-200.
• Douglas, K. (2008). Excellence and evidence in staffing: Essential links to staffing strategies, design, and solutions for healthcare. San Diego, CA: Concerro. Retrieved from http://www.nursingsociety.org/aboutus/PositionPapers/Documents/Excellence%20and%20evidence%20in%20staffing.pdf

90
Key References (cont’d)________________________________
• Douglas, K. (2009). The naked truth: staffing in health care needs an overhaul. Nursing Economic$, 27 (5), 332-334.
• Douglas, K. (2009). Getting real on evidence-based staffing. Nursing Economic$, 27 (6), 416-421.
• Douglas, K. (2010). The human side of staffing. Nursing Economic$, 28 (1), 55-62.
• Douglas, K. (2010). Ratios - if it were only that easy. Nursing Economic$, 28 (2), 119-125.
• Esposito-Herr, M.B., Persinger, K.D., & Stephens Hunt, S. (2009). Partnering for better performance: the nursing-finance alliance. American Nurse Today, 4 (4), 29-31.
• Finkler, S.A., Kovner, C.T. & Jones, C.B. (2007). Financial Management for nurse managers and executives. (3rd ed.) Philadelphia: Saunders
• Finkler, S.A. & McHugh, M. (2007). Budgeting concepts for nurse managers. (4th ed.) Philadelphia: Saunders.

Key References (cont’d)____________________________________________
• Fralic, M.F. & Morjikian, R.L. (2006). The RWJ executive nurse fellows program: Part 3. Journal of Nursing Administration, 35 (2), 96-102.
• Goetz, K., Janney, M. & Ramsey, K. (2011). When nursing takes ownership of financial outcomes: achieving exceptional financial performance through leadership, strategy, and execution. Nursing Economic$, 29 (4), 173-182.
• Kutney-Lee, A., Sloane, D.M., & Aiken, L.H. (2013). An increase in the number of nurses with baccalaureate degrees is linked to lower rates of post-surgery mortality. Health Affairs, 32(3) 579-584.
• McHugh, M.D., Kelly, L.A., Smith, H.L., Wu, E.S., Vanak, J.M. & Aiken, L.H. (2012 October). Lower mortality in Magnet R hospitals. Medical Care. Retrieved October 10, 2014 from http://www.aacn.nche.edu/media-relations/fact-sheets/nursing-workforce.
• Mensik, J. (2012). The nurse manager’s guide to innovative staffing. Indianapolis: Sigma Theta Tau International.
91
Key References (cont’d)______________________________________
92
• Needleman, j. (2015, February) Nurse staffing: the knowns and unknowns (Editorial). Nursing Economic$, 33(1), 5-7.
• Nolan, T. & Bisognano, M. (2006). Finding the balance between quality and cost. Healthcare Financial Management, April 2006, 1-6.
• O’Rourke, M. & White, A. (2011). Professional role clarify and competency in health care staffing- the missing pieces. Nursing Economic$, 29 (4), 183-194.
• Pinkerton, S. (2005). AACN standards for establishing and sustaining healthy work environments. Nursing Economic$, 23(3) 138, 140.
• Reese, S.M. (2011). 10 ways to practice evidence-based staffing and scheduling. Nursing Management, 42 (10), 20-24.
• Rundio, A. (2012.). The nurse manager’s guide to budgeting & finance. Indianapolis: Sigma Theta Tau International.
• Serratt, T. (2013). California’s nurse-to-patient ratios, Part 2, Journal of Nursing Administration, 43(10), 549-553.

Key References (cont’d)_______________________________
• Serratt, T. (2013). California’s nurse-to-patient ratios, Part 3, Journal of Nursing Administration, 43(11), 81-585.
• The American Organization of Nurse Executives. (2008). Essentials of Nurse Manager Orientation. Available at http://www.aacn.org/WD/Elearning/content/enmo/enmohome
• Thomas, J., Collins, A., Collins, D., Herrin, D., Dafferner, D., & Gabriel, J. (2008). The language of business: a key to nurse executive competency. Nursing Economic$, 26 (2), 122-127.
• Unruh, L. (2008). Nurse staffing and patient, nurse, and financial outcomes. American Journal of Nursing, 108 (1), 62-72.
• Valentine, N.M., Kirby, K., Wolf, K.M. (2011). The CNO/CFO Partnership: navigating the changing landscape. Nursing Economic$,29 (4), 201-210.
93