Essity Aktiebolag · Baby Care #5 #2 n.a. #6 #6 Drypers , Pequenín Libero Feminime Care #6 #3 n.a....
10
CORPORATES CREDIT OPINION 26 June 2018 Update RATINGS Essity Aktiebolag Domicile Sweden Long Term Rating Baa1 Type LT Issuer Rating - Fgn Curr Outlook Stable Please see the ratings section at the end of this report for more information. The ratings and outlook shown reflect information as of the publication date. Contacts Martin Fujerik +49.69.7073.0909 VP-Senior Analyst [email protected] Karoline Metzger +49.69.7073.0912 Associate Analyst [email protected] Matthias Hellstern +49.69.7073.0745 MD-Corporate Finance [email protected] Essity Aktiebolag Update following the stabilisation of the outlook Summary The Baa1/P-2 ratings of Essity Aktiebolag (Essity) primarily reflect (1) the company's sizeable scale, with revenues of SEK109 billion in 2017 (around $13 billion), and a broad product portfolio; (2) its leading market positions, with well-recognised brands and a good track record of innovation; (3) its global footprint, with faster-growing emerging markets representing roughly one-third of its revenue; (4) its fairly good underlying growth and stability in demand for its products; and (5) its financial policies aimed at protecting its solid investment-grade rating and a track record of material positive free cash flow generation that the company can use for deleveraging if needed. Essity's ratings are primarily constrained by (1) the company's exposure to volatile input costs, pulp in particular, which can be passed through only with a material delay; (2) the somewhat below-average profitability compared with that of most of its similarly rated peers, such as Kimberly-Clark (K-C, A2 stable) or Procter & Gamble (P&G, Aa3 stable), with a Moody's-adjusted EBIT margin of around 11% in 2017; (3) some debt-funded M&A risk, which however falls within the company's commitment to maintaining a solid investment- grade rating; and (4) a still fairly high leverage, following the debt-funded acquisition of BSN Medical in April 2017, which positions Essity weakly in the Baa1 category. Exhibit 1 We expect Essity to continue deleveraging following the acquisition of BSN Medical All ratios are based on 'Adjusted' financial data and incorporate Moody's Global Standard Adjustments for Non-Financial Corporations. Forward view represents Moody's view and does not incorporate any material divestments and acquisitions (other that the acquisition of BSN Medical). Source: Moody's Financial Metrics
-
Upload
vuongnguyet -
Category
Documents
-
view
219 -
download
0
Transcript of Essity Aktiebolag · Baby Care #5 #2 n.a. #6 #6 Drypers , Pequenín Libero Feminime Care #6 #3 n.a....

CORPORATES
CREDIT OPINION26 June 2018
Update
RATINGS
Essity AktiebolagDomicile Sweden
Long Term Rating Baa1
Type LT Issuer Rating - FgnCurr
Outlook Stable
Please see the ratings section at the end of this reportfor more information. The ratings and outlook shownreflect information as of the publication date.
Contacts
Martin Fujerik +49.69.7073.0909VP-Senior [email protected]
Karoline Metzger +49.69.7073.0912Associate [email protected]
Matthias Hellstern +49.69.7073.0745MD-Corporate [email protected]
Essity AktiebolagUpdate following the stabilisation of the outlook
SummaryThe Baa1/P-2 ratings of Essity Aktiebolag (Essity) primarily reflect (1) the company'ssizeable scale, with revenues of SEK109 billion in 2017 (around $13 billion), and a broadproduct portfolio; (2) its leading market positions, with well-recognised brands and a goodtrack record of innovation; (3) its global footprint, with faster-growing emerging marketsrepresenting roughly one-third of its revenue; (4) its fairly good underlying growth andstability in demand for its products; and (5) its financial policies aimed at protecting its solidinvestment-grade rating and a track record of material positive free cash flow generation thatthe company can use for deleveraging if needed.
Essity's ratings are primarily constrained by (1) the company's exposure to volatile inputcosts, pulp in particular, which can be passed through only with a material delay; (2) thesomewhat below-average profitability compared with that of most of its similarly ratedpeers, such as Kimberly-Clark (K-C, A2 stable) or Procter & Gamble (P&G, Aa3 stable), witha Moody's-adjusted EBIT margin of around 11% in 2017; (3) some debt-funded M&A risk,which however falls within the company's commitment to maintaining a solid investment-grade rating; and (4) a still fairly high leverage, following the debt-funded acquisition of BSNMedical in April 2017, which positions Essity weakly in the Baa1 category.
Exhibit 1
We expect Essity to continue deleveraging following the acquisition of BSN Medical
All ratios are based on 'Adjusted' financial data and incorporate Moody's Global Standard Adjustments for Non-FinancialCorporations.Forward view represents Moody's view and does not incorporate any material divestments and acquisitions (other that theacquisition of BSN Medical).Source: Moody's Financial Metrics

MOODY'S INVESTORS SERVICE CORPORATES
Credit strengths
» A strong business profile, with a broad portfolio of well-positioned global (Tork and Tena) and regional brands
» Fairly good underlying growth and stability of demand for most of its products
» Financial policy aimed at protecting its solid investment-grade rating
Credit challenges
» Exposure to volatile input costs such as pulp and recycled paper
» Ongoing need for innovation in the personal care and tissue business areas to preserve pricing levels
» Event risks, such as debt-funded M&A or shareholder-friendly actions
Rating outlookThe stable outlook reflects our expectation that Essity will continue deleveraging in the next 12-18 months, bringing its Moody's-adjusted debt/EBITDA to below 3.0x, both through EBITDA growth and debt repayments.
Factors that could lead to an upgrade
» EBIT margin consistently above 12% in all the company's business areas
» Retained cash flow/net debt above 25%
» Debt/EBITDA well below 2.5x
» Continued positive free cash flow generation applied towards debt reduction
Factors that could lead to a downgrade
» A decline in the company's EBIT margin to below 9%
» Retained cash flow/net debt falling sustainably below 20%
» Debt/EBITDA deteriorating towards 3x
» Free cash flow turning negative
» Erosion of the company's solid liquidity profile
This publication does not announce a credit rating action. For any credit ratings referenced in this publication, please see the ratings tab on the issuer/entity page onwww.moodys.com for the most updated credit rating action information and rating history.
2 26 June 2018 Essity Aktiebolag: Update following the stabilisation of the outlook
MOODY'S INVESTORS SERVICE CORPORATES
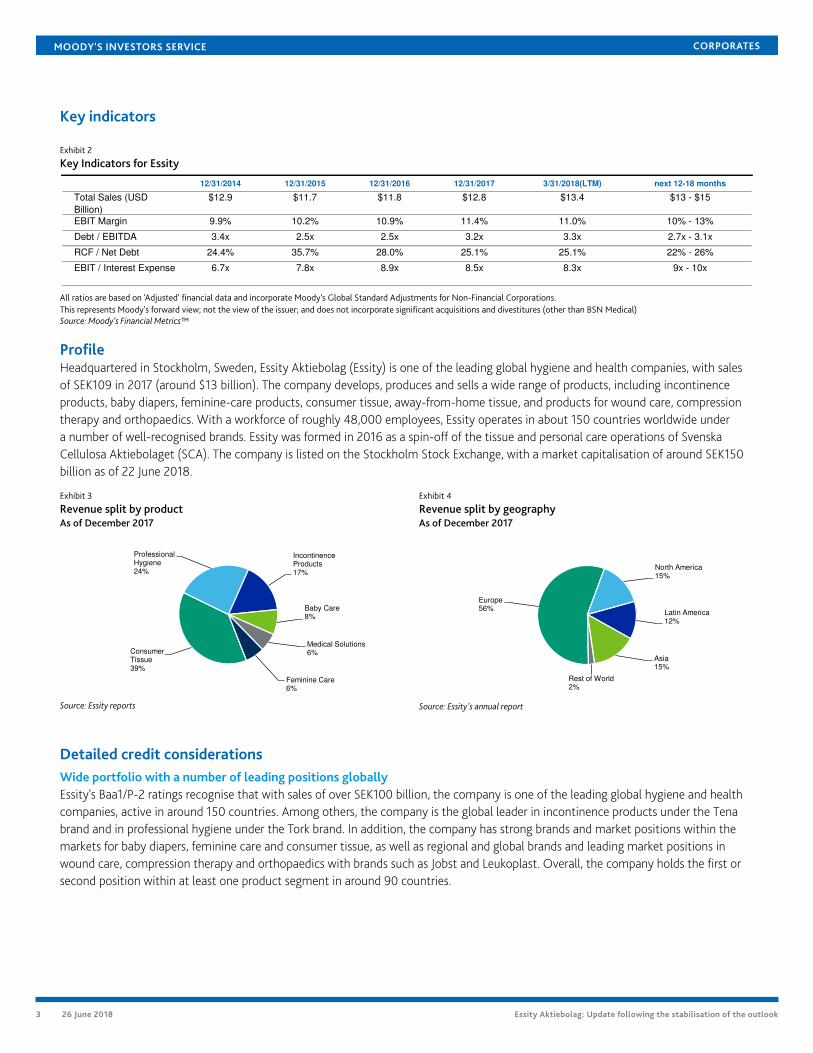
Key indicators
Exhibit 2
Key Indicators for Essity
12/31/2014 12/31/2015 12/31/2016 12/31/2017 3/31/2018(LTM) next 12-18 months
Total Sales (USD
Billion)
$12.9 $11.7 $11.8 $12.8 $13.4 $13 - $15
EBIT Margin 9.9% 10.2% 10.9% 11.4% 11.0% 10% - 13%
Debt / EBITDA 3.4x 2.5x 2.5x 3.2x 3.3x 2.7x - 3.1x
RCF / Net Debt 24.4% 35.7% 28.0% 25.1% 25.1% 22% - 26%
EBIT / Interest Expense 6.7x 7.8x 8.9x 8.5x 8.3x 9x - 10x
All ratios are based on 'Adjusted' financial data and incorporate Moody's Global Standard Adjustments for Non-Financial Corporations.This represents Moody's forward view; not the view of the issuer; and does not incorporate significant acquisitions and divestitures (other than BSN Medical)Source: Moody’s Financial Metrics™
ProfileHeadquartered in Stockholm, Sweden, Essity Aktiebolag (Essity) is one of the leading global hygiene and health companies, with salesof SEK109 in 2017 (around $13 billion). The company develops, produces and sells a wide range of products, including incontinenceproducts, baby diapers, feminine-care products, consumer tissue, away-from-home tissue, and products for wound care, compressiontherapy and orthopaedics. With a workforce of roughly 48,000 employees, Essity operates in about 150 countries worldwide undera number of well-recognised brands. Essity was formed in 2016 as a spin-off of the tissue and personal care operations of SvenskaCellulosa Aktiebolaget (SCA). The company is listed on the Stockholm Stock Exchange, with a market capitalisation of around SEK150billion as of 22 June 2018.
Exhibit 3
Revenue split by productAs of December 2017
Exhibit 4
Revenue split by geographyAs of December 2017
Consumer Tissue39%
Professional Hygiene24%
Incontinence Products17%
Baby Care8%
Medical Solutions 6%
Feminine Care6%
Source: Essity reports
Europe56%
North America15%
Latin America12%
Asia15%
Rest of World2%
Source: Essity's annual report
Detailed credit considerationsWide portfolio with a number of leading positions globallyEssity's Baa1/P-2 ratings recognise that with sales of over SEK100 billion, the company is one of the leading global hygiene and healthcompanies, active in around 150 countries. Among others, the company is the global leader in incontinence products under the Tenabrand and in professional hygiene under the Tork brand. In addition, the company has strong brands and market positions within themarkets for baby diapers, feminine care and consumer tissue, as well as regional and global brands and leading market positions inwound care, compression therapy and orthopaedics with brands such as Jobst and Leukoplast. Overall, the company holds the first orsecond position within at least one product segment in around 90 countries.
3 26 June 2018 Essity Aktiebolag: Update following the stabilisation of the outlook

MOODY'S INVESTORS SERVICE CORPORATES
Exhibit 5
Overview of market positions and key brands
Global Europe North America Latin America Asia Key Brands
Incontinence Products #1 #1 #4 #1 #4 Tena
Baby Care #5 #2 n.a. #6 #6 Drypers, Pequenín, Libero
Feminime Care #6 #3 n.a. #1 #10 Libresse, Saba, Nosotras, Bodyform
Medical Solutions #4 #1 #12 #1 #2 Jobst, Leukoplast, Cutimed, Delta-Cast
Consumer Tissuer #2 #1 n.a. #3 #1 Edet, Lotus, Regio, Tempo, Vinda, Zewa
Professional Hygiene #1 #1 #2 #4 #3 Tork
Source: Essity annual reports
The personal care and tissue markets are fairly competitive and subject to periods of temporary oversupply, which require producersto continuously focus on innovation to protect brand strength as well as optimise costs. In the tissue business, which is generally morecompetitive and less profitable, Essity competes primarily with Georgia-Pacific (A3, stable), Hengan, Kimberly-Clark (K-C) and Sofidel.In the personal care business, Essity's key competitors are K-C, the Procter & Gamble (P&G) and Unicharm. In April 2017, followingthe debt-funded acquisition of BSN Medical for a purchase price of €2.7 billion, the company entered the market for medical deviceswith low technology content, such as wound care and compression therapy, which benefits from robust and stable demand and above-average profitability.
We expect Essity to focus on growing its personal care and medical devices product offerings while further increasing the efficiency ofits tissue operations. This strategy will help narrow the profitability gap with the company's more profitable competitors, especially K-Cand P&G, which benefit from a higher share of the more profitable personal care business and the generally more profitable US market.
Exhibit 6
Essity's margins have been below those of its main competitors, but the successful integration of BSN could help somewhat narrow thatgapMoody's-adjusted EBIT margin
All ratios are based on 'Adjusted' financial data and incorporate Moody's Global Standard Adjustments for Non-Financial Corporations.Forward view represents Moody's view, not the view of the issuer.Source: Moody's Financial Metrics
Good underlying demand growth, especially in emerging marketsEssity benefits from the fact that the demand for its products has good underlying growth, supported by megatrends such aspopulation growth and higher disposable income, as well as the increased prevalence of people with chronic diseases. While maturemarkets continue to experience modest annual growth in low single digits in percentage terms, the growth potential in emergingmarkets is substantial, and we estimate the annual growth rate in these markets to be in high single digits in percentage terms. This isbecause the per capita consumption of tissue and personal care products in emerging markets is significantly lower in an environmentwhere living standards are rapidly improving.
To benefit from this development, Essity had focused on growing its presence in emerging markets over the past decade. This was doneboth organically and through M&A, most recently through an acquisition of a majority stake in Hong-Kong-based tissue company
4 26 June 2018 Essity Aktiebolag: Update following the stabilisation of the outlook
MOODY'S INVESTORS SERVICE CORPORATES
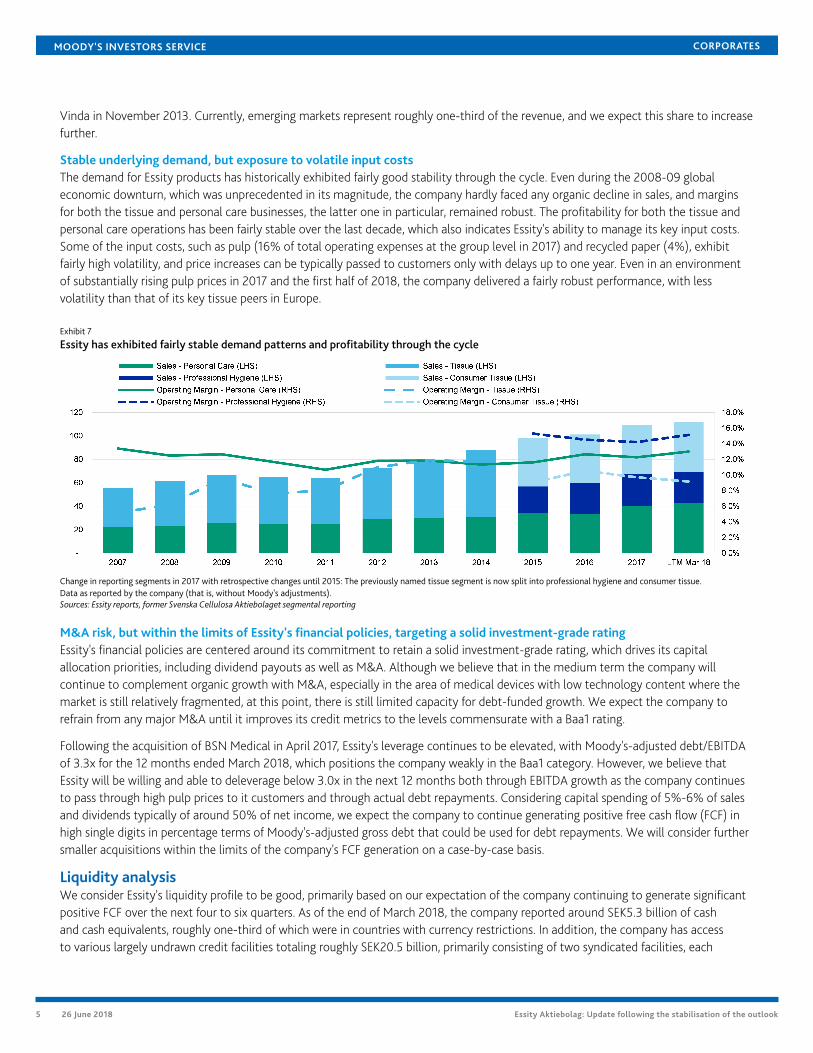
Vinda in November 2013. Currently, emerging markets represent roughly one-third of the revenue, and we expect this share to increasefurther.
Stable underlying demand, but exposure to volatile input costsThe demand for Essity products has historically exhibited fairly good stability through the cycle. Even during the 2008-09 globaleconomic downturn, which was unprecedented in its magnitude, the company hardly faced any organic decline in sales, and marginsfor both the tissue and personal care businesses, the latter one in particular, remained robust. The profitability for both the tissue andpersonal care operations has been fairly stable over the last decade, which also indicates Essity's ability to manage its key input costs.Some of the input costs, such as pulp (16% of total operating expenses at the group level in 2017) and recycled paper (4%), exhibitfairly high volatility, and price increases can be typically passed to customers only with delays up to one year. Even in an environmentof substantially rising pulp prices in 2017 and the first half of 2018, the company delivered a fairly robust performance, with lessvolatility than that of its key tissue peers in Europe.
Exhibit 7
Essity has exhibited fairly stable demand patterns and profitability through the cycle
Change in reporting segments in 2017 with retrospective changes until 2015: The previously named tissue segment is now split into professional hygiene and consumer tissue.Data as reported by the company (that is, without Moody's adjustments).Sources: Essity reports, former Svenska Cellulosa Aktiebolaget segmental reporting
M&A risk, but within the limits of Essity's financial policies, targeting a solid investment-grade ratingEssity's financial policies are centered around its commitment to retain a solid investment-grade rating, which drives its capitalallocation priorities, including dividend payouts as well as M&A. Although we believe that in the medium term the company willcontinue to complement organic growth with M&A, especially in the area of medical devices with low technology content where themarket is still relatively fragmented, at this point, there is still limited capacity for debt-funded growth. We expect the company torefrain from any major M&A until it improves its credit metrics to the levels commensurate with a Baa1 rating.
Following the acquisition of BSN Medical in April 2017, Essity's leverage continues to be elevated, with Moody's-adjusted debt/EBITDAof 3.3x for the 12 months ended March 2018, which positions the company weakly in the Baa1 category. However, we believe thatEssity will be willing and able to deleverage below 3.0x in the next 12 months both through EBITDA growth as the company continuesto pass through high pulp prices to it customers and through actual debt repayments. Considering capital spending of 5%-6% of salesand dividends typically of around 50% of net income, we expect the company to continue generating positive free cash flow (FCF) inhigh single digits in percentage terms of Moody's-adjusted gross debt that could be used for debt repayments. We will consider furthersmaller acquisitions within the limits of the company's FCF generation on a case-by-case basis.
Liquidity analysisWe consider Essity's liquidity profile to be good, primarily based on our expectation of the company continuing to generate significantpositive FCF over the next four to six quarters. As of the end of March 2018, the company reported around SEK5.3 billion of cashand cash equivalents, roughly one-third of which were in countries with currency restrictions. In addition, the company has accessto various largely undrawn credit facilities totaling roughly SEK20.5 billion, primarily consisting of two syndicated facilities, each
5 26 June 2018 Essity Aktiebolag: Update following the stabilisation of the outlook

MOODY'S INVESTORS SERVICE CORPORATES
€1.0 billion, maturing in 2021 and 2023 (the latter one with two extension options of one year each). The facilities are of highquality, without material adverse change clauses and other conditionality language, and have also served as backstop facilities for thecommercial paper programme, which has been a central source of the company's short-term funding needs. As of the end of March2018, the company reported roughly SEK8.3 billion in short-term debt, which includes around SEK1 billion of issued commercial papersand SEK3 billion euro bonds. The company's maturity profile is generally well spread, with an average maturity of around four years.
Exhibit 8
Essity's debt maturity profile is generally well spreadAs of 31 March 2018
0
5
10
15
20
25
30
35
2018 2019 2020 2021 2022 >2022
SE
K B
illion
Commercial papers Bond loans Other loans Unutilised credit lines
Source: Essity reports
Rating methodology and scorecard factorsThe principal methodology used in rating Essity is the Global Packaged Goods rating methodology. The methodology grid indicates aweak A3 rating for the metrics achieved for the 12 months ended March 2018, as well as for our 12-18 month forward-looking view.The one-notch difference is mainly attributed to a weak positioning of Essity in the A category for the Geographic Diversification,Category Assessment and Financial Policy subfactors.
6 26 June 2018 Essity Aktiebolag: Update following the stabilisation of the outlook

MOODY'S INVESTORS SERVICE CORPORATES
Exhibit 9
Methodology grid for Essity
Consumer Packaged Goods Industry Grid
Factor 1 : Scale and Diversification (44%) Measure Score Measure Score
a) Total Sales (USD Billion) $13.4 A $13 - $15 A
b) Geographic Diversification A A A A
c) Segmental Diversification Baa Baa Baa Baa
Factor 2 : Franchise Strength and Potential (14%)
a) Market Share A A A A
b) Category Assessment A A A A
Factor 3 : Profitability (7%)
a) EBIT Margin 11.0% Ba 10% - 13% Ba
Factor 4 : Financial Policy (14%)
a) Financial Policy A A A A
Factor 5 : Leverage and Coverage (21%)
a) Debt / EBITDA 3.3x Baa 2.7x - 3.1x Baa
b) RCF / Net Debt 25.1% Baa 22% - 26% Baa
c) EBIT / Interest Expense 8.3x A 9x - 10x A
Rating:
a) Indicated Rating from Grid A3 A3
b) Actual Rating Assigned Baa1
Current
LTM 3/31/2018
Moody's 12-18 Month Forward View
As of 6/22/2018
All ratios are based on 'Adjusted' financial data and incorporate Moody's Global Standard Adjustments for Non-Financial Corporations.This represents Moody's forward view; not the view of the issuer; and does not incorporate significant acquisitions and divestitures (other than BSN Medical)Source: Moody’s Financial Metrics™
Ratings
Exhibit 10Category Moody's RatingESSITY AKTIEBOLAG
Outlook StableIssuer Rating Baa1Senior Unsecured Baa1ST Issuer Rating P-2
Source: Moody's Investors Service
7 26 June 2018 Essity Aktiebolag: Update following the stabilisation of the outlook

MOODY'S INVESTORS SERVICE CORPORATES
Exhibit 11
Peer comparison
(in USD millions)FYE
Dec-16
FYE
Dec-17
LTM
Mar-18
FYE
Dec-16
FYE
Dec-17
LTM
Mar-18
FYE
Jun-16
FYE
Jun-17
LTM
Mar-18
Revenue $11,841 $12,808 $13,437 $18,202 $18,259 $18,486 $65,299 $65,058 $66,408
EBITDA $1,968 $2,219 $2,274 $4,362 $4,342 $4,342 $17,625 $17,944 $17,740
Total Debt $4,707 $7,336 $7,543 $9,035 $8,728 $8,983 $38,788 $38,464 $46,071
Cash & Cash Equiv. $472 $533 $669 $923 $616 $626 $7,102 $5,569 $5,326
EBIT Margin 10.9% 11.4% 11.0% 18.8% 18.4% 18.0% 21.7% 22.8% 22.0%
EBIT / Int. Exp. 8.9x 8.5x 8.3x 9.4x 9.2x 9.6x 17.9x 21.1x 20.5x
Debt / EBITDA 2.5x 3.2x 3.3x 2.1x 2.0x 2.1x 2.2x 2.1x 2.6x
RCF / Net Debt 28.0% 25.1% 25.1% 23.5% 24.3% 19.3% 21.3% 19.1% 26.9%
FCF / Debt 14.6% 10.5% 8.6% 13.5% 9.1% 10.2% 12.6% 6.0% 6.5%
Essity Aktiebolag Kimberly-Clark Corporation Procter & Gamble Company (The)
Baa1 Stable A2 Stable Aa3 Stable
All ratios are based on 'Adjusted' financial data and incorporate Moody's Global Standard Adjustments for Non-Financial Corporations.Source: Moody’s Financial Metrics™
Exhibit 12
Reconciliation of debt
12/31/2014 12/31/2015 12/31/2016 12/31/2017 03/31/2018 (LTM)
As Reported Debt 39,906 34,008 36,149 54,124 56,992
Pensions 4,529 2,917 4,662 3,804 3,804
Operating Leases 1,965 2,043 2,626 2,328 2,328
Non-Standard Adjustments 280 -977 -673 -195 48
Moody's-Adjusted Debt 46,680 37,991 42,764 60,061 63,172
Source: Moody’s Financial Metrics™
Exhibit 13
Reconciliation of EBITDA
12/31/2014 12/31/2015 12/31/2016 12/31/2017 03/31/2018 (LTM)
As Reported EBITDA 13,068 15,552 14,809 18,036 18,439
Pensions 52 149 134 -14 -14
Operating Leases 655 681 696 776 776
Unusual Items and Non-Standard
Adjustments-144 -934 1,189 133 -245
Moody's-Adjusted EBITDA 13,631 15,448 16,828 18,931 18,956
Moody's defines EBITDA as pretax income + gross interest expense + depreciation and amortisationSource:Moody’s Financial Metrics™
8 26 June 2018 Essity Aktiebolag: Update following the stabilisation of the outlook

MOODY'S INVESTORS SERVICE CORPORATES
Exhibit 14
Overview of key metrics
(in USD millions) 31-Dec-14 31-Dec-15 31-Dec-16 31-Dec-17 31-Mar-18
INCOME STATEMENT
Revenue $12,857.5 $11,688.2 $11,841.1 $12,807.6 $13,437.5
EBITDA $1,991.7 $1,832.7 $1,968.2 $2,219.0 $2,273.9
EBIT $1,277.1 $1,195.4 $1,296.2 $1,466.1 $1,480.9
Interest Expense $190.1 $152.4 $145.6 $172.1 $178.6
BALANCE SHEET
Cash & Cash Equivalents $521.4 $577.7 $471.8 $532.8 $669.3
Total Debt $5,963.0 $4,506.4 $4,707.3 $7,335.6 $7,543.1
Net Debt $5,441.6 $3,928.7 $4,235.5 $6,802.9 $6,873.8
CASH FLOW
CAPEX $753.9 $740.3 $806.0 $799.2 $860.8
FFO $1,552.5 $1,430.0 $1,283.6 $1,674.3 $1,765.9
Dividends $33.3 $25.6 $22.2 $33.4 $34.2
Retained Cash Flow $1,519.2 $1,404.3 $1,261.4 $1,640.9 $1,731.7
RCF / Net Debt 24.4% 35.7% 28.0% 25.1% 25.1%
Free Cash Flow (FCF) $720.9 $579.6 $730.9 $736.6 $653.1
FCF / Debt 10.6% 12.9% 14.6% 10.5% 8.6%
PROFITABILITY
% Change in Sales (YoY) n.a. 12.0% 2.8% 7.9% n.a.
EBIT Margin % 9.9% 10.2% 10.9% 11.4% 11.0%
EBITDA Margin % 15.5% 15.7% 16.6% 17.3% 16.9%
INTEREST COVERAGE
EBIT / Interest Expense 6.7x 7.8x 8.9x 8.5x 8.3x
EBITDA / Interest Expense 10.5x 12.0x 13.5x 12.9x 12.7x
(EBITDA - CAPEX) / Interest Expense 6.5x 7.2x 8.0x 8.3x 7.9x
LEVERAGE
Debt / EBITDA 3.4x 2.5x 2.5x 3.2x 3.3x
Debt / (EBITDA - CAPEX) 5.5x 4.1x 4.3x 5.0x 5.4x
Net Debt / EBITDA 3.1x 2.1x 2.3x 2.9x 3.0x
All ratios are based on 'Adjusted' financial data and incorporate Moody's Global Standard Adjustments for Non-Financial Corporations.Source: Moody’s Financial Metrics™
9 26 June 2018 Essity Aktiebolag: Update following the stabilisation of the outlook
MOODY'S INVESTORS SERVICE CORPORATES
© 2018 Moody’s Corporation, Moody’s Investors Service, Inc., Moody’s Analytics, Inc. and/or their licensors and affiliates (collectively, “MOODY’S”). All rights reserved.
CREDIT RATINGS ISSUED BY MOODY'S INVESTORS SERVICE, INC. AND ITS RATINGS AFFILIATES (“MIS”) ARE MOODY’S CURRENT OPINIONS OF THE RELATIVE FUTURE CREDITRISK OF ENTITIES, CREDIT COMMITMENTS, OR DEBT OR DEBT-LIKE SECURITIES, AND MOODY’S PUBLICATIONS MAY INCLUDE MOODY’S CURRENT OPINIONS OF THERELATIVE FUTURE CREDIT RISK OF ENTITIES, CREDIT COMMITMENTS, OR DEBT OR DEBT-LIKE SECURITIES. MOODY’S DEFINES CREDIT RISK AS THE RISK THAT AN ENTITYMAY NOT MEET ITS CONTRACTUAL, FINANCIAL OBLIGATIONS AS THEY COME DUE AND ANY ESTIMATED FINANCIAL LOSS IN THE EVENT OF DEFAULT. CREDIT RATINGSDO NOT ADDRESS ANY OTHER RISK, INCLUDING BUT NOT LIMITED TO: LIQUIDITY RISK, MARKET VALUE RISK, OR PRICE VOLATILITY. CREDIT RATINGS AND MOODY’SOPINIONS INCLUDED IN MOODY’S PUBLICATIONS ARE NOT STATEMENTS OF CURRENT OR HISTORICAL FACT. MOODY’S PUBLICATIONS MAY ALSO INCLUDE QUANTITATIVEMODEL-BASED ESTIMATES OF CREDIT RISK AND RELATED OPINIONS OR COMMENTARY PUBLISHED BY MOODY’S ANALYTICS, INC. CREDIT RATINGS AND MOODY’SPUBLICATIONS DO NOT CONSTITUTE OR PROVIDE INVESTMENT OR FINANCIAL ADVICE, AND CREDIT RATINGS AND MOODY’S PUBLICATIONS ARE NOT AND DO NOTPROVIDE RECOMMENDATIONS TO PURCHASE, SELL, OR HOLD PARTICULAR SECURITIES. NEITHER CREDIT RATINGS NOR MOODY’S PUBLICATIONS COMMENT ON THESUITABILITY OF AN INVESTMENT FOR ANY PARTICULAR INVESTOR. MOODY’S ISSUES ITS CREDIT RATINGS AND PUBLISHES MOODY’S PUBLICATIONS WITH THE EXPECTATIONAND UNDERSTANDING THAT EACH INVESTOR WILL, WITH DUE CARE, MAKE ITS OWN STUDY AND EVALUATION OF EACH SECURITY THAT IS UNDER CONSIDERATION FORPURCHASE, HOLDING, OR SALE.
MOODY’S CREDIT RATINGS AND MOODY’S PUBLICATIONS ARE NOT INTENDED FOR USE BY RETAIL INVESTORS AND IT WOULD BE RECKLESS AND INAPPROPRIATE FORRETAIL INVESTORS TO USE MOODY’S CREDIT RATINGS OR MOODY’S PUBLICATIONS WHEN MAKING AN INVESTMENT DECISION. IF IN DOUBT YOU SHOULD CONTACTYOUR FINANCIAL OR OTHER PROFESSIONAL ADVISER. ALL INFORMATION CONTAINED HEREIN IS PROTECTED BY LAW, INCLUDING BUT NOT LIMITED TO, COPYRIGHT LAW,AND NONE OF SUCH INFORMATION MAY BE COPIED OR OTHERWISE REPRODUCED, REPACKAGED, FURTHER TRANSMITTED, TRANSFERRED, DISSEMINATED, REDISTRIBUTEDOR RESOLD, OR STORED FOR SUBSEQUENT USE FOR ANY SUCH PURPOSE, IN WHOLE OR IN PART, IN ANY FORM OR MANNER OR BY ANY MEANS WHATSOEVER, BY ANYPERSON WITHOUT MOODY’S PRIOR WRITTEN CONSENT.
CREDIT RATINGS AND MOODY’S PUBLICATIONS ARE NOT INTENDED FOR USE BY ANY PERSON AS A BENCHMARK AS THAT TERM IS DEFINED FOR REGULATORY PURPOSESAND MUST NOT BE USED IN ANY WAY THAT COULD RESULT IN THEM BEING CONSIDERED A BENCHMARK.
All information contained herein is obtained by MOODY’S from sources believed by it to be accurate and reliable. Because of the possibility of human or mechanical error as wellas other factors, however, all information contained herein is provided “AS IS” without warranty of any kind. MOODY'S adopts all necessary measures so that the information ituses in assigning a credit rating is of sufficient quality and from sources MOODY'S considers to be reliable including, when appropriate, independent third-party sources. However,MOODY’S is not an auditor and cannot in every instance independently verify or validate information received in the rating process or in preparing the Moody’s publications.
To the extent permitted by law, MOODY’S and its directors, officers, employees, agents, representatives, licensors and suppliers disclaim liability to any person or entity for anyindirect, special, consequential, or incidental losses or damages whatsoever arising from or in connection with the information contained herein or the use of or inability to use anysuch information, even if MOODY’S or any of its directors, officers, employees, agents, representatives, licensors or suppliers is advised in advance of the possibility of such losses ordamages, including but not limited to: (a) any loss of present or prospective profits or (b) any loss or damage arising where the relevant financial instrument is not the subject of aparticular credit rating assigned by MOODY’S.
To the extent permitted by law, MOODY’S and its directors, officers, employees, agents, representatives, licensors and suppliers disclaim liability for any direct or compensatorylosses or damages caused to any person or entity, including but not limited to by any negligence (but excluding fraud, willful misconduct or any other type of liability that, for theavoidance of doubt, by law cannot be excluded) on the part of, or any contingency within or beyond the control of, MOODY’S or any of its directors, officers, employees, agents,representatives, licensors or suppliers, arising from or in connection with the information contained herein or the use of or inability to use any such information.
NO WARRANTY, EXPRESS OR IMPLIED, AS TO THE ACCURACY, TIMELINESS, COMPLETENESS, MERCHANTABILITY OR FITNESS FOR ANY PARTICULAR PURPOSE OF ANY SUCHRATING OR OTHER OPINION OR INFORMATION IS GIVEN OR MADE BY MOODY’S IN ANY FORM OR MANNER WHATSOEVER.
Moody’s Investors Service, Inc., a wholly-owned credit rating agency subsidiary of Moody’s Corporation (“MCO”), hereby discloses that most issuers of debt securities (includingcorporate and municipal bonds, debentures, notes and commercial paper) and preferred stock rated by Moody’s Investors Service, Inc. have, prior to assignment of any rating,agreed to pay to Moody’s Investors Service, Inc. for appraisal and rating services rendered by it fees ranging from $1,500 to approximately $2,500,000. MCO and MIS also maintainpolicies and procedures to address the independence of MIS’s ratings and rating processes. Information regarding certain affiliations that may exist between directors of MCO andrated entities, and between entities who hold ratings from MIS and have also publicly reported to the SEC an ownership interest in MCO of more than 5%, is posted annually atwww.moodys.com under the heading “Investor Relations — Corporate Governance — Director and Shareholder Affiliation Policy.”
Additional terms for Australia only: Any publication into Australia of this document is pursuant to the Australian Financial Services License of MOODY’S affiliate, Moody’s InvestorsService Pty Limited ABN 61 003 399 657AFSL 336969 and/or Moody’s Analytics Australia Pty Ltd ABN 94 105 136 972 AFSL 383569 (as applicable). This document is intendedto be provided only to “wholesale clients” within the meaning of section 761G of the Corporations Act 2001. By continuing to access this document from within Australia, yourepresent to MOODY’S that you are, or are accessing the document as a representative of, a “wholesale client” and that neither you nor the entity you represent will directly orindirectly disseminate this document or its contents to “retail clients” within the meaning of section 761G of the Corporations Act 2001. MOODY’S credit rating is an opinion asto the creditworthiness of a debt obligation of the issuer, not on the equity securities of the issuer or any form of security that is available to retail investors. It would be recklessand inappropriate for retail investors to use MOODY’S credit ratings or publications when making an investment decision. If in doubt you should contact your financial or otherprofessional adviser.
Additional terms for Japan only: Moody's Japan K.K. (“MJKK”) is a wholly-owned credit rating agency subsidiary of Moody's Group Japan G.K., which is wholly-owned by Moody’sOverseas Holdings Inc., a wholly-owned subsidiary of MCO. Moody’s SF Japan K.K. (“MSFJ”) is a wholly-owned credit rating agency subsidiary of MJKK. MSFJ is not a NationallyRecognized Statistical Rating Organization (“NRSRO”). Therefore, credit ratings assigned by MSFJ are Non-NRSRO Credit Ratings. Non-NRSRO Credit Ratings are assigned by anentity that is not a NRSRO and, consequently, the rated obligation will not qualify for certain types of treatment under U.S. laws. MJKK and MSFJ are credit rating agencies registeredwith the Japan Financial Services Agency and their registration numbers are FSA Commissioner (Ratings) No. 2 and 3 respectively.
MJKK or MSFJ (as applicable) hereby disclose that most issuers of debt securities (including corporate and municipal bonds, debentures, notes and commercial paper) and preferredstock rated by MJKK or MSFJ (as applicable) have, prior to assignment of any rating, agreed to pay to MJKK or MSFJ (as applicable) for appraisal and rating services rendered by it feesranging from JPY200,000 to approximately JPY350,000,000.
MJKK and MSFJ also maintain policies and procedures to address Japanese regulatory requirements.
REPORT NUMBER 1130345
10 26 June 2018 Essity Aktiebolag: Update following the stabilisation of the outlook