Essentials of Trading the Afternoon Market
91
The Essentials of Trading the Afternoon Market by Robert C. Joiner copyrig ht 2009 by Robert C. Joiner This book may not be duplicated or redistributed without the w ritten consent of the au thor.
-
Upload
mike-brownson -
Category
Documents
-
view
220 -
download
1
Transcript of Essentials of Trading the Afternoon Market

8/4/2019 Essentials of Trading the Afternoon Market
http://slidepdf.com/reader/full/essentials-of-trading-the-afternoon-market 1/91
The Essentials of Trading the Afternoon Market
by
Robert C. Joiner
copyright 2009 by Robert C. Joiner
This book may not be duplicated or redistributed without the written consent of the author.

8/4/2019 Essentials of Trading the Afternoon Market
http://slidepdf.com/reader/full/essentials-of-trading-the-afternoon-market 2/91
The Essentials of Trading the Afternoon Market
Preface
Before you begin reading, I'd like to explain some of the background for this material.
A few years ago, I wrote a book called GapDownProfits. That book was an analysis of early morningtrading, in which I focused on the morning gaps. That book is no longer in print. It was rewritten and is the basis for the chat room MorningHoursTrading. (Annual subscribers to this chat room receive the rewritten book as part of their subscription.)
So, since I had written extensively about the morning trading session, I thought I would complete thetrading day and talk about Trading the Afternoon Market. The morning and the afternoon sessions aretreated separately because there are many distinctions between them. Though we use some of the sameindicators, the strategies for each session are very different.
I also wanted to write about the afternoon session because someone once said to me, "Bob, I do greatwhen I'm trading with you in the morning session. But then I give it all back in the afternoon." Thatstatement shocked me a bit and made me realize that traders needed a separate guide for the afternoonsession.

8/4/2019 Essentials of Trading the Afternoon Market
http://slidepdf.com/reader/full/essentials-of-trading-the-afternoon-market 3/91
So, in the summer of 2009, I took a small group of traders over a two month period and we studiedthe afternoon session. I wrote some supporting materials. I recorded some videos to recap the lessons. Andthen, one thing led to another, and I ended up with a lot of material.
I orginally packaged all of this together into a pdf and online video package. And that package is stillavailable. But I also realized that some people just want the condensed version. They don't want to sitthrough three hours of video. So, I repackaged it into the format you're viewing now.
This is a mini-course divided into nine lessons. I encourage you to take one lesson at a time, andattempt to apply the material to your own trading as you progress. If you attempt to learn too much tooquickly, then it may only serve to confuse you.
You will see me reference certain videos in this book. These references are for the sake of those whoalso purchased the video portion of this material.
I hope you enjoy reading the material. More importantly, I hope it improves your trading in theafternoon session.
Sincerely,Bob Joiner October, 2009
8/4/2019 Essentials of Trading the Afternoon Market
http://slidepdf.com/reader/full/essentials-of-trading-the-afternoon-market 4/91
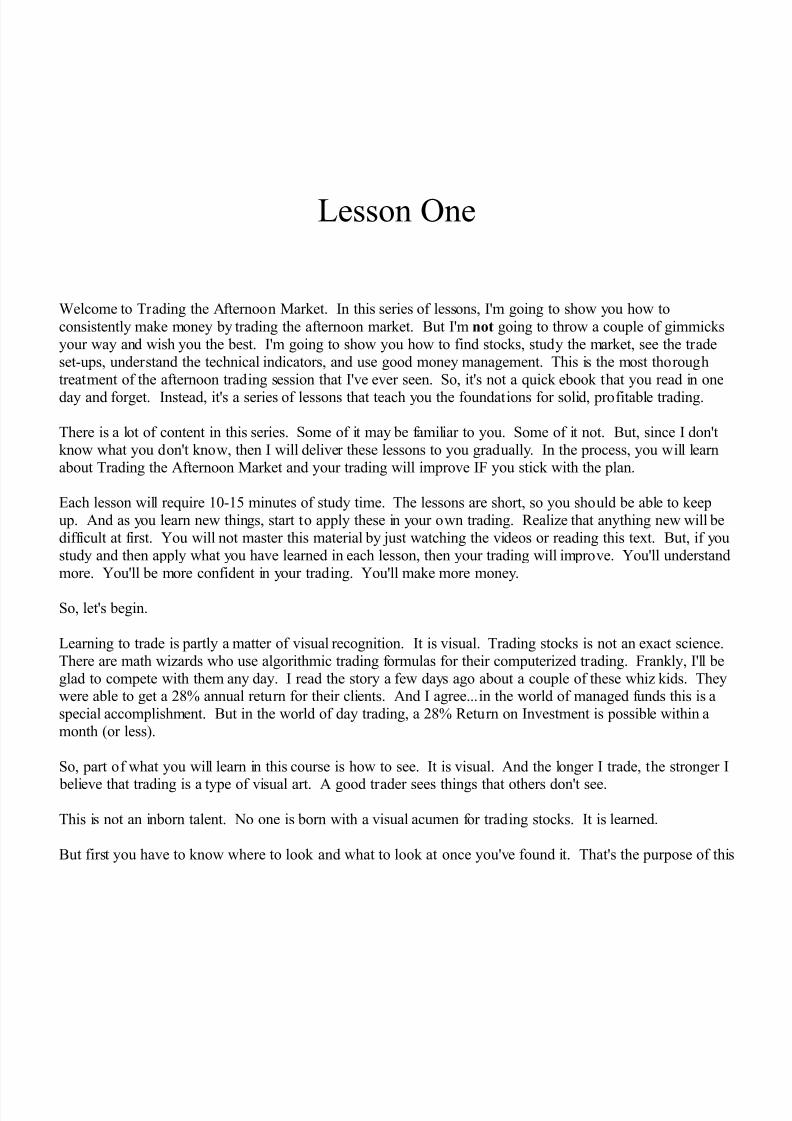
Lesson One
Welcome to Trading the Afternoon Market. In this series of lessons, I'm going to show you how toconsistently make money by trading the afternoon market. But I'mnot going to throw a couple of gimmicksyour way and wish you the best. I'm going to show you how to find stocks, study the market, see the tradeset-ups, understand the technical indicators, and use good money management. This is the most thoroughtreatment of the afternoon trading session that I've ever seen. So, it's not a quick ebook that you read in one
day and forget. Instead, it's a series of lessons that teach you the foundations for solid, profitable trading.
There is a lot of content in this series. Some of it may be familiar to you. Some of it not. But, since I don'tknow what you don't know, then I will deliver these lessons to you gradually. In the process, you will learnabout Trading the Afternoon Market and your trading will improve IF you stick with the plan.
Each lesson will require 10-15 minutes of study time. The lessons are short, so you should be able to keepup. And as you learn new things, start to apply these in your own trading. Realize that anything new will bedifficult at first. You will not master this material by just watching the videos or reading this text. But, if youstudy and then apply what you have learned in each lesson, then your trading will improve. You'll understandmore. You'll be more confident in your trading. You'll make more money.
So, let's begin.
Learning to trade is partly a matter of visual recognition. It is visual. Trading stocks is not an exact science.There are math wizards who use algorithmic trading formulas for their computerized trading. Frankly, I'll beglad to compete with them any day. I read the story a few days ago about a couple of these whiz kids. Theywere able to get a 28% annual return for their clients. And I agree...in the world of managed funds this is aspecial accomplishment. But in the world of day trading, a 28% Return on Investment is possible within amonth (or less).
So, part of what you will learn in this course is how to see. It is visual. And the longer I trade, the stronger I
believe that trading is a type of visual art. A good trader sees things that others don't see.
This is not an inborn talent. No one is born with a visual acumen for trading stocks. It is learned.
But first you have to know where to look and what to look at once you've found it. That's the purpose of this
8/4/2019 Essentials of Trading the Afternoon Market
http://slidepdf.com/reader/full/essentials-of-trading-the-afternoon-market 5/91
course...to help you see stock charts in a whole new light. I don't have a special indicator that tells youexactly when to buy a stock or short it. But, what I do have is a trained visual eye. By looking and testingand trading thousands of stocks, there are certain things I now do that are almost automatic. I can watch the
visual cues of a chart as it is forming and, based on my observations, I can tell you what it's likely do next. If the chart is too confusing and it does not produce a coherent message, then I leave it alone and go to another stock.
This is not some sort of magic trick. I utilize many tools to help me with my decisions. And these are thetools that I'll be sharing with you in this course. Some may be new to you and some may be old. It dependsupon how much time you've already devoted to stock chart analysis. But, the key value of this course is in bringing together a variety of indicators in order to create a system for trading the afternoon market that produces consistent profits. It is similar to building a puzzle. Viewed separately, the pieces make little sense.Once joined together, they create a recognizable pattern. But, as with a puzzle, seeing the completed pictureon the outside of the box makes it much easier to put the puzzle together.
So, let's get started.
Our Goal
Our goal is to make profitable stock trades in the afternoon session. There are seven reasons why tradershave a difficult time with afternoon trading. I will reiterate them here, though there is a separate documentcalled "The Perils of the Afternoon Market" that expands upon them. These observations are based on self-reflection as well as talking with many other traders over the past several years.
1. Traders don't know what they're looking for (i.e. lack of clearly defined strategy).
2. Traders get physically tired in the afternoon. Sitting in front of a computer in the afternoon after lunch isnot many people's peak performance time.
3. Traders are tempted to hold stocks overnight if they get into a bad trade.
4. Traders take on more risk than normal. If they did well in the morning session, then they get over-confident and mess up. If they did poorly, then they feel they have ground to make up.
5. Traders are trying to play the same, tired stocks they played in the morning session.
6. Traders feel that if they are sitting at home in front of their computers then they need to be tradingsomething...anything. (This is a strong work ethic gone awry.)
7. Traders expect too much from the afternoon session. Huge volatility does not typically happen in theafternoon trading session. Less volatility equals lower risk and also lower profits. But, if we can improve our

8/4/2019 Essentials of Trading the Afternoon Market
http://slidepdf.com/reader/full/essentials-of-trading-the-afternoon-market 6/91
winning percentages in the afternoon session, then it means we will lose less, profit more, and have moneyready for the next morning session.
So, one of the first things we do is to recognize the possible land mines. I just listed seven of them. Each of those land mines are just waiting to explode on you in the afternnon session. As you read the list of sevenitems, there were probably one or two that really rang true for you. "Been there. Done that." For you, thoseareas are the ones to which you need to pay special attention.
For example, when I first started trading full time, I felt that I had to be constantly in a stock. My reasoningwas that idle money was wasted money. But, as I slowly learned (we don't learn any of this stuff quickly, dowe?), idle money is much better than wasted money. Now, I am much more strategic in my trading. I respectmy cash too much to throw it away on frivolous trades. This is not a casino in which we gamble on whichstock is going to make it. I choose my trades very carefully and I have set aside my obsession to trade. Nolonger do I have to trade. I choose to trade what I want to trade and when I want to trade it, if I choose to
trade at all. Sometimes, choosing not to trade is good money management.
For you, it may be one of the other areas. But I would encourage you to spend a few moments and think about it. Before you move into this new material, it's a good idea to reflect on your tendencies as a trader.Do you get tired after lunch? You feel compelled to make up for money you lost in the morning session? Doyou tend to rationalize the trade in your mind when you turn a day trade turns into a swing trade because itisn't going the way you wanted it to go? What is your personal land mine right now?
So, before we move on, I encourage you to think about these things. Know where you're coming from andthen we'll plot out some new territory.
The Visual Toolkit
The bulk of this training will be focused on the inter-relationship of various technical indicators and how theyconverge to give us visual cues for trading. As you see the relationship of these indicators repeated over andover again, then your eyes become trained to recognize them before they occur. The visual cues become predictive cues because your mind's eye has been trained to watch for them. The temptation, in the beginning,will be for you to jump too quickly. You'll start to see things in the charts and, eager with your new foundknowledge, you will jump into a stock prematurely. But acting prematurely can turn a profitable play into a break-even trade (or worse).
So, be careful of taking a little bit of knowledge and running headstrong into trading with it. You could endup getting frustrated and discarding things too soon, before you've gained adequate experience.
The first thing, with any new strategy, is to recognize a pattern within a chart from the viewpoint of hindsight.In other words, you must first see the pattern in the chart by looking at and the end-of-day chart. Once you

8/4/2019 Essentials of Trading the Afternoon Market
http://slidepdf.com/reader/full/essentials-of-trading-the-afternoon-market 7/91
see the pattern in the still charts, then you are ready to move into real time charts. But we always begin withstill charts. You have to know what it is you are looking for before you ever be able to find it. So this iswhere we begin.
Over the course of the next six weeks, we will cover the following topics:
* Support and Resistance* Contexual Trading* RSI & Stochastics* MACD, Volume, and Money Flow* Trade-ideas (TM)* Money Management* Eight Specific Strategies* Entries & Exits
Each of these topics will be discussed further in later lessons. But, we are looking at the picture on theoutside of the puzzle box at this point. We are not trying to put the puzzle together.
Rather than trying to get ahead of the game and figuring out the details of later sessions, I encourage you tothink visually right now. Try to get a sense of the visual landscape of each trade. See how the variousindicators move together and how they make sense of each other.

8/4/2019 Essentials of Trading the Afternoon Market
http://slidepdf.com/reader/full/essentials-of-trading-the-afternoon-market 8/91
Perils of the Afternoon Market
Before we begin a discussion of how to trade the afternoon market, it's important to know the landmines thatawait you. There are seven main reasons why traders fail to make money in the afternoon market. As youread this material, I encourage you to be a little introspective. If some of the points ring true for you, thenacknowledge it. Before you can begin to grow your equity by trading the afternoon market, you have to stopthe bleeding. You have to stop losing money. So let's take a look at some of the reasons why traders lose
money in the afternoons.
1. Traders don't know what they're looking for (i.e. lack of clearly definedstrategy).
Perhaps that's the wrong way of saying it. Most traders are very goal oriented...they want to make a profitable trade. They want to make money. There is, after all, a certain adrenalin rush that comes from
bagging a successful trade. Sometimes it's not even so much about the money. It's about feeling good, proving to ourselves that we can master the challenge of trading, putting our hand in the face of those whosaid we could not do it. Pride.
But heah...the money is nice too.
The problem isn't our lack of determination either. I'd say most traders are very determined individuals. Weare not quitters. We have been successful in other things. And there is no reason in the world why we cannot be successful at trading. So, determination? Bring it on.
But this is right where we begin to run into trouble. We know the goal. We are determined to achieve it.But our success rate is not where we want it to be. We're winning a little bit more than we're losing (maybe).But we know, just as with everything else in life, we just have to try harder, focus on the goal, and our determination to succeed will eventually win the day.
Or will it?

8/4/2019 Essentials of Trading the Afternoon Market
http://slidepdf.com/reader/full/essentials-of-trading-the-afternoon-market 9/91
You see, for some reason we have this idea that we can earn a surgeon's salary by trading stocks...but,without having to secure a surgeon's education. We have bought the hype that trading is easy. So, when we bang our heads against the wall, making the same mistakes over and over again, and our determination serves
only to make us bang harder, then perhaps it's time to stop and consider what's going on.
And when we stop, if we stop at all, we might recognize that this thing called trading is a little more difficultthan we had imagined. That maybe it requires some skills we didn't expect having to acquire. And that if weare going to earn a surgeon's salary, we may have to be humble enough to learn from some people who've been around the block a few times.
And that's where "a clearly defined strategy" comes in. That's what most traders lack.
They don't lack the goal. They don't lack determination. They simply lack a strategy that will harness thedetermination that will take them to the goal.
You see, you can be determined in your goal to drive to Detroit. But, if you don't have a car and a map, thenyou're going to have a tough time getting there.
Having a strategy for trading the afternoon session is especially important. Why? We'll get into all the problems with afternoon sessions as we move through this series. But let us just say it's a field filled withlandmines. The opportunities for losing money are plentiful. And, if you make the wrong moves, then youcan end up losing all of the money you gained in the morning session. Feeling "the need to trade", you can getyourself into some dangerous territory very quickly in the afternoon session. You might, for example, end upmaking a trade that goes against you. And now you're holding a trade overnight, even though you thought itwas going to be an easy day trade. Now your equity is tied up in a trade that's moving against you. And you
end up treading water in the next day's session because your equity is still holed up in yesterday's trade.
If you've been trading any time at all, then I'm sure this scenario sounds familiar to you. We rationalize our decision to stay in a trade longer than we should. We make excuses for our lack of discipline. And then weget angry at ourselves for having done the one thing we promised ourselves we'd never do again.
And you know what? This scenario gets repeated by thousands of other traders, just like us, every day. Our good intentions are like boats that have run aground. And we end up a frustrated trader.
Now, I am not going to promise you that I've got the answer to your problems. All I know is this: until you begin trading with a clearly defined strategy, then you are going to continue to have a frustrating time as a
trader. And you are never going to earn that surgeon's salary. The quicker you can face up to that reality the better.
So what makes "a clearly defined strategy". It is a strategy that tells you when to enter and exit the trade. Ittells you where to find stocks that meet certain, tradeable criteria. It's a strategy that doesn't depend upon themarket being up or down, because it works in a variety of market conditions. And, most important of all, it
8/4/2019 Essentials of Trading the Afternoon Market
http://slidepdf.com/reader/full/essentials-of-trading-the-afternoon-market 10/91
creates more winning trades than losing trades on a consistent basis.
I am not talking about some sort of automated trading. Who wants that? If that's what you're looking for,
then keep looking. What I'm talking about is a strategy that teaches you how tosee a trade set-up when itstarts to happen, and shows you when to buy or short the stock for the maximum gain. A good strategy willhelp you recognize repeating patterns in the charts and, using just a handful of technical indicators, assist youin recognizing and exploiting those patterns.
In the following material, I'll discuss six other landmines for day traders in the afternoon session.
But, for now, I encourage you to do a short homework assignment. Being as consise as possible, write downyour current strategy for trading the afternoon market. How do you determine your entry and exit points?How much equity do you put into every trade? What strategy do you follow when the trade goes againstyou? How do you determine if the trade is going against you? Under what circumstances (if any) would you
hold a trade overnight? Just some questions to get your started.
2. Traders get physically tired in the afternoon.
This may not sound much like a landmine to you. But think about this for a minute. You're sitting at your computer, after lunch, staring at a computer screen with little lights flickering back and forth. It's enough to
make anyone fall asleep. I have never met anyone who's personal peak time is 2 o'clock in the afternoon.There's a reason why pre-school kids take a nap at that time of the day. It's what your body naturally wants todo.
But, no, you are sitting at the computer, waiting for the market to break out of the sideways trading pattern ithas been in for the past two hours.
Now, my course is not going to solve this problem for you. I'm not going to promise that the markets willnever be boring or that your eyes will never droop while you're laying your head against the back of your chair. But I am going to tell you it's a landmine of potential danger for the afternoon session.
Think about it for a minute. You have access to how many thousands of dollars? Your eyes are glossingover. Your brain is tired from the adrenaline rush of the morning session. But you are determined to sit thereand knock out another trade before you give up the fight.
So what can you do about the afternoon lull?
8/4/2019 Essentials of Trading the Afternoon Market
http://slidepdf.com/reader/full/essentials-of-trading-the-afternoon-market 11/91
First, it's okay to take a break from trading. We'll talk about this even more later on. But, for now, just knowthat it's okay to take a nap, eat lunch, get away from your computer, leave your cash on the sidelines, or even
take the rest of the day off. While I admire your tenacious work ethic, I also have to tell you: give it up.You're not at the office any more. This is a whole different life you're creating. And it's okay "not to operateheavy machinery while drowsy". You are, after all, responsible for these thousands of dollars.
Second, don't think that extra caffeine is the solution. This may only make you jumpy.
Third, get up and do some exercise. Go for a walk. Do some jumping jacks. Get the blood flowing. Inshort, get away from the computer and circulate.
Now, here's the thing. If you are unable to leave your computer for an extended period, then you're probablystaying in your trades too long, hoping they will work out, because you don't have a strategy yet. Got you,
right? Because that's the way that many day traders trade. They get into a trade. They hope it works out.And if it doesn't go their way then they hang onto it until later in the day (or the next day), when they finallyunload the losing trade. If that describes how you're trading, then it's obvious to me that you don't have aclearly defined strategy. Clearly defined strategies don't linger for hours at a time - not day trading strategiesanyway. They are clear cut and they're often over within ten minutes or two hours. They seldom last longer than this.
So, if you're buying stocks in the morning and hoping to make a profit at some point during the day, waitinguntil late in the afternoon to sell them at a loss, then (I'll be frank here) you need this course. You need it soyou can walk away from the computer, take a walk, and eat lunch. If nothing else, you need it so you can getup and get refreshed.
3. Traders are tempted to hold stocks overnight if they get into a bad trade.
One of the worst things you can do as a day trader is to rationalize your way into turning that day trade into aswing trade. It happens easily and it happens often.
Everything starts out all normal. You're trading along in the afternoon session, trying to pick up a fewdollars. You get into a trade, let's say as a long position. But then something happens in the market or something happens with this stock. It starts to move against you. And, before you can sing "happy birthday",you're losing money. Now, more time has passed and the stock still isn't going your way. Maybe it's notlosing a lot of money. But, it's not going the way you planned it either. So, you think about things and decide
8/4/2019 Essentials of Trading the Afternoon Market
http://slidepdf.com/reader/full/essentials-of-trading-the-afternoon-market 12/91
on (what appears to be) a reasonable course of action. You decide to hold the trade until the next day.
You just turned a day trade into a swing trade. You turned a one-day strategy into a two-day (at least)
strategy. But, let's be honest here - if it was a real strategy to start with, then you would have gotten out witha small loss when it moved against you. What you're really doing is more like throwing darts and you'rewilling to wait and look at the scroreboard tomorrow.
If the scenario I just described sounds at all familiar to you, then I'm going to be honest with you. You needto make some changes in the way you're trading. Because, if it hasn't happened to you already, eventuallyyou're going to wake up one day and find that a trade like this has moved against you in a big way.Depending on the number of shares you purchased, it could cost you Big Time. But even if it's only a fewhundred shares, I'd like to give you a few questions to consider.
(1) How much does a trade like this really cost you? Remember to weigh the loss you sustained plus the
worrying you did multiplied by the number of days you held this losing trade. Then add in the money youdidn't make while your equity was tied up in a losing trade and throw in the loss to your self-confidence as atrader because "maybe I don't have the discipline to trade the markets after all". Wow, pretty damaging isn'tit?
(2) Have you ever measured the damage? Do you keep track of your wins and losses, your average gain per trade and your average loss per trade? Do "held-over" trades like this one help these statistics or make themworse?
(3) When you hold a trade overnight like this one, then do you tend to worry about it? Do you wake up inthe morning, anxious to check the pre-market trading to see if the trade has broken even yet?
(4) What is the psychological cost of a held-over trade? Are you doing something you've promised yourself never to do again, and yet here you are doing it again?
Those are just a few of the questions worth asking.
Now, how do I know to ask questions like this? Because I've been there and done that. You're in the same boat that a lot of other traders are in when they trade the afternoon market. They don't have a strategy for buying and selling stocks in the afternoon session and they end up rationalizing their way into an overnighttrade, despite their best intentions.
So how do you stop doing this?
Well, I wouldn't be talking about this if I didn't think this course would help you. And I sincerely think youneed it, if the scenario I described in today's message sounds at all familiar to you.
I'll put it to you in simple mathmatical terms for you. If this course helps you earn 1% on a $25,000 trade

8/4/2019 Essentials of Trading the Afternoon Market
http://slidepdf.com/reader/full/essentials-of-trading-the-afternoon-market 13/91
next month, then it will pay for itself. And it should help you earn much more than that because you'll beusing the information in this series over and over again. You'll be a more informed trader. You'll be a smarter trader. You'll protect yourself from bad trades and see things in the charts that you've never seen before. As
a result, you'll make more money and lose less money.
4. Traders take on more risk than normal.
In the last point, I talked about the danger of letting a day trade turn into a swing trade. Letting this happen isone example of taking on risk. But, there's a very real pshychological reason why traders do this in theafternoon session. And that's what I want to talk about today.
First, I'll ask you what happens when you have a good morning in the markets? Let's say you made one or two excellent plays. Maybe you made a few hundred or even a few thousand dollars in the morning session.You feel good, right? You feel confident, like David who slew Goliath. You are the victor and you canalmost hear the theme song to Rocky playing in the background.
Second, I'll ask you what happens when you have a bad morning in the markets? Let's say you shorted astock and suddenly the market rallied and the stock you shorted just went through the roof. You finally sell it,after waiting too long to get out of it. You lost money and you feel terrible about it. This is not a play you're proud of.
Well, because we are emotional beings, the emotions created by either scenario can be very dangerous to your health and your wallet. Let me tell you why. If you had a great morning and you made plenty of money, thenit is the tendency of most traders to feel over-confident. You begin to get this feeling that you can conquer anything and nothing can stand in your way. I'm exaggerating of course. But you get the idea.
The natural tendency is to want to repeat that feeling. Right? That rush of adrenaline and that sense of success feels so good that we want to repeat it and repeat it quickly. For a moment, we see ourselves at thecasino tables, making all the right calls and we think that this is our lucky day. And then...Boom...that's whenit happens. We rush into a trade. We're too quick on the trigger. We fail to stop and analyze the trade set-up before getting in. And now, suddenly, the stock is moving against us and our emotions are riding a wellgreased roller coaster.
Back to the other scenario. Let's say we did poorly in the markets in the morning session. What is the naturaltendency of the day trader? He/she needs to make up for the loss. Right? We show our determination tosucceed by getting right back in there and making another trade. And we're right to do that - right after wefigure out what we did wrong on the bad trade. Jumping back into a new trade too suddenly, we run the risk
8/4/2019 Essentials of Trading the Afternoon Market
http://slidepdf.com/reader/full/essentials-of-trading-the-afternoon-market 14/91
of treating the market like a casino table. We begin to think it's a matter of playing the odds (it's not).
There is also the added pressure of not wanting to disappoint our significant others, be they friends or family
members. We feel the pressure to make up for money we lost. After all, it's their money too. And you'retrying to make money to support them and provide a better life for them. And now you feel terrible becauseyou just flushed some of it down the toilet. That's when you need to recognize the stress in your body, faceup to the negative emotions swirling around inside of you, and just s-t-o-p. Stop. Calm down. Review thetrade. And if you cannot calm down enough to make a sensible trade, then take the rest of the day off. If youdon't, then you're likely to do the same thing all over again.
So, to summarize, one of the landmines of the afternoon trading session is the temptation to take on too muchrisk. When you combine these swirling emotions with the fact that you're physically tired, then you create a pretty combustible situation. So, be careful.
5. Traders are trying to play the same, tired stocks they played in the morningsession.
I have already talked about afternoon fatigue. Part of this, of course, depends upon which part of the country(or the planet) you live in. Personally, I live in the same time zone as the U.S. markets, in the Eastern timezone. So, two o'clock really is two o'clock - and afternoon lethargy is a factor.
But part of our boredom can be from the fact that we're not looking at anything new in the afternoon.
Most traders begin with some sort of morning list of stocks. These may be from "late breaking news", pending earnings reports, market scans, rumors, etc. But most traders are still using those stocks for theafternoon session. And I think this contributes to the boredom. You've been looking at this same list of stocks all day. Perhaps you've traded one or two of them. And your perspective on these stocks is not fresh.
Perhaps you've had the following experience. You're looking at a stock on the 5-minute chart. You'relooking for patterns, technical indicators, or whatever it is you use to assist you in trading. And then, maybewhen you're reviewing your trades in the evening, you look back and see a move that was so obvious youcan't believe you missed it. It was right there in front of you the whole time. But you didn't see it.
Do you know why this happens? I call it the "deer in the headlights" look. You know, you're staring atimpending danger but you're transfixed and unable to do anything about it. You have been staring at the samething so long that it could hit you with a 2-by- 4 and you still wouldn't know what hit you.

8/4/2019 Essentials of Trading the Afternoon Market
http://slidepdf.com/reader/full/essentials-of-trading-the-afternoon-market 15/91
Well, part of this is from not treating the afternoon session as a brand new day. That's right. Think about themorning session. You're excited, right? You can't wait to get in there and discover what the market is goingto do today. You can't wait to jump in there and watch some charts and try to figure out some patterns and
make some profit.
So, what if you split the trading day into two different compartments? What if someone threw a whole newlist of 20 stocks at you and said "go at it". Your mind would jump into gear. It's a whole new set of problems - a whole new mental challenge. That is part of the fun of trading, isn't it? It's the mental challenge.It's the game we want to win. It's the adrenalin rush of competing. So, if you are given a whole new set of stocks to examine and you are given a whole new set of criteria for trading them, don't you think your mindwould pick up the challenge? Don't you think it would energize your afternoons and your trading?
It works for me. That's all I can tell you. And the reason I mention it is that most traders don't trade thisway. Most traders are using the same old watch list from the morning session. They are looking for patterns
in the same tired stocks they've been looking at all morning. And yes, you can find some plays in those oldstocks. I'm not saying they're worthless. I'm just saying that our minds are rejuvenated when we look for awhole new set of problems to solve. And a new list of stocks can help cure our lethargy as well as increaseour profits.
This leads to the natural question "So, which stocks do I choose for the afternoon session?"
For me, any volatile stock that is moving is an interesting stock. You can't trade a stock that's sitting still or trending sideways. You also want to make sure it has a certain amount of volume or liquidity so you can exitthe trade before the market closes. And you want price points that tend to allow for 1% price movementswithin an hour or less. You put all of that together in some scanning software, shake it up, and out pours a
fresh list of stocks every afternoon. (Yes, one of the lessons in this book is devoted to "finding stocks worthtrading".)
Then you take the trading criteria I teach for the afternoon session and you start trading. Your mind begins tostart moving. You've got a limited time window for executing some trades, so there's no time to just sit back and watch. You've got to dig in there, study, analyze, and discover. And then you've got to make thedecisions to go long or sell short and then take some trades. You limit your losses. You hold nothingovernight. And, over time, you get pretty good at the afternoon challenge and you begin to pocket someextra cash. That's the game. And it's fun...once you understand it.
In this video series, Trading the Afternoon Market, I reveal the exact criteria I use for scanning the afternoon
market. Ever since I started using it, I've never lacked for stocks, fresh stocks, to put into my watch list. Andeverything I'm saying is true - you mind is freshly engaged, you're more alert, and your profits go up. Of course, getting enough rest the night before also helps.

8/4/2019 Essentials of Trading the Afternoon Market
http://slidepdf.com/reader/full/essentials-of-trading-the-afternoon-market 16/91
6. Traders feel that if they are sitting at home in front of their computers then
they need to be trading something...anything.
When I quit my day job to start day trading full time, I created a problem for myself. It was a problem I didnot anticipate. It was a problem for which no one gave me a warning. But it was a problem.
You see, I have a strong work ethic. Even now, though I don't have to work as much as I do, I'm stillworking. If I'm not trading, then I'm leading chat rooms, working on my web site, recording videos, writing books, writing articles, etc. It's not that I'm a workaholic. I take plenty of time to enjoy life, be with family,and exercise. But I do have a strong work ethic. Maybe you're the same way. You didn't start day trading in
order to be lazy. You started day trading because it offered a unique way to make money from home -though I'm sure there were other factors involved.
If you combine a strong work ethic with a home-based business, then you have to be a wise steward of your time. You might work too much for example, not taking time for your family. You might tinker with this or that, instead of using the time wisely.
But, when you are working from home as a day trader, then there's another problem. You might feel asthough you have to be constantly trading. Sitting in front of your computer and not having your equity atwork - why, that just doesn't feel right. So, feeling the need for your money to be "in play" at all times, youcan end up making some pretty stupid choices. You can become reckless, rather than strategic.
I say this from experience. That's how I used to be. I felt that idle money was wasted money.
This problem can be exasperated by personal economic pressure...i.e. the need to pay the mortgage. If youare day trading out of the same account from which you are paying bills (not a good idea), then the pressureto be constantly trading is even greater. This intermingling of funds just adds to the pressure you're alreadyfeeling. You can feel as though you're trading next month's mortgage, and that is not a good place fromwhich to be day trading. So, my recommendation is that you have a trading account that is separate fromyour family account. Otherwise, your "need to trade" can turn into a compulsion to trade. And you begin totake on the wasted look of a gambler who's seen one too many gin and tonics and far too many roulettewheels.
The discipline I'm talking about is similar to the person who sits at the dinner table and "enjoys" eating a littletoo much. Discipline requires this person to push away from the table - to recognize one's limits, to feel thefeelings that go off inside of us when we know we've over-indulged.
Likewise, the day trader has to learn when to push away from the table. It's okay to get out of a trade and
8/4/2019 Essentials of Trading the Afternoon Market
http://slidepdf.com/reader/full/essentials-of-trading-the-afternoon-market 17/91
turn off the computer at 12:30 in the afternoon and be done for the day. Yes, it really is okay. There is nolaw that says you must sit at your computer for eight hours a day and pretend you're in an office cubicle.Take a break. Go grab some lunch. Celebrate the fact that you have the freedom to create your own
schedule. Give up on your compulsion to trade.
I'll be honest with you. Some days...I don't feel it. Some days...the charts just aren't speaking to me.(Thankfully, this doesn't happen very often.) Other days, I can do no wrong. I see things that amaze other traders. I call with pinpoint precision the exact point at which a stock will turn and go in the other direction.But every day's not like that.
So, when I am "in the zone", I make good use of that time. I trade all day long. I trade because of the sheer joy of trading. And I make plenty of money. But occassionally, it feels like work. I can still trade with a profit, but it doesn't feel brilliant. I haven't changed the strategy...I just don't SEE it.
The reason I share these things with you is because you won't hear many people talk about trading in this way. No one wants to admit the things I admit. No one wants to admit that they have a bad day every now andthen. No one wants to admit that it's not always easy and profitable. But, the way I see it, you need to hear the truth. You need people to be honest with you. And you need to hear that it's okay not to trade everyminute of the day. It's okay to take an afternoon off. It's okay to have a sick day. It's okay to push awayfrom the table.
Hey, if I don't tell it to you, then who will?
So, there's no need to be a compulsive trader. Idle money is not wasted money. Poorly traded money iswasted money. Money traded without a clear strategy - that is wasted money. But leaving your money
parked in your account for a while because you don't see a worthwhile trade or because you need some timeoff - that's okay.
7. Traders expect too much from the afternoon session.
I've already mentioned a couple of reasons why traders might expect too much from the afternoon session.They may be trying to make up for losses incured earlier that day. They may feel the pressure to make somemoney to pay the bills.
But, you can get into trouble by expecting too much from the afternoon session. Normally, the afternoonsession provides plenty of volatility for trading. And we need volatility in order to be able to trade.Otherwise, it's like trying to sail a boat without any wind. To have the opportunity for creating gains, theremust be volatility. But, HUGE volatility does not typically happen in the afternoon trading session. Why is

8/4/2019 Essentials of Trading the Afternoon Market
http://slidepdf.com/reader/full/essentials-of-trading-the-afternoon-market 18/91
that? Well, most financial news is released early in the morning. In the early morning, the market is sortingout any news that occured over the past 17.5 hours since the market closed. That's a lot of time. Earningsreports may have been issued. Government reports on unemployment might have been released. National
and international events may have caused hope or fear among traders. So, the morning session has a lot toferret out.
By the time the afternoon session arrives, the market has usually figured out its repsonse to that morningnews. The market will have a trend established. There are exceptions to this, of course. Extremenervousness among investors can cause the market to go down in the morning and up in the afternoon, andvice versa. But I teach a way to chart the markets. So, if this happens, you are fully prepared. And, asalways, you want to trade along with the rest of the market sentiment. You don't want to argue with themarket.
But, let's get back to my main point. Since the afternoon market tends to be a bit more stable, and less
volatile, we have to trade accordingly. The big gains of 3% to 5% are not as likely to occur after two o'clock.(This doesn't mean they never happen however. As I type this, I am watching one of my trades gain nearly5% in just 15 minutes - it's true.) There is simply not enough news to cause this sort of movement. So, gainsof 1% are more frequent. That being said, however, achieving a 1% gain in the afternoon session is great.And if you can do this several times each afternoon with a few different trades then all the better. Adding thatto your morning profits can help you end up with a very profitable day.
The good news about lower volatility though is that this lower volatility means lower risk for you. I'm sureyou've had the experience of buying a stock and watching it turn against you almost instantly. Although thiscan happen at any time, it is less likely to happen in the afternoon session due to the lower volatility of themarket. This also means that certain technical indicators work better in the afternoon market than in the
morning market, due to this stability. So, you have to know which indicators are the most important ones towatch. (Yes, I cover multiple indicators in the video series too.)
Well, this is the final landmine I'll cover with you. I hope you have picked up some pointers along the wayand learned a little bit about trading the afternoon market from reading these seven points. The main reasonfor covering these landmines is to set them out for you to reflect upon. Being honest with yourself and your tendencies as a day trader can help you improve your profits.
Now, on to the main course.

8/4/2019 Essentials of Trading the Afternoon Market
http://slidepdf.com/reader/full/essentials-of-trading-the-afternoon-market 19/91
Lesson Two
Support & Resistance
Today's video is divided into two parts. The first part contains the text from the material below. I havecreated it in both video and text formats, depending on your preference for learning. The second part of thevideo contains charts and material not covered in the text below.
In last week's video, we looked at the outside of the puzzle box to get a mental picture of our goal. Today,we begin to assemble that picture and we begin with Support and Resistance. We'll use S/R for shorthand.The general rule for drawing S/R lines is that they connect at least three separate points on a chart. For daytrading, we sometimes only see two points. But, the strength of the line is revealed by the number of times price has touched that line without going past it.
So, for example, if you are looking at a 5-minute chart of a stock, and you see that the 5-minute candles havetouched the price of $20.80 four times within the last hour without being able to move past it, then you knowthat's a pretty strong line of resistance for this stock today. It doesn't mean price cannot go past it. But, after the third attempt, the traders of this stock are probably convinced that price is not going to go higher than this
price today. So, they sell or short, based on this line of resistance.
Most chart technicians use S/R lines when looking at daily chart configurations. They'll draw Trendlines,showing how price continues to bounce off a certain line as the price climbs up the charts. You'll also see S/R lines drawn on the daily charts to show points of price where the stock is expected to fall (meet withresistance) or bounce (find support).
But you won't find many people who talk about using S/R with day trading. The time frames (such as the 1,5,or 10-minute charts) are thought to be too tight, not enough information for the lines to make sense.
But, what you'll discover in this video, is that S/R lines can be a huge benefit to trading the afternoon stocks.Though these lines are difficult to spot in the morning session, there is plenty of information by the afternoonsession to make use of them. And here's the reason. The afternoon session is typically less volatile than themorning session. The afternoon session tends to be a continuation of an earlier pattern. There are times, of course, when the afternoon session is very volatile. And I have seen the last half hour of trading produce bigger and better results than the previous five hours combined. But, usually, this is not the case. Usually,individual stocks will tend to follow the path they've established from the previous four or five hours of

8/4/2019 Essentials of Trading the Afternoon Market
http://slidepdf.com/reader/full/essentials-of-trading-the-afternoon-market 20/91
trading.
I call it the self-fulfilling prophecy of stock trading. We see it all the time. I mentioned that you'll see Support
and Resistance lines used more often with daily charts. Do you know part of the reason why the stock retreats at those lines of resistance? Answer: because everyone thinks it's going to retreat at that line of resistance.
For example, if you are holding a stock long as it approaches a certain line of resistance, and you've been toldthat price could fall back at this point, are you more likely to sell at that point of resistance or hold and seewhat happens? Well, if you've already made money on the trade, then you're more likely to sell at that point.Why risk losing the money you've already made. So, you'll get as close as you can to that point of resistance,and then you'll sell and take your profits.
Of course, you are not the only one who thinks this way. Hundreds or even thousands of other traders are
looking at the same stock, and the same lines, as you. They are thinking the same way as you. And whenother traders start to sell as price approaches the line of resistance, the "prophecy" of price meeting resistanceis fulfilled. This selling causes other traders to sell, before they lose their profits. In this way, selling at the point of resistance becomes a self-fulfilling prophecy. In short, that which we thought would happenhappens
because we caused it to happen. And so the cycle continues.
There is nothing wrong with a self-fulfilling prophecy - not in the stock market anyway. It actually provides alittle bit of sanity to an otherwise crazy bit of price movement. I actually enjoy the fact that other traders participate in these little things. It makes my life much easier. I am able to position myself in the right placeat the right time and take advantage of these price movements. If I believe that others are going to sell at this point of resistance, then what am I going to do? I'm going to short at the point of resistance. I short the
stock that others are selling. I make money as price is going down. They take the profits they've alreadyearned. Everyone is happy.
This self-fulfilling prophecy occurs with other indicators as well. And we'll get into those in later videos. Butthat is what makes my job all the easier. I use a variety of technical indicators. Each one may be favoredmore by certain traders than others. Some may like the S/R lines. Some prefer the MACD. Others likeBollinger Bands. That's fine with me because I use all of them. And when they all come together to producea "perfect storm", then my job is even easier. I use this fact about self-fulfilling prophecies with multipleindicators to trade right along with other traders. I get multiple confirmations from multiple indicators. Andthis increases my odds of being on the right side of the trade at the right point in time.
You'll see how all of this fits together as we move through this video series. But, for now, let's focus oncommon points of Support and Resistance. First, I will explain nine types of Support and Resistance. Thenwe'll take a look at them on actual charts, so you can see real examples.
1. Intraday High. As individual stocks trade back and forth in price, they will sometimes rise to a certain

8/4/2019 Essentials of Trading the Afternoon Market
http://slidepdf.com/reader/full/essentials-of-trading-the-afternoon-market 21/91
point and fall back again. This top price of the day is called an intraday high. Once a stock has resisted this price point, it tends to continue to resist this price point. A move past this line is a very bullish sign.
There are other factors involved, of course, such as how the market is trending, financial newsannouncements, etc. And we will discuss these when we get to the video on Contextual Trading. But, for now, just know that a stock's intraday high can be a point of resistance.
2. Intraday Low. This is the opposite of the last point. As shares are exchanged during the trading day, asort of floor is established by the market for that stock's intraday low. This line often becomes a line of support for the stock later in the day.
3. Channels. Sometimes, a stock's price will trade in a set channel, going back and forth between two lines.As with these other S/R lines, this is true on daily charts as well as intraday charts. So, if you see a stock thatis trading between these two lines, then you play the reoccuring pattern. You can buy long when price hits
the bottom line and you can short when price hits the top line.
I repeat...there are other indicators we watch to improve our accuracy in these trades. So, don't take a small piece of this information and think you've discovered the Holy Grail. This is just one piece of the puzzle.
4. Ascending Trendlines. If a stock continues to trade higher throughout the day, a trendline can be drawnalong the base of the lower candles. Depending on other factors, price may continue to bounce off of thisascending trendline, offering an opportunity to trade the stock long. Or, if price breaks through the trendline,it may offer an opportunity to trade the stock short.
5. Descending Trendlines. Same thing...different direction. If a stock is declining in price, it will tend to
continue in that direction in the afternoon session. A trendline can be drawn that connects the top sides of several candles to help you visualize the pattern. As price touches the descending trendline, it offers anopportunity to short the stock and profit as price continues to fall. If price breaks through the trendline, thenthose who have shorted the stock will tend to cover their shorts and push the price even higher. So, it wouldthen be an opportunity to buy long.
6. The top side of the Bollinger Bands. Bollinger Bands are used by many traders to determine points of support and resistance. When a candle touches the top line of the Bollinger Band, then price often retreats.You can think of these lines as "comfort zones". As price pushes to the top of the Bollinger Bands, it is pushing the edge of its comfort zone. So, price tends to contract back to what is normal for that stock.
7. The bottom side of the Bollinger Bands. When price touches the bottom line of the Bollinger Bands,then traders tend to think that the stock is oversold and undervalued. So, price may bounce at this point to push the price back within a "normal" range. As you'll see, however, price can push the Bollinger Bandshigher or lower. Price does not always bounce off those lines.
8/4/2019 Essentials of Trading the Afternoon Market
http://slidepdf.com/reader/full/essentials-of-trading-the-afternoon-market 22/91
8. The mid-line of the Bollinger Bands. Most chart services will show a hash line between the top and bottom Bollinger Bands. I call this the mid-line or the meridian. I have mentioned it in my other books. ButI like to think of this as the meridian in a highway. It takes a lot for a stock to push through this line. But,
once it is on the other side, it tends to stay on the other side. I'll show you examples of what I mean. But, for now, just know that this BB mid-line is a powerful example of either Support or Resistance.
9. The 18 Simple Moving Average. Traders use a variety of moving averages on their charts. And I don'tthink this is one that a lot of traders use. But, I have found it to be a powerful S/R line for a lot of stocks.Can't really explain it. It is often similar to the mid-line of the Bollinger Bands. But it is not the same line.So, I will often use this line in conjunction with other indicators to determine where price is headed.
Now, if you have never used Support and Resistance lines much in your trading, then you are probably a bitoverwhelmed right now. You're probably thinking "how the heck am I going to keep all of this straight? You
mean I've got to draw nine different lines on every stock to figure out what it's going to do next? And this is just one of your indicators? Give me a break..." Okay, calm down. It's going to be okay. I'm going to showyou examples of what I'm talking about in just a minute.
Here's the thing. You will be aware of all these possibilities. But you will not use every line on every chart.If you want to simplify things, then you can group them together into just four categories: (1) High/low of the day, (2) Ascending/descending trendlines, (3) Channels, and (4) Bollinger Bands. I just broke it down intonine separate categories so I could talk about each one.
Now that we've covered the nine types of Support and Resistance, it's time to look at some charts. Again,we're only looking at S/R lines in this video. We're not combining it with any of our other indicators. And it
is this combination of indicators that gives us our real strength and accuracy. But, for now, I want you to begin to see these lines on some intraday charts.
Sample Charts of Support & Resistance

8/4/2019 Essentials of Trading the Afternoon Market
http://slidepdf.com/reader/full/essentials-of-trading-the-afternoon-market 23/91
The chart for FAZ is an example of a stock hitting an intraday high line of resistance. You can see how pricekept rising to $59.50. But, every time it got to that point, it bumped its head on the ceiling and could not goany higher. You can see how price hit that line several times, further confirming the resistance each time.
When you see intraday high lines of resistance, then it keeps you from getting into a stock at the wrong time(i.e. just as its about to meet resistance). Instead, you would know to consider shorting the stock at that line.

8/4/2019 Essentials of Trading the Afternoon Market
http://slidepdf.com/reader/full/essentials-of-trading-the-afternoon-market 24/91
The chart for INTC is an example of a stock hitting its intraday low line of support. Every time price gets tothat level, it tends to bounce back up, like a rubber ball bouncing off the floor. It's important to point out thatthe line of support is not drawn at the lowest price, where the shadows of the candle dip below $15.80.Rather, I have drawn the line where it seemed to have the most contact with the most candle fragments (either the bottom of the shadow or the bottom of the body of the candle). Some chartists would tell you to use thesolid body part of the candle for these alignments. But, for day trading, I think you can use both.
When you see lines of intraday support like this, then it gives you added confidence in entering the trade.Knowing this, you would not want to short this stock just as it was approaching the line of support. Thatwould increase your risk. There are many other considerations, as you will learn in this book, but this line of resistance is a very strong one.

8/4/2019 Essentials of Trading the Afternoon Market
http://slidepdf.com/reader/full/essentials-of-trading-the-afternoon-market 25/91
The chart for FINL is an example of a price channel. You can see how price pings back and forth between thetwo blue lines. Each orange circle shows an example of the ping. The blue circle shows how price finally broke out of that channel, and the 4% price gain that occured after that break-out. This is an example also of how the line of resistance then became the line of support, as price found support before it even came back down to the top blue line.
You can use channels in your trading to play a single stock multiple times, both short and long. It can alsohelp you find break-out stocks that have the potential for sizeable gains.

8/4/2019 Essentials of Trading the Afternoon Market
http://slidepdf.com/reader/full/essentials-of-trading-the-afternoon-market 26/91
The chart for PAAS is an example of an ascending trendline. As with any trendline, you connect the body parts of multiple candles to see the pattern of support. So, for an ascending trendline, the line is drawnunderneath the candles.
Seeing these ascending support lines, you can enter the trade at a more opportune moment. Rather than buying at the candle peak, you can set specific entries that roughly align with the line of support. But you can
also use these lines to see when a trendline has been broken, giving you an opportunity to short the stock. Forexample, look at the 3% profit that occured after 1:00 on July 9th.

8/4/2019 Essentials of Trading the Afternoon Market
http://slidepdf.com/reader/full/essentials-of-trading-the-afternoon-market 27/91
The chart for XRAY is an example of a descending trendline of resistance. The line is placed at the tops of the candles. Every time price comes up to that line, it hits its head and retreats - until the bullish candle of June 10th breaks that line. This chart also shows you an example of a multi-day trendline. Some day tradersfocus so much on the tightly viewed 1-minute charts that they fail to see the larger picture of a stock. Thusthey miss the bigger trends that can result in larger gains.
Once you see this pattern in a stock, you can watch for two things. You can watch for price to hit the ceilingagain, creating an opportunity to short the stock. You can also watch for price to break out of this pattern,which could force some short covering and thus profit by buying it long.

8/4/2019 Essentials of Trading the Afternoon Market
http://slidepdf.com/reader/full/essentials-of-trading-the-afternoon-market 28/91
The chart for PNFP is an example of a stock meeting resistance at the tops of the Bollinger Bands. I've drawn blue circles on the chart to illustrate the four times, over a two day period, that the stock hit that upper line.And you can see what happened to price after that point. The second blue circle shows an afternoon tradethat made 2% profit after hitting that upper line.
Once you know that a stock may meet some resistance at that upper line, you can better set your target prices.
Yes, a stock does not always stop at that line and there are other indicators to inform you (as you'll learn), it isstill a line of importance. As I've already mentioned, it can also give you a possible short set-up if you're paying attention.

8/4/2019 Essentials of Trading the Afternoon Market
http://slidepdf.com/reader/full/essentials-of-trading-the-afternoon-market 29/91
The chart for PRSP is an example of a stock finding support at the bottom line of the Bollinger Bands. Thethird blue circle illustrates how price can push those lines lower though. You can see how the Bollinger Bands give way to the downward price pressure. But, eventually, the stock stops the downward spiral and bounces off that line.
Knowing this, you can watch for opportunities to buy stocks long, based on these lines of support. You can
also know your possible price targets for covering your short trades. Just be aware, as in the example above,that price can go lower and there are other indicators you'll need to watch as well.

8/4/2019 Essentials of Trading the Afternoon Market
http://slidepdf.com/reader/full/essentials-of-trading-the-afternoon-market 30/91
The chart above for ORLY is an example of a stock finding support at the mid-line of the Bollinger Band.This mid-line can act as either a line of support or resistance, depending on how the stock has been trading.But, in this example, it is a line for support.
Combining this line of support with other indicators, you would have more confidence in buying this stock long, at the point of that support. You can see how the third blue circle entry would have given you a price
gain of 60 cents in that last hour of trading on July 8th.

8/4/2019 Essentials of Trading the Afternoon Market
http://slidepdf.com/reader/full/essentials-of-trading-the-afternoon-market 31/91
This is the same chart of ORLY, but with an extra line. I've added the 18 EMA (exponential moving average)line to this chart, though I usually use the 18 SMA (simple moving average). Some might say this is splittinghairs, but I find that the 18 SMA is sometimes a more responsive line than the mid-line of the Bollinger Band -though they are very close, as you can see. It functions in the same way as the mid-line of the Bollinger Bands, giving you confidence in entering this trade as a long play.
This is the end of Lesson Two. I suggest that you review this material and apply it to some real-time charts before moving on to the next lesson. You can also use this information to review your own trades, seeing if might help you make more precise entries and exits.

8/4/2019 Essentials of Trading the Afternoon Market
http://slidepdf.com/reader/full/essentials-of-trading-the-afternoon-market 32/91
Lesson ThreeContextual Trading
Today's video is divided into two parts. The first part contains the text from the material below. I havecreated it in both video and text formats, depending on your preference for learning. The second part of thevideo contains charts and material not covered in the text below.
Welcome back. In video # 1, I gave you a visual overview for trading the afternoon market. I also talkedabout the seven landmines that await you when you trade in the afternoons. In video # 2, we looked at ninedifferent lines of Support and Resistance and talked about self-fulfilling prophecies.
In this video, we'll look at something I call "Contextual Trading". The benefits of using Contextual Tradingare many.
1. You gain more confidence in your trading.2. You trade with the market instead of fighting it.3. You trade with more accuracy.4. You increase your profits with a larger time perspective.
Here's the basic idea behind Contextual Trading: everything happens in the context of something else. Thiscontext may be an environmental context or it may simply be a larger world view than the one you're currentlylooking at. Now, I know that sounds very vague and confusing at this point, so let's break it down and get
specific.
There are three different areas that make up Contextual Trading. You may be trading this way already - you just never had a name for it. But, in this video, I want to bring it out in the open and talk about it. I want togive it a label because, when we give it a name, then we can talk about it.. Then we can pay attention to it.

8/4/2019 Essentials of Trading the Afternoon Market
http://slidepdf.com/reader/full/essentials-of-trading-the-afternoon-market 33/91
And something we might be doing unconsciously becomes part of our toolkit for trading stocks.
So, here are the three basic elements of Contextual Trading.
1. All stocks trade within the context of a larger market. "Duh," you may say. But let me ask you aquestion. What tools are you currently using for becoming aware of this larger market? Do you constantlyflip back to your broker's home page to scan the market numbers? Do you chart the major indices, just as youwould an individual stock? Is it possible that you could do a better job of trading stocks within the context of the larger market?
Let me tell you why this is important. In the morning session, stocks can take on their own path. They can bevolatile and soar to new heights or fall to new lows, irregardless of what the rest of the market is doing. Andthis can happen in the afternoon session as well. But it is much less likely to happen. For the most part,stocks follow the trend of the overall market. If the Dow found its high for the day at eleven o'clock this
morning and it has been falling lower ever since, then this will impact the stocks you choose and the type of play you'll want to do in the afternoon session.
For example, if the Dow has been falling since eleven o'clock, then you will tend to look for stocks that areencountering lines of Resistance. If the market is falling, then you generally will want to be on the short sideof the market. So, the ideal short is a stock whose price candles are encountering a line of Resistance. Torefresh your memory from the last video, these would include descending trendlines, the top line of a pricechannel, or the mid-line of a Bollinger Band.
Since a stock needs to be strong to cross through these lines, it is unlikely to happen when the rest of themarket is going downhill. Why would this stock show strength now when it has been weak all day? Instead,
those who had refused to sell the stock before, hoping for a market rally, will now sell it as they see themarket collapsing, before they lose more money than they have already.
As always, there are specific indicators we have to look at, in conjunction with this contextual observation.But, I don't want to assume that everyone viewing this video knows what I've just mentioned. And perhapsyou already know it, but how much are you using it in your trading? As I said, this context of the larger market is more important during the afternoon session than at any other time during the day.
There are two rules that some traders have for implementing this "Contextual Trading" concept. One is"Never short a stock when the market is positive". And the other one is its opposite, "Never go long on astock when the market is negative". So, for example, if you see that the market is trending up on a certain
day, then you would not want to "go against the flow" and short a stock on that day - not as a day trade. Itdoesn't mean that there are no shorts available. But, the reasoning goes, why fight the market? Just keeplooking until you find a trade that is going along with the rest of the market. Likewise, why go long when themarket is in a downturn? Since gravity would work against you in that situation, just go ahead a find a weak stock worth shorting.

8/4/2019 Essentials of Trading the Afternoon Market
http://slidepdf.com/reader/full/essentials-of-trading-the-afternoon-market 34/91
Later, in today's video, I'll come back to this topic and show you examples of this market context.
2. Technical indicators can give different messages depending on which time chart you're viewing.
This may be an obvious point as well. But, again, I have to ask how much you're actually using this fact?
For example, many day traders like to use the 1-minute charts in their trading. And, if your trading system is built on scalping stocks (quick surgical trades that seldom last more than a few minutes), then you mayseldom look at the 5-minute or the 15-minute charts. But, I'd encourage you broaden your world view. The1-minute chart you're viewing occurs within the context of a 5-minute chart. And the 5-minute chart occurswithin the context of the 15-minute chart. It takes five candles on the 1-minute chart to make one 5-minutecandle, etc.
You might look at the 1-minute chart and the RSI on that chart tells you the stock is very strong. RSI is at80% and pushing higher. But, if you look at the 5-minute chart, you discover than RSI is just beneath the
30% line. This stock could burn out in just a few seconds because it doesn't have the strength yet for a longer trend upwards. It could happen. But, right now, it involves too much risk and so you decline the trade. Youdecide to wait for more confirmation from the 5-minute RSI before you get involved.
Yes, you can use the 1-minute chart as your primary window. But I'd encourage you to trade that chartwithin the context of the larger window. Know where the stock seems to be headed on the larger, macroscale. Trade within that context. Your trades will last a little longer. Your gains will be larger. You'll payless in transaction fees. And you will become much more accurate in your trading.
3. Using multiple indicators gives added confirmation. I've already mentioned this. But it bears
repeating. We do not look at just one indicator or one time frame. We look at multiple indicators in multipletime frames before executing the trade. This may seem like a lot of work at first. And it will probably pushyour limits a bit if you're not accustomed to it. But, once you get comfortable with the material in thesevideos, as we build one element onto another, you'll start getting more comfortable and more proficient. Itwill slow you down just a bit. But, often, this is a good thing for the afternoon market. You have time tostudy and plot and look at different windows and indicators. And, as a result, you'll make more money.
Let me give you an example of this. Let's say you're using the 1-minute charts and you see a stock where the price seems to be bouncing back up. So, you're thinking of swooping in and riding the price back up becauseyou like to buy stocks long and you don't like shorts. Well, you can do this of course. But if you had lookedat the 5-minute chart, then you'd see that the 5-minute RSI seems to be maxed out on strength. Then you
look at the 15-minute chart and you see a descending trendline. You realize that the better play would be letthe price go up a bit and then short it at the next 1-minute peak. Since this is the larger contextual trend for this stock and the 5-minute RSI is already maxed out, then this would be a safer, longer, more profitable tradefor you.
There's another valuable point to Contextual Trading. Traders are always asking me about a methodology for

8/4/2019 Essentials of Trading the Afternoon Market
http://slidepdf.com/reader/full/essentials-of-trading-the-afternoon-market 35/91
exiting the trade. In other words, "When should I sell?" It's always a judgement call, of course. And there isno easy trick for capturing the maximum profit on every trade. But using Contextual Trading can help youand here's how. Once you know and understand some of the key indicators, you may see them maxing out on
a 5-minute chart. You may see RSI near 100% and you think "surely this cannot continue - guess I better sell". But, you would now know to expand your view. Look at the next chart out, say the 10 or the 15-minute chart. From this perspective, RSI may only be 50% and not maxed out at all. You might want to takesome profit here and move your stop up to protect yourself. But why would you exit the trade now when theindicators are showing a solid rally for this trade? This one little point alone can help you create more profitsin your trades.
So, you should have an idea now of what I mean by the phrase "Contextual Trading".
Sample Charts of Contextual Trading

8/4/2019 Essentials of Trading the Afternoon Market
http://slidepdf.com/reader/full/essentials-of-trading-the-afternoon-market 36/91
The chart of $INDU is a chart of the DOW. Charting services use a variety of symbols to chart the DOW.You might prefer to chart the S&P500. But, the major indices usually move together. The important thing isto have a chart of the market in front of you at all times. Now that you know more about support and
resistance, you can apply this information to the broader market.
In the above chart, I drew a line of support at 8100 because that was a line of support that I had seen on previous trading days. Historical lines of support can become important when you're looking at the larger market. And it places your individual stock trades within the context of the larger picture, thus improvingyour profits.
Seeing the larger context on July 10th, as the DOW found its support line at 8100 once again, I know that thismight be a good time for buying stocks long. So, the DOW's movement provides the context for myafternoon trades.

8/4/2019 Essentials of Trading the Afternoon Market
http://slidepdf.com/reader/full/essentials-of-trading-the-afternoon-market 37/91
The chart of FAS shows an ETF trading within the context of the DOW's movement. Since this ETF oftentrades in tandem with the larger market, it gives me a reason to enter the trade as a long trade around noon onJuly 10th, earning just over 2% before it met with its intraday high line of resistance. So, this chart gives you
an example of combining the last two lessons (support/resistance & contextual trading) to make a nice gainwithin the first hour of the afternoon session.

8/4/2019 Essentials of Trading the Afternoon Market
http://slidepdf.com/reader/full/essentials-of-trading-the-afternoon-market 38/91
The 5-minute chart of LMDIA that you see above is the first of three charts I'm going to show you for thisstock. They are all screen shots from the same day, but they provide three different time perspectives. Andwhat I'd like you to notice is how the time chart you are viewing can give you a different perspective on when
to exit the trade. One of the things I've noticed with many day traders is that they exit the trade too quickly,not obtaining the full profits that were there for them. And the reason is that they are not using contextualtrading. They are not viewing the stock from multiple time levels. They are so focused on the 1-minute chart,that they fail to catch the larger movements that allow for some fluctuation in price.
So, the above chart of LMDIA shows the 5-minute perspective. This is a one-day chart, on the same day asthe $INDU chart I just showed you. And you can see how price found support around 12:30 on that greenline. So, if you were looking at the 5-minute chart that is shown, then you would know that price might meetresistance at that mid-line of the Bollinger Bands, where the red line is drawn. You would make a profit bymaking that your target. But your target would only be 8 cents.

8/4/2019 Essentials of Trading the Afternoon Market
http://slidepdf.com/reader/full/essentials-of-trading-the-afternoon-market 39/91
The above chart of LMDIA is the same stock from a 10-minute perspective. Setting a price target at the mid-line of the Bollinger Bands here, gives you a possible 20 cent profit.

8/4/2019 Essentials of Trading the Afternoon Market
http://slidepdf.com/reader/full/essentials-of-trading-the-afternoon-market 40/91
The above chart is the 15-minute time perspective. Setting the target price at this mid-line of the Bollinger Bands gives you an even larger profit of 25 cents.
Please understand that I'm not advocating exiting every trade at the mid-line of the Bollinger Bands. That isnot my point. My point is just to illustrate how stocks can be viewed in the context of larger time windowsand that those larger windows can give us a reason to stay in the trades longer and gain larger profits.
While using multiple time frames to view your trades, you also keep one eye on the broader market context,letting this information inform your trading decisions.
If you are new to the idea of contextual trading, then it will take some time and patience on your part to getused to it. But, once you get comfortable with it, your profits will increase.
Before moving on the next lesson, I suggest that you practice using all of the information you've already
learned. Start with paper trading before you start using real money. Get comfortable with the ideas of support/resistance and contextual trading before you add in more information. It's sort of like math class. If you're confused now, then you'll really be confused later. So, take the time to study this material several timesif necessary before moving forward.

8/4/2019 Essentials of Trading the Afternoon Market
http://slidepdf.com/reader/full/essentials-of-trading-the-afternoon-market 41/91
Lesson Four RSI & Stochastics
In our second video, we looked at Support and Resistance lines. And we noticed that these lines oftenrepresent turning points, or pivot points, for the stocks we're following. So, as price approaches the mid-lineof the Bollinger Bands from the underbelly of that line, we know that it takes a lot of strength for the stock tomove past that line. We also discovered that a line of resistance can become a line of support. We saw that inthe last video when we looked at Contextual Trading and we studied how the Dow has responded to the 8100line in the first half of 2009.
So, how do we determine if a stock is going to go past a line or retreat from it? Knowing the line is there isone thing. Predicting what price will do when it hits it is another thing.
As we move through this video series, we'll be adding layers of indicators to try and help us solve this problem. Using a combination of indicators gives us more confidence in our decisions. Rightly interpreted,these indicators can raise our success rate in trading to new highs. These indicators become part of our Contextual Trading theory and help us in making wise decisions.
The two indicators that we'll look at today are RSI (Relative Strength Index) and Stochastics. Used inconjunction with Support and Resistance lines, these two indicators will add clarity and confidence to our trading. So let's get started.
RSI
Depending on the chart service you are using, your charts may have RSI labeled differently. It is sometimescalled Wilder's RSI, after the guy who created the formula. Some will call it simply Relative Strength or

8/4/2019 Essentials of Trading the Afternoon Market
http://slidepdf.com/reader/full/essentials-of-trading-the-afternoon-market 42/91
something else. But RSI is just what it claims to be. It measures the strength of the stock. Some chartingservices will allow you to determine the "relative" part of the formula. For example, do you want to measure"relative to the Dow Jones 30" or "relative to another stock within the same sector". Your charting service
may not allow you to specify this part of the equation and that's okay. The default settings from your broker will work just fine, except that I suggest a tighter period setting for day trading.
Most charting services will allow you to specify the period setting for the RSI. You can test various periodsand see what works best for you. But, for the purpose of day trading, I typically use a very tight setting of 4or 5. The lower the number, the more whipsaws you'll experience. But, it also lets you know more quicklywhen a change is likely to occur.
In my trading, I have found that drawing three lines on the RSI portion of my chart is helpful. The three linesshould be drawn at 30, 50, 70 if possible. You will see these lines drawn on the charts in the videos. Andhere are the general interpretations for those three lines.
* If a stock has been falling in price, and RSI has fallen below the 30% line, then a rise above that line isconsidered bullish, or strong.
* If a stock has been falling in price, and RSI turns at the 50% line in order to go back up, then this isconsidered bullish.
* If RSI falls below 70%, then this can mean that price will soon dip. If it continues to break through the50% line, then it is certain that price will continue to fall.
* RSI can stay above the 70% line or below the 30% line for extended periods of time. And price can
continue to climb or fall, respectively, with little change in the RSI percentages once they are at these twoextremes. But, it is the movement between these two lines that generally represents the best opportunity for profit because price will follow this movement.
I will show examples of these settings in action once we get to the videos.
Stochastics
The simple definition of Stochastics is that it reveals overbought and oversold situations to the trader. So, insimple terms, when Stochastics are near the top of their window, then the stock is said to be overbought. If it
is overbought, then buyers will stop bidding the price higher and the asking price is likely to be compromised.When this occurs, of course, price begins to fall. I won't go into the mathmatical forumla behind thisindicator, but it would be accurate to say that it reflects if a stock is moving in or out of its recent pricecomfort zone.

8/4/2019 Essentials of Trading the Afternoon Market
http://slidepdf.com/reader/full/essentials-of-trading-the-afternoon-market 43/91
Likewise, when the Stochastics indicator is near the bottom of the chart, then the stock is said to be oversold,which represents a buying opportunity for someone who has been waiting for a better price. Some chartingservices will allow you to control the settings for Stochastics. For day trading, I use 5 for the %K line and 3
for the %D line. But, you can use your system's default settings or play with these numbers to see whatworks best for you.
On the charts used in this video series, you will see RSI and Stochastics plotted together. I do this simply because it saves space. But I also plot them together because the signal is clearest when these two indicatorsact in unison. So let me explain that.
When I see Stochastics rising to 80% while RSI is still at 40%, then what could happen next? The stock could become overbought before solid strength is allowed to build. Instead, I strongly prefer that these twoindicators move in unison, moving together from the bottom of the chart and rising up and through the 30%line. I also like to see the angles of both indicators pointing as steeply up as possible and I want them to do
this together. If the Stochastics indicator is pointing sharply up at a 75% angle, and RSI is pointing only at a45% angle, then it doesn't mean the stock will not rise in price. But, if I had to choose between two stocks,then I would choose the one where the indicators are moving together, with the sharper angle the better.
I mentioned, in our last video, the concept of Contextual Trading. As we move into a discussion of varioustechnical indicators, it is important to remember that the indicators will give different readings depending uponthe time window of the chart you are viewing. For example, RSI may be above 50% on the 1-minute chart, but it shows 20% on the 5-minute chart. This is because the 5-minute chart represents the average of the last5 minutes on the 1-minute chart. So, you have to be careful not to jump the gun here. Remember the basicrule: the larger the time chart, the more certainty in the interpretation. The RSI on a 1-minute chart canchange quickly and dramatically. But the RSI on a 10-minute chart will give more certainty.
So now you have two more indicators to add to your charts. As we add layer upon layer to your charts,wthout doing them all at once, you will gain more clarity regarding how they function and you will learn whatweight to give the various indicators in your own trading.
Sample Charts of RSI & Stockastics

8/4/2019 Essentials of Trading the Afternoon Market
http://slidepdf.com/reader/full/essentials-of-trading-the-afternoon-market 44/91
In the chart above of FAST, I've combined RSI and Stochastics in the bottom portion of the window. RSI isthe green line. You'll see that I use various chart settings for RSI and Stochastics, but they are usually tighter than the default settings of most charting services. Any good charting service will allow you to establish thesettings you prefer. For day trading, however, I like to use tight settings of 4 or 7 for RSI.
This chart shows us multiple things, as we begin to layer our charts with more information in order to gainmore accuracy in our trading. The first thing to notice is how price responds to the three lines of theBollinger Bands. The three orange circles point this out for you.
On the RSI and Stochastic portion of the chart, I've circled the horizontal lines of 30 and 70. I want you tosee how price falls as RSI and Stochastics fall below this 70 line. Price continues to fall through the mid-lineof the Bollinger Bands as RSI and Stochastics continue their descent. There is nothing to support an upward price movement (and a reason to cover the short trade), until RSI starts to point back up and eventually

8/4/2019 Essentials of Trading the Afternoon Market
http://slidepdf.com/reader/full/essentials-of-trading-the-afternoon-market 45/91
moves through the 30 line.
Then, for guidance on when to exit the trade, we look at RSI as price comes back up to the mid-line of the
Bollinger Bands. With RSI still rising and finding support above the 50 and 70 lines, we have no reason toexit the long trade until the end of the day. So, by combining S/R (support/resistance) information withRSI/Stochastics, we could have played this one stock in both directions. We could have shorted it for 2% profit when price and indicators collapsed at the top of the Bollinger Bands. And we could have played itlong for an additional 2% profit in the later part of the afternoon.
In the chart of LEAP, we see a stock that kept meeting resistance at the mid-line of the Bollinger Bands. Youcan see how RSI just barely touches the 70 line, as Stochastics become maxed out, and price encounters the

8/4/2019 Essentials of Trading the Afternoon Market
http://slidepdf.com/reader/full/essentials-of-trading-the-afternoon-market 46/91
line of resistance. The same thing happens again around 3:00, providing a second opportunity to short thisstock for multiple gains.
In the chart above of MASI, you can see how price just kept rising all day. The reason I am showing you thischart is to illustrate how RSI and Stochastics are staying above the 70 line for an extended period. And this is
the 15-minute view of this stock. If you viewed the same stock in a larger context, then you would see slowlyrising RSI and Stochastic lines. But here's the main reason for showing this to you: RSI can stay above the70 line for an extended period of time. Just because it goes to 70 does not mean you have to sell the stock.And viewing the same stock and the same indicators from a larger contextual time frame will help you decidehow long you can stay in the trade for maximum profits.

8/4/2019 Essentials of Trading the Afternoon Market
http://slidepdf.com/reader/full/essentials-of-trading-the-afternoon-market 47/91
Lesson FiveMACD, Volume, & Money Flow
Today, we add three more technical indicators to our arsenal of tools. And once again, they are areaswatched by other traders. So, a confirmation from these signals means that other traders will be trading rightalong with us as we buy long or sell short.
The three indicators we'll look at today are MACD, Volume, and Money Flow.
MACD
MACD stands for Moving Average Convergence Divergence. Other than Bollinger Bands, I would guess it is
the most widely used indicator used by traders. Traders like the movement of the lines. And when it works,it seems to work perfectly. But, there are times when the MACD is useless, so you need to be aware of this.And there are intricacies of this tool that many traders have not discovered. So, let's take a look at thisindicator.
Some charting services will allow you to plot the MACD as either two intersecting lines and/or a series of bar graphs (called a Histogram). There are three numbers to any MACD setting and some charting services willallow you to change these settings for your suitable time frame. The MACD uses exponential movingaverages which are figured slightly differently than simple moving averages. EMAs are thought to be moreatuned to the current state of the stock, than SMAs, by some traders.
Here's the main problem with the MACD. It is a trailing indicator. It's value as a forward-pointing tool islimited to the merit that so many other traders give to it. As such, its main value is as a self-fulfilling prophecy.
Now, that may seem harsh to those of you who swear by it. But if you think about it for a minute, it is

8/4/2019 Essentials of Trading the Afternoon Market
http://slidepdf.com/reader/full/essentials-of-trading-the-afternoon-market 48/91
compiling the moving averages of price that have preceeded this point in time. It does not show strength or volume or the rapid change of price. But it does create these nice curved lines that can lull us into believingthat they work every time. They don't.
The morning trading session is not our focus here, but I'll use an example from there. The next time you see astock gap down by 15 or 20%, watch the MACD. Even if price moves sideways from there all day, or even itit continues to drop, the MACD will eventually flatten out, curve up, and cross over - leading you to believethat price is going up when actually it is not.
So why do I include it in our discussion? Two reasons, one of which I've already mentioned. We need tokeep our eye on indicators used by other traders, because this can be a catalyst for their trading. But thesecond value is as a confirmation of price trend and when to exit the trade. Sometimes it's nice to have asimple visual tool and the MACD provides that for us. When price enjoys a nice slopping upward climb, we'llsee the MACD lines slowly rising and when price levels out and reaches a calm top, then the MACD will
reflect this and go to a horizontal line. Depending on the context of your time chart, this may mean that pricehas reached its level of resistance and therefore it's a visual sign to exit the trade without incurring more risk.
There are a few details about the MACD which can help you as well. The CD part of MACD stands for convergence/divergence. As you see the gap widening between the two lines, you have a visual confirmation(usually) that price is still heading higher and therefore exiting the trade now might be a premature move.You might find it more profitable to wait until the lines come closer together, but before they actually toucheach other. (Contextual Trading will tell you to examine several time charts before reaching a conclusion.)
Another detail is the signal line of the MACD. When the fast line of the MACD comes through the signalline, you will often see an increase in volume and price. This may be due to automated trading since this is an
easy signal upon which to base a computerized trade. But if the MACD lines begin to curve and flatten out before it reaches the signal line, then be careful. When the MACD lines are above the signal line, it isconsidered bullish. It is bearish when it is below. But, I would advise you to pay closer attention to thecrossover patterns.
Crossover patterns with the MACD are often watched by traders. And, for the afternoon session, these can be meaningful due to the lower levels of volatility. When the fast line of the MACD crosses up and throughthe slow line, then it means (usually) that the average price of the stock is going up. Likewise, if that line fallsthrough from the top, the price has probably peaked and is ready to fall.
Volume
To keep it simple, we can say that volume confirms the trend. So, if volume is rising while price is rising, thendemand for the stock is creating a seller's market. The sellers know that they can demand a higher price for
8/4/2019 Essentials of Trading the Afternoon Market
http://slidepdf.com/reader/full/essentials-of-trading-the-afternoon-market 49/91
their stock and so they tend to do this. Why should they sell when price is still going up? The law of supplyand demand creates higher prices when demand is high.
Likewise, high volume also occurs when holders of a stock are quickly unloading their shares. They arewilling to sell their shares quickly in order to get out of their position. This is a bargain hunter's paradise, asnew buyers try and wait until the lowest price possible befor jumping in and buying their shares.
I find that indicators which measure pure volume are of little help. Instead, I prefer volume indicators thatinclude other features. Some of these are propietary in nature, meaning they are only available from certainchart services. Volume indicators can carry different names. But I will mention two.
1. TSV = Time Segmented Volume. This is a propietary indicator from worden.com that combines volume, price, and time. As the line moves from low to high and passes through the 50% line, it shows that investorsare having an escalated interest in owning these shares. As the line moves below the 50% line, it shows that
interest is waning.
2. PVT = Price Volume Trend (also called PVT). You can find this indicator at www.freestockcharts.com.This free chart service is apparently owned by worden.com also. And the indicator appears to be very similar to the TSV indicator listed above. (The name kind of gives it away.) I've included a separate video on usingPVT in conjunction with Money Flow for trading stocks.
Money Flow
This indicator can also go by many names. Chaiken's Money Flow is the standard and deserves the credit.Sometimes it is simply called Money Flow. And the idea is that money flows either into or out of a stock. If
the balance of the flow is bullish, then the indicator goes up and price rises as demand for the stock increases.Likewise, if the balance of the flow is bearish, then the indicator goes down and price retreats as demand driesup. This is often plotted with a 50% line drawn horizontally on the chart. As the indicator moves up andthrough this line, then price will soon follow. As it moves down and through the line, then price will soon fallalso.
In Video 5C, I've created a special look at PVT and Money Flow. Then, in the Video 9 series, you'll see itused quite a bit as we discuss specific entries and exits.
Sample Charts of MACD, Volume, & Money Flow

8/4/2019 Essentials of Trading the Afternoon Market
http://slidepdf.com/reader/full/essentials-of-trading-the-afternoon-market 50/91
In the above chart of $INDU, I've combined the standard settings for MACD (12.26.9) along with a tight RSIsetting of 4. While the MACD provides a nice even pattern of price changes, it is trailing indicator. So, it provides a more conservative approach to price trends. But it fails to catch the earliest changes in priceindicated by the tight RSI indicator. You can change the settings on MACD of course. But sometimes this

8/4/2019 Essentials of Trading the Afternoon Market
http://slidepdf.com/reader/full/essentials-of-trading-the-afternoon-market 51/91
gives too many head fakes, or false moves.
The chart above of RVBD is given to show two things. First, notice the diverging bands of the MACD in the
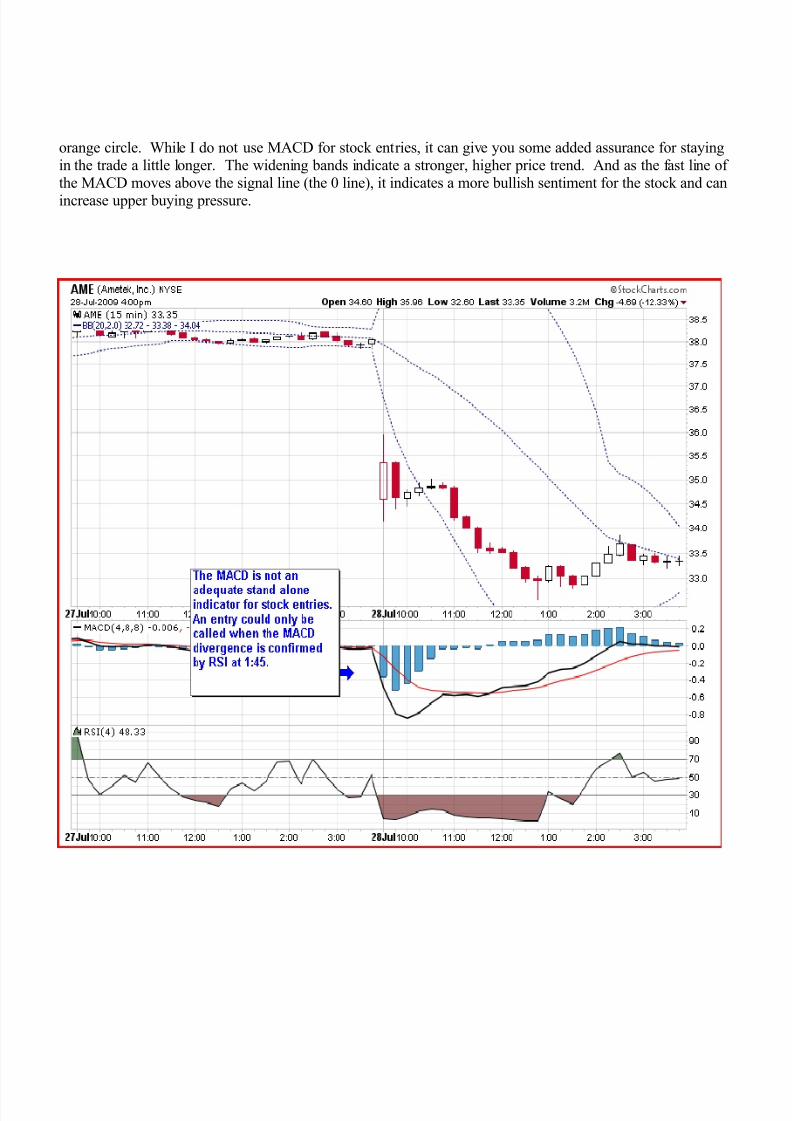
8/4/2019 Essentials of Trading the Afternoon Market
http://slidepdf.com/reader/full/essentials-of-trading-the-afternoon-market 52/91
orange circle. While I do not use MACD for stock entries, it can give you some added assurance for stayingin the trade a little longer. The widening bands indicate a stronger, higher price trend. And as the fast line of the MACD moves above the signal line (the 0 line), it indicates a more bullish sentiment for the stock and can
increase upper buying pressure.

8/4/2019 Essentials of Trading the Afternoon Market
http://slidepdf.com/reader/full/essentials-of-trading-the-afternoon-market 53/91
The chart of AME is included to simply show the weakness of using the MACD as a stand-alone indicator.
You can see how the MACD forms a confirmed bottom and then a cross-over pattern between 10:00 and12:00, while price continues to fall. (This is using a slightly tighter MACD setting.) But RSI does not getabove the 30 line until around 1:45, which is when price actually starts to rise. So, I include this just to showyou the limitations of this simple indicator. In short, it doesn't always work for entering the trade.

8/4/2019 Essentials of Trading the Afternoon Market
http://slidepdf.com/reader/full/essentials-of-trading-the-afternoon-market 54/91
In the chart of LOGI, I've included the standard volume bars on a 15-minute chart. In this case, decreasing
volume supports the downward trend in price, as well as the MACD crossover pattern in the morning.Around 3:00, volume picks back up and price rises, even though the MACD lags behind in reflecting this pricechange.

8/4/2019 Essentials of Trading the Afternoon Market
http://slidepdf.com/reader/full/essentials-of-trading-the-afternoon-market 55/91
In the chart above of FAS, I'm showing the 10-minute context for this stock. You can see how RSI bouncedoff the RSI line of 30, while price bounced off the mid-line of the Bollinger Bands. Then RSI stayed abovethe 70 line as price continued to climb for a 5% profit.
The two charts that follow will show you this same stock using freestockcharts.com and the PVT (price
volume trend) indicator with MF (money flow). First I'll show you the 5-minute perspective and then I'll drilldown to the 2-minute perspective.

8/4/2019 Essentials of Trading the Afternoon Market
http://slidepdf.com/reader/full/essentials-of-trading-the-afternoon-market 56/91
You can see how price bounces off the pivot line of $75.75. At the same time, PVT climbs higher andeventually passes through the signal line. RSI is plotted in the bottom part of this chart along with a movingaverage indicator of RSI. You can see how RSI crosses over its own moving average, while PVT rises, and price bounces off the pivot line - all in unison.

8/4/2019 Essentials of Trading the Afternoon Market
http://slidepdf.com/reader/full/essentials-of-trading-the-afternoon-market 57/91
In the chart above, you see the same stock from the 2-minute perspective. And you can see how PVT andMF move up through that red line, while RSI shows another crossover of its moving average. So, this is thesame stock, but from a tighter time persective. By using PVT and MF, you can drill down to an exact entry point for trading this stock long. Exiting at the first pivot line drawn would have given you a profit. But, by backing up to the 10-minute context, you would get plenty of reasons for staying in this trade while it gaveyou a 5% profit.
8/4/2019 Essentials of Trading the Afternoon Market
http://slidepdf.com/reader/full/essentials-of-trading-the-afternoon-market 58/91
Lesson SixQuoteTracker
We have spent a considerable amount of time studying indicators. We have looked at lines of support andresistance and how the indicators help us determine when to enter and exit the trade. In this session, we willlook at how to find stocks that you can trade for the afternoon session.
I treat the afternoon session as the second half of the trading day. Usually, the morning gap stocks have played out by lunch time and we need a fresh set of stocks to examine. We could chase the news sources and
build a stock watch list from this news. We could continue to look at the same old tired stocks we looked atin the morning. But, I think the best thing is to use a stock scanner that gives us stocks that meet certaincriteria.
So let me give you a list of the kinds of stocks I like for the afternoon session.
* They are NASDAQ stocks* The price range is $5 to $25* The minimum daily volume is 500,000 shares per day* These stocks are forming certain patterns. They may have crossed over a line of support and
resistance. They may be climbing up or falling down. They may be climbing and then suddenly reverse their
course.
By establishing criteria such as these, I narrow the number of stocks that I have to look at. And yet, I amgiven enough stocks to fill my quote grid window with a new group of stocks. I don't want to beoverwhelmed. But, I do want more than just a handful. So, a list of 20 to 30 stocks is a good number for the

8/4/2019 Essentials of Trading the Afternoon Market
http://slidepdf.com/reader/full/essentials-of-trading-the-afternoon-market 59/91
afternoon session.
We will get into specific trading strategies in our next session. The purpose of locating these stocks is just to
get some stocks in front of us that are moving. We don't care if they're moving up or down. We just wantmovement. So, the scanning crtieria will give us stocks that fit the above criteria. But first, a warning. Thescanner gives us a list of stocks to watch. The scanner does not tell us when to enter and exit the trade.These decisions are made based upon the technical indicators we've spent so much time studying. So, don'tthink that you can just place a trade as soon as you see the stock pop into your scan. The scan just gives us alist of qualified stocks. It does not make the judgement call regarding when to enter and exit the trade.
Today's video will show you how to set up a scan window inside of quotetracker.com. Quotetracker offers afree service with ads. Or, you can pay a small fee to get the service without ads. The main reason for usingQuotetracker is to have access to trade-ideas(TM). You can also gain access to trade-ideas by going to their web site, www.trade-ideas.com and paying the monthly fee for real-time scans. Or you can use the free
service at quotetracker.com and receive 20-minute delayed information. Real-time is better, of course. Andsome brokers will allow you access to trade-ideas windows on their own platform. Scottrade, for example,allows direct access to trade-ideas in real-time for its platinum users. Other charting services allow you to setthese crtieria in a scan as well. So, today's video will show you how to set up the scan using quotetracker. If you have access to better tools, then you can adapt the information in today's video to your own resources.
As a side note...you can also use quotetracker and trade-ideas to perform swing trade scans. Or you can useit as you create your own trading strategies, now that you have learned so much about trading with thetechnical indicators. It is a very rich resouce and I use it every day in my trading.
I've included a few screen shots of QuoteTracker to help guide you.
Once you're inside of QuoteTracker.com, then you'll see the Tools menu item. Once you click on that item,you'll see Trade-ideas listed. Once it opens up, the right click inside the screen to configure a new scan.
As you move through the various trade-ideas headers, you'll find lots of options for your scan. You can usethe settings listed in the above document, or choose your own. The next two screen shots give you someexamples from the Select Alerts menu. (Be sure to click the OK button after you've made all of your selections, and after you've removed all of the default choices.)

8/4/2019 Essentials of Trading the Afternoon Market
http://slidepdf.com/reader/full/essentials-of-trading-the-afternoon-market 60/91

8/4/2019 Essentials of Trading the Afternoon Market
http://slidepdf.com/reader/full/essentials-of-trading-the-afternoon-market 61/91
Using just a few of these ideas, you'll be able to scan for "stocks on the move" and find plenty of stocks worthtrading.
Just remember, stock scanners simply give you a basket of stocks that meet certain criteria. The scanner doesnot tell you when to place the trade. But, even if you are using the delayed data version of trade-ideas asfound inside of quotetracker, you can still use this information to find stocks for trading in the afternoonsession.

8/4/2019 Essentials of Trading the Afternoon Market
http://slidepdf.com/reader/full/essentials-of-trading-the-afternoon-market 62/91
Lesson SevenMoney Management
Before we launch into our Eight Specific Strategies for Trading the Afternoon Market, I want to discuss someimportant matters.
First, I want to discuss special situations for the afternoon session. For me, the afternoon trading session begins around 12 or 12:30 each day. Almost half of the trading day is over at this point, and the marketmakes a change in temperment. In the morning session, beginning with pre-market trading, the market isdigesting the world news from the previous sixteen hours or so. A lot has happened. And the market spendsthe morning session determining its reaction to that news. By the time we get to the afternoon session, muchof that termperment has been decided upon. There is less volatility - usually. The stocks that made such asplash in the morning session may now appear boring. And often very little news is issued that can upset the
course of the day.
However, you should be aware that news can break at any moment. The more serious the news, the larger the impact. For example, whenever the Federal Reserve meets and issues a statement regarding interest ratesat the end of their two-day session, then the market can be very volatile. For this reason, I seldom hold stocksduring the announcement period (generally on a Wednesday afternnoon at 2:15 PM). I do not enter trades just before the Fed announcement. And I wait for the market to settle a bit before re-entering the market.The reason for this is that sudden changes in the market direction can mess with your technical indicators.But they can also cause unwarranted excitement in the trader, causing the trader to over-react to volatilemarket sentiment.
Other news events can have their impact as well of course. The FDA, for example, might approve a new drugthat fights a certain disease. This will not affect the overall market, but it can cause huge volatility inindividual stocks related to the new medicine. So, I mention these things so as not to assume the obvious.
Second, I want to discuss money mangement. Trading any new strategy takes time to master. Do not expectto be an overnight success. Be patient with yourself and review your trades. In time, you will improve.

8/4/2019 Essentials of Trading the Afternoon Market
http://slidepdf.com/reader/full/essentials-of-trading-the-afternoon-market 63/91
But the other thing you can do is to paper trade these new strategies before you begin to use real money.After you feel comfortable with the paper trades, then you can gradually move into using the strategies with
real money. And even there, you can progress slowly, using a small amount of equity at first. I know thetemptation to rush in too quickly, excited about the money you will be making. But, so that you do not losemoney and your personal confidence, I suggest you use small amounts of equity in the beginning.
Here are four basic rules related to money management.
a) Do have a target exit on every trade. My basic rule is never enter a trade unless I think I can makeat least 1% profit on it. I let the indicators tell me when to enter and exit the trade. If a 1% profit is not possible from the trade set-up, then I look for another trade. But I also watch the indicators to determine myexit point. The indicators may tell me that price is going to continue to go up. I will keep the trade alive aslong as I am confident of this. I won't exit the trade just because it hit my target. But the target is something
I watch closely, because it is based on lines of support and resistance.
b) Do have a metal or fixed stop on every trade. If you lack the discipline to exit the trade when itgoes against you, then you should start out with a fixed stop that is determined at the time you enter the trade.This stop will be based on lines of support and resistance. Let stops be your friends, keeping your losses fromturning into huge mistakes. While a loss is always tough to swallow, it is better than letting the loss linger onand driving you crazy with the nagging question of "What should I do now?" Personally, I prefer mentalstops because I don't want to get stopped out by sudden price changes. But you must have the discipline tostill exit the trade when the indicators give you proof that the trade is going against you. This also means thatyou do not have to wait for price to hit your stop before you exit the trade. Losses can be kept to less than1% per trade very easily if you will simply let the indicators tell you when they no longer support your trade.
c) Do not try to make up for previous mistakes. In other words, don't double up your equity after alosing play. This is not a game of cards. Rather, my suggestion is that you use the same amount of equity onevery trade. Don't use the same number of shares. Use the same amount of equity. This will give you a truer measure of your progress as well. If you use the same amount of equity on every trade, then your profits willincrease along with your skills. Otherwise, you might put too much equity into a bad trade and not enoughinto the good one.
d) Do not average down. If you're not using this technique already, then great. Don't start. Butsome traders "average down", which means they buy more of the same stock at a lower price if/when thestock goes against them. This gives them a lower average price per share. The problem is that this will work
sometimes and cause you to think it's a good strategy. But it can also burn you and cause you lose even moremoney. It destroys the "same equity per trade" concept I just mentioned. Other than that, it's just sloppytrading. When you average down, then you are not accepting the fact that you made a bad trade. You arehoping to get lucky and get out without losing any money. And you are trading with a good deal of stress asyou frantically try to hold onto the losing trade and salvage it. So, although I averaged down in my first year of trading, I never do it now. The better tactic is to cut your losers off quickly, before they cause much

8/4/2019 Essentials of Trading the Afternoon Market
http://slidepdf.com/reader/full/essentials-of-trading-the-afternoon-market 64/91
damage.
Third, I want to encourage you to review your trades. The way you do this is very simple. Print an end-of-
the-day chart for every stock you purchase. Circle your entry and exit candles. Study the indicators. Thenwrite a short paragraph detailing exactly what you did well and what you did poorly. This review, if you takethe time to do it, will help you make huge progress in becoming a profitable day trader. If you tend to exittrades too quickly, before the indicators say the play is over, then you'll see this repeated over and over inyour reviews. If you tend to jump the gun, getting in ahead of the proper indicator confirmations, then thiswill show up as well. You simply cannot study your own trades too much.
While some traders take the time to measure their profits on each trade, few take the time to review their entries and exits. So, be different. Take the time to do this each day you execute a trade. Put each examinedchart into a 3-ring binder. Then, at the end of the week, review these trades as a unit. Look for your personal patterns. Look for ways to improve. Coach yourself toward success.
Fourth, let your day trades be day trades. If you entered a trade because you thought it could make at least1% that day, then don't hold that trade over until the next day - or the next, or the next. There are manyreasons for this and I will talk about a few of them here.
a) Your mistakes can be your greatest teachers. Our goal is to make profitable trades. Sometimes,that means admitting when you're wrong. That means you let the failures be failures. You study the mistakesand the failures so that you do not repeat them too often in the future. You do not hold the trade overnight,hoping a little luck swings your way. These mistakes can be your greatest teachers because they carry the pain of loss. Losing money makes you snap to attention. It makes you sharper. It is the path toimprovement. But, if you slide these losses into other days and try to ignore your mistakes, then you will
progress very slowly.
b) Equity is your inventory. If all of your inventory (cash) is tied up in a held over trade, then you arenot free to trade again. You have to wait and exit this other trade. In the meantime, you missed several other trades in which your equity could have been put to good use, earning you money. So, don't tie up your inventory with losing trades.
c) Good luck is bad for you. I'm sure you can point to examples where you held a trade overnightand it worked out fine for you. That's a problem. You got lucky. You're forgetting the times when it didn'twork out. And then you begin to think that trading is about luck, instead of skill. Then you're in realdangerous territory and you might as well go ahead and fly to Las Vegas and dump your money into a slot
machine. Trading stocks is not about luck. So don't depend on it or hope for it or think you deserve it.Learn to trade with skill. Let that be your advantage.
The fifth and final thing I want to mention in this video is just to encourage you. Don't give up. Day tradingcan provide you with all of the material things you want in life. It can provide you with enormous financialgain. But you don't get there quickly. And you don't get there by gambling with your money and taking

8/4/2019 Essentials of Trading the Afternoon Market
http://slidepdf.com/reader/full/essentials-of-trading-the-afternoon-market 65/91
unnecessary risks. You get there by learning how to trade.
Here's a measurement tool for you to use. There are two important criteria you need to measure in your
trades. Are you executing more winning trades than losing trades? And, is the percentage loss on your losingtrades smaller than the percentage gain on your winning trades? In other words, you want to win more timesthan you lose, and you want your wins to be bigger than your losses. These are the percentages that revealyour skill level in trading - the same sort of percentages you would follow if you were a professional baseball player. Know your stats. Improve your playing. Don't give up.
Lesson EightEight Strategies
We have spent a lot of time looking at charts and coming to understand some of the basic technical indicatorsfor trading stocks. As a result of your study, you know more than many people who have been trading stocksfor years. So, congratulations for making it this far and staying with the program.
In this lesson, we put it all together. We give names to eight different strategies for trading the afternoonmarket. Everything we have covered until this point has been preparation. It would not have made any senseto you if we had started here. But now, with the knowledge base you have built up, we can bring it alltogether and discover how to make money with this information.
That said, let me also say this. It will take time for you to get comfortable with these strategies. You will notexecute them perfectly every time. But, you will see much more than you ever saw before. The correctness
of your trading will improve. Your profits will grow. But it will take time. One of the most important thingsyou can do is to review each and every trade you execute. Print a copy of the chart with the indicators wehave studied. Use colored markers and draw on the charts, pointing out the various indicators. If you will dothis sort of homework with every trade, then I guarantee that your trading will improve.

8/4/2019 Essentials of Trading the Afternoon Market
http://slidepdf.com/reader/full/essentials-of-trading-the-afternoon-market 66/91
In this lesson, we look at four different strategies. The name of the strategy is not important. But giving eachstrategy a name can make it stick in our mind.
Strategy # 1: The Bollinger Band Bounce
You have been looking at Bollinger Bands in all of our charts. And you have seen this strategy on several of our charts. But the basic idea is this: price tends to stay within the comfort zone of the Bollinger Bands.Because of this, when price encounters the mid-line or the bottom line of the Bollinger Bands, then it tends to bounce off this line. It is true that price can also fall through these supports. So, for confirmation, we look toour other technical indicators to see if they support a bounce or not.
The critical aspects of this strategy are:* A positive market context is helpful, but not required. So, it is best if the overall market is also
going up.* Price is encountering either the bottom line or the mid-line of the Bollinger Bands.* RSI and Stochastics are moving above the 30% line. Ideally, MACD lines are above the signal line,
but this is not required.

8/4/2019 Essentials of Trading the Afternoon Market
http://slidepdf.com/reader/full/essentials-of-trading-the-afternoon-market 67/91
The chart above of TRAK provides an example of the Bollinger Band Bounce. The orange arrows point out
how price has been bouncing off the mid-line of the Bollinger Bands all day. Red candles appear at the top of the Bollinger Band, signaling resistance. But then price finds support each time and rebounds on the mid-line.RSI turns up around 1:30, before it touches the 30 line to give an added strength signal. And the MACDturns up before it ever gets to the signal line. All of these are signs of strength and give reasons for tradingTRAK long at that bounce.

8/4/2019 Essentials of Trading the Afternoon Market
http://slidepdf.com/reader/full/essentials-of-trading-the-afternoon-market 68/91
Strategy # 2: The Assumed Short Squeeze
If you have ever short sold a stock, then you know the panic that ensues when you see price starting to climb.You rush in to cover your short before price wipes out your gains. In this strategy, we take advantage of thissimple truth. You are not the only one who panics and rushes in to cover the short. Hundreds of other traders are rushing in to do the same thing. Combine this with new buyers who are coming in to takeadvantage of the price run-up, and you have a stock that climbs much quicker than the rest of the market.
The critical aspects of this strategy are:* A positive market context is required for this trade. This helps to create the pressure
on the short sellers who need to cover their shorts.* The stock has had a recent downward thrust in price. This makes us assume the presence of many
short sellers. This downward thrust may have been happening for only a day or two.* RSI and Stochastics are moving rapidly through the 30% line, creating a sharp upward angle.* The pace of the price increase is greater than the rest of the market.

8/4/2019 Essentials of Trading the Afternoon Market
http://slidepdf.com/reader/full/essentials-of-trading-the-afternoon-market 69/91
The chart above of JAH shows the Assumed Short Squeeze in action. You can see how price has been fallingfor two days and we can assume a certain amount of short selling accured during that period. So, we know
that if the stock breaks through that descending trendline of resistance, then it could cause some shortcovering. That occurs shortly after 2:00 on August 6th. You can see the bullish candle that leads up to thedescending orange line around that time. RSI, Stochastics, and MACD all confirm the movement higher, asRSI finally moves above 50 and then above 70.

8/4/2019 Essentials of Trading the Afternoon Market
http://slidepdf.com/reader/full/essentials-of-trading-the-afternoon-market 70/91
Strategy # 3: The Earnings Run-Up
As companies present their quarterly earnings reports, there is a certain phenomenon that occurs. The priceof the stock can rise as it approaches this report. The few days before the report is released can be especiallyvolatile for the stock. So, you can go to any of your financial web sites and get the earnings calendar thatshows the dates for stocks reporting their earnings. Since there are hundreds of companies listed on somedays, you have to edit the list. Pay special attention to the companies expected to report positive earnings, or earnings that might beat estimates. Add these stocks to your watch list and wait for the usual bullish signals.
The critical aspects of this strategy are:* A positive market context is helpful, but not required.* The general idea is that the price of a stock rises ahead of its earnings report, especially if that
report is expected to be positive. The charts will tell you if this is true for this particular stock.* Wait for the usual bullish signals (RSI and Stochastics above 30%, etc.) before entering the trade.* Flip between various time frame charts to make the most profit from this pattern.

8/4/2019 Essentials of Trading the Afternoon Market
http://slidepdf.com/reader/full/essentials-of-trading-the-afternoon-market 71/91
ANF was scheduled to release its earnings report the next day. As you can see in the chart above, price rose
throughout the day, prior to that report. A good entry into the stock is given around 2:00, when price bounces again, supported by RSI, Stochastics, and MACD.

8/4/2019 Essentials of Trading the Afternoon Market
http://slidepdf.com/reader/full/essentials-of-trading-the-afternoon-market 72/91
Strategy # 4: The Tired Descender
We all like to buy stocks long. And we llike to pull for the underdog too. But sometimes, though a stock istrying real hard to cross the line (the meridian in the Bollinger Bands highway), it just can't do it. It runs outof steam right at that critical moment. It's like the high school football team that runs the ball all the way tothe two yard line, but just can't quite get the touchdown. So, this becomes an opportunity to short the stock as it wearily descends in price and gives up one more time.
The critical aspects of this strategy are:* The market context for this is usually negative, but it can happen anytime. A market that has
rallied and lost steam provides the ideal context.
* In this play, we take advantage of a stock that has run out of strength as it approaches the mid-lineof the Bollinger Bands, or the underbelly of the 18 SMA.
* You do not want to anticipate this move and short the stock too quickly. But if price begins to stallat the mid-line of the Bollinger Bands and your primary indicators are maxed out on the 15-minute chart, thenyou've got an ideal candidate.

8/4/2019 Essentials of Trading the Afternoon Market
http://slidepdf.com/reader/full/essentials-of-trading-the-afternoon-market 73/91
The chart of CENX above shows the Tired Descender strategy. As price rises up to the mid-line of the
Bollinger Bands, it struggles to go any higher. RSI is unable to get past the 70 line and eventually RSI andStochastics both begin to lead the price downward. Price action is confirmed by the MACD, which flattensout its curve without ever reaching the 0 signal line. Price continues to fall another 4% for a nice short play,as the indicators never provide a substantial reason for covering the short.

8/4/2019 Essentials of Trading the Afternoon Market
http://slidepdf.com/reader/full/essentials-of-trading-the-afternoon-market 74/91
Strategy # 5: Climbing the Trellis
One of the most difficult trades for new traders is knowing when, how, and even if to buy a stock that seemsto be climbing without any pause. On the one hand, you don't won't to chase the stock - buying into it rightwhen it runs out of steam. On the other hand, you hate to just sit there and watch the price run up without participating in the profits.
The critical aspects of this strategy are:* The market context for this trade is often an uptrending market, as if you're climbing up the trellis.
This can also be played as a short, of course, just using the opposite configurations. In that case, a declining
market would be more favorable.* The context for this individual stock is often a bit of good news, such as an upgrade from an
analyst, or a "better-than-expected" earnings report. Price will seem to be climbing without any pause.* At some point, however, the 5-minute chart will reveal a moment of entry. It is when the indicators
have fallen off, but then find support at either the 50% or the 30% levels, that your entry opportunity arrives.As the indicators resume their upward angle, price follows suit and continues to climb up the trellis.

8/4/2019 Essentials of Trading the Afternoon Market
http://slidepdf.com/reader/full/essentials-of-trading-the-afternoon-market 75/91
This one-day chart of ANN provides an example of Climbing the Trellis. It shows how the stock provided awindow to enter the trade around 2:00. I separated the RSI and Stochastic lines so you could see thecrossover patterns more clearly. This trade is best done when the market is providing steady support.

8/4/2019 Essentials of Trading the Afternoon Market
http://slidepdf.com/reader/full/essentials-of-trading-the-afternoon-market 76/91
Strategy # 6: Beyond the Bottleneck
There are two ways to play the bottleneck pattern. I'll show you the other one in Strategy # 7. But, a bottleneck occurs when the price has become constricted to a very tight range. You'll see the Bollinger Bandsform a sort of bottleneck around price. And eventually price breaks out of the pattern. It is dangerous to predict which way price will go before the bottleneck ends. But, you can be alert to it and watch theindicators for their lead.
The critical aspects of this strategy are:* The market context for this trade often mirrors the individual stock. The market may have gapped
up in the morning on good news, and then just trades sideways for hours after that.* The price candles for this stock are trading in a narrow range. The Bollinger Bands on the 5-minute
chart have become so tight that price seems squeezed between them.
* Eventually, price breaks out of this pattern. And when it does, the outbreak can often be dramatic.While you cannot foretell the direction of the breakout, you can be prepared by knowing the indicators towatch.

8/4/2019 Essentials of Trading the Afternoon Market
http://slidepdf.com/reader/full/essentials-of-trading-the-afternoon-market 77/91
The chart of AGM illustrates the Beyond the Bottleneck strategy. You can see how constricted price becomes around mid-afternoon. When price moves in such a narrow zone, it is easy to get frustrated and lose patience. But, a careful use of the indicators, especially RSI and PVT, can give you clues as soon as the stock turns. You just have to be careful and not enter this strategy prematurely. Don't assume that you knowwhich way the stock will turn, because it could break out to the downside.

8/4/2019 Essentials of Trading the Afternoon Market
http://slidepdf.com/reader/full/essentials-of-trading-the-afternoon-market 78/91
Strategy # 7: Playing the Ping
Playing the Ping is our second bottleneck play. The situation is that the market is trading sideways in a verynarrow range again. But, if we want to trade during this time, we have to find something that is moving. Oneoption is a 3X ETF, such as the pairs BGU/BGZ or FAS/FAZ. Even in a tight market, there will be somemovement here. You just have to look close enough and be very careful. It is best to "play the ping" by using1-minute charts in the context of a 5-minute window.
The critical aspects of this strategy are:* The market context will always be a horizontal market.* The 5-minute Bollinger Bands are tight, but there is a 10 or 20 cent movement that you can see
repeating over and over. If you imagine a ping-pong ball being paddled back and forth between two fixed points, then you'll get the idea.
* Key to this strategy is the use of the 1-minute chart for trade execution and the use of limit ordersfor executing the trade. You want to capture price each time the ball hits the paddle, and it will be difficult todo this with a market order.

8/4/2019 Essentials of Trading the Afternoon Market
http://slidepdf.com/reader/full/essentials-of-trading-the-afternoon-market 79/91
The chart of BGU is the only 1-minute chart in this whole book. We have focused on larger plays that provide more profit for you. But, sometimes the market trades within such narrow constraints that trading a1-minute ETF may be your best play. In the chart above, you can see how price moves in a narrow,descending price channel. This closely follows the 1-minute Bollinger Bands. So, to utillize the Playing thePing strategy, you could short this ETF when it hit the top line of the price channel, and then cover and golong when price hit the bottom line of the price channel. This requires close supervision of the trade and somevery quick trading. As with all channels, eventually price moves outside the channel. So you have to becareful.
8/4/2019 Essentials of Trading the Afternoon Market
http://slidepdf.com/reader/full/essentials-of-trading-the-afternoon-market 80/91
Strategy # 8: Changing Lanes
In this strategy, we look at dramatic shifts in the market. We want to identify when these market changingmoments occur so we can be on the right side of the market when it happens. Again, using the 3X ETFs provide a great way to maximize the earnings on these big market moves. While you cannot anticipate thetiming of these major moves, the indicators will make it plain to you.
The critical aspects of this strategy are:* The market context is changing. You cannot usually foresee it. But you will have the tools to
recognize it and get involved quickly.* Often, a single candle will show the move from one side of the street to the other. You will
sometimes see this happen slowly. But, a single candle movement is always a signifcant move.* The major indicators will show a significant change. Watch the 30 and 70 lines closely. Once the
indicators have switched sides, they will often stay there as price continues to move in that direction.

8/4/2019 Essentials of Trading the Afternoon Market
http://slidepdf.com/reader/full/essentials-of-trading-the-afternoon-market 81/91
FAZ provides an example of the Changing Lanes strategy. Price moves boldly, in a single candle, to the other side of the Bollinger Bands mid-line around 12:15. Once it crosses this line, then price continues another 4%climb before meeting resistance. This is an example of a bold change in market sentiment, often coincidingwith a news announcement.

8/4/2019 Essentials of Trading the Afternoon Market
http://slidepdf.com/reader/full/essentials-of-trading-the-afternoon-market 82/91
Lesson Nine
Entries & Exits
The idea in Video 9 is to bring together everything you've learned so far and show how it all fits together.You'll see how I look at the market context for that afternoon. Then I'll take a stock from one of the delayeddata QuoteTracker scans. I'll put this stock in its 10-minute context, looking for possible lines of support and
resistance. Then we'll use one of the eight strategies to drill down to the 2-minute chart and execute thetrade. So, this takes you through the whole process, step-by-step.
When do you enter the trade? When the indicators tell you to. You watch for the best, safe entry and thenyou place the trade. You execute the trade when all of the elements of support, context, and qualifyingindicators line up to give you full confidence in making the trade. In these videos, you'll see the exact tools Iuse for determining exact entries. And you'll understand the reasons behind those entries.
When do you exit the trade? When the indicators tell you to. I'm not being cute here. But, as you watch thetrade set-ups over these five days of trading, you'll see the indicators max out. You'll see RSI coming up near 100 while price hits its head on a pivot line or some other level of resistance. You also have the advantage of
backing up to the the original 10-minute chart for that stock and seeing what happened after the entry wasmade. Then ask yourself some questions. What do you see in the charts? How long would you have stayedin the trade? Why?
Over these five days of trades, I have drawn circles around the entry points and sometimes the exit points aswell. Here's one way to think of exits. You exit the trade when you have made your profit target and/or you believe that holding the trade any longer will cost you money. You should never regret an exit based on eitherone of those criteria. If the stock continues to go up after you sell it, then you can review the chart and learnfrom it. But don't ever kick yourself for making a profit. Over time, you will get a feel for how far you canride these indicators before settling the trade. That simply comes with time.
Sample Charts of Entries & Exits

8/4/2019 Essentials of Trading the Afternoon Market
http://slidepdf.com/reader/full/essentials-of-trading-the-afternoon-market 83/91
The chart of $INDU provides us with the market context for September 10, 2009. As you can see, price has been moving up all day as we approach the afternoon session. But there is a small pull back around 2:00 asRSI and Stochastics fall below the 70 line.
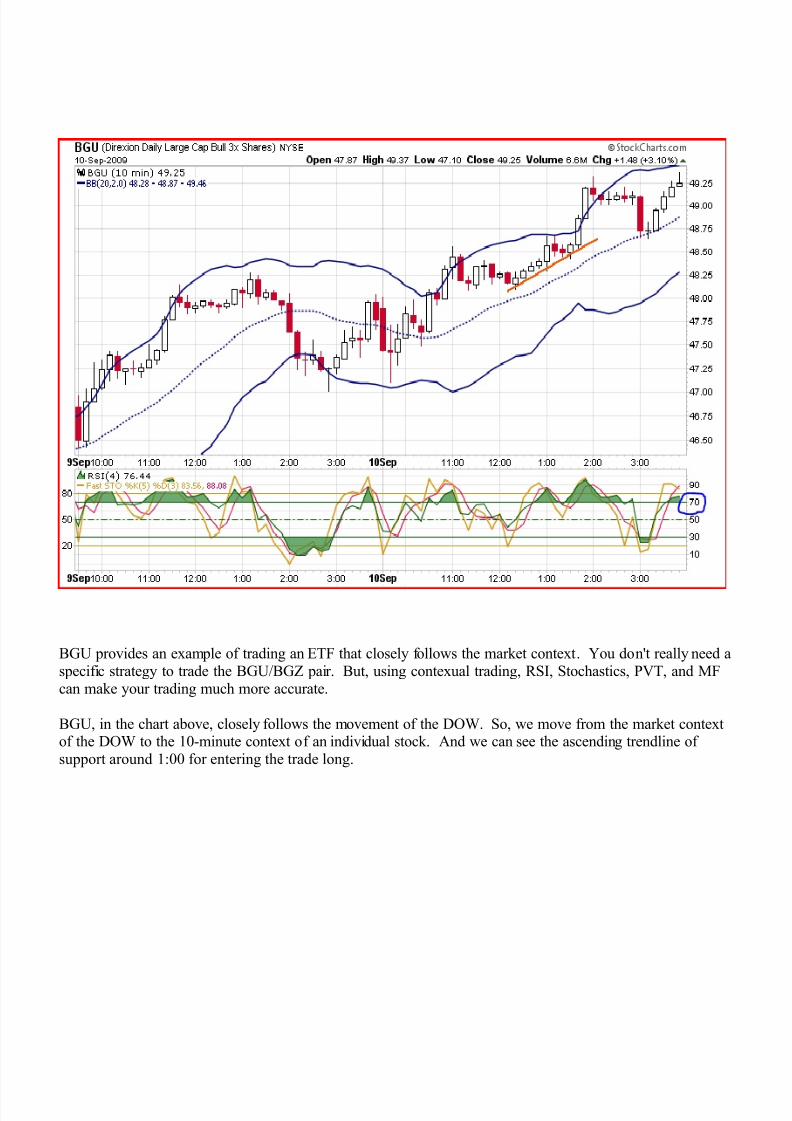
8/4/2019 Essentials of Trading the Afternoon Market
http://slidepdf.com/reader/full/essentials-of-trading-the-afternoon-market 84/91
BGU provides an example of trading an ETF that closely follows the market context. You don't really need aspecific strategy to trade the BGU/BGZ pair. But, using contexual trading, RSI, Stochastics, PVT, and MFcan make your trading much more accurate.
BGU, in the chart above, closely follows the movement of the DOW. So, we move from the market contextof the DOW to the 10-minute context of an individual stock. And we can see the ascending trendline of support around 1:00 for entering the trade long.

8/4/2019 Essentials of Trading the Afternoon Market
http://slidepdf.com/reader/full/essentials-of-trading-the-afternoon-market 85/91
The 5-minute chart above shows the RSI crossing over its moving average and then PVT and MF passingthrough the signal line at the same time. This is a great confirmation of our decision to buy this stock.

8/4/2019 Essentials of Trading the Afternoon Market
http://slidepdf.com/reader/full/essentials-of-trading-the-afternoon-market 86/91
Then, as we drill down to the 2-minute chart, we find even more confirmation that this is a good long trade.PVT and MF bounce off the red line, while RSI makes a crosssover of its moving average. And it all happensat the stock's pivot line.
By combining all of the different indicators and strategies learned in this book, we have been able to determine
a precise entry for this stock. We notice the next pivot line up on the 2-minute chart is just above $49.25. Sowe are careful to look back at our market and stock context charts, to determine a good exit. Our studyreveals that the indicators begin to weaken as price moves beyond its comfort zone of the top Bollinger Bandsline. So this becomes a good place to set a trailing stop, or simply exit the trade.

8/4/2019 Essentials of Trading the Afternoon Market
http://slidepdf.com/reader/full/essentials-of-trading-the-afternoon-market 87/91
Next, we'll look at one more stock, combining all of the different elements taught in this book.
The chart above of $INDU (the DOW), shows us the market context for the afternoon of September 14th.RSI comes back through the 30 line around 1:00 and follows an ascending trendline of support up from there.

8/4/2019 Essentials of Trading the Afternoon Market
http://slidepdf.com/reader/full/essentials-of-trading-the-afternoon-market 88/91
The chart of SNDK shows several things. The orange arrow shows the alert we received from Trade-ideas(TM). You'll see a bearish reversal candle, preceeded by three bullish candles. This alerts us to pricemovement, but does not tell us when to enter the trade. As we watch, we see price finding support at themid-line of the Bollinger Bands, so we have a possible Bollinger Band Bounce strategy set-up. This occurs atnoon, when the market first found its support and RSI first bounced off the 30 line. So, we look at our 5-minute chart next.

8/4/2019 Essentials of Trading the Afternoon Market
http://slidepdf.com/reader/full/essentials-of-trading-the-afternoon-market 89/91
In the 5-minute chart above, we see RSI making the crossover with its moving average, and PVT and MFmoving up through the signal line.

8/4/2019 Essentials of Trading the Afternoon Market
http://slidepdf.com/reader/full/essentials-of-trading-the-afternoon-market 90/91
The 2-minute chart confirms our decision to buy this stock long, in the context of the market finding somestrength. PVT nad MF have turned up and they pass through the red line. Price continues to rise through one pivot line after another, and MF doesn't come back through its top line until the stock has earned us a 3% profit. Glancing back at the 10-minute chart might have given us some reasons to stay in the trade a littlelonger - at least with part of our equity - since RSI never falls below the 70 line on the 10-minute contextchart until price tops out around $20.40.

8/4/2019 Essentials of Trading the Afternoon Market
http://slidepdf.com/reader/full/essentials-of-trading-the-afternoon-market 91/91
One final word. Congratulations on moving through this material. The fact that you have come this far proves that you really want to learn how to trade stocks. By applying the material in this course, you will belight years ahead of most other traders. If you have taken the time to truly study the material and you have begun to use these indicators in your own trading, then you will start to make more money. But it will taketime. Nothing new is easy. And it doesn't become easy without a lot of practice. Over time, however, youwill begin to see things in the charts that you've never seen before. You will begin to get a sense of where themarket is headed and you'll trade right along with it.
If you wish to dig further into this material, then the online video package may still be available. You can goto my web site, http://www.start-day-trading.com and look for the Video Course menu item. The video
course includes over three hours of video and over 140 charts.
I wish you the best as you trade the afternoon markets.
Drop me a note sometime and let me know how you're doing with this material. If you have any questions,then feel free to email me at [email protected].