Essential Oils as a Viral and Nosema control in Honey Bees...
23
Almond Board of California - 1 - 2010.2011 Annual Research Report Essential Oils as a Viral and Nosema control in Honey Bees – Viral Load Relationship to Pest, Parasites, Diseases, and Stress of Managed Honey Bees Project No.: 10-POLL9-Wick Project Leader: David Wick BVS, Inc. 5501 HWY 93 N., Suite 6 Florence, MT 59833 (406) 369-4214 [email protected] Project Cooperators and Personnel: Frank A. Eischen, Research Entomologist, USDA-ARS, Weslaco, TX Dr. Michael Stanford, Deputy Team Leader, Point Detection Team ECBC, AMSRD-ECBC-RT-DD Gordon Wardell, Ph.D., Paramount Farming Co. Objectives: Part 1. Essential Oils as a Viral and Nosema Control in Honey Bees The focus of this study is to establish whether the essential oils in the LeFore patty are effective as a virus management tool in honey bees. For this project we will be evaluating the individual oils used in the patties as well as the total combination of essential oils to determine if any one specific oil are more effective at controlling the viruses or whether the synergy of the oils together is more effective in controlling the viral load. Under a confidential disclosure, Jeff LeFore has agreed to tell us the combination of essential oils used in his commercial patties. The treatment colonies will be compared to the control colonies and to each other in an evaluation of the efficacy of these essential oils. Part 2. Viral Load Relationship to Pests, Parasites, Diseases and Stress of Managed Honey Bees To test each of the colonies in the Weslaco Project for quantitative and qualitative virus loads. The viral relationships to the factors being investigated will bring a new perspective to investigative and experimental research data analysis.
Transcript of Essential Oils as a Viral and Nosema control in Honey Bees...

Almond Board of California - 1 - 2010.2011 Annual Research Report
Essential Oils as a Viral and Nosema control in Honey Bees – Viral Load Relationship to Pest, Parasites, Diseases, and Stress
of Managed Honey Bees Project No.: 10-POLL9-Wick Project Leader: David Wick BVS, Inc. 5501 HWY 93 N., Suite 6 Florence, MT 59833 (406) 369-4214 [email protected] Project Cooperators and Personnel:
Frank A. Eischen, Research Entomologist, USDA-ARS, Weslaco, TX Dr. Michael Stanford, Deputy Team Leader, Point Detection Team ECBC, AMSRD-ECBC-RT-DD
Gordon Wardell, Ph.D., Paramount Farming Co. Objectives: Part 1.
Essential Oils as a Viral and Nosema Control in Honey Bees
The focus of this study is to establish whether the essential oils in the LeFore patty are effective as a virus management tool in honey bees. For this project we will be evaluating the individual oils used in the patties as well as the total combination of essential oils to determine if any one specific oil are more effective at controlling the viruses or whether the synergy of the oils together is more effective in controlling the viral load. Under a confidential disclosure, Jeff LeFore has agreed to tell us the combination of essential oils used in his commercial patties. The treatment colonies will be compared to the control colonies and to each other in an evaluation of the efficacy of these essential oils. Part 2.
Viral Load Relationship to Pests, Parasites, Diseases and Stress of Managed Honey Bees
To test each of the colonies in the Weslaco Project for quantitative and qualitative virus loads. The viral relationships to the factors being investigated will bring a new perspective to investigative and experimental research data analysis.
Almond Board of California - 2 - 2010.2011 Annual Research Report
Interpretive Summary: The value and joy of research is proving a theory, making recommendations of a proven process that has been tested and evaluated, and best of all, discovery. Discovery is where new applications of old known properties are looked at in a new light. Some of the processes we have done are confirmed by others and ourselves such as shipping samples. For our purposes we have simplified the shipping to just placing the live bees in a baggie and shipping via USPS flat rate boxes. This is less expensive and cumbersome to the beekeeper and the samples get to me in great shape. Sample collection and preservation has been proven by us and by work done this year by the USDA-ARS (3), making the whole process to use a laboratory easier for the beekeeper. Time of day collections was one of the questions we needed to answer in our preparation, the risk of losing data or of having misrepresenting data from using different aged bees in data analysis was answered. The problem is that the younger bees do not carry a mature viral load that can be seen in older bees. We addressed this with consistency in the location and found that there is no significant difference in the viral loads carried depending on the time of day the bees are collected.
In our project to provide a scientific method for this investigation has proven to be difficult. The first set of tests and controls all died without any essential oils being applied and with no samples being sent to BVS for analysis. The second set of tests and controls were set up and organized with a different beekeeper that backed out of the experiment causing a four month delay in the start of the experiment. However we were able to process 10 colonies over a period of several months with a control set for a total sample set of 80 for this portion of the project. This data is shown in this report. However the colonies used were already at high intensity for virus and at high levels for Nosema. The results seem inconclusive and indicate that essential oils are not a cure for Nosema and unknown as a preventative for Nosema. The data does indicate that essential oils may reduce viral loads even starting at high intensity levels. The project is continuing with additional funding from the California State Beekeepers Association and funding from Project Apis m. This will provide the needed controls and low viral loads as well as low Nosema levels for our start. The statistical analysis will be done by ECBC and the Nosema confirmations will be done by Montana State University. The project is projected to conclude by March 2012.
Essential Oils
By using the interrelationships of bee health, stress factors, bee immune response and the presence of latent and active viral loads in the honeybee we have discovered a relationship between virus intensity and honeybee stress quantification.
Virus Relationship to Stress
Using the Integrated Virus Detection System (IVDS) to detect viruses, and to count the viruses (13) we have discovered that the viral diversity and intensity changes with increasing or decreasing stress to the honeybee
Almond Board of California - 3 - 2010.2011 Annual Research Report
The quantification of the viral load and the tracking of the viral load over time and the relationship of the viral load to stress placed on the honeybee. Stress to honeybee is indicated in various works (3, 11) that details investigation that includes viral loads, as a contributing factor to declining health. The quantification of stress relates to all phases of beekeeping from migratory practices, nutrition, pesticide exposure, chemical treatments, weather, monocrop pollination, (9, 10, 11). Stress management is needed in the scope of commercial beekeeping; measuring stress is difficult to quantify, to put a number on it. The data and we have recorded and presented provide a direct relationship of viral load monitoring to stress exposure. Some bees carry a higher viral load than others, due to hygentic behavior or to other genetic qualities (9, 10). Our major discovery and recommendation to growers and beekeepers is for monitoring bee viral loads on regular intervals provides a measurement to bee stress. What we have tied together is the monitoring of viral load as a means to monitor and quantify stress from many sources such as shipping including migratory practices, pests, fungal, viral, nutrition, water, overpopulation, and weather to name some. This is the joy of discovery in research. Materials, Methods, Results and Discussion:
As a part of this project we addressed some of the pre-collecting and processing of samples to insure data integrity. The quality of samples at various stages of processing, collections, storage and filtration has been a concern in regards to viral intensity and diversity in sample to the degradation of virus integrity in the sample. In cooperation with the University of Montana with BVS, Inc., virus samples were studied for integrity from storage at various temperatures and media. While this is not the focus of this project, sample integrity is important for consistent data comparisons over time. The summary of these projects have shown that there is some titer loss from various filters, the virons are attaching to some of the materials used in the filters or attaching to the debris capture by the filter. We singled out the best filter for our application and have only minimal loss of titer at less than 10% and no diversity loss by using a 20 micron paper filter and syringe holder. The temperature storage and media applications for sample preservation showed no vial titer loss or diversity loss from frozen to fresh samples over time. The largest loss of apparent viron detections as seen on the IVDS detector were from samples stored partially processed in refrigeration but not frozen, the loss was greater than 20% after 72 hrs. but by processing sooner (within 24hrs) there was no apparent loss. The processed and ready for IVDS sample storage time is one week at 35F with no apparent loss. The processed sample ready for IVDS and frozen at -30C does not seem to have any degradation after one year. This is comparable to the work done by Dainat, B et al. published in May of 2011. (3)
Sample preservation and shipping
The methods used for sample shipping, processing and storage demonstrate integrity to the intact viruses processed by IVDS and increases the project reliability for tracking viral titers and diversity over time using IVDS.
A time of day sample collection for variables in viral load changes was conducted with statistical analysis by Brian Steele, Department of Mathematical Sciences, the University of Montana, Missoula MT, 59812, USA; Time of Day Sampling Design was by Bee Alert
Field Collections and Continuity

Almond Board of California - 4 - 2010.2011 Annual Research Report
Technologies, Inc., Missoula, Montana; the Sampling Coordination was done by Dr. V Sivaram, the University of Montana. Outline of investigation
• The data originated from 9 hives. • Collected at three times of day (morning, afternoon, and evening). • Total of 27 samples on numbers of particles belonging to a particular size class. • The investigation was to determine if there are patterns in the counts associated with
time of day. Summary
• There is convincing evidence of the presence of the sacbrood virus in every hive. • There is unconvincing evidence of differences in number of virus particles among
different times of day. Results
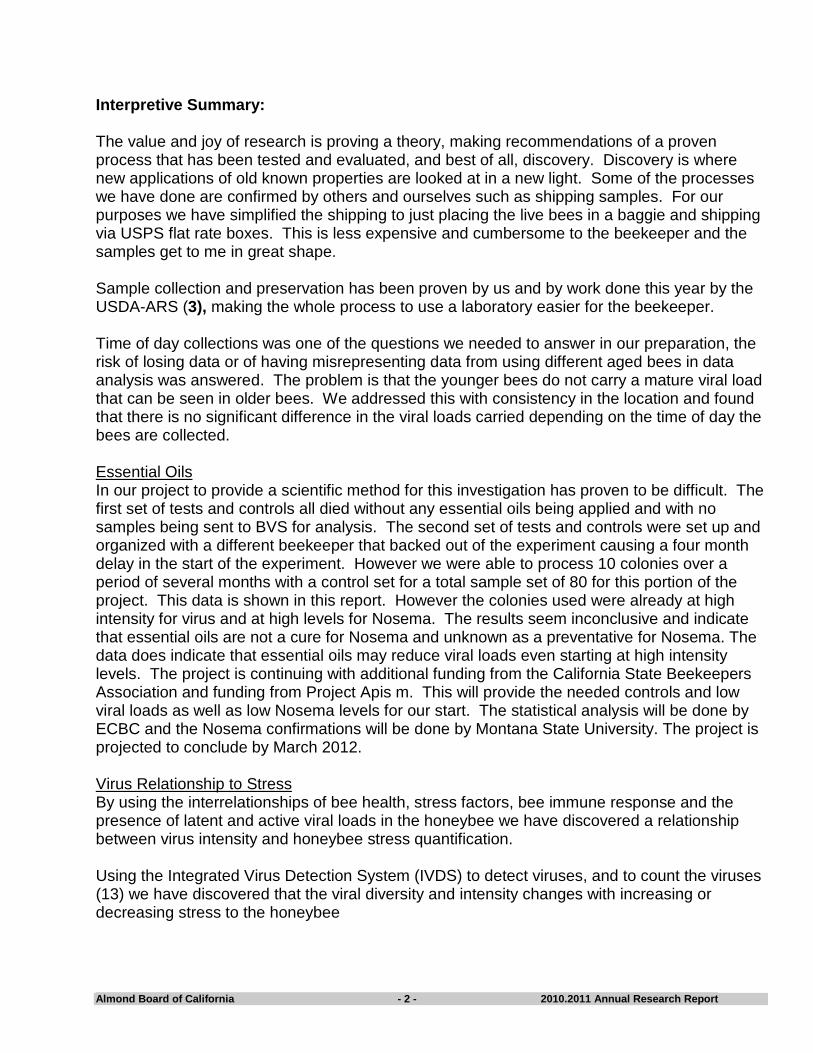
• Counts for each hive plotted against size, and for each time of day (Figure 2). • The peak associated with the sacbrood virus is apparent in each panel. • Clear differences among time of day with respect to counts are not visible. • Morning counts are not greater than the afternoon and evening counts.
There is a fairly consistent difference in the particle counts over the course of a day; Morning counts are less than afternoon and evening counts. Differences between afternoon and evening counts are not consistent.

Almond Board of California - 5 - 2010.2011 Annual Research Report
Almond Board of California - 6 - 2010.2011 Annual Research Report
Counts are greater in the afternoon compared to the morning (Figure 3). If viruses besides sacbrood are absent from the hives, than the pattern of greater counts in the afternoon compared to morning may be attributable to particles besides the sacbrood virus. In conclusion, there is no clear
evidence of differences in numbers of sacbrood viral particles by time of day.
The sample taking location for this study was from the front of the hive, collecting foragers.
Bees were collected and delivered to BVS for processing. Sample Collections
For the nutrition viral load study the Initial processing for BVS was done at the USDA Weslaco ARS laboratory that provided a 50ml solution of 100 bees ground and mixed with 50ml of deionized water. Samples were then frozen and shipped to BVS for processing. The samples for Nosema / Essential Oil Study were shipped via USPS flat rate service in zip-lock baggies or equivalent, sample weight used was 6 grams or nearly 60 bees. These bees were then liquefied in 300 ml of deionized water. The samples for viral load monitoring and stress level associations was shipped and prepared in the same manner.

Almond Board of California - 7 - 2010.2011 Annual Research Report
Each sample was then processed at BVS with each sample filtered though standard cheesecloth to remove non soluble bee parts.
30ml of the sample is centrifuged for 60 minutes at 20,000 X g. The supernatant is recovered and utra filtered through a 500,000 Dalton hollow fiber filtration system and a 250ml reverse osmosis (RO) wash which is then reduced to ~ 2ml. This produces a concentration of the viruses in the sample. The solution is prepped for IVDS by a 1:10 dilution using with Ammonium Acetate (AA) as the salt for controlled conductivity in IVDS. Each sample is filtered through a w-41 20um paper or a .45um PTFE filter, for removal of fatty and pollen residues that tend to float in the solution after centrifugation. IVDS uses a 5 scan average and is then saved in the IVDS database. Charts and tables are created from the exported data from IVDS.
Virus Detection by IVDS is based on nano-particle movement through a charged atmosphere, the particles have a mass/charge ratio that is easily converted to size. This movement allows for the sorting of the particles in the sample to be sorted by size and then with the use of a condensation particle counter, simply counted for each size the instrument is calibrated. The virus “window” we create is based on removing all other material in the sample, the “window” is based on a density gradient process that has been verified in multiple scientific applications and it is documented in 1977 by
IVDS Sample Processing
L. Bailey and R. D. Woods (8) in a process for isolating several bee virus: black queen cell virus(BQCV), Kashmir bee virus (KBV), acute bee paralysis virus (ABPV) and sacbrood virus (SBV). The detection process developed by the Army (7) in peer reviewed publications as well as independent investigators such as the National Instrument Standards Testing (NIST), (6) and the National Laboratory at Hanford, WA. (12)
Objective 1: Essential Oils as a Viral and Nosema Control in Honey Bees
BVS has processed over 3500 bee samples to date from beekeepers around the nation. The volume of data and the correlation of viral loads to seasonal changes, transportation overwintering, feeding and the use of essential oils reveals the areas that need conclusive evidence for any practical application of methods, management or treatments used. BVS has observational data that suggests essential oils are effective in the reduction of viral loads. The data shows that bee colonies with increasing viral loads respond favorably when treated with some combination of essential oils. The viral load drops and stays low for approximately sixty days. The weakness of this data is the lack of experimental methods and controls that provide reliable proof and details of application of that can then be repeated by the beekeeper with confidence in the outcome of treatments. In our project to provide a scientific method for this investigation has proven to be difficult. The first set of tests and controls all died without any essential oils being applied and with no samples being sent to BVS for analysis. The second set of tests and controls were set up and organized with a different beekeeper that backed out of the experiment causing a four month delay in the start of the experiment. However we were able to process 10 colonies over a

Almond Board of California - 8 - 2010.2011 Annual Research Report
period of several months with a control set for a total sample set of 80 for this portion of the project. This data is shown in this report (Figures 4-V12). However the colonies used were already at high intensity for virus and at high levels for Nosema. The results seem inconclusive and indicate that essential oils are not a cure for Nosema and unknown as a preventative for Nosema. The data does indicate that essential oils may reduce viral loads even starting at high intensity levels. The project is continuing with additional funding from the California State Beekeepers Association and funding from Project Apis m. This will provide the needed controls and low viral loads as well as low Nosema levels for our start. The statistical analysis will be done by ECBC and the Nosema confirmations will be done by Montana State University. The project is projected to conclud by March 2012.
Figure 4. Virus load by sample date essential oil treated samples

Almond Board of California - 9 - 2010.2011 Annual Research Report
Figure 5. Virus load by sample date untreated samples An error in sample processing occurred with 2010054251 in the filtration process that influenced viral counts. The treated samples show a general higher starting viral load count with a general drop in counts over time with the August samples showing a significant increase in both the treated and untreated samples and the September samples having a general lower count. All of these samples maintained a high Nosema count with no significant change. All samples were in the same apiary and drift is an influence that is not accounted for. All samples were being treated with essential oils prior to starting our treatment and we have not accounted to the residual affect for the prior schedule treatments. These factors are integrated into a redesign of the essential oil test. The following essential oil charts bring out the diversity between samples with a group and between the treated and non-treated groups as we track them over time. The tracking of individual colonies within a set may be the most significant analysis of the data, this also shows the diversity between colonies within a group and the trend within a group vs. the comparable set of data in the other group.
Almond Board of California - 10 - 2010.2011 Annual Research Report
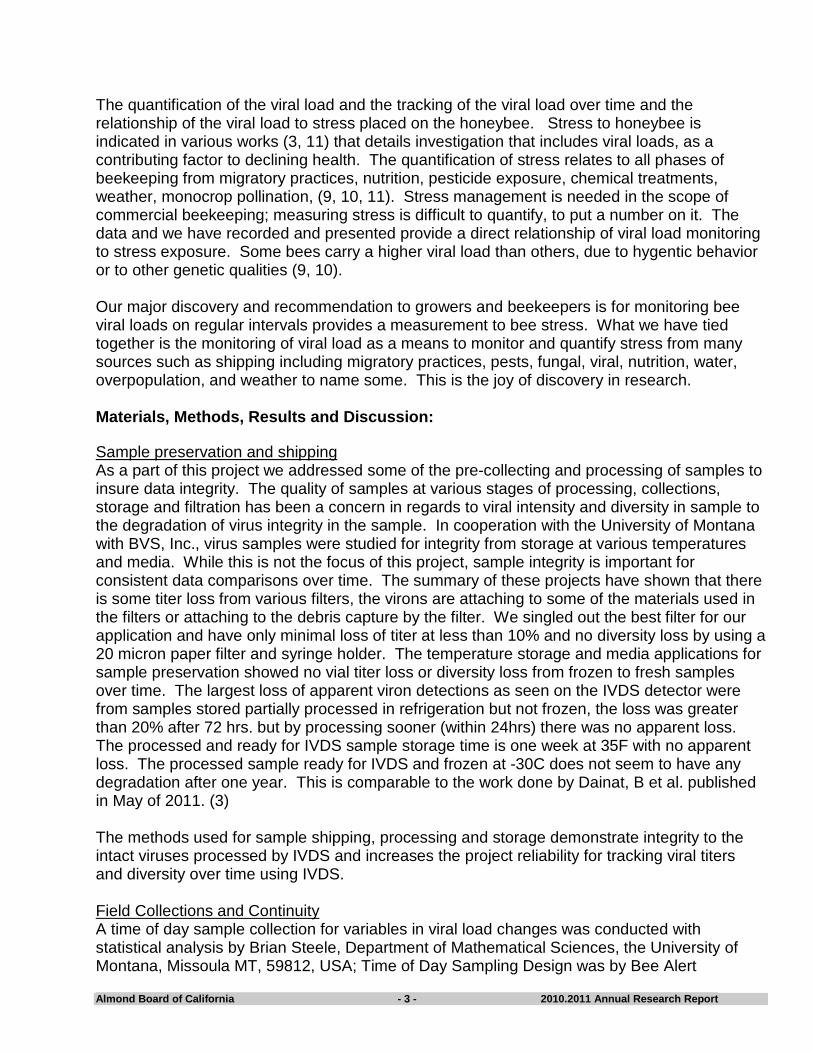
Figure 6. Virus load by colony for essential oil treated colonies Three of the five sets of treated colonies started with low and increase in the next sampling with a general decrease in viral intensity over the rest of the data set. The data in colony 3 has a large spike in viral intensity in September data, this is unaccounted for and does not match the rest of the treated colony data.
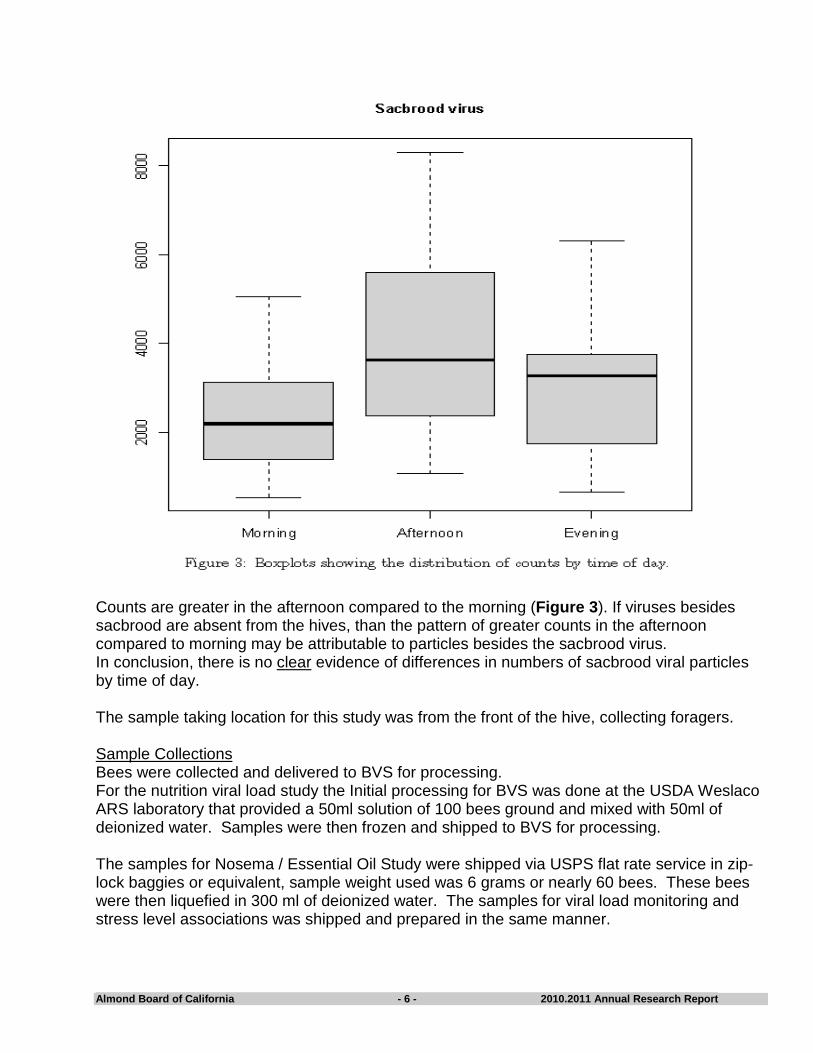
Figure 7. Virus load by colony for untreated colonies The non-treated viral load with one exception (colony 8) each start with a higher viral load which then drops in intensity with an increase in subsequent samples with the exception of colony 10 that has a general decrease in subsequent samples.

Almond Board of California - 11 - 2010.2011 Annual Research Report
Figure 8. Tracking the diversity and intensity of viral loads over time showing treated sample set diversity.
Figure 9. Tracking the diversity and intensity of viral loads over time showing untreated sample set diversity.

Almond Board of California - 12 - 2010.2011 Annual Research Report
Figure set 10. Diversity in frequency in treated samples vs. overall data base frequency.
0% 5% 14% 9% 18% 5% 14% 14% 14% 14% 0% 9% 0% 5% 5% 0% 41% 36% 0% 0% 0% 0% 14% 0% 5% 5% 0% 0% 0% 0% 0%
0 2 6 4 8 2 6 6 6 6 0 4 0 2 2 0 18 16 0 0 0 0 6 0 2 2 0 0 0 0 0
17.5 18.1 18.8 19.5 20.2 20.9 21.7 22.5 23.3 24.1 25 25.9 26.9 27.9 28.9 30 31.1 32.2 33.4 34.6 34.6 35.5 35.9 37.2 38.5 40 41.4 42.9 43.1 44.5 46.1
Deformed Wing Virus (DWV)
Satellite Virus Black Queen Cell
Virus (BQCV)Chronic Paralysis Virus (CPV)Sacbrood Virus (SBV)
Acute Bee Paralysis Virus
(ABPV)
Israeli Acute Paralysis Virus (IAPV)
Kashmir Bee Virus (KBV)
180 40 100 60 50 50 20 0 43 0 40 33 34 40 30 0 20 0 50 50 90 250 50 0 90 50 50 40 186 70 40942.5 1150 780 800 570 560 645 682.5 580 930 677.5 560 595 425 275.5 245.5 510 799.5 320 275 340 620 400 350 440 492.5 480 380 186 435 3403610 2655 2010 1900 1450 1800 1960 1806 1602 2405 1870 1800 1560 1190 1051 555 1120 2060 845 890 965 850 840 725 960 1055 1000 1020 186 960 6706375 11975 14950 10325 10562 10749 9270 9000 8980 10980 8894 13300 7740 9268 5585.5 8730 7340 10675 13975 7250 3100 5965 3910 4540 5955 4150 3700 3500 186 3215 1895
42100 184100 1E+05 212430 65400 94650 153200 72080 153400 75000 64160 142200 104220 54710 770490 41000 113700 73700 72100 16830 20420 14100 39700 45900 28900 31900 22990 29200 186 21200 22300
1 Min2 1st3 Median4 3rd9 Max Data set for frequency comparisons to the overall data at BVS.
Almond Board of California - 13 - 2010.2011 Annual Research Report
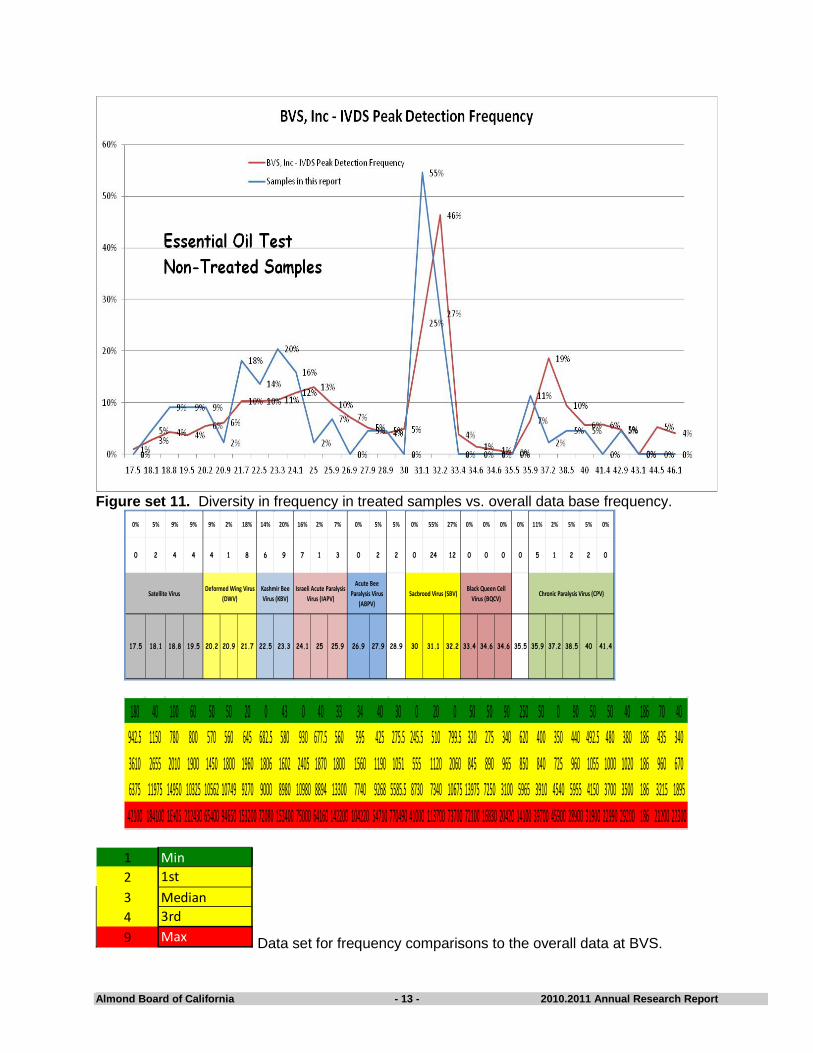
Figure set 11. Diversity in frequency in treated samples vs. overall data base frequency.
0% 5% 9% 9% 9% 2% 18% 14% 20% 16% 2% 7% 0% 5% 5% 0% 55% 27% 0% 0% 0% 0% 11% 2% 5% 5% 0%
0 2 4 4 4 1 8 6 9 7 1 3 0 2 2 0 24 12 0 0 0 0 5 1 2 2 0
17.5 18.1 18.8 19.5 20.2 20.9 21.7 22.5 23.3 24.1 25 25.9 26.9 27.9 28.9 30 31.1 32.2 33.4 34.6 34.6 35.5 35.9 37.2 38.5 40 41.4
Deformed Wing Virus (DWV)
Satellite Virus Black Queen Cell
Virus (BQCV)Chronic Paralysis Virus (CPV)Sacbrood Virus (SBV)
Acute Bee Paralysis Virus
(ABPV)
Israeli Acute Paralysis Virus (IAPV)
Kashmir Bee Virus (KBV)
180 40 100 60 50 50 20 0 43 0 40 33 34 40 30 0 20 0 50 50 90 250 50 0 90 50 50 40 186 70 40942.5 1150 780 800 570 560 645 682.5 580 930 677.5 560 595 425 275.5 245.5 510 799.5 320 275 340 620 400 350 440 492.5 480 380 186 435 3403610 2655 2010 1900 1450 1800 1960 1806 1602 2405 1870 1800 1560 1190 1051 555 1120 2060 845 890 965 850 840 725 960 1055 1000 1020 186 960 6706375 11975 14950 10325 10562 10749 9270 9000 8980 10980 8894 13300 7740 9268 5585.5 8730 7340 10675 13975 7250 3100 5965 3910 4540 5955 4150 3700 3500 186 3215 1895
42100 184100 1E+05 212430 65400 94650 153200 72080 153400 75000 64160 142200 104220 54710 770490 41000 113700 73700 72100 16830 20420 14100 39700 45900 28900 31900 22990 29200 186 21200 22300
1 Min2 1st3 Median4 3rd9 Max Data set for frequency comparisons to the overall data at BVS.

Almond Board of California - 14 - 2010.2011 Annual Research Report
Figure 12. Viral load of essential oil treated vs. non-treated samples In Figure 12, the treated samples show an overall higher mean count for DWV, KBV, IAPV with and near equal count for SBV and the non-treated set showing a higher count for ABPV and CPV. As stated previously, all samples were in the same apiary and drift is an influence that is not accounted for. All samples were being treated with essential oils prior to starting our treatment and we have not accounted to the residual affect for the prior schedule treatments. These factors are integrated into a redesign of the essential oil test. The following essential oil charts bring out the diversity between samples with a group and between the treated and non-treated groups as we track them over time. The tracking of individual colonies within a set may be the most significant analysis of the data, this also shows the diversity between colonies within a group and the trend within a group vs. the comparable set of data in the other group.
Objective 2: Viral Load Relationship to Pests, Parasites, Diseases and Stress of Managed Honey Bees:
Our objective in this portion of the project was to test each of the colonies in the Weslaco Project for quantitative and qualitative virus loads. The viral relationships to the factors being investigated will bring a new perspective to investigative and experimental research data analysis. Honeybee viral loads have been documented (2, 8) to be present and widely dispersed in bee populations. This year new viruses have been discovered and documented to be in bee populations (1, 11). Bees are subjected to stress from many sources, shipping, pests, fungal, viral, nutrition, water, overpopulation, and weather to name some. This stress is detrimental to the health of honeybee (9, 10).

Almond Board of California - 15 - 2010.2011 Annual Research Report
By using the interrelationships of bee health, stress factors, bee immune response and the presence of latent and active viral loads in the honeybee we have discovered a relationship between virus intensity and honeybee stress quantification. Using the Integrated Virus Detection System (IVDS) to detect viruses (6,7,13,14,15,16), and to count the viruses we have discovered that the viral diversity and intensity changes with increasing or decreasing stress to the honeybee. In a project funded by the Almond Board of California (ABC) to name the peaks or viral detections in IVDS, BVS, Inc. has identified seven viruses and has shown to be able to track the changes in the intensity of each virus over time by taking sequential sampling from the same colonies and further expanded this to yard or representative sampling providing data and reports to beekeepers that show and report a measurement of bee reaction to stress exposure or to stress mitigation. The report and suspicion that Colony Collapse Disorder (CCD) is the result of stress imposed on bees thereby compromising the bee immune system. The immune-suppressing stress may come from poor nutrition due to shortages of flowers that provide nectar and pollen to bees, poisoning from pesticides, parasitic mites and new and emerging diseases that infect bees. Other contributing factors may be the use of monoculture pollination, that needs to be compensated with more bees being transported across the U.S. with the resulting increase of bee stress and vulnerability of bees to disease. (9,10)
We have found that by tracking viral loads over time we see younger bees enter into the field force and the viral intensity decreases. This is similar to what we find in CCD colonies, as the older bees die, younger and younger bees are pressed into field service. The younger bees with lower viral intensities may be related to hygienic behavior that has been described by M Spivak (9,10)
We have taken the process of quantifying the viral loads in honeybees and applying this to measuring treatments and nutrition additives to bee colonies. We have processed over 1000 samples sent to us from the USDA Weslaco laboratory to measure the viral load from the Weslaco project. Weslaco has stated that these colonies have associations to transportation, monoculture, population density, nutrition, fungal infestation, and treatments. We were to provide the viral diversity, intensity and frequency to Weslaco for addition of this data to their project. BVS has not processed all the data sent to us from Weslaco, the funds received from this project only covered part of the expenses. However the data we have collected did provide insight to diversity, intensity and frequency that was applied to samples that have continuity and time sequential data that we have been able to relate and analyze to stress influences on bee colonies from migratory, monoculture, high population density yards with a comparison to viral loads within the colonies when stress is relieved.

Almond Board of California - 16 - 2010.2011 Annual Research Report
Figures 13, 14 and 15 are the Weslaco data sets with comparisons to brood, and older bees that includes a shift in viral load frequencies over time and the similarities between them.
Figure set 13. The Weslaco brood samples are showing a generally same frequency as we see in all samples.
1% 1% 1% 2% 3% 4% 6% 4% 6% 4% 8% 9% 9% 6% 6% 6% 17% 42% 7% 2% 2% 0% 7% 22% 20% 10% 10% 6% 0% 6% 8%
3 4 4 8 10 17 25 16 25 16 32 36 34 23 22 23 69 166 26 7 8 0 29 86 78 39 38 23 0 24 33
17.5 18.1 18.8 19.5 20.2 20.9 21.7 22.5 23.3 24.1 25 25.9 26.9 27.9 28.9 30 31.1 32.2 33.4 34.6 34.6 35.5 35.9 37.2 38.5 40 41.4 42.9 43.1 44.5 46.1
Deformed Wing Virus (DWV)
Satellite Virus Black Queen Cell
Virus (BQCV)Chronic Paralysis Virus (CPV)Sacbrood Virus (SBV)
Acute Bee Paralysis
Virus (ABPV)
Israeli Acute Paralysis Virus (IAPV)
Kashmir Bee Virus (KBV)
180 40 100 60 50 50 20 0 43 0 40 33 34 40 30 0 20 0 50 50 90 250 50 0 90 50 50 40 186 70 40942.5 1150 780 800 570 560 645 682.5 580 930 677.5 560 595 425 275.5 245.5 510 799.5 320 275 340 620 400 350 440 492.5 480 380 186 435 3403610 2655 2010 1900 1450 1800 1960 1806 1602 2405 1870 1800 1560 1190 1051 555 1120 2060 845 890 965 850 840 725 960 1055 1000 1020 186 960 6706375 11975 14950 10325 10562 10749 9270 9000 8980 10980 8894 13300 7740 9268 5586 8730 7340 10675 13975 7250 3100 5965 3910 4540 5955 4150 3700 3500 186 3215 1895
42100 2E+05 1E+05 2E+05 65400 94650 2E+05 72080 2E+05 75000 64160 1E+05 1E+05 54710 8E+05 41000 1E+05 73700 72100 16830 20420 14100 39700 45900 28900 31900 22990 29200 186 21200 22300 1 Min2 1st3 Median4 3rd9 Max Data set for frequency comparisons to the overall data at BVS.

Almond Board of California - 17 - 2010.2011 Annual Research Report
Figure set 14. Weslaco data from the October bees we see a higher incidence of IAPV and lower for CPV.
0% 1% 1% 1% 3% 3% 6% 6% 6% 7% 8% 11% 4% 4% 2% 3% 26% 46% 3% 1% 0% 1% 2% 14% 10% 4% 7% 6% 0% 2% 3%
0 2 4 4 9 10 23 21 23 25 27 41 16 15 7 9 93 166 12 3 0 2 6 51 37 15 25 21 0 6 9
17.5 18.1 18.8 19.5 20.2 20.9 21.7 22.5 23.3 24.1 25 25.9 26.9 27.9 28.9 30 31.1 32.2 33.4 34.6 34.6 35.5 35.9 37.2 38.5 40 41.4 42.9 43.1 44.5 46.1
Deformed Wing Virus (DWV)
Satellite Virus Black Queen Cell
Virus (BQCV)Chronic Paralysis Virus (CPV)Sacbrood Virus (SBV)
Acute Bee Paralysis
Virus (ABPV)
Israeli Acute Paralysis Virus (IAPV)
Kashmir Bee Virus (KBV)
180 40 100 60 50 50 20 0 43 0 40 33 34 40 30 0 20 0 50 50 90 250 50 0 90 50 50 40 186 70 40942.5 1150 780 800 570 560 645 682.5 580 930 677.5 560 595 425 275.5 245.5 510 799.5 320 275 340 620 400 350 440 492.5 480 380 186 435 3403610 2655 2010 1900 1450 1800 1960 1806 1602 2405 1870 1800 1560 1190 1051 555 1120 2060 845 890 965 850 840 725 960 1055 1000 1020 186 960 6706375 11975 14950 10325 10562 10749 9270 9000 8980 10980 8894 13300 7740 9268 5585.5 8730 7340 10675 13975 7250 3100 5965 3910 4540 5955 4150 3700 3500 186 3215 1895
42100 184100 1E+05 212430 65400 94650 153200 72080 153400 75000 64160 142200 104220 54710 770490 41000 113700 73700 72100 16830 20420 14100 39700 45900 28900 31900 22990 29200 186 21200 22300
1 Min2 1st3 Median4 3rd9 Max Data set for frequency comparisons to the overall data at BVS.

Almond Board of California - 18 - 2010.2011 Annual Research Report
Figure set 15. This is the January Weslaco data showing the lower incidence of IAPV and higher for CPV, similar to the brood nest samples.
0% 0% 1% 0% 1% 2% 0% 1% 2% 4% 2% 5% 0% 0% 1% 5% 39% 36% 1% 0% 0% 0% 7% 25% 9% 3% 3% 2% 0% 1% 1%
0 0 1 0 1 2 0 1 2 4 2 5 0 0 1 5 37 35 1 0 0 0 7 24 9 3 3 2 0 1 1
17.5 18.1 18.8 19.5 20.2 20.9 21.7 22.5 23.3 24.1 25 25.9 26.9 27.9 28.9 30 31.1 32.2 33.4 34.6 34.6 35.5 35.9 37.2 38.5 40 41.4 42.9 43.1 44.5 46.1
Deformed Wing Virus (DWV)
Satellite Virus Black Queen Cell
Virus (BQCV)Chronic Paralysis Virus (CPV)Sacbrood Virus (SBV)
Acute Bee Paralysis Virus
(ABPV)
Israeli Acute Paralysis Virus (IAPV)
Kashmir Bee Virus (KBV)
180 40 100 60 50 50 20 0 43 0 40 33 34 40 30 0 20 0 50 50 90 250 50 0 90 50 50 40 186 70 40942.5 1150 780 800 570 560 645 682.5 580 930 677.5 560 595 425 275.5 245.5 510 799.5 320 275 340 620 400 350 440 492.5 480 380 186 435 3403610 2655 2010 1900 1450 1800 1960 1806 1602 2405 1870 1800 1560 1190 1051 555 1120 2060 845 890 965 850 840 725 960 1055 1000 1020 186 960 6706375 11975 14950 10325 10562 10749 9270 9000 8980 10980 8894 13300 7740 9268 5585.5 8730 7340 10675 13975 7250 3100 5965 3910 4540 5955 4150 3700 3500 186 3215 1895
42100 184100 1E+05 212430 65400 94650 153200 72080 153400 75000 64160 142200 104220 54710 770490 41000 113700 73700 72100 16830 20420 14100 39700 45900 28900 31900 22990 29200 186 21200 22300
1 Min2 1st3 Median4 3rd9 Max Data set for frequency comparisons to the overall data at BVS.

Almond Board of California - 19 - 2010.2011 Annual Research Report
I have not been given the corresponding data from Weslaco for pest, nutrition, treatments or weather influences on the bee samples. As data is received this project will be updated. The following data (Figure 16) is from our tracking of commercial beekeepers over time and has applied knowledge from sample processing and tracking from the Weslaco project.
Figure 16. A single commercial beekeeper sending monthly samples showing the high intensity and diversity of several colonies during migratory season in early spring and the subsequent movement of the colonies into the summer holding yards and then to the yards positioned for honey production. The viral diversity and intensity is dramatically reduced with the reduction in the stressful conditions. Reduction of stress – reduction in bee viruses – younger bee These colonies were subject to being transported from pollination to summer honey production. These bees were healthy and strong from beginning to end showing a high tolerance to the viral load even with the recorded increases in viral intensity. What we see is the increase in the viral load during pollination and transportation to decreased viral load in smaller yards with increased nutrition diversity.
• No apparent viral infection (symptoms) - higher viral load – bee immune system is managing to keep viruses in check.
Migratory and temporary status to Stationary yard status
Almond Board of California - 20 - 2010.2011 Annual Research Report
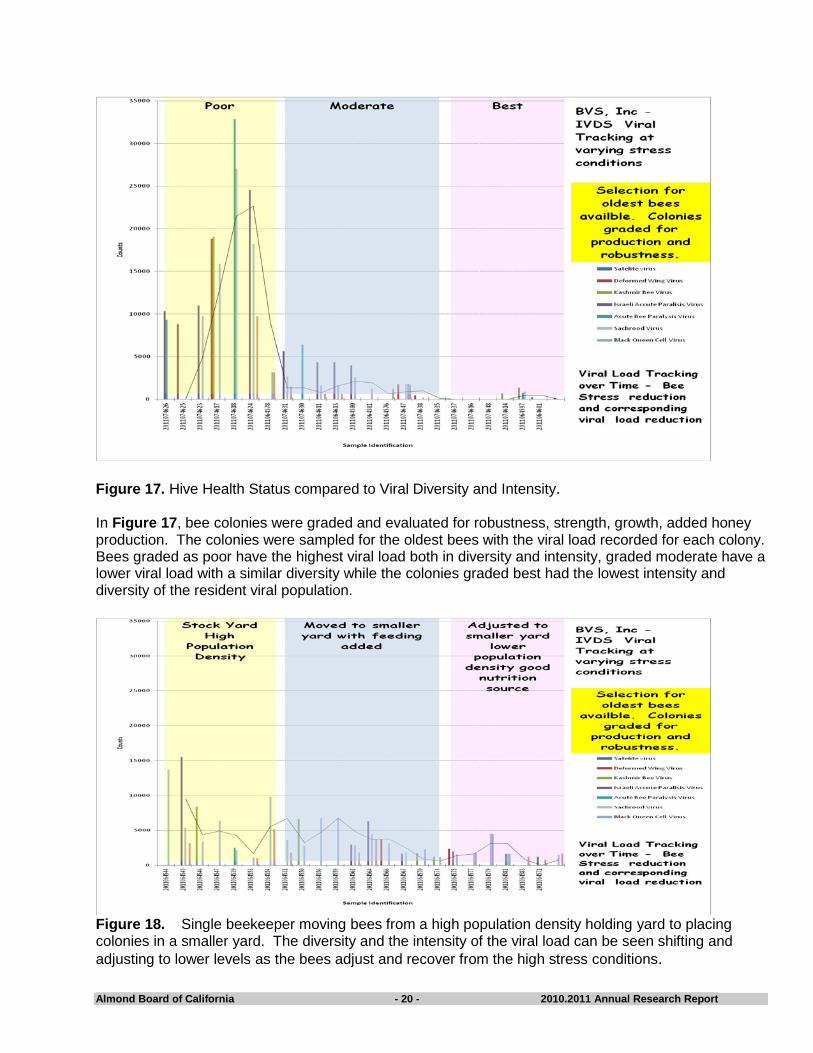
Figure 17. Hive Health Status compared to Viral Diversity and Intensity. In Figure 17, bee colonies were graded and evaluated for robustness, strength, growth, added honey production. The colonies were sampled for the oldest bees with the viral load recorded for each colony. Bees graded as poor have the highest viral load both in diversity and intensity, graded moderate have a lower viral load with a similar diversity while the colonies graded best had the lowest intensity and diversity of the resident viral population.
Figure 18. Single beekeeper moving bees from a high population density holding yard to placing colonies in a smaller yard. The diversity and the intensity of the viral load can be seen shifting and adjusting to lower levels as the bees adjust and recover from the high stress conditions.

Almond Board of California - 21 - 2010.2011 Annual Research Report
Figure 19. Virus tracking in bees from high stress to low stress yards. These counts are high in the holding yard with some low viral count and diversity seen. The contrast is the movement to the stable yards with a low population density of colonies in the same area where competition for resources and drift are minimized. The exception seen in the one yard is an example of a stressed colony not recovering and had symptoms of reduced colony strength and robustness.
Figure 20. A single beekeeper moving bees frequently from low nutrition crops to stable non-migratory yards that have diverse nutritional sources.

Almond Board of California - 22 - 2010.2011 Annual Research Report
Conclusions: Honeybees are subject to demands of agriculture and the inherent stress that comes with high production and the increased need to meet the needs of the larger single crop producer. Being able to bring high quality bees to service this industry has brought to the beekeeper a comparable set of management decisions to keep up with demand. How to we keep the honeybees in the best condition to bring the best service and the highest return for the effort. Or even how to I keep my bees alive? Most of what we are showing with this data set is of no surprise to beekeepers. What is useful is the quantification of the viral load and the tracking of the viral load over time and the relationship of the viral load to stress placed on the honeybee. Stress to honeybee is indicated in various works (4,11) that details investigation, that includes viral loads, as a contributing factor to declining health. The quantification of stress relates to all phases of beekeeping from migratory practices, nutrition, pesticide exposure, chemical treatments, weather, monocrop pollination, (9,10,11). Stress management is needed in the scope of commercial beekeeping, measuring stress is difficult to quantify, to put a number on it. The data we have recorded and presented provide a direct relationship of viral load monitoring to stress exposure. Some bees carry a higher viral load than others, due to hygenic behavior or to other genetic qualities (9,10). General nutrition improves the bees ability to tolerate elevated viral loads. We were to provide a detailed analysis on this , but it was not accomplished, what we have seen is the movement of bees into yards that have better nutrition, lower population density, and feeding resulting in a lower viral load and recorded improved bee production and strength. Monitoring bee viral loads on regular intervals provides a measurement to bee stress. Research Effort Recent Publications: No current publications. References Cited: Bromenshenk JJ, Henderson CB, Wick CH, Stanford MF, Zulich AW, et al. (2010) Iridovirus
and Microsporidian Linked to Honey Bee Colony Decline. PLoS ONE 5(10): e13181. doi:10.1371/journal.pone.0013181
Chen, Y.P., Zhao, Y., Hammond, J., Hsu, H., Evans, J.D., Feldlaufer, M.F. 2004. Multiple virus infections in the honey bee and genome divergence of honey bee viruses. Journal of Invertebrate Pathology.87:84-93.
Dainat, B., Evans, J.D., Chen, Y., Neumann, P. 2011. Sampling and RNA quality for successful diagnostics using quantitative PCR. Journal of Pest Science. 174:150-152.
Chen, Y.P., Siede, R. 2007. Honey Bee Viruses. Advances in Virus Research. 70:33-80. Hoffman, G.D., Chen, Y., Huang, E., Huang, M.H. 2010. The Effect of Diet on Protein
Concentration, Hypopharyngeal Gland Development and Virus Load in Worker Honey Bees (Apis mellifera L.). Journal of Insect Physiology, 56:1184-1191.
Almond Board of California - 23 - 2010.2011 Annual Research Report
Kuzmanovic, D.A., I. Elashvili, C. Wick, C. O'Connell, S. Krueger, Quantification of RNA in bacteriophage MS2-like viruses in solution by small-angle X-ray scattering, Radiation Physics and Chemistry 75 (2006) 359-368
Kuzmanovic, D.A., I. Elashvili, C. H. Wick, C. O'Connell and S. Krueger, Bacteriophage MS2: Molecular Weight and Spatial Distribution of the Protein and RNA Components by Small-Angle Neutron Scattering and Virus Counting, Structure, Vol. 11, 1339-1348, November 2003.
L. Bailey and R. D. Woods ,Rothamsted Experimental Station, Harpenden, Herts. AL5 2JQ, U.K. Received 21, March 1977., Accepted 6 May 1977.
Spivak, M., http://www.research.gov/research-portal/appmanager/base/desktop?_nfpb=true&_pageLabel=research_news_discoveries&_nfls=false&T21202399231261084161385_nodePath=%2FNews%2FCommon%2FMarlaSpivakAScientistWithaRealBeeinHerBonnet.html
Spivak, M.,http://ecofriendlygreenproductsnews.com/2011/02/what-is-bee-colony-collapse-disorder/
Runckel C, Flenniken ML, Engel JC, Ruby JG, Ganem D, et al. (2011) Temporal Analysis of the Honey Bee Microbiome Reveals Four Novel Viruses and Seasonal Prevalence of Known Viruses, Nosema, and Crithidia. PLoS ONE 6(6): e20656. doi:10.1371/journal.pone.0020656
Thomas, J.J., B. Bother, J. Traina, W. H. Benner, and G. Siuzdak, Electrospray ion mobility spectrometry of intact viruses. Spectroscopy 18 (2004) 31-36
Wick, C. H , P. E. McCubbin, A. Birenzvige Detection and Identification of Viruses Using the Integrated Virus Detection System (IVDS). ECBC Technical Report: 2006, ECBC-TR-463
Wick, C.H., I. Elashvili, R. Jabbour, D. Kuzmanovic, P. McCubbin, S. Deshpande, Mass Spectrometry and Integrated Virus Detection System Characterization of MS2 Bacteriophage, submitted to Toxicology Methods and Materials, July 2006
Wick, C. H., McCubbin, P. E., Purification of MS2 bacteriophage from complex growth media and resulting analysis by the integrated virus detection system (IVDS), (1999). Toxicology Methods 9:253-263.
Wick, C. H., McCubbin, P. E., Characterization of purified MS2 bacteriophage by the physical counting methodology used in the integrated virus detection system (IVDS). (1999). Toxicology Methods 9:245-252