Essential Elements of Environmental Scanning · Environmental Scanning zEffective environmental...
314
1 Essential Elements of Environmental Scanning 31 st CAIR Conference, Pasadena, CA November 1, 2006
Transcript of Essential Elements of Environmental Scanning · Environmental Scanning zEffective environmental...

1
Essential Elements of Environmental
Scanning
31st CAIR Conference, Pasadena, CANovember 1, 2006

2
Diablo Valley College
Mohamed EisaDean of Planning, Research and Student
Outcomes
Dale CraigCollege Research Coordinator

3
Environmental Scanning
Effective environmental scanning should be based on identifying the broad trends, both internally and externally, determining which of these trends may be relevant to both present and future operations of the college, and projecting the impact of these trends on the future.

4
Two ComponentsThe external environment includes analysis and discussion of the forces of change external to the college, including the demographic, social and economic changes, and competition.
The internal profile includes analysis and discussion of student access and progress, programs and curricula, academic productivity measures, and college resources (financial, human, facilities, equipment, and technology).
5
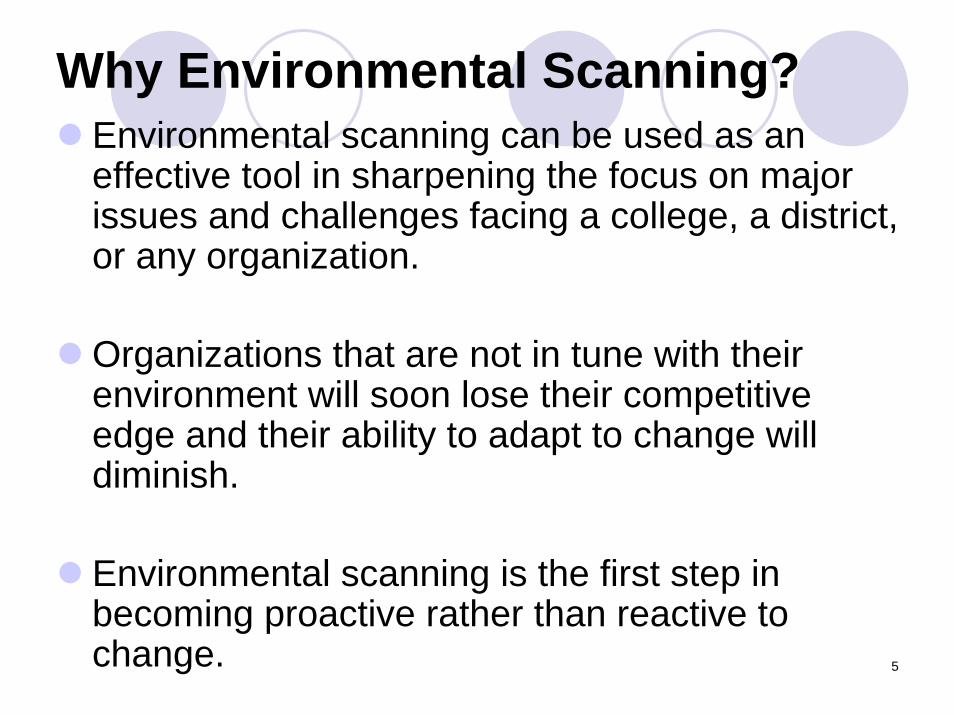
Why Environmental Scanning?Environmental scanning can be used as an effective tool in sharpening the focus on major issues and challenges facing a college, a district, or any organization.
Organizations that are not in tune with their environment will soon lose their competitive edge and their ability to adapt to change will diminish.
Environmental scanning is the first step in becoming proactive rather than reactive to change.

6
How will Environmental Scanning be Used?
It provides the first step in strategic planning and for developing the educational master plan for facilities.
It provides information for the evaluation of the institution in preparation for the accreditation self-study report.
It provides the basis for informed and effective decision making.
It provides for a broader understanding of the forces of change that will shape the future of the institution.

7
The Setting
The focus of this environmental scanning is Contra Costa County and Contra Costa Community College District and its three colleges.
Contra Costa County is located in Northern California. It is one of ten counties in the San Francisco Bay Area. The County has more than one million persons (2005) and is the ninth most populous among the 58 counties in the state.

8
The Setting
Contra Costa Community College District is the seventh largest among 72 community college districts in California with an enrollment headcount of approximately 36,000 students in fall 2005. The District has three colleges:
Contra Costa College, located in San Pablo, Western side of the county, headcount: 7,380 (fall 2005).Diablo Valley College, located in Pleasant Hill, Central part of the county, headcount: 20,704 (fall 2005).Los Medanos College, located in Pittsburg, Eastern side of the county, headcount: 8,496 (fall 2005).

9
Themes
Basic InformationLongitudinal ChangesRegional DifferencesImplications

10
External EnvironmentDemographic TrendsEducational OpportunitySocio-Economic FactorsQuality of LifeFinancing of Higher Education

11
Internal Profile
Student AccessStudent AchievementHuman ResourcesProductivityPrograms and Curricula

12
In ShortThe environmental scan is about:
PeopleMaterialIdeasForces of Change
That impact the institution and shape its future destiny.

13
Limitations and Opportunities for Future research
The environmental scan research does not provide discussion of the following topics:
District finances, facilities, and equipment.
Organizational effectiveness (organization structure, services, programs).
Student learning outcomes.

14

15
Demographic
Trends Gender
Place ofBirth
Ethnicity
Age
Population

16
Population GrowthCalifornia population grew from 1.2 million in 1890 to more than 36 million in 2005.Contra Costa County population grew from 18,000 in 1900 to 1,018,000 in 2005. One million persons were added in the past 100 years.Each 10-year period witnessed a double- digit growth rate (18% to 76%).Growth after WWII was a phenomenal 198%, resulting in creating the baby boomer generation.

17
Population Growth in California,1850 to 2004
California Population,1850 to 2004
0.0
5.0
10.0
15.0
20.0
25.0
30.0
35.0
40.0
Years
Popu
latio
n in
Mill
ions
Population 0.1 0.6 1.2 2.4 5.7 10.6 20.0 29.8 33.9 35.9
1850 1870 1890 1910 1930 1950 1970 1990 2000 2004

18
Population Growth in Contra Costa County, 1900 to 2000
Contra Costa Population, 1900 to 2000
0
200,000
400,000
600,000
800,000
1,000,000
Population 18,046 31,674 53,889 78,608 100,450 298,984 409,030 556,116 656,380 803,732 948,816
1900 1910 1920 1930 1940 1950 1960 1970 1980 1990 2000

19
Rate of Growth, 1900 to 2000Rate of Population Growth in Contra Costa
County, 1900 to 2000
0%
40%
80%
120%
160%
200%
% 76% 70% 46% 28% 198% 37% 36% 18% 22% 18%
1900 - 1910
1910 - 1920
1920 - 1930
1930 - 1940
1940 - 1950
1950 - 1960
1960 - 1970
1970 - 1980
1980 - 1990
1990 - 2000

20
Population Projections
The population of Contra Costa County grew from 948,816 in 2000 to 1,017,787 people in 2005, or 7.3% during this five-year period.
Demographers project that the county’s population will continue to grow at a slower rate than it has over the past two decades, adding more than 400,000 persons by the year 2025.

21
Population Projections to 2025
Population Projection for Contra Costa County2000 to 2025
500,000
1,000,000
1,500,000
Population 948,816 1,034,834 1,116,298 1,220,021 1,327,081 1,436,048
2000 2005 2010 2015 2020 2025

22
Population Growth by Region
Between 1990 and 2000, population growth by region was:
East County increased by 40%West County grew by 13%Central County increased by 12%
Future growth will most likely be in in the Eastern and Southern parts of the county due to land availability and housing affordability.

23
Population Growth in Contra Costa County by Region, 1990 to 2000
Count Percent
East 169,912 238,345 68,433 40.3%
West 216,406 244,180 27,774 12.8%
Central 417,415 466,292 48,877 11.7%County Total 803,733 948,817 145,084 18.1%
Percent of Growth by Region: 1990 to 2000
Region 1990 2000

24
County Regional Differences, 1990 to 2000
Percent of Growth in Population by Region, 1990 to 2000
0.0%
10.0%
20.0%
30.0%
40.0%
50.0%
% 40.3% 12.8% 11.7% 18.1%
East West Central Total
25
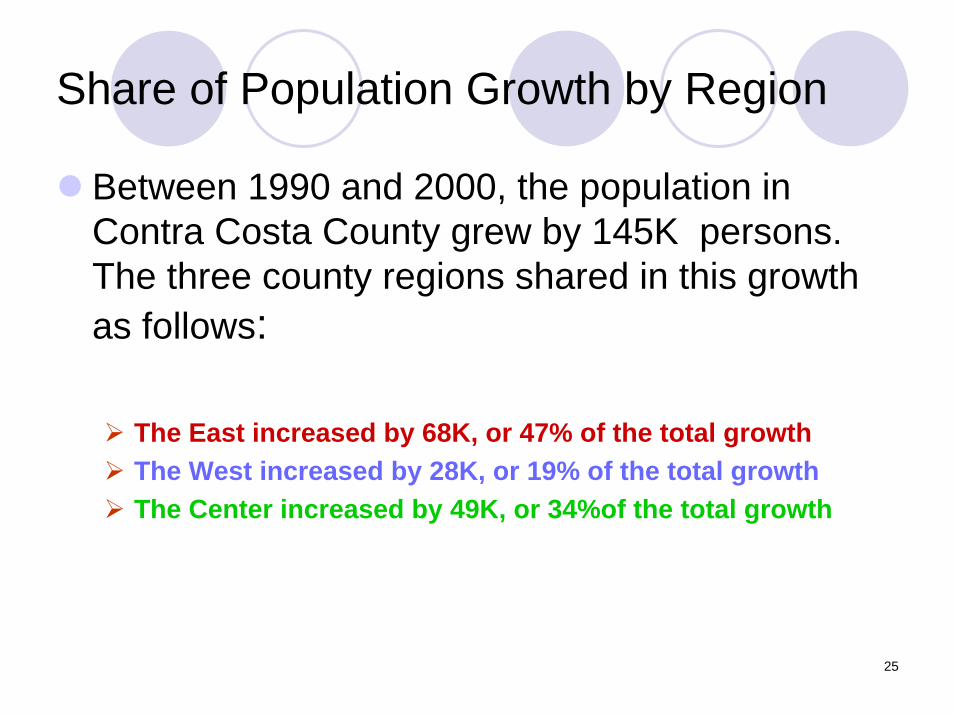
Share of Population Growth by Region
Between 1990 and 2000, the population in Contra Costa County grew by 145K persons. The three county regions shared in this growth as follows:
The East increased by 68K, or 47% of the total growth The West increased by 28K, or 19% of the total growth The Center increased by 49K, or 34%of the total growth

26
Share of County Population Growth by Region1990 to 2000
CountShare of
County Total CountShare of
County Total Count
Share of County Growth
East 169,912 21.1% 238,345 25.1% 68,433 47.2%
West 216,406 26.9% 244,180 25.7% 27,774 19.1%
Central 417,415 51.9% 466,292 49.1% 48,877 33.7%
County Total 803,733 100.0% 948,817 100.0% 145,084 100.0%
Region
Population Growth1990 2000

27

28
Gender
There are more females than males in the County due to:
The longer life expectancy for womenLocation of Rossmoor in central county
The ratio of men per 1,000 women increased from 959 to 981 (1990 to 2004), due the impact of foreign immigration. Immigrants tend to be mostly males.

29
Gender: County TotalGe nde r Dis tr ibution in Contra Cos ta
County 1990 and 2004
0.0%
20.0%
40.0%
60.0%
Male 49.0% 49.5%
Female 51.0% 50.5%
1990 2004

30
Gender Distribution in Contra Costa County, 1990 and 2004
Count % Count % Count %
Male 393,448 49.0% 494,156 49.5% 100,708 25.6%
Female 410,284 51.0% 503,687 50.5% 93,403 22.8%
Total Population 803,732 100.0% 997,843 100.0% 194,111 24.2%
Females > Males 16,836 2.1% 9,531 1.0% (7,305) -2.8%
Ratio of Men per 1,000 Women 959 981 22
Gender 1990 2004 Change

31
Gender by Region
East County has the highest ratio of men per 1,000 women due the movement of young families to the area (husband and wife are present).West County has the lowest ratio of men to women due to population aging and the existence of a larger percentage of female households.Central County has a mix of the young in the south (San Ramon) and the old in the north (Rossmoor)

32
Gender by Region, 2000Ge nde r in Contr a Cos ta County 2 0 0 0
45 .0%
46 .5%
48 .0%
49 .5%
51 .0%
52 .5%
54 .0%
Eas t 49 .3% 50 .7%
W es t 48 .4% 51 .6%
Cen tra l 48 .6% 51 .4%
To ta l 48 .8% 51 .2%
Ma le Fema le

33
Ratio of Men to Women by Region, 2000
Ratio of Males per 1,000 Females by Regions in Contra Costa County, 2000
920
930
940
950
960
970
980
Ratio 972 938 946 953
East West Central County Total

34
Implications
More females on College campuses.
There are other factors that may favor larger female enrollment in higher education. See the section on enrollment by gender.
Gradually, males are becoming the endangered species on some college campuses.
College recruitment and marketing policies should take this change into consideration.

35

36
Age: County Total
This is a relatively mature county where the Median age is:
37.1 years for the County34.2 years for California36.0 years for USA
The dominant age groups represent the Baby Boomer Generation (25-44 yrs in 1990; 45-64 yrs in 2004)By 2030, the 65+ will increase from 11% to 18% (Baby Boomers).

37
Age: County TotalAge Distribution in Contra Costa County
1990 and 2004
0.0%
10.0%
20.0%
30.0%
40.0%
1990 25.1% 9.0% 35.1% 19.9% 10.9%
2004 26.1% 8.7% 28.1% 26.1% 10.9%
Under 18 18 to 24 25 to 44 45 to 64 65 plus

38
Age by Regions
Youth, below 25 YearsEast has more youth, 41%; new communities, young familiesCenter has less, 31%; older, established communitiesWest falls in between, 36%; proximity to UC Berkeley
Middle Age and Elderly, Above 45 YearsEast has less at 27%Center has more at 38%; impact of RossmoorWest falls in between, 33%

39
Age by Regions
Age Distribution by Geographical Areas in Contra Costa County, 2000
0.0%
10.0%
20.0%
30.0%
40.0%
East County 35.0% 5.9% 32.4% 19.1% 7.6%
West County 29.1% 6.7% 31.0% 22.2% 11.0%
Central County 26.1% 4.7% 30.0% 25.9% 13.3%
Contra Costa County 28.9% 5.3% 30.6% 23.9% 11.3%
Under 20 20 to 24 25 to 44 45 to 64 65 plus

40
Implications
The population is gradually shifting toward a much older age distribution due to the significant size of the baby boomer generation, particularly in the center of the county.
Younger families will reside mostly in the East and South, while population in the Center and West will be aging.
41
Implications
Educational programs offered by each community college must change to meet the demographic make-up of the population. DVC remains a regional institution that attracts 40% of its students from outside its service area.

42

43
Ethnicity: County Total
Between 1990 and 2004 there was a significant change in the number and proportionate share of ethnic groups in Contra Costa County:
The number of Whites declined by almost 20K or 3.5% and their relative share of the total population in the county dropped from 70% to 54%.
44
Ethnicity: County Total
The number of Hispanics increased by 114k or 125%. Their share of the population almost doubled from 11% to 21%.
The number of Asians grew by 60K, or 81%. Their share of the population in the county increased from 9% to 13%.

45
Ethnicity: County Total
The number of African Americans increased by 18K, but their relative share of the population remained unchanged at 9%.The number of Native Americans increased by approximately 1,000 persons, but their relative share of the population declined from 0.6% to 0.5%.

46
Change in the Ethnicity of Contra Costa County Population, 1990 to 2004
Count Percent Count PercentWhite 560,146 69.7% 540,349 54.2%African American 72,799 9.1% 91,164 9.1%Native American 4,441 0.6% 5,439 0.5%Asian/Pacific Islander 73,810 9.2% 133,483 13.4%Other Race 1,254 0.2% 1,006 0.1%Two or More Races 21,248 2.1%Hispanic (of any Race) 91,282 11.4% 205,154 20.6%Total 803,732 100.0% 997,843 100.0%
20041990Ethnic Group Count %
(19,797) -3.5%18,365 25.2%
998 22.5%59,673 80.8%
(248) -19.8%21,248
113,872 124.7%194,111 24.2%
Change: 1990 to 2004

47
Ethnicity: County TotalEthnicity
0.0%
10.0%
20.0%
30.0%
40.0%
50.0%
60.0%
70.0%
80.0%
1990 69.7% 9.1% 0.6% 9.2% 0.2% 0.0% 11.4%
2004 54.2% 9.1% 0.5% 13.4% 0.1% 2.1% 20.6%
White African American
American Indian or Alaska
Asian or Pacific Islander
Other Race Two or more races
Hispanic (o f any race)

48
Ethnicity by Regions, 2000
Whitesrepresent a majority in the East (61%)and Center (79%), but the largest minority in the West (37%)
African Americansaccount for 11% in the East, 1.9% in theCenter, and 26% in the West

49
Ethnicity by Regions, 2000Asiansrepresent 8% in the East, 10% in the Center, and 19% in the West.
Hispanicsaccount for 26% in the East, 11% in the Center, and 24% in the West.
In Summary, the East has majority Whites and Hispanics, the Center has majority Whites, and the West has no dominant group.

50
Ethnicity by Regions, 2000Ethnicity by County Regions, 2000
0.0%
20.0%
40.0%
60.0%
80.0%
East County 61.4% 10.7% 8.3% 0.8% 12.0% 6.8% 26.1%West County 36.6% 25.7% 18.9% 0.6% 12.6% 5.6% 24.3%Central County 79.3% 1.9% 10.0% 0.5% 4.2% 4.2% 11.0%Contra Costa County 65.5% 9.4% 11.4% 0.6% 8.1% 5.1% 17.7%
White African American
Asian / Pac.
Islander
Native American
Some Other Race
Two or More Races
Hispanic (of any Race)

51
Implications
As the number and percentage of Asians and Hispanics continue to grow in the future, colleges should plan to address issues related to the new wave of student population, particularly in the areas of student services.
Basic skills, ESL, and bilingual services should be enhanced and strengthened.
Faculty and staff diversity should be enhanced to serve as role models for the new generation of students.

52

53
Place of Birth
Between 1990 and 2004, there was a significant increase in the number and percentage of foreign-born residents:
The number of foreign–born residents almost doubled from 107K to 210K, or an increase of 103K persons. Accordingly, their proportionate share of the population increased from 13% to 21%.
The 103K increase in foreign-born residents represented 53% of the total 194K increase in county population during this period.

54
Place of Birth
Most of the increase among foreign-born residents came from Latin America (42%), Asia (41%), and Europe (11%). Few were born in Africa or OceaniaIn contrast, the number of residents born in other US states outside of California declined by 50K. And their proportionate share shrunk from 35% to only 23%. In effect, there is a negative domestic migration out of California.

55
Place of Birth: County Total
0.0%
20.0%
40.0%
60.0%
1990 52.1% 34.5% 13.3%
2004 55.6% 23.3% 21.1%
Born in California Born in Different State
Foreign-Born
Nativity of Birth in Contra Costa County

56
Place of Birth by Regions
In the East, the majority of foreign-born (57%) came from Latin America, while 32% came from Asia, and 6% from Europe.In the West, foreign-born residents came almost equally from Latin America (47%) and Asia (44%); 5% from Europe.In the Center, 43% of foreign-born came from Asia, 24% from Latin America, and 20% from Europe.
57
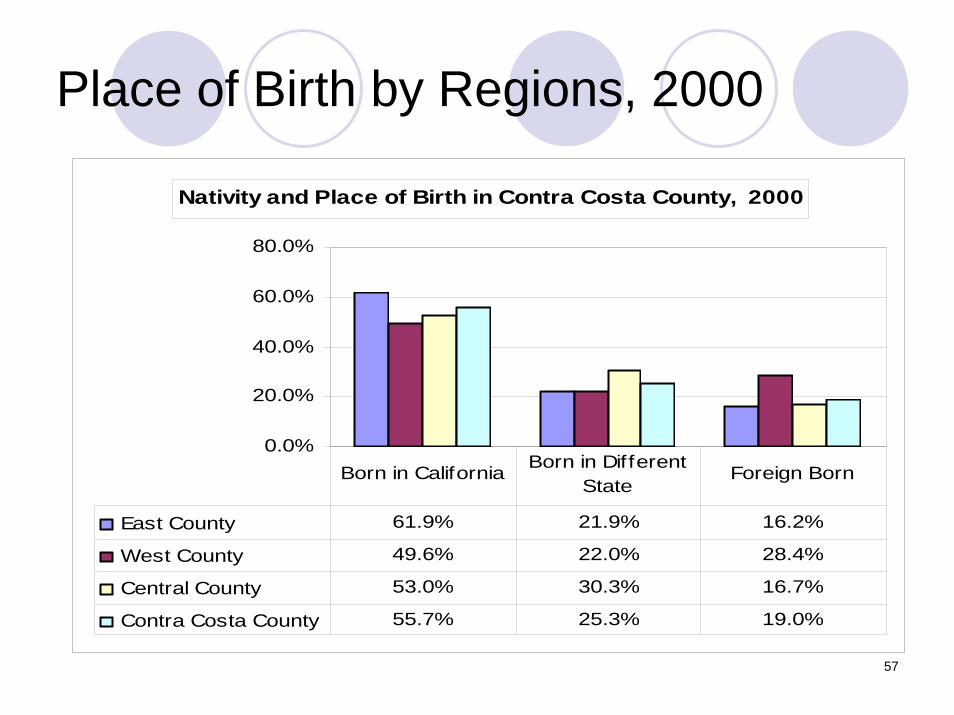
Place of Birth by Regions, 2000
Nativity and Place of Birth in Contra Costa County, 2000
0.0%
20.0%
40.0%
60.0%
80.0%
East County 61.9% 21.9% 16.2%
West County 49.6% 22.0% 28.4%
Central County 53.0% 30.3% 16.7%
Contra Costa County 55.7% 25.3% 19.0%
Born in California Born in Different State
Foreign Born

58
Region of Birth of Foreign-BornRegions of Birth of Foreign-Born in
Contra Costa County, 2004
0.0%
10.0%
20.0%
30.0%
40.0%
50.0%
Percent 42.3% 40.7% 10.6% 3.6% 1.6% 1.3%
Latin America
Asia Europe North America
Africa Oceania

59
Region of Birth of Foreign-Born
Regions of Foreign-Born by County Area, 2000
0.0%
20.0%
40.0%
60.0%
East County 32.1% 56.6% 6.3% 1.6% 1.6% 1.8%
West County 44.4% 46.9% 5.0% 0.9% 1.9% 0.9%
Central County 43.4% 28.9% 19.7% 4.3% 2.3% 1.4%
Contra Costa County 41.1% 40.8% 12.1% 2.6% 2.0% 1.4%
Asia Latin America
Europe North America
Africa Oceania
60
Implications
ESL programs should be expanded on college campuses.
Bilingual services should become accessible to students on each campus.
Attracting the new immigrants to college education represents a major challenge for educators and for the marketing department.

61
Implications
Enhancing faculty and staff diversity is important in serving as role models for the new wave of students.
Implementation of multicultural programs on college campuses is necessary to prepare all students to be competent, both culturally and globally.

62

63
Language Spoken at Home: County Total
Between 1990 and 2004, the number of persons speaking a language at home other than English more than doubled (134K to 273K).
The proportion of those who spoke languages other than English at home increased from 18% to 29%, while the percentage of those who spoke English only declined from 82% to 71%.
Spanish is the dominant foreign language (55%), followed by Asian languages (28%).

64
Language Spoken at Home: County TotalLanguage Spoken at Home in
Contra Costa County
0.0%
25.0%
50.0%
75.0%
100.0%
1990 82.0% 18.0%
2004 70.7% 29.3%
English Only Language Other Than English

65
Languages Spoken at Home by Regions
East: 26% of the population 5 years and older spoke a foreign language at home.
West: 39% spoke a language other than English at home. This is the highest percentage in the County and it approached that of the state at 41% (US 19%). In San Pablo, 58% spoke a language other than English at home.
Central: 21% spoke a foreign language at home.

66
Language Spoken at Home by Regions
La ngua ge S pok e n a t Hom e by County Re gion, 2 0 0 0
0.0%
20.0%
40.0%
60.0%
80.0%
100.0%
Eas t County 73.6% 26.4%
W es t County 61.0% 39.0%
Centra l County 79.5% 20.5%
Contra Cos ta County 74.0% 26.0%
Englis h On ly Speak a Language Other Than Eng lis h
67
Implications
Each college must establish programs that address the unique needs of its service area. There is no cookie cutter.
Colleges should be prepared to absorb the new influx of students with complex backgrounds and different aspirations.
Expansion of the ESL programs and communicating in multiple languages is no longer a luxury; it is a necessity.

68

69
EducationalOpportunity
Competition
Participation
High Schools
Ed Attainment

70
Educational Opportunity
School Enrollment Educational AttainmentHigh Schools Population Participation RatesCompetition
71
School Enrollment• Total Enrollment in county schools and colleges
increased from 214K in 1990 to 281K in 2004, an increase of 67K, or 31%. The overall population growth during this period was 24%.
The faster growth in school enrollment suggests that families with school age children have moved to the county in large numbers between 1990 and 2004.

72
School Enrollment
The increase in school enrollment was uneven:
K-12 Enrollment:grew from 150K to 216K, an increase of 66K or 44%. The proportionate share of K-12 enrollment increased from 70% to 77%.
College Enrollmentgrew from 63K to 64K, a meager increase of 1K or 2%.The proportionate share of total college enrollment dropped from 30% to 23%.

73
School Enrollment
The slower growth in college enrollment suggests one or more of the following:
Lower college-going rates for HS graduatesAdult learners are not attending college in large numbersNew immigrants are moving into the county but they are bypassing college altogether

74
School Enrollment, 1990 and 2004
Count % Count %
K-12 Enrollment 150,252 70% 216,076 77%
College Enrollment 63,455 30% 64,447 23%
Population 3 Years and Older 213,707 100% 280,523 100%
School Enrollment in Contra Costa County, 1990 and 2004
1990 2004School Enrollment by Level

75
Change in School Enrollment
Count %
K-12 Enrollment 150,252 216076 65,824 44%
College Enrollment 63,455 64447 992 2%
Population 3 Years and Older 213,707 280523 66,816 31%
Change in School Enrollment in Contra Costa County: 1990 to 2004
1990 2004Change
School Enrollment by Level

76
School Enrollment by RegionsElementary Schools (K-8)
East 60% (Young families) West 55%Central 54%
High Schools (9-12)East 21%West 19%Central 21%
CollegesEast 19%West 26% (UC Berkeley factor) Central 25% (Several higher ed. institutions in the area)
.
77
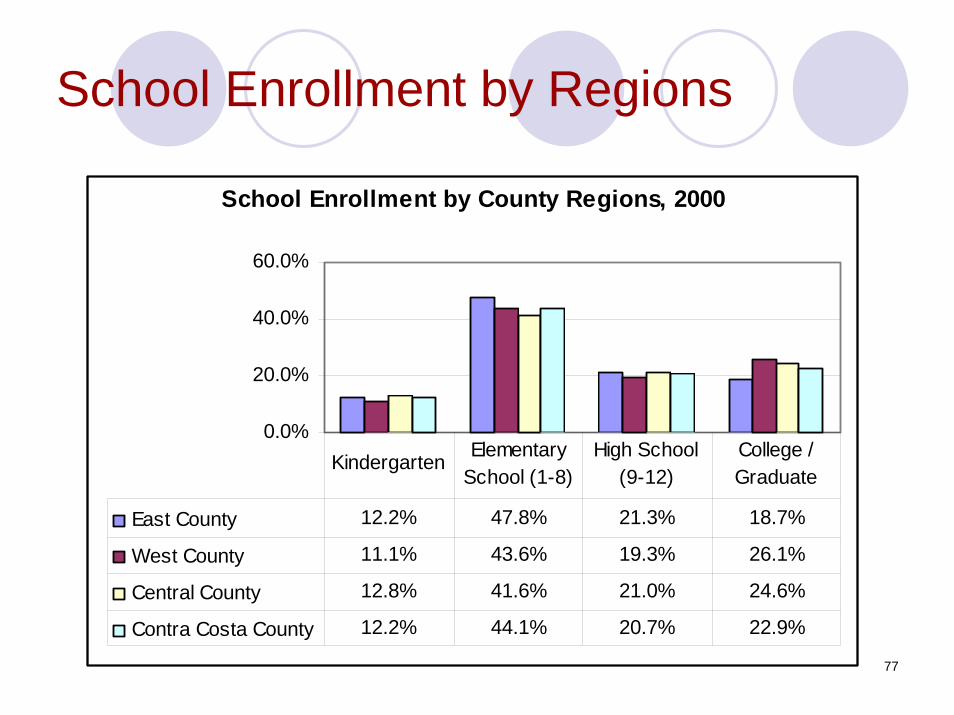
School Enrollment by Regions
School Enrollment by County Regions, 2000
0.0%
20.0%
40.0%
60.0%
East County 12.2% 47.8% 21.3% 18.7%
West County 11.1% 43.6% 19.3% 26.1%
Central County 12.8% 41.6% 21.0% 24.6%
Contra Costa County 12.2% 44.1% 20.7% 22.9%
Kindergarten Elementary School (1-8)
High School (9-12)
College / Graduate
78
School Enrollment by Regions
Regional differences reflect the characteristics of the community, population movement, and proximity to other institutions in the area.

79

80
Educational Attainment
This is the most important indicator of economic opportunity and upward mobility. It impacts the following:
Family incomeHousing costPoverty ratesCrime ratesQuality of lifeQuality of public high school educationOther factors

81
Educational Attainment and Income
Average Family Income by Educational Attainment of Householder, 2004
$0
$50,000
$100,000
$150,000
$200,000
Average Family Income $32,324 $37,194 $55,729 $66,919 $72,097 $99,070 $119,559 $147,529 $165,079
9th Grade 9-12, No Diploma
HS Graduate
Some College,
No Degree
Associate Degree
Bachelor's Degree
Master's Degree
Doctorate Degree
Professional Degree

82
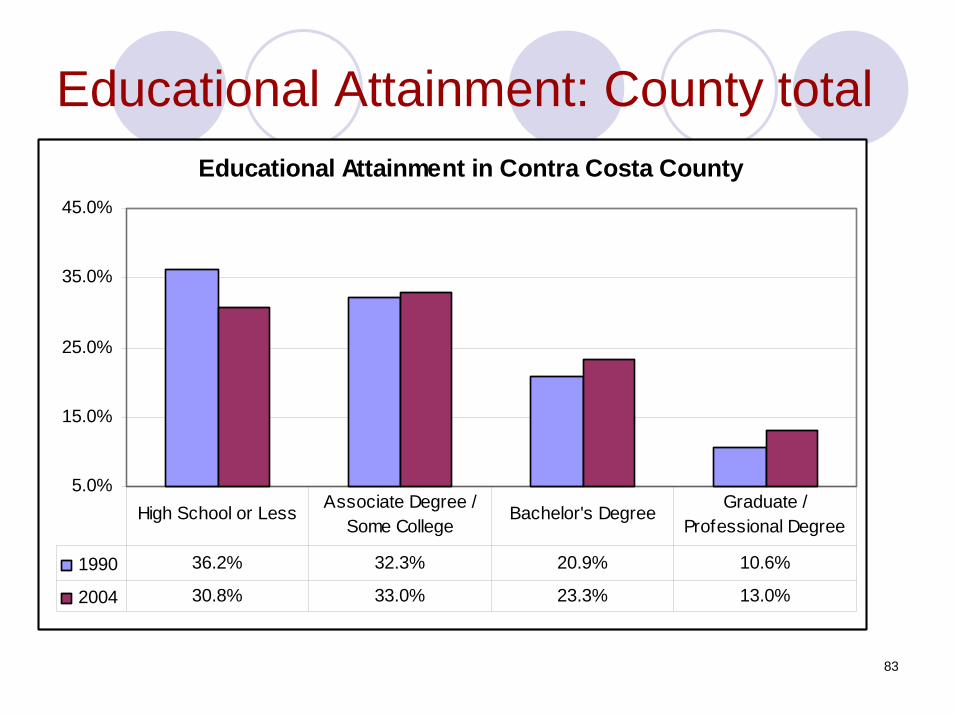
Educational Attainment: County Total
Bachelor’s degree and higher for the population 25 years and older in 2004:
County 36%California 29%
Improvement in the educational attainment in the county:
1990: 31%2004: 36%
83
Educational Attainment: County total
5.0%
15.0%
25.0%
35.0%
45.0%
1990 36.2% 32.3% 20.9% 10.6%
2004 30.8% 33.0% 23.3% 13.0%
High School or Less Associate Degree / Some College
Bachelor's Degree Graduate / Professional Degree
Educational Attainment in Contra Costa County

84
Educational Attainment by Regions
High School or LessEast: 45%West: 42%Central: 23%
Bachelor Degree or HigherEast: 17%West: 28%Central: 46%

85
Educational Attainment by Region
Educational Attainment by Regions, 2000
0.0%
10.0%
20.0%
30.0%
40.0%
50.0%
East County 45.2% 37.8% 12.8% 4.2%
West County 42.0% 30.5% 17.5% 10.0%
Central County 23.5% 30.8% 29.5% 16.2%
Contra Costa County 32.9% 32.1% 22.8% 12.2%
High School or Less
Assoc Degree/Some
College
Bachelor's Degree
Graduate/Professional Degree

86
Educational Attainment by Selected Cities: B.A. and Above:
Antioch 19%Pittsburg 14%
El Cerrito 56% (Close to UCB)Richmond 22%San Pablo 10%
Orinda 74%Lafayette/ Moraga 68%San Ramon 53%%Walnut Creek 51%Concord 26%

87
Implications
The education attainment of the community impacts the mission of the college and provides a mandate for each college to place emphasis on certain programs and services (transfer, vocational, basic skills, life-long learning, etc.)While CCC may place emphasis on basic skills, DVC may focus on the transfer programs, and LMC may enhance its vocational programs.

88

89
Demand for Education Services
Community college enrollment consists of two major categories of students:
Traditional-age students (usually 18 to 24 years old) who attend college following their graduation from high school.
Adult learners (usually 25 years and older) who return to college later in life for various reasons such as retooling, updating knowledge, training for another career or for promotion on the job, or simply for life-long learning and leisure.
.
90
Demand for Education Services
Each one of these two groups will be examined from the perspective of the external environment.
In the section on internal profile, we will have another opportunity to revisit these two groups from the perspective of college access.
In the following slides we will examine 1. High school graduation2. Adult participation in college education

91
High Schools Graduation: County Total
The number of high school graduates and the college going rates are good predictors of enrollment in higher education.
Contra Costa County has 71 high schools that graduate 11K students each year:
27 public schools graduate 9K44 private and alternative schools graduate 2K
92
High Schools Graduates by Region
The number of graduates from the 27 public high schools increased from 6,746 to 9,040, or 34% in 10 years (1995 to 2005).
This growth reflects increased domestic and foreign immigration in the 1980s and 1990s and some natural growth.

93
High Schools Graduates by Region
East: 2,297 graduates in 2004-05, up by 65% since 1995-96 (5 schools) – significant population growth. Two new high schools were added in the past 10 years.
West: 1,762 graduates in 2004-05, up by 19% (8 schools)–-slower growth.
Central: 4,981 graduates in 2004-05, up by 29% (14 schools) -- growth in the east (Clayton) and south (San Ramon).

94
High School Graduates by Region
Percent of Growth in the Number of Public High School Graduates in CCC by Regions,1995-96 to 2004-05
0.0%
20.0%
40.0%
60.0%
80.0%
% of Grow th 65.1% 18.8% 28.6% 34.0%
East County West County Central County County Total

95
Projection of High School Graduates
According to the California Department of Finance, the number of graduates from high schools is expected to reach its peak in 2007-08 and level off for the next five years.
The projections for Contra Costa County are expected to follow a similar pattern.
Actual numbers may be different due to the impact of foreign immigrations, particularly from Asia and Latin America.

96
High School Graduates: CaliforniaProjected High School Graduates in California, 1994-95 to 2012-13
200,000
220,000
240,000
260,000
280,000
300,000
320,000
340,000
360,000
380,000
400,000
1994
-9519
95-96
1996
-9719
97-98
1998
-9919
99-00
2000
-0120
01-02
2002
-0320
03-04
2004
-0520
05-06
2006
-0720
07-08
2008
-0920
09-10
2010
-1120
11-12
2012
-13

97
High School Graduates: Contra Costa
Projected High School Graduates in Contra Cost County2000-01 to 2014-15
6,000
8,000
10,000
12,000
H.S. Grads 9,139 9,667 10,001 10,018 10,125 10,417 10,558 11,042 11,126 10,848 10,757 10,739 10,886 10,737 10,889
00-01 01-02 02-03 03-04 04-05 05-06 06-07 07-08 08-09 09-10 10-11 11-12 12-13 13-14 14-15

98

99
High School Graduation Rate
HS graduation rate represents the percentage of the 9th grade student cohort who receive a high school diploma in four years.
California HS graduation rate for the 2001-02 Cohort was 69.7%. California ranks 30th among the states in HS graduation rate.
Contra Costa HS graduation rate for the 2001-02 Cohort was 71.7%.

100
High School Graduation Rate
HS Graduation Rate - Top Nine and California
20.0%
40.0%
60.0%
80.0%
100.0%
HS Graduation Rate 90.6% 84.7% 83.9% 83.9% 82.4% 81.6% 79.2% 78.6% 78.3% 69.7%
New JerseyMinnesotaUtah No. Dakot Iowa Nebraska So. DakotaWisconsin Idaho California
1 2 3 4 5 6 7 8 9 30
101
High School Graduation Rate
HS graduation rates vary among schools and ethnic groups.
The graduation rates for African Americans and Hispanics in Contra Costa County is almost 20% to 30% below those of Whites and Asians.

102
High School Graduation Rate
High School Graduation Rate in Contra Costa County, 2001-02
20.0%
40.0%
60.0%
80.0%
100.0%
HS Grad Rate 79.4% 78.9% 57.0% 51.9% 71.7%
Asian White African-Am Hispanic Average

103
Academic Performance Index (API)
The Academic Performance Index is a good predictor of HS graduation rate and of preparation for postsecondary education. The API provides scores based on the results of the California Standardized Testing and Reporting (STAR) program. The API rating is between 200 and 1,000.
The educational attainment of the community impacts the schools API index.
The average API for the 27 public schools in the county was 728. There are variations by service areas, with most of central county schools scoring higher than average.

104
API for County HS, 2005Academic Performance Index - 2005
552
563
571
572
648
649
652
653
653
696
701
703
705
705
711
728
733
744
758
818
822
836
836
857
857
871
895
900
500 550 600 650 700 750 800 850 900 950
Kennedy High
Richmond High
M t. Diablo
De Anza High
Pittsburg High
Pino le Valley High
John Swett High
Antioch High
El Cerrito High
Ygnacio Valley
Clayton Valley
Concord
Dear Valley High
Freedom High
Hercules High
Average
Alhambra
College Park
Liberty High
Las Lomas
M iddle College High
California
Northgate
M onte Vista
San Ramon
Acalanes
M iramonte
Campolindo
DVC Service Area
LegendLMC Service AreaCCC Service Area

105
High School College-Going Rates
The college-going rate is a measure of the percentage of high school graduates enrolled at different levels of post-secondary education within one year immediately following graduation.
Current rates are lower than their historical averages and they do not compare well with other states. The changing demographics of the population may have impacted the college-going rates in California and in Contra Costa County.

106
College-Going Rates
College-Going Rate in California, 1993 - 2004
0.0%
10.0%
20.0%
30.0%
40.0%
50.0%
60.0%
College-Going Rate 53.9%53.4%55.7%56.6%54.5%52.5%50.5%51.0%52.2%53.4%48.6%49.5%52.4%
1993 1994 1995 1996 1997 1998 1999 2000 2001 2002 2003 2004 Average
107
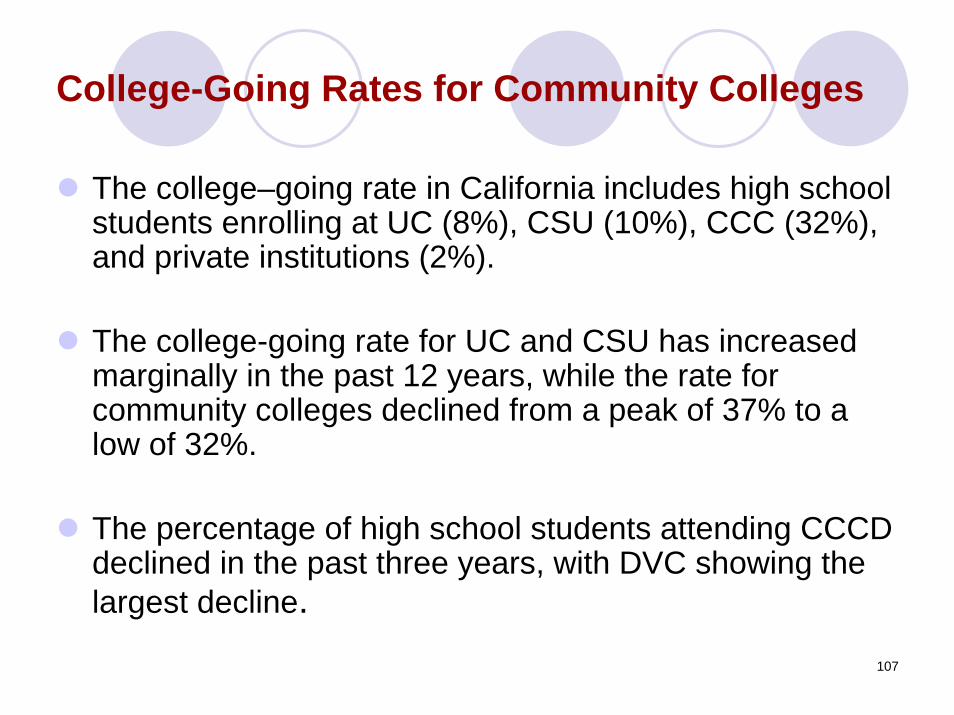
College-Going Rates for Community Colleges
The college–going rate in California includes high school students enrolling at UC (8%), CSU (10%), CCC (32%), and private institutions (2%).
The college-going rate for UC and CSU has increased marginally in the past 12 years, while the rate for community colleges declined from a peak of 37% to a low of 32%.
The percentage of high school students attending CCCD declined in the past three years, with DVC showing the largest decline.
108
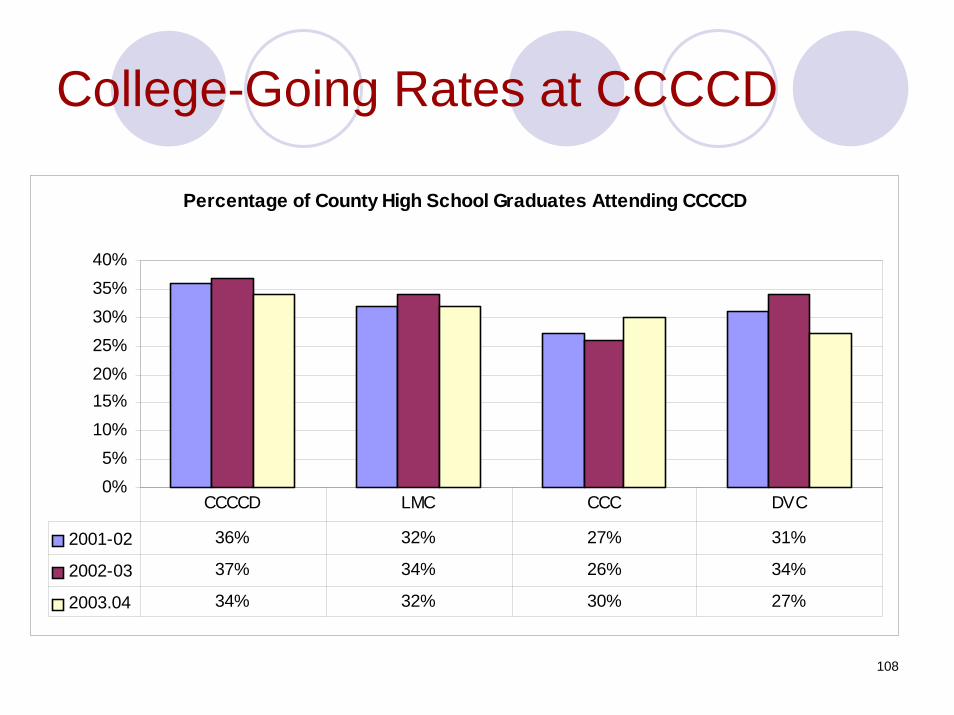
College-Going Rates at CCCCD
Percentage of County High School Graduates Attending CCCCD
0%5%
10%15%20%25%30%35%40%
2001-02 36% 32% 27% 31%
2002-03 37% 34% 26% 34%
2003.04 34% 32% 30% 27%
CCCCD LMC CCC DVC

109

110

111
Adult Participation in College Education
The adult participation rate is the proportion of the general population, 18 to 64 years old, who enroll in community colleges in a given term or academic year. A higher rate will translate into higher enrollment and vice-a-versa.

112
Adult Participation in College Education
In fall 2004, the rate for Contra Costa County stood at 6.1%, compared to 7.3% for California as a whole. These rates represent a decline from the peaks of 7.1% and 8.2%, respectively in 2002.
The gap between the state and the county may be due to the difference is the median age of 37.1 for Contra Costa vs. 34.2 for the state. With an aging population, there is less opportunity for participation.
The decline in participation rates may be due to the increases in tuition and fees and the high cost of books.

113
Adult Participation in College Education
Adult Participation Rate in the County and the StateFall 2000 to Fall 2004
0.0%
2.0%
4.0%
6.0%
8.0%
10.0%
% at CCCCD 6.6% 6.8% 7.1% 6.3% 6.1%
% in System 7.8% 8.2% 8.2% 7.5% 7.3%
Fall 2000 Fall 2001 Fall 2002 Fall 2003 Fall 2004

114
Adult Participation by Regions
The participation rates for county regions is only available for 2000 (US Census). In between censuses, the American Community survey does not break down the data for smaller communities.
East: 8.8%, younger population, higher rateWest: 7.5%, a mix of young and oldCentral: 6.9%, aging population, lower rate

115
Adult Participation in College Education
Adult Participation Rate for Contra Costa County, 2000-01 to 2004-05
4.0%
6.0%
8.0%
10.0%
12.0%
Participation Rate 11.2% 11.8% 11.3% 9.5% 9.1%
2000-01
2001-02
2002-03
2003-04
2004-05

116
Implications
According to the Center for Public Policy and Higher Education, based in San Jose, California, the USA ranks 5th in terms of college participation rates, but it ranks 16th among 27 countries in terms of college completion rates.
Tuition increases, combined with dwindling financial aid contributes to this picture. For most Americans, college affordability has continued to deteriorate.
As the large and well-educated baby boom generation retires, the USA faces a drop off in college-trained workers to replace them.

117
College Participation and College Completion: An International Perspective
ParticipationRank1. Korea 48%2. Greece 43%3. Finland 37%4. Belgium 37%5. USA 35%
GraduationRank1. Japan 26%2. Portugal 25%3. U.K. 24%4. Australia 23%5. Switzerland 23%16. USA 17%

118

119
Market PotentialThe market potential for a community college is the total population, 25 years and older, who have an educational attainment less than an associate degre.
The market poential may be defined broadly to include population in the neighboring counties of Alameda and Solano. Colleges in the district attract a sizable number of students (more than 5,000, or 15%) from these counties.

120
Market Potential: County TotalThe size of the market potential for CCCCD includes more than one million in three counties:
Contra Costa: 358KAlameda: 509KSolano: 156K
The size of the market potential expanded marginally (2%) between 1990 and 2004 due to the rise in the educational attainment of persons with an associate degree or higher.

121
The Market Potential Expanded
Market Potential for Community Colleges inContra Costa County, 2004
0100,000
200,000300,000
400,000500,000
600,000
Some College, No Degree 158,016 186,743 72,990
High School Graduate, NoCollege
134,022 185,963 52,205
Less Than High School 66,077 136,347 31,185
Contra Costa Alameda Solano

122
Market Potential by RegionsThe market potential for each region in the county is different because of the difference in the educational attainment of the population.
The East has highest percentage of market potential, 75% of the population 25 years and older (87K).
The West has a sizable number of 55% of the population 25 years and older (81K).
The Center has the lowest percentage of market potential, 46% of the population 25 years and older (132K)

123
Market Potential
Market Potential by Region
0.0%
20.0%
40.0%
60.0%
80.0%
Some College, No Degree 29.5% 23.6% 22.9%
High School Diploma 27.7% 20.9% 15.8%
Less Than High School 17.6% 21.1% 7.6%
East West Central

124
ImplicationsThe decline in high school college-going rate and the population participation rate present a golden opportunity for the colleges in Contra Costa County to package and market their services to attract the hundreds of thousands of students who could benefit greatly from higher education.

125
Implications
Taking the college to the people by establishing branch campuses or education centers closer to the population centers is an effective way of attracting a larger number of students. This has proven to be a far-sighted policy, in the case of LMC and DVC

126
Implications
The new technologies of distance learning should also be tapped and expanded to reach a much larger student body beyond the traditional college service areas.

127

128
Competition: Supply of Education Services
Competition from postsecondary institutions has a direct impact on student enrollment.
Competition in Contra Costa County includes almost 100 institutions and/or their branches that are located in the county and the neighboring three counties of Alameda, Solano, and San Francisco (a driving distance of 30 to 40 miles).

129
Major Educational Institutions in a Four-County Area (Contra Costa, Alameda, Solano, and San Francisco)
UC, Berkeley and San FranciscoCalifornia State University, Hayward, Concord, Vallejo, SFCalifornia Community Colleges in Hayward, Alameda, Oakland, Berkeley, San Pablo, Pleasant Hill, Pittsburg, and FairfieldSt. Mary’s College in MoragaGolden Gate University in SF and Walnut CreekUniversity of San FranciscoUniversity of the Pacific in SFChapman University in ConcordUniversity of Phoenix Regional Campus in ConcordHeald College in Concord and SFJohn F. Kennedy University in Pleasant Hill

130
Competition: Supply of Education Services
20% of the institutions are public and 80% have different affiliations. However, the majority of students are enrolled in public institutions.
Keen competition for the community colleges comes from for-profit corporations that have become experts in capturing selected markets and are skillful in developing curricula and programs responsive to market demand.

131
Implications
The question for the college is how to compete effectively in this abundant education market.
The answer lies in excellence across the board: in teaching, student learning, services, administration, and accountability for measuring how well things are done.
The broader the focus, the less likelihood of high quality. Effective competition in this market can be best achieved within the context of specifically-defined purpose or creating a niche for one’s educational services.
Ultimately, quality education is defined by the users.

132

133
Socio-economic Factors
Housing
Income
Industry
OccupationsOccupations
Families
134
Family Structure
America’s family structure has changed dramatically in the past 50 years.
In 1955, 60% of the families in the US consisted of a father, a mother, and 2 children. Today, that typical nuclear family of 4 amounts to only 7%. The number of female households with no husband present, and with their own children under 18, increased.The number of married couples who are separated has also increased.

135
Family Structure
America’s divorce rate is one of the highest in the world. Almost one third of all children born in the 50 states were born out of wedlock. 38% of grandparents living in a household with children were responsible for their grandchildren.
Since traditional parents have been the primary educators and chief payers of college tuition, the new pattern of childrearing has had a profound impact on the life of children and on schools.

136
Campus Crime Statistics
CCCCD Campus Crimes 1995 1996 1997 1998 1999 2000 2001 2002 2003 2004
Homicide 0 1 0 0 0 0 0 0 0 0Rape 1 0 1 4 0 1 0 1 2 0Robbery 16 9 9 4 6 1 7 7 5 4Assault 21 20 15 13 15 10 15 11 8 10Burglary 42 23 33 17 25 36 27 22 24 31Theft 354 261 469 246 222 190 201 220 122 139Auto Theft 20 23 17 19 8 19 31 39 36 50Total 454 337 544 303 276 257 281 300 197 234

137
Implications
Increased need for financial aid. (LMC: 37%; CCC: 50%; DVC, 19%)
Students work longer hours (75% of all US undergraduate students work 12 to 40 hours per week to help defray the cost of education.
Impact on success, retention, graduation, probation/suspension, drop out, and time to degree.

138
Implications
Student counseling is impacted heavily by the changing social factors. Students need guidance, not only academically, but also socially and psychologically.
Rising cost of establishing and maintaining security on college campuses. Rising level of campus crimes including theft and vandalism.

139
Implications
Although the Campus crime rates in Contra Costa County community colleges declined, the number is still high, particularly in the area of auto theft.
DVC Campus was closed for two days October 24 and 25 due to bomb threats.

140

141
Industries
Analysis of industry and occupations provide valuable information for developing and enhancing the occupational programs.
The total number of employed civilian population in the county stood at 470K in 2004, compared to 410K in 1990, a 15% increase.
Manufacturing continued to decline as many companies moved overseas to take advantage of cheap labor and lower cost of operations.

142
Industries
The service sector is the major employer in Contra Costa County. Services that are labor intensive and personal have grown at a faster pace in Contra Costa County:
Education, Health and Social services: 21% in 2004; 14% in 1990Professional and business services:14% in 2004 vs. 8% in 1990Finance, Insurance, and Real Estate: 12% in 2004 vs. 11% in 1990 Leisure and hospitality: 6% in 2004 vs. 1% in 1990

143
Industries in the County, 1990 and 2004Industry in Contra Costa County
0.0%
5.0%
10.0%
15.0%
20.0%
25.0%
1990 14.4% 8.3% 11.4% 15.9% 11.6% 7.8% 1.3% 8.4% 9.2% 4.7% 4.8% 2.2%
2004 20.7% 14.1% 11.8% 10.6% 7.8% 7.6% 6.1% 5.0% 4.9% 4.3% 3.8% 2.9% 0.3%
Educational, Health Care, and Social
Professional and Business
Services
Finance, Insurance, Real Estate, Rental,
Retail Trade Manufacturing ConstructionLeisure and Hospitality
Transportation, Warehousing,
Utilities
Other Services (Except Public
Admin)
Public Administration
Wholesale Trade
InformationAgriculture,
Forestry, Fishing,

144
Industries by RegionPercent of persons employed in industries
East:
Education, health and Social Services 17%Retail Trade, 13%Professional and Business Services 11%Construction 10%Manufacturing 9%
West
Education, health, and Social Services 21%Professional and Business Services 13%Construction 6.5%Manufacturing 8.5%

145
Industries by Region
Central
Education, health and Social Services 17%Professional and Business Services 16%Retail Trade, 12%,Construction 7%Manufacturing 8%
Blue denote services that are higher in that the region comparedto other regions in the county

146
OccupationsTwo out of five persons, 16 years and older, worked in Management, Professional, and Related Occupations, with variations among the regions: East 28%, West 36%, Central 49%
Sales and Office Occupations accounted for 27% in the county, with no significant differences among the regions.

147
Occupations
Construction, Extraction, and Maintenance Occupations accounted for 10% of the occupations in the county, with the highest percentage in the East 14%, compared to 9% for the West, and 7% for the Center.
Production and Transportation Occupationsrepresented 8% of the total occupations in the county. The percentage of persons working in these occupations was 12% in the East, 12% in the West, but only 6% in the Center.

148
Occupations: County TotalOccupation in Contra Costa County, 2000 and 2004
0.0%5.0%
10.0%15.0%20.0%25.0%30.0%35.0%40.0%45.0%
2000 41.0% 28.0% 13.4% 8.5% 8.9% 0.2%
2004 40.7% 27.2% 14.7% 9.5% 7.9% 0.1%
M anagement, Professional,
RelatedSales and Office Service
Production, Transportation, M aterial M oving
Construction, Extraction,
M aintenance, Repair
Farming, Forestry, Fishing

149
Occupations by RegionOccupations in Contra Costa County by Regions, 2000
0.0%
10.0%
20.0%
30.0%
40.0%
50.0%
60.0%
East 27.9% 16.3% 30.0% 0.3% 13.6% 11.8%West 35.9% 16.2% 27.4% 0.2% 8.6% 11.7%Central 48.7% 10.9% 27.7% 0.1% 6.9% 5.8%
Management & Professional Service Sales & Office Farming,
Fishing, Forestry
Construction, Extraction,
Maintenance
Production & Transportation

150
Occupational Outlook 2002 to 2012 in Alameda and Contra Costa
Fastest Growing OccupationsOf the top 25 fastest growing occupations,
14 are in the health care and related industries, 5 are in engineering and construction, and the remaining are in other areas such as environmental cleanup, social and human services, teaching, and software engineering.

151
Occupational Outlook 2002 to 2012 in Alameda and Contra Costa
Fastest Growing Occupations (Top 12)
1. Hazardous Material Removal Workers2. Respiratory Therapists3. Veterinary Technicians4. Social and Human Service Assistants5. Fitness Trainers6. Environmental Engineers7. Architects8. Medical Assistants9. Teachers10. Insurance Sales Agents11. Medical Records12. Home Health Aides

152
Occupational Outlook 2002 to 2012 in Alameda and Contra CostaOccupations with the Most Job Openings (Top 12)
1. Cashiers2. Retail Salespersons3. Waiters4. Food Preparation and Service Workers5. Registered Nurses 6. Office Clerk, General7. Freight, Stock, and Material Movers8. General and operation Managers9. Counter Attendants, Cafeteria, Food Concessions10.Stock clerks11.Customer Service Representatives12.Sales Representatives

153
Implications
Industrial and Manufacturing-related jobs are currently transitioning to a more service-oriented occupations.
Programs in heath care should be strengthened and expanded, particularly for the elderly. This is important for the aging baby boomer generation in central county and for the large number of young children residing in East county. Social services are also important in meeting the needs of the population in West county.

154
Implications
Program in environmental protection and cleanup are important as the state leads the country and the world in reducing environmental pollution.
Developing curricula in areas of bioscience, telecommunication, medical technology are also important in meeting the needs of the community that has become so dependent on the new technologies.

155
Income and Poverty• Median household income:
Contra Costa County $67,823California: $51,185USA: $44.684
• 30% of the households in the County had incomes of $100,000 or more, compared to only 20% in California.
• The relatively high income level is a reflection of the high level of educational attainment in the county.

156
Household IncomeCalifornia and Contra Costa County Income, 2004
0.0%2.0%4.0%6.0%8.0%
10.0%12.0%14.0%16.0%18.0%20.0%
California 7.5% 5.3% 10.8% 10.6% 14.6% 18.4% 12.2% 12.1% 8.5%
Contra Costa 6.5% 3.5% 6.7% 9.6% 12.6% 16.6% 14.1% 15.5% 14.8%
Less than
$10,000
$10,000 to
$14,999
$15,000 to
$24,999
$25,000 to
$34,999
$35,000 to
$49,999
$50,000 to
$74,999
$75,000 to
$99,999
$100,000 to
$149,999
$150,000 or more

157
Income and Poverty
There is a significant income disparity between the “haves” and the “have nots” in the county.
While income for the top tier of the population increased sharply in the past 20 years, income for the bottom tier has declined in real dollars.
Those who go to college seem to do well, while the young people who bear children at the age of 14 and 15 end up on some type of governmental assistance and probably may never finish high school.

158
Income and Poverty
In 2004, the median household income for the wealthiest zip code (94528 - Diablo) was $229,508, compared to the $37,419 for the lowest income zip code (94801 – Richmond).
While the upper middle class has grown, There is a disturbingly large unemployed, dysfunctional class, especially in the large cities.

159
PovertyPoverty Rate in Contra Costa County, 1990 and 2004
0.0%
5.0%
10.0%
15.0%
20.0%
25.0%
1990 5.5% 21.9% 7.3% 10.7% 6.1% 13.6% 5.3%
2004 7.4% 17.6% 9.9% 12.2% 9.1% 20.1% 6.9%
All FamiliesFamilies w / Female, No Husband
All PeopleRelated
Under 18 Years
18 Years and Over
Unrelated15 Years and Over
65 Years and Over

160
Implications
A steadily large number of high income applicants go to elite colleges because the upper class wants the best for Johnny and Susie.
The open admission institutions had to settle for students who are under-prepared for college, have a lower household income, or want to be closer to home or their job.

161
Implications
Some families have discovered the value of community colleges in terms of the quality of teaching, the nurturing environment and the small size of classes (e.g., International students).
Community colleges must invest heavily in basic skills education, tutoring, mentoring, and vocational education.

162

163
Housing AffordabilityMedian Price of a House, Top 15 Most Expensive
Counties in the USA, 2004
$50,000
$150,000
$250,000
$350,000
$450,000
$550,000
$650,000
$750,000
San
Mat
eo, C
A
San
Fran
cisc
o, C
A
Sant
a C
lara
, CA
New
Yor
k, N
Y
Sant
a C
ruz,
CA
Ora
nge,
CA
Mon
tere
y, C
A
Sono
ma,
CA
Alam
eda,
CA
Sant
a Ba
rbar
a, C
A
Vent
ura,
CA
Wes
tche
ster
, NY
San
Die
go, C
A
Con
tra C
osta
, CA
Fairf
ield
, CT
Cal
iforn
ia
USA

164
Housing Affordability Index
Median Housing Cost
Median Household Income
California $391,102 $51,185 7.6:1Contra Costa $465,892 $67,823 6.9:1Difference $74,790 $16,638% Difference 19.1% 32.5%
Median Housing Cost/Median
Household Income
2004
State/County

165
Housing: Regional Diffrences
Housing affordability varies by county regions: East county has a lower indexCentral county has a high indexWest county has can index that falls in between
The attraction of central county is due to the quality of life in general, including quality schools, availability of jobs, low crime rates, and accessibility to the highway infrastructure. This in large respect, reflects the high education attainment which in turn impacts income and cost of housing.

166
Implications
The unaffordable housing market presents a challenge for the recruitment of professional talent to fill faculty and staff positions.
Young people and retired persons on fixed income may not be able to afford the high mortgage payments and may have to relocate to Oregon, Nevada, Arizona, or other states. (See the section on place of birth)

167
Implications
Students who graduate from DVC or other colleges in the county and who move to other states represent a brain drain and a net loss for the state’s tax payers.
Unaffordable housing also impacts industry relocation.

168

169
Quality of Life
TrafficCongestion
Air Quality
PopulationDensity

170
Population Density
CCC has a high population density of 1,414 persons per square mile, compared to 232 for California, and 83 for the US.
High density impacts housing cost, the quality of life, and college enrollment.
Major investment in infrastructure: highways, transit systems, new schools, parks, etc.

171
Population Density, Persons per SM, 2004
Contras ts in Population De ns ity
0.0
500.0
1,000.0
1,500.0
2,000.0
2,500.0
Pop.per Sq.Mi 1,968.9 1,399.4 1,398.9 1,302.6 431.3 232.0 84.0
A lameda County
Sacramento County
Contra Costa
Santa Clara
V entura County
Calif ornia United States

172
Population Density by RegionCounty Area and City Population Land Area in Sq Mi Population Density
East Antioch 90,532 26.9 3,366 Brentwood 23,302 11.6 2,002 Pittsburg 56,769 15.6 3,639
West El Cerrito 23,171 3.7 6,348 Richmond 99,216 30.0 3,307 San Pablo 30,215 2.6 11,711
Central Concord 121,780 30.1 4,046 Pleasant Hill 32,837 7.1 4,631 Martinez 35,761 11.5 3,104 San Ramon 43,761 11.2 3,897 Walnut Creek 64,296 19.9 3,231

173
Commuting to WorkMean Travel Time to Work in Contra Costa County in 2004: 32.2 Minutes
Commuting to Work
0.0%
10.0%
20.0%
30.0%
40.0%
50.0%
60.0%
70.0%
80.0%
1990 71.5% 13.8% 7.8% 5.2% 1.6%
2004 71.3% 12.3% 9.1% 5.8% 1.5%
Drove Alone In CarpoolsPublic
Transportation (excluding
Walked or Worked At Home Other Means

174
Commuting to Work in Contra Costa County 1990 &2004
No. % No. % No. %Workers 16 Years and Over 401,173 100.0% 451,751 100.0% 50,578 12.6%Drove Alone 286,754 71.5% 322,103 71.3% 35,349 12.3%In Carpools 55,488 13.8% 55,357 12.3% -131 -0.2%Public Transportation (excluding taxicab) 31,344 7.8% 41,128 9.1% 9,784 31.2%Walked or Worked At Home 21,024 5.2% 26,296 5.8% 5,272 25.1%Other Means 6563 1.6% 6867 1.5% 304 4.6%Mean Travel Time to Work (Minutes) 29.3 32.2
1990 2004Commuting to Work ChangeContra Costa County

175
Commuting to Work: East
No. % No. % No. %Workers 16 Years and Over 40,712 100.0% 9,229 100.0% 23,942 100.0%Car, truck, or van - Drove Alone 30,194 74.2% 6,844 74.2% 16,117 67.3%Car, truck, or van - Carpooled 6,320 15.5% 1,451 15.7% 4,517 18.9%Public Transportation 1,764 4.3% 197 2.1% 2,033 8.5%Walked 614 1.5% 161 1.7% 366 1.5%Other Means 680 1.7% 88 1.0% 385 1.6%Worked at Home 1,140 2.8% 488 5.3% 524 2.2%Mean Travel Time to Work (Minutes) 41.6 43.8 37.3
Commuting to Work Antioch Brentwood PittsburgEast Contra Contra Costa County

176
Commuting to Work: West
No. % No. % No. %Workers 16 Years and Over 11,867 100.0% 41,745 100.0% 10,405 100.0%Car, truck, or van - Drove Alone 6,884 58.0% 24,738 59.3% 6,165 59.3%Car, truck, or van - Carpooled 1,346 11.3% 8,184 19.6% 2,533 24.3%Public Transportation 2,428 20.5% 6,045 14.5% 1,153 11.1%Walked 183 1.5% 774 1.9% 204 2.0%Other Means 401 3.4% 808 1.9% 185 1.8%Worked at Home 625 5.3% 1,196 2.9% 165 1.6%Mean Travel Time to Work (Minutes) 32.2 34.3 33.4
Commuting to WorkWest Contra Contra Costa County
El Cerrito Richmond San Pablo

177
Commuting to Work: Central
No. % No. % No. % No. % No. %Workers 16 Years and Over 58,700 100.0% 18,820 100.0% 17,456 100.0% 25,431 100.0% 29,901 100.0%Car, truck, or van - Drove Alone 40,508 69.0% 14,575 77.4% 12,655 72.5% 20,266 79.7% 20,744 69.4%Car, truck, or van - Carpooled 8,317 14.2% 1,960 10.4% 1,438 8.2% 2,245 8.8% 2,312 7.7%Public Transportation 5,662 9.6% 1,082 5.7% 1,953 11.2% 1,258 4.9% 4,138 13.8%Walked 1,015 1.7% 267 1.4% 277 1.6% 242 1.0% 601 2.0%Other Means 1,311 2.2% 198 1.1% 256 1.5% 200 0.8% 399 1.3%Worked at Home 1,887 3.2% 738 3.9% 877 5.0% 1,220 4.8% 1,707 5.7%Mean Travel Time to Work (Minutes) 31.9 27.9 30.3 31.3 32.8
San Ramon Walnut CreekCentral Contra Contra Costa County
Commuting to Work Concord Martinez Pleasant Hill

178
Top 10 Counties with Longest Commute, 2004
Rank County
Average Commuting
Time in Minutes
1 Queens, NY 41.72 Richmond, NY 41.33 Bronx, NY 40.84 Kings, NY 39.75 Prince William, VA 36.46 Prince George's, MD 35.57 McHenry, IL 35.18 Nassau, NY 33.29 Orange, NY 32.510 Contra Costa, CA 32.1
California 27.1USA 24.7

179
Productivity Loss from Vehicle Hours of Delay, 2000 & 2004
2000 2004 Count %Alameda 138 61,700 50,540 (11,160) -18% $379Santa Clara 137 51,700 22,910 (28,790) -56% $172Contra Costa 87 16,200 18,520 2,320 14% $139San Mateo 73 18,100 9,550 (8,550) -47% $72San Francisco 19 12,500 9,490 (3,010) -24% $71Marin 28 9,900 7,410 (2,490) -25% $56Sonoma 55 4,300 5,320 1,020 24% $40Solano 79 3,200 2,830 (370) -12% $21Napa 5 - - - n/a $0Bay area 616 177,600 126,570 (51,030) -29% $949
Estimated Annual Loss of Productivity in
2004 (millions of $)County
Freeway Miles in 2004
Daily Vehicle Hours of Delay Change

180
Change in Daily Vehicle Hours of Delay, 2004
Pe rce nt Change in the Daily V e hicle Hours of De layContra Cos ta County and the Bay Are a, 2000 to
2004
-40%
-30%
-20%
-10%
0%
10%
20%
Percent Change,2000 to 2004
-29% 14%
Bay A rea Contra Cos ta

181
Open Space (Acres per Person), 2005Open Space in the Bay Area, 2005
0
0.1
0.2
0.3
0.4
0.5
0.6
0.7
0.8
Acres per Person 0.75 0.72 0.28 0.15 0.15 0.11 0.11 0.07 0.01
Napa Marin Solano Sonoma San Mateo Santa Clara
Contra Costa Alameda San
Francisco

182
Air Quality, CCC, 2005
With respect to air pollution Contra Costa County ranks high among the 58 counties in California. Significant emissions contributing to an unhealthy environment have been reported. With respect to the EPA’s six criteria of air quality, the following 2005 emissions and rank of the county in California indicated a serious challenge facing the county for many years to come:Carbon Monoxide emissions 193,582 tons, rank 9Nitrogen Dioxide emissions 49,361 tons, rank 11PM 2.5 emissions 9,340 tons, rank 15PM 10 emissions 30,265 tons, rank 15Sulfur dioxide 14,447 tons, rank 2

183
CCC Grade of Air Quality, 2005Measures Contra Costa
High Ozone Days Ozone Grade DParticle Pollution - 24 Hour FParticle Pollution - Annual P
Source: American Lung Association State of the Air 2005 Report
Notes: High Ozone Grades are as follows: A=0.0, B=0.3-0.9, C=1.0-2.0, D=2.1-3.2, F=3.3+
Particle Pollution - 24 Hour Grades are the same.Particle Pollution - Annual Grades are:
P = Pass, F = Fail, I = Incomplete.
184
Implications: Why Quality of Life Matters
Environment is a very important resource that should be maintained and enhanced.
Learning to empathize with and extend our compassion to people in other lands, to other species, and to future generations is essential to preserving the integrity of the environment and to the survival of us all.

185
Implications: Why Quality of Life Matters
Educating students, and staff is the first step in environmental preservation. We all must understand the importance of environmental responsibility.
Design of new facilities should take into consideration the creation of a “green campus”that relies on renewable sources of energy and sets examples for others in the community to follow.

186

187
Financing of Higher Education

188
California Community College Revenues, 2004-05
Revenues, 2004-05Other, 10.1%
Federal, 4.1%
Lottery, 2.6%
Student Enrollment Fees,
6.6%
Property Tax, 30.1%
State General Fund, 46.5%
189
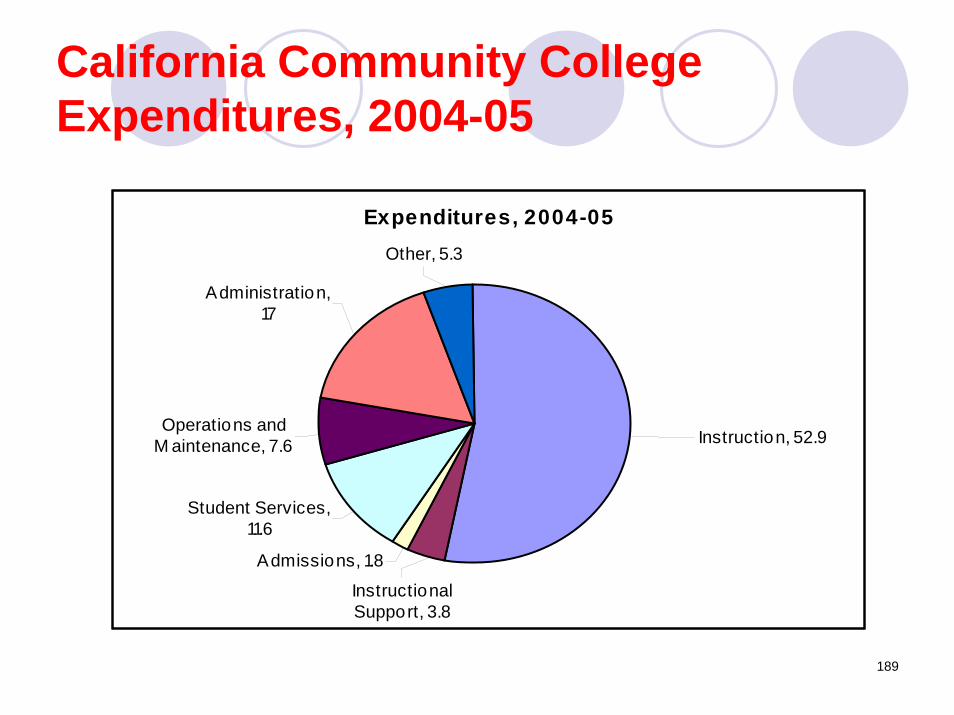
California Community College Expenditures, 2004-05
Expenditures, 2004-05
Admissions, 1.8
Student Services, 11.6
Operations and M aintenance, 7.6
Other, 5.3
Administration, 17
Instructional Support, 3.8
Instruction, 52.9

190
State Funding per FTES
State Funding per FTES, 2004-05
$1,000
$6,000
$11,000
$16,000
$21,000
$26,000
State Funding per FTES $4,560 $10,191 $22,634
CCC CSU UC

191
California FTES in Higher Education, 1965 to 2005
0
200,000
400,000
600,000
800,000
1,000,000
1,200,000
University of California California State Univers ity California Community Colleges

192
Revenue per FTES, 1965 to 2005
$0
$5,000
$10,000
$15,000
$20,000
$25,000
University of California California State University California Community Colleges

193
Revenue per FTES in Constant Dollars, 1965 to 2005
$0
$2,000
$4,000
$6,000
$8,000
$10,000
$12,000
$14,000
$16,000
$18,000
$20,000
University of California California State University California Community Colleges
194
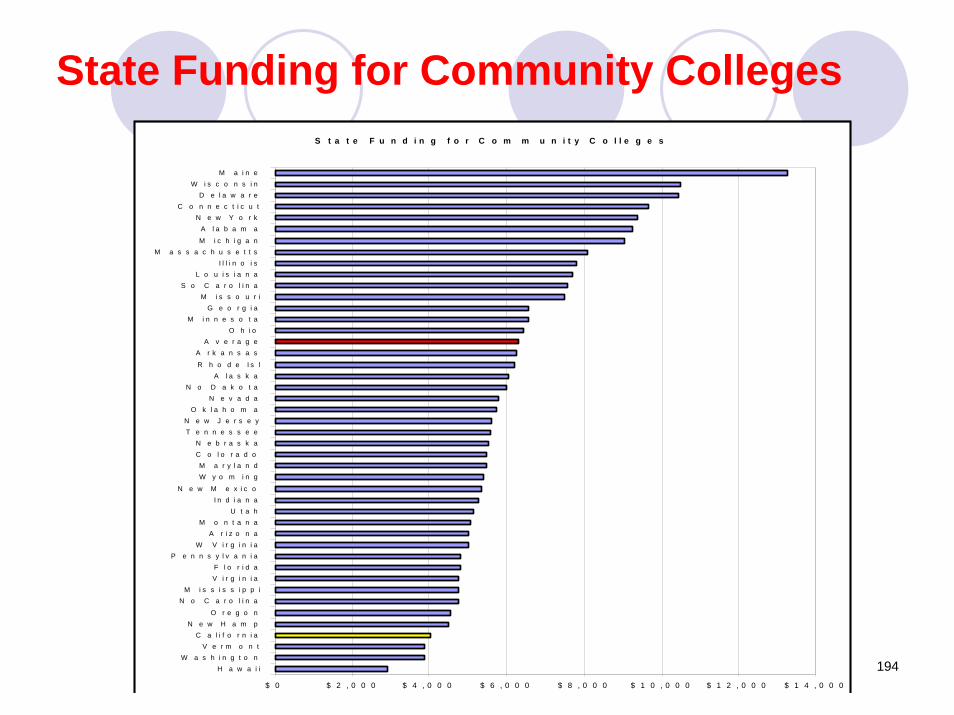
State Funding for Community CollegesS t a t e F u n d i n g f o r C o m m u n i t y C o l l e g e s
$ 0 $ 2 , 0 0 0 $ 4 , 0 0 0 $ 6 , 0 0 0 $ 8 , 0 0 0 $ 1 0 , 0 0 0 $ 1 2 , 0 0 0 $ 1 4 , 0 0 0
H a w a i iW a s h i n g t o n
V e r m o n tC a l i f o r n i a
N e w H a m pO r e g o n
N o C a r o l i n aM i s s i s s i p p i
V i r g i n i aF l o r i d a
P e n n s y l v a n i aW V i r g i n i a
A r i z o n aM o n t a n a
U t a hI n d i a n a
N e w M e x i c o
W y o m i n gM a r y l a n d
C o l o r a d oN e b r a s k a
T e n n e s s e eN e w J e r s e y
O k l a h o m aN e v a d a
N o D a k o t aA l a s k a
R h o d e I s l
A r k a n s a sA v e r a g e
O h i oM i n n e s o t a
G e o r g i aM i s s o u r i
S o C a r o l i n aL o u i s i a n a
I l l i n o i sM a s s a c h u s e t t s
M i c h i g a n
A l a b a m aN e w Y o r k
C o n n e c t i c u tD e l a w a r e
W i s c o n s i nM a i n e

195

196
Internal Profile

197
Internal Profile
Student AccessStudent AchievementHuman ResourcesProductivityPrograms and Curricula

198
Student Access
199
Student Access
Enrollment TrendsGenderAgeEthnicityDay/EveningUnit LoadZip Codes

200
CCCCD Enrollment by FTES, 14 yrs.
FTES at CCCCD, 1992-93 to 2004-05
20,000
22,000
24,000
26,000
28,000
30,000
32,000
34,000
Total 28,087 27,414 28,192 27,740 28,009 28,834 28,925 27,718 29,239 31,233 33,071 31,297 29,602
1992-93
1993-94
1994-95
1995-96
1996-97
1997-98
1998-99
1999-00
2000-01
2001-02
2002-03
2003-04
2004-05

201
FTES Enrollment in the Top 10 Districts in California, 2004-05
Rank District FTES Enrollment
1 Los Angeles 87,1882 Los Rios 44,5953 San Diego 40,1964 Foothill 39,6635 San Francisco 37,1776 North Orange 33,7657 Contra Costa 29,7928 Rancho Santiago 28,8799 Coast 26,647
10 Ventura 25,703
1,088,9942.74%
Total FTES for All 72 DistrictsProportionate Share of CCCCD

202
Headcount Enrollment
CCCCD Student Headcount Enrollment by College 2000-2004
0
5,000
10,000
15,000
20,000
25,000
2000 9,235 7,921 21,365
2001 10,289 8,449 21,737
2002 10,424 10,117 23,260
2003 8,977 8,210 22,137
2004 8,899 8,048 21,112
LMC CCC DVC

203
LMC Enrollment
FTES at LMC, 1992-93 to 2004-05
4,000
5,000
6,000
7,000
8,000
9,000
LMC 5,901 5,879 6,260 6,252 6,448 6,476 6,256 6,211 6,708 7,498 8,158 7,314 6,881
1992-93
1993-94
1994-95
1995-96
1996-97
1997-98
1998-99
1999-00
2000-01
2001-02
2002-03
2003-04
2004-05

204
CCC EnrollmentFTES at CCC, 1992-93 to 2004-05
4,000
5,000
6,000
7,000
CCC 6,146 5,970 6,058 5,863 5,773 5,922 5,782 5,293 5,584 5,992 6,591 5,918 5,716
1992-93
1993-94
1994-95
1995-96
1996-97
1997-98
1998-99
1999-00
2000-01
2001-02
2002-03
2003-04
2004-05

205
DVC Enrollment
FTES at DVC, 1992-93 to 2004-05
14,000
15,000
16,000
17,000
18,000
19,000
DVC 16,041 15,566 15,874 15,625 15,789 16,436 16,887 16,214 16,947 17,743 18,322 18,065 17,004
1992-93
1993-94
1994-95
1995-96
1996-97
1997-98
1998-99
1999-00
2000-01
2001-02
2002-03
2003-04
2004-05

206

207
Gender at CCCCD
Stude nt Ge nde r - CCCCD
0.0%
10.0%
20.0%
30.0%
40.0%
50.0%
60.0%
Male 43.2% 42.1% 42.8% 41.4% 41.9% 41.9%
Female 56.8% 55.5% 54.3% 55.7% 54.7% 54.6%
Unknow n 0.0% 2.4% 2.9% 3.0% 3.4% 3.6%
1992 2001 2002 2003 2004 2005
208
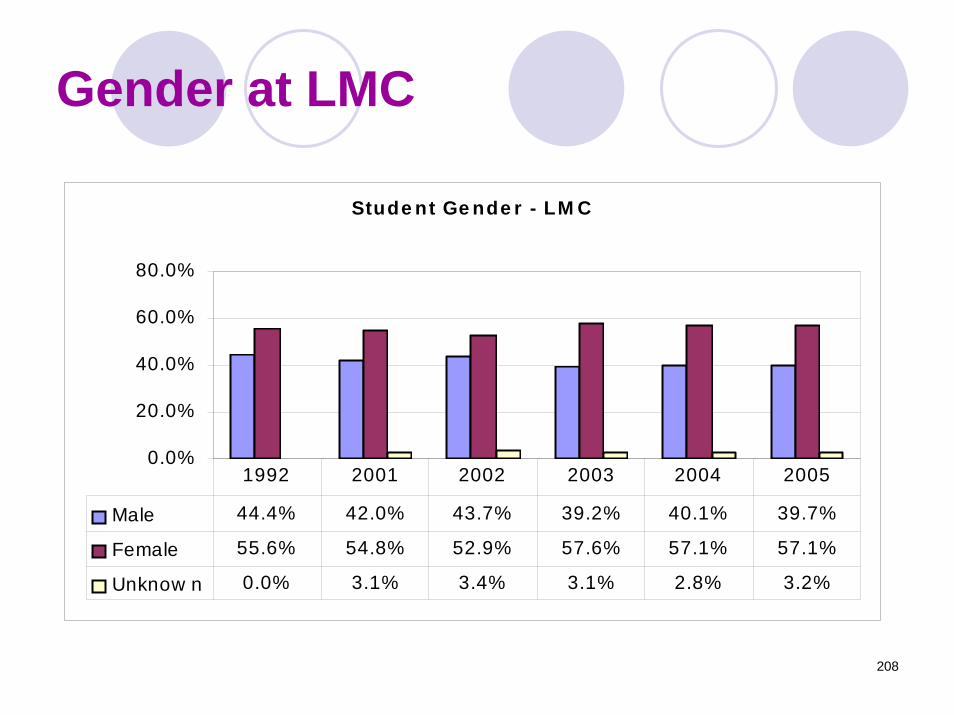
Gender at LMC
Stude nt Ge nde r - LM C
0.0%
20.0%
40.0%
60.0%
80.0%
Male 44.4% 42.0% 43.7% 39.2% 40.1% 39.7%
Female 55.6% 54.8% 52.9% 57.6% 57.1% 57.1%
Unknow n 0.0% 3.1% 3.4% 3.1% 2.8% 3.2%
1992 2001 2002 2003 2004 2005

209
Gender at CCCStu d e n t Ge n d e r - C C C
0.0%
20.0%
40.0%
60.0%
80.0%
Male 39.4% 36.1% 38.7% 34.5% 34.2% 33.7%
Female 60.6% 62.2% 59.0% 61.6% 60.0% 60.7%
Unknow n 0.0% 1.7% 2.3% 3.9% 5.8% 5.7%
1992 2001 2002 2003 2004 2005

210
Gender at DVCStudent Gender - DVC
0.0%10.0%
20.0%30.0%40.0%
50.0%60.0%
Male 44.2% 44.5% 44.3% 44.8% 45.6% 45.7%
Female 55.8% 53.1% 52.9% 52.6% 51.7% 51.3%
Unknow n 0.0% 2.3% 2.8% 2.6% 2.7% 3.0%
1992 2001 2002 2003 2004 2005

211
Ratio of Men per 1000 Women
Ratio of Men per 1000 W omen, 1992 and 2005
0
100
200
300
400
500
600
700
800
900
1000
1992 800 650 792 759
2005 695 555 890 767
LMC CCC DVC CCCCD

212
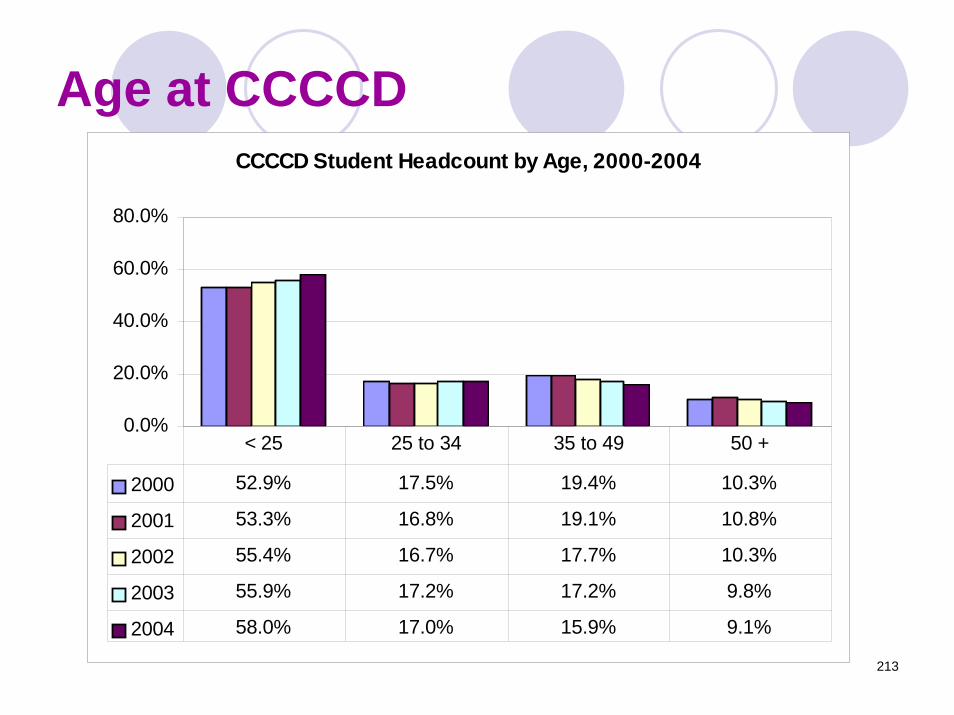
213
Age at CCCCDCCCCD Student Headcount by Age, 2000-2004
0.0%
20.0%
40.0%
60.0%
80.0%
2000 52.9% 17.5% 19.4% 10.3%
2001 53.3% 16.8% 19.1% 10.8%
2002 55.4% 16.7% 17.7% 10.3%
2003 55.9% 17.2% 17.2% 9.8%
2004 58.0% 17.0% 15.9% 9.1%
< 25 25 to 34 35 to 49 50 +

214
Age at LMC
LMC Student Headcount by Age, 2000-2004
0.0%
20.0%
40.0%
60.0%
2000 44.0% 20.1% 27.1% 8.7%
2001 43.7% 19.2% 26.2% 10.9%
2002 47.6% 19.6% 23.1% 9.6%
2003 51.7% 18.5% 21.7% 8.0%
< 25 25 to 34 35 to 49 50 +

215
Age at CCC
CCC Student Headcount by Age, 2000-2004
0.0%
20.0%
40.0%
60.0%
2000 48.5% 17.5% 18.1% 15.9%
2001 51.0% 16.6% 17.6% 14.8%
2002 54.1% 15.3% 17.2% 13.4%
2003 46.6% 18.9% 19.1% 15.3%
< 25 25 to 34 35 to 49 50 +

216
Age at DVC
DVC Student Headcount by Age, 2000-2004
0.0%
20.0%
40.0%
60.0%
80.0%
2000 58.2% 16.3% 16.6% 8.9%
2001 58.7% 15.8% 16.3% 9.1%
2002 59.4% 16.0% 15.5% 9.1%
2003 60.9% 16.0% 14.8% 8.4%
< 25 25 to 34 35 to 49 50 +

217

218
Ethnicity at LMC
LMC Student Headcount by Ethnicity, 2000-2004
0.0%10.0%
20.0%30.0%40.0%
50.0%60.0%
2000 11.7% 10.8% 17.6% 0.9% 51.5% 1.7% 5.8%
2001 11.5% 11.1% 18.2% 1.0% 50.8% 2.1% 5.4%
2002 12.3% 11.7% 19.3% 0.9% 48.4% 2.4% 5.0%
2003 12.3% 12.6% 21.8% 1.0% 44.6% 2.6% 5.1%
2004 13.2% 12.6% 23.2% 0.8% 42.9% 2.4% 4.9%
African-American
Asian Hispanic Native American
White Non-Hispanic
Other Non-White
Unknow n

219
Ethnicity at CCC CCC Student Headcount by Ethnicity, 2000-2004
0.0%
10.0%
20.0%
30.0%
2000 26.6% 20.4% 18.9% 0.6% 25.4% 2.3% 5.8%
2001 25.3% 21.4% 21.3% 0.6% 23.9% 2.4% 5.2%
2002 26.1% 20.3% 23.9% 0.6% 21.1% 2.4% 5.7%
2003 25.6% 21.1% 25.8% 0.5% 19.9% 2.3% 4.8%
2004 26.8% 21.3% 26.2% 0.5% 18.0% 2.8% 4.5%
African-American Asian Hispanic
Native American
White Non-
Hispanic
Other Non-White
Unknow n

220
Ethnicity at DVCDVC Student Headcount by Ethnicity, 2000-2004
0.0%
10.0%
20.0%
30.0%
40.0%
50.0%
60.0%
2000 4.8% 18.2% 10.8% 0.7% 55.9% 3.3% 6.3%
2001 4.8% 18.0% 10.9% 0.7% 54.6% 3.3% 7.7%
2002 4.9% 18.1% 10.8% 0.7% 52.9% 3.2% 9.4%
2003 5.3% 18.5% 11.9% 0.7% 51.1% 3.1% 9.4%
2004 5.8% 18.7% 12.3% 0.7% 50.3% 3.1% 9.1%
African-American
Asian Hispanic Native American
White Non-Hispanic
Other Non-White
Unknow n

221

222
Day/Evening at CCCCDCCCCD Student Headcount By Day/Evening, 2000-2004
0.0%
20.0%
40.0%
60.0%
80.0%
2000 64.5% 32.5% 3.1%
2001 62.4% 33.4% 4.2%
2002 63.7% 33.3% 3.0%
2003 65.0% 31.2% 3.8%
2004 66.2% 29.9% 4.0%
Day Evening Unknow n

223
Day/Evening at LMC
LMC Student Headcount By Day/Evening, 2000-2004
0.0%
10.0%
20.0%
30.0%
40.0%
50.0%
60.0%
70.0%
2000 55.3% 35.9% 8.8%
2001 51.1% 35.7% 13.2%
2002 58.3% 36.7% 5.0%
2003 57.2% 35.5% 7.3%
2004 60.4% 31.4% 8.2%
Day Evening Unknow n

224
Day/Evening at CCCCCC Student Headcount By Day/Evening, 2000-2004
0.0%
20.0%
40.0%
60.0%
80.0%
2000 62.3% 35.3% 2.4%
2001 62.6% 35.9% 1.5%
2002 60.4% 37.2% 2.5%
2003 63.2% 34.1% 2.8%
2004 63.4% 34.2% 2.4%
Day Evening Unknow n

225
Day/Evening at DVC
DVC Student Headcount By Day/Evening, 2000-2004
0.0%
20.0%
40.0%
60.0%
80.0%
2000 69.2% 29.9% 0.9%
2001 67.6% 31.4% 1.0%
2002 67.6% 30.1% 2.3%
2003 68.9% 28.4% 2.7%
2004 69.7% 27.6% 2.8%
Day Evening Unknow n
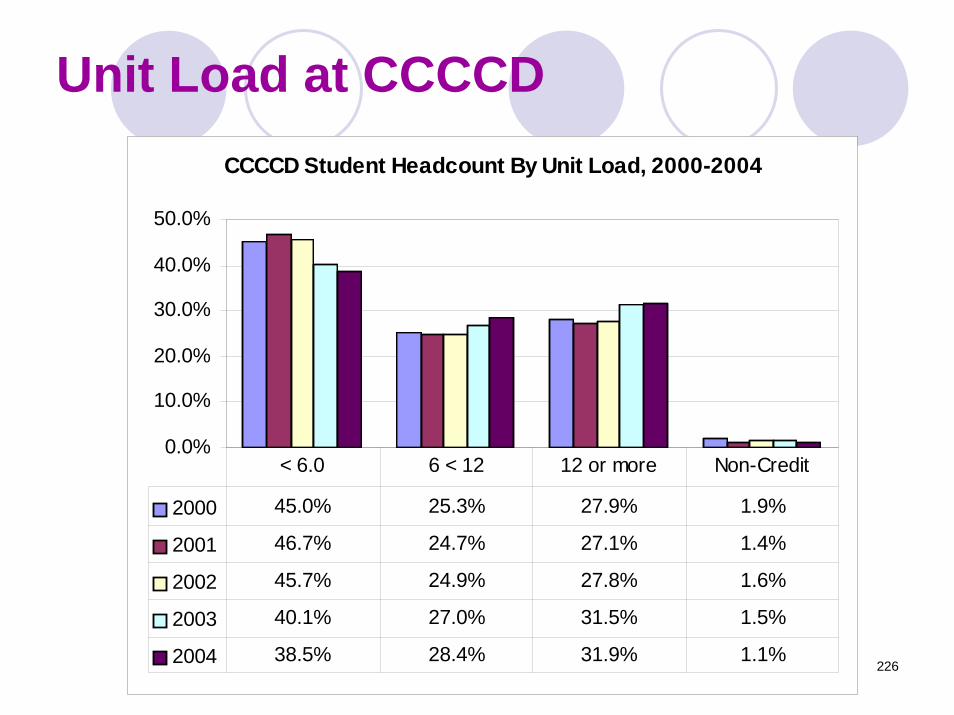
226
Unit Load at CCCCDCCCCD Student Headcount By Unit Load, 2000-2004
0.0%
10.0%
20.0%
30.0%
40.0%
50.0%
2000 45.0% 25.3% 27.9% 1.9%
2001 46.7% 24.7% 27.1% 1.4%
2002 45.7% 24.9% 27.8% 1.6%
2003 40.1% 27.0% 31.5% 1.5%
2004 38.5% 28.4% 31.9% 1.1%
< 6.0 6 < 12 12 or more Non-Credit

227
Unit Load at LMC
LMC Student Headcount By Unit Load, 2000-2004
0.0%
20.0%
40.0%
60.0%
80.0%
2000 57.4% 23.6% 19.0%
2001 58.0% 22.0% 20.0%
2002 56.0% 22.4% 21.5% 0.0%
2003 46.8% 25.7% 27.4% 0.1%
2004 43.3% 27.0% 29.6%
< 6.0 6 < 12 12 or more Non-Credit

228
Unit Load at CCCCCC Student Headcount By Unit Load, 2000-2004
0.0%
10.0%
20.0%
30.0%
40.0%
50.0%
2000 42.4% 25.0% 23.5% 9.1%
2001 45.7% 25.6% 21.9% 6.8%
2002 45.9% 24.5% 22.8% 6.8%
2003 37.4% 28.5% 27.1% 7.0%
2004 38.4% 29.9% 26.2% 5.4%
< 6.0 6 < 12 12 or more Non-Credit

229
Unit Load at DVCDVC Student Headcount By Unit Load, 2000-2004
0.0%
10.0%
20.0%
30.0%
40.0%
50.0%
2000 40.6% 26.1% 33.3% 0.0%
2001 41.8% 25.7% 32.5% 0.0%
2002 40.9% 26.2% 32.9% 0.0%
2003 38.3% 26.9% 34.8% 0.0%
2004 36.6% 28.4% 35.0% 0.0%
< 6.0 6 < 12 12 or more Non-Credit

230
Gender and Age at CCCDCCCCD Enrollment by Gender and Age, Fall 2005
0.0%
10.0%
20.0%
30.0%
40.0%
50.0%
60.0%
70.0%
Female 49.8% 57.8% 65.2% 64.2%
Male 46.6% 39.2% 30.9% 32.8%
<25 25-34 35-49 50+

231
Gender and EthnicityCCCCD Gender and Ethnicity, Fall 2005
0.0%
20.0%
40.0%
60.0%
80.0%
Male 36.3% 37.4% 43.6% 44.1% 45.5% 48.6% 43.3%
Female 60.9% 57.5% 53.6% 53.2% 50.4% 49.8% 49.1%
Unknow n 2.9% 5.0% 2.8% 2.7% 4.1% 1.6% 7.6%
African-Am
Hispanic Asian/PI White Other Native Am Unknow n

232
Age at CCCCD
C C C C D S tu d e n t H e a d c o u n t b y A g e , 2 0 0 1 -2 0 0 5
0 .0 %
1 0 .0 %
2 0 .0 %
3 0 .0 %
4 0 .0 %
5 0 .0 %
6 0 .0 %
7 0 .0 %
1 9 9 2 4 7 .2 % 2 2 .8 % 2 1 .0 % 8 .9 %
2 0 0 1 5 3 .3 % 1 6 .8 % 1 9 .1 % 1 0 .8 %
2 0 0 2 5 5 .4 % 1 6 .7 % 1 7 .7 % 1 0 .3 %
2 0 0 3 5 5 .9 % 1 7 .2 % 1 7 .2 % 9 .8 %
2 0 0 4 5 8 .0 % 1 7 .0 % 1 5 .9 % 9 .1 %
2 0 0 5 6 0 .5 % 1 6 .4 % 1 5 .0 % 8 .2 %
< 2 5 2 5 to 3 4 3 5 to 4 9 5 0 +

233
Ethnicity at CCCCDC C C C D S tu d e n t H e a d c o u n t b y Eth n ic ity, 2 0 0 1 -2 0 0 5
0 .0 %
2 0 .0 %
4 0 .0 %
6 0 .0 %
8 0 .0 %
1 9 9 2 9 .5 % 1 3 .2 % 1 0 .6 % 0 .8 % 6 1 .8 % 0 .9 % 3 .3 %
2 0 0 1 1 0 .8 % 1 6 .9 % 1 4 .9 % 0 .7 % 4 7 .2 % 2 .8 % 6 .6 %
2 0 0 2 1 1 .5 % 1 7 .1 % 1 5 .9 % 0 .7 % 4 4 .5 % 2 .8 % 7 .5 %
2 0 0 3 1 1 .1 % 1 7 .7 % 1 7 .1 % 0 .7 % 4 3 .1 % 2 .8 % 7 .5 %
2 0 0 4 1 2 .0 % 1 7 .8 % 1 7 .8 % 0 .7 % 4 1 .7 % 2 .9 % 7 .2 %
2 0 0 5 1 2 .0 % 1 7 .3 % 1 8 .2 % 0 .7 % 4 1 .1 % 2 .9 % 7 .7 %
A f r ic a n -A me r ic a n A s ia n H is p a n ic
Na tiv e A me r ic a n
W h ite No n -
H is p a n ic
O th e r No n -W h ite
Un kn o w n

234
Ethnicity at LMCL M C S tu d e n t H e a d c o u n t b y Eth n ic ity, 2 0 0 1 -2 0 0 5
0 .0 %
2 0 .0 %
4 0 .0 %
6 0 .0 %
8 0 .0 %
1 9 9 2 7 .5 % 8 .7 % 1 5 .6 % 1 .0 % 6 3 .5 % 0 .6 % 3 .1 %
2 0 0 1 1 1 .5 % 1 1 .1 % 1 8 .2 % 1 .0 % 5 0 .8 % 2 .1 % 5 .4 %
2 0 0 2 1 2 .3 % 1 1 .7 % 1 9 .3 % 0 .9 % 4 8 .4 % 2 .4 % 5 .0 %
2 0 0 3 1 2 .3 % 1 2 .6 % 2 1 .8 % 1 .0 % 4 4 .6 % 2 .6 % 5 .1 %
2 0 0 4 1 3 .2 % 1 2 .6 % 2 3 .2 % 0 .8 % 4 2 .9 % 2 .4 % 4 .9 %
2 0 0 5 1 3 .8 % 1 2 .3 % 2 3 .8 % 0 .8 % 4 1 .8 % 2 .6 % 4 .9 %
A f r ic a n -A me r ic a n A s ia n His p a n ic
Na tiv e A me r ic a n
W h ite No n -His p a n ic
O th e r No n -W h ite Un kn o w n

235
Ethnicity at CCC C C C S tu d e n t H e a d c o u n t b y Eth n ic ity, 2 0 0 1 -2 0 0 5
0 .0 %
1 0 .0 %
2 0 .0 %
3 0 .0 %
4 0 .0 %
1 9 9 2 2 5 .9 % 1 6 .3 % 1 3 .2 % 1 .0 % 3 5 .2 % 1 .0 % 7 .4 %
2 0 0 1 2 5 .3 % 2 1 .4 % 2 1 .3 % 0 .6 % 2 3 .9 % 2 .4 % 5 .2 %
2 0 0 2 2 6 .1 % 2 0 .3 % 2 3 .9 % 0 .6 % 2 1 .1 % 2 .4 % 5 .7 %
2 0 0 3 2 5 .6 % 2 1 .1 % 2 5 .8 % 0 .5 % 1 9 .9 % 2 .3 % 4 .8 %
2 0 0 4 2 6 .8 % 2 1 .3 % 2 6 .2 % 0 .5 % 1 8 .0 % 2 .8 % 4 .5 %
2 0 0 5 2 7 .7 % 2 1 .9 % 2 7 .6 % 0 .5 % 1 5 .1 % 2 .6 % 4 .5 %
A f r ic a n -A me r ic a n A s ia n His p a n ic
Na tiv e A me r ic a n
W h ite No n -
H is p a n ic
O th e r No n -W h ite
Un kn o w n

236
Ethnicity at DVCD V C S tu d e n t H e a d c o u n t b y E th n ic i ty , 2 0 0 1 -2 0 0 5
0 .0 %
2 0 .0 %
4 0 .0 %
6 0 .0 %
8 0 .0 %
1 9 9 2 3 .7 % 1 3 .6 % 7 .6 % 0 .6 % 7 1 .9 % 0 .9 % 1 .7 %
2 0 0 1 4 .8 % 1 8 .0 % 1 0 .9 % 0 .7 % 5 4 .6 % 3 .3 % 7 .7 %
2 0 0 2 4 .9 % 1 8 .1 % 1 0 .8 % 0 .7 % 5 2 .9 % 3 .2 % 9 .4 %
2 0 0 3 5 .3 % 1 8 .5 % 1 1 .9 % 0 .7 % 5 1 .1 % 3 .1 % 9 .4 %
2 0 0 4 5 .8 % 1 8 .7 % 1 2 .3 % 0 .7 % 5 0 .3 % 3 .1 % 9 .1 %
2 0 0 5 5 .7 % 1 7 .8 % 1 2 .6 % 0 .7 % 5 0 .1 % 3 .2 % 9 .9 %
A f r ic a n -A me r ic a n A s ia n His p a n ic
Na tiv e A me r ic a n
W h ite No n -His p a n ic
O th e r No n -W h ite Un kn o w n

237
Ethnicity and AgeCCCCD Age and Ethnicity, Fall 2005
0.0%
10.0%
20.0%
30.0%
40.0%
50.0%
60.0%
African-Am 10.9% 13.2% 15.1% 12.3%
Asian/PI 18.3% 18.1% 13.9% 14.7%
Hispanic 18.8% 21.5% 17.4% 9.1%
White 39.3% 36.8% 44.8% 56.6%
<25 25-34 35-49 50+

238
Day and Evening Classes by AgeCCCCD Enrollment in Day and Evening
Classes by Age, 2005
0%
20%
40%
60%
80%
100%
Day Evening
Day 86% 77% 53% 45% 43% 41% 44%
Evening 13% 20% 41% 48% 50% 53% 52%
19 or Less 20 to 24 25 to 29 30 to 34 35 to 39 40 to 49 50 +

239
Day and Evening Classes by Unit LoadCCCCD Enrollment in Day and Evening Classes
by Unit Load, 2005
0%
20%
40%
60%
80%
100%
Day Evening
Day 37% 66% 88% 94%
Evening 58% 32% 11% 3%
<6.0 Units 6.0< 9.0 Units 9.0< 12.0 Units 12.0+ Units

240
Geographical Locations of Students
InstitutionEast
CountyWest
CountyCentral County
Total from Contra Costa
CountyAlameda County
Solano County
Other Counties
Outside CCC Total
LMC 78.8% 2.2% 13.0% 94.0% 1.9% 1.8% 2.3% 6.0% 100.0%
CCC 1.9% 81.1% 3.7% 86.6% 8.3% 3.5% 1.6% 13.4% 100.0%
DVC 7.9% 11.4% 62.5% 81.8% 8.6% 6.8% 2.8% 18.2% 100.0%
CCCCD 23.0% 24.9% 37.8% 85.7% 7.0% 4.9% 2.4% 14.3% 100.0%

241
Student Achievement

242
Student Achievement
Success and RetentionDegrees and CertificatesTransfer to Four-Year InstitutionsBasic Skills Improvement

243
Success Rates by College
CCCCD Success Rates, Fall 2001-Fall 2005
62.0%
64.0%
66.0%
68.0%
70.0%
72.0%
Fall 2001 67.8% 69.4% 68.7% 68.6%
Fall 2002 66.2% 69.3% 70.5% 69.3%
Fall 2003 69.2% 67.4% 71.0% 70.0%
Fall 2004 67.9% 65.4% 70.6% 69.0%
Fall 2005 66.8% 65.2% 70.7% 68.8%
LMC CCC DVC CCCD

244
Success by Ethnicity
CCCCD Course Success Rates by Ethnicity, Fall 2005
50.0%
55.0%
60.0%
65.0%
70.0%
75.0%
80.0%
Fall 2005 76.3% 72.4% 70.7% 68.8% 67.8% 67.1% 65.7% 54.2%
Unknow n White Asian/PI Average Native Am
Other NW Hispanic African Am

245
Success by Ethnicity
CCCCD Suc c e s s Ra te s by Ethnic ity, Fa ll 2 0 0 1 -Fa ll 2 0 0 5
40.0%
50.0%
60.0%
70.0%
80.0%
Fall 2001 58.3% 70.3% 64.7% 64.9% 66.1% 71.4% 72.9%
Fall 2002 57.8% 71.6% 65.1% 63.0% 65.5% 72.3% 75.0%
Fall 2003 56.3% 71.5% 65.8% 65.0% 66.1% 73.7% 76.2%
Fall 2004 53.8% 71.0% 65.7% 61.8% 67.4% 72.9% 75.9%
Fall 2005 54.2% 70.7% 65.7% 67.8% 67.1% 72.4% 76.3%
A f r ic an A m A s ian/PI His panic Nativ e A m Other NW W hite Unknow n

246
Gaps in Success Rates
7.5%
3.6%
1.9%
0.00%
-1.0%
-1.7%
-3.1%
-14.6%
-20.0% -15.0% -10.0% -5.0% 0.0% 5.0% 10.0%
Unknow n
White
Asian/PI
Average
Native Am
Other NW
Hispanic
African Am
Gap Between Ethnic Group Success Rate and Average, Fall 2005

247
Retention Rates by CollegeDistrict Retention Rates
70.0%
75.0%
80.0%
85.0%
90.0%
2000-2001 87.7% 78.6% 84.0%
2001-2002 85.7% 80.1% 81.7%
2002-2003 85.0% 83.3% 84.0%
2003-2004 83.6% 84.0% 83.2%
2004-2005 81.9% 83.8% 82.6%
5 Year Average 84.7% 82.0% 83.2%
CCC DVC LM C

248
Persistence Rates by College
Persistence by College, Fall 2001 to Fall 2005
40.0%
45.0%
50.0%
55.0%
60.0%
65.0%
70.0%
Fall 2001 54.5% 58.6% 62.7% 59.7%
Fall 2002 54.7% 65.8% 65.1% 62.3%
Fall 2003 52.1% 52.4% 65.9% 59.8%
Fall 2004 61.9% 62.7% 67.3% 64.4%
Fall 2005 55.4% 64.5% 67.3% 65.2%
LMC CCC DVC CCCCD

249

250
Degrees by College
Degrees and Certificates at CCCCD, 2000-01 to 2004-05
0200400600800
100012001400
2000-01 1051 527 830
2001-02 409 527 1,020
2002-03 350 680 1,069
2003-04 421 529 1,065
2004-05 384 403 1,254
LMC CCC DVC

251
Transfers of CCCCD Students
CCCCD Transfers to UC and CSU, 2000-2005
-
500
1,000
1,500
2,000
2000 565 1,436
2001 603 1,431
2002 601 1,425
2003 638 1,388
2004 673 1,434
2005 691 1,600
UC C SU

252
LMC TransfersLMC Transfers to UC and CSU, 2000-2005
0
50
100
150
200
250
2000 29 147
2001 15 155
2002 15 156
2003 28 170
2004 38 178
2005 28 225
UC CSU

253
CCC TransfersCCC Transfers to UC and CSU, 2000-2005
0
50
100
150
200
250
2000 47 211
2001 41 219
2002 38 182
2003 46 168
2004 56 189
2005 52 220
UC C SU

254
DVC Transfers
DVC Transfers to UC and CSU, 2000-2005
0
200400
600800
10001200
1400
2000 489 1,078
2001 547 1,057
2002 548 1,087
2003 564 1,050
2004 579 1,067
2005 611 1,155
UC CSU

255
Transfers by EthnicityTransfers to UC/CSU by Ethnicity
0.0%5.0%
10.0%15.0%20.0%25.0%30.0%35.0%40.0%45.0%
Transfers to UC/CSU 38.4% 24.4% 15.8% 11.1% 5.4% 3.2% 0.9% 0.8%
White Asian_PI No Response
Hispanic African-American
NonRes Alien
Other Non-White
Native American

256
Transfer by Ethnicity: Gaps
6.6%
6.4%
0.6%
0.1%
-2.2%
-5.2%
-6.2%
-8.0% -6.0% -4.0% -2.0% 0.0% 2.0% 4.0% 6.0% 8.0%
Unknow n
Asian/PI
White
Native Am
Other Non-Wh
Hispanic
African-Am
CCCCD Percentage Difference Between Transfer and Enrollment by Ethnicity, 2005
CCCCD

257
Transfer Rates by College
0.0%
10.0%
20.0%
30.0%
40.0%
50.0%
1994 25.2% 21.2% 45.8% 33.7%
1995 22.8% 21.5% 44.2% 33.7%
LMC CCC DVC State
Six-Year Transfer Rates to UC and CSU, Student Cohorts of 1994 and 1995

258
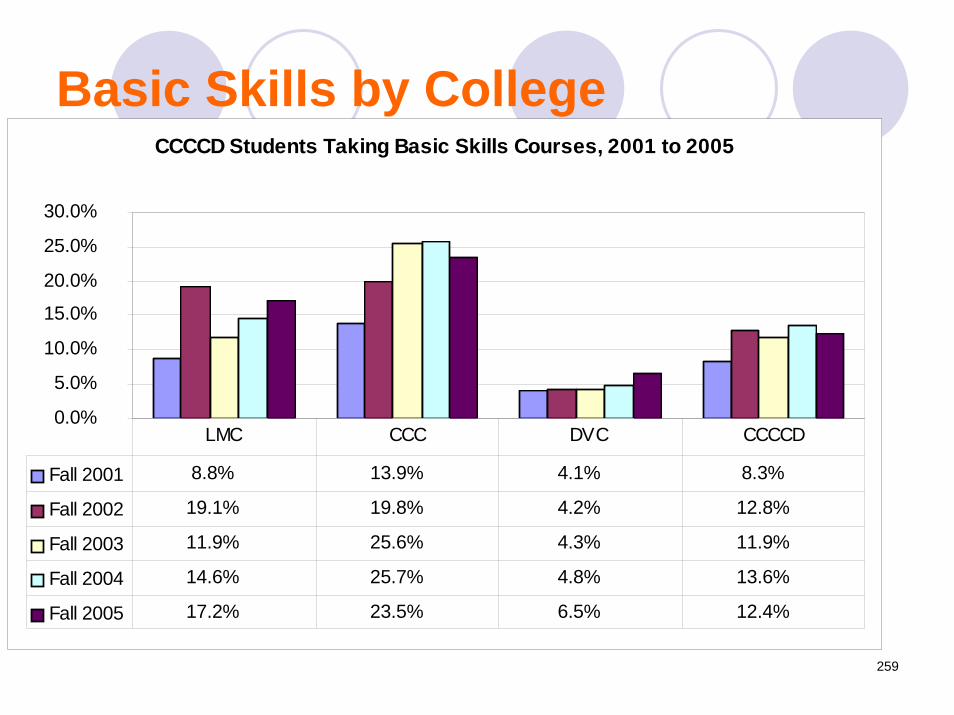
259
Basic Skills by CollegeCCCCD Students Taking Basic Skills Courses, 2001 to 2005
0.0%
5.0%
10.0%
15.0%
20.0%
25.0%
30.0%
Fall 2001 8.8% 13.9% 4.1% 8.3%
Fall 2002 19.1% 19.8% 4.2% 12.8%
Fall 2003 11.9% 25.6% 4.3% 11.9%
Fall 2004 14.6% 25.7% 4.8% 13.6%
Fall 2005 17.2% 23.5% 6.5% 12.4%
LMC CCC DVC CCCCD

260
Basic Skills Students by EthnicityEthnicity of Basic Skills Students at CCCCD, 2001 to 2005
0.0%
10.0%
20.0%
30.0%
40.0%
Fall 2001 22.2% 16.9% 20.8% 0.6% 3.1% 25.3% 11.1%
Fall 2002 18.0% 18.7% 27.3% 0.4% 2.8% 25.4% 7.4%
Fall 2003 19.6% 17.2% 33.7% 0.4% 2.3% 20.6% 6.1%
Fall 2004 22.9% 17.0% 32.2% 0.5% 2.8% 19.6% 4.9%
Fall 2005 21.6% 15.0% 30.6% 0.6% 2.9% 23.3% 6.0%
African-Am Asian/PI Hispanic Native Am Other NW White Unknow n
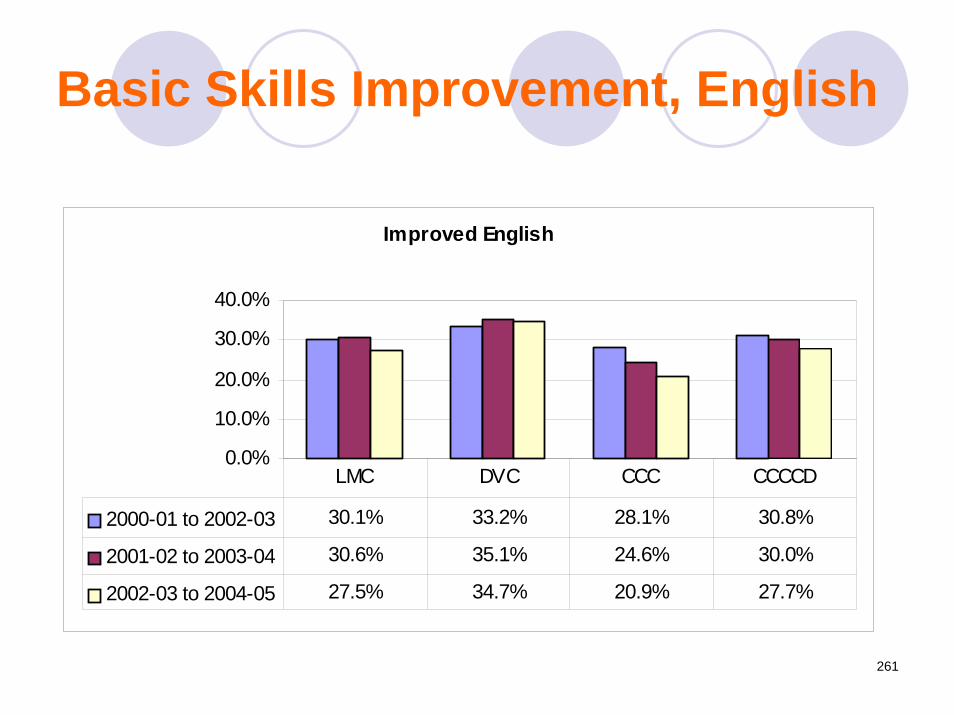
261
Basic Skills Improvement, English
Improved English
0.0%
10.0%
20.0%
30.0%
40.0%
2000-01 to 2002-03 30.1% 33.2% 28.1% 30.8%
2001-02 to 2003-04 30.6% 35.1% 24.6% 30.0%
2002-03 to 2004-05 27.5% 34.7% 20.9% 27.7%
LMC DVC CCC CCCCD

262
Basic Skills Improvement, Math
Improved Math
0.0%
10.0%
20.0%
30.0%
40.0%
2000-01 to 2002-03 16.3% 29.2% 15.2% 20.8%
2001-02 to 2003-04 16.7% 29.3% 16.5% 21.2%
2002-03 to 2004-05 16.2% 28.3% 18.9% 21.0%
LMC DVC CCC CCCCD

263
Improvement of Basic Skills
Total Improvement
0.0%
10.0%
20.0%
30.0%
40.0%
2000-01 to 2002-03 21.6% 31.5% 22.5% 25.9%
2001-02 to 2003-04 22.6% 32.3% 21.2% 25.7%
2002-03 to 2004-05 21.1% 31.6% 20.0% 24.4%
LMC DVC CCC District

264
Human Resources

265
Human Resources
This section addresses four issues, namely:
Sufficiency of human resources at all levelsThe ratio of full-time to part-time facultyDiversity of employeesClimate survey

266
Sufficiency
In evaluating the sufficiency of human resources for the district, the human resources data is analyzed in three ways:
Longitudinal trends over timeProportionate size of each employee categoryRatio of full-time equivalent employees per 1,000 full-time equivalent students (FTES)

267
CCCCD Ratio of FTES per Employee, 2005
Institution Employee Category
Number of Employees per 1,000
FTESAcademic 29.5Non-Academic 14.9Total 44.4Academic 33.9Non-Academic 18.4Total 52.3Academic 28.9Non-Academic 12.8Total 41.7Academic 0.0Non-Academic 2.4Total 2.4Academic 30.0Non-Academic 16.9Total 46.9Academic 33.2Non-Academic 26.1Total 59.3
State
District Office
LMC
CCC
DVC
CCCCD

268
Sufficiency
0%
20%
40%
60%
80%
100%
Proportionate Size of Employee Groups, 2005
Staff 26.3% 28.4% 24.2% 27.6% 38.8%
Faculty 66.4% 64.8% 69.3% 64.0% 55.9%
Admin 7.4% 6.8% 6.5% 8.4% 5.2%
LMC CCC DVC CCCCD State

269
Sufficiency
Ratio of Employees per 1,000 FTES, 2005
0.05.0
10.015.0
20.025.0
30.035.0
40.0
LMC 3.3 29.5 11.7
CCC 3.6 33.9 14.9
DVC 2.7 28.9 10.1
CCCCD 3.9 30.0 12.9
State 3.1 33.2 23.0
Admin Faculty Staff

270
Faculty Full-time Equivalency (FTE) Distribution
The existence of a large proportion of part-time employees creates a sense of instability regarding instructional responsibility, committee service, and student advisement and guidance; and it places an undue burden on those employed on a full-time basis.

271
Sufficiency
If it is accepted that a 75%/25% full-time/part-time ratio is desirable, then it is apparent that the community colleges in both the district and the state are below acceptable norms for institutions of higher education.

272
Faculty Full-time Equivalency (FTE) Distribution by College, District and State, Fall 2005
College Full Time Part Time Total
LMC 55.7% 44.3% 100.0%CCC 57.1% 42.9% 100.0%DVC 53.8% 46.2% 100.0%CCCCD 54.9% 45.1% 100.0%State 56.5% 43.5% 100.0%
Fall 2005

273
FT and PT Faculty Proportions
Since the 1970s, there has been considerable controversy surrounding the employment of part-time faculty at community colleges.

274
Part-Time Faculty: Advantages
Beneficial for instructors who have another job or family commitmentsPT faculty provide current expertise when they are employed in their fieldPT faculty cost less than full-time facultyPT faculty provide budget flexibility because they can be more responsive to students’ requests for classes and to the needs of businesses

275
Part-Time Faculty: Disadvantages
PT faculty teaching core courses may undermine departmental curriculum development and continuityPT faculty may not be able to meet with students outside of classPT faculty usually do not participate in curriculum review and developmentClaims that PT faculty teaching is inferior to that of FT faculty are not supported by research

276
Human Resources - Diversity
GenderAgeEthnicityOverview of Ethnicity in County and CollegeClimate Survey

277
Gender
Staff Gender in District
40.0%42.0%44.0%46.0%48.0%50.0%52.0%54.0%56.0%
Fall 2000 50.7% 49.3%
Fall 2001 50.7% 49.3%
Fall 2002 48.4% 51.6%
Fall 2003 46.9% 53.1%
Fall 2004 45.9% 54.1%
Male Female

278
Age
Overview of Full-Time Faculty Age in CCCCD, Fall 2004
0.0%5.0%
10.0%15.0%20.0%25.0%30.0%35.0%40.0%45.0%
FT Faculty Age 4.8% 17.4% 38.9% 35.2% 3.7%
<35 35-44 45-54 55-64 65+

279
Ethnicity: Population, Students, and Faculty
Ethnicity in Contra Costa County and DVC Students and Faculty, 2005
0.0%
10.0%
20.0%
30.0%
40.0%
50.0%
60.0%
70.0%
Contra Costa County 9.1% 13.4% 21.2% 0.3% 52.9% 3.1%
DVC Students 5.7% 17.8% 12.6% 0.7% 50.1% 13.1%
DVC Faculty 5.8% 7.0% 10.3% 1.2% 64.0% 11.6%
African-American
Asian/Pac Isl
Hispanic of any Race
Native American White
Othe / Two or More Races

280
Climate Survey
The Climate Survey consisted of nineteen questions that addressed three major issues, namely:
General climate (clarity of communication, ethical behavior, trust, feeling values, and accountability)Job performance (fair rewards and recognition, responsibility to take charge, management ability and awareness)Quality of work life (workgroup effectiveness, resources, and work life)

281
Climate Survey
In addition there was an open-ended question that solicited responses regarding the most effective action to improve morale. The survey instrument used a five-point scale that included: Strongly agree=5, Agree=4, Neutral=3, Disagree=2, Strongly disagree=1.

282
Climate Survey
The three responses with the highest rating were:Employees are expected to behave ethically (3.78)Employees have the skills required to do their jobs well (3.62)Trust and respect exist between employees and their supervisors (3.46)

283
Climate Survey
The three responses with the lowest rating were:CCCCD has a system of accountability (2.60)Having an effective voice through shared governance (2.65)CCCCD recognizes and respects my contributions as an individual (2.66)

284
Climate Survey
The most critical issues that must be addressed by the district include establishing an effective system of accountability and communicating the results to all employees.

285

286
Climate Survey(Scale: Strongly Agree=5, Agree=4, Neutral=3, Disagree=2, Strongly Disagree=1)
2.602.652.662.692.722.742.762.812.852.872.90
2.953.00
3.153.22
3.333.33
3.463.62
3.78
2.00 2.50 3.00 3.50 4.00 4.50 5.00
Q11: CCCCD System of Accountability
Q13: Voice in Shared Governance
Q4: CCCCD Recognizes Contributions
Q17: CCCCD Responses to Suggestions
Q5: Fair Treatment by CCCCD
Q2: District Empowers M e
Q16: Understand Decision-M aking
Q7: Express Feelings w/o Fear
Q10: Employees are Accountable
Q14: Sufficient Resources
Q 1: District Inspires M e
Q3: Feel Important
Neutral Response M arker
Q9: Trust M anagers
Q19: CCCCD Strategic Directions
Q12: Agreement on Expectations
Q18: Supervisors Praise
Q8: M utual Trust/Respect
Q15: Employees Have Skills
Q6: Expected to Behave Ethically

287
Climate Survey: LMC(Scale: Strongly Agree=5, Agree=4, Neutral=3, Disagree=2, Strongly Disagree=1)
2.392.66
2.732.74
2.852.872.892.902.912.932.962.973.00
3.123.19
3.363.42
3.523.61
3.80
2.00 2.50 3.00 3.50 4.00 4.50 5.00
Q11: CCCCD System of Accountability
Q16: District Decision-M aking
Q10: Employees are Accountable
Q4: District Recognizes M y Contributions
Q7: Express Feelings w/o Fear
Q17: Responses to Suggestions
Q5: Fair Treatment by CCCCD
Q1: CCCCD Inspires M e
Q2: CCCCD Empowers M e
Q13: Effective Shared Governance
Q3: CCCCD M akes M e Feel Important
Q14: Sufficient Resources
Neutral Response M arker
Q19: District Strategic Directions
Q9: Trust M anagers to Present Views
Q18: Supervisors Praise Employees
Q12: M gr/Employee Agree on Expectations
Q8: M gr/Employee M utual Trust/Respect
Q15: Employees Have Skills
Q6: Employees Behave Ethically

288
Climate Survey: CCC(Scale: Strongly Agree=5, Agree=4, Neutral=3, Disagree=2, Strongly Disagree=1)
2.943.003.00
3.073.073.083.103.143.163.20
3.293.37
3.513.523.53
3.593.61
3.843.87
4.08
2.00 2.50 3.00 3.50 4.00 4.50 5.00
Q11: CCCCD System of Accountability
Q16: District Decision-M aking
Neutral Response M arker
Q14: Sufficient Resources
Q17: Responses to Suggestions
Q10: Employees are Accountable
Q4: District Recognizes M y Contributions
Q5: Fair Treatment by CCCCD
Q13: Effective Shared Governance
Q2: CCCCD Empowers M e
Q7: Express Feelings w/o Fear
Q1: CCCCD Inspires M e
Q19: District Strategic Directions
Q3: CCCCD M akes M e Feel Important
Q9: Trust M anagers to Present Views
Q18: Supervisors Praise Employees
Q12: M gr/Employee Agree on Expectations
Q15: Employees Have Skills
Q8: M gr/Employee M utual Trust/Respect
Q6: Employees Behave Ethically

289
Climate Survey: DVC(Scale: Strongly Agree=5, Agree=4, Neutral=3, Disagree=2, Strongly Disagree=1)
2.222.352.362.372.39
2.492.562.57
2.622.64
2.722.80
2.873.00
3.133.173.183.20
3.603.63
2.00 2.50 3.00 3.50 4.00 4.50 5.00
Q13: Effective Shared Governance
Q4: District Recognizes M y Contributions
Q17: Responses to Suggestions
Q2: CCCCD Empowers M e
Q5: Fair Treatment by CCCCD
Q7: Express Feelings w/o Fear
Q3: CCCCD M akes M e Feel Important
Q11: CCCCD System of Accountability
Q1: CCCCD Inspires M e
Q16: District Decision-M aking
Q14: Sufficient Resources
Q10: Employees are Accountable
Q9: Trust M anagers to Present Views
Neutral Response M arker
Q19: District Strategic Directions
Q18: Supervisors Praise Employees
Q12: M gr/Employee Agree on Expectations
Q8: M gr/Employee M utual Trust/Respect
Q15: Employees Have Skills
Q6: Employees Behave Ethically

290
Productivity

291
WSCHCCCCD WSCH: Fall Terms 1999-2005
0
50,000
100,000
150,000
200,000
250,000
300,000
1999FA 115,862 228,720 87,360
2000FA 109,642 232,110 92,447
2001FA 113,657 238,035 99,747
2002FA 93,552 245,109 105,256
2003FA 80,768 237,990 97,043
2004FA 82,896 229,718 96,635
2005FA 81,190 227,822 92,515
Contra Costa College Diablo Valley College Los M edanos College
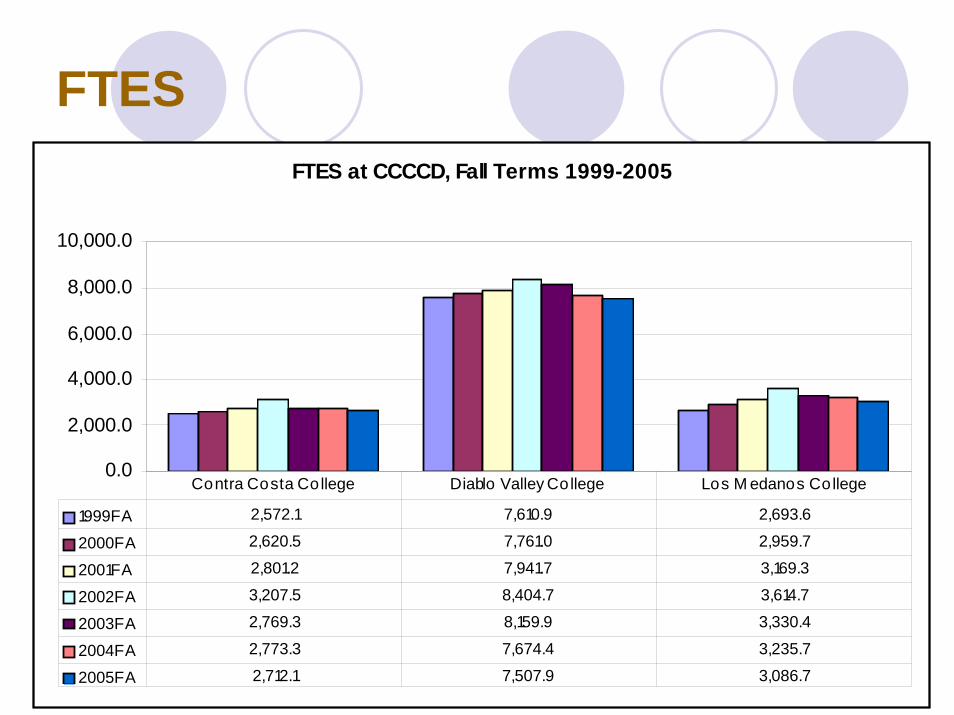
292
FTESFTES at CCCCD, Fall Terms 1999-2005
0.0
2,000.0
4,000.0
6,000.0
8,000.0
10,000.0
1999FA 2,572.1 7,610.9 2,693.6
2000FA 2,620.5 7,761.0 2,959.7
2001FA 2,801.2 7,941.7 3,169.3
2002FA 3,207.5 8,404.7 3,614.7
2003FA 2,769.3 8,159.9 3,330.4
2004FA 2,773.3 7,674.4 3,235.7
2005FA 2,712.1 7,507.9 3,086.7
Contra Costa College Diablo Valley College Los M edanos College

293
FTEFFTEF at CCCCD: Fall Terms 1999 - 2005
0
100
200
300
400
500
600
1999FA 173.737 447.521 223.83
2000FA 178.596 456.718 189.421
2001FA 173.855 478.777 195.922
2002FA 193.3 489.353 223.945
2003FA 154.746 472.282 189.696
2004FA 168.789 476.442 194.292
2005FA 173.473 480.742 193.865
Contra Costa College Diablo Valley College Los M edanos College

294
WSCH/FTEFAcademic Load at CCCCD, Fall Terms 1999-2005
0.0
200.0
400.0
600.0
800.0
1999FA 666.9 511.1 390.3 511.1
2000FA 613.9 508.2 488.1 526.5
2001FA 653.7 497.2 509.1 532.0
2002FA 484.0 500.9 470.0 489.7
2003FA 521.9 503.9 511.6 509.1
2004FA 491.1 482.2 497.4 487.5
2005FA 468.0 473.9 477.2 473.5
Contra Costa College Diablo Valley College Los M edanos College District

295
FTES/FTEFStudent-Faculty Ratio at CCCCD: Fall Terms 1999-2005
0.0
5.0
10.0
15.0
20.0
1999FA 14.8 17.0 12.0 15.2
2000FA 14.7 17.0 15.6 16.2
2001FA 16.1 16.6 16.2 16.4
2002FA 16.6 17.2 16.1 16.8
2003FA 17.9 17.3 17.6 17.5
2004FA 16.4 16.1 16.7 16.3
2005FA 15.6 15.6 15.9 15.7
Co ntra Co sta Co llege Diablo Valley Co llege Lo s M edano s Co llege District
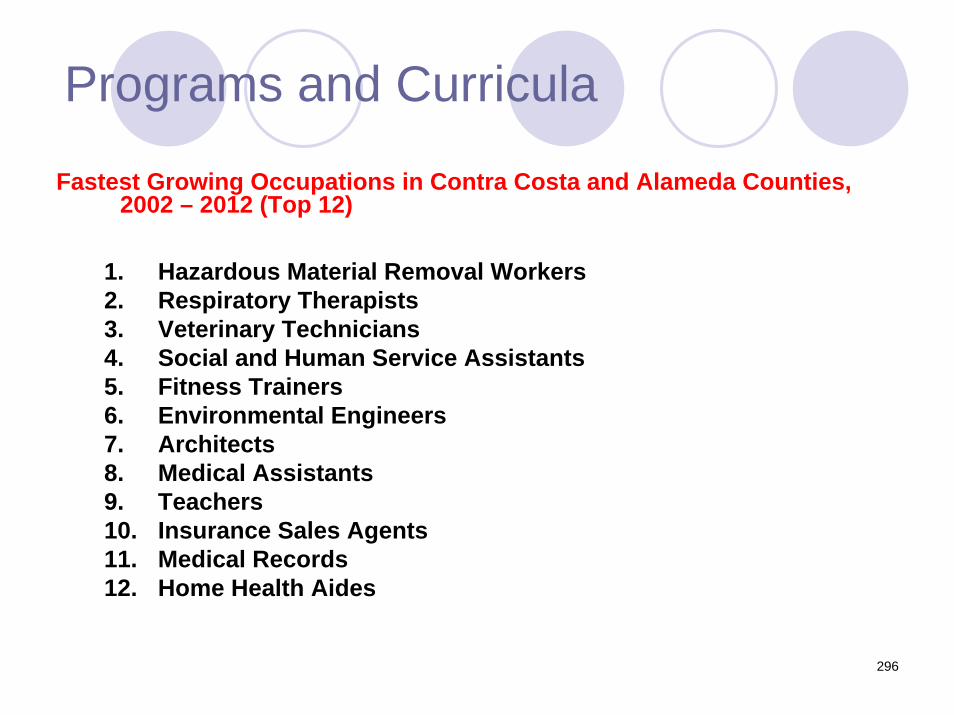
296
Programs and Curricula
Fastest Growing Occupations in Contra Costa and Alameda Counties, 2002 – 2012 (Top 12)
1. Hazardous Material Removal Workers2. Respiratory Therapists3. Veterinary Technicians4. Social and Human Service Assistants5. Fitness Trainers6. Environmental Engineers7. Architects8. Medical Assistants9. Teachers10. Insurance Sales Agents11. Medical Records12. Home Health Aides

297
Programs and CurriculaT o ta l D e g re e s a n d C e r ti fi c a te s A w a rd e d b y A l l C o l l e g e s in th e D istr ic t (E x c lu d in g
A A D e g re e s in L ib e ra l A r ts), 2 0 0 4 -0 5
1
1
5
8
9
1 4
1 5
1 6
1 7
3 0
3 2
3 2
4 0
4 0
5 7
1 1 8
1 5 5
1 9 2
1 9 5
0 5 0 1 0 0 1 5 0 2 0 0 2 5 0
Hu m a n it ie s ( L e tte r s )
Ph y s ic a l S c ie n c e s
Co m m e r c ia l S e r v ic e s
M a th e m a tic s
A g r ic u ltu r e a n d Na tu r a l Re s o u r c e s
L ib r a r y S c ie n c e
Ed u c a tio n
B io lo g ic a l S c ie n c e s
Ps y c h o lo g y
Fo r e ig n L a n g u a g e
In f o r m a tio n Te c h n o lo g y
F in e a n d A p p lie d A r ts
M e d ia a n d Co m m u n ic a tio n s
S o c ia l S c ie n c e s
En g in e e r in g a n d In d u s tr ia l Te c h n o lo g ie s
B u s in e s s a n d M a n a g e m e n t
Fa m ily a n d Co n s u m e r S c ie n c e s
He a lth
Pu b lic a n d Pr o te c tiv e S e r v ic e s

298
Programs and Curricula
Need additional programs in:Health-related disciplinesEnvironmental StudiesSocial ServicesTechnology and Related DisciplinesTeaching

299

300
Summary and Conclusions
By 2025, Contra Costa County population will reach 1.5 million persons. The rate of growth in the next 20 years will be slower than that of the previous 20 years. Expect a slow rise in enrollment at community colleges.
Population will shift to the areas where land is available and the houses are affordable (Watch for East Contra Costa County, South Contra Costa County, and Solano County).
LMC enrollment will grow at a faster rate. DVC will remain the college of choice for transfer students. It will continue to attract students from areas beyond its traditional community. CCC will place more emphasis on basic skills. Watch for inter-segmental competition among institutions.
301
Summary and Conclusions
The population will be aging due to the size of the Baby Boomer Generation. Demand for health services for the elderly will increase. Developing programs in allied heath disciplines represents a wise and insightful choice for all colleges.
The population is becoming more diverse. Hispanics and Asians will lead the change. Multicultural programs are needed for all students. Multi-lingual services are necessary in student services.
Basic skills programs must be expanded to meet the needs of the under-prepared students.

302
Summary and ConclusionsHousing affordability is a serious concern in Contra Costa County. The college may need to work closely with the local community to create new opportunities for affordable housing developments particularly in the newly vacated naval base (Concord).
The disparity in income levels and the rising cost of education are serious challenges that necessitate re-examination of financial aid packages.
The gradual shift from manufacturing to a service-based economy calls for re-examination of the curriculum and program mix on college campuses.

303
Summary and Conclusions
Since high school graduation is leveling off, the college-going rate for community colleges is declining, and adult learners are not attending college in large numbers, there is a need to rethink the existing marketing strategies.
Recruitment policies should consider the significant imbalance in gender enrollment on college campuses.
Raising the success, transfer, and graduation rates of certain ethnic groups is a serious challenge.

304
Summary and Conclusions
Enhancing the diversity of the faculty and staff on college campuses is a challenge.
Increasing the ratio of full-time to part-time faculty is a challenge that can not be ignored.
State-wide campaigns are necessary to increase funding for community colleges.
Becoming a learning institution is a challenge.
Rising cost of energy and health care is a challenge.

305
Summary and Conclusions
Enhancing the organizational effectiveness of the district and the colleges is a challenge.
Improving revenue sources and modernizing the facilities is a challenge.
Improving labor relations is a challenge.
Environmental preservation and protection are essential for future generations.

306
Summary and Conclusions
Community colleges have a great opportunity to reach out to students who may never have thought of going to college. They provide education and training for the nation’s workforce and offer courses for self-enrichment in flexible formats unmatched by their counterparts at the four-year institutions.

307
Summary and Conclusions
Community colleges play a pivotal role in the system of higher education, since they guarantee California’s historical commitment to access and opportunity, and open the door to students who would otherwise have been left behind.
Contra Costa’s three 2-year public colleges can offer educational opportunities to the over 1 million people within a 30-mile radius who do not have a college degree.

308

309
Information Sources
Data sources are provided for every table and chart in the document from which these slides were derived. The main sources were:
1. California Department of Finance2. U.S. Decennial Census3. American Community Survey4. California Department of Education, Dataquest5. National Center for Public Policy and Higher
Education

310
Information Sources
6. California Community Colleges System Strategic Plan
7. Postsecondary Education Opportunity8. California Postsecondary Education Commission.9. Contra Costa Community College District: Data
Warehouse, Datatel, IT Research 10. California Community Colleges Chancellor’s Office
MIS Data Mart11. National Center for Higher Education Management
Systems (NCHEMS)

311
Information Sources
12. California Employment Development Department13. Metropolitan Transportation Commission14. U.S. Environmental Protection Agency15. Public Policy Institute of California. 16. Diablo Valley College Geography Department17. CCCCO System Performance on Partnership for
Excellence Goals18. Workforce Development Department, Diablo
Valley College19. Center for Community College Policy

312
Information Sources
20. National Center for Education Statistics21. Association of Bay Area Governments22. 2006 Performance Index, Contra Costa
County

313

314
Thank you