Essent Third Quarter 2014 Earnings...
8
Essent Third Quarter 2014 Earnings Presentation
Transcript of Essent Third Quarter 2014 Earnings...
Essent Third Quarter 2014Earnings Presentation
This presentation includes “forward-looking statements” which are subject to known and unknown risks and uncertainties, many of which may bebeyond our control. Forward-looking statements generally can be identified by the use of forward-looking terminology such as "may," "plan," "seek,""comfortable with," "will," "expect," "intend," "estimate," "anticipate," "believe" or "continue" or the negative thereof or variations thereon or similarterminology. Actual events, results and outcomes may differ materially from our expectations due to a variety of known and unknown risks,uncertainties and other factors. Although it is not possible to identify all of these risks and factors, they include, among others, the following: changes inor to Fannie Mae and Freddie Mac (the “GSEs”), whether through Federal legislation, restructurings or a shift in business practices; failure to continueto meet the mortgage insurer eligibility requirements of the GSEs; competition for customers; lenders or investors seeking alternatives to privatemortgage insurance; an increase in the number of loans insured through Federal government mortgage insurance programs, including those offered bythe Federal Housing Administration; decline in new insurance written and franchise value due to loss of a significant customer; decline in the volume oflow down payment mortgage originations; the definition of "Qualified Mortgage" reducing the size of the mortgage origination market or creatingincentives to use government mortgage insurance programs; the definition of "Qualified Residential Mortgage" reducing the number of low downpayment loans or lenders and investors seeking alternatives to private mortgage insurance; the implementation of the Basel III Capital Accorddiscouraging the use of private mortgage insurance; a decrease in the length of time that insurance policies are in force; uncertainty of loss reserveestimates; deteriorating economic conditions; non-U.S. operations becoming subject to U.S. Federal income taxation; becoming considered a passiveforeign investment company for U.S. Federal income tax purposes; and other risks and factors described in Part I, Item 1A “Risk Factors” of our AnnualReport on Form 10-K for the year ended December 31, 2013 filed with the Securities and Exchange Commission on March 10, 2014. Any forward-looking information presented herein is made only as of the date of the issuance of this presentation, and we do not undertake any obligation to updateor revise any forward-looking information to reflect changes in assumptions, the occurrence of unanticipated events, or otherwise.
Disclaimer
1
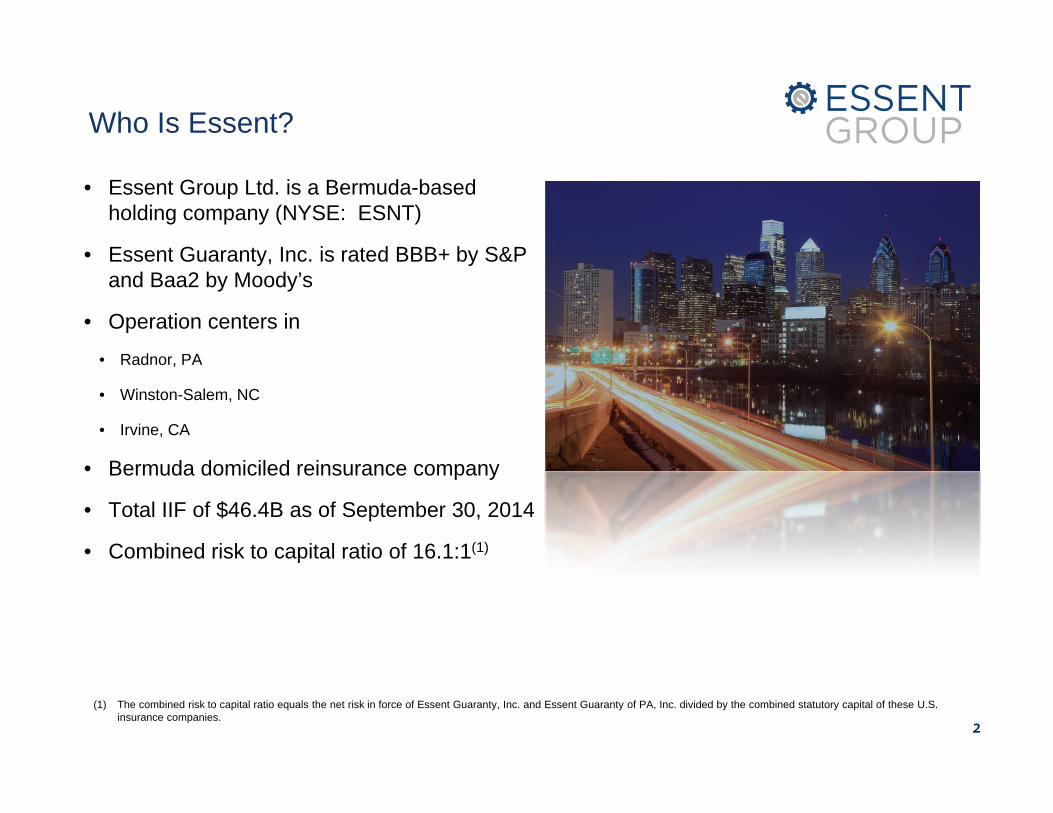
• Essent Group Ltd. is a Bermuda-based holding company (NYSE: ESNT)
• Essent Guaranty, Inc. is rated BBB+ by S&P and Baa2 by Moody’s
• Operation centers in
• Radnor, PA
• Winston-Salem, NC
• Irvine, CA
• Bermuda domiciled reinsurance company
• Total IIF of $46.4B as of September 30, 2014
• Combined risk to capital ratio of 16.1:1(1)
2
Who Is Essent?
(1) The combined risk to capital ratio equals the net risk in force of Essent Guaranty, Inc. and Essent Guaranty of PA, Inc. divided by the combined statutory capital of these U.S. insurance companies.
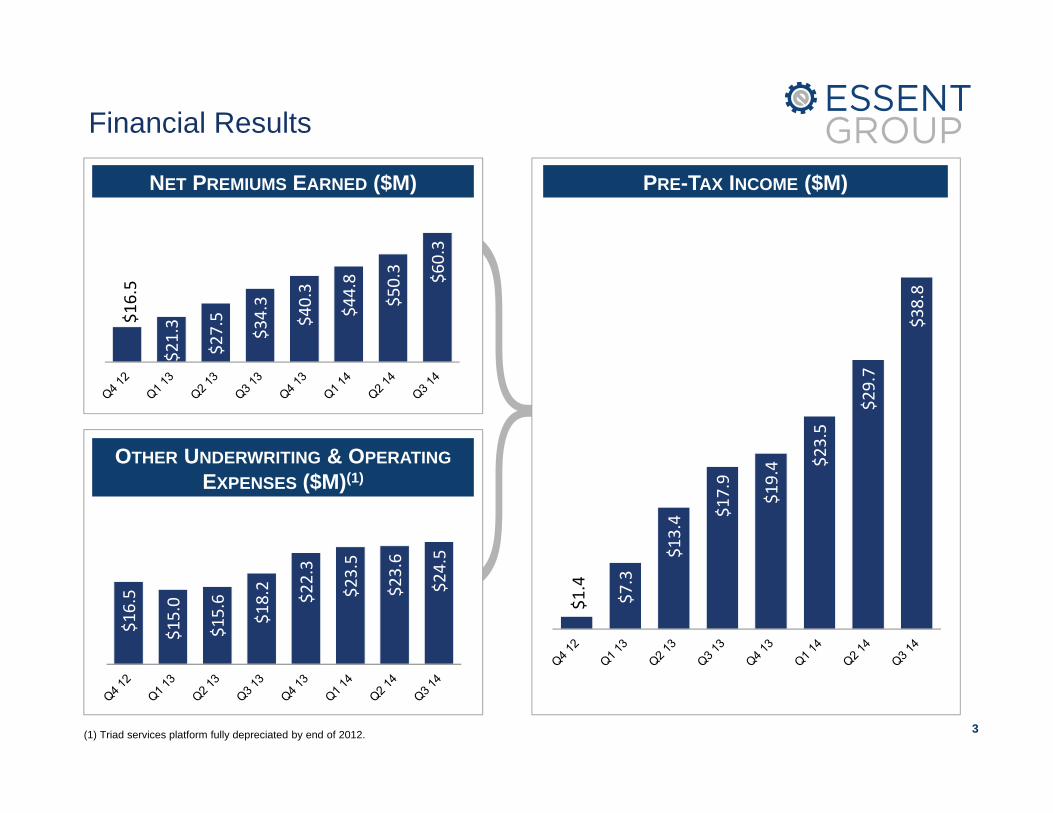
Financial Results
(1) Triad services platform fully depreciated by end of 2012.
NET PREMIUMS EARNED ($M)
OTHER UNDERWRITING & OPERATINGEXPENSES ($M)(1)
3
PRE-TAX INCOME ($M)
$16.5
$21.3
$27.5
$34.3
$40.3
$44.8
$50.3 $60.3
$16.5
$15.0
$15.6
$18.2
$22.3
$23.5
$23.6
$24.5
$1.4
$7.3
$13.4 $1
7.9
$19.4 $2
3.5
$29.7
$38.8
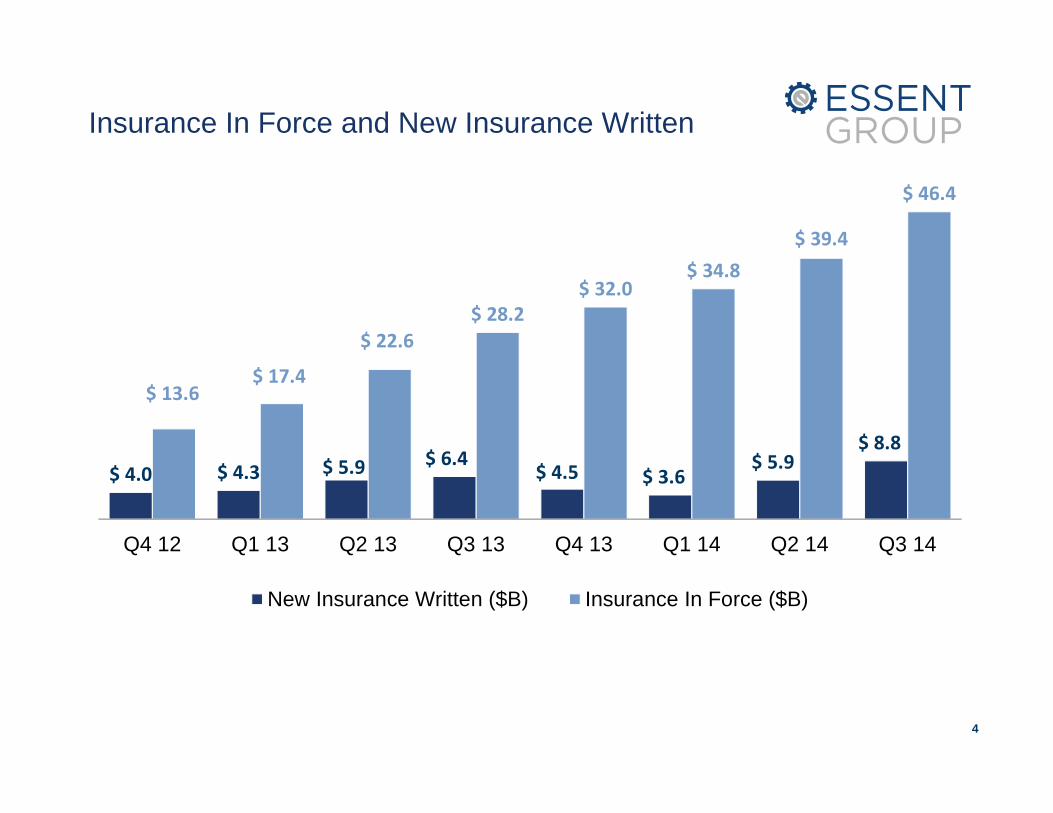
Insurance In Force and New Insurance Written
4
$ 4.0 $ 4.3 $ 5.9 $ 6.4 $ 4.5 $ 3.6
$ 5.9 $ 8.8
$ 13.6 $ 17.4
$ 22.6 $ 28.2
$ 32.0 $ 34.8
$ 39.4
$ 46.4
Q4 12 Q1 13 Q2 13 Q3 13 Q4 13 Q1 14 Q2 14 Q3 14
New Insurance Written ($B) Insurance In Force ($B)
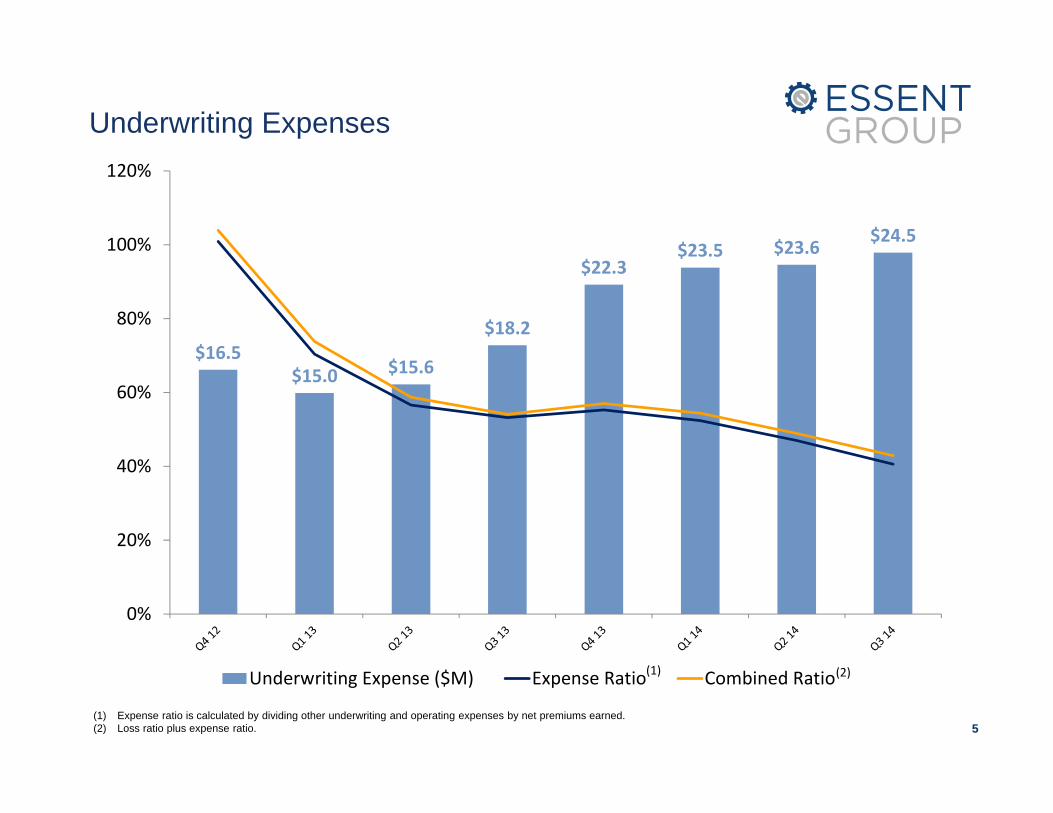
Underwriting Expenses
(1) Expense ratio is calculated by dividing other underwriting and operating expenses by net premiums earned.(2) Loss ratio plus expense ratio. 5
$16.5 $15.0 $15.6
$18.2
$22.3 $23.5 $23.6 $24.5
$0. 0
$5. 0
$10 .0
$15 .0
$20 .0
$25 .0
$30 .0
0%
20%
40%
60%
80%
100%
120%
Underwriting Expense ($M) Expense Ratio Combined Ratio(1) (2)
6
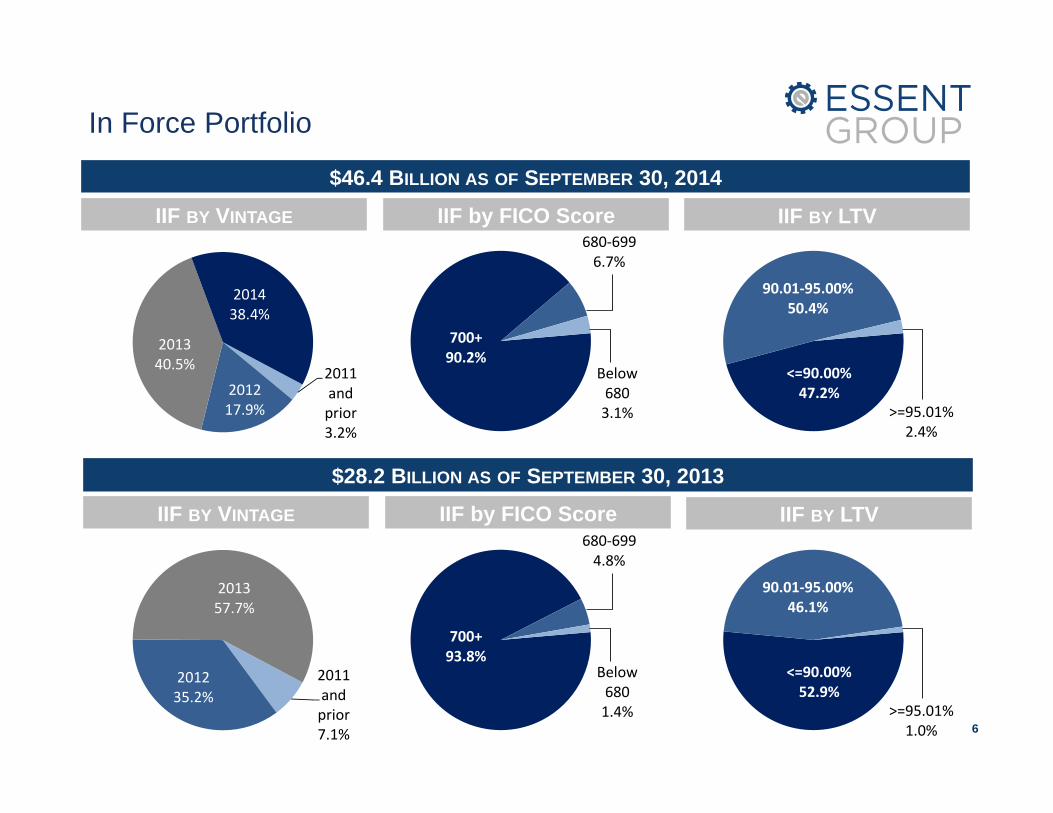
IIF by FICO ScoreIIF BY VINTAGE IIF BY LTV
$46.4 BILLION AS OF SEPTEMBER 30, 2014
IIF by FICO ScoreIIF BY VINTAGE IIF BY LTV
$28.2 BILLION AS OF SEPTEMBER 30, 2013
In Force Portfolio
2011 and prior7.1%
2012 35.2%
2013 57.7%
700+93.8%
680‐6994.8%
Below 6801.4%
<=90.00%52.9%
90.01‐95.00%46.1%
>=95.01%1.0%
2011 and prior3.2%
2012 17.9%
2013 40.5%
201438.4%
<=90.00%47.2%
90.01‐95.00%50.4%
>=95.01%2.4%
700+90.2%
680‐6996.7%
Below 6803.1%
7
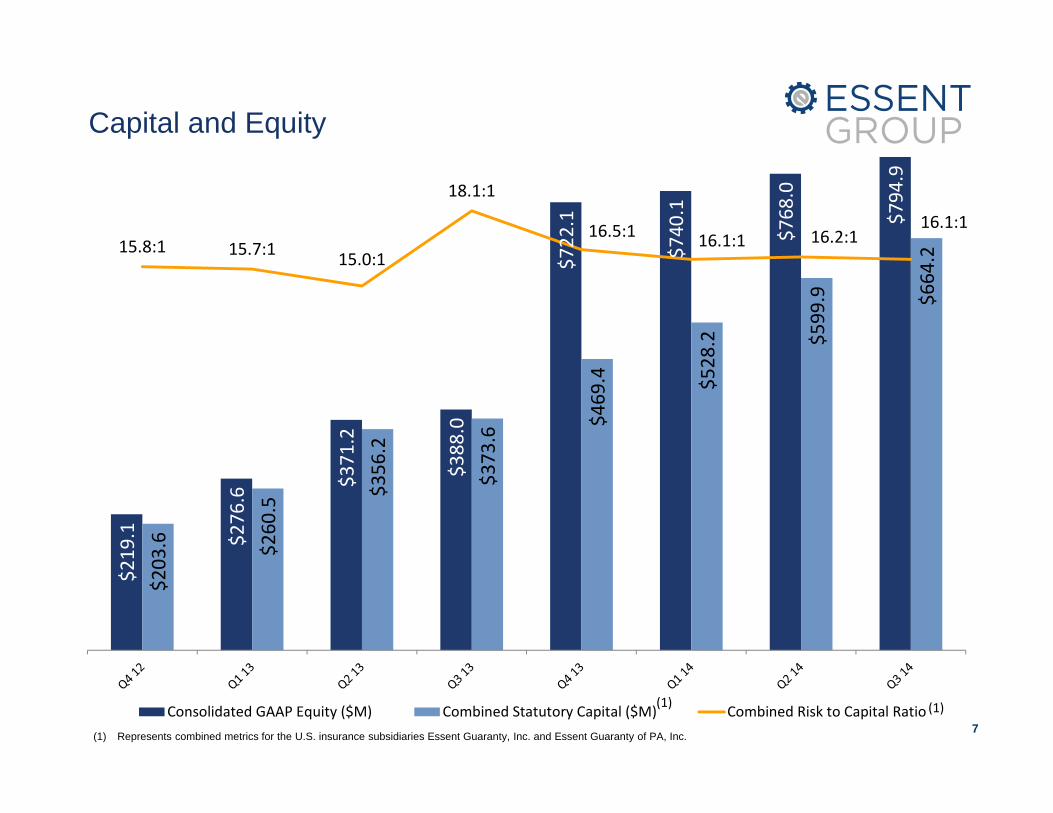
Capital and Equity
(1) Represents combined metrics for the U.S. insurance subsidiaries Essent Guaranty, Inc. and Essent Guaranty of PA, Inc.
$219.1
$276.6 $371.2
$388.0
$722.1
$740.1
$768.0
$794.9
$203.6
$260.5 $3
56.2
$373.6 $4
69.4
$528.2
$599.9
$664.2 15.8:1 15.7:1 15.0:1
18.1:1
16.5:1 16.1:1 16.2:116.1:1
$0.0
$100.0
$200.0
$300.0
$400.0
$500.0
$600.0
$700.0
$800.0
$900.0
0.0 :1
5.0 :1
10.0:1
15.0:1
20.0:1
Consolidated GAAP Equity ($M) Combined Statutory Capital ($M) Combined Risk to Capital Ratio(1) (1)