ESSAYS ON WOMEN'S BARGAINING POWER AND INTRA - RePub
168
ESSAYS ON WOMEN’S BARGAINING POWER AND INTRA-HOUSEHOLD RESOURCE ALLOCATION IN RURAL ETHIOPIA Bilisuma Bushie Dito
Transcript of ESSAYS ON WOMEN'S BARGAINING POWER AND INTRA - RePub

ESSAYS ON WOMEN’S BARGAINING POWER AND INTRA-HOUSEHOLD RESOURCE ALLOCATION IN
RURAL ETHIOPIA
Bilisuma Bushie Dito

This dissertation is part of the Research Programme of CERES, Research School for Resource Studies for Development Funded by the Netherlands Fellowship Program (NFP)
© Bilisuma Bushie Dito 2011 All rights reserved. No part of this publication may be reproduced, stored in a retrieval system, or transmitted, in any form or by any means, electronic, mechanical, photocopying, recording or otherwise, without the prior permission of the author. Printed in The Netherlands ISBN 978-90-815873-8-9 Ipskamp Drukkers B.V. Josinkmaatweg 43 7545 PS Enschede Tel: 0031-(0)53 482 62 62 Fax: 0031-(0)53 482 62 70

Essays on Women’s Bargaining Power and Intra-household Resource
Allocation in Rural Ethiopia
ESSAYS OVER DE ONDERHANDELINGSPOSITIE VAN VROUWEN EN DE TOEWIJZING VAN MIDDELEN
BINNEN HUISHOUDENS OP HET PLATTELAND IN ETHIOPIË
Thesis
to obtain the degree of Doctor from the Erasmus University Rotterdam by command of the rector magnificus
Professor dr H.G. Schmidt
and in accordance with the decision of the Doctorate Board
The public defence shall be held on 22 December 2011 at 10.00 hrs
by
Bilisuma Bushie Dito
born in Addis Ababa, Ethiopia

Doctoral Committee
PromotorsProf.dr. M. GrimmProf.dr. I.P. van Staveren
Other members Prof.dr. A.S. Bedi Dr. M. Dekker, African Studies Centre, Leiden Dr. T Truong

Dedication To my parents and my husband

vi
Contents
List of Tables and Figures viiiAcronyms xiAcknowledgements xiiAbstract xvSamenvatting xvii
1 INTRODUCTION 11.1 Statement of the Problem 11.2 Research Questions 41.3 Overview of Data and Methodology 41.4 The Setting and Justification 71.5 The Chapters 8Notes 9
2 DETERMINANTS OF WOMEN’S BARGAINING POWER IN RURAL ETHIOPIA 10
2.1 Indicators of bargaining power: The Literature 102.2 Evidence from Ethiopia 132.3 Indicators used in the Empirical Chapters 27Notes 30
3 THE EFFECT OF A WOMAN’S BARGAINING POWER ON HER PARTICIPATION IN NON- FARM WORK IN RURAL ETHIOPIA 31
3.1 Introduction 313.2 Theoretical Considerations 333.3 Data and Descriptive Statistics 37

Contents vii
3.4 Empirical Strategy 403.5 The Results 423.5 Conclusions 46Notes 48
4 THE EFFECT OF A WOMAN’S BARGAINING POWER ON HER HEALTH STATUS IN RURAL ETHIOPIA 49
4.1 Introduction 494.2 Theoretical Framework 514.3 The Data and Descriptive Statistics 534.4 Empirical Strategy 594.5 Findings of the Study 62
4.5.1 Bargaining Power and Health Status 624.5.2 Bargaining power and Health Inputs 70
4.6 Conclusions 72Notes 73
5 THE EFFECT OF A WOMAN’S BARGAINING POWER ON CHILD LABOUR AND SCHOOLING IN RURAL ETHIOPIA 75
5.1 Introduction 755.2 Review of the Relevant Literature 775.3 Theoretical Discussion 795.4 The Data and Descriptive Statistics 815.5 Empirical strategy 855.5 Findings 895.6 Conclusions 100Notes 101
6 SUMMARY AND CONCLUSIONS 102Appendices 108References 130

viii
List of Tables and Figures
Tables
2.1 Descriptive Statistics of Bargaining Power Indicators 283.1 The Effect of a Woman’s Bargaining Power on her Participation in
Off-farm Self Employment (OLS) 443.2 The Effect of a woman’s Bargaining Power on her Participation in
Off-farm Self Employment during Shocks (OLS) 464.1 Descriptive Statistics of the Health Status Measures 554.2 The Effect of Bargaining Power on Self- Reported Health Status
(OLS) 634.3 The Effects of a Woman’s Bargaining Power on her Functional
health, Body Mass index and Chronic Energy Deficiency (OLS) 654.4 The Effect of a Woman’s Bargaining Power on Intra household
Inequality in Health Status (OLS) 694.5 The Effect of Bargaining Power Indicators on Health Inputs 715.1 Descriptive Statistics on Child labour and Schooling outcomes 835.2 Descriptive Statistics on Decision Making on Various Domains 845.3 The Percentage of Women depending on the Number of Domains
they alone decide on (%) 855.4 Tobit Estimation of hours spent on domestic work 925.5 Tobit Estimation of hours spent on Economic work 935.6 Marginal Effects of Probability of attending school for children aged
5-15 965.7 Tobit Estimation of Age Adjusted Education Attainment (SAGE)
for children 7-15 99

List of Tables and Figures ix
A3.1 Participation Rates in Different Types of Off-farm Self-employment Activities by Gender (%) 109
A3.2 Participation in Different types Wage Work by Gender (%) 110A3.3 Participation Rates in Off-farm Self-employment and Wage Work
by Household Poverty Status and Gender (%) 111A3.4 Descriptive Statistics of Key Variables 112A3.5 Estimation Results of Bargaining Power Variables on Married
Women’s Participation on Off-farm Self-Employment (Estimated Individually)(OLS) 113
A3.6 The Effect of Agricultural Shocks on Married Men’s and Women’s Participation in Off-farm Self- Employment(OLS) 114
A4. 1 Descriptive Statistics of Key Variables 115A4.2 Health Status by Socioeconomic Status 116A4.3 Descriptive Statistics of Health Status by Bargaining Power
Variables 117A4.4 Descriptive Statistics of Intra-household Health Inequality 119A4.5 Estimation Results of Interaction Effects of Bargaining Power
Variables with Region Dummy on Self Assessed Health Status (OLS) 120
A4.6 Estimation Results of Interaction Effects of Bargaining Power Variables with region dummy on the Objective Health Outcomes (OLS) 121
A4.7 Interaction Effects of Assets Brought to Marriage with BP Variables on the Objective Health Outcomes (OLS) 122
A5.1 Schooling Labour Outcomes by Decision Making Power 123A5.2 Descriptive Statistics of Key Variables 125A5. 3 Tobit Estimation on the Effect of a Woman’s Power over
Investment Decision in Human Capital on Hours Children spent on Domestic Work 126
A5.4 Tobit Estimation on the Effect of a Woman’s Power over Investment Decision in Human Capital on Hours children spent on Economic Work 127
A5.5 Marginal Effects of Probability of attending School for Children aged 5-15 128
A5.6 Tobit Estimation of Age Adjusted Education Attainment (SAGE) for Children 7-15 129

x WOMEN’S BARGAINING POWER & INTRA-HOUSEHOLD RESOURCE ALLOCATION IN RURAL ETHIOPIA
Figures
2.1 Analytical Framework on Dimensions that affect Women’s Bargaining Power 18
4.1 Flow Chart on the Relationship between Bargaining Power and Health Status 51
5.1 The relationship between child labour and balance of power within a household 80
A3.1 Participation Rates in Off-farm Self-employment by Gender (%) 108A3.2 Participation Rates in Wage Work by Gender 110

xi
Acronyms
BMI Body Mass Index BP Bargaining Power CED Chronic Energy Deficiency CSA Central Statistics Authority EEP Extra Household Environmental Parameters ERHS Ethiopian Rural Household Survey FAO Food and Agriculture Organization FGD Focus Group Discussion GAGE Age Adjust School Achievement ICRW International Centre for Research on Women IDA International Development Association ILO International Labour Organization MOFED Ministry of Finance and Economic Development MDG Millennium Development Goals OLS Ordinary Least Squares UNDP United Nations Development Program UNIFEM United Nations Entity for Gender Equality and
Empowerment of Women WDR World Development Report WHO World Health Organization

xii
Acknowledgements
I would like to thank the Netherlands Fellowship Program for sponsor-ing this study. I also would like to thank School of Economics, Addis Ababa University, International Food policy Research Institute, and Cen-ter for African studies, Oxford University for making the ERHS dataset available.
Doing this Ph. D has not been an easy ride but it sure was an enjoya-ble and a very inspiring one. This is because of the support of many people.
I can, without a doubt, say that I have been blessed with two wonder-ful Promoters: Prof. Michael Grimm and Prof. Irene Van Staveren.
Michael, your suggestion for me to work on intra-household issues has everything to do with my enjoying the Ph.D years a great deal. It amazes me that you still show the same kindness, and enthusiasm for my research as the first day I met you in November, 2007. You have taught me how to write a good research paper, pushed me to go beyond my limits, never took more than three days to comment on my chapters, never got tired of my knocking on your door unannounced, showed sympathy for my weakness. You are not only a promoter but also a col-league, mentor and a good friend. Thank you for everything.
My co-Promotor, Prof. Irene Van Staveren, I greatly appreciate your comments as an internal examiner during my research design seminar in November, 2008. After that, you became my co-promoter. Dear Irene, I have learned so much from you. Thank you for helping me to look be-yond the conventional perspectives. Without those, this thesis would not have been complete. I also would like to thank you for giving me the TRA opportunity for the Introduction to economics course for three consecutive years. Thank you for treating me like a colleague and a friend.

Acknowledgements xiii
Prof. Arjun Bedi is also as much a supervisor to me. His critical comments have contributed a great deal to improving the quality of this thesis. As the Head of Economics of Sustainable Development Staff group, he provided both the financial and intellectual support needed for the workshop I co-organized on ‘Women’s Bargaining Power and Eco-nomic Development’ in February 2011. He also provided me with a travel grant to participate in a conference on Schumpeter’s Heritage in 2011. Thank you Arjun for all your support
I want to thank Dr. Marleen Dekker from African Studies Center, Leiden University. Dear Marleen, our meeting in a gender session at a conference in Oxford University led to our collaboration to organize a workshop on ‘Women’s Bargaining Power and Economic Develop-ment’. I want to thank you for inspiring me, and for showing a lot of in-terest in my research. I just hope that our friendship and collaboration continues.
Anyone who has had the chance to meet Dr. Thanhdam can easily see how inspiring, humble and nurturing she is. Dear Thanhdam, thank you for being such a wonderful person and for your friendship.
I want to thank members of the Macro-Micro Poverty Linkage re-search cluster for their comments on most of the chapters of this thesis. Dr. Robert Sparrow, Prof. Peter Knoringa, Dr. Peter de Valk, Prof. Mansoob Murshed, Prof. Peter Van Bergeijk, Dr. Jan van Heemst, Ria Browers, Dr. Pedro, Gloria, Saleem, Renate, and Maz.
If this thesis reads as well as it should, Linda MacPhee, my academic writing teacher, has everything to do with it. She taught me how to write consciously. Dear Linda, I will never forget the blue-the yellow and the Camera. Linda also helped us to form a writing group with Shyamikah, Mariana, Richard, Atsushi, and Karem. Guys, our discussions were intel-lectually stimulating and I learned so much from you. I hope we contin-ue to communicate through our writing blog.
I want to thank Jane Pocock for thoroughly editing this thesis. From the Ph.D office, Maureen, Dita, Ank, Lubna, Susan, Nyke Jo and from facilities Sylvia, John, Robin who have been very helpful in facilitating all the things I need throughout my study years. From the welfare office, Martin Block whose face lights up whenever he sees you. Thank you Martin for making us all feel at home. I also would like to thank Joy Misa for her support with editing and formatting of this thesis.

xiv WOMEN’S BARGAINING POWER & INTRA-HOUSEHOLD RESOURCE ALLOCATION IN RURAL ETHIOPIA
If it were not for the friendship of the following people, the journey would surely have been more difficult and lonely. My office mates: Rose, Suzanne, Larissa, Piyanit thank you for your friendship, Shyamika (thank you for being a wonderful friend), Renate (So Hanz, do you think we are…? dancing Matilda ), Kai, Sathya, Pedro, Arianne, Mariana, Ka-rem, Suchi, Akimi, Donald, Reko, Gloria, Saleem, Maz, Moushira, Atsu-shi, Caizhen, Camilo, Richard, John Agbonifo, Henry, Roselle, Deniz, Djalita, Angelica, Georgina, Runa, Kenji, Ricardo, Admassu, Anagaw, Zelalem, Tsegaye, Eyob, Selam, Hania.
When times were tough, I always turned to my friends, Martha Get-achew and Melat Getahun, who deserve all the credit for their continu-ous support and for keeping me sane throughout the process. Thanks girls for believing in me. Special thanks also go to my friends Fre, Betty, and Zemuye.
To my parents, Bushie Dito and Hawariat Michael, I just only hope that the return for your being the most loving, supportive, and hard-working parents is that your children succeed in what they do. That is why this should belong to you more than it belongs to me. My sister, Heliye, who believes in me more than I believe in myself and my two sweetest and cutest brothers, Amiye and Babye, thank you for your un-conditional love.
To my-in-laws Asnakech and Ayalew and my sister-in-law Aster and my brother-in-laws Dagim, Yehualashet, and Misrak, thanks for all your love and support.
This journey is unthinkable without the support and love of my awe-some husband, Anteneh Ayalew. Honeye, thanks for teaching me to ac-cept criticism with grace. You are my best friend and all I can say is thank God that I found you.

xv
Abstract
This thesis investigates the effect of a woman’s bargaining power on her welfare and that of her children in rural Ethiopia. The issue is of particu-lar concern because, as empirical evidence shows, intra-household ine-qualities in welfare are frequently the direct consequence of inequalities in power positions within the household. Although much progress has been made in this area, the literature still shows substantial gaps. While it is evident that different bargaining power indicators capture distinct di-mensions of women’s power, this is often ignored in the literature. Em-pirical analyses often work with the same narrow set of indicators, inde-pendent of the outcomes under study. Only a few studies have analyzed the distinct effects of specific dimensions and, hence, so far only little is known about what factors are relevant for which outcome.
Using information from focus group discussions, this thesis shows that the factors that affect a woman’s bargaining power in this context originate from various dimensions. These include material and social re-sources, marital institutions, and the agency dimension.
Using the Ethiopian Rural Household Survey dataset, the thesis anal-yses the effect of these dimensions on women’s participation in self-employed off-farm work and various health outcomes. It also analyses the effect of the balance of power within a household on children’s la-bour and schooling outcomes.
The study finds that women with better bargaining power have a low-er probability of participating in off-farm self-employed work. This rela-tionship remains the same during times of shocks when more participa-tion in off-farm work is needed to supplement income declines. By using multidimensional health measures, the study suggests that few common measures of power affect all dimensions of women’s health. This implies that efforts geared towards improving women’s health through empow-

xvi WOMEN’S BARGAINING POWER & INTRA-HOUSEHOLD RESOURCE ALLOCATION IN RURAL ETHIOPIA
erment should take into account the effect of a distinct dimension of power on a distinct dimension of health. For participation in self-employed work and most of the health outcomes considered, marital institutions and women’s agency are found to be important.
The study also provides an alternative perspective on women’s bar-gaining power and child welfare nexus by showing that the relationship between women’s power and children’s welfare is not always positive. The study shows that an increase in a woman’s power relative to her husband increases the number of hours children spend on domestic work and increases the probability that boys attend school. This effect is not found for girls. Indeed, a woman’s greater power over human capital investment reduces the chances of a girl going to school. When a man is more powerful than his wife in this sphere, both girls’ and boys’ chances of attending school decline. No evidence is found that the power rela-tionship within a household affects children’s educational attainment.

xvii
ESSAYS OVER DE ONDERHANDELINGSPOSITIE VAN VROUWEN EN DE TOEWIJZING VAN
MIDDELEN BINNEN HUISHOUDENS OP HET PLATTELAND IN ETHIOPIË
Samenvatting
Het onderzoek in dit proefschrift gaat over het effect van de onderhan-delingspositie van vrouwen op het welzijn van hen en van hun kinderen op het platteland in Ethiopië. Dit is een belangrijk onderwerp omdat uit onderzoek blijkt dat verschillen in welbevinden binnen een huishouden vaak een direct gevolg zijn van verschillen in machtsposities binnen het huishouden. Hoewel er op dit gebied veel vooruitgang is geboekt, bevat de vakliteratuur nog aanzienlijke lacunes. Het is evident dat verschillende indicatoren van de onderhandelingspositie verschillende dimensies van macht van vrouwen in beeld brengen, maar hieraan gaat de literatuur vaak voorbij. In empirisch onderzoek wordt vaak dezelfde beperkte groep indicatoren gebruikt, onafhankelijk van wat er onderzocht wordt. Slechts enkele studies hebben de effecten van specifieke dimensies apart onderzocht en daardoor is er tot nu toe weinig bekend over welke facto-ren relevant zijn voor welk resultaat. Op grond van informatie verzameld in groepsdiscussies blijkt in dit proefschrift dat de factoren die van in-vloed zijn op de onderhandelingspositie van vrouwen in deze context uit verschillende dimensies voortkomen. Hieronder vallen materiële en soci-ale hulpbronnen, huwelijksgebruiken en de dimensie agency (handelings-capaciteit).
Dit onderzoek maakt gebruik van de gegevens van de Ethiopian Rural Household Survey (een enquête onder plattelandshuishoudens in Ethio-

xviiiWOMEN’S BARGAINING POWER & INTRA-HOUSEHOLD RESOURCE ALLOCATION IN RURAL ETHIOPIA
pië) om het effect van deze dimensies op de arbeidsparticipatie van vrouwen als zelfstandige en op diverse gezondheidsvariabelen te analyse-ren. Het effect van het machtsevenwicht binnen huishoudens op kinder-arbeid en schoolprestaties wordt ook onderzocht.
Uit het onderzoek blijkt dat vrouwen met een sterkere onderhande-lingspositie een kleinere kans maken om als zelfstandige werkzaam te zijn buiten het boerenbedrijf. Dit verband geldt ook in slechte tijden wanneer er meer werk buiten het boerenbedrijf verricht moet worden om het inkomen aan te vullen. In het onderzoek worden multidimensio-nale gezondheidsmetingen gebruikt en de resultaten wijzen erop dat al-gemene maten van macht lang niet altijd van invloed zijn op alle dimen-sies van de gezondheid van vrouwen. Dit betekent dat men bij inspanningen om de gezondheid van vrouwen te verbeteren door em-powerment rekening moet houden met het effect van een bepaalde di-mensie van macht op een bepaalde dimensie van gezondheid. Bij de ar-beidsparticipatie als zelfstandige en de meeste bestudeerde gezondheidsvariabelen blijken huwelijksgebruiken en agency (hande-lingscapaciteit) van vrouwen belangrijk te zijn.
Het onderzoek biedt ook een andere kijk op het verband tussen de onderhandelingspositie van vrouwen en het welzijn van kinderen, door te laten zien dat het verband tussen de macht van vrouwen en het welzijn van kinderen niet altijd positief is. Uit het onderzoek blijkt dat een toe-name in de macht van een vrouw ten opzichte van die van haar man leidt tot een toename van het aantal uren dat kinderen aan huishoudelijk en economisch werk besteden en tot een grotere kans dat jongens naar school gaan. Dit effect is niet gevonden voor meisjes. Het is zelfs zo dat de kans dat een meisje naar school gaat kleiner wordt naarmate vrouwen meer macht hebben op het gebied van investeren in menselijk kapitaal. Wanneer een man op dit gebied meer macht heeft dan zijn vrouw, neemt zowel voor meisjes als voor jongens de kans af om naar school te gaan. Er is geen steun gevonden voor de hypothese dat de machtsverhouding binnen een huishouden het schoolsucces van kinderen beïnvloedt.

1
1 Introduction
1.1 Statement of the Problem
Although women make up 50 per cent of the world population, they are left behind in many aspects of welfare. They make up 70 per cent of the 1.3 billion poor people (UNDP 2011) and two thirds of the illiterates in the world (WDR 2011). They earn less than men and their labour force participation is low and has only risen by four percentage points on aver-age in the last 20 years (UNDP 2011). In contrast, their share of em-ployment in the informal sector has been on the rise. This is especially true of women in low income countries. And these countries particularly show low scores in gender development and empowerment indices (UNDP 2011). Such deprivations have serious consequences. Depressed economic growth, for instance, is associated with gender inequalities in education (Klasen 1999, and Dollar and Gatti 1999). Women’s depriva-tions in health, education and other aspects of welfare have serious in-tergenerational consequences (Christiaensen and Alderman 2001, Osma-ni and Sen 2003).
Analyzing the sources of these disparities has been the focus of re-search over the last decade. More specifically, research that explains the sources of these disparities by focusing on the intra-household dynamics has increased (Browning et al. 1994, Browning and Chiappori 1998, Manser and Brown 1980, McElroy and Horney 1981, Lundberg and Pol-lak 1993). Earlier research analyzed what happens at a household level (Becker 1973, and Samuelson’s 1956). As such, what goes on within the household was ignored. And research that looked at gender disparities focused only on female-headed households (Quisumbing et al. 1995, Bu-vini and Gupta 1997, Barros et al.1997). However, more and more evi-dence shows how access to resources differs among household members

2 CHAPTER 1
and how this depends on the power balance within a household. These studies show the presence of substantial disparities in the welfare of in-dividuals at the household level (e.g. Behrman 1988, Thomas 1990, Had-dad and Kanbur 1990, Pitt and Rosenzweig 1990). More specifically, the-se studies have documented the unequal access and control of resources within a household, and how this translates into differential levels of consumption, education and health outcomes, especially between men and women (Chen et al. 1981, Duflo and Udry 2004, Dercon and Krish-nan 2000, and Illahi 2000). Further evidence also shows the presence of discrimination between daughters’ and sons’ schooling, nutrition and time allocation, differential patterns of men’s and women’s participation in the labour market and differences in expenditure patterns between men and women (Behrman 1988, Pitt and Rosenzweig 1990, Qui-sumbing and Maluccio 1999, Lundberg and Pollak 1997). In view of this evidence, ignoring an intra-household inequality in various welfare out-comes could grossly under-estimate the overall level of inequality in a given country (Sahn and Younger 2009).
It is often the case that many of the differences in access to resources are often linked to the balance of power within a household. To capture this, studies have resorted to various measures with more emphasis given to those measures that capture women’s bargaining power relative to men (Doss 1997, Beegles et al. 2000, Dercon and Krishna 2000, Thomas et al. 2002, Pollak 2005). For example, an increase in working hours, wage rates and non-labour income, current assets, assets brought to mar-riage and expected assets in the event of divorce are associated with bet-ter women’s bargaining power (Blumberg and Coleman 1989, Pollak 2005, Blundell et al. 2005, Lundberg et al. 1997). Indeed, these aspects are themselves associated with an increase in expenditure on food, wom-en’s and children’s clothing and schooling, improvement in children’s and women’s health, and a reduction in fertility (Quisumbing and Ma-luccio 1999, Doss 1997, Dercon and Krishna 2000, Beegles et al. 2000).
In spite of the progress made to understand gender disparities in view of the power balance within a household, the literature still shows a number of gaps. These gaps stem from the way the indicators of bar-gaining power are used. For instance, there is more emphasis given to indicators that capture women’s economic empowerment. This is prob-lematic because not all women can benefit from their economic position in the same way. This is because benefiting from such resources may de-

Introduction 3
pend on social norms that constrain women’s power in other dimensions (Agarwal 1997). If norms, for example, shape women’s perceptions in such a way that they regard their needs as inferior to the needs of other household members, then access may not improve their welfare.
In addition to this, factors that affect a woman’s bargaining power in one context are often assumed to be relevant in another context. Given that this may not always be true, there is certainly a need to understand relevant factors for a specific context. What is also interesting is that some bargaining power measures used in the literature are not only indi-cators of power but are also results of the bargaining process within a household. A good example in this regard is how women’s labour market participation is widely viewed as a good source of women’s empower-ment. However, studies show that the nature of household bargaining could affect the pattern of women’s labour participation (Schultz 1990, Grossbard-Shechtman and Neideffer 1997, Chiappori et al. 2002, Angrist 2002). These studies found, for example, that women with better bar-gaining power prefer to spend more time on leisure activities rather than on work. The extent to which women’s labour participation is automati-cally assumed to be a good source of women’s participation can be illus-trated by the fact that labour participation is one of the Millennium De-velopment Goals that needs to be achieved in the hope of empowering women (see MDG3).
Another gap in the literature is in the outcomes considered. Empirical analyses often test the effect of a woman’s bargaining power on a limited set of outcomes. These are often related to expenditure on food, wom-en’s and children’s clothing, and women’s reproductive decisions. Also, studies often show the effect of a woman’s bargaining power on a given welfare outcome. However, which indicators of power are relevant for which welfare outcomes in a specific context are often not tested.
Some of these anomalies in research are also reflected on the policy side. Over the last decade especially, the Millennium Development Goals (MDGs) have been influential in shaping country-specific programmes on gender issues. This particularly pertains to two of these goals - MDG3 and MDG5. MDG3 focuses on gender parity in education, wage employment and political participation. MDG5 focuses on maternal mortality and, since 2005, on universal access to reproductive health.
Since the onset of the MDGs in 2000, few of the targeted outcomes have shown substantial progress. For instance, a recent United Nations

4 CHAPTER 1
report on the progress achieved so far underscores that the commit-ments are much more than the actual results obtained (UN 2010). Rea-sons for the slow progress are varied. MDGs are criticized for focusing more on material resources while largely ignoring the social relationships that govern access to these resources (Kabeer 2005). The factors that affect women’s empowerment are limited to specific dimensions related to education, wage work or political participation while other dimensions of women’s power have largely been ignored. They are also criticized for not explicitly addressing gender specific risks, vulnerabilities, roles and responsibilities (ODI 2008). A good example in this regard is the un-precedented focus given to reproductive health while other aspects of women’s health are ignored.
1.2 Research Questions
In view of the aforementioned gaps in the literature, this thesis attempts to answer the following four questions:
1. What factors are relevant in explaining women’s bargaining pow-er within a household in rural Ethiopia?
2. How does a woman’s bargaining power affect her participation in non-farm work? And how do shocks affect this relationship?
3. How does a woman’s bargaining power affect her health status and the intra-household health inequality?
4. How does a woman’s bargaining power affect children’s labour and schooling outcomes?
Clearly, the answers to the first question can be used to answer the remaining research questions. Apart from the research gaps discussed above, the justifications for asking these research questions are discussed in detail in the individual chapters in this thesis.
1.3 Overview of Data and Methodology
The thesis uses both qualitative and quantitative datasets. The qualitative dataset is used to answer the first research question. This data is based on information from focus group discussions1 I undertook from De-cember, 2008 to February, 2009 in rural Ethiopia. The remaining re-

Introduction 5
search questions are addressed using the Ethiopian Rural Household Survey dataset.
Conducting focus group discussions (FGDs) was found to be indis-pensable to getting a sense of which factors villagers perceive to be im-portant for a woman’s bargaining position in rural Ethiopia. The FGDs were conducted in four sites from four regions in Ethiopia. These sites are covered by the Ethiopian Rural Household Survey. These four re-gions are: Oromiya, Tigray, Amhara, and Southern Nation and Nationali-ties. These regions are organized according to dominant ethnic groups which together make up almost the total cultural heterogeneity in Ethio-pia. From each region one site was selected for the FGD. From Oromiya the site selected was Turufe-Kechema; from Tigray, Haresaw; from Am-hara, Dinki; from Southern Nations and Nationalities, Imbdibir. Eight separate FGDs were conducted with women’s and men’s groups in order to understand men’s and women’s perceptions. Each focus group dis-cussion consisted of six to eight individuals.
To answer the remaining research questions, I use a quantitative da-taset from the Ethiopian Rural Household Survey. The Ethiopian Rural Household Survey was collected by the Department of Economics of Addis Ababa University, Oxford University and International Food Poli-cy Research Institute. It is a rich dataset that comes in seven rounds: round one (1994a), round two (1994b), round three (1995), round four (1997), round five (1999), round six (2004), and round seven (2009).
The first survey was conducted in 1989 to understand the response to the food crisis which was affecting the country at that time. The survey provides information on 450 households regarding consumption, assets and income. The sampling in the first round considered villages which were affected by the famine and drought in 1984-1985. Seven villages were randomly selected. Households were then proportionally and ran-domly selected after stratification by the sex of the head of the house-hold. This round is not considered in this thesis since it lacks the relevant information to answer the research questions stated above.
The second survey was conducted in 1994 with nine additional villag-es which represent the different agricultural systems in the country, ex-cluding the pastoralist areas. Accordingly, the newly included villages were obtained by using a stratification of the main agro-ecological zones and sub-zones and the villages were selected randomly from the different strata. Similarly to the first survey, the selected villages were again strati-

6 CHAPTER 1
fied into female and male headed households and 1447 households were randomly and proportionally selected. Data for the remaining rounds was collected based on this sampling framework and specifications to create a household panel dataset.
This dataset is suitable for such study because it provides individual level information on various welfare outcomes such as health, labour market participation, expenditures, child labour and schooling. Beyond this, the availability of information that shows women’s power position makes the testing of these indicators on various welfare outcomes possi-ble.
One of the most important contributions of this thesis is the unique approach it adopts in integrating the qualitative information in the quan-titative analysis. This is less common in economics research. The qualita-tive data has helped in teasing out the relevant bargaining power indica-tors. The quantitative data helped to provide proxies and has helped to analyze to what extent the identified indicators explain welfare outcomes such as women’s participation in non-farm work, their health status and the nature of their children’s labour and schooling.
The econometric techniques used are discussed in detail in the various chapters. At this point, it is important to highlight the challenges faced in using the Ethiopian Rural Household Survey while addressing the aforementioned research questions. Questions relating to factors that affect women’s power are only available in the 1997 round. This round provides information on time invariant indicators of power. Moreover, for those bargaining power indicators that potentially change over time, follow-up questions in subsequent rounds were not administered. This was found to be problematic, especially when trying to utilize the panel nature of the data. This means that controlling unobserved heterogeneity has been a big challenge throughout the empirical chapters. In the se-cond research question, the random effects estimation technique is used to show the effect of bargaining power on participation in non-farm work. Fixed effects estimation was used to examine the interaction of bargaining power indicators and the shock variables. While answering the third research question, random effects estimation is again used. To answer the fourth research question, single cross-section data from the 2009 round was used and I applied estimation techniques applicable for cross-section data.

Introduction 7
1.4 The Setting and Justification
It is worthwhile to ask the aforementioned research questions in the con-text of Ethiopia. Ethiopia lags behind many countries in many basic so-cial indicators with its per capita income standing at 157 US dollars. This is one of the lowest in the world.2 The country has one of the fastest growing populations in Sub-Saharan Africa with a population of 80 mil-lion (CSA 2007).
83 per cent of the population resides in rural areas (CSA 2007) hence the focus of this research on households in these areas. For most rural dwellers, the primary source of income is agriculture which mainly de-pends on rainfall. Drought and famine are recurrent phenomena which increase the number of food insecure people every year. 38 per cent of the population is poor with a higher proportion residing in rural areas (MOFED 2006). These facts are readily confirmed by the country’s low human development index (0.44) which puts it at a rank of 169 out of 177 countries in the world (UNDP 2010).
Ethiopia is a country where substantial disparities in several welfare outcomes among women and men are prevalent. This is reflected in a very low Gender Related Development Index (0.39) and the Gender Empowerment Index (0.45).3
Women in Ethiopia are often faced with inequality in ownership of productive assets, something which has continuously reduced their ac-cess to resources and their say in decision making both within and be-yond their households. Land, as the most important resource for the ma-jority of rural households in the country, shows a huge gender divide in its distribution. On average 82 per cent of men but only 16 per cent of women own land (Abaynesh 2001).
Harmful traditional practices such as early marriage, kidnapping and female genital mutilations are prevalent. Nearly 88 per cent of rural women4 claimed that their husbands have the right to beat them (Wiki gender 2008).
To curb these inequalities, the government of Ethiopia formulated the National Gender Policy on Women in 1993. It also adopted the Mil-lennium Development Goals in 2000 and included gender issues as very important cross-cutting issues in its poverty reduction strategy pro-gramme. Likewise, laws on female genital mutilation, kidnapping and early marriage have been introduced in recent years. Over the past two

8 CHAPTER 1
decades, there have been areas where substantial changes have been ob-served. For example, the empowerment programme fostered within the National Gender Policy has shown results in equipping women with bet-ter economic empowerment, in bringing about changes in perceptions and so on. Although the government initiated these policies, the imple-mentation of specific gender sensitive programmes was decentralized and conducted at the regional level. As such, it fell within the decentrali-zation policy the government has been following over the last two dec-ades. Decentralizing gender sensitive programmes has potential benefits in identifying region-specific gender problems and making tailor-made programmes and policies. However, as a World Bank report shows, the National Gender Policy failed to reduce women’s disadvantages due to the absence of demand driven projects as a result of the top-down ap-proaches it has followed (WB 1998).
In finding answers to the four research questions contributes to poli-cy and gender research in various ways. First and foremost, it fills the gap in gender desegregated data in the country. The problem with a lack of such data is that it has created challenges in following progresses in important welfare outcomes. Beyond education, reproductive health and economic empowerment, the focus on welfare outcomes such as wom-en’s labour market participation or various dimensions of their health status would provide interesting insights.
Given that the end of the time frame allotted for achieving develop-ment goals is approaching, the discussions in this thesis provides inter-esting perspectives in various ways. First, the thesis attempts to explain on what it means to participate in the labour market and how this relates to bargaining power as opposed to the approach of using labour market participation as an indicator of empowerment. Two, it brings to the fore-front the importance of looking into various dimensions of a woman’s health rather than the unprecedented focus given to reproductive health in both policy and research. Finally, it gives a new perspective on the na-ture of the women’s bargaining power and child welfare nexus.
1.5 The Chapters
The rest of the thesis is organized into five chapters. The next chapter provides a review of the measures of power used in the existing empiri-cal literature and discusses the factors that affect women’s bargaining

Introduction 9
power in the context of rural Ethiopia. The third chapter provides evi-dence on the link between a woman’s bargaining power and her partici-pation in non-farm work. It also highlights how shocks shape this link. The fourth chapter examines to what extent a woman’s bargaining power affects various dimensions of her health as well attempting to explain how it affects intra-household inequality in health. Chapter five presents evidence on the effect of the balance of power on child labour and schooling outcomes. The last chapter presents the conclusions and poli-cy implications.
Notes
1 The data collection was carried out with the help of a research assistant that I hired in Ethiopia. With the exception of one site, Turfe-Kechema in which my research assistant served as an interpreter, I administered the discussions myself. 2 The PPP adjusted per capita income in 2005 was 1055 dollars (UNDP 2007) 3Figure is for the year 2005 (UNDP 2007). 4 Figures are for the year 2005.

10
2 Determinants of Women’s Bargaining Power in Rural Ethiopia
This chapter discusses the bargaining power indicators used in the exist-ing literature. It also discusses the factors that affect women’s bargaining power in the context of rural Ethiopia based on information from focus group discussions. Finally it presents the descriptive statistics of the bar-gaining power indicators used in the rest of the chapters in this thesis.
2.1 Indicators of bargaining power: The Literature
Several studies in the social science literature have used various factors that affect women’s bargaining power. In economics specifically, the lit-erature often measures bargaining power based on resources or materi-als. Among the most widely used indicators are assets which are often seen as important elements of household or individual ownership. The fact that an asset can be transferred during an individual’s life time and that it has a symbolic meaning beyond its economic value makes it more appealing compared to other measures (Quisumbing and Maluccio 1999). Current assets, assets brought to marriage and expected assets up-on divorce are commonly used in the literature.
Ownership of current assets as a bargaining power indicator have been used in various studies and are positively associated with food ex-penditure (Doss 1997) and better reproductive decisions (Beegles et al. 2000). However, the amount and the types of assets accumulated depend on the bargaining process within a household.1 As a result, the causal relationship between current assets and bargaining power gets fuzzy.
This problem is, to a certain extent, minimized when bargaining pow-er is measured using assets brought to marriage. Such assets serve as an important indicator of economic independence within marriage. This is because they are not only retained as individual property during marriage but are also excluded from settlements if the marriage dissolves (Thomas

Determinants of Women’s Bargaining Power in Rural Ethiopia 11
et al. 2002). It is, as studies show, positively associated with increase in food budget shares, expenditures on child schooling and child health, decline in expenditure on alcohol and cigarettes (Quisumbing and Ma-luccio 1999, Dercon and Krishna 2000, Quisumbing and Briere 2000, Thomas et al. 2002).
It is argued that assets brought to marriage rather reflect the tastes of parents who often arrange marriages2 and transfer resources rather than the preferences of either the woman or the man in a marriage (Franken-berg and Thomas 2001). This is problematic as it has implications on a woman’s control over some of these assets.
Beyond this, given that rural households in developing countries are highly exposed to various shocks and that these households use their assets as a buffer to smooth consumption, understanding whose assets are used for this purpose in the event of these shocks is important. Clearly, if the power relationship in such households leads to the sale, in a time of shock, of the assets brought to the marriage by the woman, the number of these assets will decline over time.
The expected level of assets upon divorce is also taken as an alterna-tive indicator of bargaining power as a response to the Nash bargaining model. The Nash bargaining model argues that those women who have better fall back option outside the marriage have better bargaining power within the marriage (McElroy 1992). Often these fall-back positions are measured in terms of expected assets up on divorce. Those women who expect to receive more assets upon divorce are assumed to have better bargaining power compared to those who expect to get nothing. Studies show the positive association between these assets and women’s nutri-tion (Dercon and Krishna 2000) and an increase in cash crop production (Lim et al. 2007).
The fall-back position is often measured in terms of wealth or income and ignores the distribution of responsibilities, costs of caring for chil-dren, and resource transfer after divorce. As a result, it does not fully capture the constraints that a woman faces when divorce occurs (Folbre 1997). These constraints often originate from family law, public policies on childcare, and income transfers and are usually gender-identified con-straints that affect women’s position when divorce occurs. For example, women are both legally and culturally expected to assume custody of their children upon divorce (Kabeer 1999). This means, though divorce settlements allow women to get equal share of household assets, their

12 CHAPTER 2
responsibilities for their children reduces the benefits from these assets. This adversely affects their bargaining position in the course of the mar-riage.
Apart from using assets, labour and non-labour incomes are used as measures of bargaining power. The literature finds evidence of an in-crease in women’s bargaining power as a result of an increase in the hours of work and wage levels (Blumberg and Coleman 1989). However, using labour income as a bargaining power indicator is more problematic than measures like assets brought to marriage. This is because having a wage income might be a result of the bargaining process within a house-hold. Furthermore, an increase in a woman’s bargaining power due to an increase in labour income is conditional on how and why the increase in labour income has occurred. For example, the increase in women’s la-bour supply could be due to the low transfer of income from husbands to wives (Carter and Katz 1992, and Elson 1998). It could also be due to an increase in the time devoted to the labour market while wages are constant (Pollak 2005). In addition to this, a woman may have little con-trol over this income (Agarwal 1986). This forces women to be secretive about their income-earning activities (Agarwal 1994, Zohir and Paul-Majumder 1996, Endeley 2001). Also, the level of extra transport, cloth-ing and accommodation (in the case of migration) costs as a result of labour market participation could offset the benefits from wage income (Elson 1998).
Apart from labour income, non-labour income has also been used a bargaining power indicator. It is positively associated with girls’ educa-tion, increase in food expenditure (Thomas 1990, and Schultz 1990) and expenditure on children’s and a woman’s clothing (Lundberg et al. 1997). Its use as a bargaining power indicator is less problematic since it is ex-ogenous3 to household decision-making compared to most of the measures discussed above (Pollak 2005). It, however, constitutes a small fraction of household income and as a result does not play a significant role in explaining household circumstances (Pollak 2005).
Other studies have gone beyond resources and focused on alternative measures of bargaining power. This includes education which is positive-ly associated with a woman’s say in fertility decisions (Govindasamy and Malhotra 1996), and a reduction in childhood malnutrition (Handa 1999, Thomas 1994). The pathways from education to a woman’s bargaining power could be through exposing her to ideas that promote her inde-

Determinants of Women’s Bargaining Power in Rural Ethiopia 13
pendence from prohibiting traditional norms (Malhotra and Mather 1997). It could also be via increasing her access to resources and skills through employment opportunities.
However, these effects are dependent on a specific cultural context and could be restricted to specific domains of power. For example, edu-cation could have less significance for a woman’s economic empower-ment in cases where women are culturally allowed to have more control over household resources (Malhotra and Mather 1997). Moreover, its effect could be limited to the financial dimension of domestic power with no effect on the social and institutional dimensions (Malhotra and Mather 1997).
Beyond the indicators used above, indicators that reflect social con-texts are also used. This include religion, household and life course facts such as the wife’s age, marital duration and children, sons, the age differ-ence between wife and husband (Malhotra and Mather 1997, Gupta 1995, Morgan and Niraula 1996, and Schuler et al. 1996). These are often used in qualitative studies. For example, increase in a woman’s age is as-sociated with increase in a cumulative bargaining power (Gupta 1995). Likewise, sons are also associated with increasing her bargaining position and are important in certain welfare outcomes such as a reduction in domestic violence within marriage (Schuler et al. 1996).
This section shows how the bargaining power indicators used are var-ied. It also shows that a woman’s bargaining power is not only affected by her access and control over resources but is also potentially influ-enced by familial and societal relations. In what follows I discuss, the different factors that are relevant in the context of selected sites in rural Ethiopia.
2.2 Evidence from Ethiopia
From December 2008 to February 2009, I conducted Focus Group Dis-cussions (FGDs) in rural Ethiopia to enrich the information on women’s bargaining power collected with the Ethiopian Rural Household Survey and to see whether measures usually used in the literature are relevant and applicable in the context underlying this study. The FGDs also helped to identify new proxies, not yet discussed in the literature but rel-evant in the given context.

14 CHAPTER 2
I start with the discussion of gender identity and roles and their impli-cations on women’s welfare. These not only reveal but also perpetuate underlying power relations in a given society. The focus group discus-sions all confirmed that gender stereotypes exist. Both men and women describe men in such terms as ‘strong, intelligent, superior, confident, and capable of defending their rights’, while they described women as ‘not useful to their families, weak, inferior, incapable of pursuing their rights and freedoms even when they are given the opportunity to do so, weak in school, and less deserving’. Discussions with women’s groups in most sites where the discussions took place showed that women feel un-comfortable with such stereotypes. While they think that men are indeed physically stronger, they argued that women are as intelligent as men.
Both men and women recognise the contribution such stereotypes make to perpetuating many of the prejudices that exist in their communi-ties. For example, in all areas, until recently, women rarely inherit their family wealth. On occasions when they do, they get less than they should inherit according to the rules or law. Men’s groups in Tirufe-Kechema stated that women are often restricted by social norms to take advantage of modern laws that are potentially beneficial to them. In Imdibir, wom-en stated that it is socially acceptable that husbands beat their wives since disciplining them is considered to be their responsibility.
These stereotypes are often layered with gender related behaviours that are culturally desirable or acceptable. For example, in all the sites visited, a woman is considered to be ’good’ if she excels in her traditional responsibilities such as domestic work and taking care of her husband. A good woman is also expected to suppress her own needs for the sake of her family. For example, the discussion revealed that society expects women to feed their family first before feeding themselves. Both men’s and women’s groups affirmed that women are more likely to eat less dur-ing times of food shortage.
Discussions in all of the sites revealed how women are expected to clean, fetch water, cook, collect firewood, care for their children, and feed labour hired for agricultural activities. In addition to their primary tasks, they are also expected to participate in agricultural activities such as weeding and harvesting. In contrast, men are mainly responsible for agricultural related tasks and are not expected to help out in domestic work. Even though women play important roles in both reproductive as well productive aspects, their contribution is considered to be inferior to

Determinants of Women’s Bargaining Power in Rural Ethiopia 15
that of men. This can be illustrated by a statement from women’s groups in Dinki:
Men’s tasks are considered to contribute to household income hence are more appreciated, while women, instead of generating income, are in-volved in tasks that use the households’ income. As a result, women are considered to waste the family income.
Men who perform traditional women’s roles are widely viewed as ’womanly’. As a result, men are not particularly eager to participate in such ‘deprecating’ work. In most of the study sites, both mothers and fathers do not allow boys to enter the kitchen, to fetch water, to cook or to be involved in any job that is considered womanly. Men who do women’s jobs feel emasculated as they often face humiliation from their fellow men and, very interestingly, from women as well. On the other hand, in most of the sites visited women who do men’s jobs are often cheered by the society.
Both men and women claimed that while women’s work is carried out all year and all day, men’s work is intensive only during the agricultural seasons and is often performed during the daytime. Women argued that they often do not rest as their work is both time consuming and difficult to perform. The men’s groups admitted that women do indeed work for long hours but argued that they perform relatively easier tasks.
The construction of women’s work as ’easy’ and ’emasculating’ have largely contributed to static gender roles in rural Ethiopian society. These roles have, by and large, considerable implications for women’s time burden, and thus their physical as well as mental well-being. Do Women Bargain?
Both theoretical and empirical literature on intra-household resource allocation has long discussed the importance of a woman’s bargaining power for her and children’s welfare. What is found in this context and is not often discussed in these literature is how bargaining takes various modes. Sometimes it involves overt ways of bargaining such as confron-tation and revolt. This however is costly since the women who bargain heavily are often threatened or face marital dissolution. Since norms con-sider divorce or separation a taboo, few women resort to this strategy. Men’s groups in most of the sites stated that a man is justified to divorce his wife without giving her any property if she does not consult him or ask his permission when she decides to do something. As a result, many

16 CHAPTER 2
women prefer to politely communicate their position in household nego-tiation.
Others, on the other hand, resort to mediation through their parents and relatives.
Interestingly, excelling in domestic tasks is another strategy that women use to have access to resources within a household. Focus groups pointed out that those women who excel in domestic work have more bargaining power than women who do not. It has to be recognized that while women’s reliance on excelling in domestic work works for their best interest in accessing resources to a certain extent, it does not lead to the changes that is needed in the gender division of labour in this context. As such, such choices continue to contribute to rigid gender divisions of labour where women continue to rely on their traditionally assigned roles for their bargaining position. This is a good example that illustrates Moser’s argument of the distinction one needs to make regard-ing practical as opposed to strategic gender needs (Moser 1993). She ar-gues that
Practical gender interests arise from the concrete conditions of women's positioning by virtue of their gender within the division of labour. Unlike strategic gender interests, practical gender interests are formulated by the very women themselves who are within these positions, rather than through external interventions. Practical interests are usually a response to an immediate perceived need which is identified by women within a spe-cific context. These are most commonly practical in nature and relate to the inadequacies in living conditions which women face on a daily basis. Therefore they do not generally entail a strategic goal such as women's emancipation or gender equality (Moser 1993).
Women also turn to other strategies that do not directly involve bar-gaining to pursue their interests. One such strategy is hiding their in-comes from off-farm work. It is important to note that women could resort to multiple ways of bargaining to access resources within a house-hold.
Not only how women bargain but also the extent to which they bar-gain is limited. For instance, if bargaining does not result in consensus, it is often the husband’s opinion which takes precedence. This is rather common in all the sites visited. The implication is that the extent to which women push for their interests during household negotiations is

Determinants of Women’s Bargaining Power in Rural Ethiopia 17
limited and heavy bargaining by the woman may result in undesirable outcomes like divorce. This is in contrast with what is depicted by the collective household model where the household negotiation process is assumed to bring about the most efficient allocation of resources.
It should be noted that different factors determine what kind of strat-egies women use during household negotiations. In many of these strat-egies, economic resources such as assets brought to marriage, as well as current off-farm income plays an important role. Women also use social networks and various relationships to increase their power. Institutional arrangements also play a significant role in setting power relations within a household. How exactly different factors affect women’s power posi-tion is explained in the following section.
Factors that affect Women’s Bargaining Power
This section discusses the various factors that affect women’s bargaining power under three sets of dimensions. These include resources, institu-tions and agency. The resource dimension includes economic, human as well as social resources (Kabeer 1999). The institutional dimension cap-tures systems of established and prevalent social rules that structure so-cial interactions (Knight 1992). On the other hand, the agency dimension encompasses the meaning, motivation and purpose which individuals bring to their activity, their sense of agency or the power within (Kabeer 1999). These dimensions affect a woman’s bargaining power in a non-linear fashion (Care 2006) as shown in Figure 2.1.
Resources could play a role in relaxing the constraints associated with the spheres that women have a say in. This, in turn, reshapes the power relationship within a household by changing traditional roles. Institutions influence individuals’ perceptions regarding their contributions and needs and hence influence their behaviour. They could also establish de-cision-making spheres, thus limiting the areas individuals can have a say over. Human resources such as education, for instance, help individuals challenge existing norms thus facilitate the reshaping of these norms.
Institutions often set the boundaries within which women and men interact and negotiate with each other by setting specific rules for distri-bution of tasks, and resources. They also determine the relevant social resources and a person’s agency. Women with better agency, bring shifts in what is normally accepted. Resources also play a role in changing insti-tutions or norms or women’s sense of power. For example, a recent

18 CHAPTER 2
study that evaluated an empowerment program, the Ethiopian Women Development Initiative Fund, showed that only few participant women support norms that prohibit women from ploughing, riding animals and carts, and walking alone compared to non-participants (IDA 2008).
Figure 2.1Analytical Framework on Dimensions that affect Women’s Bargaining Power
Source: Care, 2006
The various factors under each dimensions identified from focus
group discussions are discussed below.
Resources
Economic Resources Focus groups identified economic resources as important for women’s bargaining power. This is consistent with the findings of previous studies (Quisumbing and Malucio 2002, Dercon and Krishnan 2002, Doss 1997, Fafchamps et al. 2010). The most common economic resources are as-sets. These assets are transferred during marriage in different forms. The first form of transfer, which is common in all the areas visited, is from the husband to wife’s parents at the onset of the marriage. The second form is from the wife’s parents to the husband. The third type of trans-fer occurs from parents to couples.
Bargaining Power
Resources
InstitutionsAgency
Determinants of Women’s Bargaining Power in Rural Ethiopia 19
The most common gifts are cattle, money and traditional blankets.4 The level of assets men and women are expected to bring to the mar-riage differ from one area to another. For instance, in Dinki both women and men are expected to bring an equal number of assets to their house-holds upon marriage. As stated in the focus group discussion: ‘if a man brings one cow, a woman is expected to bring one as well’. Such expecta-tions are not prevalent in other areas. What the discussions in all the sites showed is that wives are expected to bring household furniture and uten-sils in addition to assets like livestock or land.
Both men’s and women’s groups in all the sites reported that as the quality and value of a bride gift increases, the woman is considered by her husband as a purchase. For example, in Tirufe-Kechema, it was re-ported that a father invites guests for his daughter’s wedding by saying: ‘I am selling my daughter and you are invited’.
In all the areas studied, it was reported that the effect of a bride gift on setting power relations within a household depends on the assets a wife brings to the marriage. Apart from bringing extra labour and the potential to produce children, the wealth brought into the marriage by women in the form of livestock, land and household furniture is one of the benefits men expect to gain from marrying. If a woman does not bring any assets with her, while her husband hands over a large number of gifts to her parents, she will find herself in a lower bargaining posi-tion. The men’s groups in Dinki described the situation of such a woman as follows:
If she does not bring assets, the husband would treat her in a bad way. He would tell her that he does not care if she leaves. But a woman who brings assets can do anything she wants and sometimes tells her husband what to do. On the other hand, it is only a woman brings a lot of assets that the husband will invite her to sit with him. If not, he will say, sit over there.
Focus groups also reported that women with few or no assets tend to experience more verbal and physical violence. They also claimed that a husband from such a household either marries another wife or becomes involved in extramarital relationships with other women.
In areas like Tigray, a woman’s parents are expected to provide a dowry known as ’gezmi’ to the husband. Money and cattle are the most common gifts. The higher the value of the gift, the better a wife’s bar-

20 CHAPTER 2
gaining position would be within the household. This is illustrated by a statement from the women’s focus group in Haresaw:
If the ’gezmi’ is very small, the husband insults her by calling her ‘poor’ in front of his friends and relatives and threatens to divorce her. But a wife with a bigger ’gezmi’ or dowry is always in agreement with her husband.
Others, however, argued that ’gezmi’ does not significantly affect a woman’s power as it is a gift transferred to a husband rather than an as-set registered in the wife’s name in a written document.
Income earned from off-farm work also has a bearing on women’s decision-making power in the context of rural Ethiopia. Both men’s and women’s groups stated that a woman who brings in income from off-farm work has more say in the household bargaining process. Given that income from agricultural sources is declining, women’s participation in off-farm work is increasingly being encouraged to supplement these in-come declines. The men’s groups in all the areas under study reacted positively to women being involved in income generation. However, men do not encourage women to participate in certain types of work. A good example is traditional hair dressing. Women’s groups in Haresaw said:
If a woman earns income from traditional hair dressing, her husband con-stantly complains and he does not want to eat what she cooks because he thinks that it is a dirty job.
Even though it is argued that off-farm work is important, it depends on the type of off-farm work and the amount of income it generates. In many of the areas, contrasting views were expressed regarding women’s control of income from off-farm activities. While many agree that wom-en control their own incomes and can use the money to spend on items of their choice, others stated that women have to hide the income they earn to prevent husbands from taking their money.
Apart from individualized resources, resources at a household level have important implications on women’s decision-making power. For example, many of the participants in the discussions in Tirufe-Kechema and Haresaw agreed that a woman in a wealthy household participates in decision-making and have plenty of opportunities to administer house-hold wealth. They agreed, however, that she is also burdened with work

Determinants of Women’s Bargaining Power in Rural Ethiopia 21
due to the large size of the landholding and the large number of live-stock.
Contrasting views were expressed regarding women’s bargaining power in poor households. On the one hand it was reported that couples in such households get along very well since they have to cooperate to allocate scarce resources efficiently. On the other hand, it is argued that scarcity of resources brings further tensions that expose women to do-mestic violence. When resources are relatively scarce, negotiations strictly follow traditional norms that require women to prioritize the needs of their husbands and children above their own. In households with rela-tively abundant resources, on the other hand, not following traditional norms has lower social costs and allows women to actively participate in decision-making.
While focus groups in Dinki revealed that women’s decision-making power does not depend on the household’s economic status, women’s focus groups in Imdibir expressed the opinion that women in rich households encounter less challenges and have more input in household decision-making. The women expressed the differences between women in rich vis-à-vis poor households as follows:
‘A woman in a poor household is needed only for work’.
Education The importance of education was emphasized in all the sites visited. Men reported that an educated woman is well appreciated since she knows how to calculate expenses and revenues, knows the benefits of family planning, and is more convincing in discussions with her husband. Simi-larly, the women’s groups stated that an educated woman is much more respected and has more say in the household. This is because, according to them, she has better analytical skills, speaks her mind without fear and knows what is best for her family.
In most cases, most women and men in rural areas are not educated. A large proportion of the individuals (nearly 85 per cent) in the Ethiopi-an Rural Survey data used in this thesis never went to school. As a result, focus groups in sites like Dinki for example claimed that they were talk-ing about the role of education without being able to refer to actual cases in their village.

22 CHAPTER 2
Social Resources Although so much focus is given to economic resources in the lit-
erature, the type of resources relevant in setting power relations within a household go beyond such a narrow definition of resources. As such, social resources have important implications on women’s bargaining power. Some of these come from complying with specific norms related to having children and sons, both of which are important status symbols. A woman who cannot give birth is referred as a ‘mule’ or, as some focus groups reported, is described as ‘a broken handle of a pot with no use at all’. In most cases, women who cannot have children face divorce. Since divorced women who are unable to have children have a lower chance of re-entering the marriage market, some women encourage their husbands to have children by other women.
Beyond this, having children of a preferred sex gives women more access to household decision-making. Norms and factors associated with labour market opportunities guide sex preference biased towards male children. Differences in son preferences are observed across sites. The men’s groups in Imdibir reported that they prefer a daughter as first born because when sons grow up, they start disrespecting their fathers. Some of the women’s focus groups in the same area also stated that they prefer to have girls since they help in domestic work. However, even given some slight changes in preferences in recent years as described above, most parents still prefer to have sons. As pointed out by focus groups in Tigray, people still celebrate the birth of a boy by ululating three times and only once upon the birth of a girl. A focus group state-ment that parents would prefer ‘to have a blind son rather than a beauti-ful daughter’ illustrates the strong preference in favour of sons. This suggests that fulfilling such social preferences gives women more bar-gaining power.
In particular, the sex of the first born plays a role in power relations within a household. It is common to see that women whose first born is a son are more respected and have more bargaining power. It is often assumed that girls will eventually become part of another family and take some of her birth family's wealth with her on marriage. In contrast, sons are seen to add to the family wealth and labour by bringing an additional person into the family. Hence, they are considered as protectors of the family name.

Determinants of Women’s Bargaining Power in Rural Ethiopia 23
What happens to women’s bargaining power is also determined by the age of sons in this context. As pointed out by focus groups, grown up sons are important sources of bargaining power for women. It is ar-gued that women who have grown up sons face less domestic violence. However, women’s focus groups in Tirufe-Kechema expressed a differ-ent view, as follows:
We feel that we are stuck in a household with two powerful men and pleasing both is often difficult. Husbands think that we like our sons bet-ter but our sons would harm us if we go against their demands.
Familial or kinship relationships are other forms of social resources that affect a woman’s bargaining power. According to focus groups, hav-ing brothers affects women’s power position positively. Such women can confront their husbands during household decision-making discussions and husbands feel obliged to meet the demands of their wives out of fear for her brothers.
Parental wealth is another key social resource. It is, as focus groups pointed out, a potential buffer against negative shocks, including nega-tive externalities related to domestic violence. According to focus groups, women with richer parents are more likely than women with poorer families to return to their parents’ home if they disagree with their husbands. While parental wealth is reported to be important in cas-es of arranged marriages, it is claimed that it is not as relevant in marriag-es based upon a couple’s mutual agreement.
The importance of living in the village of birth on a woman’s deci-sion-making power is also noted from focus group discussions but the effect is reported to be rather mixed. Focus groups in the northern part of the country argued that a woman who lives in her birth place has more say due to the social support she can rely on in her home village. However, those in the south underscored that, because a woman who resides in her birth place could face interference in her day to day house-hold affairs from close kin, living in her birth place puts a strain on her relationship with her husband. Alternatively, a woman who lives in her husband’s birth place may have more say due to the extra care provided to her by the husband’s family or even the whole clan: since the hus-band’s relatives do not want the wife complaining to her parents or other family members.

24 CHAPTER 2
Marital Institution and Agency Institutional arrangements are one of the most important key factors that affect women’s bargaining power. More specifically, marriage arrange-ments have considerable implications for ex-post bargaining considera-tions (Zhang and Chan, 1999). For example, Jacoby and Mansuri (2009) documented the importance of marriage based on bride exchange5 in ensuring the welfare of women in rural Pakistan. They argued that be-cause of a potential reciprocity, such marriages protect women’s welfare.
Marital arrangements take various forms in the context under study. A large proportion of marriages in rural Ethiopia are arranged by the couple’s parents. One of the requirements is often that the woman is a virgin at the time of marriage. If a woman is unable to fulfill this re-quirement, it brings shame to her and her family. It is the groom's family who search for a bride for their son not vice versa though the bride's parents can and do put up certain conditions to be fulfilled before agree-ing to the marriage. During the negotiation period, the bride to be is not at all consulted and it is her duty to marry the man chosen by her family. The bride and groom meet for the first time on their wedding day.
Kidnapping or abduction is another way of arranging marriages in ru-ral Ethiopia. It is only as recently as 2005 that bridal abduction was made illegal in the country. A strategy used by an abductor to make a woman stay in a marriage is to engage in sex - often involving rape. Once a woman loses her virginity, she is left with no choice but to remain mar-ried. A girl who runs back to her family is forced to return to her abduc-tor since parents want to avoid the shame of having a 'tainted' daughter Hari (2010). They, as a result, negotiate with the kidnapper to make the marriage legal.
Reasons why such marriages occur are varied. Some men cite love as a major reason for resorting to kidnapping. As cited in Hari (2010), one abductor explained why he kidnapped his wife as follows:
I used to see her in the market where I sell pots. She was beautiful. I never talked to her, but I loved her. One Monday, I called my friends and we picked her up and took her to the car and away with us.
Kidnapping also occurs for economic reasons. It is used as a strategy by the abductor to avoid paying the high bride price set by parents who want to benefit from the marriage. It also occurs by agreement between the girl’s parents and the kidnapper if her parents cannot afford the ex-

Determinants of Women’s Bargaining Power in Rural Ethiopia 25
penses of caring for their daughter and paying for the wedding ceremo-ny. Such marriages also occur as a way of ensuring that a girl is married at an age required by the norm.
What happens after kidnapping is of particular interest. Most women are unhappy with the situation they find themselves in at first, but come to terms with it during the course of the marriage. This is because there is a strong preference for women to be married rather than remain sin-gle, even if the marriage is brought about through kidnapping.
Marriages arranged by parents and abduction are fostered within a norm that encourages the marriage of women at an early age. Children can get married at age as low as 8 to 10 years old. The main reasons for early marriage are tradition, to strengthen social ties, for prestige, to avoid difficulty in getting married when older, to earn dowry, to protect virginity and to avoid premarital affairs (ICRW, 2008). In cases of girl-child marriage, which is common in some parts of the country, the age gap between spouses is very large. This leads to a situation in which a girl’s education gets interrupted, thus constraining her life choices, in-cluding low access to household decision-making as girls become re-sponsible for domestic work and child care at a young age (UNICEF 2006). Also, more fertility associated with a longer period of marriage increases women’s vulnerability to various health problems.
Given that most marriages are arranged either by family or by abduc-tion, there is often little room for a woman to choose her own husband. In a context where arranged marriages are prevalent and couples in most cases meet for the first time on their wedding day, focus groups indicat-ed that talking to a spouse before marriage is taken as an indicator of marriage through mutual agreement.
Arranged marriages involve matching which often involves religious and ethnic considerations. In this context, the regional clustering of populations based on dominant ethnic groups and religion has resulted in few marriages across ethnicity and religion. Focus groups indicated that any marriages that do cross either religious or ethnic boundaries of-ten occur with the couple's mutual consent. As Kabeer (2008) argues:
The structure of constraints that prevail in different contexts will deter-mine which kinds of choices are likely to have strategy consequences for women's lives. A woman who chooses to take up paid work or marry someone of her own choice is exercising a strategic form of agency in con-

26 CHAPTER 2
texts where women have been denied the ability to make such choices. They have less significance in contexts in which these choices are taken for granted.
However, because the changes those choices bring occur at an indi-vidual level rather than an institutional one (Hayward 1998 cited in Ka-beer 2008), not confirming to norms may offset the benefits of exercis-ing such choices. For example, if a woman's choice of groom does not fit in with that of her parents’, she loses the support of her family thus leaving her with a weaker fall-back position.
Some interesting developments have been observed over the years in rural Ethiopia. The presence of repeated economic shocks accompanied by income declines are reported in all the areas under study, though the shocks have been much more pronounced in some areas than others. There seem to be similarities across the areas on how households cope with income shocks. Often, for example, women’s and children’s labour burdens increase, as a result of which women are becoming the new breadwinners while they are also still expected to fulfill their traditional housekeeping roles. Thus, women’s time burden has increased.
In Haresaw and Imdibir, men’s migration to neighbouring towns and countries is one of the important coping mechanisms in times of shock. This has resulted in women taking over the role of household heads in the absence of men. Such a forced change in a woman’s role is more likely to increase her work burdens. It is further stressed that declining incomes has brought about changes to existing traditions. For example, in areas where polygamy is very common, few men now actually have more than one wife due to their inability to sustain more than one spouse. In all of the areas studied, both men’s and women’s groups claimed that the value of bride gifts and dowries has declined over the years due to economic problems.
Changes due to major policy shifts in the country have also been reg-istered. A very good example of a major change is the revised Family Law which came into effect in 2004. The law dictates that men and women are entitled to an equal share of household assets in the event of divorce or inheritance. Divorced husbands are expected to pay child support if there are young children involved. To my surprise, everyone, both men and women, in all the sites I visited know the details of this law, due largely to the strong campaign by the Women’s Affairs Office.

Determinants of Women’s Bargaining Power in Rural Ethiopia 27
Both men’s and women’s groups admitted that since the implementation of the law, men have become less resistant to women’s opinions for fear that divorce may take away half of their wealth.
The discussion in this section demonstrates how various factors play a role in affecting a woman’s bargaining power within a household in the context of rural Ethiopia. As discussed previously, these factors affect a woman’s bargaining power through the resources, the institutional and the agency dimensions. And some of these factors are very peculiar to the context under the study. For instance, the chapter shows the role of the existing marital institutions for a woman’s bargaining power within a household. These are very much context specific and are not widely dis-cussed in the existing literature. Also, the factors that capture a woman’s agency are again context specific. For instance, in circumstances where marriage between people from different ethnic group is quite the norm, measuring agency using this may not be relevant.
In the next section the indicators used in the following chapters are briefly discussed.
2.3 Indicators used in the Empirical Chapters
This section discusses the descriptive statistics of the bargaining power indicators used in the empirical analysis in the subsequent chapters. This descriptive statistics is based on data from the 1997 round of the Ethio-pian Rural household Survey. These indicators are specially used in the next two chapters and rely on seven indicators of bargaining power that capture the three dimensions discussed in the previous section. These are presented in Table 2.1. As can be seen, eighty five percent of women in the sub-sample do not have any schooling while only 10 percent have at least primary education and only 5 percent have either religious educa-tion or participated in adult literacy programs. Comparing these with husband's education level, men are on average, better educated than women. Sixty five percent of men do not have any schooling while the percentage of men who attended at least primary education is at par with women. However, more men have either religious or adult literacy train-ing.

28 CHAPTER 2
Table 2.1 Descriptive Statistics of Bargaining Power Indicators
Bargaining Power Indicators 1997
Resources
Wife has no Schooling 85.5
Wife has at least Primary education 9.8
Wife has Other education 4.7
Wife’s share of land brought to marriage 2.0
Wife’s Share of livestock brought to marriage 14.8
Wife has brothers 78.2
Wife has children 91.1
Wife has a son 69.3
Wife has a son (age>15) 30.8
Marital Institutions/Arrangements
Wife was kidnapped for the marriage 10.7
Wife talked to husband before marriage 38.9
Couple have written marital contract 44.4
Wife has richer parents 24.9
Wife lives in the same place she was born 38.4
Age gap between husband and wife in years 10.4
Agency
Couples are from different ethnic group 14.1
Couples have different religion 8.5
Source: Author’s Own Calculation using ERHS (1997)
Relating to economic resources, wives brought only two per cent and
15 per cent of the total land and livestock to marriage, respectively. Resources that affect the social dimension of a woman’s power in-
clude children, sons, grown up sons, brothers and parental wealth, and living in one’s place of birth. Ninety one percent and 69 per cent of women in the sample have children and sons, respectively. Seventy eight per cent of women reported that they have brothers and only 31 per cent reported that they have sons above the age of 15 years. Twenty five per

Determinants of Women’s Bargaining Power in Rural Ethiopia 29
cent of women in the sub-sample come from richer parents compared to the parents of the husband. 38 per cent of the wives live in the village of their birth.
I consider various ways of marital arrangements: marriage arranged by kidnapping, marriage arranged by love, and marriage that involves writ-ten marital contract and the age gap to capture child marriage. In this dataset, nearly 39 per cent of wives talked to their husbands before mar-riage while the rest did not. Talking to a spouse is taken an indicator of marriage arranged by couple’s consent and is taken as an indicator of better bargaining power. Marriage for 11 per cent of the women in the sub-sample was arranged by kidnapping. Forty four per cent of the mar-riage involves a written marital contract. Having a written marital con-tract increases a woman’s fall-back position hence increases her bargain-ing power during marriage. The average age gap in the sub-sample is 10 years which is the largest compared to the Sub-Saharan Africa average of 7.4 years (Casterline et al. 1986).
As noted above, focus groups argued that women who marry a hus-band from another ethnic group or religion defy societal norms revealing their exercising certain level of agency. Nearly 9 per cent of couples have different religion and 14 per cent are from different ethnic groups.
Chapter four rather relies on different indicators from the ones used in chapter three and chapter four. This is because this chapter relies on data collected in 2009 and its focus is to understand the effect of the bal-ance of power on child labour and schooling. The indicators used in the first two empirical chapters show a woman’s bargaining power but they do not explicitly show the extent of the power a woman has compared to her husband. Because of this, the extent of the decision-making power a woman has in the various domains within a household compared to her husband is used in this chapter.

30 CHAPTER 2
Notes
1 Household heads, who are often men, have control over assets in Ethiopia (Fafchamps and Quisumbing 2002). 2 Evidence courting and marriage market selection are documented, for example, for rural Ethiopia by (Fafchamps and Quisumbing 2003). 3 It is not entirely exogenous if current non-labour income is affected by past labour supply and consumption decisions (Thomas et al. 2002). 4 Giving a traditional blanket is only common in Tirufe-Kechema. 5 Exchange marriage opportunities are limited by the presence of age and sex appropriate siblings; a bride normally must have an available brother, preferably one older by not too many years.

31
3The Effect of a Woman’s Bargaining Power on her Participation in non- Farm Work in Rural Ethiopia
3.1 Introduction
Women’s labour market participation is linked to their empowerment. And this is assumed to result in better welfare for both women and chil-dren. Due to this, increasing women’s participation in market work is considered to be one of the pathways to empowering them and has been the focus of international targets such as the Millennium Development Goals.
The literature on women’s participation in the labour market comes in two strands. The first strand of literature uses the level of women’s participation in the labour market as an indicator of empowerment and examines its effect on women’s and children’s welfare (Canagarajah et.al. 2000). The other strand of literature examines how household-level bar-gaining determines women’s participation in the labour market. A closer look into the latter literature shows that to claim that empowerment originates from labour market participation requires that the circum-stances that lead women to participate in the labour market in the first place should be scrutinized. Evidence which shows the negative link be-tween the two illustrates this argument. For example, using Thai data, Schultz (1990) shows that women with more bargaining power prefer to increase their own consumption of leisure or time spent on non-market activities rather than in greater participation in market work. Similar re-sults are found by Grossbard-Shechtman and Shoshana (1988) using a sample of married Israeli women. They show that women with desirable characteristic that increases their marriage market opportunities 1 have low participation in the labour market. Similar evidence is obtained by Chiappori et al. (2002) using data from the United States. Their study

32 CHAPTER 3
shows that the adoption of a divorce law favourable to women and a sex ratio that shows the scarcity of females reduces the labor supply of mar-ried women to the labour market. A recent study by Orefic (2007) using US data also shows that the legalization of abortion, which increased women’s bargaining position, is found to have reduced their labour sup-ply. Again using US data, Grossbard-Shechtman (1993), Grossbard-Shechtman and Neideffer (1997), and Angrist (2002) found that an in-crease in the sex ratio reduces the labour force participation of married women and their hours worked.
The main theoretical argument behind this empirical literature is that the decline in the supply of labour for women with better bargaining power is due to compensating differentials. That is, women with better bar-gaining power command a larger transfer of the husband’s or joint household income (Grossbard-Shechtman and Shoshana 1988). This reduces their participation in the labour market and increases their con-sumption of leisure time.
Most of the studies outlined above are based on data from developed countries and there is scant literature that examines this using data from developing countries. This chapter adds to the existing literature by ex-amining the effect of women’s bargaining power on their participation in non-farm work in the context of rural Ethiopia. The chapter uses the various indicators of power identified from focus group discussions which were discussed in the previous chapter. Particularly, it will be in-teresting to understand which of these dimensions of a woman’s bargain-ing power are relevant in explaining her participation in non-farm work.
To put this bargaining power-labour supply link into perspective, the chapter also examines the effect of agricultural shocks on women’s par-ticipation in non-farm work and how a woman’s bargaining power af-fects the responses to these shocks. If a woman’s bargaining power leads to a lower participation in the labour market due to the income effect, then what happens to this link when incomes decline is of particular in-terest. There is a reason to believe that shocks are one of the most im-portant factors that modify the labour supply patterns of households in developing countries. This is evident from studies that show an increased labour supply to market work to cope with income declines due to shocks (Rosenzweig and Stark 1989, Kochar 1999, Fafchamps 1999). In principle, the labour supply of women should increase to cope with in-come declines. If women with better bargaining power due to compen-

A Woman’s Bargaining Power & her Participation in Non-Farm Work 33
sating income differentials supply less labour to market work under normal circumstances, whether this remains so during compelling cir-cumstances is of particular interest. It is only rarely considered in the lit-erature that women’s bargaining power may be of different importance in daily and recurrent situations relative to exceptional events. In tradi-tional societies daily life often follows fixed norms and rules which do not leave much space for negotiation. In contrast, specific events, such as crop failures may lead to situations where decisions outside the norm have to be taken. I study these for Ethiopia, where agricultural shocks are frequent in a context in which the majority of the population (85 per cent) is engaged in the agricultural sector. The chapter is based on data from the Ethiopian Rural household survey. It is a panel data of seven rounds, six of which are used for this study.
The study suggests that the amount of time a woman spends on non-farm labour is subject to household bargaining and a woman with more bargaining power is less likely to participate in non-farm work. The chap-ter also argues that agricultural shocks increase a woman’s participation in non-farm work. However, this is found not be true for a woman with better bargaining power in the economic and agency dimensions de-scribed in the previous chapter. More particularly, as the study demon-strates, bargaining power helps to reverse the effect that negative shocks have on a woman’s participation in non-farm labour, i.e. women with higher bargaining power tend to participate less in this type of work, even during economic hardships.
The rest of this chapter is organized as follows. The following section briefly discusses the theoretical background underlying this study. Sec-tion 3.3 briefly describes the relevant data used and provides the descrip-tive statistics. Section 3.4 proposes the empirical strategy. Section 3.5 reports the findings and the last section concludes.
3.2 Theoretical Considerations
Standard theories of labour supply assume that labour supply increases with the wage rate, which in turn depends on the person’s level of educa-tion, experience and other skills (Varian 1992). However, there might be a point where further increases in the wage rate lead to lower labour supply due to the associated income effect which overcompensates the substitution effect between leisure and labour. The higher the wage rate,

34 CHAPTER 3
the more expensive leisure becomes (the opportunity cost of time). But if leisure is a normal good, its consumption increases in income (Blundell and MacCurdy 1999).
Provided this income effect is relevant, one can also argue that not only earned but also unearned income affects an individual’s labour sup-ply. For example, an increase in the husband’s earnings may reduce a wife’s labour supply through the income effect. This could happen if the household behaved as one unit, which maximizes a household utility function conditional on pooled household income (Becker 1965). In this so-called unitary household model, the distribution of non-labour in-come across family members plays no role on the labour supply of each household member, only total non-labour income matters. Moreover, the compensated cross wage effects become symmetrical, i.e. the re-sponse of a woman’s labour supply to the change in wage rate of her spouse is the same as the response of a man’s labour supply to a change in the wage rate of his spouse.
In contrast, collective household models explicitly take into account that a household is composed of members with different preferences. Individuals choose their own consumption and labour supply given their own budget constraints after allocation of non-labour income among members according to a predetermined sharing rule.2 Assuming that members are selfish, changes in either the non-labour or labour income of another household member would, for a given household member, only have an income effect on this member’s labour supply if the sharing rule is such that this member directly benefits from the higher income. Obviously, the implication of the collective model is different from the unitary household model. Whereas the unitary household model assumes that total non-labour income leads to changes in the labour supply of all members through the income effect, the collective model implies that the change in the labour supply of one member remains constant as long as that member does not explicitly get a part of the additional income.
On the other hand, the Nash bargaining framework by McElroy and Horney (1981) argues that household members, say husband and wife, solve a joint allocation problem to maximize the gains from marriage and that not only factors such as labour and non-labour income affect household allocation decisions but also ‘Extra Environmental Parame-ters’ (EPPs), because these affect the individual threat points (utilities in

A Woman’s Bargaining Power & her Participation in Non-Farm Work 35
the unmarried state) and therefore determine the respective bargaining (or decision) power of both partners.
The marriage and remarriage market conditions, religion and produc-tivity outside marriage, labour market laws and institutions are consid-ered as some of the factors that may play a role in shifting individual threat points. If relative threat points determine individuals’ labour sup-ply, then women with relatively better traits compared to their husbands tend to supply less labour outside their homes3 (Grossbard-Shechtman and Shoshana 1988). This would happen if wives’ material needs were satisfied through a larger transfer of the husbands’ income or joint household income, and, hence, women could reduce their participation in the labour market. Becker (1973), for instance, argues that any trait of the wife or husband associated with a higher wife’s share of household income implies an increased demand for leisure and therefore a lower probability that she participates in the labour market.
This is also argued in the ‘conjugal contract model’ by Carter and Katz (1992) who emphasized that the wage rate per se is not the most important factor determining women’s labour supply outside the house-hold. Given that women produce mostly public goods when they work inside the household but earn cash income that can be spent on private goods when working outside the household, they may decide to work outside the household despite the low market wages they would then earn. This is because the relevant shadow value of the income earned is much higher than the value of the public goods. Thus, women tend to supply more labour outside their homes (and hence reduce their time in the production of public goods) to increase their consumption of private goods. If the conjugal contract ensures that women receive income transfers from their husbands, the time devoted to household public goods increases while participation in the labour market declines.
Attempting to integrate the arguments from these theories, it can generally be argued that why women’s labour market participation de-clines in the face of an increase in their bargaining power seems to fol-low an income effect argument. In a nutshell, the theoretical argument is that a woman commands more transfer of resources from her husband if the balance of power in the household tilts towards her.
Sociological literature argues that more than income effect is at issue here. An alternative explanation for the negative linkage is provided by, amongst others, Kabeer (2008). This literature argues that women often

36 CHAPTER 3
face patriarchal constraints that prevent them from allocating their la-bour to activities that they want to participate in. Such constraints are rooted in men’s fear of being subordinated or of losing their breadwin-ning role if their wives become economically too powerful. Moreover, norms are often such that they label the husbands of women that do par-ticipate in income earning activities as lazy, indolent, and entirely negli-gent of their family (Goldin 1994 cited in Kabeer, 2008).
Increased women’s bargaining power could ease or challenge such constraints. It affects a woman’s labour supply in various ways. On the one hand, a woman with a higher bargaining power has more control of her own income. This, in turn, gives her an incentive to participate in income generating activities. Moreover, it allows her to more easily break the traditions that prevent her from offering her labour outside the household. If, for instance, a woman’s preference is to supply more la-bour to income generating activities, a higher bargaining power should allow her to do so despite her husband’s resistance. Alternatively, women with better bargaining power could also more easily resist doing work that is perceived as disagreeable and hard.
The discussion about women’s avoidance of blue collar work ema-nates from the construction of how work is viewed in a given context or specific individual preferences towards work. To the extent that this work is considered to be fulfilling and desirable, a better bargaining posi-tion should allow women to participate more in this type of work. If however, the work is not at all desirable or it is difficult, better bargain-ing power should instead allow women to avoid it. Perhaps the relevance of relying on income transfers from husbands should be looked at from the perspective of how the type of work is perceived in a given context. .
If the link between bargaining power and labour supply is a matter of only income effect then circumstances that change the household’s in-come would have a very interesting implication. More generally, individ-uals within a household increase their off farm work to raise income to sustain income declines during shocks. Provided that this is true, if shocks do not affect income transferred to women, then bargaining power would continue to have negative effects even during times of shocks.

A Woman’s Bargaining Power & her Participation in Non-Farm Work 37
3.3 Data and Descriptive Statistics
The data drawn from the Ethiopian Rural Household Survey relies on a sub-sample of married women followed over the period 1994 to 2004. Hence, in total the dataset covers 2018 married women on average in each year over the six year panel period.
The survey provides information on the number of days individuals spent on off-farm wage work and off-farm self-employment. Self-employment is reported in categorized activities. These activities include collecting and selling firewood, making traditional hair styles, making and selling local drinks and so on. Wage work covers activities such as partic-ipation in a food-for-work programme, manual work, skilled work, farm work, and so on.
However, in most parts of the analysis, only the information on indi-viduals’ participation and not on the number of days of participation in these activities is used. This is because of differences in the questions regarding the time spans individuals participated in off-farm activities in the last round and the previous rounds. In all rounds apart from round six, the participants were asked about the number of days spent on both off-farm wage work and self-employment in the past four months prior to the survey. In the latter round, individuals were instead asked the number of months they had participated in the two types of labour over the last 12/13 months.
The survey also provides detailed information on different types of shocks that households faced in the previous agricultural season. In all rounds, information is available on farm specific shocks related to rain-fall based on a series of questions on whether there was enough rain at the beginning of the main rainy season; whether the rain in the main rainy season came on time and whether rain stopped on time, and whether there was rain near harvest time. Information is also available on crop related shocks such as damage through flooding, wind, plant dis-ease, insects and weeds. Information on other agricultural shocks (avail-ability of oxen and labour) and health shocks is also available. However, the information on these is only available for the first three rounds and the last round but not for the two rounds in between. As a result, only the rain and crop shocks are considered for this current study.
The bargaining power indicators to be used and their respective de-scriptive statistics have already been discussed in the previous chapter.

38 CHAPTER 3
As a result, I only discuss here the descriptive statistics of women’s par-ticipation rates in off-farm self-employment and wage work. This is shown in Figure A3.1 and Figure A3.2, respectively.
Although the focus of the chapter is more on women’s participation in these activities, men’s participation rates are discussed as well. As can be seen, the participation rates for both men and women are rather low in both activities. However, men’s participation rates are found to be greater than that of women in both cases, although smaller differences are observed in the case of the off-farm self-employed work. It is inter-esting that particularly married women’s participation in off-farm self-employment is higher than their participation in wage work. In the first round, 18 per cent of men and 17 per cent of women participated in off-farm self-employment. However, a huge difference by gender is preva-lent in the fourth round where only 0.6 per cent4 of women participated in this type of work while men’s participation was about 13 per cent. In the last two rounds, the gender difference in the participation rates in self-employment narrowed down again, to about 4 percentage points.
Regarding wage work, a substantial difference by gender throughout all survey rounds is found. Overall, only 3 per cent of women, on aver-age, participated in wage work. The lowest female participation rate in wage work occurred during the fourth round (about 2 per cent).
Table A3.1 and Table A3.2 show the participation rates of both men and women in different types of off-farm work and wage work. General-ly, it can be observed that certain activities are more predominantly done by men than women and vice versa. For instance, Table A3.1 shows that while men dominate off-farm activities such as weaving, trading grain and livestock and activities such as salt trade and traditional healing, women are mainly engaged in activities that involve handicraft and col-lecting and selling firewood.
Women’s participation is lower than that of men in most activities categorized under wage work (see Table A3.2). The largest participation gap, i.e. nearly 7 percentage points on average, is observed for unskilled work. With respect to farm wage work, women’s participation is lower by 4 percentage points on average relative to men. Participation rates for both men and women in professional work such as teaching; administra-tive work, etc. are the lowest, possibly due to the fact that the large pro-portion of our sample constitutes individuals with no schooling at all.

A Woman’s Bargaining Power & her Participation in Non-Farm Work 39
I also checked whether participation in both off-farm self-employment and wage work shows variation with respect to the house-hold poverty status as reported in Table A3.3. Men from poor house-holds show a higher participation in off-farm self-employment and wage work in the second, third and last round, while more men from non-poor households participated in the first, fourth and fifth rounds. In contrast, more women from poor households participated in off-farm self-employment in almost all rounds except in the fourth round.
Across all survey rounds, more men and women from poor house-holds participated in wage work except for the last two rounds for which a higher participation among individuals from non-poor households is observed. However, taking the total sample period as reference, one can state that the participation gaps between individuals from poor and non-poor households are quite marginal.
Table A3.4 presents the descriptive statistics of the key variables used in this chapter. The households in our sample have on average a house-hold size of 6.5 members and they own on average 1.35 hectares of land. Overall, nearly 43 per cent of households have an income per capita lower than the official poverty line.5 The highest poverty head count is registered in the third round (55 per cent) and the lowest in the fourth round (32 per cent).
The average age of married men and women in the sample is 47 and 37 years, respectively. A substantial share of individuals in the sample has not completed any form of schooling. This is particularly true for wom-en. Nearly 84 per cent of women and 63 per cent of men were never en-rolled in either formal or informal schooling. Few individuals have com-pleted the primary level (25 per cent of men and 11 per cent of women). About 5 per cent of women and nearly 12 per cent of men attended ei-ther religious education or were involved in adult literacy programmes.
Table A3.4 also provides information on self-reported rain and crop shocks. On average across all rounds 61 per cent of the interviewed households reported that there was enough rain at the beginning of the rainy season and the rain in the main rainy season came on time. Nearly 47 per cent of the households reported that the rain stopped on time. Variations in the percentage over time are quite substantial indicating that rain is very variable. Again, on average across all rounds 26 per cent of the households reported rain near harvest time. Rain in harvest time can heavily damage and reduce the harvest and often necessitates the

40 CHAPTER 3
immediate harvesting of crops. Nearly 20 per cent of the interviewees reported that their crops suffered from wind/storm and 18 per cent from flooding related shocks, again with substantial variations ranging from (nearly) 9 per cent to 33 per cent.
Given that the participation rate of women in wage work is very small, I only consider participation rates in off farm self-employed work for further analysis. The estimation techniques used are discussed in the following section.
3.4 Empirical Strategy
To test the hypotheses discussed in the previous section, I proceed in two steps. First, I examine how different dimensions of bargaining pow-er affect women’s non-farm labour supply. Second, I examine how women’s (and men’s) non-farm labour supply responds to agricultural shocks and subsequently investigate how the different dimensions of women’s bargaining power shape their labour supply response to agricul-tural shocks. In what follows, I discuss how these tests are done empiri-cally and then proceed with a discussion of the results.
I start by studying the effects of women’s bargaining power on wom-en’s participation in non-farm work. The following equation is estimated:
itPtTibpXT ititit 4'
3'
2'
1'
0, (3.1)
where Tit is a binary variable taking the value one if a woman i’s par-ticipates in off-farm self-employment in period t; Xit is a vector of indi-vidual, household and community characteristics such as age, age squared, education, land ownership, household size and distance to the nearest market; bpi represents a wide set of factors that affect a woman’s bargaining power; Tt are wave dummies; Pit are seasonal dummies; and it stands for individual period-specific random shocks. Given that my in-terest is particularly on the role of bargaining power, i.e. on the set of coefficients 2, it is not possible to introduce fixed effects in Equation (1), since bargaining power is time-invariant in the dataset. Hence, to es-timate Equation (1), I pool all rounds of the ERHS, introduce random effects and apply a between-estimator. Note that random effects make the strong assumption that time-invariant individual unobservable effects are uncorrelated with the included regressors. I estimate these equations
A Woman’s Bargaining Power & her Participation in Non-Farm Work 41
using a linear probability model. The robustness of the results is checked using a logistic estimation.
In a second step, I examine how women’s participation in off-farm self-employed work responds to agricultural shocks. The following speci-fication is used:
itPtbpSSXT iitiittitit ti 5'
4'
3'
2'
1'
0 )( (3.2)
where the vector Sit stands for a set of agricultural shocks (such as the coming of rain on time, whether there was enough rain at the beginning of the rainy season, whether rain stopped on time, whether there was rain near harvest time, wind, flooding, weed, plant disease and insect re-lated shocks). Sitbpi is the interaction effect of agricultural shocks and dif-ferent measures of bargaining power and ai is the individual fixed-effect. All other variables correspond to those in Equation (3.1). Equation (3.2) is estimated with a fixed-effects linear probability model. Alternatively, one could use a probit or logit model, but this would require making strong assumptions on the fixed-effects. Moreover, these models drop all observations that do not show any within-variation in the sample from the estimation, leading, in our case (since this occurs quite frequently), to a serious selection problem. Equation (2) is estimated separately for both men and women. The comparison between men and women’s labour supply behaviour can give interesting insights on how gender affects la-bour supply in response to agricultural shocks. It is, however, important to highlight that I only look at off-farm labour supply and ignore how agricultural labour supply responds to shocks.
Before proceeding to discuss the results, it is worth discussing the role of individual fixed effects. The estimation of participation in off-farm work could be subject to omitted variables bias. This could be due to unobserved permanent individual characteristics such as tastes for lei-sure or rates of time preference, and work choices (Lundberg 1988). Ad-ditionally, household level unobservables such as the quality of landhold-ing affect individuals’ labour supply to the market. This is because households with higher land quality tend to have higher returns from their land which reduces an individual’s labour supply to the market through the income effect. Another potential source of bias emanates from an individual’s perceptions of shocks which in turn may have an effect on how these shocks are managed.

42 CHAPTER 3
Individuals may ignore new information to persevere their beliefs and may willingly misread new evidence in the hope of supporting prior be-liefs. This may affect their ability to predict shocks or responses afte shocks are realized (Doss et al. 2006). Biases may occur due to culture-specific factors that provide social safety nets which determine how indi-viduals in specific communities manage risks and shocks (Doss et al. 2006). Hence, applying fixed-effects can control these potential biases on condition that they are time-invariant.
3.5 The Results
Table 3.1 shows the results from the random effects estimation on the association between a woman’s participation in self-employment off-farm work and her relative bargaining power. In principle, each indicator of bargaining power measures a different dimension of bargaining power and hence all indicators could be used simultaneously. However, given that at least some of the various bargaining power indicators that are used are correlated, two specifications are estimated. One in which all indicators are used together in one regression (see Table 3.1) and another in which each bargaining power indicators are used separately (see Table A3.5). However, for most of the indicators, there is no significant differ-ence between the signs of the various coefficients and the significance levels in the respective specifications.
As the result shows, not all dimensions of a woman’s bargaining power are important for her participation in off-farm self-employment. Only bargaining power originating from specific marital arrangements is found to be significant. I find that self-arranged marriage measured by talking to a spouse before marriage and the presence of a written marital contract are statistically significant. I also find (in the estimation in which each factor is tested in isolation (see Table A3.5), that the wife’s share in the total land brought to marriage is an important determinant of a woman’s participation in off-farm self-employment.
More precisely, the probability of participation in this type of work increases by 3 percentage points for a woman who was able to talk to her husband before marriage compared to a woman who did not. This is plausible given that a woman who is familiar with her husband before marriage tends to have a better say in household negotiations and there-fore she may find it easier than other women avoid this type of work.

A Woman’s Bargaining Power & her Participation in Non-Farm Work 43
Again, marriages in the Ethiopian context are predominantly arranged by parents or relatives and couples often meet for the first time during their wedding. As indicated in the previous chapter, only 45 per cent of cou-ples in the sample considered spoke to each other before their marriage.
Moreover, the probability of participation in off-farm self-employment increases by 2 percentage points if the woman has a written marital contract compared to a woman who either has no written con-tract, or who has ‘only’ a verbal or religious marital contract. Because women with a written marital contract have the assurance that they get half of the household assets on divorce, they have a higher ‘threat point’ and therefore more bargaining power within their household. Although most of the indicators considered are found insignificant, the ones found significant show that increased bargaining power is associated with a lower probability of participation in off-farm self-employed work. The results support two of the complementing explanations provided in sec-tion 3.2. This negative relationship could be due to the fact that a woman with better bargaining power has more income transferred to her which allows her to spend more time on non-market activities instead of work-ing.
The result also supports the explanation provided in the sociological literature (Kabeer 2008). As can be recalled, this literature argues how the nature of work itself could shape a woman’s preference to participate in the said work. This is especially true when considering off-farm activi-ties in this context. These include collecting firewood, selling local drinks, and traditional hair dressing which, in our focus group discus-sions, came out as activities done by poor women or activities done when there are compelling circumstances. These are generally not desir-able by the society at large. Thus, it can be argued that women do not always choose to participate in income earning activities without any re-gard for other equally important social standards. Thus, having more bargaining power helps them to participate less in work considered un-desirable.

44 CHAPTER 3
Table 3.1 The Effect of a Woman’s Bargaining Power on her Participation
in Off-farm Self Employment (OLS)
Random Effects
At least primary education 0.004
(0.016)
Other education 0.016
(0.024)
Wife’s share in the total land brought to marriage -0.011
(0.026)
Wife’s share out of the total livestock brought to marriage -0.019
(0.013)
Wife talked to spouse before marriage -0.033***
(0.011)
Wife kidnapped for marriage 0.004
(0.015)
Couples have written marital contract -0.020*
(0.011)
Wife has brothers 0.012
(0.011)
Wife comes from a different ethnic group 0.001
(0.015)
Wife’s religion different from husband’s 0.016
(0.029)
Wife’s parents richer than husband’s 0.008
(0.012)
Constant 0.257***
(0.047)
Observations 4363
Cluster adjusted robust standard errors in parentheses *** p<0.01, ** p<0.05, * p<0.1; socioeconomic variables, shocks, round and season dummies are controlled but not reported.
Source: Own calculation from ERHS (1994-2004)
As mentioned previously, the chapter also examines how a woman’s bargaining power shapes her labour supply responses when agricultural shocks occur. To address this, first an estimation of the effect of the ag-ricultural shocks on a woman’s participation in self-employed work is undertaken. This is done to identify the shocks relevant for a woman’s participation in work activities. This is reported in Table A3.6. As can be

A Woman’s Bargaining Power & her Participation in Non-Farm Work 45
seen, only rain that suddenly comes near harvest time, crop failures due to wind, flooding and weeds increase a woman’s probability of partici-pating in off-farm work,6 while other shocks are found to be insignifi-cant. Taking this information into account, a principal component analy-sis is used to construct a shock index using only those significant shock variables which are found to have a positive and significant effect. The shock index is then interacted with the bargaining power variables con-sidered. The result using fixed-effects estimation is reported in Table 3.2.
It shows that the probability of a woman’s participation in off-farm self-employed work increases when shocks occur. With an increase in the shock index by one unit, the probability of participating increases by 2 percentage points. More generally, it can be argued that a woman’s participation in off-farm work is used as one of the coping strategies when certain agricultural shocks occur. This finding can be further linked to the issue of women’s time burdens in the face of economic hardships since women are predominantly responsible for most reproductive work and the extra time spent on off-farm work plausibly comes with a reduction in their leisure time. This, in conjunction with the evidence that suggests deterioration in women’s nutritional status as a result of shocks (Dercon and Krishnan 2002), points to the multifaceted effects shocks could have on women’s physical as well as mental health in rural Ethiopia. It should also be emphasized that shocks that affect women’s labour market participation conceivably increase the demand for children’s labour in domestic work as children are the only alternative source of labour (Grootaert and Kanbur 1995).
However, as the results show, the above is not true in the case of a woman who has a better bargaining power. This is particularly true of a woman with better bargaining power through the economic and the agency dimensions. Among indicators that show women’s power in the-se dimensions, only the share of livestock brought to marriage and hav-ing a husband with a different ethnicity matter. The result shows that with a one per cent increase in a woman’s share of livestock brought to marriage, the probability of her participation in off-farm self-employed work declines by 3 percentage points. As already discussed in chapter two, a woman who marries a man of a different ethnicity is believed to exercise more agency - in this case the probability that she participates in off-farm self-employed work declines by 2 percentage points compared to a woman whose husband shares her ethnicity.

46 CHAPTER 3
Table 3.2 The Effect of a woman’s Bargaining Power on her Participation
in Off-farm Self Employment during Shocks (OLS)
Fixed Effects
Shocks index 0.02**
(0.01)
Shocks Index interacted with
Wife’s share in the total land brought to marriage 0.03
(0.02)
Wife’s share out of the total livestock brought to marriage -0.03***
(0.01)
Wife talked to spouse before marriage -0.01
(0.01)
Wife kidnapped for marriage 0.00
(0.01)
Couples have written marital contract -0.00
(0.01)
Wife has brothers 0.00
(0.01)
Wife comes from a different ethnic group -0.02*
(0.01)
Wife’s religion different from husband’s 0.01
(0.02)
Wife’s parents richer than husband’s 0.00
(0.01)
Constant 0.17***
(0.01)
Observations 5,035
R-squared 0.067
Cluster adjusted robust standard errors in parentheses *** p<0.01, ** p<0.05, * p<0.1; socioeconomic variables, shocks, round and season dummies are controlled but not reported.
Source: Own calculation from ERHS (1994-2004)
3.5 Conclusions
This chapter investigates the effect of a woman’s bargaining power on her participation in off-farm self-employed work. It also examines how a woman’s bargaining power shapes her labour supply responses to agri-cultural shocks. The chapter uses a unique panel data drawn from the

A Woman’s Bargaining Power & her Participation in Non-Farm Work 47
Ethiopian Rural Household Survey. It also attempts to link this data to the information obtained from focus group discussions regarding factors that villagers perceive to be important for women’s bargaining power.
Given the wide interest that surrounds the effect of women’s bargain-ing power on different welfare outcomes, this chapter provides a number of interesting insights. I find evidence that women’s participation in off-farm self-employed work is the result of a bargaining process within the household. More specifically, the findings suggest that an increase in a woman’s bargaining power reduces her participation in the off-farm self-employed work. Among the dimensions of power considered, only those indicators that show power in the marital arrangement dimensions are found relevant. The result found is consistent with findings of studies based on data for developed countries. It is also consistent with the soci-ological literature that studies the importance of the type of income gen-erating activities which a woman undertakes. This literature suggests that not all income generating activities are necessarily desirable and that women use their bargaining position to adjust their labour supply to dif-ferent types of work. This is quite consistent with what was revealed in the focus group discussions where women frequently stated that most self-employment activities such as collection of firewood, preparation of local drinks, engaging in traditional hair making, and pottery making are generally considered to be undesirable and that women engage in these activities only as a way to cope with economic problems.
This chapter provides evidence that a woman’s probability of partici-pating in off-farm self-employed work increases when agricultural shocks occur. But this is not true for a woman who has better bargaining power. The chapter shows that women with better bargaining power in the eco-nomic and agency dimensions participate less in this type of work even when shocks occur. In particular, an increase in the share of livestock brought to marriage and being in an inter-ethnic marriage insulates women from participating in this type of work. This again underlines the argument made above that women perceive off-farm self-employment as undesirable.

48 CHAPTER 3
Notes
1 These traits include having a relatively better off father, having stayed in Isreal for a long time, being European American and being younger compared to their husbands. 2 Chiappori (1995) argues that the sharing rule may depend on culture, tradition and marriage market conditions. The rule is such that decisions lead always to a Pareto optimal outcome. 3 This is known as the argument of compensating differentials (Grossbard-Shechtman and Shoshana 1988). 4 This could possibly be due to a decline in the poverty incidence from 55 per cent in the third round to 32 per cent in the fourth round (see Table A3.3). Der-con et al. (2008) also argued that this might have been caused by the fact that the data for this round was collected during the harvest season when agricultural in-comes are particularly high. 5 The official poverty line is 2200 kcal/day/adult (MoFED 2002). 6 Among the shocks considered, men’s participation in off-farm self-employment is only affected by the presence of flooding in the previous agricultural season. 6 Chiappori (1995) argues that the sharing rule may depend on culture, tradition and marriage market conditions. The rule is such that decisions lead always to a Pareto optimal outcome. 6 This is known as the argument of compensating differentials (Grossbard-Shechtman and Shoshana 1988). 6 Human resources include skills and education levels while economic resources constitute ownership of assets, land or cash. Social resources such as various rela-tionships, networks and support systems also enhance women’s bargaining pow-er. 6 This could possibly be due to a decline in the poverty incidence from 55 per cent in the third round to 32 per cent in the fourth round (see Table A3.3). Der-con et al. (2008) also argued that this might have been caused by the fact that the data for this round was collected during the harvest season when agricultural in-comes are particularly high. 6 The official poverty line is 2200 kcal/day/adult (MoFED 2002). 6 Among the shocks considered, men’s participation in off-farm self-employment is only affected by the presence of flooding in the previous agricultural season.

49
4The Effect of a Woman’s Bargaining Power on her Health Status in Rural Ethiopia
4.1 Introduction
There have been major developments in understanding the causes be-hind women’s health deprivation. Earlier literature emphasized the im-portance of biological-related causes such as disorders in the reproduc-tive system (DFID 1999). However, a newer literature argues that gender differences (WHO 2002) in power relations is one of the most important determinants of women’s health.
Ample evidence shows this link in settings affected by poverty and these studies use various indicators of power to show this link (Kirigia et al. 2005, Jeejobhoy 1995, Maitra 2003, Becker et al. 2005). For instance, a woman’s education has been shown to affect her ownership of health insurance (Kirigia et al. 2005), her nutrient intake (Adair 1991), relative reproductive health (Jeejobhoy 1995, Maitra 2003), as well as her ability to negotiate the timing and conditions of sex with partners (Wolff 2000). Her control over economic resources such as access to credit or her share of household assets affects various aspects of reproductive health (Beegle et al. 2000, Amin and Lloyd 2002) Schuler et al. 1997, Nanda 1999). Similarly, a woman’s say on major purchases has been linked to her ability to prepare for maternal emergency (Becker et al. 2005); to a better body mass index and energy intake, and to a lower risk of anemia (Adair 1990, Hindin 2000, and Mabsout 2010).
However, the literature shows some gaps. There is generally more fo-cus given to a single measure of power, while it is evident that a number of factors potentially affect women’s decision-making power (see chapter 2). More focus, for instance, appears to be given to indicators that meas-ure women’s economic empowerment. However, the use and ownership

50 CHAPTER 4
of economic resources are conditional on specific gender norms (Masbout 2010). If different factors affect a woman’s decision-making power through distinct dimensions, not controlling alternative measures introduces biases when examining health as well as other outcomes. Be-sides the mere focus on a single measure of power, there seems to be more emphasis given to women’s reproductive health, although health has multiple dimensions.
This chapter examines the effect of a woman’s bargaining power on her health status by addressing some of the aforementioned gaps in two ways. Four health status measures: self- reported illness, functional abil-ity, body mass index, and chronic energy deficiency are used. Various factors that affect women’s bargaining power through several dimen-sions are used. These dimensions include resources, marital arrange-ments and women’s agency, which were identified from focus group dis-cussion in rural Ethiopia. Moreover, the chapter examines how these factors affect various health inputs and also the intra-household health inequality in the given context.
I study these issues for married women using five rounds of the Ethi-opian Rural Household survey dataset. The main departure from existing empirical literature is the use of multidimensional bargaining power as well as health indicators.
The chapter argues that the bargaining power indicators that are con-sidered important vary depending on the health status measure used. In particular, dimensions of power through marital institutions and agency play a significant role in women’s health in the context of rural Ethiopia. The result also shows the importance of looking into the joint effects of bargaining power variables. For instance, economic resources have posi-tive effects for women who have better bargaining power in other di-mensions. It is also found that only few bargaining variables affect intra-household health inequality. Economic resources such as livestock brought to marriage and social resources such as grown up sons and children affect intra-household health inequality in favor of a woman.
The rest of the chapter is organized as follows. The next section dis-cusses the theoretical framework. Section 4.3 presents the data and de-scriptive statistics. Section 4.4 and 4.5 present the empirical strategy and the results, respectively. The last section concludes.

A Woman’s Bargaining Power & her Health Status in Rural Ethiopia 51
4.2 Theoretical Framework
The theoretical framework for this chapter is presented in Figure 4.1. It shows the various pathways from a woman’s bargaining power to her health status. These pathways include factors that influence her exposure and her responses to ill health. Exposure to illness could be caused by limited access to food, for example. As studies show, this is more preva-lent for women compared to men and this exposes them to illness much more than men (Chen et al.1981, Basu et al. 1986, Engle and Nieves 1993, Messer 1997). Such food distribution patterns in most settings are linked to norms that encourage women to eat last and less nutritious food (Khan et al. 1983). The role of a woman’s bargaining power on in-creasing her access to food is documented (Thomas 1990, Quisumbing and Maluccio 1999, Dercon and Krishna 2000, Quisumbing and Briere 2000, Thomas et al. 2002).
Figure 4.1Flow Chart on the Relationship between Bargaining Power and Health Status
Access to food
Gender roles
Stress
Perception ’
Health expenditture
Health status
Bargaining
Power

52 CHAPTER 4
A woman could also be exposed to illness due to the associated gen-der divisions of roles and responsibilities. For example, a woman who spends long hours in unventilated kitchens and collect fuel wood and water from far places is more prone to respiratory and back pain prob-lems (Levine et al. 2000). Similarly, a woman who is deprived of leisure time is exposed to a number of physical as well as psychological illnesses (Levine et al. 2001). As some studies found, a heavy workload results in a higher chance of experiencing weight loss, and reduced happiness (Jimenez and Newton 1979, Tafari et al. 1980, Rajagopalan et al. 1981, Gjerdingen et al 2000). Recent evidence, for example, associates better bargaining power1 with more leisure time (Gupta and Stratton 2008, Friedberg and Webb 2005).
The neuroendocrine pathway is another mechanism where signals that originate in the brain due to stress cause vulnerability to illness (Brunner and Marmot 2006). According to a recent WHO report, wom-en are disproportionately affected by mental disorders. And this is due to violence, socioeconomic disadvantage, low income and income inequali-ty, subordinate social status and continuous responsibility for the care2 of others (WHO 2008). Also, a woman’s exposure to illness could be caused by her perception that she has lower claims on household re-sources and that domestic violence by her husband is justified and she internalized her social status as a person of lesser value (Kabeer 1999). Studies show that a woman’s bargaining power affect her happiness posi-tively (IDA 2008) and her exposure to domestic violence negatively (Ce-ballo et al 2004, Aizer 2010).
How one responds to illness is also matter for one’s health status. More specifically, the pattern of resource distribution especially for utili-zation of health care facilities depends on existing norms that attach dif-ferent values to the health of women and men. For example, there are norms that promote female seclusion and they often increase a woman’s likelihood of experiencing debilitating health because treatment is de-layed or does not happen at all (Basu 1993, Nikie`ma et al. 2008). How-ever, studies indicate that a woman with better bargaining power has bet-ter utilization of health care facilities (Furtua and Salway 2006, Rahman 2009).
The effect of some of the factors that affect the various dimensions of women’s power on her health status is explored in the remaining sec-tions. Also, an attempt is made to investigate the effect of these same

A Woman’s Bargaining Power & her Health Status in Rural Ethiopia 53
factors on some of the pathways such as happiness, women’s goods and leisure.
4.3 The Data and Descriptive Statistics
Data comes from two sources: the Ethiopian Rural Household Survey (ERHS) and information from focus group discussions in rural Ethiopia. The ERHS provides information on different health domains. This in-formation is available at an individual level. It includes the incidence of illnesses and number of illness days. This information is collected for the four weeks time period prior to the survey and it is available in all the survey years except the 1999 survey round. In that year, the illness in-formation was collected for a specific agricultural season.
The data also consists of information on whether the illness or inju-ries prevented the individual from carrying out his/her main activities; and what the symptoms were of most recent illnesses. Information on four functional abilities (activities related to daily life) is available. These include whether a person can stand up after sitting down; whether a per-son can walk 10 kilometers; whether a person can carry 20 liters of water; whether a person can hoe and is able to sweep a floor. Information on the weight and height of the individuals is available in all rounds except in the 1999 round.
I focus on a sub-sample of nearly 4500 married women in monoga-mous households, followed over five rounds of the ERHS (1994a, 1994b, 1995, 1997 and 2004). The data from the 1999 round is excluded due to inconsistency in the time span used for the self-reported health status and absence of information on the weight and height of the indi-viduals surveyed.
The indicators of bargaining power are reported and their descriptive statistics is discussed in chapter 2. Four health status measures are used: self-reported health status, body mass index (BMI), Chronic Energy De-ficiency (CED) and functional ability (activity of daily living, ADL).
Self-reported health status measures rely on individuals’ perception of their health. It is a tool that provides ‘a simple, direct, and global way of capturing perceptions of health using criteria that are as broad and inclu-sive as the responding individual chooses to make them’ (Idler and Ben-yamin 1997). The correlation between self-reported health status and mortality is documented (Ibid, 1997).

54 CHAPTER 4
Despite this, this measure is prone to measurement error.3 This could stem from perceptions that are conditional on an individual’s experienc-es, socioeconomic behaviour and outcomes (Baker et al. 2005). This is, for instance, illustrated by the high self-assessed morbidity rates found in higher income countries and among the affluent in developing countries (Schultz and Tansel 1998, Foster 1993).
Weight-to-height-squared or body mass index is another measure of health status considered in this study. It is often correlated with better levels of health and productivity4 (Thomas and Strauss 1997). Using this measure is advantageous because it conveys valid information about ear-ly nutritional or health conditions that affect more general living stand-ards. This is because adult height does not change substantially between the ages of about 25 to 55, (Fogel 1993, Floud et al. 1990). As a result, weight-to height squared and BMI are measures that bridge health status at different moments in the life cycle (Costa 2002). Beyond inadequate food intake, it also captures the feedback relations between illness and malnutrition (Pacey and Payne 1985). Measurement of height and weight are less prone to errors compared to measures like self-reported health status. Any errors that occur are often random because they are less like-ly to be correlated to unobservables and measures of well-being such as wealth (Sahn and Younger 2009). I use the WHO classification of adult underweight. This is true of body mass index below 18.5 kilogram per square meter. Those who are below this cut off point are considered to experience chronic energy deficiency.
Another health status measure used is activities of daily living (ADL).5 This refers to a basic set of everyday activities or tasks that an individual should be able to perform in order to live independently (Katz et al. 1963). Respondents were asked whether they were able to perform spe-cific tasks easily, with difficulty, or not at all. ADL is considered to be a more objective measure of morbidity compared to self-reported health status since it is often validated by the interviewers’ observations and is, as a result, less prone to measurement error (Strauss et al. 1993).
Because the activities considered are not standardized across age and gender, using them to understand health inequality is problematic (Sahn and Younger 2009). For example, measures may reflect gender divisions of labour rather than true inequalities. To my knowledge, there is a lack of empirical work that investigates the link between a woman’s health status via this measure and her decision-making power.

A Woman’s Bargaining Power & her Health Status in Rural Ethiopia 55
Table 4.1 Descriptive Statistics of the Health Status Measures
1994a 1994b 1995 1997 2004 Pooled
Suffered from illness 18.5 10.1 11.2 11.6 18.6 13.7
Illness days 2.7 1.4 1.9 1.6 2.6 2
Stand 98.1 98.3 98.6 98.7 98.6 98.4
sweep 98.3 98.8 98.7 98.7 98 98.5
walk 95 97.1 97.1 96 95.4 96.2
carry 91.5 93.7 92.6 91.1 90.2 91.9
hoe 80.1 86.7 87.7 85.2 86.3 85
Body mass index 20.1 20.4 20.2 20.2 20.1 20.2
Chronic Energy deficiency (BMI<18.5) 25.4 18.8 21.8 20.5 28.3 22.57
Source: Author’s Own Calculation using ERHS (1994-2004)
Nearly 14 per cent of women reported that they suffered from illness
within the time span considered. Incidence of illness was at its peak in the first and the last round of questioning, while no significant variations were observed in the remaining rounds. Women reported two days of illness over the entire sample period. Fever is the most common symp-tom (23 per cent) followed by severe headache (17 per cent), cough and breathing difficulties (10per cent). Mental disorder, ear ache, weight loss, appetite loss, uterus problems, and heart disease are the least reported symptoms.
Health status measured using the various functional abilities show lit-tle variation across rounds (see Table 4.1). Nearly 99 per cent of women reported that they can stand after sitting down and are also able to sweep the floor. For walking for 20 kilometres, the number marginally declined to 96 per cent but is still a high figure. 92 per cent reported that they can carry 20 litres of water and 85 per cent reported they can hoe easily and with little difficultly.
The average body mass index of married women is 20 kg per square metter and does not show any significant variation across the rounds. However, using an 18.5 cut off point, 28 per cent of women had a body mass index below this level in the last round compared to only 19 per

56 CHAPTER 4
cent in the second round: on average nearly 23 per cent of women regis-tered a body mass index below 18.5 for the entire sample.
The descriptive statistics for various key variables is reported in Table A4.1. I checked whether reported illness differs across some of these variables such as age groups and socioeconomic status (see Table A4.2). Generally, a higher incidence of illness is reported for older age groups. However, the increase in incidence of illness and illness days is not line-ar. More specifically, the least incidence of illness and illness days are re-ported by women below the age of 18 - nearly 8 per cent reported inci-dence of illness compared to the 17 per cent in the age group between 49 and 65. For illness days, women in the age group between 49 and 65 years experienced three days of illness for the entire sample period while women in the age group below 18 years encountered less than one illness day.
Functional ability and body mass index decline with age. The percent-age of women whose body mass index is below 18.5 differs between age groups. The lowest percentage, i.e. 12.6 per cent, is observed for those below 18 years of age and the highest per cent, i.e., 37 per cent, for those women in the age group between 49 and 65 years of age. 25 per cent of women above the age of 65 have a body mass index below 18.5 and 20 per cent of those between the ages of 18 and 49 have a body mass index below 18.5.
The poor report much higher incidence of illness and illness days while no remarkable differences are observed for the functional ability measures. The body mass index of the poor is marginally lower than that of the non-poor. The differences in the means between these groups are statistically significant. Using the 18.5 cut off point, 27 per cent of wom-en from poor households have a body mass index below 18.5 while only 20 per cent of women from non-poor households fall below this meas-ure.
On the other hand, incidences of illness and illness days increase with land size. While only 8 per cent of women who reside in landless house-holds reported illness, 17 per cent of women that reside in a household with more than five hectares of land reported that they were ill. Only one illness day is reported by women in landless households, while three ill-ness days are reported by those with a larger land holding. This shows that more illness is reported by those with a better socioeconomic status when this is measured by land ownership.

A Woman’s Bargaining Power & her Health Status in Rural Ethiopia 57
For functional abilities, no significant differences in the ability to stand, sweep the floor and walk was observed. While women in house-holds with between one and five hectares of land show a slightly lower ability to carry, women in households holding less than one hectare of land show less ability to hoe.
The mean body mass index is much lower for women in landless households compared to the rest. However, using the 18.5 cut off point, it is not the women in landless households but those in households with less than one hectare of land that show the highest percentage in body mass index below 18.5. Women in households with a large land holding show the least percentage in body mass index below 18.5.
Using education as a status measure, illness incidence is similar be-tween those women who never had any schooling and those with at least primary education. Even though those who have a different educational status show a lower incidence of illness, the differences in means be-tween these groups is not statistically significant. Similarly, the ability to perform different activities improves with better educational status. In contrast, the mean body mass index does not show significant variation with educational status.
Those women in the lowest quintile of consumption expenditure re-ported more illness than those in the higher quintile. No significant dif-ferences were observed in their functional abilities. However, households in the lower quintile had a high percentage of women (27 per cent) with a BMI below 18.5. A large proportion of women in poor households reported more incidences of illness and illness days and had a higher per-centage of women (23 per cent) below 18.5.
Cross correlations of the different measures show that self-reported health statuses are significantly and negatively correlated with functional abilities and body mass index and positively correlated with chronic en-ergy deficiency.
Table A4.3 shows the distribution of health status stratified by bar-gaining-power measures for the whole sample. The same is done for the sub-sample of poor women.6
Women who have no education and richer parents reported more in-cidences of illness and illness days on average. These patterns are not observed when only poor women are considered. Women in inter-ethnic marriages and those who have grown up sons reported more incidences

58 CHAPTER 4
of illness. On the other hand, women who brought livestock to their marriage, have a written marital contract and reside in their birth place reported fewer incidences of illness and illness days on average. Similar patterns are observed for the sub-sample of poor women.
Lower functional ability for those with no schooling, those who brought livestock to marriage and those who are in inter-ethnic marriag-es are found. Poor women who have grown up sons have a lower aver-age functional ability while better functionality ability is found for those who have brothers, children, sons and grown up sons; those kidnapped for the marriage, and live in their birth place.
Lower average body mass index and higher incidences of chronic en-ergy deficiency are observed for women who have no education, are in inter-religious marriages, and who were kidnapped for marriage. All the indicators show similar patterns for the sample of poor women except the statistically insignificant difference between kidnapped and non-kidnapped women. In contrast, higher body mass index and lower inci-dences of chronic energy deficiency are observed for women who brought land to marriage, have brothers, have written marital contracts and talked to their spouse before marriage.
For poor women, higher body mass index and lower chronic energy deficiency is registered for those who brought land to marriage, have a written marital contract, talked to their spouse before marriage and have brothers.
I also checked whether the distribution of health status varies by dec-iles of real per capita expenditure for selected health status measures and bargaining-power indicators. Generally, lower health status is prevalent for women in the lower expenditure deciles. Self-reported illness is high-er among the non-educated in the lower expenditure deciles, while high reported illness is observed in the higher expenditure deciles for women with some level of schooling. The body mass index of women in almost all expenditure deciles shows that educated women persistently have higher body mass index compared to uneducated ones.
I do not, however, observe clear patterns in the distribution of self-reported illness by land brought to marriage. For instance, women in the lower expenditure deciles (between the 2nd and the 3rd deciles) who brought land to their marriage reported more incidences of illnesses. However, women between the 3rd and the 6th deciles who did not bring

A Woman’s Bargaining Power & her Health Status in Rural Ethiopia 59
land to marriage, reported more incidences of illness. The pattern alter-nates for subsequent expenditure deciles. Women who brought land to marriage in all expenditure deciles, except between the 5th and 7th, had a higher body mass index compared to women with no assets. Similar pat-terns are observed in the case of women who have brothers and have written marital contracts, whereas fewer incidences of illnesses and high-er body mass index are reported compared to women who do not have brothers. However, women who have brothers and who reside in house-holds in the 9th expenditure decile and above reported more illness.
The prevalence of intra-household inequality in body mass index is al-so explored. I only use body mass index because of gender related biases associated with self-reported illness and functional ability (Strauss et al. 1993, and Sahn and Younger 2009). It is also problematic to directly compare men’s and women’s body mass indices. Because of this reason, I standardized the body mass index of each sex by the community mean for the respective sex. Following this standardization, I computed the difference in men’s standardized body mass index compared to women’s to see the relative health standing of women compared to men at the household level. Table A4.4 shows the presence of intra-household ine-quality in body mass index in favour of men. As can be seen, the magni-tude is very small. Village-wise comparisons show similar pictures. Com-parison is also done based on the 18.5 cut-off points below which chronic energy deficiency occurs. Based on this comparison, 15 per cent of wives are found to be malnourished compared to their husbands.
The aforementioned relationships are explained in a descriptive set up without controlling for other important factors. In the following sec-tions, I examine the effect of the bargaining power indicators while con-trolling for these factors.
4.4 Empirical Strategy
This section outlines the strategy adopted to answer the research ques-tions. I first examine the linear effects of a woman’s bargaining power on her health status. The model is specified as follows:
it'itiitititit +R'T+'bp+'V+I'+X'+=H 6543210
(4.1)

60 CHAPTER 4
Hit is the health status of a woman i at time t which is measured ei-ther by self-reported illness, illness days, functionality index7, body mass index or body mass index below the 18.5 cut off point which captures the presence of chronic energy deficiency (CED).
I control for household level variables, Xit, which include household size as well as wealth measured by the amount of land owned in hectares. Since land is owned by the government and buying and selling is prohib-ited by law, hence is exogenous to changes in one’s health status. It is hence used to avoid the potential endogeneity bias that might have oc-curred had measures like consumption expenditure been used. I control for indices of rain and crop shocks constructed from different agricul-tural shocks that households reported as being important elements be-hind the variability in their incomes. I also include individual level varia-bles Iit such as age, and age squared and whether a woman is pregnant or breastfeeding. I include a vector of community variables Vit that capture the infrastructure of the village: access to electricity and piped water; dis-tance to the nearest government hospital and distance to the nearest market. These variables also capture the proximity to urban areas and are controlled. Region, Ri and round fixed effects, T, are also controlled.
The bargaining power indicators that capture economic, human and social resources, marital institutions and proxies for agency are repre-sented by bp. As discussed in the previous section, these variables are constructed using the information from the 1997 round. Because of this, and because most of these variables originate from events that occurred ex ante marriages, most of the indicators are time invariant. Since this poses problem of using fixed effects estimation, identification is done using the random effects estimation.
In accordance with the theoretical framework set out in section 4.2, to explore the possible channels from bargaining power to health, I esti-mate reduced form equations of log of expenditure on women’s clothes for which information in five rounds is available; hours spent on leisure activities for which information is available in the 1997 round; whether a woman generally feels happy or not for which information is available in the 2004 round. Factors that influence expenditure on a woman’s cloth-ing reveal important information regarding household spending that matter for a woman’s health due to its private good nature. Random ef-fects, OLS and probit estimation techniques are used for expenditure on women’s clothing, leisure and happiness, respectively. I control for

A Woman’s Bargaining Power & her Health Status in Rural Ethiopia 61
household and individual variables, and region and round fixed effects where relevant. In the case of the estimation on happiness, I also control for the presence of recent unfortunate events or bad luck in the week prior to the survey. Given the nature of the bargaining power variables and also because, in the case of leisure and happiness, only cross section information is available, it is not possible to control for time invariant unobserved heterogeneity.
The estimations above involve examining the effect of bargaining power on health status or transmission channels by comparing women in different households.
To examine how these same bargaining power indicators affect the intra-household inequality in health status between a man and a woman, the following specification is estimated.
it'itiitititit e+R'T+'bp+'V+I'+X'+=HI 6543210
(4.2)
HIit captures two inequality measures. The first one is the difference in standardized body mass index of each sex by the community mean in which a positive difference shows an inequality in favour of a woman while the negative shows inequality in favour of a man. The second ine-quality measure is a dummy based on a comparison of incidence of chronic energy deficiency - 1 captures whether a wife is malnourished compared to her husband while 0 captures whether a woman has either equal or better status relative to her husband.
Certain econometric issues of concern are discussed as follows. First, the endogeneity between health and education is often a concern. How-ever, given that, in the setting under this study, the custom is that wom-en stop going to school after they are married, it is less likely that current education status is endogenous to current health status. Also, it is doubt-ful that there exists endogeneity between past health and past education status in a context where 85 per cent of the women never went to school because of lack of a school infrastructure and norms on female educa-tion.
The second concern is the endogeneity of some of the bargaining in-dicators and health status. For example, being a kidnapped wife could be correlated with a woman’s past health status. Referring to the reasons I mentioned in chapter 2, kidnapping could occur with or without com-

62 CHAPTER 4
plete information on a woman’s health. The past health status of a wom-an is not available in the ERHS data but it is plausible to argue that un-less it is a more visible illness or disability such as leprosy, it is unlikely that the husband took health into consideration when kidnapping his wife.
It is also a concern that, due to a lack of information in the ERHS da-ta set, I cannot control for congenital factors or factors related to per-sonal behaviour such as smoking, eating, attitudes and values that affect health. This only poses a problem if these factors are correlated with any of the bargaining power indicators. This could result in underestimates of the magnitude of the variables of interest.
4.5 Findings of the Study
4.5.1 Bargaining Power and Health Status
Table 4.2 reports the estimation results on self-reported illness. Most of the bargaining power indicators do not have any effect on this measure of health except the negative effect of informal education and the posi-tive effects of a share of livestock brought to the marriage and parental wealth. While there is no significant effect as a result of formal educa-tion, informal education appears to affect the number of self-reported illness days negatively. The insignificant effect of formal education is not surprising given that such a large proportion of women do not have any formal schooling.
Among the variables that affect women’s power in the social dimen-sion, only parental wealth appears to matter for this dimension of health. I find that a woman who has richer parents compared to her husband’s is more likely to be ill (two percentage points) and experience more ill-ness days (0.56 illness days). The effects of a share of livestock and pa-rental wealth on self-reported illness are not as expected. It is plausible that women may have picked up a ‘wealth or status effect’ consistent with the literature that shows the influences of conditioning factors on reporting behaviour. To check this, I re-estimated the regression for a sub-sample of women who reported illness and whose body mass index is below 18.5 kilogram per square meter. The result shows that the effect of informal education is robust while the effect of share of livestock and parental wealth has disappeared.

A Woman’s Bargaining Power & her Health Status in Rural Ethiopia 63
Table 4.2The Effect of Bargaining Power on Self- Reported Health Status (OLS)
Incidence of illness Illness days
Pooled Random Pooled Random
Wife has at least primary education 0.015 0.014 -0.043 -0.042
(0.015) (0.015) (0.391) (0.395)
Wife has either religious or adult literacy education -0.031 -0.033 -0.94** -0.98***
(0.021) (0.021) (0.323) (0.330)
Wife share of land brought to marriage 0.061 0.062 0.820 0.847
(0.053) (0.055) (0.989) (0.995)
Wife’s share of livestock brought to marriage 0.060** 0.061** 0.832 0.815
(0.020) (0.019) (0.297) (0.292)
Wife has brother/s -0.003 -0.004 -0.169 -0.189
(0.011) (0.010) (0.247) (0.247)
Woman has children 0.019 0.021 0.487 0.526
(0.030) (0.029) (0.740) (0.739)
Woman has son 0.001 -0.002 -0.210 -0.256
(0.022) (0.022) (0.353) (0.349)
Woman has a child above 15 years old -0.002 -0.002 -0.067 -0.096
(0.019) (0.019) (0.359) (0.355)
Couple have different ethnicity 0.006 0.006 0.497 0.529
(0.030) (0.032) (0.630) (0.640)
Couple have different religion -0.008 -0.011 -0.161 -0.239
(0.041) (0.040) (0.775) (0.752)
Couple have different ethnicity and religion -0.005 -0.004 -0.694 -0.667
(0.058) (0.060) (1.215) (1.238)
Wife was kidnapped for marriage 0.013 0.011 0.242 0.218
(0.018) (0.019) (0.316) (0.325)
Wife talked to spouse before marriage -0.007 -0.007 -0.275 -0.285
(0.020) (0.019) (0.297) (0.292)
Couple have written marital contract -0.015 -0.015 -0.078 -0.095
(0.023) (0.024) (0.423) (0.437)
Wife’s parents richer than husbands 0.024* 0.024** 0.561** 0.559**
(0.012) (0.012) (0.222) (0.227)
wife lives in her birth place -0.013 -0.014 -0.355 -0.388
(0.011) (0.012) (0.254) (0.261)
Age gap -0.001 -0.001 -0.011 -0.012
(0.001) (0.001) (0.017) (0.017)
Constant 0.051 0.051 -0.444 -0.596
(0.047) (0.051) (0.816) (0.858)
Observations 3,698 3,698 3,698 3,698
R-squared 0.043 0.033

64 CHAPTER 4
Cluster adjusted Robust standard errors in parentheses *** p<0.01, ** p<0.05, * p<0.1; Household, individual, community characteristics are controlled but not reported
Source: Own calculation from ERHS (1994-2004)
What can be argued from the result of this estimation is that self-
reported illness is only affected by the resource dimension while other dimensions do not have any effect at all. This is not unexpected given that illness is measured within a short time span which may not reflect sustained deprivation in the health status of an individual. While infor-mal education significantly and negatively affects reported illness, eco-nomic resources, captured by livestock brought to marriage and social resources as indicated by having richer parents, only affect reporting be-haviour.
Table 4.3 reports estimation results for functional health, body mass index and chronic energy deficiency. It is found that none of the factors that affect women’s power through the resource dimension have any bearing on functional health. However, a woman’s agency measured by inter-ethnic and inter-religious marriage has significant effects on func-tional ability but with contrasting results. While an inter-religious mar-riage results in better functional ability, an inter-ethnic marriage leads to worse functional ability. It is quite interesting that these two indicators that show women’s strategic choices show opposite results. This indi-cates that dimensions that are associated with more female power are not always associated with better welfare outcomes.
As expected, marriage arrangements through a written marital con-tract that improve women’s fall back positions affect a woman’s func-tional ability positively. It increases the index by 0.18 units. In contrast, an increase in the age difference between spouses is found to be detri-mental for the woman’s functional health but the levels of significance and magnitude are not that strong.
Unlike self-assessed health status, only bargaining power associated with marriage arrangement and agency has implications on a woman’s health measured by her functional ability.

A Woman’s Bargaining Power & her Health Status in Rural Ethiopia 65
Table 4.3 The Effects of a Woman’s Bargaining Power on her Functional health,
Body Mass index and Chronic Energy Deficiency (OLS)
Functionality Index Body mass index Chronic Energy
Deficiency
Pooled Random Pooled Random Pooled Random Wife has at least primary education 0.058 0.086 0.203 0.182 -0.021 -0.024 (0.101) (0.108) (0.161) (0.167) (0.023) (0.021) Wife has either religious or adult literacy education 0.047 0.068 0.203 0.190 -0.020 -0.023 (0.149) (0.161) (0.213) (0.225) (0.024) (0.029) Wife share of land brought to marriage -0.063 -0.092 0.484 0.497 -0.029 -0.024 (0.278) (0.287) (0.653) (0.629) (0.104) (0.106) Wife’s share of livestock brought to marriage -0.081 -0.117 0.123 0.247 0.027 0.020 (0.119) (0.121) (0.315) (0.321) (0.052) (0.058) Wife has brother/s 0.105 0.093 0.102 0.144 - 0.04** -0.04*** (0.091) (0.097) (0.097) (0.109) (0.014) (0.014) Woman has children 0.144 0.057 -0.408 -0.325 -0.007 -0.007 (0.129) (0.129) (0.286) (0.255) (0.039) (0.028) Woman has son 0.015 -0.065 0.024 0.025 -0.022 -0.019 (0.112) (0.125) (0.224) (0.185) (0.030) (0.025) Woman has a child above 15 years old -0.043 0.008 -0.000 0.074 0.013 0.003 (0.065) (0.042) (0.113) (0.084) (0.022) (0.020) Couple have different ethnicity -0.256** -0.279** 0.333 0.351 -0.052 -0.058 (0.108) (0.119) (0.338) (0.366) (0.039) (0.041) Couple have different religion 0.225*** 0.223*** 0.193 0.031 -0.12** -0.11** (0.065) (0.061) (0.509) (0.409) (0.049) (0.043) Couple have different ethnicity and religion 0.082 0.117 -0.301 -0.300 0.128** 0.141*** (0.171) (0.179) (0.780) (0.713) (0.050) (0.040) Wife was kidnapped for marriage 0.084 0.087 -0.414* -0.383* 0.022 0.024 (0.049) (0.056) (0.212) (0.201) (0.034) (0.034) Wife talked to spouse before marriage 0.002 -0.001 0.418** 0.477*** -0.064** -0.065** (0.081) (0.077) (0.161) (0.165) (0.027) (0.029) Couple have written marital contract 0.139* 0.177** -0.007 0.083 0.025 0.016 (0.078) (0.080) (0.196) (0.170) (0.029) (0.031) Wife’s parents richer than husbands -0.054 -0.069 -0.003 -0.011 -0.006 -0.010 (0.059) (0.061) (0.139) (0.133) (0.017) (0.017) wife lives in her birth place -0.030 -0.018 -0.125 -0.119 0.026* 0.027* (0.048) (0.052) (0.142) (0.158) (0.014) (0.016) Age gap -0.006 -0.009* 0.012 0.013 -0.001 -0.001 (0.005) (0.005) (0.010) (0.009) (0.002) (0.002) Constant -0.892** -0.959** 19.829*** 20.083*** 0.258 0.281* (0.382) (0.423) (0.904) (0.999) (0.150) (0.154) Observations 3,598 3,598 3,448 3,448 3,690 3,690 R-squared 0.137 0.111 0.100
Cluster adjusted Robust standard errors in parentheses *** p<0.01, ** p<0.05, * p<0.1; Household, individual, community characteristics are controlled but not reported.
Source: Own calculation from ERHS (1994-2004)
66 CHAPTER 4
Economic resources and the level of education do not have any effect on a woman’s body mass index. This is consistent with the findings of Fafchamps et al. (2009). Other studies, however, show the positive effect of an increase in these assets on food budget shares, expenditures on child schooling, and child health (Quisumbing and Maluccio 1999, Der-con and Krishna 2000, Quisumbing and Briere 2000, Thomas et al. 2002). Also, none of the factors that affect women’s power through the social dimension affect body mass index, which is contrary to a result elsewhere (Li and Wu 2011).
Marital arrangements, however, do affect a woman’s body mass in-dex. Specifically, marriage arranged by kidnapping has a negative effect on a woman’s body mass index while marriage arranged by mutual con-sent is positively associated with better body mass index. The result shows that a kidnapped woman has a lower body mass index (0.38 units) compared to a woman in alternative marriage types, whereas a woman in a marriage of her choice has higher body mass index (0.47 units higher BMI).
Again, as can be seen, marital arrangements predominantly affect women’s body mass index while the other indicators are not significant at all. Similar to health measured by functional ability and body mass in-dex, economic resources and education do not have any significant effect on a woman’s likelihood of experiencing chronic energy deficiency. But social resources such as having brothers and living in one’s birth place are found to be important while they are insignificant in the case of other health measures. Bargaining power associated with brothers negatively affects a woman’s probability of having chronic energy deficiency - a re-sult consistent with what focus groups in rural Ethiopia stated. Living in one’s birth place only explains the probability of having chronic energy deficiency but is found to be irrelevant for other measures. A woman who lives in her birth place shows a higher probability (three percentage points) of having chronic energy deficiency compared to one who lives far away.
Similar to the case of body mass index, marriage arranged by mutual consent measured by talking to a spouse before marriage reduces a woman’s probability of experiencing chronic energy deficiency by seven percentage points. Bargaining associated with agency measured by an inter-ethnic and inter-religious marriage has significant effects on the probability of having chronic energy deficiency but again with con-

A Woman’s Bargaining Power & her Health Status in Rural Ethiopia 67
trasting results. An inter-religious marriage reduces, while an inter-ethnic marriage increases the probability of being malnourished.
What can be argued from this is that there are very few common bar-gaining power indicators that affect the four health status measures con-sidered. This could be because different factors affect distinct dimen-sions of a woman's power hence have an effect only on specific dimensions of her health status. Unlike resources which received un-precedented focus, marital institutions and women's agency affect the more objective health status measures, whereas bargaining measures that also potentially pick up wealth effects are important in the case of self-reported health status.
Regional Differences
The bargaining power indicators are interacted with a region dummy to capture heterogeneity in the social, institutional and agency variables de-pending on where a woman lives. The dummy assigns 1 for Tigray and Amhara which are found in the north and 0 for Oromia and SNNP found in the South8. The results are reported in table A4.4 and A4.6. As can be seen, there is a clear difference in the role location plays on the effect of certain bargaining power variables.
As can be recalled, children did not matter in the linear estimation for all the health status measures. However, it is found to have a significant effect on self-reported illness when it is interacted with the location dummy. The result shows that a woman who has children and who re-sides in the north is more likely to report incidence of illnesses and suffer more illness days than a woman who has children and who lives in the south.
The linear effect of marriage arranged by kidnapping was not signifi-cant for functional health. However, its interaction with the region dummy shows that a kidnapped woman who resides in the north has a lower functional ability compared to a woman in the south. Since mar-riage arranged by kidnapping is more common in the south than in the north, it makes sense that it has a negative effect in a place where it is not a common practice.
Sons and grown up sons are important in positively affecting a wom-an’s body mass index only if she resides in the north. This could stem from the higher value given to women who produce sons in the north.

68 CHAPTER 4
Also, the benefit of agency related to marriage on a woman’s health status depends on the context. While inter-ethnic marriages improve health status, inter-religious marriages are costly if a woman lives in the north. Inter-ethnic marriages in the north increase a woman's body mass index (one unit) whereas inter-religious marriages have a negative effect compared to a woman in a similar marriage in the south (a decline of 0.6 units). When one moves from the north to the south, there is more het-erogeneity in religion as well as ethnicity. The north is predominantly orthodox Christian hence an inter-religious marriage could be more cost-ly.
I also checked whether the effect of the economic resources consid-ered would vary depending on a woman’s bargaining power in other di-mensions. In the linear estimation, land and livestock brought to mar-riage are found insignificant. Besides lack of variation in the variables, lack of control over these resources could be one reason for this (Kabeer 1999, Agarwal 1997). I tested this by interacting land and livestock brought to marriage with the other bargaining power variables. The re-sults are reported in A4.7 for the more objective health status measures. As this study shows, economic resources matter more to a woman’s health when she has better bargaining power in other dimensions. For example, an increase in the share of livestock brought to the marriage increases the functional ability for a woman who talked to her husband before marriage, for a woman who lives in her birth place, and who has richer parents. It is also observed that economic resources reinforce the impact of high bargaining power in other dimensions. For instance, an increase in the share of land brought to the marriage increases functional ability for a woman in an inter-religious marriage. The linear effect of an inter-religious marriage is positive, while the linear effect of land brought to marriage on functional health is insignificant. This implies that under-standing the joint effects of different dimensions gives rather interesting insights.

A Woman’s Bargaining Power & her Health Status in Rural Ethiopia 69
Table 4.4The Effect of a Woman’s Bargaining Power on Intra household Inequality
in Health Status (OLS)
Woman is malnourished rela-tive to her husband
Pooled Random
Wife has at least primary education -0.025 -0.027 (0.022) (0.020)
Wife has either religious or adult literacy education 0.010 0.008 (0.024) (0.026)
Wife share of land brought to marriage -0.034 -0.030 (0.077) (0.079)
Wife’s share of livestock brought to marriage -0.003 -0.008 (0.027) (0.030)
Wife has brothers -0.022 -0.023 (0.017) (0.018)
Woman has children -0.053* -0.055** (0.030) (0.022)
Woman has son -0.005 -0.004 (0.031) (0.029)
Woman has a child above 15 years old -0.032 -0.037** (0.020) (0.018)
Couple have different ethnicity -0.062** -0.066** (0.028) (0.030)
Couple have different religion -0.049* -0.046 (0.025) (0.028)
Couple have different ethnicity and religion 0.070 0.068 (0.040) (0.042)
Wife was kidnapped for marriage 0.022 0.024 (0.023) (0.024)
Wife talked to spouse before marriage -0.031 -0.031 (0.020) (0.020)
Couple have written marital contract 0.043 0.041 (0.036) (0.037)
Wife’s parents richer than husbands -0.003 -0.003 (0.014) (0.014)
Wife lives in her birth place 0.013 0.015 (0.013) (0.013)
Age gap(age of wife/age of husband) -0.001 -0.001 (0.001) (0.001)
Constant 0.073 0.065 (0.102) (0.103)
Observations 3,683 3,683R-squared 0.037
Cluster adjusted robust standard errors in parentheses *** p<0.01, ** p<0.05, * p<0.1; Household, individual, community characteristics are controlled but not reported, Source: Own calculation from ERHS (1994-2004)

70 CHAPTER 4
Table 4.4 reports the effect of bargaining power on the intra-
household inequality in health status. As mentioned before, the inequali-ty considered is only between husband and wife. This inequality is meas-ured by a dummy that assigns one if a woman is either in a better or equal nutritional status compared to her husband and 0 if she is in a worse nutritional status. As can been, a woman’s bargaining power in the social dimensions explains her health status compared to that of her husband. Also bargaining power due to specific marital arrangements is found to matter. Specifically, a woman who has children, grown up sons, or is in an inter-ethnic marriage has a lower probability of suffering from chronic energy deficiency compared to her husband.
4.5.2 Bargaining power and Health Inputs
As discussed in section 4.2, there are several pathways from bargaining power to health. In this section I analyze the effect of the bargaining power indicators considered on some of these intermediate outcomes or inputs that contribute to better health. These include expenditure on a woman's clothing, a woman’s time spent on leisure activities, and her happiness. This is reported in Table 4.5.
As can be seen, increase in the share of land brought to marriage, having at least primary education is associated with an increased expendi-ture on women’s goods. In contrast, presence of children reduces the expenditure on women’s goods. None of these indicators are found sig-nificant on any of the health status measures used. Besides measurement errors associated with the dependent variables, this could mean that the effect of the significant bargaining power variables on a woman’s health status could be via other pathways that are not considered here. Relating to the effect on the time spent on leisure, most of the indicators are found insignificant with the exception of parental wealth. It is found that women who have richer parents compared to the parents of the husband enjoy more leisure time.
With the exception of a few, most of the bargaining power indicators are found insignificant for a woman’s probability of happiness. Social resources such as brothers are negatively associated with a woman’s probability of happiness. The probability declines for a woman in an in-

A Woman’s Bargaining Power & her Health Status in Rural Ethiopia 71
ter-ethnic marriage. The lower probability could be explained by the fact a woman who defies existing marital norms often ends up losing her parents’ or kins’ support. This could cause stress hence less happiness. On the other hand, a woman who talked to her husband before marriage is more likely to be happy compared to a woman who never talked to her husbands before marriage.
Table 4.5 The Effect of Bargaining Power Indicators on Health Inputs
Expenditure on Women’s
clothes(OLS)
Leisure Happiness
Random effects OLS Probit (dy/dx) Coef. Std.Err Coef. Std.Err Coef. Std.Err
Wife has at least primary education
0.20 (0.08)*** 0.07 (0.10) 0.02 (0.06)
Wife has either religious or adult literacy education
-0.15 (0.10) 0.04 (0.19) 0.03 (0.09)
Wife share of land brought to marriage
0.31 (0.16)* 0.11 (0.36) 0.04 (0.08)
Wife’s share of livestock brought to marriage
-0.04 (0.09) 0.06 (0.15) -0.09 (0.06)
Wife has brother/s -0.02 (0.06) -0.09 (0.09) -0.21 (0.08)** Woman has children -0.19 (0.09)** 0.23 (0.18) 0.07 (0.08) Couple have different ethnic-ity
-0.07 (0.08) 0.00 (0.10) -0.23 (0.12)*
Couple have different reli-gion
-0.12 (0.14) -0.12 (0.13) 0.16 (0.18)
Couple have different ethnic-ity and religion
0.14 (0.19) 0.02 (0.27) 0.05 (0.06)
Wife was kidnapped for marriage
-0.08 (0.07) -0.12 (0.08) -0.02 (0.04)
Wife talked to spouse before marriage
0.01 (0.05) -0.02 (0.06) 0.11 (0.06)**
Couple have written marital contract
0.06 (0.06) 0.07 (0.10) -0.01 (0.04)
Wife’s parents richer than husbands
-0.05 (0.05) 0.15 (0.08)* 0.06 (0.04)
wife lives in her birth place -0.03 (0.05) 0.02 (0.06) 0.00 (0.00) Age gap -0.00 (0.00) 0.00 (0.00) 0.20 (0.05)*** Constant 4.13 (0.22)*** 0.26 (0.33) Observations 2,017 754 487
Cluster adjusted Robust standard errors in parentheses *** p<0.01, ** p<0.05, * p<0.1; Household, individual, community characteristics are controlled but not reported.
Source: Own calculation from ERHS (1994-2004)

72 CHAPTER 4
As can be seen, only some indicators explain the three inputs consid-ered. Only a few of these are also found significant for the health status measures discussed previously. For example, talking to a spouse before marriage is positively associated with a woman’s body mass index, while being in an inter-ethnic marriage is negatively associated with her func-tional health. The result shows that one of the pathways from these indi-cators to women’s health could be through women’s happiness. For in-stance, parental wealth was found to have a positive and significant effect on self-reported illness. Its positive effect on leisure could illumi-nate the biased effect that wealth could have on self-reported health sta-tus.
4.6 Conclusions
Using five rounds of the Ethiopian Rural Household Survey (ERHS) data, the study examines the effect of a woman’s bargaining power on her health status. The bargaining power indicators are identified from focus group discussions conducted in rural Ethiopia and are then used to identify possible proxies from the ERHS. The departure from previous work is the use of various dimensions of women’s power: namely re-sources, marital institutions and agency; and multidimensional health measures: self-reported illness, functional ability, body mass index and chronic energy deficiency.
The results show that there are few common bargaining power indi-cators across the various health status measures used. For instance, live-stock brought to marriage and a wife’s parental wealth are associated with more self-reported illness but are not important for more objective measures. An inter-ethnic marriage negatively affects functional ability whereas an inter-religious marriage is associated with better functional ability and less chronic energy deficiency. Kidnapping is found to be det-rimental for a woman’s body mass index whereas talking to a spouse is associated with a better body mass index and a lower incidence of chron-ic energy deficiency. This implies that efforts geared towards improving women’s health by empowering them should take into account the effect particular dimensions of power have on particular dimensions of health.
The result also shows that marriage institutions and agency variables affect women’s health in rural Ethiopia more than the conventional vari-

A Woman’s Bargaining Power & her Health Status in Rural Ethiopia 73
ables associated with economic empowerment. This means that changes in these institutions, rather than a mere focus on economic empower-ment, results in better well-being. In line with this, very specific institu-tional changes that need to be addressed involve strengthening efforts to abolish marriage by kidnapping and child marriage and to foster formali-zation of marriages through written contracts.
The finding that significant interaction-effects of various indicators are found important albeit their insignificant linear effects, implies that different dimensions jointly rather than individually affect women’s health. This is indeed a departure from previous studies that only fo-cused on the individual effects of these indicators. Moreover, contextual-izing the importance of economic resources for women’s well-being is important. This is because, as the results indicate, in some cases lower bargaining power in a specific context counters the expected outcomes from higher bargaining power through the economic dimension. In oth-er cases, however, higher bargaining power through economic resources reinforces the effect of better bargaining power in specific dimensions. The implication is that policies that attempt to empower women only in the economic dimension without considering existing heterogeneities among women in other, equally important, dimensions may not be effec-tive.
The intra-household health inequality between men and women is found to be marginal. This is not surprising in a resource-constrained setting like rural Ethiopia. Few bargaining variables (only those related to specific economic resources like livestock brought to marriage, and so-cial resources, such as grown up sons and children) reduce intra-household inequality in favour of women.
Notes
1 Bargaining power is measured by wages. 2 Women’s poor health also reflects their neglect of personal interest combined with a great concern for family welfare (Sen 1990). 3 A lack of knowledge to understand complicated illnesses, particularly in as-sessing their seriousness and reaching correct diagnosis; limited knowledge of other places and experiences leading to understanding that a specific disease is endemic to a region and part of the human condition and therefore not necessari-ly avoidable (Sen 2001, Baker et al. 2005). Measurement error also occurs when

74 CHAPTER 4
respondents do not feel comfortable reporting their conditions. For example, individuals report less mental illness or sexually transmitted diseases. The biases could also stem from short memories due to a gap between the period of illness and the survey dates. 4 This is, however, subject to diminishing returns. For example, arbitrary cut off points reveal that a person with less than 21 or more than 28 metric units is con-sidered as undernourished and obese, respectively and is vulnerable to increased risks of mortality and morbidity in both cases (Fogel 1993) 5 Functionality measures are more commonly used in studies that examine the health status of individuals in old age. The most commonly used measure is the Katz Activities of Daily Living Scale which includes bathing, dressing, using a toilet, continence and eating (Katz et al. 1963). 6 The latter is done to see whether the health status of poor women stratified by the bargaining power measures show any meaningful, statistically significant dif-ferences. 7 The functionality index is constructed by using a set of variables that indicate a person’s functional ability such as ‘whether a person can stand after sitting down’, ‘whether a person can walk 10 km’, whether the person can carry 20 litres of wa-ter, whether a person can hoe and sweep floor. 8 This is based on anthropological studies which report that women's bargaining power declines when one moves from the north to the south of the country (Bevan and Pankhurst 1996).

75
5The Effect of a Woman’s Bargaining Power on Child Labour and Schooling in Rural Ethiopia
5.1 Introduction
Women’s empowerment is widely viewed as one of the most important policy instruments to improve children’s welfare. This is because wom-en’s bargaining power has been shown to have a positive correlation with a household’s resource allocation pattern in favour of children.1 This has reinforced the assumption that women always internalize their children’s interests better than men (Basu 2006).
However, this is not always true since this link may not hold beyond a certain power threshold (Basu 2006). In a household where there is an unbalanced power, children’s outcomes could be affected adversely re-gardless of who the powerful person is. This is not without empirical support. For example, Gitter and Barham (2008), using data from Nica-ragua, show that children’s school enrolment declines in a household where women are more powerful than their husbands. Also, Lancaster et al. (2006), using data from India, found that the only time household re-sources are allocated in favour of children is when power is spread even-ly between the spouses rather than where one partner enjoys a dominant position. Similarly, Basu and Ray (2002), using Nepalese data, show the minimum incidence of child labour when there is balanced power while the incidence increases in households where one of the parents is more powerful.
These studies show how the interests of mothers are not always in congruence with what is best for their children. This should be under-stood in view of parental preferences and how this is revealed in house-hold choices depending on who has better bargaining power. If women find, for instance, sending their children to work more painful than men,

76 CHAPTER 5
an increase in their bargaining power reduces the incidence of child la-bour. If, however, women have positive attitudes towards sending chil-dren to work, then an increase in their bargaining power could have an opposite effect (Basu 2006). To my knowledge, no evidence specifically based on data from sub-Saharan Africa is available to show whether this perspective holds true. As such, this chapter examines how the intra-household balance of power affects child labour and schooling in rural Ethiopia. The setting is a good place to study this linkage as it is charac-terized by the presence of norms that influence the balance of power within a household. As such, studying the influence of this on the alloca-tion of children’s time is of particular interest given the high incidence of child labour and low schooling in the country. According to the Interna-tional Labour Organization, 36 per cent of all children in Ethiopia be-tween the ages of 5 and 15 are engaged in economic work while only 15 per cent attend school (ILO 2006).2 The situation is particularly worri-some for those children in rural Ethiopia. While more than one third of these children are engaged in economic work, only 9 in hundred children attend school.
Data from the seventh wave of the Ethiopian rural household survey conducted in 2009 is used to examine the effect of a woman’s relative power position on hours children spent on domestic and economic work, the probability of children going to school and their education at-tainment adjusted for their age. The chapter also examine to what extent a woman’s power over investment decisions on human capital affects these outcomes.
The results show that an increase in a woman’s power relative to her husband’s increases hours children spend on domestic work. This is true for both girls and boys although girls are slightly more affected than boys. Increase in the number of domains in which women alone decide is positively associated with the probability that only boys attend school. Girls are less likely to go to school when women have more power on deciding over human capital investment. But no effect is found for boys. On the other hand, when fathers are more powerful in deciding over this investment, both boys and girls are less likely to go to school. No evi-dence is found that balance of power on various domains and specifically over human capital investment have any significant effect on both chil-dren’s age -adjusted educational attainment.
A Woman’s Bargaining Power & Child Labour and Schooling 77
The rest of this chapter is organized as follows. The next section pre-sents a review of the relevant literature. Section 5.3 presents the theoreti-cal discussion. Section 5.4 discusses the data and provides descriptive statistics. Section 5.5 discusses the empirical strategy. Section 5.6 reports the results, followed by a conclusion in section 5.7.
5.2 Review of the Relevant Literature
There is substantial literature on the determinants of child labour and schooling in developing countries. However, the review of literature in this chapter is more focused on studies that look at the link between women’s bargaining power and children’s labour and schooling.
The literature reviewed below uses mother’s education, employment, or decision-making power on household purchases as alternative indica-tors of women’s power in various contexts. I start with studies that ex-amine the importance of the mother’s education as it is the most widely used indicator in the literature. It is to be noted that studies that examine the effect of a mother’s education on her children’s welfare do not often explicitly discuss the bargaining effect prominently, although it is subtly implied in some of them. While it is generally expected that an educated mother would have an affinity for children’s schooling and an aversion towards child labour, the evidence suggests that its effect depends on the specific context. These studies usually compare which parents’ educa-tional status matters in how children’s time is allocated. For example, in some contexts a father’s education is negatively related with children’s work while a mother’s education is found to be insignificant (Canagara-jah and Coulombe 1997, Wolderhanna et al. 2005). There are also cases where a mother’s education is positively associated with her daughter’s schooling (Glick and Sahn 1999, Nath and Hadi 2000, Ainsworth et al. 2000) and negatively associated with her manual labour (Mukerjee and Das 2008).
There are also studies that look at the implications of women’s em-ployment in paid work on the allocation of their children’s time. These studies use two common variables: labour market participation and wage rate and often discuss the income as well as substitution effects of wom-en’s employment. While women’s employment could increase child schooling and reduce child labour through the income effect, it could also increase the demand for child labour through the substitution effect.

78 CHAPTER 5
Ample evidence shows an increase in children’s domestic work in re-sponse to women’s labour market participation (Blunch and Verner 2000 and Canagarajah and Coulombe 1998 for Ghana, Cartwright 1999 for Columbia, Grootaert 1997 for Cote d'Ivoire, Sakellariou and Lall 1997 for Philippines, Levis 1991 for Brazil, Patrinos and Psacharopoulos 1995 for Paraguay and Woldehanna 2005 for Ethiopia). In contrast, other studies show a reduction in child labour as a result of female labour mar-ket participation (Cartwright and Patrinos 1999 for Bolivia, Rosenzweig and Everson, 1997 for India) and also improvements in children’s schooling (Ersado 2002). Similarly, an increase in the mothers’ wage is important in reducing the incidence of child labour (Lavy 1985 for Egypt, and Kambhampati and Ranjan 2005 for India).
Studies in both strands of literature, those that focus on education and those that focus on women’s employment, analyze only linear effects and provide little information on what happens when women have pow-er beyond a specific threshold. A few other studies have provided evi-dence on this. Using the ratio of years of schooling completed by the female and male heads of household as a measure of the balance of power, Gitter and Barham (2008), using Nicaraguan data, found that ad-ditional female power reduces children’s school enrolment, especially that of girls, when female power is significantly greater than male power in the household. Basu and Ray (2002), using Nepalese data, show that child labour is minimized when power is balanced and the incidence of child labour increases in households where one of the parents is more powerful. Similarly, Sakamoto (2006), using data from India, shows that children are more likely to work in households where the father is more powerful. In contrast, Reggio (2010), using Mexican data, shows the neg-ative link between women’s decision making power and child labour, especially for girls.
To my knowledge, therefore, only few studies examine how child la-bour and schooling correlates with the balance of power within a house-hold, more particularly giving emphasis to what happens when women are relatively more powerful than their husbands.

A Woman’s Bargaining Power & Child Labour and Schooling 79
5.3 Theoretical Discussion
A common assumption in theoretical models of child labour is that one parent makes decisions regarding allocation of household resources. And the concerned parent’s preferences play an important role in the decision to send children to work and/or to school. However, which parent’s preference is revealed in allocation choices depends on the balance of power within a household.
The theoretical model that motivates this study relies on Basu’s theo-ry that links child labour with the balance of power within a household (Basu, 2006). By using a collective household framework, Basu shows that a household maximizes a weighted utility of individual sub-utility functions less the costs of child labour. He also includes income from child labour as part of the household’s budget constraint. He assumes that, given that children do not participate in the day-to-day decision making within a household, the power structure influences their welfare through the power position of the parent who is considered to look out for their best interests.
Based on these assumptions3, the model makes the following predic-tions. If both parents are equally averse to sending their child to work but have differential preferences on how to spend the income derived from child labour, the relationship between child labour and a woman’s power becomes U-shaped as indicated in Figure 5.1. If there is an even power distribution where =1/2, neither of the parents are able to use the income from child labour. Thus, the least incidence of child labour occurs at this point. On the other hand, the presence of either an all-powerful husband ( =0) or an all-powerful wife ( =1) leads to a high incidence of child labour since the full benefits from child labour are reaped by the powerful agent.
In contrast, if mothers are more sensitive to the pain of their children than fathers, then the incidence of child labour becomes smaller when there is an all-powerful woman. The same argument holds if fathers are more sensitive to the pain of their children. Hence the graph becomes less sharp on the right hand side.

80 CHAPTER 5
Figure 5.1 The relationship between child labour and balance of power within a
household
Source: Basu (2006)
On the other hand, if only women are concerned about their children
while men are not sensitive to the pain of their children, the graph be-comes an inverted U-shape. That is, a rise in a woman’s power position within the household only results in a reduction in child labour if her initial power position is better than that of her husband.
We test these theoretical predictions using data from Ethiopia. This requires us to make sense of the assumptions used in Basu’s theory based on the context under consideration. Allocation decisions that lead to Pareto optimal outcomes, as suggested by the collective framework is questionable based on the available evidence (see Lundberg and Pollak 1996, Udry and Duflo 1995, Seebens and Sauer 2006). There exist, for instance, idle children who neither go to school nor are engaged in any type of work.
Also, the benefits of child labour could include not only economic work but also domestic as well as farm work which is very common in this setting. Where imperfect labour markets fail to satisfy the demand for labour especially for domestic and farm work, children’s labour is quite indispensable for such types of work.

A Woman’s Bargaining Power & Child Labour and Schooling 81
Moreover, it is possible that parents may not view child labour as painful and they may have positive attitudes towards it (Patrinos and Shafiq 2010). This, for instance, happens to be true in the context of ru-ral Ethiopia (Roschanski 2007). As such, an increase in a woman’s bar-gaining power could increase child labour in a linear fashion unless child labour becomes undesirable beyond a certain level of work.
It is also plausible that mothers or fathers could have different prefer-ences on how to allocate their daughters’ or sons’ time. This could espe-cially happen if there are differences in the returns to schooling invest-ments depending on the sex of the child (Thomas 1995). I account this aspect by incorporating a gender element to the analysis to capture any potential sex biases on how balance of power affects child labour and schooling.4
As can be seen from the discussion in chapter 2, the factors that af-fect a woman’s power relative to her husband go beyond the fraction of income earned by a woman as depicted in Basu’s model.
Basu’s theory described above is tested by introducing these context-specific intricacies when analyzing the data introduced in the next sec-tion.
5.4 The Data and Descriptive Statistics
This chapter uses the 2009 Ethiopian Rural Household Survey dataset. I focus on data from this round since it consists of the relevant infor-mation on household decision making. Similar information is also found in the 4th round collected in 1997. However, as most children who were in the relevant age group in 1997 had outgrown the age group by 2009, it is not possible to create a panel data.
The dataset provides a broad array of information on socioeconomic characteristics, agricultural activity, shocks, health issues, and risk and time preferences. It also provides information on the number of hours children spent on various activities over the previous seven days, their schooling and at what age they begin working. In addition, the data pro-vides information on who decides on various domains within a house-hold. The domains include the purchase of cereals, meat, medicine, men’s clothing, women’s clothing, children’s clothing, and schooling.

82 CHAPTER 5
I consider 1922 children between the ages of 5 and 15 years in 755 monogamous households. The incidence of child labour is defined as hours spent on domestic and economic work. The percentage of chil-dren involved in work or schooling or those that combine both is also reported. The education attainment of children for a specific age is also used as a schooling indicator.
Table 5.1 reports the descriptive statistics on children’s characteristics and these outcomes. The data consists of an equal proportion of male and female children with an average age of 10 years. 95 per cent of these children reside with their biological parents.
Children started engaging in work at the age of 6.5 years on average. 66 per cent of the children combine school with work while 27 per cent of them are only engaged in work. Very few of them only attend schools (1 per cent) or are idle (5 per cent). Those who work spend nearly 17 hours and 21 hours per week on average on domestic and farm work, respectively. Fewer children are engaged in paid work and spend 30 hours per week on average on this work - an equivalent of six working hours per weekday. Those with the maximum number of hours on the various work types spend, on average, more than eight hours per day on work.
Children’s age-adjusted school achievement (SAGE) is calculated fol-lowing Psacharopoulos and Yang (1991) using a sub-sample of 1685 children above the age of six years.
100*)/( EAGSAGE (5.1)
Where G indicates the highest grade of formal schooling attained by the child, A and E refer to the age of the child and the official school entry age (six years is taken for Ethiopia), respectively.
If SAGE=0, a child is illiterate. If SAGE is between 0 and 100, a child has below the normal school attainment. A child is considered to have normal educational attainment if SAGE is equal to 100. A child has above the normal education attainment for his/her age if SAGE is great-er than 100.
The average education attainment, 46.3, is far below the normal school level for a given age. As can be observed, 24 per cent of children in the sample never had any education while 65 per cent have schooling

A Woman’s Bargaining Power & Child Labour and Schooling 83
below what they should normally attain for their age. Only 8 per cent have attained the normal education level for their age and only 3 per cent are over-achievers for their age.
Table 5.1 Descriptive Statistics on Child labour and Schooling outcomes
N mean sd min max
Sex(1=male) 1922 0.51 0.50 0.00 1.00
Age in years 1922 10.45 2.98 5.00 15.00
Biological Child 1922 0.95 0.23 0.00 1.00
age child started participating in work for the first time 1758 6.50 1.33 4.00 13.00
Child only goes to school 1922 0.01 0.12 0.00 1.00
Child combines school and work 1922 0.66 0.47 0.00 1.00
Child only works 1922 0.27 0.44 0.00 1.00
Child neither goes to school nor works 1922 0.05 0.22 0.00 1.00
hours per week on domestic tasks 1423 16.72 11.38 1.00 96.00
hours per week on farm work and household business 1194 21.05 13.91 1.00 84.00
hours per week on paid work 15 29.53 18.95 6.00 70.00
Age Adjusted educational Attainment(SAGE) 1685 46.30 37.87 0.00 300.0
0
Illiterate(SAGE=0) 1685 0.24 0.42 0.00 1.00
Under normal(0<SAGE<100 1685 0.65 0.48 0.00 1.00
Normal (SAGE==100) 1685 0.08 0.28 0.00 1.00
Above normal(SAGE>100) 1685 0.03 0.18 0.00 1.00
Source: Author’s Calculation based on ERHS (2009)
Table 5.2 reports the descriptive statistics on who decides on the var-ious domains. As can been seen, a large proportion of husbands decide alone on the purchase of meat (68 per cent), medicine (58 per cent), their own clothing (73 per cent), and children’s schooling (59 per cent). In contrast, most wives decide alone on the purchase of cereals (52 per cent), and their own clothing (42 per cent).
Substantial numbers of couples jointly decide on the various domains. Couples in 23 per cent of households decide jointly on the purchase of cereals; 30 per cent jointly decide on the purchase of medicine; 14 per

84 CHAPTER 5
cent decide on the purchase of men’s clothing and 25 per cent decide on the purchase of women’s clothing.
Table 5.2Descriptive Statistics on Decision Making on Various Domains
Items Husband alone wife alone Both Jointly
Cereal 0.25 0.52 0.23
meat 0.68 0.17 0.15
health inputs(medicine) 0.58 0.11 0.30
Clothing for men 0.73 0.12 0.14
Clothing for women 0.33 0.42 0.25
Clothing for children 0.44 0.22 0.34
Schooling for children 0.59 0.18 0.24
Separate finance(1=yes) 0.86
N=755
Source: Author’s Calculation based on ERHS (2009)
Table A5.1 summarizes the descriptive statistics on the differences in the aforementioned children’s outcomes based on who decides on the various domains. The proportion of children who combine school and work is higher in households where there is balanced power in decision making over all the domains except in the case of meat.
The average number of hours that children spend on domestic and economic work is higher in households where the wife decides alone on all expenditure domains except cereals and women’s clothing. There is no statistically significant difference in the mean age-adjusted educational attainment based on the balance of power in the various domains.
The information on decision making over these domains is used to generate an indicator on generic decision making in the household by counting how many domains a wife decides on alone. It is assumed that a woman’s power increases with the number of domains she decides on.
Table 5.3 shows that wives decide on nearly two domains, on average, of the seven domains considered. 28 per cent of the women do not have any decision-making power on any of the given domains while 28 per

A Woman’s Bargaining Power & Child Labour and Schooling 85
cent decide on 1 or 2 domains. The percentage of women with decision-making power declines as the number of domains increases - only four per cent of the women decide alone on all of the given domains.
Table 5.3The Percentage of Women depending on the Number of Domains
they alone decide on (%)
Number of Domains N Percent
0 213 28.21
1 210 27.81
2 165 21.85
3 51 6.75
4 37 4.90
5 31 4.11
6 21 2.78
7 27 3.58
Mean( 1.78) N=755
Source: Author’s Calculation based on ERHS (2009)
What determines women’s power within a household is discussed in
chapter two. Based on the discussion in this chapter, it can be argued that a number of factors in the resource, institutional and agency dimen-sions potentially affect women’s power in this context.
5.5 Empirical strategy
This section presents the empirical strategies used to examine the effect of a woman’s power on child labour and schooling. First, the effect of the generic decision-making power within a household is tested and this is measured by the number of domains in which a woman can decide alone. An increase in the number of domains indicates an increase in a woman’s power relative to her husband’s. Relative power thus ranges from zero, indicating no power to seven, implying an all-powerful wom-an who decides alone on all domains. Following this, we focus on to what extent having power over decision-making on investment in human

86 CHAPTER 5
capital (children’s schooling) affects these same outcomes. Using bal-anced power as a reference, the effect of the presence of either an all-powerful woman or an all-powerful man in this domain is examined.
I focus on three dependent variables mentioned previously: a) hours of work by type of work; b) combining school and work versus working only; and c) age-adjusted educational attainment.
A basic OLS specification is given below for hours spent by child i on a specific type of work k as a function of child(C), household(X), paren-tal (P) characteristic and balance of power (BP). Types of work include domestic, farm, and paid work. The hours spent on farm and paid work are pooled together since few children have a positive number of hours for the latter. These two types of work will hereafter be referred to as economic work.
ihhhhhhicki BPPXCH (5.2)
The dependent variable is left censored, i.e. the data reveals a large proportion of children, 26 per cent in the case of domestic and 37 per cent in the case of economic work, with zero hours of work. Thus, we use a Tobit estimation technique since estimating equation (5.1) using OLS would result in inconsistent estimates.
The schooling outcomes of children are measured by two variables which are modelled independently. The first one is a binary outcome coded 1 if a child combines school and work and 0 if a child is engaged in work only. Since few children go to school only, we combined this with the category of children who find time to combine work and school. Combining schooling and work should be considered a better outcome in this setting since these children are engaged in work yet are also able to find the time to enroll in school, unlike those who only have time to work. As such, this is taken as a schooling outcome hereafter. The probability of a child going to school is then treated as a function of child (C), household (X), Parental (P) characteristics and the power bal-ance within a household (BP). The specification is given as follows:
]0[]1[Pr ihhhphhici eBPPXCPSchob (5.3)
Assuming that the error term, ei is normally distributed, equation (5.3) is estimated using the probit model.

A Woman’s Bargaining Power & Child Labour and Schooling 87
The second outcome is the age-adjusted educational attainment (SAGE). I use this as an indicator of schooling success. Besides the aforementioned controls, the number of hours, h, that children spend on domestic and economic work and the age children started working are controlled in the following specification:
ihhhhhhiiici BPPXhCSAGE (5.4)
SAGE is also censored from the left, i.e., for 24 per cent of children, the value is zero. SAGE is naturally zero for those children who have never attended school. As a result, we apply the Tobit model to mini-mize any potential inconsistent estimates if OLS were to be used.
A common problem that needs to be addressed in all of the afore-mentioned specifications is the problem of unobserved heterogeneity. Theory predicts that parents with higher discount factors (Lang and Ruud 1986), those who lack information on future labour market oppor-tunities and relevant networks invest less in their children's human capi-tal. A panel data would have been ideal to account for such unobservable attributes but due to data constraints I only rely on cross section data. Even so, an attempt has been made to control for some of these attrib-utes since the survey provides information on the household’s risk or time preference and its attitudes towards children’s education. In the case of risk preference, the survey provides information regarding whether a household prefers to receive 125 birr today or 200 birr next month. Those who prefer to receive 125 birr today are considered to ex-hibit ‘less forward looking behaviour’. Concerning attitudes towards ed-ucation, those who have positive attitudes are coded one against the al-ternative and this is used as a proxy for parental attitudes towards education.
Also, the individual motivation and determination of a child are es-sential, especially for success at school. This is particularly true in the case of some children in rural Ethiopia where empirical evidence shows the presence of children who defy their family wishes and continue to go to school (Roschanski 2007). It is not possible to control for such attrib-utes due to data constraints. This is potentially problematic only if a child’s school interest or motivation affects the attitude of the parent who has more bargaining power. If this is the case, then omission of this would overestimate the effect of the bargaining power variable. As a re-

88 CHAPTER 5
sult of the problems outlined above, the objective of this study is rather modest and is not intended to claim causality but to show the possible statistical association between the variables of interest.
Besides the decision making variables, the literature on child labour shows the importance of several factors that determine the allocation of children’s time. In the analysis below we control mostly for supply fac-tors, i.e. those characteristics of the child and the household which influ-ence the household’s decision to allocate children’s time away from schooling and towards work. The descriptive statistics are provided in Table A5.1.
Investment decisions on children’s education or allocation of their time may depend on child-related characteristics (C) such as sex, being a biological child and age. In particular, norms as well as labour market opportunities determine the perception of appropriate girls’ and boys’ education. Older children are more likely to engage in work due to rela-tively higher labour productivities that increase with age.
Several demographic and economic features of the household as a unit affect the supply of child labour. Various household characteristics (X) such as land measured in hectares and the number of livestock measured in tropical livestock unit (TLU)5, are controlled. Besides cap-turing the income effect, land and livestock ownership may also induce more demand for children’s labour. Children are the key sources of la-bour for herding livestock and working on the family farm in this setting.
Land quality measured by the percentage of best plots6 , the number of times the household was visited by extension workers in the past 12 months, and the use of fertilizer in the past five years are controlled. Since households in rural Ethiopia are often subject to shocks, they of-ten rely on their children’s labour to smooth consumption given that la-bour and capital markets are imperfect (Woldehanna 2010). I control for rain and crop shocks which are common in this setting.
Also whether the household is involved in labour sharing activities is relevant as it is correlated to what extent these shocks affect children’s labour and schooling (Debebe 2007). The effect of shocks also may de-pend on the household’s access to credit. I focus on whether the house-hold was able to access credit from the available informal credit market as we consider this to capture a degree of vulnerability. While it may show the ability of households’ to smooth their consumption in the

A Woman’s Bargaining Power & Child Labour and Schooling 89
event of shocks, it may also indicate to what extent the household is af-fected by various shocks. This is because, in this setting, people are often reluctant to borrow money from their neighbours or relatives unless they are in extreme distress. In most cases the amount of money they borrow from friends and families is not large enough to smooth consumption at the desired level.
Apart from household level correlates, children’s labour and school-ing decisions depend on parental characteristics (P) such as the age and schooling (measured in years) of the mother and father. I also control for mother’s participation in non-farm work and income from this type of work. I control for whether men and women have separate finances or not since this may affect to what extent decisions on purchasing capture the power balance in the household. As can be seen from Table 5.2, nine per cent of the households have separate finances while the majority use the same source of income.
Factors such as access to infrastructure, and schooling costs could al-so determine the outcomes under consideration. I only control distance to water source measured in hours. I also use this as a proxy for access to schooling infrastructure as there is often a positive correlation be-tween the two.
Since labour demands differ depending on the season, the season fixed effects is introduced. Also, as there are substantial variations in ed-ucational infrastructure across the villages studied, proximity to urban centres, and social norms, I control for village-fixed effects by introduc-ing dummy variables for the 15 villages covered by the survey.
5.5 Findings
Table 5.4 and Table 5.5 report the results from Tobit estimation on hours of domestic and economic work, respectively. This is carried out for children aged 5 to 15. Since the gender element is of particular in-terst, I run the estimation for boys and girls separately.
Turning our attention to the variable of interest, it appears that the balance of power within a household affects child labour. This is particu-larly true for hours children spend on domestic work while no effect is found on economic work. And the effect of a woman’s power on the hours children spend on domestic work affects both girls and boys. However, I find stronger effects for girls, which is in line with expecta-

90 CHAPTER 5
tions. As can be seen, both the level of significance and magnitude of the coefficient using the girls’ sample is much stronger and larger than is found for boys. As can be seen, every additional domain on which a woman alone has the decision-making power increases the number of hours girls and boys spend on domestic work by 0.74 hours and 0.65 hours per week, respectively.
This result seems to confirm the predictions based on Basu’s theory discussed in section 5.3 although the theory is only applicable to inci-dences of child economic work rather than the domestic work. It is curi-ous why child domestic labour intensifies when women are more power-ful. The result may reflect both a technological and preference effect although I do not disentangle which one of the two is driving the results found. Given the strict gender division of labour prevalent in the context of rural Ethiopia, norms are very particular about who should do what. As such, women operate within the domestic sphere and are mainly re-sponsible for domestic activities. To make sense of the result found, it is relevant to mention the literature that shows women’s share in leisure activities increases with an increase in their bargaining power (Schultz 1990). This also happens to be true in the setting under consideration (see chapter 4). What this means is that with an increase in women’s bar-gaining power, the demand for children’s labour, especially for domestic work, increases as children’s labour is the only substitute for women’s labour for this type of work.
On the other hand, the preference effect could also be driving the re-sult. For instance, Rochinsky (2007), in his qualitative study, found the presence of positive attitude for child work in this setting. He also found that women particularly have stronger preference for child work com-pared to men. This would mean that the result plausibly reflects women’s preference which is revealed when they are more powerful than their husbands within a household.
Most of the results from the other controls are in line with the find-ings from previous literature. As can be seen, the number of hours girls spend on both domestic and economic work increases by nearly seven hours as their age increases by one year, while boys work only four extra hours on domestic work and nine more hours on economic work. The negative sign of the age squared variable shows that the relationship be-tween age and child work (both domestic and economic) is non-linear. This is true for both boys and girls. It is not surprising that the hours

A Woman’s Bargaining Power & Child Labour and Schooling 91
spent on both types of work decline as the child’s age increases since the work division in rural Ethiopia reflects age considerations. This means that the work done by older siblings is eventually taken over by younger siblings. I do not find that being a biological child matters for hours spent on either type of work regardless of the sex of the child. Alongside child related characteristics, we find that demographic factors matter but only for domestic work, i.e. an increase in household size by one mem-ber is associated with a 0.6 hour and a 0.5 hour reduction in domestic work for girls and boys, respectively: the presence of more household members eases the work burden of children due to sharing and speciali-zation.
I do not find land ownership important for either types of work re-gardless of sex. Nonetheless, there appears to be an increase in the amount of economic work carried out as the quality of land increases. Due to the difficulty in hiring labour from the existing labour market, households have to rely on their children’s labour for economic work and this may intensify as the quality of the land improves - a one per cent increase in the quality of the household’s best plot increases a girl’s eco-nomic work by 0.04 hours. I do not find any significant impact on boys’ hours of economic work. I find, however, that increase in the number of visits by an extension worker is significant for boy’s economic work while it is found to be insignificant for other types of work.
As expected, the number of hours children spend on economic work is positively associated with the amount of livestock owned. We find this in the estimation using the girl’s sample. An increase in livestock by one livestock unit is associated with a 0.3 hour increase in domestic work and a 0.7 hour increase in economic work. The presence of a crop shock re-duces the number of hours girls spend on domestic work. The presence of crop shocks reduces the supply of mother’s labour for domestic work since women’s labor supply to farm work declines following crop fail-ures. It is found that the number of hours girls spend on economic work is higher in households which took credit from the informal credit mar-ket in the previous year. Girls who reside in such households spend five more hours on economic work while no significant effect is found for boys.
Variables that capture attitudes and risk or time preferences are found to be important for the hours girls spend on domestic work while no effect is found for boys. It is found that girls with ‘less forward-looking

92 CHAPTER 5
parents’ spend less time on domestic work - a reduction of nearly two hours is observed. Also girls spend nearly three hours less on domestic work if their parents have positive attitudes towards child education.
Table 5.4 Tobit Estimation of hours spent on domestic work
Hours spent on Domestic Work
Girls Boys
Coef. Std Err. Coef. Std Err.
Age in years 7.73 (1.56)*** 4.14 (1.17)*** Age squared -0.27 (0.07)*** -0.16 (0.06)*** Biological Child 2.43 (2.64) 1.80 (2.15) Household size -0.61 (0.32)* -0.47 (0.25)* Land in hectares -0.03 (0.02) 0.01 (0.02) Percentage of best plots 0.02 (0.01) 0.02 (0.02) Number of times visited by extension workers -0.23 (0.22) -0.28 (0.22) Used fertilizer in the past five years -1.38 (1.30) -0.14 (1.64) Number of livestock in TLU 0.29 (0.14)** 0.20 (0.23) Faced Rain shock in the last agricultural season -0.42 (0.36) -0.62 (0.58) Faced Crop shock in the last agricultural season -0.78 (0.36)** -0.37 (0.34) Household took loan of at least 20 birr 1.93 (1.32) 1.29 (0.84) Household benefits from labor sharing activities -2.00 (1.33) -0.59 (1.49) Household is risk averse -2.03 (1.20)* -0.55 (1.19) Positive attitude towards children’s schooling -2.77 (1.67)* 0.60 (2.07) Time it takes to fetch water(hrs) 0.03 (0.04) -0.06 (0.06) Father's age in years 0.04 (0.05) 0.01 (0.10) Mother's age in years -0.01 (0.05) -0.06 (0.06) Fathers schooling in years 0.04 (0.06) -0.04 (0.10) Mother's schooling in years 0.14 (0.08)* 0.16 (0.10)* Mother participates in non-farm work 0.85 (1.09) -0.18 (0.89) Mother's income from non-farm work -0.00 (0.00) 0.00 (0.00)* Presence of Separate finance -0.01 (1.46) -0.25 (2.13) Number of domains that woman alone decides on 0.74 (0.25)*** 0.65 (0.29)** Constant -45.27 (10.13)*** -32.30 (9.82)*** 11.85 (0.99)*** 11.23 (0.85)*** Observations 897 929
Clustered adjusted robust standard errors in parentheses *** p<0.01, ** p<0.05, * p<0.1, season and village fixed effects is controlled. Source:
Author’s Calculation based on ERHS (2009)
When considering parental characteristics, only the father’s educa-
tional level is found to be important, but only related to the hours chil-

A Woman’s Bargaining Power & Child Labour and Schooling 93
dren spend on domestic work. The mother’s educational level does not seem to matter for either type of work for both sexes. A year’s increase in the father’s education is associated with a 0.14 hour and a 0.16 hour rise in domestic work for girls and boys, respectively. While the mother’s participation in non-farm work is found to be insignificant, the mother’s income from this labour is important in increasing the number of hours spent on domestic work by boys. However, the level of the increase is too small to be meaningful.
Table 5.5 Tobit Estimation of hours spent on Economic work
Hours Spent on Economic Work Girls Boys
Coef. Std Err. Coef. Std Err. Age in years 6.63 (2.15)*** 9.06 (1.84)*** Age squared -0.30 (0.10)*** -0.36 (0.09)*** Biological Child 3.25 (3.67) -2.89 (3.38) Household size -0.92 (0.57) -0.47 (0.31) Land in hectares -0.71 (0.93) -0.03 (0.03) Percentage of best plots 0.07 (0.04)** 0.03 (0.02) Number of times visited by extension workers -0.24 (0.29) 0.22 (0.13)* Used fertilizer in the past five years 3.98 (3.77) 0.38 (2.16) Number of livestock in TLU 0.71 (0.32)** 0.33 (0.22) Faced Rain shock in the last agricultural season -0.27 (1.58) -0.84 (0.62) Faced Crop shock in the last agricultural season 0.78 (1.13) 0.39 (0.60) Household took loan of at least 20 birr 5.19 (1.82)*** -0.57 (1.30) Household benefits from labor sharing activities -1.95 (2.87) -1.49 (1.06) Household is risk averse 2.42 (2.66) 2.24 (1.92) Positive attitude towards children’s schooling 1.73 (4.26) -0.09 (2.26) Time it takes to fetch water(hrs) -0.01 (0.05) 0.00 (0.05) Father's age in years -0.04 (0.17) 0.15 (0.13) Mother's age in years 0.04 (0.13) 0.02 (0.09) Fathers schooling in years -0.21 (0.22) -0.12 (0.10) Mother's schooling in years -0.13 (0.19) 0.02 (0.08) Mother participates in non-farm work -1.13 (2.02) -1.18 (1.54) Mother's income from non-farm work -0.00 (0.00) -0.00 (0.00) Presence of Separate finance -5.63 (3.89) -0.67 (2.08) Number of domains that woman alone decides on 0.36 (0.65) -0.13 (0.51) Constant -34.73 (17.25)** -33.45 (13.15)** 20.45 (1.92)*** 16.08 (1.03)*** Observations 897 929
Clustered adjusted robust standard errors in parentheses *** p<0.01, ** p<0.05, * p<0.1, season and village fixed effects are controlled.
Source: Author’s calculation based on ERHS (2009)
Table 5.6 reports estimates from the marginal effects from the probit estimations of a child’s probability of combining school with work. As

94 CHAPTER 5
can be seen, we do not see any effect from the variable included to cap-ture women’s generic power. This is true for both boys and girls. We fur-ther investigated whether having more power over human capital in-vestment in particular could have any bearing on the outcome (see Table A5.3). In this estimation, I controlled a woman’s decision-making power on domains other than her decisions on human capital and I also con-trolled the human capital aspect. Taking a situation of balanced power between the parents as a reference, I found that when either of the par-ents is more powerful in deciding about human capital investment the probability that girls go to school declines by 8 percentage points while no significant effect is found for boys. Compared to children in house-holds with balanced power, the probability of going to school declines for both boys and girls in households where the man alone decides on human capital investment. A much larger effect is found for boys than for girls: while the probability declines by eight percentage points for girls, it declines by 19 percentage points for boys. Surprisingly, the varia-ble that shows women’s generic power, excluding decisions on human capital investment, is found significant, but only for boys. The result shows that with every additional domain over which a woman has sole decision-making power, the probability that boys go to school increases by three percentage points.
Two explanations could make sense of these results. It is possible that women prefer to invest in boys' schooling but at the same time prefer to train their girls in domestic work so that they are ready for marriage. Al-so, the choice might be a rational decision on the part of the women to invest in their sons’ education for economic reasons. For example, sons do generally not move away from the home village when they marry, hence women tend to have more contact with their sons. This means that they are able to benefit from investing in their sons’ education over the long term. Also, the discussion in chapter two highlights how women rely on their sons for their bargaining position within a household. That chapter also discusses how sons are a good source of social capital for women outside the domestic sphere. Contrasting results are found by Thomas (1995) using data from Ghana. He shows that powerful women prefer to invest more on their daughter’s health while fathers invest on their sons. Thomas (1995) used non-labour income as a measure of bar-gaining power.

A Woman’s Bargaining Power & Child Labour and Schooling 95
As for the other control variables, there is no evidence that being a biological child matters. But I find that an increase in age by a year re-sults in an increase in the probability of combining school with work by 33 percentage points for girls and 28 percentage points for boys. The opposite, however, follows from the effect of a child’s age squared, which is found significant and non-linear in both samples. This is in line with expectations, as parents rely more on their children’s labour when their children get older due to the increase in their marginal productivity. Also, the lack of a school infrastructure for secondary education leaves older children with less possibility to combine work with school.
Demographic and socioeconomic factors also determine the probabil-ity of a child going to school, though this is found to be true for girls only. I do not find any significant effect in the estimation using the boys’ sample. As Table 5.5 shows, an increase in household size increases the probability that girls go school by three percentage points. This is con-sistent with what was found in the previous literature (Mulat 1997 for Ethiopia; Chernichovsk, 1985 for rural Botswana). Such an effect, as ex-plained by Chernichovsky (1985), could be due to role assignment result-ing from diminishing returns to labour in households with more mem-bers. As a result, children, particularly girls in this setting, find more time to accommodate school besides their work responsibilities.
I find a sex bias in the effect of land ownership. An increase in land size by a hectare increases the probability that girls go to school, whereas it reduces the probability for boys. This is to be expected since the de-mand for boys’ labour for farm work increases with increase in farm land. The role of livestock in demanding child labour and its undesirable effect on children’s schooling is also documented for this context (Cockburn 2001, Woldehanna et al. 2004). No effects of crop and rain shocks are found for either boys or girls. Parents who view education as desirable affect the chances that girls’ go to school. That is, having par-ents with such traits increases the probability that girls go to school by 11 percentage points.
It is found that an increase in the number of hours it takes to fetch water reduces the likelihood that girls go to school. While the variable is statistically significant at 10 per cent, the magnitude is rather small. The mother’s schooling is important for increasing both boys’ and girls’ probability of going to school albeit it has a much stronger effect for boys than for girls. In contrast, the father’s schooling matters for boys

96 CHAPTER 5
but not for girls. It appears that with an increase in the father’s schooling by one year, the probability that boys go to school declines by one per-centage point. It is true that an increase in education leads to more op-portunities for a man to work outside the farm. Furthermore, boys’ la-bour is a substitute for their father’s, especially in the case of farm work, thus reducing the time they put aside for school.
Table 5.6Marginal Effects of Probability of attending school for children aged 5-15
Girls BoysCoef. Std Err. Coef. Std Err.
Age in years 0.33 (0.04)*** 0.29 (0.04)*** Age squared -0.01 (0.00)*** -0.01 (0.00)*** Biological Child -0.00 (0.04) 0.09 (0.06) Household size 0.03 (0.01)*** 0.02 (0.01) Land in hectares 0.03 (0.01)** -0.00 (0.00)** Percentage of best plots 0.00 (0.00) -0.00 (0.00) Number of times visited by extension workers 0.01 (0.00) 0.00 (0.00) Used fertilizer in the past five years 0.03 (0.06) 0.05 (0.06) Number of livestock in TLU -0.01 (0.00)*** 0.00 (0.01) Faced Rain shock in the last agricultural season 0.01 (0.01) -0.00 (0.02) Faced Crop shock in the last agricultural season -0.02 (0.01)* -0.01 (0.01) Household took loan of at least 20 birr -0.01 (0.03) 0.01 (0.03) Household benefits from labor sharing activities 0.04 (0.04) 0.01 (0.04) Household is risk averse -0.01 (0.04) -0.10 (0.04)** Positive attitude towards children’s schooling 0.11 (0.04)*** -0.04 (0.05) Time it takes to fetch water(hrs) -0.00 (0.00)** 0.00 (0.00) Father's age in years -0.00 (0.00) 0.00 (0.00) Mother's age in years -0.00 (0.00)* -0.00 (0.00) Fathers schooling in years 0.00 (0.00)* 0.01 (0.00)*** Mother's schooling in years -0.00 (0.00) -0.01 (0.00)** Mother participates in non-farm work 0.08 (0.03)** 0.04 (0.03) Mother's income from non-farm work -0.00 (0.00) -0.00 (0.00) Presence of Separate finance 0.14 (0.04)*** 0.07 (0.05) Number of domains that woman alone decides on -0.00 (0.01) -0.00 (0.01) Observations 897 929Log pseudo likelihood -359.39 -415.97Pseudo R2 0.37 0.27chi2 7494.73*** 4567.76***
Clustered adjusted robust standard errors in parentheses *** p<0.01, ** p<0.05, * p<0.1, village and season fixed effects are controlled.
Source: Author’s calculation based on ERHS (2009)
Unlike the findings in the literature described in section 5.4, women’s
participation in non-farm work increases the probability that girls go to

A Woman’s Bargaining Power & Child Labour and Schooling 97
school by seven percentage points. I do not find any significant effect of this variable on boys’ likelihood of going to school.
I also find that when women have separate finances, girls benefit while no effect is found for boys (see Table 5.6), the probability of girls going to school increases by 14 percentage points in such instances.
Table 5.7 reports estimates from Tobit regressions for the age-adjusted educational attainment for girls and boys. Contrary to our pre-vious findings on the aforementioned outcomes, I do not find any signif-icant effect on children’s educational attainment as a result of an increase in their mother’s power within the household. Likewise, we do not ob-serve any sex bias. Again, the uneven distribution of power regarding investment decisions on human capital does not seem to have any bear-ing on children’s educational attainment. This is true whichever of the parents has more power in this domain within the household. I suspect that the insignificant result may be due to the fact that the decision-making variables considered may not explain the variation for long term outcomes such as educational attainment.
As the results show, educational attainment seems to vary with age and with being a biological child. An increase in age by one year increas-es the level of educational attainment by nearly 20 per cent for girls and 23 per cent for boys. The coefficient of age-squared is significant and negative, which indicates a non-linear relationship between age and edu-cational attainment. This makes sense in the context of rural Ethiopia where it is not exceptional to find children whose education becomes interrupted before completing their primary school owing to a lack of access to educational infrastructure.
Biological children seem to excel in their educational attainment. Be-ing a biological child increases school attainment by nearly 15 per cent for girls and 17 per cent for boys. The age that a child starts participating in work activities appears to be relevant only for girls, while no effect is found for boys. With every additional year before a girl starts working, her educational attainment is reduced by nearly three per cent. I find that the hours spent on domestic work do not have any effect on either boys or girls; more time spent on economic work is detrimental only for girls’ educational attainment. An increase of one hour in this type of work re-duces the attainment level by 0.37 per cent, which is not so dramatic. Beegle et al. (2007) found similar results for Tanzania.

98 CHAPTER 5
A strong positive effect is found on boys’ educational attainment aris-ing from socioeconomic status, measured in terms of land size, while no significant effect is found in the case of girls. But the magnitude of the increase is rather small - for every hectare increase in land size there is a 0.3 per cent increase in boys’ educational attainment. Unlike the effect found in the labour and educational outcome considered in the previous section, quality of land does not seem to have any significant effect and does not show any sex bias.
The presence of a sex bias on the effect of agricultural technologies, however, is evident. Provision of agricultural services, which is captured by counting the number of visits to the landholding by extension work-ers, is positively correlated with boys’ educational attainment. For every additional visit, boys achieve a two per cent increase in their educational attainment. Contrary to this, the use of fertilizer increases girls’ education attainment. Compared to girls in households which did not use fertilizer during the last five years, girls in households with a history of fertilizer use show a nearly 13 per cent rise in their educational attainment.
I do not find that livestock ownership matters for this outcome. Nor is there any evidence that crop shocks mater. This is true for both boys and girls. But I do find that an increase in rain shock significantly and negatively affects girls’ educational attainment while no effect is found for boys.
Borrowing from the informal credit market is only negatively associ-ated with boys’ education attainment. Boys in households which bor-rowed money the previous year show a 7 per cent reduction in their edu-cational attainment compared to their counterparts. As discussed previously, this variable captures the extent of vulnerability rather than the ability to mitigate income declines, given that households use bor-rowing as a last resort only when they are in an exceptionally distressful situation. People are traditionally reluctant to reveal their vulnerability to others so it is not surprising that children in such households would like-ly be forced to withdraw from school to overcome income declines.
It is known that rural households in rural Ethiopia generally rely on their networks to mitigate labour shortage but I do not see the effect of this on children’s education attainment. Also, having parents who are ‘less forward looking’ does not seem to have any significant effect. Boys with parents who have a positive attitude towards education show a 16

A Woman’s Bargaining Power & Child Labour and Schooling 99
per cent decline in their educational attainment compared to boys with parents who have a negative perception of education.
Table 5.7Tobit Estimation of Age Adjusted Education Attainment (SAGE) for children
7-15
Girls Boys Coef. Std Err. Coef. Std Err.
Age in years 19.95 (9.42)** 22.73 (5.90)*** Age squared -0.73 (0.40)* -0.78 (0.25)*** Biological Child 14.98 (6.37)** 16.96 (6.04)*** Age child started working -2.92 (1.14)** 0.38 (1.12) Hours per week on domestic work -0.23 (0.15) 0.35 (0.25) Hours per week on Economic work -0.37 (0.09)*** -0.21 (0.26) Household size 2.22 (0.98)** 0.29 (1.07) Land size in hectares -0.03 (0.06) 0.30 (0.08)*** Percentage of best plots -0.05 (0.07) -0.07 (0.04) Number of times visited by extension workers 0.94 (0.62) 2.33 (0.58)*** Used fertilizer in the past five years 13.41 (7.57)* 9.19 (5.70) Number of livestock in TLU -0.68 (0.74) -1.02 (0.91) Faced Rain shock in the last agricultural season -3.63 (1.47)** 0.19 (1.47) Faced Crop shock in the last agricultural season 1.63 (1.69) -1.65 (2.07) Household took loan of at least 20 birr -1.29 (3.85) -7.41 (2.64)*** Household benefits from labor sharing activities 4.45 (5.65) -0.09 (4.13) Household is risk averse -3.47 (6.36) 0.12 (5.18) Positive attitude towards child schooling 4.40 (5.87) -15.67 (4.21)*** Time it takes to fetch water (hrs) -0.25 (0.12)** 0.08 (0.14) Father’s age in years -0.38 (0.25) -0.04 (0.30) Mother’s age in years 0.46 (0.17)*** 0.17 (0.24) Fathers schooling in years 0.17 (0.40) -0.20 (0.23) Mother’s schooling in years 0.26 (0.37) -0.34 (0.25) Mother participates in non-farm work -4.08 (4.84) -11.33 (3.26)*** Mother’s income from non-farm work 0.01 (0.01) 0.02 (0.00)*** Presence of separate finance 4.94 (7.23) -2.90 (6.42) Number of domains wife alone decides on 0.20 (0.98) 0.08 (1.01) Constant -100.38 (59.84)* -116.70 (41.23)*** Observations 748 787Log pseudo likelihood -3066.31 -3309.88 Pseudo R2 0.036 0.03 chi2 221.29*** 172.74***
Cluster adjusted Robust standard errors in parentheses *** p<0.01, ** p<0.05, * p<0.1, season and village fixed effects is controlled.
Source: Author’s calculation based on ERHS (2009)

100 CHAPTER 5
It is not surprising that as the number of hours it takes to fetch water increases, girls’ education attainment declines. While the level of signifi-cance is strong, the magnitude (0.25 per cent) is not that large.
Among the parental characteristics, only the father’s age is found to be significant and is positively associated with girls’ educational attain-ment. But the magnitude (0.46 per cent) again is rather small.
I find a large and perverse effect of a mother’s participation in non-farm work on boys’ educational attainment. Boys’ educational attainment declines by 16 per cent if their mothers participate in non-farm work. This is consistent with the findings in previous studies (Grootaert 1998, Ray 2000, Fuwa et al. 2006, Woldehanna 2005).
Alternatively, a mother’s income obtained from non-farm work ap-pears to have a strong and positive effect on boys’ school attainment though with very small magnitude (0.02 per cent). Therefore, one can speculate that the substitution effect outweighs the income effect. This is not surprising given that income generated from non-farm work is rather small in the setting under study.
Overall, it can be argued that educational attainment seems to be driven by some of the child, household and parental characteristics con-sidered.
5.6 Conclusions
Many studies that show the positive effect of women’s bargaining power on children’s welfare have inspired the argument that there is always a positive link between the two. However, recent literature argues that the woman bargaining power-child welfare nexus depends on the relative bargaining power of the woman in relation to her husband. In the light of this new research, the chapter investigated the effect of a woman’s power on child labour and schooling outcomes using the 2009 Ethiopian Rural Household Survey dataset for children between the ages of 5 to 15. The number of domains over which a woman has the sole right to make decisions was used as an indicator of her decision-making power. The effect of this is investigated on hours children spend on domestic and economic work, the probability of that children go to school, and age-adjusted educational attainment. The effect of a woman’s power over human capital investment was also examined on these same outcomes.

A Woman’s Bargaining Power & Child Labour and Schooling 101
Contrary to what was conventionally expected, an increase in the number of domains over which a woman decides increases rather than decreases the number of hours children spend on both domestic and economic work. The effect was evident for both boys and girls although slightly higher effects are observed for domestic work on girls and for economic work on boys. It is also found that an increase in women’s power positively affects the probability that boys go to school while no effect was found for girls. More specifically, a woman’s power over hu-man capital investment reduces the chances of a girl going to school. Similarly, it is found that when a man is more powerful than his wife in this domain, the probability that children attend school declines, with larger effects found for boys. There is no effect found for children’s ed-ucation attainment when either of the parents is powerful.
This study provides an alternative perspective on the women’s bar-gaining power-child welfare nexus. It shows that the relationship be-tween women’s power and children’s welfare is not always positive. The results from this study could be of interest to interventions that use women’s empowerment as an instrument to influence children’s welfare.
Notes
1 See Quismbing and Maluccio 1998, Quismbing and Brière 2000, Glick and Sahn 1998, Lunderberg et al. 19971 2 This is based on the 2005 Ethiopian Child Labour Force Survey. 3 The full proof of the model is found in Basu (2006). 4 A huge strand of literature from developing countries suggests that parents do not necessarily weigh boys’ and girls’ work or schooling equally. Very often these literatures underscored the presence of a huge gender divide. For example, found for Côte d'Ivoire that girls have a high probability of engaging in home care activ-ities rather than attending school or combine school and work (Grootaert, 1998, Canagarajah and Coulombe 1997, Ersado, 2002, Illahi 2001, Tassew et al., 2004). 5 TLU refers to a common unit to describe livestock numbers of various species as a single figure that expresses the total amount of livestock present, irrespective of the specific composition (Fao 2010). 6 Best plots are known as ‘lem’ in the local language and yield greater outputs.

102
6 Summary and Conclusions
This thesis examines the effect of women’s bargaining power on their participation in non-farm work, on their health status and on their chil-dren’s labour and schooling in rural Ethiopia.
The thesis uses information from focus group discussions conducted in rural Ethiopia to understand the underlying factors that affect wom-en’s bargaining position within a household. Using this information, this thesis argues that the factors that affect women’s bargaining power should be viewed within a given context. It shows this using rural Ethio-pia as an important case study. The thesis shows that a woman’s bargain-ing power originates from various dimensions. In contrast to the focus given to the economic dimension of women’s bargaining power in re-search and policy, this thesis shows that a woman’s bargaining power can also originate from social resources, marital institutions and agency. Apart from bringing assets to marriage that give a woman power in the material/economic dimension, the study finds that various networks and relationships give her power in the social dimension. Some of these orig-inate from fulfilling expectations emanating from traditional values and norms. Of particular significance is the importance of having children, particularly sons for enabling women to enjoy a better bargaining posi-tion within their household. Apart from this, social resources like having grown up sons and brothers, the wealth status of parents, and residing in the place of birth are found to be of paramount importance.
The study brings to the forefront the correlation between a woman’s bargaining power and the type of marital arrangement at the beginning of the marriage. This is something that is not widely discussed in the ex-isting literature. As the study site is a rural setting, norms are deeply rooted hence have an effect on the day to day interactions of household members. While most marriages are arranged by a couple’s parents, a
Summary and Conclusions 103
non-negligible proportion of marriages are arranged by bride kidnapping or abduction. Marriage by kidnapping puts a woman in a relatively lower fall-back position, while a marriage arranged by parents ensures a better fall-back position. Both of these arrangements do not, in most cases, re-flect a woman’s own preference to be in the marriage. The incidence of love marriages is very low and such marriages are considered to be a de-viation from the widely accepted tradition. Inter-ethnic and inter-religious marriages are often marriages formed by mutual consent or love, given that most arranged marriages occur between individuals from the same ethnic group and the same religion. The study highlights that a woman in such marriages exercises more agency than a woman in a mar-riage arranged by her parents or by kidnapping. Apart from this, the the-sis shows the importance of marriages that involve a written marital con-tract. Such marriages improve women’s fall-back position relative to marriages that do not involve such contracts.
Besides these dimensions of power, the study highlights that women may resort to strategies that allow them to have access to household re-sources. A very good example that is emphasized in this thesis is wom-en’s use of excelling in household work as a means to negotiate access to resources within a household. This aspect is largely ignored in the exist-ing literature where more focus has been given to measuring power through tangible resources. To the extent that women continue to rely on their traditional roles as a means to fulfill their practical needs as op-posed to needs of strategic nature (Moser 1993), the existing gender divi-sions of labor could remain the same.
The study shows how the various dimensions of women’s power af-fect the welfare of women and children in the setting of rural Ethiopia. It shows that better bargaining power originating from specific marital ar-rangements such as self-arranged marriage (measured by talking to a spouse before marriage) and the presence of a written marital contract reduce women’s participation in off-farm self-employed work. It also highlights that women’s participation in this type of work increases when agricultural shocks occur. However, this thesis argues that all women do not respond to these shocks in the same manner. The results has shown that women with better bargaining power in the economic and the agen-cy dimensions have a lower participation rate in this type of work even in times of shocks. In particular, women who brought livestock to marriage and are in inter-ethnic marriage have a lower probability of participating

104 CHAPTER 6
in the self-employed off-farm work during times of shocks. The results reveal the perception of various types of work in this setting. Traditions still dominate and these traditions label some of this work undesirable. Work associated with traditional hair dressing and selling local drinks are considered indecent. Work associated with selling firewood requires that women travel long distances carrying heavy loads on their backs. There-fore, women with higher bargaining power supply less labour to this type of work, even at times of shocks.
The most important implications of such findings are threefold. First, female labour is an important consumption-smoothing mechanism dur-ing shocks. Given the tenacity in gender roles in this context, women are more likely to be time-burdened during such times. Second, not all work is desirable and women who do undesirable work are already in a lower bargaining position. While it can be argued that this work could eventu-ally lead to better bargaining power, it may not necessarily be the case so long as attitudes towards such types of work remain the same. This is a very interesting departure from the existing literature that often associ-ates labour market participation with women’s empowerment. Converse-ly, what this thesis shows is that participation in certain types of work, the problem of the time-burden, the associated psychological stress of engaging in undesirable work, and the disproportionate impact that shocks have on women’s malnutrition could have very disconcerting im-plications on their welfare.
Beyond the implications on participation in off-farm self-employed work, the study also examines the effect of women’s bargaining power on their health status using multidimensional health status indicators. These include self-reported illness, functional ability, body mass index and chronic energy deficiency. The use of multidimensional health indi-cators is to show whether similar factors affect various dimensions of health. The findings have both a methodological contribution and bear interesting policy implications. The study finds that few common measures of power affect all dimensions of health. While the economic dimension is associated with more self-reported illness, it is found to be unimportant for the more objective measures of health. The agency di-mension captured by an inter-ethnic marriage negatively affects func-tional ability, whereas the same dimension captured by an inter-religious marriage is associated with better functional ability and lesser chronic energy deficiency. Marital arrangements such as kidnapping are found to
Summary and Conclusions 105
be detrimental to a woman’s body-mass index compared to marriage ar-ranged by mutual consent, which is associated with better body-mass index and a lower incidence of chronic energy deficiency. This implies that efforts geared towards improving women’s health by empowering them should take into account the effect of distinct dimensions of power on distinct dimensions of health. This cautions against generalizations based on a specific dimension of health. Overall, it can be argued that while economic and human resources are found to be unimportant, mar-ital institutions and agency matter. Economic factors appear to have an effect when women are endowed with better bargaining power in other dimensions. From a policy standpoint it can be argued that focusing on economic resources without addressing institutions, especially those re-lated with marital arrangements that hamper women’s power position, will not have the desired effect.
This thesis also examines the effect of women’s bargaining power on child labour and schooling. The intra-household literature often associ-ates women’s power with better welfare for children. As a result, improv-ing women’s power position has been considered to be a key entry point for policy to improve children’s welfare. The results found caution against taking this presumed relationship for granted. The thesis shows that an increase in a woman’s power relative to her husband increases the number of hours children spend on domestic work. The study finds that an increase in women’s power positively affects the probability that boys attend school while no effect was found for girls. More specifically, a woman’s power over human capital investment reduces the chances of a girl going to school. Similarly, the study found that when a man is more powerful than his wife in this domain, the probability that both girls and boys go to school declines. No evidence was found that the power rela-tionship within a household affects children’s educational attainment.
One of the most interesting contributions of this thesis is the effort made to understand which dimensions of a woman’s bargaining power matter for which outcomes. It can be seen that only the economic di-mension is found to be important in reducing a woman’s participation in off-farm self-employed work while it increases self-reported illness. Marital arrangements that increase a woman’s power are associated with a decline in a woman’s participation in self-employed work during times of shocks and these are also associated with an increase in her body mass index and a decline in the probability that she experiences chronic nutri-

106 CHAPTER 6
tional deficiency. A marriage arrangement that involves kidnapping re-sults in a woman having a lower body mass index but this does not seem to have any effect on her participation in off-farm self-employed work. The agency dimension is important in explaining a woman’s probability of participation in off-farm self-employed work and her functional health. The agency dimension is found to be important for a woman’s participation in off-farm self-employed work, her functional health and the likelihood that she experiences chronic energy deficiency.
The results of this study have substantial policy implications. As this thesis shows, more improvements to women’s position within the household derive from marital institutions and women’s agency, particu-larly when these relate to participation in self-employed work and wom-en’s health. Despite the importance of context-specific institutions on women’s status or power position, they are largely ignored by policies or programmes such as the Millennium Development Goals. It seems that women’s empowerment is understood within a narrow definition that only looks at dimensions related with economic empowerment. Yet eco-nomic empowerment does not necessarily reflect or change women’s subordinate position that emanates from specific institutional arrange-ments. In this regard, the results described in this thesis could provide an interesting case for the need to pay attention to the various dimensions that are relevant for women’s empowerment as well as their welfare. Specifically in the case of Ethiopia, the study shows that the need to tar-get institutions, especially those related with marriage, is critical.
There are encouraging signs that the Ethiopian government has at-tempted to address these. For example, Ethiopia ratified the UN con-vention on the Elimination of All forms of Discrimination against Women in 1995. Achieving Millennium goals has been an integral part of the National Development Programs. Similarly, new laws have been es-tablished: an example being the revision of the family law in 2004 which provides the legal framework for women to have an equal share of the household’s assets in the event of inheritance or divorce. Land certifica-tion in some regions of the country has elements of addressing inequali-ties along gender lines. The passing of a law to make kidnapping and child marriage illegal are some of the other changes. It thus appears that besides empowering women through economic means, there is a move towards rearranging institutions. However, it should be noted that a top down approach to changing institutions may not be effective if commu-

Summary and Conclusions 107
nities are not integrated enough in this process of change. Given the pa-triarchal nature of the society under study, policies should pay significant attention to the role of men in bringing about the necessary changes in those institutions that could have a significant contribution towards gen-der equality.
The study proposes two issues for future research. What this study does not address, although it is critical, is how women’s bargaining pow-er changes across different time periods. Particularly in this setting, in the past two decades various changes (due to policies, globalization, and shocks) that have a direct bearing on women’s status have occurred. Un-derstanding how women’s power evolves over time would help to un-derstand the implications of, for example, targeted interventions. Cer-tainly the results from this analysis only reflect some of the reality in the context of rural Ethiopia. To my knowledge almost nothing is known on this topic in the context of urban Ethiopia which provides a second issue for future research.

108
Appendices
Figure A3.1Participation Rates in Off-farm Self-employment by Gender (%)
Source: Own calculation from ERHS (1994-2004)
Participation in off farm work by Sex
18.2
15.8
13.1 13.2
16.115.5
17
5.3 5.2
0.6
11.8 12.2
0
2
4
6
8
10
12
14
16
18
20
1994a 1994b 1995 1997 1999 2004
Survey Year
PercentageMaleFem ale
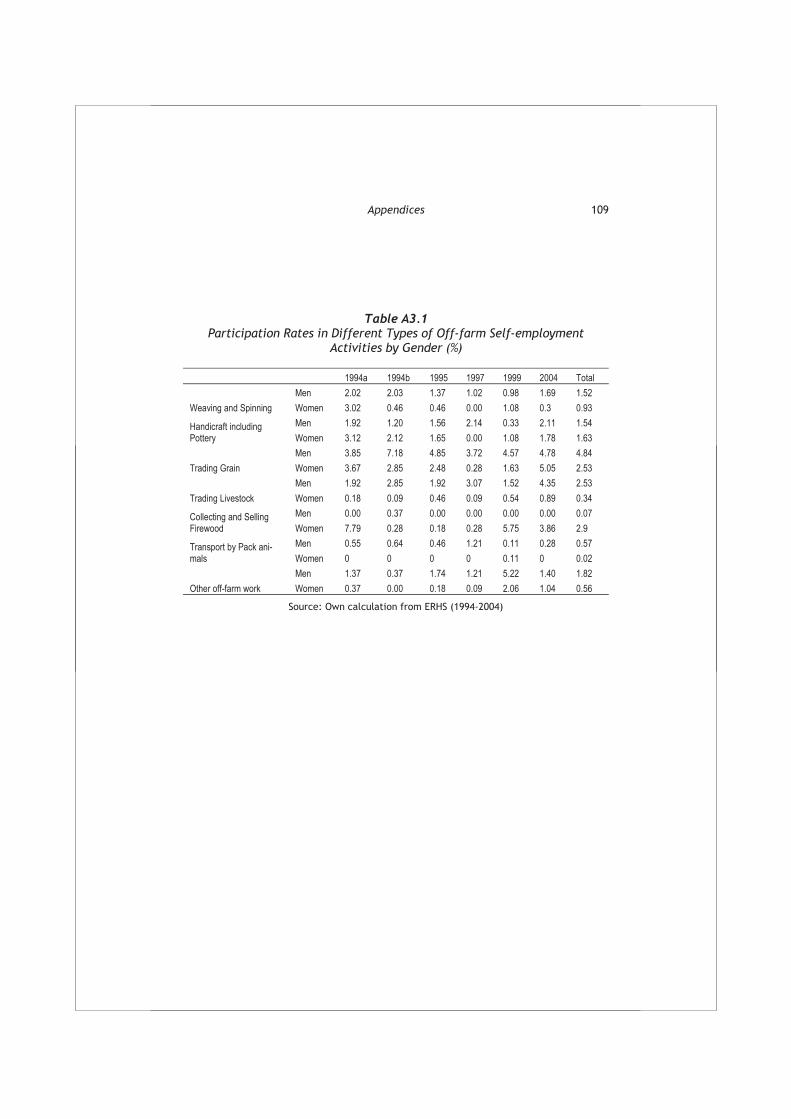
Appendices 109
Table A3.1Participation Rates in Different Types of Off-farm Self-employment
Activities by Gender (%)
1994a 1994b 1995 1997 1999 2004 Total
Weaving and Spinning
Men 2.02 2.03 1.37 1.02 0.98 1.69 1.52
Women 3.02 0.46 0.46 0.00 1.08 0.3 0.93
Handicraft including Pottery
Men 1.92 1.20 1.56 2.14 0.33 2.11 1.54
Women 3.12 2.12 1.65 0.00 1.08 1.78 1.63
Trading Grain
Men 3.85 7.18 4.85 3.72 4.57 4.78 4.84
Women 3.67 2.85 2.48 0.28 1.63 5.05 2.53
Trading Livestock
Men 1.92 2.85 1.92 3.07 1.52 4.35 2.53
Women 0.18 0.09 0.46 0.09 0.54 0.89 0.34
Collecting and Selling Firewood
Men 0.00 0.37 0.00 0.00 0.00 0.00 0.07
Women 7.79 0.28 0.18 0.28 5.75 3.86 2.9
Transport by Pack ani-mals
Men 0.55 0.64 0.46 1.21 0.11 0.28 0.57
Women 0 0 0 0 0.11 0 0.02
Other off-farm work
Men 1.37 0.37 1.74 1.21 5.22 1.40 1.82
Women 0.37 0.00 0.18 0.09 2.06 1.04 0.56
Source: Own calculation from ERHS (1994-2004)

110 WOMEN’S BARGAINING POWER & INTRA-HOUSEHOLD RESOURCE ALLOCATION IN RURAL ETHIOPIA
Figure A3.2Participation Rates in Wage Work by Gender
Source: Own calculation from ERHS (1994-2004)
Table A3.2Participation in Different types Wage Work by Gender (%)
1994a 1994b 1995 1997 1999 2004 Total
Hired in Farm work
Men 5.32 8.56 5.31 5.03 4.35 5.62 5.74
Women 0.46 1.01 0.73 0.74 1.3 0.3 0.77
Professional work
Men 0.37 0.55 0.55 1.02 0.54 0.7 0.62
Women 0 0.09 0 0 0.22 0 0.05
Skilled work-er(builder)
Men 1.74 2.85 1.47 2.98 2.39 1.12 2.14
Women 0.09 0.09 0 0.09 0.11 0 0.07
Unskilled work-er
Men 7.37 6.74 9.71 18.63 20.24 6.07 10.01
Women 4.17 1.69 4.35 3.7 2.22 2.33 2.99
Food for work
Men 5.87 5.89 6.41 0.84 5.54 15.87 6.21
Women 2.29 1.2 2.39 0.37 2.93 4.16 2.07 Other wage work(trader,driver, mechan-ic, etc)
Men 1.92 1.29 1.19 0.93 2.39 2.39 1.62
Women 0.37 0.55 0.18 0.74 0.11 0.45 0.4
Source: Own calculation from ERHS (1994-2004)
Participation in Paid Work by Sex
16.6817.96
15.84
13.78 13.37
17.42
3.482.58
3.31.96
3.582.38
0
2
4
6
8
10
12
14
16
18
20
1994a 1994b 1995 1997 1999 2004
Survey Year
PercentageMaleFem ale

Appendices 111
Table A3.3Participation Rates in Off-farm Self-employment and Wage Work by
Household Poverty Status and Gender (%)
Survey Round
Self-employment Off-farm Work Wage Work
Men Women Men Women
Poor Non Poor Poor Non Poor Poor Non Poor Poor NonPoor
1994a 15.72 20.6 18.94 15.1 18.94 14.56 5.68 1.42
1994b 17.73 13.99 5.78 5.01 21.51 14.85 3.78 1.55
1995 13.61 12.05 6.46 3.61 16.16 15.86 3.57 3.18
1997 11.95 13.83 0.29 0.69 12.83 14.38 2.33 1.80
1999 15.3 16.58 11.9 11.78 9.35 15.87 3.40 3.69
2004 18.64 13.39 14.76 10.45 15.41 18.71 0.37 3.73
Source: Own calculation from ERHS (1994-2004)

112 WOMEN’S BARGAINING POWER & INTRA-HOUSEHOLD RESOURCE ALLOCATION IN RURAL ETHIOPIA
Table A3.4Descriptive Statistics of Key Variables
Variables 1994a 1994b 1995 1997 1999 2004
Age in years 37.0 37.0 37.0 37.0 37.0 37.0
No schooling 84.8 84.8 84.8 84.2 82.9 81.1
At least primary education 9.9 9.9 10.0 10.2 11.7 12.9
Other education 11.4 11.4 11.5 11.7 12.5 13.4
Poor 48.4 46.4 55.5 32.2 38.3 39.3
Household Size 7.0 7.0 6.0 6.0 7.0 6.0
Land(in Hectares) 1.4 1.4 1.5 1.5 1.3 1.0
Distance to the nearest town in Kilometers 11.9 11.9 11.9 11.9 11.9 11.9
Kiremit rains came on time 57.6 57.6 40.2 72.5 68.0 68.5 Enough rain at the beginning of the rainy season
60.8 60.8 40.0 69.1 66.3 69.9
Rain stopped on time 43.2 43.2 30.4 55.9 55.6 52.2 Rained near harvest time 38.3 38.3 14.1 20.6 14.8 31.4
Crop suffered from wind 33.1 33.1 8.6 12.5 10.5 19.7
Crop suffered from flooding 30.3 29.6 8.9 14.6 12.8 13.0
Crop suffered from plant disease 44.6 44.6 10.5 24.5 70.5 24.3
Crop suffered from insects 37.4 37.4 10.2 20.2 49.6 20.9 Crop suffered from weed 26.4 26.4 5.8 9.5 50.5 12.7 Unable to get oxen at the right time 43.8 43.8 19.1 29.8
Unable to get labor at the right time 21.5 21.5 8.2 14.8
Family members were ill 20.0 20.0 8.6 20.5 Wife's share in the total land brought to mar-riage
2.0 2.1 2.0 2.5 1.7 1.3
Wife's Share in the total livestock brought to marriage
15.7 15.7 15.7 15.5 15.4 15.3
Wife talked to spouse before marriage 38.3 38.2 38.2 39.7 38.7 40.4
Wife was kidnapped for the marriage 11.3 11.3 11.2 10.8 10.6 9.9
Husband and wife do have written marital contract
44.7 44.8 45.0 45.5 45.5 42.4
Wife and husband are from different ethnic groups
2.1 2.1 2.2 2.2 2.2 2.3
Wife and husband have different religion 11.4 11.5 11.7 12.0 10.5 9.3
Wife has brothers 73.8 73.9 73.7 80.3 73.3 73.7
Wife's parents are richer than husband's par-ents
25.3 25.4 25.2 25.2 25.1 26.4
Number of Observation(total) 2,182 2,172 2,182 2,148 1,842 1,582
Source: Own calculation from ERHS (1994-2004)

Appendices 113
Table A3.5Estimation Results of Bargaining Power Variables on Married Women’s
Participation on Off-farm Self-Employment (Estimated Individually)(OLS)
Self Employed Off-farm work Pooled Random
Effects Wife’s share out of the total land brought to marriage -0.029 -0.117*** (0.026) (0.029) Wife’s share out of the total livestock brought to marriage -0.015 -0.014 (0.012) (0.012) Wife talked to spouse before marriage -0.029*** -0.029*** (0.010) (0.010) Wife kidnapped for marriage 0.007 0.008 (0.014) (0.014) Couples have written marital contract -0.015 -0.015 (0.010) (0.010) Wife has brothers 0.008 0.008 (0.011) (0.011) Wife comes from a different ethnic group -0.000 -0.000 (0.015) (0.015) Wife’s religion different from husband’s 0.017 0.018 (0.025) (0.025) Wife’s parents richer than husband’s 0.010 0.011 (0.012) (0.012)
Robust standard errors in parentheses *** p<0.01, ** p<0.05, * p<0.1; socioeconomic and shock variables, round and season dummies are controlled in each case.
Source: Own calculation from ERHS (1994-2004)

114 WOMEN’S BARGAINING POWER & INTRA-HOUSEHOLD RESOURCE ALLOCATION IN RURAL ETHIOPIA
Table A3.6 The Effect of Agricultural Shocks on Married Men’s and Women’s
Participation in Off-farm Self- Employment(OLS)
Married Men Married Women Variables Pooled Fixed effects Pooled Fixed effects Rain in the main rainy season came on time -0.006 -0.011 -0.005 0.009 (0.012) (0.012) (0.010) (0.010) Enough rain at the beginning of the rainy season 0.001 -0.008 0.003 -0.002 (0.013) (0.011) (0.009) (0.010) Rain stopped on time 0.013 0.016 -0.014* -0.000 (0.012) (0.010) (0.008) (0.009) Rained near harvest time 0.007 0.008 0.016 0.020* (0.013) (0.012) (0.010) (0.011) Crop suffered from wind/storm -0.029** 0.005 0.046*** 0.033** (0.014) (0.014) (0.012) (0.013) Crop suffered from flooding -0.003 0.027** -0.04*** -0.028*** (0.014) (0.013) (0.011) (0.010) Crop suffered from plant disease 0.033** 0.013 -0.009 -0.022** (0.014) (0.012) (0.010) (0.010) Crop suffered from insects -0.047*** 0.001 -0.003 0.018* (0.013) (0.012) (0.010) (0.010) Crop suffered from weed -0.047*** -0.016 0.018 0.022* (0.014) (0.013) (0.012) (0.013) Constant 0.210*** 0.185*** 0.187*** 0.178*** (0.018) (0.014) (0.015) (0.014) Observations 5437 5437 5382 5382R-squared 0.017 0.011 0.057 0.080
Cluster adjusted robust standard errors in parentheses *** p<0.01, ** p<0.05, * p<0.1; socioeconomic and shock variables, round and season dummies are controlled in each case.
Source: Own calculation from ERHS (1994-2004)

Appendices 115
Table A.4. 1Descriptive Statistics of Key Variables
Variables 1994a 1994b 1995 1997 2004 Pooled
Age in years 35.2 35.2 36.3 37.8 43.3 37.0
Husband has no schooling 64.6 64.3 65.1 66.0 64.5 65.0
Husband has at least primary education 11.4 11.5 11.2 11.0 11.3 11.3
Husband has other education 24.0 24.2 23.7 23.0 24.1 23.8
Household size 6.5 6.6 7.1 7.9 6.8 7.0
land in hectares 1.4 1.4 1.5 1.5 1.0 1.4
Material of wall 9.3 9.8 8.4 9.9 6.5 9.0
Material of roof 12.4 11.0 11.1 13.0 12.9 12.0 Rain in the main rainy season did not come on time 42.5 42.7 60.3 27.5 31.2 41.5 Not enough rain at the beginning of the rainy season 38.9 38.7 60.5 30.9 30.4 40.6
Rain did not stop on time 56.9 56.6 69.7 44.1 46.7 55.4
There was rain near harvest time 38.2 38.2 13.8 20.6 32.8 28.3
Crop suffered from wind/storm 32.8 32.8 8.2 12.5 20.5 21.3
Crop suffered from flooding 30.1 29.7 8.2 14.6 12.9 19.2
PA has access to Electricity 13.7 13.6 13.6 20.2 12.1 14.8
PA has access to piped water 25.2 24.8 29.7 30.5 30.8 28.0 Distance to the nearest government hospital 24.7 24.5 24.5 24.4 25.5 24.6
Distance to the nearest market 11.3 11.3 11.3 11.3 10.8 11.2
region1 8.0 7.9 7.3 8.2 7.9 7.9
region3 30.8 31.0 30.4 31.8 32.3 31.2
region4 27.4 27.3 28.2 27.2 20.9 26.6
region7 33.8 33.8 34.0 32.8 38.9 34.3
Number of Observations 1092 1043 1062 1098 705 4999
Source: Author’s Own Calculation using ERHS (1994-2004)

116 WOMEN’S BARGAINING POWER & INTRA-HOUSEHOLD RESOURCE ALLOCATION IN RURAL ETHIOPIA
Table A4.2Health Status by Socioeconomic Status
ill Illness days stand sweep walk carry hoe
body mass index CED
Age<18 7.9 0.9 99.2 99.2 97.5 96.7 91.0 20.4 12.6 18<age<49 13.2 1.9 99.1 99.2 97.5 95.1 88.3 20.4 19.949<=age<65 17.2 2.8 96.5 96.8 93.1 81.3 73.5 19.3 36.8Age>65 14.0 1.9 95.9 95.4 88.4 78.9 74.6 19.9 24.8Poor 15.4 2.3 98.4 98.2 96.0 91.6 83.4 19.9 26.5Non-poor 12.4 1.8 98.5 98.9 96.3 92.2 86.5 20.4 19.71st quintile 15.9 2.3 97.9 97.8 96.1 91.6 82.0 19.8 27.02nd quintile 12.5 1.9 98.7 98.7 95.6 91.7 85.7 20.0 22.8third quintile 13.7 2.0 98.4 98.8 96.6 92.5 86.2 20.3 22.1Fourth quintile 13.0 1.9 98.7 98.8 96.4 92.0 86.5 20.5 19.2Better wall 11.2 1.8 98.9 98.9 96.6 92.0 90.1 20.5 16.1Better roof 12.1 1.8 97.2 97.9 94.3 89.5 81.9 20.5 18.9land=0 8.2 1.0 98.7 99.1 96.0 94.7 87.5 19.6 22.40<land<1 15.2 2.2 98.3 98.4 95.9 91.5 83.7 20.0 26.11<land<5 12.5 1.8 98.5 98.7 96.5 91.9 86.1 20.5 19.2land>=5 17.2 2.8 99.1 98.3 95.7 94.0 87.8 20.6 15.5no-schooling 13.9 2.1 98.3 98.3 95.8 90.9 84.0 20.1 23.8At least prima-ry education 13.5 1.7 99.8 99.8 98.7 97.7 91.4 20.7 15.7 Other educa-tion 11.0 1.3 98.7 100.0 97.8 97.3 90.6 20.8 15.0
Source: Author’s Calculation using ERHS (1994-2004)

Appendices 117
Table A4.3Descriptive Statistics of Health Status by Bargaining Power Variables
Bargaining power variables ill
Illness days Functionality
Body mass index
CED(BMIN18.5)
No schooling=0 0.1267 1.576 0.3349 20.73 0.1551
No schooling=1 0.1385 2.08 0.002351 20.1 0.2377
P-value 0.3916 0.0483** 0.0000*** 0.00*** 0.000***
Brought land to mar-riage=0 0.1363 2.009 0.0481 20.17 0.2275
Brought land to mar-riage=1 0.1341 1.866 0.05415 20.58 0.1718
P-value 0.9360 0.7769 0.9604 0.0574* 0.0943*
Brought livestock to marriage=0 0.1411 2.042 0.09538 20.19 0.2295
Brought livestock to marriage=1 0.1151 1.837 -0.1585 20.17 0.2089
P-value 0.0380** 0.3769 0.0000*** 0.8153 0.1788
has brothers=0 0.1439 2187 -0.1968 19.96 0.2675
has brothers=1 0.1349 1956 0.1179 20.25 0.2141
P-value 0.4418 0.2893 0.0000*** 0.0022*** 0.0002***
has children=0 0.1233 1686 -0.4854 20.09 0.2315
has children=1 0.1382 2038 0.1003 20.2 0.2252
p-value 0.3845 0.2648 0.0000*** 0.4417 0.7624
has son=0 0.1451 2.06 -0.05753 20.18 0.2334
has son=1 0.133 1982 0.1009 20.2 0.2222
P-value 0.2457 0.6862 0.0006*** 0.7992 0.3785
has a son>15=0 0.1451 2.06 -0.05753 20.18 0.2334
has son>15=1 0.133 1982 0.1009 20.2 0.2222
P-Value 0.2457 0.6862 0.0006*** 0.7992 0.3785
different ethnicity=0 0.1355 1.972 0.07939 20.18 0.2281
different ethnicity=1 0.1439 2.236 -0.1514 20.23 0.2136
P-value 0.5512 0.3116 0.0003*** 0.6775 0.3979
different religion=0 0.1374 2036 0.04912 20.22 0.2258
different religion=1 0.1292 1727 0.03419 19.87 0.2284
P-value 0.6409 0.3433 0.8515 0.0163** 0.9047

118 WOMEN’S BARGAINING POWER & INTRA-HOUSEHOLD RESOURCE ALLOCATION IN RURAL ETHIOPIA
kidnapped for the marriage=0 0.1341 1983 0.03943 20.24 0.2242
kidnapped for the marriage=1 0.157 2.3 0.1553 19.9 0.2369
P-Value 0.1534 0.2858 0.0961* 0.0066*** 0.5158
Talked to spouse be-fore marriage=0 0.1308 2.039 0.03043 20.12 0.242
Talked to spouse be-fore marriage=1 0.1446 1.972 0.08728 20.33 0.1982
P-Value 0.1733 0.7240 0.2025 0.0106** 0.0004***
has written marital contract=0 0.1529 2.16 0.05729 19.98 0.2525
has written marital contract=1 0.1163 1841 0.04451 20.48 0.1911
P-value 0.0002*** 0.0852* 0.7707 0.0000*** 0.0000***
has richer parents=0 0.1321 1.904 0.06246 20.25 0.2223
has richer parents=1 0.1553 2.386 0.02318 20.12 0.232
P-value 0.0448** 0.0245** 0.4380 0.1555 0.4866
Wife lives in her birth place=0 0.1466 2.229 -0.02255 20.17 0.2297
wife lives in her birth place=1 0.1196 1.643 0.1586 20.21 0.2191
P-value 0.0070*** 0.0016*** 0.0000*** 0.5761 0.3853
*** p<0.01, ** p<0.05, * p<0.1; Source: Author’s Own Calculation using ERHS (1994-2004)
Source Author’s Own Calculation using ERHS (1994-2004)

Appendices 119
Table A4.4Descriptive Statistics of Intra-household Health Inequality
Village Mean difference in body mass index of a husband from that of wife
standardized by community mean
Haresaw 0.001
Geblen -0.002
Dinki -0.002
Yetmen 0.008
Shumsha -0.004
Sirbana Godeti -0.008
Adele Keke -0.002
Korodegaga -0.001
Trirufe Ket-chema 0.002
Imdibir 0.001
Aze Deboa -0.001
Adado -0.001
Gara Godo 0.006
Doma -0.003
Debrebirihan 0.002
Average mean -0.0001
Source Author’s Own Calculation using ERHS (1994-2004)

120 WOMEN’S BARGAINING POWER & INTRA-HOUSEHOLD RESOURCE ALLOCATION IN RURAL ETHIOPIA
Table A4.5Estimation Results of Interaction Effects of Bargaining Power Variables with
Region Dummy on Self Assessed Health Status (OLS)
Incidence of illness Illness daysPooled Random Pooled Random
Wife has at least primary education X North -0.037 -0.038 -0.454 -0.432 (0.028) (0.027) (0.502) (0.504) Wife share of land brought to marriage X North
-0.073 -0.072 -0.214 -0.255
(0.129) (0.131) (2.249) (2.270) Wife has brothers X North 0.027 0.025 0.037 0.025 (0.020) (0.020) (0.485) (0.485) Woman has children X North -0.026 -0.018 -1.372 -1.311 (0.054) (0.055) (1.030) (0.994) Woman has son X North -0.066 -0.063 -0.330 -0.219 (0.046) (0.051) (0.717) (0.763) Woman has a child above 15 years old X North
0.058** 0.060** 1.078** 1.081**
(0.026) (0.026) (0.469) (0.465) Couple have different ethnicity X North -0.003 -0.003 -0.439 -0.443 (0.041) (0.043) (0.825) (0.847) Couple have different religion X North -0.077 -0.077 -0.670 -0.631 (0.051) (0.053) (0.830) (0.897) Wife was kidnapped for marriage X North -0.038 -0.034 -0.806 -0.752 (0.032) (0.032) (0.533) (0.514) Wife talked to spouse before marriage X North
-0.001 0.001 0.293 0.312
(0.033) (0.033) (0.554) (0.554) Couple have written marital contract X North
0.002 0.001 -0.194 -0.202
(0.035) (0.036) (0.663) (0.685) Wife’s parents richer than husbands X North -0.032 -0.029 -0.423 -0.377 (0.026) (0.026) (0.399) (0.403) wife lives in her birth place X North 0.006 0.007 0.382 0.388 (0.024) (0.024) (0.428) (0.416) Age gap X North -0.002 -0.002 -0.008 -0.010 (0.002) (0.002) (0.028) (0.028) Constant 0.030 0.042 -0.420 -0.296 (0.056) (0.061) (0.938) (0.981) Observations 4,180 4,180 4,180 4,180R-squared 0.044 0.031
Cluster adjusted Robust standard errors in parentheses *** p<0.01, ** p<0.05, * p<0.1; Household, individual, community characteristics, and linear effects of bargaining power variables are controlled but not reported
Source: Author’s Own Calculation using ERHS (1994-2004)

Appendices 121
Table A4.6Estimation Results of Interaction Effects of Bargaining Power Variables with
region dummy on the Objective Health Outcomes (OLS)
Functionalityindex Body mass index Chronic energy
Deficiency Pooled Random Pooled Random Pooled Random
Wife has at least primary education X North
0.045 0.006 0.051 0.077 0.009 0.003
(0.197) (0.219) (0.265) (0.260) (0.032) (0.031)Wife share of land brought to marriage X North
-0.497 -0.492 0.862 0.854 -0.227 -0.237
(0.377) (0.351) (1.887) (1.842) (0.343) (0.339)Wife has brothers X North 0.278 0.308 0.210 0.226 -0.024 -0.019 (0.224) (0.238) (0.133) (0.163) (0.029) (0.032)Woman has children X North 0.079 -0.112 -0.125 -0.067 0.008 0.018 (0.344) (0.271) (0.496) (0.387) (0.075) (0.056)Woman has son X North 0.191 0.196 0.585** 0.518*** -0.027 -0.027 (0.133) (0.146) (0.271) (0.181) (0.055) (0.050)Woman has a child above 15 years old X North
-0.019 -0.040 0.380 0.371** -.095** -.094***
(0.168) (0.156) (0.265) (0.176) (0.044) (0.035)Couple have different ethnic-ity X North
0.161 0.216 0.874* 0.998** 0.018 0.011
(0.176) (0.191) (0.412) (0.442) (0.049) (0.050)Couple have different religion X North
-0.356* -0.450** -0.678* -0.614 -0.079 -0.093
(0.188) (0.218) (0.380) (0.397) (0.057) (0.058)Wife was kidnapped for mar-riage X North
-0.199**
-0.27*** -0.063 -0.068 0.021 0.040
(0.085) (0.094) (0.372) (0.385) (0.056) (0.058)Wife talked to spouse before marriage X North
-0.022 -0.036 -0.457 -0.464 0.086 0.085
(0.198) (0.187) (0.318) (0.334) (0.057) (0.059)Couple have written marital contract X North
0.080 0.117 0.376 0.381 -0.110 -0.112
(0.166) (0.166) (0.484) (0.490) (0.067) (0.072)Wife’s parents richer than husbands X North
0.012 0.019 0.013 0.015 0.010 0.012
(0.169) (0.162) (0.247) (0.235) (0.034) (0.033)wife lives in her birth place X North
0.027 0.032 -0.033 -0.077 0.006 0.010
(0.098) (0.108) (0.299) (0.311) (0.030) (0.033)Age gap X North 0.006 0.005 0.009 0.005 -0.001 0.000 (0.013) (0.014) (0.019) (0.019) (0.003) (0.003)Constant -0.962* -1.178** 21.118*** 21.027*** 0.162 0.208 (0.451) (0.476) (0.730) (0.798) (0.121) (0.129)Observations 4,060 4,060 3,882 3,882 4,171 4,171R-squared 0.136 0.104 0.097
Cluster adjusted Robust standard errors in parentheses *** p<0.01, ** p<0.05, * p<0.1; Socioeconomic characteristics, and linear effects of bargaining power variables are controlled but not reported.
Source: Author’s Own Calculation using ERHS (1994-2004)

122 WOMEN’S BARGAINING POWER & INTRA-HOUSEHOLD RESOURCE ALLOCATION IN RURAL ETHIOPIA
Table A4.7Interaction Effects of Assets Brought to Marriage with BP Variables on the
Objective Health Outcomes (OLS)
Functionalityindex
Body massindex
Chronic energy Deficiency
Pooled Random Pooled Random Pooled Random Interaction with Wife’s share of livestock brought to marriage withWife was kidnapped for marriage 0.080 0.017 -0.306 -0.186 0.031 0.010 (0.113) (0.118) (0.412) (0.457) (0.070) (0.075)Couple have written marital contract -0.026 -0.011 0.121 0.266 -0.068 -0.089 (0.222) (0.189) (0.490) (0.445) (0.076) (0.074)Wife talked to spouse before marriage 0.319* 0.312** -0.331 -0.409 0.054 0.058 (0.180) (0.153) (0.390) (0.404) (0.064) (0.069)Couple have different ethnicity -0.672* -0.585* -1.221** -1.072** 0.148** 0.112* (0.345) (0.325) (0.508) (0.529) (0.069) (0.066)Couple have different religion 0.081 -0.077 0.254 0.318 -0.195** -0.219*** (0.376) (0.329) (0.641) (0.541) (0.089) (0.081)age gap 0.025 0.025* 0.021 0.009 0.000 0.002 (0.016) (0.014) (0.020) (0.020) (0.003) (0.003)wife’s parents richer than husband 0.239 0.234 0.070 0.136 -0.022 -0.020 (0.198) (0.186) (0.325) (0.299) (0.043) (0.038)wife has brothers 0.329 0.389 -0.702* -0.701* 0.086* 0.095** (0.369) (0.368) (0.382) (0.370) (0.044) (0.043)wife has children 0.351 0.012 -0.272 -0.310 0.035 0.003 (0.694) (0.509) (0.455) (0.338) (0.069) (0.052)wife lives in her birth place 0.293** 0.244* -0.025 -0.026 0.009 0.002 Interaction with wife’s share of land brought to marriage (0.118) (0.126) (0.378) (0.401) (0.050) (0.056)Wife was kidnapped for marriage -3.29*** -3.30*** -3.467 -3.560 0.742** 0.764** (0.473) (0.565) (3.723) (3.608) (0.321) (0.306)Couple have written marital contract 0.002 0.026 -1.678 -1.703 0.217 0.217 (0.236) (0.220) (1.714) (1.753) (0.163) (0.164)Wife talked to spouse before marriage -0.482** -0.493*** 0.610 0.329 0.006 0.010 (0.182) (0.175) (0.988) (1.015) (0.170) (0.172)Couple have different ethnicity 1.004*** 1.017*** -0.422 0.053 0.380 0.379 (0.334) (0.336) (3.222) (3.331) (0.312) (0.306)Couple have different religion 2.050** 2.080*** 3.738 4.029* -0.456 -0.470 (0.778) (0.778) (2.265) (2.160) (0.416) (0.378)age gap 0.006 0.003 -0.179** -0.187*** 0.025*** 0.026*** (0.015) (0.014) (0.065) (0.072) (0.007) (0.007)wife’s parents richer than husband 0.355* 0.316** 0.754 0.753 -0.112 -0.125 (0.166) (0.148) (1.113) (1.200) (0.204) (0.193)wife has brothers 0.634 0.476 -3.663 -4.044 0.312 0.322 (0.508) (0.425) (3.772) (3.823) (0.264) (0.256)wife has children -0.122 -0.029 -1.504 -0.758 0.279 0.242 (0.358) (0.293) (2.535) (2.007) (0.177) (0.161)wife lives in her birth place 0.231 0.240 -0.727 -0.693 0.115 0.099 (0.287) (0.310) (1.302) (1.370) (0.142) (0.142)Constant -0.650 -0.804* 20.526*** 20.484*** 0.197 0.236* (0.429) (0.436) (0.821) (0.931) (0.133) (0.138)Observations 4,060 4,060 3,882 3,882 4,171 4,171 R-squared 0.154 0.106 0.094
Cluster adjusted Robust standard errors in parentheses *** p<0.01, ** p<0.05, * p<0.1; Socioeconomic characteristics, and linear effects of bargaining power variables are controlled but not reported. Source: Author’s Own Calculation using ERHS (1994-2004)
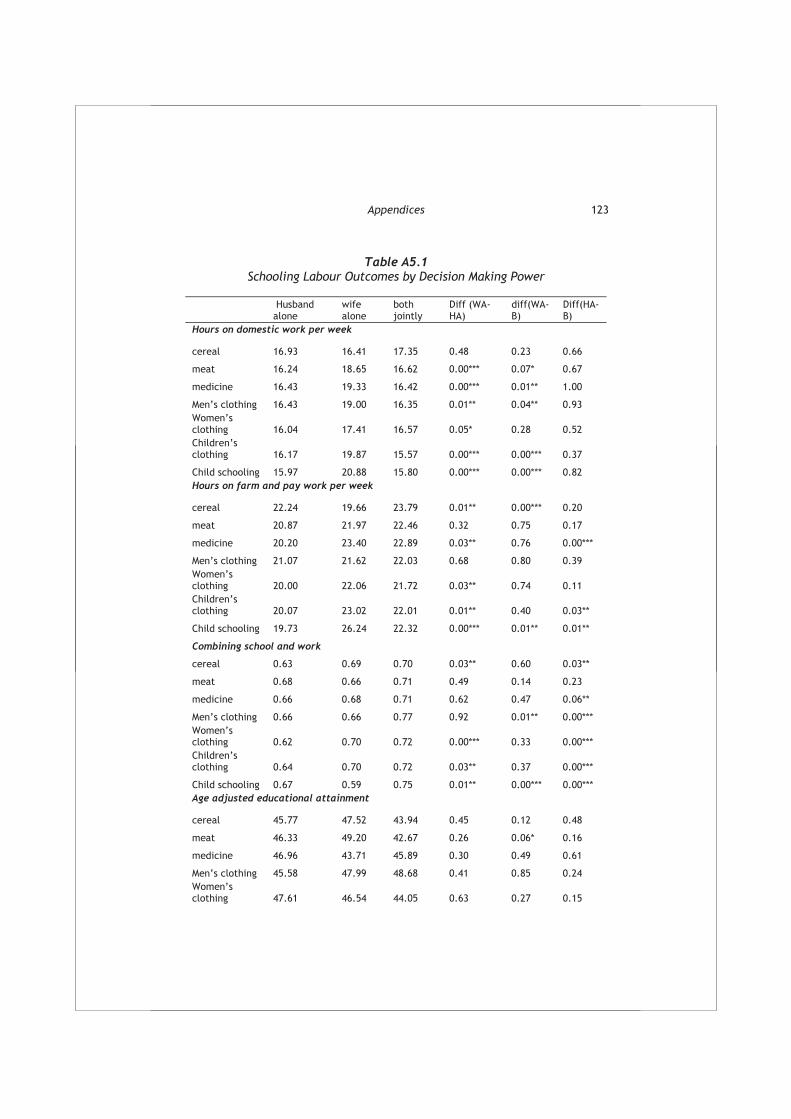
Appendices 123
Table A5.1Schooling Labour Outcomes by Decision Making Power
Husband alone
wifealone
both jointly
Diff (WA-HA)
diff(WA-B)
Diff(HA-B)
Hours on domestic work per week
cereal 16.93 16.41 17.35 0.48 0.23 0.66
meat 16.24 18.65 16.62 0.00*** 0.07* 0.67
medicine 16.43 19.33 16.42 0.00*** 0.01** 1.00
Men’s clothing 16.43 19.00 16.35 0.01** 0.04** 0.93 Women’s clothing 16.04 17.41 16.57 0.05* 0.28 0.52 Children’s clothing 16.17 19.87 15.57 0.00*** 0.00*** 0.37
Child schooling 15.97 20.88 15.80 0.00*** 0.00*** 0.82 Hours on farm and pay work per week
cereal 22.24 19.66 23.79 0.01** 0.00*** 0.20
meat 20.87 21.97 22.46 0.32 0.75 0.17
medicine 20.20 23.40 22.89 0.03** 0.76 0.00***
Men’s clothing 21.07 21.62 22.03 0.68 0.80 0.39 Women’sclothing 20.00 22.06 21.72 0.03** 0.74 0.11 Children’s clothing 20.07 23.02 22.01 0.01** 0.40 0.03**
Child schooling 19.73 26.24 22.32 0.00*** 0.01** 0.01**
Combining school and work
cereal 0.63 0.69 0.70 0.03** 0.60 0.03**
meat 0.68 0.66 0.71 0.49 0.14 0.23
medicine 0.66 0.68 0.71 0.62 0.47 0.06**
Men’s clothing 0.66 0.66 0.77 0.92 0.01** 0.00*** Women’s clothing 0.62 0.70 0.72 0.00*** 0.33 0.00*** Children’s clothing 0.64 0.70 0.72 0.03** 0.37 0.00***
Child schooling 0.67 0.59 0.75 0.01** 0.00*** 0.00*** Age adjusted educational attainment
cereal 45.77 47.52 43.94 0.45 0.12 0.48
meat 46.33 49.20 42.67 0.26 0.06* 0.16
medicine 46.96 43.71 45.89 0.30 0.49 0.61
Men’s clothing 45.58 47.99 48.68 0.41 0.85 0.24 Women’s clothing 47.61 46.54 44.05 0.63 0.27 0.15

124 WOMEN’S BARGAINING POWER & INTRA-HOUSEHOLD RESOURCE ALLOCATION IN RURAL ETHIOPIA
Children’s clothing 45.27 46.23 47.85 0.69 0.53 0.23
Child schooling 47.15 43.54 45.99 0.17 0.41 0.61
Source: ERHS, 2009, Author’s calculation, *** p<0.01, ** p<0.05, * p<0.1, WA and HA refer to wife along and husband alone, respectively.
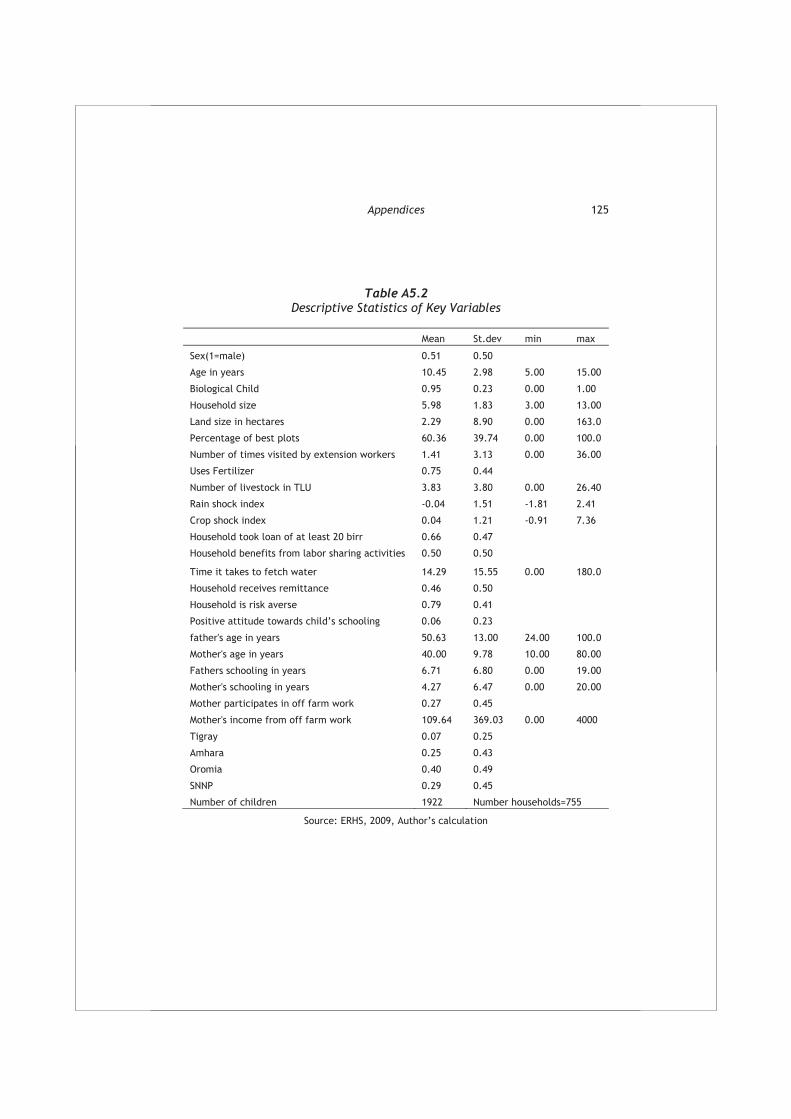
Appendices 125
Table A5.2Descriptive Statistics of Key Variables
Mean St.dev min max
Sex(1=male) 0.51 0.50
Age in years 10.45 2.98 5.00 15.00
Biological Child 0.95 0.23 0.00 1.00
Household size 5.98 1.83 3.00 13.00
Land size in hectares 2.29 8.90 0.00 163.0
Percentage of best plots 60.36 39.74 0.00 100.0
Number of times visited by extension workers 1.41 3.13 0.00 36.00
Uses Fertilizer 0.75 0.44
Number of livestock in TLU 3.83 3.80 0.00 26.40
Rain shock index -0.04 1.51 -1.81 2.41
Crop shock index 0.04 1.21 -0.91 7.36
Household took loan of at least 20 birr 0.66 0.47
Household benefits from labor sharing activities 0.50 0.50
Time it takes to fetch water 14.29 15.55 0.00 180.0
Household receives remittance 0.46 0.50
Household is risk averse 0.79 0.41
Positive attitude towards child’s schooling 0.06 0.23
father's age in years 50.63 13.00 24.00 100.0
Mother's age in years 40.00 9.78 10.00 80.00
Fathers schooling in years 6.71 6.80 0.00 19.00
Mother's schooling in years 4.27 6.47 0.00 20.00
Mother participates in off farm work 0.27 0.45
Mother's income from off farm work 109.64 369.03 0.00 4000
Tigray 0.07 0.25
Amhara 0.25 0.43
Oromia 0.40 0.49
SNNP 0.29 0.45
Number of children 1922 Number households=755
Source: ERHS, 2009, Author’s calculation

126 WOMEN’S BARGAINING POWER & INTRA-HOUSEHOLD RESOURCE ALLOCATION IN RURAL ETHIOPIA
Table A5. 3Tobit Estimation on the Effect of a Woman’s Power over Investment Decision in Human Capital on Hours Children spent on Domestic Work
Hours Spent on Domestic Work
Girls Boys
Coef. Std Err. Coef. Std Err.
Age in years 7.73 (1.59)*** 4.09 (1.18)***
Age squared -0.27 (0.07)*** -0.16 (0.06)***
Biological Child 2.72 (2.54) 1.62 (2.19)
Household size -0.62 (0.31)** -0.48 (0.25)*
Land in hectares -0.02 (0.02) 0.01 (0.02)
Percentage of best plots 0.02 (0.01) 0.02 (0.02)
Number of times visited by extension workers -0.21 (0.21) -0.25 (0.21)
Used fertilizer in the past five years -1.27 (1.25) -0.24 (1.66)
Number of livestock in TLU 0.29 (0.15)** 0.18 (0.22)
Faced Rain shock in the last agricultural season -0.34 (0.35) -0.67 (0.57)
Faced Crop shock in the last agricultural season -0.77 (0.34)** -0.31 (0.34)
Household took loan of at least 20 birr 1.95 (1.31) 1.29 (0.86)
Household benefits from labor sharing activities -1.90 (1.33) -0.70 (1.52)
Household is risk averse -2.12 (1.22)* -0.63 (1.21)
Positive attitude towards children’s schooling -2.66 (1.67) 0.66 (2.00)
Time it takes to fetch water(hrs) 0.03 (0.04) -0.06 (0.06)
Father's age in years 0.05 (0.06) 0.00 (0.10)
Mother's age in years -0.01 (0.05) -0.06 (0.06)
Fathers schooling in years 0.04 (0.06) -0.05 (0.09)
Mother's schooling in years 0.14 (0.08)* 0.17 (0.10)*
Mother participates in non-farm work 0.87 (1.10) -0.22 (0.87)
Mother's income from non-farm work -0.00 (0.00) 0.00 (0.00)*
Presence of Separate finance 0.14 (1.50) -0.32 (2.16)
Number of domains that woman alone decides on exclud-ing human capital investment
0.35 (0.44) 0.84 (0.34)**
Woman alone decides on human capital 1.16 (1.90) 1.34 (1.43)
Husband alone decides on human capital 3.70 (2.68) 0.42 (1.50)
Constant -46.7 (9.87)*** -32.2 (9.95)***
Log pseudo likelihood 11.82 (1.00)*** 11.21 (0.84)***
Observations 897 929
Cluster adjusted robust standard errors in parentheses, *** p<0.01, ** p<0.05, * p<0.1, season and village fixed effects are controlled.
Source: Author’s Own Calculation using ERHS (2009).

Appendices 127
Table A5.4Tobit Estimation on the Effect of a Woman’s Power over Investment Decision in Human Capital on Hours children spent on Economic Work
Hours Spent on Economic Work
Girls Boys
Coef. Std Err. Coef. Std Err. Age in years 6.60 (2.14)*** 9.29 (1.92)***
Age squared -0.30 (0.10)*** -0.37 (0.09)***
Biological Child 3.41 (3.86) -2.41 (3.42)
Household size -0.97 (0.58)* -0.46 (0.31)
Land in hectares -0.73 (0.97) -0.03 (0.03)
Percentage of best plots 0.07 (0.04)** 0.02 (0.02)
Number of times visited by extension workers -0.21 (0.30) 0.17 (0.12)
Used fertilizer in the past five years 3.96 (3.82) 0.63 (2.19)
Number of livestock in TLU 0.70 (0.34)** 0.36 (0.22)*
Faced Rain shock in the last agricultural season -0.25 (1.49) -0.74 (0.61)
Faced Crop shock in the last agricultural season 0.81 (1.14) 0.32 (0.60)
Household took loan of at least 20 birr 5.26 (1.78)*** -0.58 (1.26)
Household benefits from labor sharing activities -1.92 (2.88) -1.41 (1.11)
Household is risk averse 2.17 (2.70) 2.22 (1.89)
Positive attitude towards children’s schooling 1.85 (4.27) -0.07 (2.13)
Time it takes to fetch water(hrs) -0.02 (0.05) 0.01 (0.05)
Father's age in years -0.03 (0.17) 0.17 (0.13)
Mother's age in years 0.04 (0.13) 0.02 (0.09)
Fathers schooling in years -0.22 (0.21) -0.11 (0.10)
Mother's schooling in years -0.13 (0.20) 0.00 (0.08)
Mother participates in non-farm work -1.21 (2.03) -1.05 (1.52)
Mother's income from non-farm work -0.00 (0.00) -0.00 (0.00)
Presence of Separate finance -5.56 (3.84) -0.55 (2.11)
Number of domains that woman alone decides on ex-cluding human capital investment
0.22 (0.66) -0.86 (0.58)
Woman alone decides on human capital 2.28 (2.22) -1.37 (1.31)
Husband alone decides on human capital 2.62 (5.76) 2.94 (2.54)
Constant -36.1 (18.09)** -35.1 (13.15)***
Log pseudo likelihood 20.44 (1.89)*** 16.03 (1.02)***
Observations 897 929
Cluster adjusted Robust standard errors in parentheses *** p<0.01, ** p<0.05, * p<0.1, season and village fixed effects is controlled.
Source: Author’s Calculation Based on ERHS (2009)

128 WOMEN’S BARGAINING POWER & INTRA-HOUSEHOLD RESOURCE ALLOCATION IN RURAL ETHIOPIA
Table A5.5Marginal Effects of Probability of attending School for Children aged 5-15
Girls Boys
Coef. Std Err. Coef. Std Err. Age in years 0.33 (0.04)*** 0.28 (0.04)***
Age squared -0.01 (0.00)*** -0.01 (0.00)***
Biological Child -0.01 (0.05) 0.08 (0.06)
Household size 0.03 (0.01)*** 0.02 (0.01)
Land in hectares 0.03 (0.01)** -0.00 (0.00)***
Percentage of best plots 0.00 (0.00) -0.00 (0.00)
Number of times visited by extension workers 0.00 (0.00) 0.00 (0.00)
Used fertilizer in the past five years 0.03 (0.06) 0.04 (0.06)
Number of livestock in TLU -0.01 (0.00)*** 0.00 (0.01)
Faced Rain shock in the last agricultural season 0.01 (0.01) -0.00 (0.02)
Faced Crop shock in the last agricultural season -0.02 (0.01)** -0.01 (0.01)
Household took loan of at least 20 birr -0.01 (0.03) 0.01 (0.03)
Household benefits from labour sharing activities 0.04 (0.04) 0.01 (0.04)
Household is risk averse -0.01 (0.04) -0.08 (0.04)*
Positive attitude towards children’s schooling 0.11 (0.04)*** -0.05 (0.05)
Time it takes to fetch water(hrs) -0.00 (0.00)** -0.00 (0.00)
Father's age in years -0.00 (0.00) 0.00 (0.00)
Mother's age in years -0.00 (0.00) -0.00 (0.00)
Fathers schooling in years 0.00 (0.00)* 0.01 (0.00)***
Mother's schooling in years -0.00 (0.00) -0.01 (0.00)**
Mother participates in non-farm work 0.08 (0.03)*** 0.04 (0.03)
Mother's income from non-farm work -0.00 (0.00) -0.00 (0.00)
Presence of Separate finance 0.14 (0.05)*** 0.07 (0.04)
Number of domains that woman alone decides on exclud-ing human capital investment
0.00 (0.01) 0.03 (0.01)**
Woman alone decides on human capital -0.08 (0.03)*** -0.06 (0.04)
Husband alone decides on human capital -0.08 (0.04)* -0.19 (0.05)***
Observations 897 929
Log pseudo likelihood -356.87 -409.83
Pseudo R2 0.37 0.28
chi2 2824.28*** 800.45***
Cluster adjusted Robust standard errors in parentheses *** p<0.01, ** p<0.05, * p<0.1, season and village fixed effects is controlled.
Source: Author’s calculation Based on ERHS (2009)

Appendices 129
Table A5.6Tobit Estimation of Age Adjusted Education Attainment (SAGE)
for Children 7-15
Girls Boys Coef. Std Err. Coef. Std Err.
Age in years 19.88 (9.46)** 22.36 (5.86)*** Age squared -0.72 (0.40)* -0.76 (0.25)*** Biological Child 14.96 (6.43)** 16.54 (5.87)*** Age that child begin working -2.82 (1.17)** 0.34 (1.13) Hours spent on domestic work -0.23 (0.16) 0.35 (0.24) Hours spent on farm work -0.37 (0.09)*** -0.20 (0.27) Household size 2.28 (0.96)** 0.30 (1.06) Land in hectares -0.04 (0.07) 0.30 (0.08)*** Percentage of best plots -0.05 (0.07) -0.07 (0.04) Number of times visited by extension workers 0.90 (0.64) 2.37 (0.60)*** Used fertilizer in the past five years 13.50 (7.38)* 9.03 (5.59) Number of livestock in TLU -0.66 (0.75) -1.03 (0.90) Faced Rain shock in the last agricultural season -3.61 (1.51)** 0.17 (1.45) Faced Crop shock in the last agricultural season 1.54 (1.67) -1.62 (2.09) Household took loan of at least 20 birr -1.46 (3.86) -7.44 (2.69)*** Household benefits from labour sharing activities 4.45 (5.65) -0.06 (4.36) Household is risk averse -3.17 (6.03) 0.24 (5.05) Positive attitude towards children’s schooling 4.21 (5.73) -15.72 (4.16)*** Time it takes to fetch water(hrs) -0.25 (0.13)* 0.08 (0.14) Father's age in years -0.39 (0.25) -0.05 (0.30) Mother's age in years 0.45 (0.18)** 0.18 (0.25) Fathers schooling in years 0.18 (0.40) -0.21 (0.24) Mother's schooling in years 0.25 (0.38) -0.32 (0.27) Mother participates in non-farm work -4.00 (4.78) -11.49 (3.13)*** Mother's income from non-farm work 0.01 (0.01) 0.02 (0.00)*** Presence of Separate finance 4.85 (7.04) -3.01 (6.42) Number of domains that woman alone decides on excluding human capital investment
0.10 (1.25) 0.79 (1.99)
Woman alone decides on human capital -2.73 (4.57) 0.22 (4.17) Husband alone decides on human capital -1.13 (6.37) -3.71 (7.15) Constant -
99.10 (60.53) -
114.05 (40.29)***
Observations 748 787Log pseudo likelihood -3066.13 -3309.65 Pseudo R2 0.0364 0.029chi2 186.93*** 99.06***
Cluster adjusted Robust standard errors in parentheses *** p<0.01, ** p<0.05, * p<0.1, season and village fixed effects is controlled.
Source: Author’s calculation based on ERHS (2009)

130
References
Abaynesh, M. (2001) ‘Women and Land Ownership in Ethiopia, Paper pre-sented at the Advocacy Model report in Ethiopia’, Addis Ababa, Ethio-pia.
Adair, L. (1991) ‘Weight-for Height and Body Mass Index in Non-pregnant Women’ In: K. Krasovec and M.A. Anderson (eds.), Maternal Nutrition and Pregnancy Outcomes. Results of the meeting 'Maternal Anthropometry for Pre-diction of Pregnancy Outcomes,Washington DC: Pan American Health Or-ganization.
African Development Bank (2008) ‘Social Development, Gender and Inclu-sion’, the African Development Bank Group.
Agarwal, B. (1986) Cold hearts and barren slopes. The Woodfuel Crisis in the Third World. Zed Books: London.
__________ (1994) A Field of One’s Own: Gender and Land Rights in South Asia, Cambridge: Cambridge University Press.
__________ (1997) ‘Bargaining and Gender Relations: Within and Beyond the Household’, Feminist Economics 3(1):1-51
Ainsworth, M., Beegle, K.,and Nyamete, A.(1996) ‘The Effect of Women's Schooling on Fertility and Contraceptive Use: A Study of Fourteen Sub-Saharan African Countries’, The World Bank Economic Review 10(l):85-122.
Ainsworth, M., Beegle, K., and Godlike, K.G. (2000) The effect of adult mortality on Primary School Enrolment in North-western Tanzania, pa-per prepared with support from UNAIDS.
Aizer, A. (2010) ‘The gender wage gap and Domestic Violence, American Economic Review, Forthcoming
Alderman, H and Paxson, C. (1992) ‘Do the Poor Insure?: A synthesis of the literature on Risk and Consumption in Developing Countries’, World Bank Policy Research Working paper series ,No.1008.

References 131
Alderman,H.,Chiappori,A.P,L.,Haddad,L., Hoddinott,J andKanbur,R.(1995) ‘Unitary versus Collective Household Models: Is it time to shift the Bur-den of Proof?’, World Bank Research Observer 10:1-9.
Amin, S. and Lloyd, C. (2002) ‘Women’s lives and rapid fertility decline: Some lessons from Bangladesh and Egypt’, Population Research and Policy Review 21: 275–317.
Angrist, J. (2002) ‘How Do Sex Ratios Affect Marriage And Labor Markets? Evidence from America's Second Generation’, The Quarterly Journal of Economics 117(3): 997-1038.
Baker, M., Stabile,M. and Deri, C. (2001) ‘What do Self -reported, objective, measures of health measure’, NBER working paper No. 8419.
Basu, A. M. (1993) ‘Women's roles and Gender gap in Health and Survival’, Economic and Political Weekly 23 (October): 2356–62.
Basu, A.M., Roy, S. K., Mukhopadhyay, B., Bharati, P., and Gupta, R.(1986) ‘Sex bias in Intra-household Food Distribution’, Current Anthropology 27:536-39
Basu, K. (2006) ‘Gender and Say: A Model of Household Behavior with Endogenously-determined Balance of Power’, Economic Journal 116(511):558-580.
Barros, R., Fox, L. and Mendonca, R. (1997) ‘Female-Headed Households, Poverty, and the Welfare of Children in Urban Brazil’, Economic Develop-ment and Cultural Change 45 (2): 231-57.
Basu, K., and Tzannatos, Z., (2003) ‘The Global Child Labor Problem: What do we know and what can we do?’ The World Bank Economic Review 17(2):147-173.
Becker, G. (1965) ‘A Theory of the Allocation of Time’, Economic Journal 75:493-517.
_______ (1973) ‘A Theory of Marriage’, Journal of Political Economy 81(4):813. Becker, S., Fannie Fonseca-Becker, F., and Schenck-Yglesias, C. (2005)
‘Husbands’ and Wives’ Reports of Women’s Decision-making Power in Western Guatemala and their effects on preventive Health Behaviours’, Social Science and Medicine 62(9): 2313-2326
Beegle, K. (2005) ‘Labor Effects of Adult Mortality in Tanzanian House-holds’, Economic Development and Cultural Change 53:655–683.
Beegle, K., Frankenberg, E. and Thomas, D. (2000) ‘Bargaining power with-in Couples and Use of Prenatal and Delivery Care in Indonesia’, Studies in Family Planning 32(2):130-146.

132 WOMEN’S BARGAINING POWER & INTRA-HOUSEHOLD RESOURCE ALLOCATION IN RURAL ETHIOPIA
Beegle, K., Dehejia,R., and Gatti R. (2006) ‘Child Labour and Agricultural shocks’, Journal of Development Economics 81: 80-96.
Behrman,J. (1988) ‘ Intra-household Allocation of Nutrients in Rural India: Are Boys Favored? Do Parents Exhibit Inequality Aversion?’ Oxford Eco-nomic Papers 40(1):32-54.
Benefice E., Simondon K, and Malina R.M. (1996) ‘Physical activity patterns and anthropometric changes in Senegalese women observed over a complete seasonal cycle’, American Journal Human Biology 8:251–261.
Berhane,Y, Gossay,Y and Hogberg,U.(2001) ‘Women’s Health in Rural Set-ting in Societal Transition in Ethiopia’, Social Science and Medicine 53(11):1525-1539.
Bério, Ann-Jacqueline (1984a) ‘The Analysis of Time Allocation and Activi-ty Patterns in Nutrition and Rural Development Planning’, Food and Nu-trition Bulletin 6 (1): 53-68.
Bevan, P. and Pankhurst, A. (1996) ‘Ethiopian Village Studies’, Mimeo, Centre for the Study of African Economies, University of Oxford.
Bhalotra .S and Heady, C. (2001) ‘Child Farm Labour: The Wealth Paradox’, Social Protection Discussion Papers Series No. 125, Human Develop-ment Network, The World Bank
Bhalotra S. (2001) Is Child Work Necessary? Social Protection Discussion Paper Series No. 0121, Human Development Network, the World Bank
Bittman, M., E., P., Sayer, L., Folbre, N., and Matheson, G. (2003) ‘When does gender trump money? Bargaining and time in household work’, American Journal of Sociology 109:186–214.
Blumberg, R. L., and Coleman, M. T. (1989) ‘A theoretical look at the bal-ance of Power in the American couple’, Journal of Family Issues 10: 225–250.
Blunch, N. and Verner, D. (2001) ‘Revisiting the Link Between Poverty and Child Labour: The Ghanaian Experience’, Centre for Labour Market and Social Research, Working Paper 01-03.
Blundell.R and MacCurdy, T. (1999) ‘Labor Supply: A Review of Alternative Approaches” In: Handbook of Labor Economics , Ashenfelter.O and Card. D. (eds), Amsterdam: North Holland.
Browning, M., Bourguignon F., Chiappori P.A., and Lechene, V. (1994) ‘In-comes and Outcomes: A Structural Model of Intra-Household Alloca-tion’, Journal of Political Economy 102, 1067-1096.

References 133
Browning M. and. Chiappori P.A. (1998) ‘Efficient Intra-Household Alloca-tions: a General Characterization and Empirical Tests’, Econometrica 66: 1241-1278.
Brunner, E. and Marmot, M. (2006) ‘Social Organization, Stress and health’, in Social determinants of Health ,Marmot, M. and Wilkinson R. G.(eds), Ox-ford University press: New York
Buchman,C.(2000) ‘Family Structure, Parental Perceptions, and Child La-bour in Kenya: What Factors Determine Who is Enrolled in School?’, Social Forces (78)4: 1349-1378
Buor, D. and Bream, K. (2004) ‘An Analysis of the Determinants of Mater-nal Mortality in Sub-Saharan Africa’, Journal of Women’s Health 13(8): 926-938.
Bussey, K., & Bandura, A. (1999) ‘Social cognitive theory of gender devel-opment and differentiation’, Psychological Review (106): 676-713.
Buvini , M. and Gupta, G.R. (1997) ‘Female-Headed Households and Fe-male-Maintained Families: Are They Worth Targetting to Reduce Pov-erty in Developing Countries?,’ Economic Development and Cultural Change, Vol. 45 (2):259-80.
Buvini .M., Medici.A., Fernández.E., and Torres A. C. (2006) ‘Gender Dif-ferentials in Health’, in Disease Control Priorities in Developing Coun-tries. eds. Jamison D.T, Breman J.G, Measham A.R, et al., World Bank:Washington (DC).
Carter, M., and Katz, E.(1997) ‘Separate Spheres and the Conjugal Con-tract,’ In: Intra household Resource Allocation in Developing Countries: Models, Methods, and Policy, Lawrence Haddad, John Hoddinott, and Harold Al-derman, (eds) pp. 95 – 111. Baltimore: Johns Hopkins University Press.
CARE(2006)‘Women’s Empowerment,’ www.care.org/newsroom/whitepapers/women_and_Empowerment
Casterline, John B., Lindy Williams, and Peter McDonald.(1986) ‘The age difference between spouses: Variation among developing countries’, Pop-ulation Studies 40(3): 353-374.
Ceballo,R., Ramirez, C., Castillo.M. and Caballero, G. A. (2004) ‘Domestic Violence and Women’s mental health in Chile’, Psychology women quarterly 28: 298-304
Central Statistics Agency (2007) ‘Population and Housing Census’, Ethiopian National Statistics Abstract.

134 WOMEN’S BARGAINING POWER & INTRA-HOUSEHOLD RESOURCE ALLOCATION IN RURAL ETHIOPIA
Chen, Lincoln C., Emdadul Huq, and Stan D'Souza. (1981) ‘Sex bias in the family Allocation of Food and Health care in Rural Bangladesh’, Popula-tion and Development Review 7(1): 55-70.
Chernichovsky, D. (1985) ‘Socioeconomic and Demographic Aspects of School Enrollment and Attendance in Rural Botswana.’ Economic Devel-opment and Cultural Change 33(2):319-32.
Chiappori,P.A., Fortin ,B., and Lacroix,G.(2002) ‘Marriage Market, Divorce Legislation, and Household Labour Supply’, Journal of Political Economy 110(1): 37-72.
Christiaensen, L., and Alderman, H. (2004) ‘Child Malnutrition in Ethiopia: Can Maternal Knowledge Augment the Role of Income?’ Economic Devel-opment and Cultural Change 52:287-312.
Cochrane, S.H. (1990) ‘Education, Income and Desired Fertility in Egypt: A Revised Perspective’, Economic Development and Cultural Change (38), 313-339.
Cockburn,J.,(2004) ‘Child Labor Versus Education: Poverty Constraints or Income Opportunities?’, Mimeo, Nuffield College, Oxford University.
Coltrane, S. (2000) ‘Research on Household Labor: Modeling and Measur-ing the Social Embeddedness of Routine Family Work’, Journal of Mar-riage and the Family 62:1208-33.
Costa, D. L. (2002) ‘Changing Chronic Disease rates and long term declines in functional limitations among older men’, Demography 39(1): 119-137.
Dayioglu M. and Assad, R. (2006) ‘Determinants of Child Labour in Urban Turkey’, Journal of Development Studies (42): 939-956
De Graff, D, Billsborrow, R., and Merrin, A. (1993) The Implications of High Fertility for Children’s Time Use in the Philippines, In: Fertility, Family Size and Structure, C. Lloyd (eds), 297-329, Population Council: New York.
Department for International Development (DFID) (1999) Guidelines for the analysis of gender and health, Liverpool School of Tropical Medicine: Liverpool.Dercon, S and Krishna, P. (2000) ‘In Sickness and In Health: Risk Sharing
within Households in Rural Ethiopia’, Journal of Political Economy 108 (10). Dercon, S. (2001) ‘Assessing Vulnerability to Poverty’, Mimeo, Jesus Col-
lege, Oxford, and Centre for the Study of African Economies (CSAE), Department of Economics, Oxford University.
Dercon, S. (2002) ‘Income Risk, Coping Strategies, and Safety Nets’, The World Bank Economic Observer 17(2):141-166.
References 135
Dercon, S. and Hoddinott, J. (2004) ‘Health, Shocks and Poverty Persis-tence’, in S. Dercon (Ed.) Insurance against Poverty, Oxford: Oxford Uni-versity Press.
Dercon, S., and Hoddnitt, J. (2005) ‘Livelihoods, Growth, and Links to Market Towns in 15 Ethiopian Villages’, Washington D.C.: International Food Policy Research Institute
Dercon,S., Hoddinott, J. and Woldehanna, T. (2008) ‘Shocks and Consump-tion in 15 Ethiopian Villages, 1999-2004’, Journal of African Economies doi:10.1093/jae/eji022
Dollar and Gatti, (1999) ‘Gender Inequality, Income, and Growth: Are Good Times Good for Women’, Policy Research Report on Gender and Development Working Paper Series, No.1
Doss, C. (1997) ‘The effects of women’s bargaining power on household health and education outcomes: Evidence from Ghana’, Paper presented at the Population Association of America Annual Meetings, March 27-29, Washington, D.C.
Doss, C., McPeak, J. and Barrett, C.B. (2008) ‘Interpersonal, Intertemporal and Spatial Variation in Risk Perceptions: Evidence from East Africa’, World Development 36(8): 1453-68.
Doss, C.R. (1996) ‘Intra household Resource Allocation in an Uncertain Environment’, American Journal of Agricultural Economics 78:1335–1339.
Duflo, E., and Udry, C. (2004) ‘Intra household Resource Allocation in Cote d'Ivoire: Social Norms, Separate Accounts and Consumption Choices’, NBER working paper No.W10498.
Duryea, S. (1998) ‘Children’s Advancement through School in Brazil: The Role of Temporary Shocks to Household Income’, Office of the Chief Economist, Working Paper Series 376. Inter- American Development Bank, Washington D.C.
Ellis, F. and Woldehanna, T. (2005) ‘Ethiopia Participatory Poverty As-sessment 2004-05’, Forthcoming.
Elson, D. (1998) ‘The Economic, the Political and the Domestic: business-es, States and Households in the Organization of Production’, New Politi-cal Economy 3(2): 189-208.
Emerson, P. and A. Souza (2007) ‘Child Labour, School Attendance and Intra-Household Gender Bias in Brazil’, World Bank Economic Review 21(2):301-316.

136 WOMEN’S BARGAINING POWER & INTRA-HOUSEHOLD RESOURCE ALLOCATION IN RURAL ETHIOPIA
Endeley, J. B. (2001) ‘Conceptualizing Women's Empowerment in Societies in Cameroon: how does money fit in?’, Gender and Development 9:1:34-41.
Engle, P., and Nieves, I. (1993) ‘Intra-household Food Distribution among Guatemalan Families in a Supplementary feeding Program: Behavior Pat-terns’, Social Science Medicine 36(12):1605–1612
Ersado, L. (2005) ‘Child labor and School decisions in urban and rural areas: comparative evidence from Nepal, Peru, and Zimbabwe’, World Develop-ment 33: 455-480.
Fafchamps, M and Quisumbing, A. (1998) ‘Human Capital Productivity and Labor Allocation in Rural Pakistan’, Journal of Human Resources 34(2):369-406.
Fafchamps, M and Quisumbing, A. (2002) ‘Control and Ownership of As-sets within Rural Ethiopian Households’, Journal of Development Studies (38): 47-82.
Fafchamps, M. (1999) ‘Risk Sharing and Quasi Credit’, Journal of International Trade and Economic Development (8)3: 257-78.
Fafchamps, M.,Kebede, B, and Quisumbing, A. ( 2009) ‘Intrahousehold Welfare in Rural Ethiopia’, Oxford Bulletin of Economics and Statistics 71(4): 567-599
Floud, R., Wachter, K. W., Gregory, A. (1990) ‘Height, Health and History: Nutritional Status in the United Kingdom, 1750-1980’, Cambridge Uni-versity Press: Cambridge.
Fogel, R. W. (1993) ‘New Sources and New techniques for the study of sec-ular trends in nutritional status, health, and mortality, and the process of aging’, Historical Methods 26, 5-43.
Folbre, N. (1997) ‘Gender Coalitions: Extrafamily Influences on Intrafamily Inequality’, In: Intra-household Resource Allocation in Developing Countries: Methods, Models and Policies, Haddad.L, Hoddinott,J. and Alderman, H (eds.), Baltimore, MD: Johns Hopkins University Press.
Frank, E. (1999) ‘Gender, Agricultural Development and Food Security in Amhara, Ethiopia: The Contested Identity of Women Farmers in Ethio-pia’, Mimeo, USAID-Ethiopia.
Frankenberg, T., and Thomas, D. (2001) ‘Measuring Power’, FCND Work-ing Paper No.113.
Friedberg,L.,and Webb, A. (2006) ‘Determinants and Consequences of Bar-gaining Power in Households’, NBER Working Paper No.12367.

References 137
Furuta, M and Sarah Salway, S.(2006) ‘Women’s Position within the House-hold as a Determinant of Maternal Health Care Use in Nepal’, Interna-tional Family Planning Perspectives 32(1):17–27
Gershuny, J., and Robinson, J.P. (1988) ‘Historical Changes in the House-hold Division of Labour’, Demography 25: 537-52.
Gjerdingen D, McGovern P, Bekker M, Lundberg U, Willemsen T.( 2000) ‘Women's work roles and their effect on health, well-being, and career: comparisons between the United States, Sweden, and The Netherlands’, Women’s Health 31(4): 1-20
Gitter, S.R., Barham, B.L.(2008) ‘Women's power, conditional cash trans-fers, and schooling in Nicaragua’, World Bank Economic Review, 22(2):271-290.
Glick, P. and Sahn, D.E. (1998) ‘Schooling of Girls and Boys in West Afri-ca: the effects of Parental education, Income and Household Structure’, Economics of Education Review 19(1):63-87.
Goldstein, M. (1999) ‘Chop Time, No Friends: Examining Options for In-dividual Insurance in Southern Ghana’, Manuscript, Department of Ag-ricultural and Resource Economics, University of California, Berkeley.
Grootaert, C. and Kanbur, R. (1995) ‘Child labour: A Review’, Background Paper prepared for World Development Report on Labour.
Grootaert, C. and Kanbur, R. (1995) ‘Child Labor: An Economic Perspec-tive’, International Labor Review 134(2): 187-203.
Grossbard-Shechtman, A. (1984) ‘A theory of Allocation of Time in Mar-kets for Labor and Marriage’, Economic Journal 94: 863-882.
Grossbard-Shechtman, S. A. and Shoshana, N. (1988) ‘Women’s Labor Supply and Marital Choice’, Journal of Political Economy 96: 1294-1302.
Grossbard-Shechtman, S. A. and Neideffer, M. (1997) ‘Women’s Hours of Work and Marriage Market Imbalances’, In Economics of the Family and Family Policies, Persson, I., and Jonung. C. (eds), Routledge: London.
Govindasamy, P., and Malhotra, A.(1996) ‘Women’s position and family planning in Egypt’, Studies in Family Planning 27(6):328-340.
Guarcello, L., S. Lyon, F. Rosati, C. V. (2004) ‘The influence of orphanhood on Children’s Schooling and Labor: Evidence from Sub Saharan Africa’, Working Paper No. 13 (Understanding Children's Work, Rome, Italy).
Gunnarsson, V., P. Orazem,P. and M. Sanchez (2006) ‘Child labor and school achievement in Latin America’, World Bank Economic Review 20: 31-54.

138 WOMEN’S BARGAINING POWER & INTRA-HOUSEHOLD RESOURCE ALLOCATION IN RURAL ETHIOPIA
Gupta, S. (2006b) ‘Her money, her time: Women's earnings and their housework hours’, Social Science Research 35(4): 975-999.
Gupta, S., Ash, M.(2006) Whose Money, Whose Time? A Nonparametric Approach to Modeling Time Spent on Housework’, University of Mas-sachusetts, Department of Economics, Working Paper series, No. 06.
Gupta, N, and Stratton. L. (2008) ‘Institutions, Social Norms, and Bargain-ing Power: An Analysis of Individual Leisure Time in Couple House-holds’, Working Papers 0806, VCU School of Business, Department of Economics.
Haddad, L., and Kanbur, R. (1990) ‘Are better off households more unequal or less unequal ?’, Policy Research Working Paper Series 373, The World Bank.
Handa, S. (1999) ‘Maternal Education and Child Height’, Economic Develop-ment and Cultural Change 47(2): 421-439.
Hari, J. (2010) ‘Kidnapped, Raped, Married: The extraordinary rebellion of Ethiopia's abducted wives’, The Independent.
Haswell, Margaret (1981a) Energy for Subsistence, the Macmillan Press Ltd: London.
Haswell, Margaret (1981b) ‘Food Consumption in Relation to Labour Out-put. In: Seasonal Dimensions to Rural Poverty. Chambers, Longhurst and Pacey (eds.), Francis Printer Ltd: London.
Heady, B.(2003) ‘The Effect of Child Labour on Learning Achievement’, World Development (31) 2: 385–398.
Hindin, M, J. (2000) ‘Women's Power and Anthropometric Status in Zim-babwe’, Social Science & Medicine 51:1517-1528.
Hoddinott J, and Kinsey B. (2001) ‘Child growth in time of drought’, Oxford Bulletin of Economics and Statistics 63 (4): 409-436.
Hoddinott, J. (2006) ‘Shocks and their consequences across and within households in Rural Zimbabwe’, Journal of Development Studies (42) 2:301-321.
ICRW ( 2007). ‘How to End early child marriage: action strategies for pre-vention and protection’, International Center for Research on Women, Policy Brief.
IDA (2008) ‘Ethiopia: Women’s Income rise’, World Bank Report. Idler E.L, and Benyamin, Y. (1997) ‘Self-rated health and mortality: a Re-
view of twenty-seven community studies’, Journal of Health and Social Be-havior 38: 21- 37.

References 139
Ilahi, N. (2000) ‘The Intra household Allocation of Time and Tasks: What have We learnt from Empirical Literature?’, World Bank Policy Research Report on Gender and Development Working Paper Series, No.13
Illahi, N. (2001) ‘Children’s Work and Schooling: Does Gender Matter? Ev-idence from the Peru LSMS Panel Data’, Paper for The Policy Research Report on Gender, The World Bank.
International Labour Organization (2006) ‘World Labour Report’, Geneva. Jacoby, H. G. and Mansuri, G. (2006) ‘Watta Satta: Bride Exchange and
Women’s Welfare in Rural Pakistan’, Washington, DC: The World Bank. Jejeebhoy, S.J. (1995) Women's Education, Autonomy, and Reproductive Behaviour:
Experience from Developing Countries, Oxford: England, Clarendon Press. Jensen, P., and Helena Skyt Nielsen, H. S. (1997) ‘Child Labor or school
attendance? Evidence from Zambia’, Journal of Population Economics 10(4):407-424.
Jimenez, M. H. and Newton,N. (1979) ‘Activity and Work During Pregnan-cy and the Postpartum Period: A crosscultural study of 202 societies’, American Journal of Obstetrics and Gynecology 135 (2): 171-176
Kabeer, N. (1999) ‘Resources, agency, achievement: reflections on the measurement of women's empowerment’, Development and Change 30(3):435-464.
Kabeer, N. (2003) Gender Mainstreaming in Poverty Eradication and the Millenni-um Development Goals: A Handbook for Policy Makers and Other Stakeholders, Common Wealth Secretariat and Routledge.
Kabeer, N. (2008) ‘Paid Work, Women’s Empowerment and Gender Jus-tice: Critical Pathways of Social Change’, Pathways Brief issue 3.
Khan, M.E., Ghosh D.S., and Bairathi, S. (1983) ‘Women and Health - A Case Study in Sex Discrimination’, Proceedings of the ICMR Workshop on Child Health, Nutrition and Family Planning, Bangalore
Katz S, Ford A., Moskovitz , R.W, et al. (1963) ‘Studies of illness in the aged: the index of ADL’, JAMA 185:914.
Kebede,B. (2000) ‘Intra-household Distribution of Expenditures in Rural Ethiopia: A Demand Systems Approach’, Mimeo, Centre for the Study of African Economies and St. Anthony’s College, Oxford University.
King, Elizabeth M. and Mason, A. (2000) Engendering Development: Gender Equality in Rights, Resources, and Voice, New York: Oxford University Press for the World Bank.

140 WOMEN’S BARGAINING POWER & INTRA-HOUSEHOLD RESOURCE ALLOCATION IN RURAL ETHIOPIA
Kirigia,J., Sambo, L., Nganda, B., Mwabu, G., Chatora, R. and Mwase, T. (2005) ‘Determinants of health insurance ownership among South Afri-can Women’, BMC Health Services Research 5(17).
Klasen, S.(1999) ‘Does Gender Inequality Reduce Growth and Develop-ment? Evidence from Cross-Country Regressions’, World Bank Policy Research Report on Gender and Development, Working Paper Series, No. 7.
Klaveren,V.C.,Prag,V.B., and Massen, V. H. (2006) ‘A Collective Household Model of Time Allocation - A Comparison of Native Dutch and Immi-grant Households in the Netherlands’, IZA Discussion Paper,No.2172.
Kochar, A. (1995) ‘Explaining household vulnerability to idiosyncratic in-come shocks’, American Economic Review 85(2):159-63
Kochar, A. (1999) ‘Smoothing Consumption by Smoothing Income: Hours-of-Work Responses to Idiosyncratic Agricultural Shocks in Rural India’, Review of Economics and Statistics 81(1): 50-61.
Kochar,A. (1995) ‘Explaining Household Vulnerability to Idiosyncratic In-come Shocks’, The American Economic Review (85)2:159-64.
Lang, K. and Ruud, P. (1986) ‘Returns to Schooling, Implicit Discount Rates and Black-White Wage Differentials’, Review of Economics and Statis-tics 68: 41-47.
Lam, D. and Duryea, S.(1999) Effects of Schooling, Labour Supply and In-vestment in Children, Evidence from Brazil’, The Journal of Human Re-sources (34)1:160-190
LaMontagne, J., Engle, P.L., and Zeitlin, M. (1998) ‘Maternal Employment and Nutritional Status of 12–18 month old children in Managua’, Nica-ragua. Social Science and Medicine 46(3):403-414.
Lancaster, G., Maitra, P, and Ray, R. (2006) ‘Endogenous Intra-household Balance of Power and Its Effect on Expenditure Patterns: Evidence from India’, Economica 73(291):435–60.
Levine. J. A, Weisell. R, Chevassus. S, Martinez Claudio D, Burlingame. B, and Andrew W. C. (2001) ‘The Work Burden of Women’, Science 294(5543): 812
Li, L., and Wu, X. (2011) ‘Gender of children, bargaining power and intra household Resource Allocation in China’, Journal of Human Resources 46(2):295-316

References 141
Lim, S., Winter-Nelson, A. and Arends-Kuenning, M. (2007) ‘Household Bargaining Power and Agricultural Supply Response: Evidence from Ethiopian Coffee Growers’, World Development 35(7):1204–1220.
Lokshin, M., Glinskaya, E. and Garcia, M.(2004) ‘The Effect of Early Childhood Development Programmes on Women’s Labour Force Par-ticipation and Older Children’s Schooling in Kenya’, Journal of African Economies (13): 240-276.
Lundberg, S. (1988) ‘Labor Supply of Husbands and Wives’, Review of Eco-nomics and Statistics 70: 224-235.
Lundberg, S., and Pollak, R.A. (1993) ‘Separate Spheres Bargaining and the Marriage Market’, Journal of Political Economy 101(6):988-1010.
Lundberg, S. J., Pollak, R.A. and Wales, T.J. (1997) ‘Do husbands and wives pool their resources? Evidence from the United Kingdom child benefit’, Journal of Human Resources 32 : 463–480.
Mabsout, R., & Van Staveren, I. (2010) ‘Disentangling Bargaining Power from Individual & Household level to Institutions: Evidence on Wom-en’s position in Ethiopia’, World Development 38: 783–796.
Mabsout, R. (2010) ‘Capability and Health Functioning in Ethiopian Households’, Social Science Indicator Research, DOI 10.1007/s11205-010-9661-0.
Maitra, P. (2003) ‘Parental Bargaining, Health Inputs and Child Mortality in India’, Journal of Health Economics 23 (2004) 259–291.
Malhotra, A., and Mather, M. (1997) ‘Do Schooling and Work Empower Women in Developing Countries? Gender and Domestic Decisions in Sri Lanka’, Sociological Forum 12(4):599-630.
Manser M., and Brown M. (1980) ‘Marriage and Household Decision Mak-ing: a Bargaining Analysis’, International Economic Review 21: 31-44.
McElroy, M. B., and Horney, M. J. (1981) ‘Nash-Bargained Household De-cisions: Toward a Generalization of the Theory of Demand’, International Economic Review 22: 333-49.
McElroy,M.(1992) ‘The Policy Implication of family Bargaining and Mar-riage markets’, In Intra household Resource allocation in Developing Countries: Methods, Models and Policy, Haddad,L. Hoddinott,J. And Alderman,H.(eds) Baltimore: John Hopkins University Press.
Messer, E. (1997) ‘Intra-Household Allocation of Food and Health Care: Current Findings and Understandings - Introduction, Social Science and Medicine, 44, (11):1675-84.

142 WOMEN’S BARGAINING POWER & INTRA-HOUSEHOLD RESOURCE ALLOCATION IN RURAL ETHIOPIA
Ministry of Finance and Economic Development (2002) ‘Ethiopia: Sustain-able Development and Poverty Reduction Program’, Addis Ababa, Ethi-opia, MOFED, Development Planning and Research Department.
___________ (2006) ‘Ethiopia: Building on Progress: A Plan for Accelerat-ed and Sustained Development to End Poverty (PASDEP)’, Annual Progress Report.
Moser, C O.N. (1993) Gender Planning and Development: Theory, Practice, and Training, Routledge: London
Morgan, P. S., and Niraula. B. B.1995) ‘Gender Inequality in two Nepali villages’, Population and Development Review 21(3): 541-61.
Mukerjee, D and Das, S. (2008) ‘Role of Parental Education in Schooling and Child Labour Decision: Urban India in the Last Decade’, Social Indi-cators Research, DOI 10.1007/s11205-007-9233-0.
Mulat, D. (1997) ‘Demand for Education and Returns to Investment in Ed-ucation in Ethiopia’, Proceedings of the Seventh Annual Conference on the Ethiopian Economy on Human Resources Development held on 28-30 November 1997, Ethiopia, Nazareth
Murray C.J.L, and Evans, D.B. (2003) ‘Health Systems performance As-sessment: Debates, methods and Empiricism’, World Health Organiza-tion, Geneva.
Nanda, P. (1999) ‘Women’s Participation in Rural Credit Programs in Bang-ladesh and their Demand for Formal Health Care: Is there a Positive Ef-fect’, Journal of Health Economics 8: 415–428.
Nikie`ma B, Haddad S, Potvin L. (2008) ‘Women bargaining to seek healthcare: norms, domestic practices, and implications in rural Burkina Faso’, World Development 36:608–24.
Canagarajah, S., Newman, C. and Bhattanmishra,R. (2001) ‘Non-farm in-come, gender, and inequality: evidence from rural Ghana and Uganda, Food Policy 26(4):405-420.
Osmani, S. and A. Sen (2003) ‘The hidden Penalties of gender inequality: Fetal origins of ill-health’, Economics and Human Biology 1: 105-121.
Palmer, I., (1981) ‘Seasonal Dimensions of Women's Roles’, In: Seasonal Di-mensions to Rural poverty. Chambers, R., Longhurst. R., and Pacey A., Frances Pinter: London, pp 195-201.
Pacey, A. and Payne, P. (1985) Nutrition and Agriculture Development, Unwin Hyman: London,.

References 143
Pitt,M. M, Rosenzweig,M. R, and Hassan,N. (1990) ‘Productivity, Health, and Inequality in the Intra household Distribution of Food in Low In-come Countries’, The American Economic Review 80(5):1139-1156.
Pitt,M.M and Rosenzweig, M.R. (1990) ‘Estimating the Intra household In-cidence of Illness: Child Health and Gender Inequality in the Allocation of Time’, International Economic Review 31(4) :1139–1156.
Pollak, R. (2005) ‘Bargaining Power in Marriage: Earnings, Wage rates, and Household Production’, NBER Working Paper No.W11239.
Psacharopoulos, G. (1996) ‘Child labour versus Educational Attainment: Some Evidence from Latin America’, Journal of Population Economics 10:377–386
Psacharopoulos,G. and Yang, H.(1991) ‘Educational Attainment among Venzuelan Youth: An analysis of its determinants,’ International Journal of Educational Development 11: 289-294.
Quisumbing, A. and Yohannes, Y. (2005). ‘How Fair is Workfare? Gender, Public Works and Employment in Rural Ethiopia’, Policy Research Working Paper No. 3492, World Bank, Washington.
Quisumbing, A. R., and B. de la Brière. (1999) ‘Women’s assets and intra household allocation in rural Bangladesh: Testing Measures of Bargain-ing Power’, International Food Policy Research Institute, Washington, D.C.
Quisumbing, A.R and Maluccio, J. A. (1999) ‘Intra household Resource Al-location and Gender Relations: New Empirical Evidence’, Policy Re-search report on Gender and Development Working paper series, No. 2., World Bank Development Research Group.
Quisumbing, A. R., Haddad, L. J., & Peña, C. (1995) ‘Gender and poverty’, FCND discussion papers 9, International Food Policy Research Institute (IFPRI)
Rahman, K. M. M. (2009) ‘Determinants of Maternal Health Care Utiliza-tion in Bangladesh’, Research Journal of Applied Sciences 4(3):113-119
Rajagopalan, S., P.K. Kyrnal and Pu-ai Pei (1981) ‘Births, Work and Nutri-tion’, In Tamil Nadu, India. In: Seasonal Dimensions to Rural Poverty. Chambers, Longhurst and Pacey.A. (eds.), Frances Pinter Ltd., London.
Ranjan, P. (2001) ‘Credit constraints and the phenomenon of child labour’, Journal of Development Economics 64: 81-102.
Ray, R. (2000) ‘The Determinants of Child Labour and Child Schooling in Ghana’, Mimeo, School Of Economics, University Of Tasmania

144 WOMEN’S BARGAINING POWER & INTRA-HOUSEHOLD RESOURCE ALLOCATION IN RURAL ETHIOPIA
Ray, R. (2000) ‘Child Labour, Child Schooling, and their Interaction with Adult Labour: Empirical Evidence for Peru and Pakistan’, World Bank Economic Review 14(2):347-367.
Regassa, N. (2007) ‘Socio-economic Correlates of High Fertility among Low Contraceptive Communities of Southern Ethiopia’, Journal of Human Ecology 21(3): 203-213.
Reggio, I. (2010) ‘The influence of the mother's power on her child's labour in Mexico,’ Journal of Development Economics 96(10):95-105
Rosenzweig, M. and Stark, O. (1989) ‘Consumption-Smoothing, Migration, and Marriage: Evidence from Rural India’, Journal of Political Economy (97): 905-926.
Roschanski, H. (2007) ‘Deprived Children and Education: Ethiopia’, Inter-national Research on Working Children.
Sahn, D., & Younger, S. (2009) ‘Measuring intra-household health inequali-ty: Explorations using the body mass index’, Health Economics 18:13–19.
Sakamoto, S. (2006) ‘Parental Attitudes toward Children and Child Labor: Evidence from Rural India’, Institute of Economic Research Hitsubashi University, Discussion paper series No. 136
Samuelson, P.A. (1956) ‘Social Indifference Curves’, Quarterly Journal of Eco-nomics 70:1-22.
Sayer,L.C.(2005) ‘Gender, Time and Inequality: Trends in Women's and Men's Paid Work, Unpaid Work and Free Time’, Social Forces Social Forces 84(1 ): 285-303.
Schuler, S. R., Hashemi, S.M. and Riley, A. P. (1997) ‘The Influence of Women’s Changing Roles and Status in Bangladesh’s Fertility Transition: Evidence from a Study of Credit Programs and Contraceptive Use’, World Development 25(4): 563-575.
Schultz, T. P., and Tansel, A. (1998) ‘Wage and Labor Supply Effects of Illness in Coted'Ivoire and Ghana: Instrumental Variable Estimates for Days Disabled’, Journal of Development Economics 53(2): 251-286
Schultz, T.P. (1990) ‘Testing the Neoclassical Model of Family Labor Sup-ply and Fertility’, Journal of Human Resource 25(4): 599-634.
Seck, P. (2005) ‘Do Parents Favour their Biological Offspring over Adopted Orphans? Theory and Evidence from Tanzania’, Hunter College De-partment of Economics Working Papers, Number 409.

References 145
Sedlacek,G.,(2005) ‘Child Labour, Schooling and Poverty in Latin America’, Social Protection Discussion Paper Series No. 0511, Human Develop-ment Network, World Bank.
Seebens, H. and Sauer, J. (2006) ‘Bargaining Power and Efficiency: The Case of Rural Ethiopian Households’, forthcoming.
Sen, A. K. (1985a) ‘Well-being, Agency and Freedom’, The Journal of Philoso-phy 132(4): 169-221.
________ (1990) ‘Gender and Cooperative Conflict’, in Persistent Inequalities. Irene Tinker, ed. NY: Oxford U. Press.
_______ (2001) ‘The Many Faces of Gender Inequality’, India's National Magazine 18 (22).
Strauss,J., Getler,P.J,Rahman,O., Fox C.(2003) ‘Gender and Life-Cycle Dif-ferentials in the Patterns and Determinants of Adult Health’, Journal of Human Resources 28(4): 791-837.
Tafari, N., R.L. Naeye and A. Gobezie (1980) ‘Effects of Maternal Under-Nutrition and Heavy Physical Work during Pregnancy on Birth Weight’, British Journal of Obstetrics and Gynaecology 87: 222-226
Tassew, W, Bekele,T., Jones. N., and Bayrau, A. (2004) ‘Child Labour, Gen-der Inequality and Rural/Urban Disparities: How can Ethiopia’s Nation-al Development Strategy be revised to address negative Spill over Effects on Child Education and Well Being’, Young Lives Working Paper No. 20.
Thomas, D. (1990) ‘Intra household Resource allocation: An inferential Ap-proach’, Journal of Human Resources 25(4):635-664.
Thomas, D. & Strauss, J. (1997) ‘Health and wages: Evidence on men and women in urban Brazil’, Journal of Econometrics 77(1): 159-18.
Thomas, D., Elizabeth, F.,and Dante C. (2002) ‘Distribution of Power with-in the Household and Child Health’, Mimeo, UCLA
UNDP (1995) Human Development Report, Published for the United Na-tions Development Program, New York: Oxford University Press.
_____ (2006) ‘Human Development Report’, Published for the United Na-tions Development Program, New York: Oxford University Press.
_____ (2007) ‘Human Development Report’, Published for the United Na-tions Development
_____ (2008) ‘Human Development Report’, Published for the United Na-tions Development Program, New York: Oxford University Press.

146 WOMEN’S BARGAINING POWER & INTRA-HOUSEHOLD RESOURCE ALLOCATION IN RURAL ETHIOPIA
______ (2010) ‘Human Development Report’, Published for the United Nations Development Program, New York: Oxford University Press.
______ (2011) ‘Human Development Report’, Published for the United Nations Development Program, New York: Oxford University Press.
UNICEF (2007) ‘The State of the world’s children 2007: Women and Chil-dren’, The double Dividend of Gender equality.
Varian, H. (1992) Microeconomic Analysis, Third edition. Norton: New York. Weerdt,J. D. and Dercon, S. (2006) ‘Risk Sharing networks and Insurance
against Illness’, Journal of Development Economics (81)2:337-356. WHO (2008) ‘Gender Disparities in Mental Health, Department of mental
health and substance dependence’, WHO Report. Wiki gender (2008) ‘Gender, Institutions and Development Database’, ac-
cessed September 2, 2008, http://www.wikigender.org/wiki/index.php?title=Category:Data_and_Statistics.
Wolff, B., Blanc, A.K., and Gage, A.G. (2000) ‘Who decides?: Women's Sta-tus and Negotiation of Sex in Uganda’, Culture Health and Sexuality 2(3): 303-322.
Woldehanna, T., Tefera, B., Jones, N., & Bayrau, A. (2005a) ‘Child labour, gender inequality and rural/urban disparities: How can Ethiopia’s Na-tional Development Strategies be revised to address negative spill-over impacts on child education and well-being?’ Young Lives Working Paper 20. London: Save the Children UK
Woldehanna, T., Jones, N., & Tefera, B. (2005b) ‘Children’s Educational Completion Rates and Achievement: Implications for Ethiopia’s second poverty reduction strategy’, Young Lives Working Paper 18, London: Save the Children UK.
World Bank (1998) ‘Gender issues in Ethiopia: Implementing the National Policy on Women’, World Bank Findings on Africa Region, No.119.
World Development Report (2003) ‘Sustainable Development in a Dynamic World’, the World Bank.
Zafiris, T. (1998) ‘Child Labour and School Enrolment in Thailand in the 1990s’, Economics of Education Review (22):523–536.
Zhang, J. and Chan,W. (1999) ‘Dowry and Wife’s Welfare: A Theoretical and Empirical Analysis’, Journal of Political Economy 107 (4): 786–808.

References 147
Zohir, S.C. and Paul-Majumder, P. (1996) ‘The Garment Workers in Bang-ladesh: Economic, Social and Health Conditions’, Bangladesh Institute of Development Studies, Dhaka

148 WOMEN’S BARGAINING POWER & INTRA-HOUSEHOLD RESOURCE ALLOCATION IN RURAL ETHIOPIA

The Author Bilisuma Bushie Dito did her BA in Economics and her MSc in Economic Policy Analysis at Addis Ababa University, Ethiopia. In November 2007, upon receiving a fellowship from the Netherlands Fellowship Programme (NFP), she joined the Ph.D. programme in Development Studies at the In-stitute of Social Studies. For the past four years, she has been conducting research under the supervision of Prof. dr. Michael Grimm and Prof.dr. Irene Van Staveren on issues of intra-household resource allocation and women’s bargaining power. During this period, she has presented her work at several international conferences and has co-organized a workshop on women’s bargaining power and economic development. Bilisuma’s main research areas of interest are health, labour and gender eco-nomics, and migration issues. She is highly interested in inter-disciplinary research. Beginning from January 1, 2012, she will be joining the Globaliza-tion and Development Research Group at Maastricht University as a post-doctoral researcher. Contact: Email: [email protected] Declaration: This thesis has not been submitted to any university for a degree or any other award.