Essays on Executive Compensation: Examining Pay and ...
270
Essays on Executive Compensation: Examining Pay and Performance Associations, Choice of Performance measures and the Use of Relative Performance Evaluation in Compensation Contracts Thesis submitted in partial fulfilment of the requirements for the degree of Doctor of Philosophy HENLEY BUSINESS SCHOOL THE UNIVERSITY OF READING ICMA Centre Affan Hameed June 2018
Transcript of Essays on Executive Compensation: Examining Pay and ...

Essays on Executive Compensation: Examining Pay and Performance Associations,
Choice of Performance measures and the Use of Relative Performance Evaluation in
Compensation Contracts
Thesis submitted in partial fulfilment of the requirements
for the degree of Doctor of Philosophy
HENLEY BUSINESS SCHOOL
THE UNIVERSITY OF READING
ICMA Centre
Affan Hameed
June 2018

ii
DECLARATION
I confirm that this is my own work and the use of all material from other sources has been
properly and fully acknowledged
Affan Hameed

iii
ABSTRACT
This thesis contributes to our understanding of executive compensation schemes in the United
Kingdom (UK). On one hand, the study focuses on the effectiveness of long-term incentive
plans (LTIPS) which has come under scrutiny in the recent past. On the other hand, it tests
within various settings whether compensation contracts are designed optimally. It also looks in
detail at the contractual features of long-term incentives which have received little attention in
the literature to date.
The first empirical chapter analyses the effect of firm performance on Chief Executive Officer/
Chief Financial Officer (CEO/CFO) pay by employing a sample of non-financial FTSE 350
firms during 2010-2014. We test this association by differentiating between the impacts of
short-term and long-term performance on short and long-term compensation. The short and
long-term compensation components consist of cash (salary and bonus), equity (performance
share plan, share option, matching plan and others) and total realized pay (salary, bonus and
total equity vested) of CEO and CFO compensation. We also explore the effectiveness of LTIPs
awarded to executives by examining the impact of different numbers, amounts and types of
long-term plans on the long-term pay-performance responsiveness. The results indicate that
CEO long-term pay, total realized pay and total remuneration are determined by a firm’s three-
year performance. These results also hold true for CFO but the relationship is not as strong as
that for CEO. Also, for CEOs and CFOs, companies that use three or four separate LTIP plans
award higher realized pay and total remuneration than companies that do not award any LTIP.
However, for CEOs, companies that operate one, two or three plans in a compensation package,
align the interests of CEOs with those of the shareholders. Basic plans in compensation
packages tend to increase the pay-performance responsiveness. Within these LTIPs, the more
valuable the grants are, the stronger the pay-performance relationship becomes. However, for

iv
CFOs, greater number or amounts of LTIPs correspond to higher total compensation and
realized pay and greater pay-performance responsiveness. These findings suggest that higher
grants encourage greater CFO effort, leading to higher equity vesting because of the attainment
of performance targets. For CFO, the pay-performance responsiveness differs in number and
amount of long-term incentives awarded than that of CEO. Finally, these findings remain
consistent with the use of market adjusted TSR, further strengthening the conclusion of the
research question.
Next, we analyse the influences on and the effects of the choice of performance measure in
CEO compensation contracts, for a sample of 3400 plans from 2007 to 2015. We investigate
the link between the choice of performance measure and the volatility of earnings per share
(EPS) and total shareholder return (TSR), taking into account four different performance
categories, in that a firm may use either EPS or TSR, both, or neither. This allows us to utilize
a comprehensive cross-section of plans and accounts for when both EPS and TSR are jointly
employed. We find that EPS in combination with TSR is the most common performance metric
employed by firms. The findings show that firms with higher EPS volatility and lower TSR
volatility are more likely to choose TSR as a performance measure and that firms with higher
EPS volatility are less likely to choose EPS alone; we argue that these results are in line with
optimal contracting theory. Our results are robust to controlling for plan types, industry and
time fixed effects. We control for the effect of the identity of the advising compensation
consultant and also for industry on the category of performance measure, and find that some
consultants, and some industries, have marked preferences for one measure over another. This,
we argue, is an evidence of institutional isomorphism.
The final empirical chapter analyses the effect of common shock on the selection of relative
performance evaluation (RPE) based plan in the construction of CEO compensation packages.

v
The results indicate that firms implement RPE based measures exclusively when a performance
measure contains significant shocks which are common amongst peer companies and are
consistent with the predictions of agency theory. These results are robust after controlling for
the identity of the remuneration consultant and alternate proxies for common risk, for example,
r-square and correlation. We provide a novel analysis of the breakdown of RPE characteristics,
namely, different peer choices, threshold targets, and the equity vesting pertaining to these
threshold targets by industry in compensation contracts as set by the firms. The findings reveal
that firms are very distinct in their peer group selection and the choice of performance targets.
Furthermore, we assess the relationship between common risk and the characteristics of the
RPE. We identify that firms facing greater common risk tend to employ tougher performance
targets in the shape of wider target spread and a lower percentage of equity vesting at the median
and upper quartile threshold targets, where target spread is the difference between median and
maximum performance required for equity vesting. Finally, we find that vesting percentages
vary in characteristics of RPE.

vi
ACKNOWLEDGEMENT
In the Name of Allah, the Most Merciful and the Most Magnificent…
All praise and thanks be to Allah, for His blessings and guidance to enable me to commence
this dissertation. Alhamdulillâh, I cannot thank Him enough for bestowing me with the
patience, strength and confidence to work through this scientific assignment and for providing
me with inspirational individuals who supported me to accomplish this doctoral thesis.
I would like to express my gratitude to my supervisors, Dr. Carol Padgett and Professor Michael
Clements, for their continuous support throughout my Ph.D. and related research, for their
patience, motivation, immense knowledge, and timely interventions to fine-tune my work. The
guidance offered to me by my supervisors is invaluable to me. I could not have imagined having
better advisors and mentors for my Ph.D. study. Their comments were insightful and
encouraging and, often, the questions they posed for my work were challenging and rigorous.
This helped stimulate my intellectual calibre and widen my research from various perspectives.
I feel fortunate for having secured a PhD studentship for three years from the ICMA Centre,
University of Reading. My sincere thanks go to the ICMA, University of Reading for granting
me this full scholarship in the form of a PhD studentship, without which it would not be possible
to conduct this research. This opportunity gave me access to the world-class research facilities
at this institution. In addition, I received an external grant and access to the database of
executive compensation, made available through MEIS. All these resources were incredibly
crucial for the topic of my doctoral research and enabled me to single-mindedly focus on my
work.
Research is an act of churning knowledge and knowledge cannot operate in a vacuum nor grow
in isolation. I am, therefore, indebted to the administrative and academic staff at ICMA for

vii
ensuring that my doctoral experience at the University of Reading was a good one. Thank you,
Yeqin for making time out to help me whenever I approached you for guidance. It is also an
immense privilege to have met and known some incredible people while doing this thesis at the
University and beyond. I thank my fellow students: Chardin, Rachel, Qian, Rupini, Sijing,
Zhong, Lei, Ivan, Lisa, Hanyu, Salah, Fahad, Christopher, Nick, Andrei, Satya, Chao, Despiona
and Yijun, for the stimulating discussions and for all the fun we have had in the last four years.
A special mention to Anindita for being there in the final stages of my work. A big shout out to
my dearest friends- Sana, Mzie, Kausar, Anand, Anas, Jasim, Saad, Aamir, Usman, Tahir, Abid,
Shuja, Taqi, Jasim, Daniela, Sheikha, Vijay and Junaid. Also, Stephanie, Indrajeet and Laura
for your constant reassurance. Special thanks to Karolina and Ibrahim for your company.
I take this opportunity to thank my managers, colleagues and friends at Mercer where I interned
during my PhD. This internship provided me with useful professional and industrial experience.
Especially, I am grateful to Mercer for broadening my understanding of executive
compensation packages which enriched my own research interests. My heartfelt appreciation
for Matt, Oli and George.
Finally, to Chris I provide my sincerest condolences for proofreading some part (Chapter 6) of
this thesis, without which this work would have taken substantially longer.
Down the road and along the way, my lifeline remains my family that has blessed me with love
and given me role models I look up to. I would like to thank my brothers- Hassan and Soban,
and my sisters- Munazza and Faiza, especially, Munazza for supporting me spiritually
throughout my writing this thesis and the endless supplies of food. Lots of love and affection
to my little bundles of joy- Afsha and Yahya, who always bring a cheer to my heart. I also thank
my cousins, Ali, Bilal, Ijlaal, Talal and Zeeshan for reminding me of the life beyond my
intellectual bubble.

viii
To save the best, my immense gratitude and love to my amazing parents who made every
achievement in my life possible. There are no words to express my immeasurable gratitude and
your hard work and sacrifices have made it possible for me to nurture my own dreams and
ambitions.
I devote this work to my late grandparents. I sense your blessings in every step of my life and
know that your prayers engulf and protect me as I continue to walk ahead.

i
TABLE OF CONTENTS
LIST OF TABLES .................................................................................................................... v
LIST OF ABBREVIATIONS .................................................................................................. x
1 INTRODUCTION ............................................................................................................. 1
1.1 Motivation .................................................................................................................... 1
1.2 Contribution ................................................................................................................. 6
1.3 Outline of the Thesis .................................................................................................... 8
2 CORPORATE GOVERNANCE REPORTS AND THE STRUCTURE OF
REMUNERATION CONTRACTS ...................................................................................... 12
2.1 The Development of Corporate Governance and Executive Remuneration in the UK
………………………………………………………………………………………12
2.1.1 Cadbury Report ................................................................................................... 12
2.1.2 Greenbury Report ............................................................................................... 14
2.1.3 Hampel Report and the Combined Code ............................................................ 16
2.1.4 Directors’ Remuneration Report Regulations..................................................... 18
2.1.5 2013 Reforms ...................................................................................................... 19
2.2 Executive Compensation Structure ............................................................................ 20
2.2.1 Base Salary ......................................................................................................... 21
2.2.2 Annual Bonus ..................................................................................................... 21
2.2.3 Equity Compensation .......................................................................................... 22
2.2.3.1 Share Options .............................................................................................. 22
2.2.3.2 Performance Share Plans ............................................................................. 23
2.2.3.3 Share Matching Plans .................................................................................. 24
2.2.4 Benefits-in-kind .................................................................................................. 25
2.2.5 Pension ................................................................................................................ 25
3 LITERATURE REVIEW ............................................................................................... 27
3.1 Introduction ................................................................................................................ 27
3.2 Theoretical Perspective on Executive Compensation ................................................ 27
3.2.1 Agency Theory ................................................................................................... 27
3.2.2 Managerial Power Theory .................................................................................. 28
3.2.3 Tournament Theory ............................................................................................ 30
3.3 Empirical Literature ................................................................................................... 30
3.3.1 Discussions on Pay for Performance Relationship ............................................. 30

ii
3.3.2 Discussions on Performance Choices in Compensation Contracts and Optimal
Contracting ........................................................................................................................ 37
3.3.3 Discussions on RPE-based Contracts ................................................................. 40
3.3.4 Brief Reflection of the Relevant Literature ........................................................ 45
4 THE EFFECTIVENESS OF LONG-TERM INCENTIVES IN ALIGNING
INTERESTS BETWEEN EXECUTIVES AND SHAREHOLDERS ................................ 48
4.1 Introduction ................................................................................................................ 48
4.2 Related Literature and Development of the Hypotheses............................................ 51
4.3 Effects of Corporate Governance and Control Variables on the Level of
Compensation ........................................................................................................................ 56
4.3.1 Variables ............................................................................................................. 59
4.3.2 Model Estimation ................................................................................................ 61
4.4 Data ............................................................................................................................ 64
4.4.1 Data Sources and Sample Construction ................................................................... 64
4.4.2 Sample Statistics ....................................................................................................... 65
4.4.3 Panel Data-Fixed Effects Model ......................................................................... 73
4.5 Empirical Results ....................................................................................................... 74
4.6 Robustness Check ...................................................................................................... 87
4.7 Conclusion ................................................................................................................. 93
APPENDIX TO CHAPTER 4 .............................................................................................. 95
Variable Definition................................................................................................................ 95
5 THE CHOICE OF PERFORMANCE MEASURES, TARGET SETTING AND
VESTING LEVELS IN UK FIRMS CEO COMPENSATION CONTRACT ................ 101
5.1 Introduction .............................................................................................................. 101
5.2 Theory, Related Literature and Hypothesis Development ....................................... 103
5.2.1 Related Literature ............................................................................................. 104
5.2.1.1 The Development of the Study of Performance Measures ........................ 104
5.2.1.2 The Problem of Volatility in Measuring Management Effort ................... 106
5.2.1.3 Hypotheses ................................................................................................ 108
5.2.1.4 Isomorphism in Executive Compensation Contracts ................................ 108
5.2.1.5 The Structure of Compensation Contracts ................................................ 109
5.2.1.6 The Role of Compensation Consultants .................................................... 110
5.3 Executive Compensation Plan Structure .................................................................. 111
5.3.1 The Dataset ....................................................................................................... 111
5.3.2 The Design of Executive Compensation Contracts .......................................... 111

iii
5.4 Methodology ............................................................................................................ 112
5.4.1 Independent Variables ...................................................................................... 112
5.4.2 Sample Construction ......................................................................................... 113
5.4.3 Data Coding ...................................................................................................... 114
5.4.4 Model Estimation .............................................................................................. 115
5.5 Data Analysis and Empirical Results ....................................................................... 117
5.5.1 Descriptive Statistics......................................................................................... 117
5.5.1.1 Performance Measures Used in Long-Term Incentive Arrangements ...... 117
5.5.2 Empirical Results .............................................................................................. 126
5.5.2.1 Multinomial Logistic Regression .............................................................. 126
5.5.2.2 Marginal Effects ........................................................................................ 129
5.5.2.3 Robustness ................................................................................................. 132
5.6 Design of Compensation Contracts .......................................................................... 133
5.6.1 Market-Based Measures ................................................................................... 134
5.6.1.1 Peer Group Choices for TSR Only Contracts............................................ 134
5.6.1.2 Vesting Levels in TSR Based Contracts ................................................... 137
5.6.2 Accounting-Based Measures ............................................................................ 141
5.6.2.1 Breakdown of Types of EPS ..................................................................... 141
5.6.2.2 EPS targets and Vesting levels .................................................................. 142
5.7 Performance Target Achievements .......................................................................... 146
5.8 Conclusion ............................................................................................................... 151
APPENDIX TO CHAPTER 5 ............................................................................................ 154
Variable Definition.............................................................................................................. 154
6 RPE CHOICES IN COMPENSATION CONTRACTS OF UK FIRMS ................ 160
6.1 Introduction .............................................................................................................. 160
6.1.1 Discussion on the use of Relative Performance Evaluation (RPE) presence ... 164
6.1.2 On Peer Groups used in RPE ............................................................................ 167
6.1.3 RPE Award Design ........................................................................................... 170
6.2 Related Literature and Hypothesis development ..................................................... 171
6.3 Research Variables ................................................................................................... 171
6.3.1 Use of RPE in remuneration contracts .............................................................. 171
6.4 Executive Compensation Contracts ......................................................................... 176
6.5 Empirical Strategy .................................................................................................... 184
6.5.1 Data Coding ...................................................................................................... 184

iv
6.5.2 Empirical Model ............................................................................................... 184
6.5.3 Data Sources, Sample Construction, and Variable Definition.......................... 186
6.5.3.1 Independent Variables ............................................................................... 186
6.5.3.2 Dependent Variables ................................................................................. 186
6.5.4 Variable Classification ...................................................................................... 187
6.5.5 Descriptive Statistics......................................................................................... 188
6.6 Empirical Results ..................................................................................................... 191
6.6.1 Multinomial Logistic Regression...................................................................... 191
6.6.2 Marginal Effects ............................................................................................... 195
6.6.3 RPE Plan Characteristics .................................................................................. 199
6.6.3.1 Peer Group Choice .................................................................................... 199
6.6.3.2 Initial and Maximum Threshold Vesting .................................................. 203
6.6.3.3 Target Spread............................................................................................. 206
6.6.4 Robustness Tests ............................................................................................... 208
6.6.5 Actual Equity Vesting Percentages................................................................... 212
6.7 Conclusion ............................................................................................................... 217
APPENDIX TO CHAPTER 6 ............................................................................................ 220
7 SUMMARY AND CONCLUSION .............................................................................. 225
7.1 Summary of the Findings ......................................................................................... 225
7.2 Limitations of the Findings ...................................................................................... 232
7.3 Suggestions for Future Research .............................................................................. 234
BIBLIOGRAPHY ................................................................................................................. 238

v
LIST OF TABLES
Table 4.1 Panel A: The descriptive statistics of components of CEO Compensation…….......68
Table 4.1 Panel B: The descriptive statistics of components of CFO Compensation…….......69
Table 4.1 Panel C: CEO and CFO compensation within different number of long-term
incentives awarded……………………………………………………………………………70
Table 4.1 Panel D: Descriptive statistics on average number of active long-term incentive plans
granted three-years before the compensation is awarded……………………………………...71
Table 4.1 Panel E: The descriptive statistics of regression variables…………………………71
Table 4.1 Panel F: The descriptive statistics of financial performance of the firm…………...72
Table 4.1 Panel G: Correlation Matrix of main independent variables………………….........72
Table 4.1 Panel H: VIF Test Results…………………………………………………...…….73
Table 4.2 Panel A: CEO compensation as a function of corporate performance at previous
interval………………………………………………………………………………………..80
Table 4.2 Panel B: CEO compensation as a function of corporate performance at previous
interval………………………………………………………….……………………….……81
Table 4.2 Panel C: Multivariate model examining the effectiveness of number of plans for
CEO at previous interval (t-3→t)………………………………...……………………………82
Table 4.2 Panel D: Multivariate model examining the effectiveness of type of plans for CEO
……….......................................................................................................................................83
Table 4.3 Panel A: CFO compensation as a function of corporate performance at previous
interval…………………………………………………………………………….………….89
Table 4.3 Panel B: CFO compensation as a function of corporate performance at previous
interval ……………………………………………………………………………………….90
Table 4.3 Panel C: Multivariate model examining the effectiveness of number of plans for
CFO at previous interval (t-3→t) ……………………………………….……………….....…91

vi
Table 4.3 Panel D: Multivariate model examining the effectiveness of type of plans for CFO
………………………………………………………………………………………………...92
Table A.4.1: Hausman Test……………………….……………………………………….....97
Table A.4.2: Robustness test:
Impact of Market adjusted TSR (1 year) on components of CEO pay……….………………...99
Table A.4.3: Robustness test:
Impact of market adjusted TSR (3 years) on components of CEO pay………………………...99
Table A.4.4: Robustness test:
Impact of Market adjusted TSR (1 year) on component of CFO Pay……….……….…….…100
Table A.4.5: Robustness test:
Impact of market adjusted TSR (3 years) on components of CFO pay……………….............100
Table 5.1: Performance measures used in long-term incentive arrangement…….…………119
Table 5.2: Performance measures categories in long-term incentive arrangements...……….120
Table 5.3: Descriptive Statistics
Table 5.3 Panel A: Firm Level Characteristics……………………………………………...121
Table 5.3 Panel B: Correlation Matrix of Main Independent Variables…………………….122
Table 5.3 Panel C: Compensation Consultant Statistics…………………………………….122
Table 5.4: Multinomial logit model estimating the probability of performance measures in
compensation contracts…………………………………………………………………..….123
Table 5.5: Marginal effects of the impact of volatilities on performance choices……….......125
Table 5.6: Market-based performance targets and relative benchmarks………………….…135
Table 5.7: Comparator Groups (Index) in Relative to TSR Plans………………………........136
Table 5.8 Panel A: The distribution of vesting levels at median threshold and upper quartile
targets in LTIP schemes……………………………………………………………………...137
Table 5.8 Panel B: Outperformance TSR plans……………………………………………..138

vii
Table 5.9: Type of EPS plans (performance share plans/options/matching plans) ……….…141
Table 5.10 Panel A: Distribution of EPS growth in excess of RPI required for minimum and
maximum threshold (in per annum equivalent) ………………………..…………………….143
Table 5.10 Panel B: Distribution of EPS absolute growth required for minimum and maximum
threshold (in per annum equivalent) ………………………………………………………....144
Table 5.11: Breakdown of the number of plans achieving median or upper quartile performance
thresholds of relative TSR benchmarks against the FTSE 100, FTSE 250, FTSE 350, and FTSE
Small Cap, by year…………………………………………………………………………...146
Table 5.12 Panel A: Descriptive Statistics of EPS Real/ RPI growth targets………………149
Table 5.12 Panel B: The breakdown of number of plans achieving minimum or maximum
performance thresholds of EPS real / RPI growth, by year…………………………………..149
Table 5.13 Panel A: Descriptive Statistics of EPS absolute growth targets…………………150
Table 5.13 Panel B: The breakdown of a number of plans achieving minimum or maximum
performance thresholds of EPS absolute growth, by year……………………………………150
Table A.5.1: Robustness test 1:
Multinomial logistic model estimating the effects of industry-adjusted EPS and TSR volatilities
on performance measures…………………………………………………………...……….155
Table A.5.2: Robustness test 2:
Multinomial logistic model estimating the effects of basic EPS volatility and TSR volatility on
performance measures……………………………………………………………………….156
Table A.5.3: Robustness test 3:
Multinomial logit model estimating the probability of performance measures with time
dummies……………………………………………………………………………………..157

viii
Table A.5.4: Robustness test 4:
Multinomial logit model estimating the probability of performance measures (using total assets
as a proxy for firm size) …………………………………….………………………………..158
Table A.5.5: Robustness test 5:
Multinomial logit model estimating the probability of performance measures in compensation
contracts (inclusion of EPS along with income measures in earnings category) ………….…159
Table 6.1: Breakdown of type of performance standards in remuneration contracts…...……176
Table 6.2: Industrial breakdown of performance standards in long-term incentive plans…...177
Table 6.3: Breakdown of relative performance evaluation (RPE) and non-RPE in long-term
incentive plans of FTSE 350 UK firms
Table 6.3 Panel A: Breakdown of RPE plans in remuneration contracts……………………178
Table 6.3 Panel B: Breakdown for non-RPE firms based on long-term incentives in
remuneration contracts……………………………....……………………………………....178
Table 6.4: Industry breakdown of comparator groups which incorporate RPE conditions......180
Table 6.5: Breakdown of sector and index peer groups in RPE plans……….……...………..181
Table 6.6: Breakdown by industry of plans with non-traditional relative percentile ranking for
maximum payout and percentage vesting at initial and upper quartile percentile rankings set by
RPE firms……………..……………………………………………………………………..183
Table 6.7: Descriptive statistics for the independent variables………………………………189
Table 6.8: Correlation matrix of Independent Variables……………………………...……..190
Table 6.9 Panel A: Multinomial logistic model estimating the probability of performance
standards in compensation contracts…………………………………………………………193
Table 6.9: Panel B: Marginal effects of impact of common shock on performance standards
……………………………………………………………………………………………….197
Table 6.10: Multinomial logistic model estimating the probability of peer group choices…..202

ix
Table 6.11 Panel A: Regressions of impact of common risk on Initial Vesting……………..209
Table 6.11 Panel B: Regressions of impact of common risk on Upper Quartile Vesting……210
Table 6.11 Panel C: Regressions of impact of common risk on Target Spread……………...211
Table 6.12: Descriptive statistics of the effect of RPE characteristics on percentage of equity
vesting
Table 6.12 Panel A: Breakdown as Peer Group…………………………………………….212
Table 6.12 Panel B: Breakdown as Target Spread…………………………………………..213
Table 6.12 Panel C: Breakdown as Initial Vesting………………………………………….213
Table 6.12 Panel D: Breakdown as Vesting on achieving upper quartile performance……..214
Table A.6.1: Robustness Test 1:
Multinomial logit model estimating the probability of performance types (R-square as proxy of
common risk) ………………………………………………………………………………..222
Table A.6.2: Robustness Test 2:
Multinomial logit model estimating the probability of performance standards (Correlation as
proxy of common risk) ………………………………………………….…………………...223
Table A.6.3: Robustness Test 3:
Consultant specific effects………………………………………………………………...…224

x
LIST OF ABBREVIATIONS
ABS Absolute Performance
AGMS Annual General Meetings
CEO Chief Executive Officer
CFO Chief Financial Officer
DRRR Directors’ Remuneration Report Regulations
EPS Earnings per Share
EVA Economic Value Added
FE Fixed Effects Model
FTSE Financial Times Stock Exchange
KPIs Key Performance Indicators
LSE London Stock Exchange
LTIPs Long-Term Incentive Plans
MP Member of Parliament
NEDS Non-Executive Directors
OLS Ordinary Least Square Method
PSA Performance Share Award
PPS Pay-performance sensitivity
PSPs Performance Share Plans
PVSOs Performance Vested Stock Options
PWC PricewaterhouseCoopers
RC Remuneration Committee

xi
ROA Return on Asset
ROE Return on Equity
RPE Relative Performance Evaluation
SEC Security Exchange Commission
TSR Total Shareholder Return
UK United Kingdom
US United States of America
VIF Variance Inflation Factor

1
1 INTRODUCTION
1.1 Motivation
The motivation for this thesis comes from major milestones that have affected the world of
businesses in contemporary times. During the financial crisis of 2007-2008, Richard Fuld, Chief
Executive Officer (CEO) and the chairman at Lehman Brother were awarded 500 million
dollars, only four days prior to the bankruptcy, despite having announced that the firm had
recently lost four billion dollars in the third quarter of 2007. There were controversies on the
amount he was paid right after the bankruptcy was declared as well as disagreement on how
much he was paid in total as compensation over the period 2000-2008. This led to the
heightened involvement in understanding and questioning the structures around executive
compensation schemes not only in the US but also globally.
Within the UK context, as well, a few prominent cases have received extensive media coverage.
For instance, the case of the 2003 shareholder revolt at GlaxoSmithKline which primarily
focused on the pay package of its CEO Jean Pierre Garnier1 and later in 2008, there was a strong
disapproval linked with the disclosure that Sir Fred Goodwin, the CEO of failed Royal Bank of
Scotland received a pension entitlement of up to £30 million2.
Similarly, during the last two decades, stock-based compensation has gained significant
attention from the media, the general public, academia, and legislators. More recently, in May
2017, MPs (Member Of Parliament) called on the government to ban the award of lucrative and
1 Jill Treanor (2012), GlaxoSmithKline chief's pay package more than doubles to £6.7m, The Guardian.
https://www.theguardian.com/business/2012/mar/12/glaxosmithkline-chief-pay-andrew-witty
[accessed on July 21, 2017]. 2 Richard Evens (2009), Sir Fred Goodwin: True cost of pension ‘is £30m’, The Telegraph.
http://www.telegraph.co.uk/finance/personalfinance/pensions/4861923/Sir-Fred-Goodwin-True-cost-of-pension-
is-30m.html
[accessed on July 22, 2017].

2
complex share-based incentive schemes to the executives of UK firms.3 Additionally,
shareholders have also shown their displeasure over the granting of long-term incentive plans
(LTIPs), reflecting in the declining support of such approval.4 MPs also suggest a need to award
simpler deferred stock option instead of LTIPs, which would only cash in later years, perhaps
after their retirement. There have been ongoing discussions on the design of LTIPs, as they
continue to grow in complexity. One compensation consultant, Mercer argues that abolishing
LTIPs is too prescriptive but a design of LTIPs and the way performance measures are linked
to it needs careful attention.
Higher levels of executive pay have been widely discussed worldwide. As an example, Murphy
(2013) reports that median CEO compensation at S&P 500 firms has increased from $2.9
million in 1992 to $9.0 million in 2011, signifying 4% growth p.a. for a period of 30 years.
While in the UK, the average total pay of FTSE 100 Chief Executive Officers (CEOs) has risen
by 13.6% per year, from an average of £1 million to £4.2 million for the period from 1998–
2010, far exceeding the 1.7% average annual increase in the FTSE 100 index.5 However, it is
important to know whether executives are compensated to act in the best interest of
shareholders.
The UK has been a “pioneer in corporate governance reforms”, also, emphasizing the aspects
of executive compensation regulation (Thompson, 2005). It has undertaken a series of corporate
3 See Christopher Williams (2017), MPs call for ban on complex incentive schemes in corporate governance
crackdown, The Telegraph.
http://www.telegraph.co.uk/business/2017/04/04/mps-call-ban-complex-incentive-schemes-soon-possible/
[accessed on July 21, 2017]. 4 Nick Dawson (2017), LTIP-ing Point: Is This the End of Long-Term Incentive Plans?, Harvard Report.
https://corpgov.law.harvard.edu/2017/05/12/ltip-ing-point-is-this-the-end-of-long-term-incentive-plans/
[accessed on July 21, 2017]. 5 Executive remuneration: discussion paper (2011), Department for Business Innovation and Skills (“BIS”)
https://www.gov.uk/government/uploads/system/uploads/attachment_data/file/31660/11-1287-executive-
remuneration-discussion-paper.pdf
[accessed on July 12, 2017].

3
governance reforms since the publication of the Cadbury Report in 1992 to ensure transparency
as well as encouraging shareholders to play an active role in executive compensation. Following
the UK, European and other countries have also established several regulations on executive
compensation. For instance, even the US, with its historic approach to business-friendly
corporate laws, has initiated “say on pay” regulation, while, as an example, some European
jurisdictions like Germany and Switzerland6 have a binding shareholder vote on matters related
to executive compensation and have initiated or have attempted to initiate executive-employee
compensation ratio or salary caps. Moreover, in the US, the laws on governance are that a firm
should adhere strictly according to the terms of the regulations and if firms do not comply, they
will be penalized. However, in the UK, instead of firms being subject to mandatory compliance,
the principle of “comply or explain” is applied to the corporate governance codes. This was put
forward in the Cadbury Report as a Code of Best Practice in 1992 and gives freedom to firms
to either comply with the governance codes’ principles or give a reasonable explanation if they
fail to do so (Ndzi, 2014).
The motivations of this study also comes from the rising interest in addressing agency problems
surrounding executive compensation, along with widespread concerns whether the structure of
compensation contracts is designed optimally. Extant literature on identifying a clear link
between executive compensation and performance has primarily involved US firms (e.g. Jensen
and Murphy, 1990; Mehran, 1995), whereas relatively, limited research has been carried out in
the UK context (Ozkan, 2011). Most importantly, this small body of research, by and large,
has remained inconclusive in its results. Thus, the debate concerning executive compensation
pertaining to higher levels of compensation is ongoing and calls for a further examination from
6 Executive Remuneration: European Corporate Governance Developments (2013), Willis Towers Watson.
https://www.towerswatson.com/en/Insights/IC-Types/Technical-Regulatory/2013/Executive-Remuneration-
European-Corporate-Governance-Developments
[accessed on July 12, 2017].

4
various perspectives. Therefore, it is necessary to analyse various components of executive
compensation in investigating pay for performance association. To this end, this study analyses
different definitions which are mentioned in the prior literature and also synthesizing a new
variable, namely, ‘‘total realized pay’’. Total realized pay is the sum of salary, bonus, payouts
from performance share plans and the value of options exercised. Despite the growing concern
in this area, prior literature fails to consider a long-term measure of the firm performance.
Nowadays, long-term incentives are frequently granted to the executives in the form of shares
which vest after the attainment of performance hurdles. The last decade has seen a rapid shift
in the landscape of long-term incentive plans and firms have started to grant multiple long-term
incentive plans to ensure executives act in the best interests of shareholders. As discussed
earlier, fuelled by the strong interest in the structure of executive remuneration and complexity
in long-term incentives by various stakeholders, the question that has arguably spurred most
academic interest is whether long-term incentive plans are effective in aligning managerial
interests and shareholder wealth. To date, there has been no study which identifies the
effectiveness of different numbers and amount of long-term incentive plans awarded to
executives.
In addition, there are widespread concerns about the effectiveness of contractual terms of CEO
compensation. One of the key elements of contractual terms has been the selection of
performance measure. However, in this regard, even the corporate governance codes in the UK
do not make any recommendations on specific performance measures that firms should employ
while assessing the performance of the company. Extant literature restricts its focus on how the
volatility of performance measure impacts the pay-performance sensitivity (e.g., Sloan, 1993).
However, it is silent on the determinants of the choice of performance measures for UK firms.
Parallel to this, there is no detailed discussion about an ever-increasing role of compensation

5
consultants in aspects of compensation design. These are pertinent questions that need to be
addressed in order to better understand this subject matter.
Compensation consultants highlight that current practices of the UK firms are highly innovative
in selecting performance metrics but this area needs further exploration. On the other hand, in
the context of US, there are studies, albeit a few in number, that investigate the breakdown of
mechanics of incentivization in compensation contracts of the US firms (De Angelis, 2015; Li
and Wang, 2016). These studies also point out that limited disclosure and transparency restricts
the availability of contractual terms, which has led many to question whether compensation
contracts are designed optimally. Thus, the aim of this study is to understand and show detailed
structure and mechanism of executive compensation schemes from the information available in
directors’ remuneration section of the annual reports.
Turning towards the different performance standards within the executive compensation
packages which are tied to relative performance evaluation (RPE) and/or absolute terms, where
RPE is measured relative to externally fixed benchmarks or different peer groups. On the other
hand, absolute targets are measured based on fixed internal standards. Holmstrom (1982)
asserts that an optimal incentive contract would insulate the firm from common shocks and
provide a more informative measure by evaluating firm performance relative to its peers.
However, prior literature has shown limited evidence on the use of RPE in compensation
contracts (Antle and Smith 1986; Gibbons and Murphy 1990; Janakiraman et al., 1992;
Aggarwal and Samwick 1999b; Rajgopal et al., 2006; Albuquerque 2009). One possible reason
could be that there was limited disclosure during the time period of their analysis. These
previous studies fail to consider the potentially vital contractual details of RPE contracts, such
as characteristics of peer group, performance metrics, targets and their vesting levels. Directors’
Remuneration Report (2002) and Security Exchange Commission (2006) results in enhanced

6
disclosure and transparency in reporting executive compensation contracts, which in turn
produce an increase in working papers on the subject of RPE provision, mainly in the US.
Surprisingly, there exists only one published work carried out by Carter et al. (2009) for the
single year 2004 in the UK context. At present, firms are much more sophisticated and
innovative in the design of compensation contracts. Regarding this, studies in the area are far
from conclusive and often incomplete. In this gap, we see an opportunity for additional
research. Therefore, we have analysed the adoption and the characteristics of RPE along with
their determinants, specific to the UK market. There are additional concerns on characteristics
of RPE that are set in a manner such that they meet performance targets which leads greater
equity vesting. This crucial aspect also forms another motive for this research we have
undertaken.
1.2 Contribution
This thesis contributes to the existing academic literature on executive compensation in several
aspects.
In explaining higher levels of compensation, this study employs four broad measures of
compensation comprising of short-term compensation (cash compensation), equity pay, total
realized pay (salary, bonus and total equity vested) and total compensation as relying on a single
compensation variable (e.g. total compensation) could lead to a misleading interpretation of
theoretical implications of the findings. Within the UK context, studies do not consider the
actual payouts from equity compensation while analyzing pay for performance associations
(e.g. Ozkan, 2011). This is the first time realized pay has been studied in the UK market. The
growing complexity in the design of compensation contracts arises from varying number and
value of incentives awarded to executives. Therefore, it would be interesting to analyse the
7
effectiveness of different long-term incentive arrangements in strengthening the relationship
between executive compensation and performance.
Previous papers mainly focus on examining the impact of accounting or market-based volatility
on the level of compensation and pay-performance association (e.g. Sloan, 1993), whereas we
elaborate this relationship by looking at performance choices in the compensation contracts of
UK firms. So far, none of the previous research has considered the impact of volatility on either
earning or total shareholder return, both or neither. Also, limited research exists on the selection
of performance measure in equity compensation. Mostly, the choice of performance measures
has been analysed in the bonus contracts. Therefore, this study helps to elucidate the factors
that go into determining the selection of Earnings per Share (EPS) and Total Shareholder Return
(TSR) jointly, EPS and TSR individually, and neither EPS nor TSR. Additionally, the literature
on executive compensation, globally, does not perform a detailed breakdown of EPS and TSR
plan characteristics and relative benchmarks, nor have they examined targets and vesting
percentages triggered at the median and upper quartile threshold in detail, to date.
Consequently, to the best of our knowledge, the dataset used in this research is the most
extensive and detailed in the context of analyzing incentive based contracts.
Additionally, this study represents one of the first attempts to shed light on the scant literature
of compensation contract complexity by classifying and analyzing the finer details of RPE
characteristics by industry for UK firms. A stream of literature focusing on the adoption of
relative performance conditions has not considered absolute measures nor have they analysed
the characteristics of plans with relative performance conditions (e.g. Carter et al., 2009; Gong
et al. 2011). We also investigate the determinants for selection of peer group categories and
threshold targets and vesting levels pertaining to the median and maximum thresholds in RPE
based targets, which was a matter of debate on the topic of executive compensation. The

8
descriptive statistics of this study also provide exploratory evidence on detail breakdown of the
broad index, sector and bespoke peers employed in relative performance evaluation (RPE) plans
that were ignored in the prior literature. To this end, this study also extends the academic
enquiry on RPE and analyses the effect of different characteristics of RPE on the percentage of
equity that vests.
1.3 Outline of the Thesis
The remainder of the thesis is structured as follows and has a thematic arrangement around
executive pay-performance relationship, the choice of performance measures and the selection
of relative performance evaluation. Chapter 2 presents in detail a discussion on the structure of
executive compensation packages in UK firms. Alongside, the most compelling reports on
corporate governance regulations concerning executive compensation are studied in tandem
with their recommendations. The existing reports comprise of the Cadbury Report (1992), the
Greenbury Report (1995), the Hampel Report (1998), the Combined Code (1998) and the
Directors Remuneration Report Regulations (2002).
Chapter 3 provides an overview of a theoretical perspective which has been used in the context
of executive compensation matters and governance conflict. Next, this chapter sets out the
literature review for the following three fields: executive compensation and performance
relationship, the choice of performance measure, and the selection of relative performance in
compensation contracts. The comprehensive review of theoretical perspectives along with
research on prior studies lays a strong theoretical foundation towards the formulation of
research hypotheses and an explanation for these findings. Further, this section aids in providing
a background against which the contributions of this study are to be assessed.

9
The second part of the thesis presents three empirical chapters related to the aspects of executive
compensation.
The first empirical study in Chapter 4 concentrates on the executive compensation package
which has undergone considerable shifts and grown in complexity. In particular, this chapter
distinguishes between the different components of executive compensation packages in order
to provide a detailed understanding of the impact of firm performance on CEO/CFO pay. This
chapter starts with the introduction and background information followed by the literature
review on executive compensation, based on which we then formulate the research hypotheses.
We follow this with discussions on research variables and present several models for the
estimation. After the sample statistics, we discuss empirical results which test the association
between pay and performance by employing broader measures of compensation and firm
performance. The main data sources used in this chapter are the MEIS (data on executive
compensation), DataStream, Fame and the Bloomberg. To determine the impact of different
long-term incentive schemes in aligning executive interests and shareholder wealth, we interact
three-year TSR with different numbers of LTIPs granted by the firm. We also interact TSR with
the value granted within the different numbers of LTIPs and with the type of LTIP awarded by
the firms to analyse pay-performance responsiveness after controlling for corporate governance
mechanisms and firm-specific characteristics. In analysing these associations, we employ fixed
effects model and conduct several robustness tests while employing market adjusted TSR as a
measure of performance.
The second empirical study in Chapter 5 focuses on performance metric employed in the
construction of Chief Executive Officer (CEO) compensation contracts. The first part of the
chapter empirically investigates the explanation behind the selection of EPS exclusively, TSR
alone, neither EPS nor TSR and the joint selection of TSR and EPS performance categories by

10
utilizing multinomial logit model. Similar to the previous chapter, Chapter 5 starts with an
introduction and background information. We apply optimal contracting theory as a basis of
this empirical chapter. We review the literature and propose the hypothesis that greater volatility
in market-based measure results in a greater likelihood of the selection of accounting based
measure. As also, greater volatility in accounting-based measure results in a greater likelihood
for the choice of market-based measure. This chapter continues by explaining the methodology
and presenting sample statistics. Then, this continues by providing distribution of the
performance criteria that are attached to different elements of long-term incentive schemes. The
main data sources used in this chapter are the directors’ remuneration section of the annual
reports, MEIS, DataStream, Fame and the Bloomberg. After discussions on empirical findings
and testing the robustness of main results, the second part of the chapter continues by providing
descriptive statistics on the breakdown of different types of EPS and TSR and comparator group
employed to evaluate firm’s performance and the vesting percentages pertaining to minimum
and upper quartile thresholds of TSR and EPS based measures. Following these descriptive
statistics, we investigate how the detail of TSR and EPS performance target influence the actual
payout. This allows us to analyse whether there exist certain norms and patterns in performance
targets. Chapter 5 ends with a summary of empirical results and a discussion on findings from
the descriptive statistics. The results of these investigations are expected to be of particular
interest to policymakers, as well as, consultants and have been addressed as part of the
recommendation in the thesis.
Chapter 6 consists of the last empirical study where we concentrate on performance standards
with a specific focus on the use of relative performance evaluation in compensation contracts.
We empirically explore the relationship between the common risk and the choice of relative
performance evaluation in compensation contracts. This chapter starts with the introduction and
background context. After an extensive literature review on relative performance evaluation,

11
we hypothesize that greater common shocks result in the selection of RPE plans. Then, we
continue by discussing research variables, descriptive statistics of plans with relative conditions
and the construction of the sample. Multinomial logit model has been utilized, by classifying
firms into “RPE only”, “absolute only” and “absolute and RPE”. While documenting
descriptive statistics, we note that firms vary in their selection of RPE characteristics: peer
group selection, target spread, initial and upper quartile vesting in their relative based plans.
Following these analyses, we investigate the impact of common risk on these characteristics of
RPE. This chapter then focuses on analysing the extent to which these different characteristics
of RPE affect the equity vesting. Chapter 6 ends with a summary of empirical results and a
discussion on the implications of these results.
We have a detailed description of how this research contributes to the already existing literature,
yet some references can be found in the introduction section of each empirical chapter.
Similarly, we provide a brief conclusion at the end of each empirical chapter, a more detailed
discussion and an overall conclusion in Chapter 7, which additionally, outline the possible
avenues for future empirical enquiry in the area of executive compensation.

12
2 CORPORATE GOVERNANCE REPORTS AND THE STRUCTURE OF
REMUNERATION CONTRACTS
The development of corporate governance regulations has its roots in the corporate scandals
that came to surface in the late 1980s and early 1990s, such as the collapse of the BCCI bank
in 1991. Thereafter, in order to gain the confidence of investors, these regulations have focused
not only on the overall corporate governance, but also the transparency and accountability of
executive pay and on internal governance structure for the formation of executive compensation
packages. The corporate governance codes consist of Cadbury Report (1992), the Greenbury
Report (1995), the Hampel Report and the Combined Code (1998), the Directors’
Remuneration Report Regulations (2002) and the 2013 Reforms.7
2.1 The Development of Corporate Governance and Executive Remuneration in the UK
2.1.1 Cadbury Report
The Cadbury Report was published in 1992 and aimed to improve corporate governance by
outlining the responsibilities of the board of directors. This Report specifies the Code of Best
Practice that a company needs to follow in order to meet the highest standards of operations
(Clarke, 2007). It also concentrates on aspects of auditing and financial reporting that the firms
should adhere to, if listed on the London Stock Exchange (LSE). In this regard, it is the firm’s
board of directors’ responsibility to provide an accurate account and statement about its
financial position. This Code of Best Practice is based on the “comply or explain” principle.
7 Although there are many reports around executive compensation and corporate governance, the scope of this
chapter has been defined by those published reports which have been widely discussed and considered to be
influential. However, the other reports which are not discussed and falls outside the scope of thesis are: Turnbull
Report (1999), the Myners (2001), the Higgs Report (2003), the Smith Report (2003) and Walker report (2009).

13
This is characterized by the voluntary compliance by firms where the firms are expected to state
whether they comply with the Code provisions and also explain reasons in case of its non-
compliance. The adoption of such an approach would be considered as best practice.
The Cadbury Report recommends that the board of directors hold regular meetings, aim towards
decentralization of power and authority, and if the CEO also holds the position of the chairman
then it is recommended that there is provision for clear allocation of responsibilities for
balanced power and authority in the company.8 The Code also emphasizes on increasing the
number of non-executive directors (NEDs). These NEDs should exercise greater independence
when making decisions and should not have any vested interests except the fees and their
shareholdings in the company.9 Concerning the fees, the Code outlines that it should explicitly
reflect the time during which NEDs committed their services to the company.10 The Code
furthermore recognizes the vital role played by institutional investors in a company and
encourages them to make sustained contacts with the executives of the company for the
exchange of opinions on performance, strategy, and the overall management quality. Also, the
institutional investors should make proper use of their voting rights in matters related to the
board.
The Cadbury Report offers some guidance on executive compensation. It was also the first
instance that proposed the transfer of responsibility from executives to the remuneration
committee for setting the levels of their own compensation; therefore, recommending that firms
8 See paragraph 4.9 of The Committee on the Financial Aspect of Corporate Governance (1992), Report of the
Committee on the Financial Aspects of Corporate Governance.
http://www.ecgi.org/codes/documents/cadbury.pdf
[accessed on 21 May, 2016]. 9 See paragraph 4.12 of The Committee on the Financial Aspect of Corporate Governance (1992), Report of the
Committee on the Financial Aspects of Corporate Governance.
http://www.ecgi.org/codes/documents/cadbury.pdf
[accessed on 21 May, 2016]. 10 Ibid, para. 4.13.

14
with no remuneration committee (RC) should form one, such that it comprises mainly or wholly
of NEDs, making it less easy for executives to intervene (Girma et al., 2007). Also, the
membership of the RC should be published in the annual report.11 Further, the Report
recommends the disclosure of the total compensation of directors as well as the chairman and
of the top paid director. Additionally, providing separate figures of salary and performance-
based components and a justification of the basis on which this performance is assessed is
required too.12 Lastly, as per the Report, future service contract of executives should not exceed
more than three years without the approval of shareholders.13
2.1.2 Greenbury Report
Greenbury Report was published in 1995 by Sir Richard Greenbury and addresses the growing
concerns over executive compensation schemes. The Greenbury Report incorporates a Code of
Best Practice on director’s remuneration. It outlines the disclosure criteria for executive
compensation, linkage of rewards to performance and the responsibilities of the remuneration
committee.
The Greenbury Report emphasizes on some areas which were already highlighted by the
Cadbury Report. The former Report tasks the responsibility to RC in setting executive
compensation which should mainly consist of NEDs in order to attain greater level of
independence.14 The report further highlights that service contracts and notice period for
11 See paragraph 4.42 of The Committee on the Financial Aspect of Corporate Governance (1992), Report of the
Committee on the Financial Aspects of Corporate Governance.
http://www.ecgi.org/codes/documents/cadbury.pdf
[accessed on 21 May, 2016]. 12 Ibid, para. 4.40. 13 Ibid, para. 4.41.

15
company directors should not exceed a maximum period of one year.15 In accordance with the
notice period, the board in conjunction with the remuneration committee should terminate the
contracts of all non-performing directors of the company for reasons of better governance.
Further, it recommends that the structure of executive compensation is to be a mix of base
salary, annual bonuses, share options and long-term incentive plan.16 The remuneration
committee should prepare a report to the shareholders on behalf of the board that specifies how
firm’s performance is measured, how executives’ rewards are related to it, how performance-
based pay (bonus/LTIP) is linked to short/long-term objectives, and over time how the firm has
performed in relative terms.17 The report should be published in the firms’ annual account.
The Greenbury Report also sheds light upon the need to link executive rewards to tougher
performance conditions, instead of executives receiving awards for a mere increase in the share
price which could be due to inflation or general market-wide movements.18 Also, it is the first
to mention that firms should use comparator groups in measuring relative performance.19
PricewaterhouseCoopers (PWC) conducted an analysis in 1999 on the firm practices after the
implementation of the Greenbury report in 1995 and concluded that most firms complied with
this regulation only in their broadest terms, while a handful provided a finely detailed
reporting.20 This suggests that firms disclose compensation practices differently. This could be
14 See paragraph 4.8 of The Committee on the Financial Aspect of Corporate Governance (1992), Report of the
Committee on the Financial Aspects of Corporate Governance.
http://www.ecgi.org/codes/documents/cadbury.pdf
[accessed on 21 May, 2016]. 15 See paragraph 7.13 of The Directors Remuneration: The Report of a Study Group Chaired by Sir Richard
Greenbury (1995), Greenbury Committee.
http://www.ecgi.org/codes/documents/greenbury.pdf
[accessed on September 21, 2016]. 16 Ibid, para. 6.14. 17 Ibid, para. 6.19. 18 Ibid, para. 6.38 19 Ibid, para. 6.39. 20 Department of Trade and Industry, Monitoring of Corporate Governance Aspects of Directors’ Remuneration
(1999), PricewaterhouseCoopers.
http://webarchive.nationalarchives.gov.uk/20060214022110/http://www.dti.gov.uk/cld/pwcrep.pdf
[accessed on September 21, 2016].

16
partly due to the Greenbury Report not establishing a standardized format concerning this.
Moreover, the RC reports to shareholders on the remuneration policy but it does not require
approval of shareholders in setting this up, also giving the RC flexibility on the information
they disclose.
2.1.3 Hampel Report and the Combined Code
The Hampel committee was established in 1995 and chaired by Sir Ronald Hampel. It endorses
corporate governance as an important tool for the prosperity of the business. It reviews and
reforms some of the recommendations and policy statements outlined in the previous two
reports. However, the Committee also proposed that the recommendations of Cadbury,
Greenbury and Hampel should be included in a single Code of Corporate Governance.
As such, the Hampel Report provided a list of boardroom principles that companies should
adhere to. For instance, the board should be efficient in producing reliable information in a
timely manner and should have at least one-third of non-executive directors on it.21 The role of
chairman and CEO are different positions and preferably should not be held by the same
individual. However, if these two roles are given to the same individual then this needs to be
justified.22 Further, it also highlights the benefits of shareholder activism to a company. At the
time when the report was published only a few shareholders attended the AGM but the more
the number of attendees, the more meaningful the AGM becomes, possibly holding directors to
become more accountable towards the shareholders. Moreover, the AGM is one of the
21 See paragraph 3.14 of The Committee on Corporate Governance: Final Report (1998), The Report of the
Committee on Corporate Governance.
http://www.ecgi.org/codes/documents/hampel.pdf
[accessed on September 21, 2016]. 22 Ibid, para. 3.17.

17
opportunities for small shareholders to be updated on activities of the company that involves
their immediate presence and thus it would be good practice to have presentations concerning
the same, with a scope for question and answer sessions for a more direct interaction with the
shareholders.23
Hampel Report stresses the use of fixed pay for non-executives and suggests that if firms find
it useful to provide incentive compensation in the form of firm’s shares, they should do so, but
refrain from making it a universal practice.24 The Report does not suggest additional refinement
in the Greenbury Report concerning performance-based pay of executive directors.25 However,
the report hints toward simplification of disclosure of compensation packages which may
become too complex for a general audience.26 Additionally, as firms merely make a statement
in the annual report concerning their compliance with the Code, without providing full
disclosure of details of firm’s practices in achieving the provisions of the Code, from the
perspective of the shareholders it may become merely a box-ticking procedure.27
Concerning the Combined Code which was published in 1998, now the UK Corporate
Governance Code (UKCGC), this was revised in 2003, later updated in 2016 and contains many
of the recommendations already stated in the Combined Code (Petrin, 2015) and has therefore
not been considered as this falls outside the remit of the present thesis. The Combined Code
establishes the aspects of corporate governance practices. It covers issues related to the
management and operations of the company, including the board of directors, the remuneration
packages for the board members and executives, and accountability as well as audit. In this
23 See paragraph 5.14 of The Committee on Corporate Governance: Final Report (1998), The Report of the
Committee on Corporate Governance.
http://www.ecgi.org/codes/documents/hampel.pdf
[accessed on September 21, 2016]. 24 Ibid, para. 4.8. 25 Ibid, para. 4.7. 26 Ibid, para. 4.16. 27 Ibid, para. 6.19.

18
regard, the role of the board should operate in such a way that it matches the goals and objectives
and contributes towards firm enhancement. The board should consist of an equal ratio of
executives and non-executives and should provide accounts of the company that reflects its
financial position. The board should undertake the responsibility of setting up an audit
committee to play a role in revising the company accounts (Alregab, 2016). It also encourages
a continuous dialogue with its shareholders to understand their concerns. In addition, the Code
also tasks institutional shareholders with the responsibility of making use of their voting rights.
According to this report, executive compensation packages are to be designed in a manner that
they attract, motivate, and retain talented executives while avoiding excess pay that outweighs
the value of the services delivered. To align executives’ interests with shareholders, it is vital
for a firm to proportionally allocate the performance-based element of pay.
2.1.4 Directors’ Remuneration Report Regulations
Prior to 2002, the previous codes in the Cadbury, Greenbury, and Hampel Reports focused less
on the disclosure requirements concerning executive compensation in comparison to Director’s
Remuneration Report (DRRR), which made this disclosure requirement more stringent. DRRR
aims to strengthen the link between pay and performance and improve transparency in setting
executive compensation. Consequently, the disclosure of pay arrangements became more
rigorous, as well as detailed, aiding the public and investors to get a better insight into executive
compensation matters (Petrin, 2015).
DRRR had to go through an internal audit before being approved by board of directors and
shareholders. In fact, it was necessary for all quoted firms to disclose remuneration reports of
their directors (Alregab, 2016). This report displays tables which compare executive pay and

19
performance over a five-year period. In addition to the information of RC role and their
membership, it demonstrates compensation policy, year on year change in executive
compensation, pension entitlements, base salary, and grants of share options and LTIPs of each
individual director and termination payment.28 Moreover, the report specified that the directors’
remuneration report had to be verified by the company’s external auditors. By doing so,
investors and shareholders can evaluate whether the executives met the performance criteria as
specified in their plan or not. Lastly, shareholders pass a non-binding say-on-pay vote,
demonstrating whether they approve the remuneration report or not (Petrin, 2015). Taken
together, these regulations are quite nuanced with regards to executive compensation schemes.
2.1.5 2013 Reforms
The disconnect in pay and performance relationship which led the UK Government to introduce
a more stringent framework, taking effect from October 1, 2013, applies to public quoted firms
(Petrin, 2015). In fact, it is noteworthy that these said insufficiencies were aggravated by the
2007 recession.
These reforms made several recommendations, but of interest, here, is the Three-part Director’s
Remuneration Report. The company’s reporting on remuneration needs to be divided into three
different parts. The first part is related to the annual statement with a personal reflection from
the chairman of the remuneration committee. The annual statement summarizes key decisions
made by firm directors concerning their remuneration as well as accounting for any substantial
changes. Secondly, the report requires all public limited liability firms to provide a detailed
28 See The Directors’ Remuneration Report Regulations (2002), the ‘2002 Regulations’, amending the Companies
Act 1985.
http://www.opsi.gov.uk/si/si2002/20021986.htm
[accessed on September 19, 2016].

20
account on the implementation of the remuneration policy and the compensation awarded to
the directors of the firm that appears in the annual report (Mallin, 2010). In addition,
remuneration report for directors should contain information on each element of the
remuneration package. Although it was already stated in the 2008 Regulation29, it was
reinforced in the 2013 Regulation that firms must provide a single remuneration figure for each
individual director.30 This should be displayed in the table and break down of the components
consisting of salary, benefits, pensions, annual bonuses, equity compensation from achievement
of performance targets and realized amount from LTIPs. Finally, the last part comprises of the
remuneration policy of the directors as approved by the firms’ shareholders.31
2.2 Executive Compensation Structure
Executive compensation contracts play a vital role in attracting, motivating, and retaining
executives. It is important to analyse the structure, as a well-designed compensation contract is
considered to be important for the long-term success of the company. These contracts consist
of fixed and variable components and involve the following elements of executive
compensation: base salary, annual bonus, share options, performance share plans, matching,
benefits-in-kind, and pension.
29 See the section 2.4 of the brief by Tim Edmonds and Andrew Clark (2017), Banking executives' remuneration
in the UK - Parliament UK, House of Commons Library.
http://researchbriefings.parliament.uk/ResearchBriefing/Summary/SN06204#fullreport
[accessed on June 21, 2017]. 30 See for more details on the Schedule 8 of the 2008 Regulation
http://www.legislation.gov.uk/uksi/2013/1981/schedule/made
[accessed on June 21, 2017]. 31 Ibid, Part 3, section 4 -10.

21
2.2.1 Base Salary
Base salary is a fixed element in the executive compensation contract. It is usually paid monthly
and reviewed, in most cases, annually. The previous literature argues that salary is a
fundamental cash component for attracting talented executives (Murphy, 1999; Solomon,
2007). The amount of salary could be influenced by labour market forces and individual
differences, such as age and experience. Since other elements of compensation are awarded as
a percentage of salary, for instance, annual bonuses and the equity component of the
compensation, this makes salary a crucial component of the compensation as a rise in base
salary will also correspond to an increment in other components of executive compensation.
In recent years, there has been a shift in the structural composition of executive compensation
packages. As reported by Ferri and Maber (2013), in 2005, on an average, 47% of the UK total
compensation comprised of equity pay as opposed to 50% of the total compensation which was
made up of base salary in 2007, as shown by Conyon et al. (2000). This indicates that over time
firms place greater emphasis on the equity component of the compensation.
2.2.2 Annual Bonus
The bonus is one of the variable components of the compensation contracts and is awarded to
executives annually, either in the form of cash payments or deferred shares or both. Like other
incentives, it is calculated as a percentage of salary and is designed to compensate executives
after meeting pre-specified short-term performance targets, which are usually based on
financial yardsticks, such as profit, cash flow, return on assets (ROA) or individual performance
targets established for that year. Sometimes operational yardsticks are also present in bonus
contracts; these may consist of employee health and safety, individual productivity and the

22
customer satisfaction, as shown in the prior literature (Conyon and Sadler, 2001; Mallin, 2007;
Sapp, 2008 etc). Therefore, it indicates that bonuses may include individual performance targets
along with group performance targets. Unlike the salary element of executive compensation,
bonuses are payments conditioned upon prior-achieved performance, as opposed to the future
performance (Kim and Nofsinger, 2007). In 2011, more than 95% of firms included bonus
contracts in their compensation packages, in contrast to 53% in 2007, as indicated by Bruce et
al. (2007). This sheds light upon the proposition that the elements of compensation packages
have undergone a considerable change.
2.2.3 Equity Compensation
2.2.3.1 Share Options
The grant of share options is usually limited to senior executives but may be extended to other
employees of the firm. They give a right to executives (employees) to buy shares at a fixed
price for a pre-specified term. Executive options typically vest three years after the grant date
based on achievement of performance targets. Generally, an option expires between three to ten
years from the grant date, after which the executive can no longer exercise the option. The
majority of UK companies select ten-year option terms. Other important features of these
options are that they are non-tradable and are terminated once executives leave the company,
thus incentivizing them to retain their affiliation with the company. When reward vests,
executives simply receive the difference in market price on the exercise date and the strike price
as determined on the grant date.
In the 1970s, share option schemes were introduced in the UK which gained much popularity
between the late 1980s and early 1990s (Lee et al., 2007). Pre-1995, the award of executive
share options was contingent upon time and was considered to be the only equity vehicle of

23
choice. Previous studies have shown that executives take actions that lower exercise prices in
order to maximize the value of options on the day of exercise, hence, conventional time-based
options can be engineered (Bebchuk et al., 2002). Share options offer a risk-free opportunity as
executives do not make any loss on a fall in share price but they gain with an increase in the
share price. However, recent corporate governance reforms worldwide place a greater emphasis
on share options to be subject to tougher performance conditions. Moreover, firms use different
terminologies for share options such as stock options, performance options, and executive share
option schemes (ESOs) as seen in annual reports. All different forms of long-term incentives
are granted to achieve long-term goals and objectives of the company.
2.2.3.2 Performance Share Plans
Performance share plans (PSPs), also known as nil-cost options, are options on the company’s
stock with a zero-strike price which pay cash on the day they are exercised. Firms rarely
construct PSPs in the form of cash reward and are mostly awarded in the form of shares. These
shares are provided to executives after fulfilment of certain performance criteria as mentioned
in their compensation contracts, which typically last for three years and are frequently updated
on a rolling basis. In PSPs, unlike share options, participants benefit from the whole value of
award not just the difference, since the exercise price is zero. Thus, PSP award valuation is
calculated as the multiplication of firm’s share price and maximum potential of share that
executives can receive from the award.
24
LTIPs are more commonly referred to as performance share plan32 and have gained popularity
following the Greenbury Report recommendations. One of the main reasons behind the
introduction of LTIPs was due to the absence of performance condition or sometimes lack of
rigorous performance conditions in share options. Presently, in annual reports, the term “long-
term incentive plan” is used in a much broader sense for all types of equity plans and is not just
restricted to performance share plans only. As an example, the firm Britvic, in 2012, awarded
share options under the category of LTIPs. Other different terminologies for performance share
plans are executive incentive plans, condition shares, restricted stock shares, executive
incentive plans, and performance share awards (PSA).
Long-term incentives encourage senior executives to improve long-term performance, by doing
so, also enhances shareholdings in the company. Occasionally, executives are awarded one-off
equity payments such as recruitment, retention or turnaround payments.
2.2.3.3 Share Matching Plans
Share matching plans, also known as co-investment plans are those in which executives invest
part of their annual bonus in shares and if long-term performance conditions are met after three
years, they receive a multiple of their initial investment in the form of shares. For some firms,
this deferral is compulsory rather than voluntary. For example, in a “2:1” share matching plan,
an additional grant of 200,000 shares is awarded on top of the initial deferral of 200,000 shares.
This is conditioned on achieving performance targets.
32 See the paper by Kendon, Benns, and Sharman, Long Term Incentive Plans and Deferred Bonus Plans (UK),
Bird & Bird.
https://www.twobirds.com/~/media/pdfs/expertise/employment/employment-incentive/long-term-incentive-
plans-and-deferred-bonus-plans.pdf
[accessed on August 14, 2017].

25
2.2.4 Benefits-in-kind
Benefits-in-kind consists of health insurance, club memberships, colleague discount, car
allowance, private use of jet, and other kinds of indirect benefits. Another example of
executives’ benefit could be when they are reimbursed for the distance or time travelled
between their home and office. Usually, benefits-in-kind form a small proportion of executive
compensation package, nonetheless, forming an important element for a company to be
competitive in order to acquire talented executives.
2.2.5 Pension
Pension is mostly dependent upon the base salary component (which could build up over time
or with bonuses) and encourages executives to work hard, alongside fulfilling the firm’s
objective to retain their executives, as it is not received until his/her retirement, thus motivating
the executives to stay longer in the firm. Like other elements of compensation, an increase in
base salary will, therefore, have an implication for the pension in the following years. Pensions
have gained much popularity recently, partly due to the general increase in amount and also due
to cases of very generous pension payments awarded to the outgoing executives of failed firms.
For example, the outgoing CEO Martin Winterkorn at Volkswagen got a pension pot of €28.6
million despite the scandalous revelation of the company rigging emissions tests.33 While in the
UK, the Royal Bank of Scotland announced a loss of £24.1 billion but still awarded its CEO a
33 Alan Tovey (2017), Departed VW chief Martin Winterkorn could get £22m payoff despite scandal, The
Telegraph.
http://www.telegraph.co.uk/finance/newsbysector/industry/11887750/Departed-VW-chief-Martin-Winterkorn-
could-get-22m-payoff-despite-scandal.html
[accessed on August 14, 2017].

26
lump sum of £650,000 pension funds.34
34 Emily Garnham (2009), Failed RBS boss keeps quiet over his £650k pension, Sunday Express.
http://www.express.co.uk/news/uk/86523/Failed-RBS-boss-keeps-quiet-over-his-650k-pension
[accessed on August 14, 2017].

27
3 LITERATURE REVIEW
3.1 Introduction
As one type of popular area in corporate governance, the topic of executive compensation is a
complex, constant work in progress and attracts numerous researchers. In this chapter, we
review the significant body of empirical work in the field of executive compensation. Secondly,
we provide an overview of theoretical frameworks which aid in explaining the association
between executive compensation and firm performance and the way in which firms set specific
contractual terms in the executive compensation package.
3.2 Theoretical Perspective on Executive Compensation
In the last few decades, various theoretical perspectives have been developed which have sought
to establish an appropriate mechanism in the formation of executive compensation or presently,
the way these theoretical perspectives explain the existence of a certain type of compensation
structure in various settings. These theories consist of agency theory, managerial power theory,
and tournament theory.
3.2.1 Agency Theory
Agency theory has had a huge impact on the finance and economics literature for many decades
(Muth and Donaldson, 1998) and has also been studied in the context of corporate governance,
predominantly, executive compensation (Ross, 1973). Shareholders own the company and
managers work as agents to run the company on shareholders’ behalf. There exists an
information asymmetry as shareholders cannot monitor agents’ activities directly and the
managers have access to privileged information concerning the financial position of the

28
company since they are experts in their respective fields. Like other individuals, CEOs tend to
pursue objectives that increase their own well-being. Consequently, this divergence of interests
between executives and shareholders gives rise to an agency issue.
Post-1970s, the application of agency theory in compensation setting became popular with a
greater focus on information symmetry between the principal and the agent.35 Jensen and
Meckling (1976) contend that this information symmetry causes contradictory motivations
between the principal and the agent and that the issue of “separation and control” might be
settled by writing appropriate contracts which comprise of stock-based compensation as well
as effective monitoring. Later, Jensen and Murphy (1990) suggest that firms should devise
contracts that assist in mitigating agency problems. They also contend that “how to pay” is a
much bigger issue than the magnitude of pay. Agency theory focuses on closely tying the
reward to actual or perceived firm performance. Firms seek to design optimal compensation
policies that retain, attract, and motivate executives and aim to align executive interests with
that of the shareholders (Conyon, 2006).
3.2.2 Managerial Power Theory
An alternative theory proposed by Bebchuk et al. (2002) and Bebchuk and Fried (2003) is the
managerial power perspective. They contend that the process of compensation setting has
strayed from the arms-length bargaining to rent extraction and the responsibility of this lies
upon the shoulders of managers who hold key positions in the company. Although agency
theory views performance-based pay as a key mechanism to solve agency problems, the
35 Note: The literature has largely focused on information symmetry between the principal and the agent for the
disparity between the information that is accessible to these parties. However, another potential reason maybe that
shareholders are diverse group while the managers are a more coherent group.

29
managerial theory proposes that it creates further problems. This could be partly because agency
theory ignores the powerful position occupied by the executives that control the sources of the
organisation. Managerial power theory can take several other forms, for example, the influence
of CEOs on the selection of easy performance targets, etc. The influence of CEO and other
executives, directly or indirectly on the compensation committee, or on the board, is another
important aspect in explaining executive compensation matters. In other words, board and
remuneration committee aids in forming such compensation schemes that are favourable to
executives. The manager power view also implies that levels of pay are too high and
compensation contracts are designed poorly.
According to managerial power theory, the amount of rent extraction is the value of pay in
excess of what executives would receive under a scheme that maximizes the shareholders’
value. An example of rent extraction is when firms offer stock option grants to the executives
which do not strongly link pay to performance. This enables executives to reap windfall gains
for a mere increase in share price that is due to fluctuation in market or sector in which the firm
operates.
Managerial theory believes that both internal and external directors of the firms have some
hidden agenda to serve managerial interests as opposed to those of shareholders (Bebchuk and
Fried, 2005). This thought process stems from the day to day relationships between executive
directors on the board. The authors also point out that directors manipulate compensation
contracts in ways that lead to higher managerial pay. By doing this, it is expected that their own
compensation will also rise. Much of the extant literature on pay and performance has been
analysed mainly from amongst these opposite strands of perspectives, either agency or
managerial power theory.

30
3.2.3 Tournament Theory
Over time Tournament theory (Lazear and Rosen, 1981) has gained much popularity in the area
of executive compensation. It emphasizes on rank order compensation schemes and offers an
effective way for the principal to evaluate and motivates managers when their efforts are
unobservable. In this context, prior empirical studies have focused the performance of the firm
resulting from the tournament. Some studies (Frederickson, 1992; Hannan et al., 2008) find that
tournaments are an effective way to reduce risk to managers when some risks are common
among all managers. This results in higher level of managerial effort in the tournament as
opposed to individual schemes, such as fixed pay. Thus, in these tournament based incentive
schemes, executives are awarded higher compensation for relative performance as opposed to
absolute performance.
3.3 Empirical Literature
The literature on executive pay is vast and the empirical studies selected for the general
literature in this thesis are not exhaustive but each empirical chapter of the thesis also provides
a specific literature to the topic of the respective chapter. Therefore, the following paragraphs
focus only on the general background, noteworthy studies, and the recent trends of research on
executive compensation.
3.3.1 Discussions on Pay for Performance Relationship
Executive compensation is one of the most extensively analysed research areas in the field of
corporate governance. At the core of the majority of theoretical and empirical studies lies the
question whether there exists a relationship between executive compensation and firm

31
performance. Although, the incentive system in the UK is much stricter and transparent, yet it
is more complex than that in the US. However, it is noted that a large corpus of literature has
more generally focused on the US.
Prior studies have also been carried out for countries other than the UK and US (Kaplan, 1994a;
Kato, 1997 in Japan; Kaplan, 1994b, 1999 in Germany; Izan et al. 1998 in Australia; Zhou,
2000; Sapp, 2008 in Canada; Duffhues and Kabir, 2008 in Netherland; Cao and O’Halloran,
2012 in Ireland). For example, Kato (1997) reports a positive link between executive
compensation and firm performance, measured by ROA, of 154 large Japanese firms. Whereas,
Kaplan (1994a) finds a negative relationship between pay and performance for Japanese firms.
Another research by Kaplan (1994b), consistent with his findings in Japan, reports a negative
association between pay and performance for German firms in the 1980s. On the other hand,
Zhou (2000) shows a positive association between executive compensation and company
performance for 755 Canadian firms over the years 1991-1995. The author employs total
compensation as a measure of salary, bonus, the value of stock options and long-term incentive
plans granted during the year. Izan et al. (1998) do not show any significant link between firm
performance and executive compensation for Australian firms. Their results remain robust
within different specifications of compensation model (i.e. “changes” versus “level”). On the
other hand, Duffhues and Kabir (2008) find a negative pay and performance relationship for
750 Dutch firms in the transportation, manufacturing and financial industries. Their study
indicates that executives receive awards which they do not actually deserve. However, the
results of their study contradict with the argument that executives are awarded for adding
shareholder value. These research studies identify a mixed evidence of a relationship between
executive pay and firm performance. The findings of these studies suggest that trend of pay-
performance responsiveness may be company specific, as well as prone to be impacted by the
presence of institutional owners or corporate governance codes. Even, the country-level

32
corporate governance characteristics and executive compensation transparency could be
influential factors in explaining these results.
Turning towards US firms, one of the most influential studies that shed light on the association
between executive compensation and performance for these firms is by Jensen and Murphy
(1990). They find a statistically positive significant relationship between pay and performance
and show that CEO wealth changed by $3.25 for every $1000 increase in shareholder wealth
for US firms. Leonard (1990) studies 439 large US companies from 1981 to 1985. His results
show that a firm which grants equity incentives such as traditional stock options tends to
increase the ROE of the company and the companies that award bonuses in their compensation
plans perform better than those that do not incorporate bonus schemes in their compensation
contracts. However, the authors do not control for any corporate governance variables in their
investigation.
Mehran (1995) examines the structure of executive compensation structure for 153
manufacturing US firms across the years 1979 to 1980 by employing OLS estimation. The
measures of executive compensation comprise of the percentage of total compensation which
is equity-based and the percentage of total compensation in the form of salary and bonuses.
However, the author uses return on assets and TSR as proxies for firm performance. Mehran’s
(1995) result shows a significant positive association between equity-based compensation and
firm performance. The author also points out that the manager’s aim for more structural
compensation, in order to bear less personal risk, is the manager’s preference of cash pay over
equity-based pay.
Aggarwal and Samwick (1999a) study 1500 large US firms from 1993 to 1996 by employing
Ordinary Least Square (OLS) method. Their results provide support for the existence of the
principal-agent model in executive compensation package and indicate a positive association

33
between total shareholder return and total compensation (measured by salary and bonus), as
consistent with the findings in Deckop’s (1998) study. The results by Sigler (2011) also show
a positive relationship between pay and performance for 280 US firms after the Sarbanes-Oxley
Act. However, unlike Aggarwal and Samwick’s (1999a) study, Sigler (2011) uses total
compensation as a measure of salary, bonus and stock gains. The latter also employs sales, firm
size and return on equity (ROE) as explanatory variables, and points out that the firm size is the
most dominant factor in determining the level of CEO compensation. The results of this study
are congruent with the findings of Sridharan (1996), who observes CEO base salary to be
positively related to sales growth, the value of assets, and firm size.
In the UK context, Main et al. (1996) are the first to investigate the equity component of the
compensation for a sample of 50 companies during the periods 1983 to 1989. The authors find
that an inclusion of share options in executive compensation packages increases pay-
performance sensitivity, leading to a reduction in agency problems. During the period of their
research analysis, share options were the only available element of the equity compensation.
Other studies in the UK context, carried out by Gregg et al. (2005), Gregg et al. (2012), Conyon
and Peck (1998) find little evidence of the existence of a pay-performance relationship.
However, these researchers employ only the cash element of CEO compensation. In an
unpublished study, Gregg et al. (2005), analyses the pay-performance relationship for large UK
companies from 1994 to 2002 by employing fixed effect regression method. Their study finds
a weak significant relationship between compensation and total shareholder return while
employing a single compensation measure as a sum of salary, bonus and pension. These results
are consistent with agency theory and with those of Conyon and Peck (1998) and Conyon and
Sadler (2001) which show a statistically weak relationship at the 10% level between pay and
performance for UK companies. Gregg et al. (2012) investigate the impact of cash-plus-bonus
on firm performance for financial and non-financial firms from 2007 to 2008 during the period

34
encompassing the global financial crisis. The authors also argue that although the level of CEO
pay is higher in financial firms, there is no significant difference in pay-performance sensitivity
for financial and non-financial firms.
Later on, Ozkan (2011) investigates the impact of previous year stock returns on CEO
compensation from 1999 to 2005 by employing fixed effects regression model. The author uses
cash compensation as a measure of salary and bonus and finds a positive significance only with
the cash component of the compensation. The results also show significant evidence of the link
between firm performance and total direct compensation (the sum of base salary, bonus, and
granted value of LTIPs and options as their compensation measure). The author does not
consider performance condition and vested value of LTIPs, having only made assumptions
about the performance targets that ought to be achieved in the future.
Over time, the literature on executive compensation has sought to examine the impact of
corporate governance characteristics on the level of compensation or controlling for corporate
governance mechanisms. Among this latter group, key studies include Conyon (1997) that
investigates the effect of corporate governance mechanisms on director compensation of 213
large UK firms between 1988 and 1993. The author employs chair duality and existence of
remuneration committee as corporate governance variables and shows little evidence of the role
of corporate governance mechanisms in shaping executive compensation. Sapp (2008) focuses
on pay-performance relationship of top five executives for a set of 400 Canadian firms from
2000 to 2005, and finds out that the board of directors and different types of shareholders
influence the level and the structure of the executive compensation, although the author does
not find any evidence of relationship between compensation and most measures of firm
performance.

35
More recently, Conyon (2014) studies the relationship between corporate governance
mechanisms and executive compensation for S&P 500 and S&P Mid-Cap companies. The
analysis shows that board of directors and remuneration committees are independent in the
establishment of executive compensation packages. Concerning executive compensation, on an
average, it is positively related to the size of the firm and company performance. The author
states the option as the most widely used component of equity compensation. There has also
been a shift from granting fixed elements of pay towards the granting of riskier elements of pay
namely, performance-based/equity pay. Ozkan (2007) focuses on the UK market between the
years 2007 and 2008 and investigates how the corporate governance characteristics, such as
board size and institutional ownership, influence level of CEO compensation. The study finds
that the board size is positively linked with the level of compensation, whereas the percentage
of institutional ownership has a negative impact on the level of compensation.
Despite the widely-held perception on the disconnect between executive compensation and firm
performance, until now in this regard, little attention has been paid in defining several measures
of executive compensation and firm performance. As discussed earlier in Chapter 2, in the
1990s several reports such as Cadbury (1992) and Greenubry (1995) focus on attracting
attention towards issues surrounding corporate governance and consequently have led to
various reforms which have improved the transparency in the executive remuneration. Since
then there has been an advancement in linking stock options or shares to performance targets.
These incentive mechanisms have been implemented after decades of effort to bridge this
disconnect.
Different from time conditioned share options, options which are contingent upon performance
are also referred to as performance-vested stock options (PVSOs). The use of performance-
vested stock options in compensation plans was initially supported by regulators and activist

36
shareholders. There has been disquiet concerning incentive effects of performance-vested stock
options. Gerakos et al. (2005) argue that firms merely grant PVSOs to lessen investor’s concern
and that an adoption of PVSOs with achievable performance criteria will not deliver additional
incentives. In contrast, as pointed out in its Global Best Practice 2006 for ‘‘Corporate
Performance Management’’, PWC supports the use of the performance-vested equity grants in
compensation contracts. Since the mid-2000s, the literature that has emerged includes in its
investigations, whether the adoption of long-term incentive component is effective in aligning
executives’ interests and shareholder wealth, for example, as analysed by Buck et al. (2003)
and Kuang and Qin (2009). Buck et al. (2003) show that the adoption of LTIPs reduces the pay-
performance sensitivity, while Kuang and Qin (2009) analyze only PVSOs and document that
its introduction strengthens the association between pay and performance in aligning
executives’ interests and shareholder wealth, for example, as analysed by Buck et al. (2003)
and Kuang and Qin (2009). Buck et al. (2003) show that the adoption of LTIPs reduces the pay-
performance sensitivity, while Kuang and Qin (2009) analyze only PVSOs and document that
its introduction strengthens the association between pay and performance. The drawbacks of
both the studies are that they only look at single components of equity compensation and use
the performance period of one year, LTIPs, however, being three-year plans. The studies will
be discussed in more depth in Section 4.2.

37
3.3.2 Discussions on Performance Choices in Compensation Contracts and Optimal
Contracting
Agency theory has emerged as being very crucial to accounting and finance literature in the last
thirty years and has been examined mainly to differentiate conflicts of interest and incentive
problems. There exists a strand of literature that focuses on studying various aspects of the
agency problem in executive compensation setting, amongst which is the use of accounting
measures (Holmstorm, 1979, 1982).
Interestingly, agency theory does not specifically mention the selection of accounting or
financial performance metrics in a compensation contract, but the theory can be employed to
determine properties of accounting or finance variables for assessing the agent’s performance.
Among academics as well as in the corporate world, the relative merits on which market-based
measure versus accounting measures are to be selected is still debatable. The greater prevalence
of the use of stock prices as a market-based measure has been observed since the 1990s.
Initially, price-based measures are mainly used in incentive contracts and over time, firms have
started to employ accounting based measures in compensation contracts. By way of illustration,
Larcker (1983) finds that only twenty-five firms use accounting-based plans in CEO
compensation contracts, while Kumar and Sopariwala (1992) find only sixty-two companies
that incorporate plans with accounting performance conditions attached. Kaplan and Norton
(1992) develop a non-financial measure technique known as a “balanced scorecard” in
compensation contracts, which employs various performance measures with different relative
weights, unlike the specific use of total shareholder return, return on investments or earnings.
Later studies have charted the introduction of non-financial measures in bonus contracts, for
example, customer service, production and safety (Ittner et al., 1997). One of the limitations of

38
their study was that they restrict their analysis to bonus contracts, thus, excluding the equity
component which forms the major element of the compensation package.
Holmstorm (1979) proposes the “Informativeness principle” which states that any performance
metric with high signal quality in revealing CEOs actions should be included in the
compensation contract. In reality, if markets are efficient and firms have all the necessary
information that is known to the market, the use of stock-based measure should be redundant
in compensation contracts. This validates the property of optimal contracting framework.
According to the informativeness principle, information on accounting earnings are not only
useful because investors care about earnings but also because it improves contracting, as these
reveal the actions of managers beyond what stocks measures fully capture.
Theoretically, accounting or even non-financial measures are mainly introduced to filter
common noise in compensation contracts. For example, Ittner et al. (1997) have examined the
adoption of financial or non-financial performance measures in bonus contracts of US firms.
Their results show that the selection of non-financial measures is an increasing function of noise
in financial performance measures. On the other hand, the most widely recognized reason that
led to the use of earning metrics is that earnings reflect components which are under the direct
control of the management (O’Byrne, 1990; Watts and Zimmerman, 1990).
Banker and Datar (1989) state that even if CEOs make decisions in the best interest of the firm,
if the performance measure is noisy, it restricts the ability to have the same impact of what the
performance measure should have been without the noise. Therefore, less weight placed on
noisy performance measure will increase the strength and the value of an incentive contract. On
the other hand, the lesser the noise is, the more accurate and consistent the performance measure
becomes (Franco-Santos, 2007). Empirical studies test agency theory predictions in
compensation contract by testing pay-performance sensitivity and relative noise between an

39
accounting or market-based measure. Sloan (1993) examines the role of accounting measures
in salary and bonus components of the compensation and documents that the use of earnings in
a compensation pay setting will tend to shield compensation from market fluctuations in stock
prices. The author also suggests that if the stock price is a relatively noisy element, then
compensation will be more sensitive to earnings than stock returns.
Lambert and Larcker (1987) investigate the relationship between pay and performance by
applying agency framework and analyze whether accounting or market measures are considered
to be more informative to shareholders. The results indicate that weight assigned between the
market-based measure and accounting measure is a function of noise in these two performance
measures, where the noisier the accounting based measure is, the lesser is the weight of the
accounting measure. Additionally, growth firms tend to place more weight on market-based
measures. For the measure of compensation, the author employs salary and bonus component
which the authors believe to be 80 percent of the executive compensation. These studies note
that both these performance measures are related to changes in CEO cash compensation only.
De Angelis and Grinstein (2015) provide the details of performance criteria in US equity-based
grants for the year 2007 only. The research findings indicate that there exists significant
variance in the choice of performance measures employed by firms and we can also infer from
their empirical results that firms opt for performance measures which are more informative of
CEO actions. Furthermore, growth firms and businesses with complex structure prefer to
employ market-based measures over accounting-based measures.
Turning towards the choice of performance measure, so far in the UK context, there are three
studies covering this aspect. Conyon et al. (2000) present a breakdown of performance
measures linked to CEO stock options only. Their study ignores other components of equity
compensation and does not give any details of performance targets. Whereas, Pass et al. (2000)

40
and Zakaria (2012) provide details of EPS and TSR performance targets. For EPS, they consider
minimum performance threshold target only. While for TSR performance measure, they
provide very little details of the relative benchmark to TSR and do not provide any details of
threshold performance required. These studies also ignore the vesting criteria pertaining to these
thresholds.
Firms are increasingly employing non-financial key performance indicators (KPIs) in their
bonus contracts.36 In addition to financial-based measures in LTIPs, some firms have also
started to employ KPIs in these equity plans. Traditional performance measures such as TSR
or EPS influences stockholders since they own companies’ shares. KPIs such as employee
health, safety and environment are very important for stakeholders over the long term since
they are critical to the success of the organization and indicates whether or not the organization
is on track towards its stated objectives.
3.3.3 Discussions on RPE-based Contracts
In devising compensation contracts, targets can be set in relative or absolute terms. Relative
performance is measured against an externally-derived benchmark and absolute performance is
measured on the basis of set internal standards. During performance benchmarking, if firms
select absolute measures, this process can be classified as “fixed benchmarking” and requires
little data. In contrast, relative benchmarking has greater data requirements as it involves
appropriate peers to evaluate the relative performance of the company. Firms employ
36 Hass et al. (2014), Measuring and rewarding performance: Theory and evidence in relationto executive
compensation, CFA Society 2014.
https://secure.cfauk.org/assets/1298/Remuneration_Report.pdf
[accessed on May, 2018].

41
performance targets to assess agents’ performance as they provide critical information
concerning managers’ behaviour and also grant rewards for higher firm performance.
As discussed earlier in Section 3.2.1, agency theory postulates that firms can strengthen the
interest alignment between executives and shareholders by tightening the relation between
executive compensation to firm performance. However, if the performance of the company is
assumed to be influenced by external shocks, then it restricts the ability of CEOs to maximize
shareholder wealth as firms are exposed to economy-wide shocks which CEOs cannot directly
control. The contract may not be optimal if the performance of the company is correlated with
either market or sector performance. Thus, the firms’ use of absolute measure will merely
compensate or penalize executives for general market-wide movements (Camara, 2001).
Holmstrom (1982) proposes that an optimal compensation scheme would shield the manager
against external shocks by measuring agent’s performance relative to its peers. Therefore, the
use of RPE protects from market-wide movements and exogenous shocks which influence the
performance of the firm and its peers, thereby, strengthening the link between compensation
and firm performance.
As discussed earlier in Section 2.1.4, Directors’ Remuneration Report Regulation (DRRR)
requires a detailed reporting on executive compensation matters. As part of this requirement,
presently, firms disclose comprehensive information on executive compensation packages.
Also, firms display peers selected for the purpose of performance benchmarking in their annual
reports, reporting the returns on their own shares for the last five-year period, together with the
comparative data on market and industry returns, over the same period.
In comparison to UK firms, since 2006, Security Exchange Commission (SEC) requires US
firms to disclose the presence of RPE and peer choices in their annual reports. Before these
disclosures, prior studies both in the UK and US detect the use of RPE by regressing executive

42
compensation against peer group performance. As an example, a pioneering study by Antle and
Smith (1986) analyses US firms and infers the use of RPE indirectly from negative coefficient
on peer performance while regressing executive compensation on both peer and firm
performance by using an implicit approach. This negative coefficient on peer performance
indicates that the remuneration committee filters market-wide performance wholly (or partly)
out of executive compensation (Rajgopal et al., 2006). Gibbons and Murphy (1990) also show
evidence supporting the presence of RPE with use of shareholder returns as a performance
metric. The authors report that the changes in executive pay are more likely to be assessed
relative to market movements instead of firm’s industry. Studies on RPE use market peers to
account for RPE use by performing implicit tests (e.g. Hall and Liebman, 1998; Garvey and
Milbourn, 2003) and some use the implicit approach to detect RPE presence by employing
industry peers (e.g. Janakiraman et al., 1992; Aggarwal and Samwick, 1999a; Garvey and
Milbourn, 2006), while, some other studies employ both industry and market peers together
(Aggarwal and Samwick, 1999b; Gibson and Murphy, 1990; Rajgopal et al. 2006). Of these
studies, only Antle and Smith (1986), Gibbons and Murphy (1990), Janakiraman et al. (1992)
and Rajgopal et al. (2006) find support for the presence of RPE in compensation contracts.
Albuquerque (2009) employs industry-size peers to measure peer performance and detects
support for RPE use from the S&P 1500 firms. However, the author finds weaker evidence of
RPE use when peer performance is based on peer groups from S&P 500 index and two digits
SIC codes. One criticism of much of the literature on RPE, as also pointed by Dikolli et al.
(2013), is that previous studies which test implicit RPE usage may have made measurement
errors due to incorrect assumptions by selecting wrong peer groups for the detection of RPE or
have shown biases in their selection of peer groups (e.g. industry or market peer groups). Since
they use these various potential peer groups, instead of the actual peer groups which may differ
in the detection of RPE, the results obtained from these implicit studies are still inconclusive.

43
Another major weakness of this approach is that it does not give an indication of percentage
number of firms using relative performance and thus it remains unclear how many firms utilize
RPE in the sample. Some of these studies use salary and bonus as a dependent variable (e.g.
Barro and Barro, 1990; Janakiraman et al., 1992) in their analysis. This is clearly erroneous
since firms mostly employ RPE in the equity component of the compensation.
Only a few studies undertaken previously focus on the explicit approach in detecting RPE,
where regulatory filings are directly observed. Murphy (1999) analyses a sample of 177 large
US firms contained in the survey by Towers Perrin in 1997 and documents that 28.8% of firms
employ RPE in annual bonus contracts. In another study, Bannister and Newman (2003)
examine 163 US firms in the Fortune 250 Index in 1992-1993 and indicate that the firms’ use
of RPE in compensation contracts is not widespread as only 45 firms out of 163 (28%)
incorporate RPE based contracts. The authors also find that the use of RPE is positively
associated with greater monitoring and stakeholder concern on executive pay and performance.
Whereas, Gong et al. (2011) report greater frequency and indicate that 38% of the US S&P
1500 firms in 2006 employ RPE in compensation contracts. Carter et al. (2009) investigate the
use of RPE in 129 UK firms in 2002 and report that around 50% of firms do not employ RPE
in their performance-vested equity grants. Carter et al. (2009) and Gong et al. (2011), in addition
to showing the percentage of firms that employ RPE using explicit approach, look at the
determinants of firm’s use of RPE and non-RPE. So far, these are the two main studies in the
context of firm’s use of RPE. However, in contrast to Gong et al. (2011), Carter et al. (2009)
show little empirical evidence that the common shock plays a role in the decision to use RPE.
In a recent working paper, Black et al. (2016) use explicit disclosure to perform an implicit test
to detect RPE for S&P 500 firms. They analyze the relationship between pay and firm
performance and between pay and peer performance for a full sample, RPE sub-sample, and

44
non- RPE subsample by identifying implicit RPE using two-digit SIC peers, and industry/size
quartile peers for the single year 2006. Their research findings show implicit evidence of RPE
in RPE sub-sample using both peer groups. Their results also detect RPE presence in non-RPE
firms using industry/size quartile peer groups only and argue that firms do not comply with the
regulation in disclosing RPE. However, this is less of an issue in the context of UK firms since
firms disclose the selection of RPE and comparator groups in their annual reports. After the
introduction of mandatory SEC disclosure, the use of RPE has been investigated in several
ways. In another working paper, Gao et al. (2017) investigate contractual features such as
performance horizon and choice of multiple plans of S&P 500 industrial firms. Their study
concludes that the selection of RPE and longer performance horizons can filter noise from
market-based measures. In the US, the length of performance horizon varies in equity grants,
however, in the UK, long-term incentives are usually three-year plans and their length does not
vary. Thus, performance horizon does not impact the choice of RPE in UK compensation-
setting.
Along with the decision to use RPE, the characteristics of RPE are also very important. One of
the important characteristics is the selection of peer group in relative performance evaluation
purposes, which has received less attention. Lewellen et al. (1996) investigate the influence of
prior firm performance and corporate governance characteristics on the degree of bias in the
selection of index and industry peer group for financial reporting practice. They conclude that
industry and peer-company stock return benchmarks selected by the company are downward
biased. In this way, the firm of interest can place themselves in higher percentile ranking, thus,
indicating a bias in the peer selection process.
Besides, the risk sharing benefits from the adoption of RPE in compensation contracts,
tournament theory postulates the potential benefits from the presence of RPE. The theory

45
further suggests that the selection of RPE peers should be such that RPE firms and peer firms
should both have an equal probability to win, given equal levels of effort (Lazear and Rosen,
1981). If the selection of peers is inappropriate, it could result in diluting RPE benefits.
In order to shield executives from external shocks, the selection of peer group should be based
on their ability to share greater common risk with the RPE firm. Gong et al. (2011) also analyse
only those firms which select custom peer groups, therefore, ignoring firms which pick sector
and index peers. To capture the common risk exposure of potential peers, their study looks at
similarities in industry membership, index membership, and sub-index membership to that of
an RPE firm. They do not take into consideration the performance criteria attached to these
RPE plans in their analysis. The results of their study conclude that firms select RPE peers
which belong from the Same_SIC2, S&P 1500 and have similar characteristics, which is in line
with the efficient contracting theory. However, they also find evidence of self-selection bias as
firms select such peers which have lower expected future stock returns.
3.3.4 Brief Reflection of the Relevant Literature
The literature review undertaken in previous sections displays that although there exists a body
of literature on executive compensation, there are voids in the understanding of the design of
long-term incentives and effectiveness of these incentive schemes in the UK.
Firstly, all the studies reviewed in the literature so far in examining the relationship between
pay and performance have taken cash compensation, measured by the sum of salary and bonus,
and the equity compensation as the prime measure of compensation in their investigations. In
their valuation of equity compensation, these studies only include the granted value of equity
as opposed to vested value. Thus, failing to consider the realized component of the

46
compensation. The equity grant is the maximum incentive opportunity (sometimes adjusting
the probability of vesting), whereas, the vesting amount refers to the actual payout from equity-
based pay which has been awarded to the executives after the attainment of performance
criteria. It is impossible to estimate the true value of awards that will vest in the future. In the
existing literature, only Conyon (2014) employs the vested value of equity grants in their
empirical model to analyse US firms. Most of the research that we have discussed has only
considered short-term performance in analyzing pay for performance relationship. Evidently,
therefore, there is more scope in the UK to analyze the link between different elements of
executive pay and measures of firm performance. Only limited studies extensively focus on
LTIP plans, Buck et al. (2003) and Kuang and Qin (2009), which, however, yield inconclusive
results to exhibit its effectiveness. This leaves an opportunity for potential research into whether
adopting LTIPs in a compensation package align managerial and shareholder interests by
strengthening the association between pay and performance across various settings.
Secondly, much of the extant literature investigates the impact of accounting or market-based
measure on the relationship between pay and performance. These studies argue that firms
should not select volatile performance measures since they make the relationship between pay
and performance insensitive. However, the studies do not empirically test whether the volatility
in accounting or market-based performance measures influences the selection of performance
metrics. Additionally, concerning the choice of performance measures and their targets in long-
term incentive plans, research in the UK has been thinner and more limited and has, to date,
explored restricted datasets, with sample periods ending in 2003. Therefore, future research
should concentrate on examining the design of compensation contracts in detail, including the
vesting related to these performance targets.

47
Thirdly, based on the review of the literature, a handful of non-UK based studies are mostly
derived from the US data to detect RPE using implicit techniques in compensation contracts.
The mixed results and lack of empirical evidence for RPE use can be attributed to incorrect
model assumptions and misspecification in the implicit approach. Only very recently, the mode
of research on RPE has changed and started to examine the explicit use of RPE by using annual
reports. Only two studies use explicit methods for US and UK firms which investigate the
determinants of choice between RPE and non-RPE firms for a single year only. Consequently,
more research is needed in the UK that accounts for explicit use of RPE by using a large dataset.
Some recent studies use the explicit method to detect the implicit presence of RPE and others
analyze a selection of individual firms who are selected to be in RPE pool. These studies employ
the US dataset and are yet unpublished as they are quite current- 2016, 2017, suggesting that
the literature on explicit RPE is still under research. Also, presently the characteristics of RPE
are fully observable in annual reports and have advanced in the past few years. Yet, only limited
studies thoroughly analyze RPE characteristics. Thus, future research should examine the
characteristics of RPE and analyze their determinants. All these extensions will elaborate the
understanding of executive compensation packages.

48
4 THE EFFECTIVENESS OF LONG-TERM INCENTIVES IN ALIGNING
INTERESTS BETWEEN EXECUTIVES AND SHAREHOLDERS
4.1 Introduction
A vital role of corporate governance is to alleviate the misalignment of interests between
executives and shareholders which mainly arise from the separation of ownership and control.
Owing to corporate global scandals, such as Enron or WorldCom that have surfaced since 2001,
the issue of executive compensation has been in the spotlight ever since. Media and politicians
mostly tend to pay attention to higher levels of pay, while stakeholders of the firm and
regulatory authorities tend to focus on whether compensation is sufficiently linked to executive
performance (Alregab, 2016). There has been considerable reform initiatives which attempt to
make the board more independent in their decision-making process. From the analysis of the
reports in Section 2.1, these reform initiatives suggest that institutional owners should have
control over matters related to executive compensation.
Further, we reviewed the Greenbury Report (1995) in Section 2.1.2, which suggested that firms
should employ performance contingent long-term incentive plans for their executives.
However, the enforcement of Directors’ Remuneration Report Regulations (DRRR) in 2002
aim towards enhancing transparency and disclosure on fixed and variable components of
compensation. Therefore, this disclosure provides an opportunity for researchers to conduct
analysis on features of long-term incentive arrangements for UK firms. It also helps public and
investors to understand the various components of executive compensation packages.
As discussed in Section 2.2, long-term incentive plans usually consist of performance share
plans, share options, and share matching plans. These shares vest only after performance criteria
are met over a period of time. Vesting time is referred to as the time before restrictions are lifted
on the ownership of stocks or options. Vesting of these shares is not contingent upon the time

49
lapsed for UK firms; in comparison, however, a greater number of US firms still grant
incentives which are conditional upon the time lapsed. Moreover, UK firms have adopted long-
term incentive schemes much before the US firms and the vesting of shares occurs only after
three years, once the plan has been devised (Tower Perrin, 2005).
The grant of long-term incentives serve two objectives: firstly, it ensures that the interest of
executives and firm’s shareholders are aligned. Secondly, it encourages executives to maximize
their effort and enhance shareholder wealth (Pepper et al., 2013). The key metric which
influences the outcome is pay-performance sensitivity. It measures the degree of interest
alignment between executives and shareholders (Jensen and Murphy, 1990; Firth et al., 2007).
Pepper et al. (2013) also report that LTIP accounts for around 38% and 33% of total earnings
of executives in the FTSE 100 and FTSE mid-250, respectively. This suggests that the
introduction of LTIPs in compensation packages has become more prevalent. Despite this
popularity, there has been disquiet among multi-institutions on how successful LTIPs actually
are in achieving these two objectives and their benefits. This disquiet has been reinstated in the
academic enquiry by Buck et al. (2003). A greater focus on linking equity-based pay to firm
performance has resulted in the innovation of the design of LTIPs which has eventually led to
greater variations in compensation practices (Bruce et al., 2005). Though, how effective the
introduction of these long-term incentive schemes has been, is an issue which is yet to be
explored.
In prior literature, greater focus has been given to compensation of CEO. The main reason
behind it is that CEO equity incentives are much bigger than that of CFO. Considering the fact
that CFO acts as an agent of CEO, it would be interesting to analyse how the pay-performance
relationship holds for CFO. A greater grant of number and value of long-term incentive plans
tend to engage CEO in riskier business projects in order to achieve a higher level of

50
compensation which is more than that of CFO, thus, leading CEO to be less risk-averse than
CFO. Although the value of performance-based shares awarded to CEO and CFO within the
same company differs, the performance criteria on which these shares vest remain similar,
making it interesting to investigate pay for performance association for both CEO and CFO.
Our study analyses a sample of 237 non-financial firms of UK FTSE 350 Index from 2010 until
2014 (excluding financial services and investment trusts). The broad conclusions of the study
are as follows: firstly, the level of executive compensation has increased significantly between
2010 and 2014 for both CEOs and CFOs. Secondly, the structure of executive compensation
has also changed; whereby a shift in the landscape of executive compensation from granting
base pay towards granting of stock options and performance share plans has been noticed. The
results show that there exists a positive link between previous year’s total shareholder return
and different components of CEO pay except for equity pay. The findings are similar in the
case of CFO as well. However, there exists a positive link between all components of CEO/CFO
pay and long-term firm performance.
This chapter makes several contributions. It is the first in investigating pay-performance
relationship for CFOs. Additionally, we contribute to the literature by making a clear distinction
between different measures of firm performance and executive compensation (realized pay,
equity pay, and total remuneration) in ways that existing studies have not considered as yet.
Finally, we examine the impact of various numbers and amount of LTIPs granted on the pay-
performance relationship. To date, there is no concrete evidence provided in the previous
literature towards examining the pay-performance sensitivity of different LTIPs.
The rest of the chapter is organised as follows: in Section 4.2, literature is reviewed and
hypotheses are proposed. In Section 4.3, the impacts of corporate governance and control
variables are studied. Section 4.4 introduces the methodology and Section 4.5 illustrates the

51
data and sample statistics, Section 4.6 focuses on empirical results while Section 4.7 shows the
results of the robustness tests undertaken. Finally, Section 4.8 provides the conclusion and
implication of the results derived.
4.2 Related Literature and Development of the Hypotheses
As reviewed in Section 3.2.1, two broadly competing models, the managerial power theory and
the agency theory are used to examine executive compensation results. In keeping with the
agency theory, Jensen and Meckling (1976) advocate that executives’ reward structure should
be constructed in such a way that it is positively associated with firm performance. However,
it is also noted that this positive association is not always achievable due to the problems arising
as part of the conflicts in the interests that separate the ownership and control in the company
(Conyon et al., 2000).
Managerial power theory challenges the agency theory perspective by asserting that the
executives occupy the most powerful position in a company and this provides sufficient
discretion to set contractual terms without intervention and generates generous pay schemes
(Bebchuk et al., 2002). Further on, Bebchuk and Fried (2005) argue that the building block of
managerial power approach is the “pay camouflage”, where pay packages are constructed in
such ways that appear to be complex and opaque, therefore making these packages different
from the optimal contracting view of the agency theory. Agency theory stresses the need for
the agents to maximise shareholder wealth in order to achieve higher rewards.
Based on the above argument, the following hypotheses shall be tested:
Hypothesis 4.1: A higher level of company performance positively affects CEO/CFO
compensation.

52
Turning towards long-term incentives, their stated purpose is to prevent executives from getting
undeserved profits and to influence managers to make decisions that are in the best interest of
the shareholders. One of the first research studies in analysing long-term incentive plans has
been carried out by Buck et al. (2003). The authors analyse how the use of LTIPs in a
compensation package influence the pay-performance sensitivity for UK firms from 1997 to
1998. The results of their study indicate that firms which employ LTIPs award higher absolute
pay to executives, while pay-performance sensitivity reduces in comparison to firms which do
not award LTIPs. LTIPs are three-year plans and were introduced in 1995, but the sample
analysed by Buck et al. (2003) was from 1996 and employ one-year performance. These are the
shortcomings of their study. The authors also state that in isolation, LTIPs have a mechanical
relation with performance conditions attached to the company’s share price.
Kuang and Qin (2009) study whether traditional or performance-vested stock options lead to
greater interest alignment with shareholders by increasing their wealth for UK firms. They
consider only stock option as an element of equity compensation and their results show that
pay-performance sensitivity increases with the use of performance-vested stock options over
traditional time-based options. Similar to Buck et al. (2003), the limitation of this study is that
they fail to consider three-year performance in examining the pay-performance sensitivity. On
the other hand, Cao and Halloran (2012) explore whether Irish companies which adopt LTIPs
perform better than others. The authors find no evidence of a relationship between the adoption
of LTIPs and firm performance.
Presently, equity grants have performance conditions attached to them and these designs vary
depending upon the objectives of the company. If LTIPs consist of multiple performance
measures, it is difficult to assess how challenging these performance measures are. Opponents
of the use of LTIPs argue that complex designs make them difficult to understand as

53
performance conditions are either too demanding or undemanding. In this present study, we
take into account all the components of long-term incentive plans (options, performance share
plans, matching plans and others) in our analysis. In the past, most researchers like Buck et al.
(2003) employed the expected or granted value of long-term incentive plans in their equity
valuation. We include the actual vested value (also called, payout) from share options,
performance shares, and matching plans in our study which will be discussed in Section 4.4.1.
Next, the focus will be on the complexity in the design of executive compensation contracts.
For example, in 2010 Reed Elsevier operates four long-term incentive plans with performance
conditions that have different vesting scales attached to them. LTIPs awarded by them, as usual,
vest after three years and include one performance share plan, one share option plan and one
matching plan.
For the matching plan, namely, the Reed Elsevier Growth Plan, each performance measure-
EPS, TSR, and return on invested capital (ROIC)- vests on one-third of the total after attainment
of performance targets. For TSR, due to the global nature of Reed Elsevier’s business, a
comparator group from different relative market indices (FTSE 100 for Sterling, Euro next for
Euro and S&P 100 for U.S Dollar Comparator Group) has been included. TSR performance of
Reed Elsevier should be above the median performance in order to trigger a minimum reward
that will result in 30% of the equity vesting. In order for the executives to achieve the maximum
reward of a 100%, TSR performance should be in the upper quartile, relative to the comparator
group of companies as defined above. When shares vest, the restrictions are lifted on
executives’ ownership. However, the minimum threshold target for EPS absolute growth is 5%
and for ROIC is 10%, while maximum threshold targets are 9% for EPS absolute growth and
11% for ROIC.

54
For the share option plan to vest, the adjusted EPS growth should be between 6% for minimum
threshold and 8% for the maximum threshold. Nonetheless, for both the plans discussed above,
there is a straight line vesting between these minimum and maximum thresholds which depend
on the level of growth. Lastly, for the LTIP plan, the performance condition puts an equal
proportion on EPS and TSR. TSR is benchmarked relative to Eurozone and S&P 100
comparator groups and EPS has a similar condition to that of share options. Considering the
various equity plans, comparator groups and performance measures, the design of
compensation packages of Reed Elsevier becomes more complex in nature.
Since LTIPs are three-year plans, it would be reasonable to consider a performance of three
years which would reflect a more robust picture of pay for performance relationship. There
exists the possibility that the firm which operates a greater number of components in the LTIPs
has performance targets that might not be based solely on increasing shareholder value.
In the past, managers have received higher rewards with minimal effort but with an adoption of
long-term incentives, more effort is required to achieve higher compensation, else the
performance targets will be missed. This practice is in line with agency theory as it aligns the
interests of executives with that of shareholders (Kuang and Qin, 2009). So, the firms which
grant a greater number of LTIPs achieving these performance targets will result in a higher
compensation than the firms which grant a lesser number of LTIPs.
Additionally, Cao and O’Halloran (2012) argue that LTIPs could also provide opportunities to
tilt the compensation package in the executives’ favour which may lead to managerial rent
extraction. Also, the company which grants greater value of equity compensation to their
executives reflects an influence of CEO power over the pay setting process. Therefore, such
schemes may be used to camouflage CEO power from public scrutiny over the design of
compensation contract (Gerakos et al., 2005).

55
Buck et al. (2003) document that the presence of LTIP award in a compensation package
reduces the pay-performance sensitivity. This raises a doubt about the effectiveness of long-
term incentives and motivates us to investigate whether the presence of various long-term
incentive plans influences the pay-performance responsiveness. Pay-performance
responsiveness measures the percentage responsiveness of pay to a percentage change in
performance. LTIPs are granted to solve agency problems and within LTIPs, if an increase in
shareholder wealth leads to an increase in compensation, it solves the agency problem. The
presence of a negative or insignificant relationship will show that managers use incentives in
their own favour, implying the prevalence of managerial power perspective. Overall, this makes
it interesting to analyse how LTIPs influence the pay-performance sensitivity.
Based on the discussion above, the acceptance of hypothesis 4.2 will be consistent with the
principal-agent theory.
Hypothesis 4.2: The greater the number of long-term incentive components granted to
executives in a compensation package, the stronger the pay-TSR performance responsiveness.
There has been a decrease in the use of share options since the mid-2000s. The current practice
is for firms instead to grant performance share plans in their compensation contracts (Main,
2010; Conyon et al., 2010). As can be seen from the descriptive statistics of Zakaria (2012),
both options and PSPs employ a mix of EPS and TSR as the performance measure. However,
TSR is more popular among PSPs. Thus, the inclusion of performance share plans can lead to
greater pay-performance responsiveness than it would for share options.
Hypothesis 4.3: Interest alignment is higher for the use of performance share plans than for
stock options.

56
4.3 Effects of Corporate Governance and Control Variables on the Level of
Compensation
In this section, we also control for and are interested in examining the corporate governance
mechanisms to analyze whether they have explanatory power in explaining the level of
compensation. According to prior literature, weaker corporate governance mechanisms have an
influence on the magnitude and the composition of executive compensation (Sigler, 2011).
Following Sapp (2008) and Ozkan (2011), in terms of corporate governance controls, we use
the following variables- board size, non-executive directors, chair duality and institutional
ownership.
Board Size
Prior empirical studies document that the size of the board impacts its ability to control and
monitor the firm activities (Sigler, 2011). Yermack (1996) argues that smaller boards are
considered to be effective than boards with a greater number of directors. Smaller boards
process information quicker and enhance communication level among top management and
executives in a firm (Zahra et al., 2000).
Previous studies show a positive association between board size and CEO compensation (e.g.
Guest, 2010; Renneboog and Trojanowski, 2010). This association can be explained from large
boards that do not play an effective role, thereby hindering efficient monitoring, communication
and decision making which results in greater CEO compensation. On the other side, it has been
argued that large boards are valuable since it brings on board the expertise and knowledge of
the board members. Also, there exists literature which finds negative or no effect of board size
on the level of compensation. For example, Firth et al. (2007) show that there exists a negative
relationship between board size and compensation. Another strand of studies indicates the

57
positive impact of board size on one of the important components of compensation, namely,
equity compensation (Mehran, 1995; Core et al. 1999; Ryan and Wiggins, 2001).
Chair Duality
Traditionally, both in the US and in the UK, it was common for CEOs to be also the chairman
of the board. Core et al. (1999) argue that CEO-chair duality enhances greater executive control
in determining the level and the structure of their executive compensation. In this context,
previous studies show mixed results. The findings from the studies by Conyon (1997) and
Conyon and Peck (1998) indicate that there is no significant association between chair duality
and managerial compensation. Whereas, Brick et al. (2006) conclude that firms where CEOs is
also chairman of the board, they receive greater total compensation.
Non-executive directors
Although non-executive directors are part of the board, they do not have any active involvement
in the day to day operations of the business. However, they are considered to play an effective
role in monitoring activities of the company to protect shareholders’ interests and solve agency
problems. Concerning empirical evidence, however, literature does not provide us with a
consistent conclusion on whether a greater percentage of non-executives on the board
influences the levels of compensation. For example, Sapp (2008), Fahlenbrach (2009) and
Guest (2010) find a negative association between non-executive directors and the level of
executive compensation. Similarly, Mehran (1995) indicates that boards with greater
percentage of non-executive directors are awarded a lesser cash compensation but a greater
equity compensation. This result suggests that non-executives provide a monitoring role by
awarding greater equity compensation as it aligns the interests of shareholders with those of
managers. Conversely, the results of Ozkan (2007) and Franks et al. (2001) indicate that there

58
is an insignificant association between percentage of non-executive directors and cash
compensation, signifying non-executive directors do not provide an effective monitoring role.
CEO/ CFO Age and Tenure
CEO tenure is the number of years they have served in the company. Hill and Phan (1991)
argue that the longer CEO tenure is, the more they get paid. Also, Janakiraman et al. (2010) and
Allgood et al. (2012) find a positive association between tenure and compensation. The latter
suggests that this positive association reflects CEO entrenchment. CEO tends to gain more
power as their tenure in the company lengthens which also results in their ability to influence
the pay setting process. Devers et al. (2007) suggest that age is an important proxy for
experience and is directly associated with CEO compensation. Watson (1994) finds age to be a
significant determinant for CEO compensation in non-financial firms.
Ownership structure
In prior literature, for ownership structure, the researchers tend to employ shares owned by
institutional investor as a proxy. The presence of institutional owners is believed to be vital to
corporate governance practices in terms of the level as well as the structure of executive
compensation (Ozkan, 2011). They are considered to be effective monitors due to their greater
ownership within the company. Following Hartzell and Starks (2003) and Sapp (2008), this
variable is used as one of the indicators of corporate governance quality.
Firm Size
Firm size has received greater attention in the literature on executive compensation. As firm
size increases, the complexity of the organization also increases. Due to a competitive labour
market for executives, this enables the large firms to attract more talented CEOs to be employed
(Conyon, 1997). Also, the results from the empirical studies by Kuang and Qin (2009), Guest

59
(2010) and Gregg et al. (2012) indicate that firm size is an important determinant in explaining
executive compensation. Previous studies employ market capitalization as a proxy for firm size
(Hartzell and Starks, 2003; Kuang and Qin, 2009; Armstrong et al., 2010).
4.3.1 Variables
Compensation Variables
In our study, we employ several different measures of executive compensation. Base pay is the
fixed amount received for the financial year. Bonus is the amount paid for the financial year
inclusive of any deferred element (provided there is no performance requirement on release)
and is paid in either cash or shares. Total short-term pay includes base salary and annual bonus
amount. Equity compensation or long-term performance-based pay is measured as the granted
value of performance shares, option grants, granted value of matching plans, vested value of
performance share plans, exercised value of options, and vested value of matching plans. Total
remuneration includes total cash plus the granted value of long-term incentives for that financial
year.
Total realized pay is a measure of the sum of base pay, bonus and the vested value of long-term
incentives (options, performance share plans, matching plans and others that are vested for the
financial year). In MEIS’ database, the granted value of stock options is valued at 25% of the
exercise value. This method is also followed by (Core et al., 1999; Berrone and Gomez-Mejia,
2009). Berrone and Gomez-Mejia (2009) study option valuation using the Black-Scholes
method and the method described above shows a positive correlation of 0.97, as also observed
by previous researchers (Lambert et al., 1993; Finkelstein and Boyd, 1998). Berrone and
Gomez-Mejia (2009) show almost identical results while using two different estimation
techniques. The granted amount of PSPs is valued at the 50% of the exercise value. However,

60
the vested values of share options and PSPs are the actual shares figures which have been
exercised or given to executives after the actual attainment of the performance conditions.
Performance Variables
We employ market-based measure to investigate the relationship between compensation and
firm performance. For this, we analyse both long-term and short-term stock returns; we measure
long-term stock returns as previous three-year returns to shareholders from Datastream Return
Index, which includes dividend reinvested, provided by Datastream. However, for short-term
performance, it is the previous one-year return (Jensen and Murphy, 1990; Conyon and Sadler,
2001). The performance variable is lagged one year as compensation will be influenced by the
performance of the previous year (Ozkan, 2011; Jensen and Murphy, 1990).
In our model, we also consider a three-year shareholder return to analyse its impact on the level
of equity pay, total remuneration, and total realized. The objective of this study is to shed light
on the relationship between CEO/CFO compensation and firm’s short term and long-term
performance for FTSE 350 UK companies.
Plan Types
Long-term incentives are awarded in different forms such as share options, matching plans,
performance share plans, etc. For a plan, specific dummy, we exclude short-term incentive
plans or bonuses, since they are not categorized as long-term plans. We also exclude one-off
LTIPs, for example, turnaround plans, acquisition plans, retention plans and plans for the
recruitment purpose. Rarely, firms offer five-year plans that are initially for three years, but
once the three years have lapsed, the LTIP can be further extended to another two years.
However, these have been excluded from our sample as they do not reflect the value of
compensation awarded because of the tenure of these plans. We also eliminate firms which do
61
not provide sufficient information on long-term incentive plans. Lastly, for the purpose of this
study, companies which grant shares with zero exercise price are labelled under the “share
options” category in annual reports. Similar to Zakaria (2012), we too classify them under
performance share plans category.
Control Variables
As discussed earlier, corporate governance variables used in this study consist of the sum of the
top 4 institutional ownership, which is the number of institutional shareholders who own more
than 5% of the company’s common shares. CEO chair duality is when the CEO is also the
chairman of the board. Board size is the number of directors on the board. The percentage of
non-executives is the total number of non-executive members on the board. Lastly, firm size is
measured by market capitalization (Kuang and Qin, 2009).
4.3.2 Model Estimation
To explore the link between compensation and performance, we use multivariate analysis after
controlling for corporate governance mechanisms and firm-specific variables. Firstly, we test
the association between the level of compensation and short-term firm performance. The link
between compensation and long-term firm performance is also studied. Subsequently, we
examine the impact of different number of LTIPs on pay-performance responsiveness. Finally,
we explore the pay-performance responsiveness in different types of plans. Following Murphy
(1999) and Gregg et al. (2012), we take a log for the compensation variable which is our
dependent variable, since it helps us to interpret the pay-performance elasticity.
We estimate the following model in order to investigate how firm performance influences the
level of compensation and can be expressed as follows:

62
Model 1
𝐿𝑛 (𝐶𝑜𝑚𝑝𝑒𝑛𝑠𝑎𝑡𝑖𝑜𝑛)𝑖,𝑡 =
𝛼 + 𝛽1 𝐹𝑖𝑟𝑚 𝑃𝑒𝑟𝑓𝑜𝑟𝑚𝑎𝑛𝑐𝑒 𝑖,𝑡−1→𝑡 + ∑ ƴ𝑗 𝑐𝑜𝑟𝑝𝑜𝑟𝑎𝑡𝑒 𝑔𝑜𝑣𝑒𝑟𝑛𝑎𝑛𝑐𝑒 𝑣𝑎𝑟𝑖𝑎𝑏𝑙𝑒 𝑖,𝑡−1𝑝𝑗=1 +
𝑛 𝑐𝑜𝑛𝑡𝑟𝑜𝑙 𝑣𝑎𝑟𝑖𝑎𝑏𝑙𝑒 𝑖,𝑡−1 + ԑ 𝑖,𝑡 (4.1)
i is the transcript for the firms while t is for the time period. ɛit is the error term and the
dependent variable “Compensation” consists of total short-term pay, equity pay, realized pay
and total pay.
The coefficient of firm performance (𝛽1) measures the pay performance elasticity. From an
agency perspective, a higher level of company performance is positively associated with future
pay. So, we expect the coefficient of firm performance to be positive and significant.
Model 2
𝐿𝑛 (𝐶𝑜𝑚𝑝𝑒𝑛𝑠𝑎𝑡𝑖𝑜𝑛)𝑖,𝑡 = 𝛼 + 𝛿1𝑓𝑖𝑟𝑚 𝑝𝑒𝑟𝑓𝑜𝑟𝑚𝑎𝑛𝑐𝑒(𝑇𝑆𝑅)𝑖,𝑡−3→𝑡 + 𝐵1 𝑑𝑢𝑚𝑚𝑦 𝑝𝑙𝑎𝑛 1 𝑖,𝑡−3 +
𝐵2 𝑑𝑢𝑚𝑚𝑦 𝑝𝑙𝑎𝑛 2 𝑖,𝑡−3 + 𝐵3 𝑑𝑢𝑚𝑚𝑦 𝑝𝑙𝑎𝑛 3 𝑖,𝑡−3 + 𝐵4 𝑑𝑢𝑚𝑚𝑦 𝑝𝑙𝑎𝑛 4 𝑖,𝑡−3+
𝐵5 𝑑𝑢𝑚𝑚𝑦 𝑝𝑙𝑎𝑛 1 𝑖,𝑡−3𝑇𝑆𝑅 𝑖,𝑡−3→𝑡 + 𝐵6 𝑑𝑢𝑚𝑚𝑦 𝑝𝑙𝑎𝑛 2 𝑖,𝑡−3𝑇𝑆𝑅 𝑖,𝑡−3→𝑡 +
𝐵7 𝑑𝑢𝑚𝑚𝑦 𝑝𝑙𝑎𝑛 3 𝑖,𝑡−3𝑇𝑆𝑅 i,𝑡−3→𝑡 + 𝐵8 𝑑𝑢𝑚𝑚𝑦 𝑝𝑙𝑎𝑛 4 𝑖,𝑡−3𝑇𝑆𝑅 𝑖,𝑡−3→𝑡 +
∑ ƴ𝑗 𝑐𝑜𝑟𝑝𝑜𝑟𝑎𝑡𝑒 𝑔𝑜𝑣𝑒𝑟𝑛𝑎𝑛𝑐𝑒 𝑣𝑎𝑟𝑖𝑎𝑏𝑙𝑒 𝑖,𝑡−1𝑝𝑗=1 + 𝑛 𝑐𝑜𝑛𝑡𝑟𝑜𝑙 𝑣𝑎𝑟𝑖𝑎𝑏𝑙𝑒 𝑖,𝑡−1 + ԑ 𝑖,𝑡 (1.2)
ɛit is the error term and the dependent variable “Compensation” consists of total remuneration,
total realized pay, and long-term pay. Since long-term incentives are three-year plans, we use
3-year lag for a number of long-term incentives granted by the company. For example, any
LTIP award granted in 2007 will only vest in 2010.
To investigate pay performance responsiveness within the different number of plans, initially,
we assign dummies to represent the different numbers of long-term incentives granted by the
company since there are many different performance conditions and criteria as shown in model

63
1.2. Including these dummies will give an indication whether there are different pay levels
within different long-term incentive plans. To test the existence of pay-performance
responsiveness, we create four dummy interaction variables between each LTIP plan and three-
year shareholder returns. Lastly, we also investigate the incentive strength within different
number of long-term incentives by taking the natural logarithm of value of long-term incentives
granted. A higher positive value corresponds to greater importance of amount awarded to
CEO/CFO.
The regression model can be expressed as follows:
Model 3
𝐿𝑛 (𝐶𝑜𝑚𝑝𝑒𝑛𝑠𝑎𝑡𝑖𝑜𝑛)𝑖,𝑡 = 𝛼 + 𝛿1 𝑓𝑖𝑟𝑚 𝑝𝑒𝑟𝑓𝑜𝑟𝑚𝑎𝑛𝑐𝑒 (𝑇𝑆𝑅)𝑖,𝑡−3→𝑡 +
𝐵2 𝑑𝑢𝑚𝑚𝑦 𝑝𝑙𝑎𝑛 𝑃𝑆𝑃 𝑖,𝑡−3 + 𝐵3 𝑑𝑢𝑚𝑚𝑦 𝑝𝑙𝑎𝑛 𝑂𝑝𝑡𝑖𝑜𝑛 𝑖,𝑡−3 +
𝐵4 𝑑𝑢𝑚𝑚𝑦 𝑝𝑙𝑎𝑛 𝑃𝑆𝑃 𝑖,𝑡−3𝑇𝑆𝑅 𝑖,𝑡−3→𝑡 + 𝐵5 𝑑𝑢𝑚𝑚𝑦 𝑝𝑙𝑎𝑛 𝑂𝑝𝑡𝑖𝑜𝑛 𝑖,𝑡−3𝑇𝑆𝑅 𝑖,𝑡−3→𝑡 +
∑ ƴ𝑗 𝑐𝑜𝑟𝑝𝑜𝑟𝑎𝑡𝑒 𝑔𝑜𝑣𝑒𝑟𝑛a𝑛𝑐𝑒 𝑣𝑎𝑟𝑖𝑎𝑏𝑙𝑒 𝑖,𝑡−1𝑝𝑗=1 + 𝑛 𝑐𝑜𝑛𝑡𝑟𝑜𝑙 𝑣𝑎𝑟𝑖𝑎𝑏𝑙𝑒 + ԑ 𝑖,𝑡 (1.3)
Lastly, to test the existence of pay-performance responsiveness within the type of plans, in
Model 2, we replace the dummy number plans with dummy type plans. Therefore, “Dummy
plan PSP” is defined as 1 if the company grants only performance share plans in their
compensation contract and zero-otherwise. The dummy for option is also constructed in a
similar way. Also, we create a dummy interaction between each type of plan and three-year
shareholder return. Our alternative hypothesis predicts that higher pay-performance
responsiveness is associated with the use of PSPs rather than for options. As seen in the study
by Zakaria (2012), PSPs mostly have TSR performance condition attached to them in
comparison to share options. The use of PSP could be employed as a proxy for presence of TSR
based contracts. Thus, expecting to have a positive pay-performance responsiveness.

64
Following previous studies on CEO compensation, we include firm and time fixed effects. In
our estimation, standard errors are robust to clustering at the firm level. In the strand of
corporate governance literature (e.g. executive compensation models), there are concerns over
endogeneity, so by taking lags of the explanatory variable, this problem in the regression models
can be minimized (Hartzell and Starks, 2003). Some researchers argue that not only
performance influences compensation but also the compensation is a motivating factor for the
executive to perform in the future. So, there is a two-way relationship between compensation
and performance; however, as we consider one year lag for the performance measures we can
minimize this issue.
4.4 Data
4.4.1 Data Sources and Sample Construction
The initial sample of executive compensation consists of 237 firms of UK FTSE 350 Index
from 2010 to 2014 (excluding firms from financial services and investment trusts).
Additionally, to be included in a regression, a firm must have valid data on total shareholder
return for three years- i.e. if the LTIP plan has been implemented in 2007, then we consider
firm performance from 2007 to 2010, as that effects the compensation/LTIP vested value for
the year 2010. Similarly, for LTIP awarded in 2008, we consider the performance from 2008
to 2011 and so on, each year after plan implementation until 2011. Thus, we consider three-
year performance and valid data on corporate governance variables in our analysis, therefore,
resulting in the final sample to be reduced and unbalanced with 225 firms for the CEOs and
223 firms for the CFOs.
The data used in this study has been gathered from various sources. For instance, compensation
data for the CEO and CFO have been taken from MEIS database and supplemented with

65
manually collected data, where information was unavailable on the MEIS database from annual
reports. Information, concerning the numbers, types, and value of LTIPs granted by firms from
2007 to 2011 and whether these granted LTIPs were active in each of these years, has been
hand-collected from the firms’ annual reports. The data on institutional ownership has been
collected from Fame. Similar to Ozkan (2011), institutional ownership is measured as the sum
of holdings of the top four institutional investors. Data for board size and chair duality has been
collected from Bloomberg database. However, we obtained stock price and other financial data
from Datastream based upon their FY values. Following Hartzell and Starks (2003) and Ozkan
(2011), we use Datastream’s Total Return Index which reflects a stock’s growth in value
assuming all dividends are re-invested.
4.4.2 Sample Statistics
Panel A of Table 4.1 presents the trends in the level of components of CEO compensation. The
mean and the median value of CEO base salary increase from 2010 until 2014. On the other
hand, the mean CEO short-term pay increases from £1,207,600 in 2010 to £1,347,542 in 2014
and the total compensation from £1,845,479 in 2010 to £2,439,548 in 2014. The average value
of equity pay increases from £939,460 in 2010 to £1,432,964 in 2014. Furthermore, the largest
increase is in the average value of realized pay from £1,296,123 in 2010 to £2,038,142 in 2014.
A possible explanation for this might be that over time firms have started to achieve the
performance goals as specified in their compensation contracts.
Panel B of Table 4.1 shows different components of CFO compensation from 2010 to 2014.
We observe an increase in the mean and median values of CFO base pay. For the CFO, the
largest increase has been in the average and median value of total compensation from
£1,062,704 (£900,652) to £1,583,531 (£1,328,896). For realized pay, in our sample period, the

66
average value increases from £786,214 to £1,273,896. Also, there is a small increase in short-
term pay from £705,703 to £719,382. We also observe that mean and median value for CFO
age increases from 50 to 51 from 2010 until 2014, while an average value for CFO tenure is
more or less 6 years.
Panel C of Table 4.1 reports descriptive statistics for components of CEO and CFO
compensation within different numbers of long-term incentives awarded by the company. As
shown in the table, firms which operate multiple long-term incentives differ significantly in the
ways they compensate their CEOs and CFOs. The average value of CEO (and CFO) total pay
increases from £1,941,436 (£1,193,436) to £6,997,678 (£3,119,818). It is noted that the
companies which operate two, three or four long-term incentives award higher realized pay by
15%, 29% and 34%, respectively.
Panel E of Table 4.1 shows descriptive statistics for board size, the sum of top 4 institutional
ownerships, age and tenure of the CEO. As can be seen from the table, the median value for
board size is 9 and the mean value is close to 9 for each year which is consistent with Ozkan
(2007). However, there is not much variation in the average institutional ownership during our
sample period. The average age of CEO is around 52 and CFO is around 50. While, on an
average, for our sample period, the tenure of CEO is more or less 7 years, whereas, the average
tenure of CFO is around 6 years. Finally, the average % of non-executive directors range from
55.5% to 57.3%.
Panel F of Table 4.1 reports that the mean value of three years TSR varies for our sample period
and the mean ranging from 0.21 to 0.63 but there exists less variation in one year TSR of the
company.
In Panel G of Table 4.1, we discuss correlation matrix of main independent variables used in
the regression. The correlation between market capitalization and board size is only 35%.

67
Turning towards other control variables, we find very low correlations (Panel G of Table 4.1).
Furthermore, we present an evaluation of the variance inflation factor (VIF) in Panel H of Table
4.1. Multicollinearity is not likely to be a problem in our multivariate test because no VIF
exceeds 10 for any of our independent variables (e.g. Hair et al., 2006)

68
Table 4.1
Panel A: The descriptive statistics of components of CEO Compensation (Pounds)
Variable 2010 2011 2012 2013 2014
Base Salary (£)
Mean 563,267 575,212 595,045 584,643 604,158
Median 522,800 517,566 533,000 527,000 543,000
Bonus (£)
Mean 718,380 645,366 630,705 636,725 634,893
Median 500,000 501,404 433,500 465,500 604,158
Short Term Pay (£)
Mean 1,207,600 1,158,252 1,255,178 1,309,722 1,347,542
Median 1,000,000 1,040,920 1,113,500 1,157,000 1,293,018
Equity Pay (£)
Mean 939,460 1,180,521 1,696,440 1,642,955 1,432,964
Median 516,978 752,243 968,292 1,023,114 1,047,638
Realized Pay (£)
Mean 1,296,123 1,635,151 2,018,496 2,037,154 2,038,142
Median 1,100,000 1,266,373 1,418,752 1,494,677 1,523,211
Total Pay (£)
Mean 1,845,479 2,173,139 2,686,979 2,655,696 2,439,458
Median 1,374,000 1,655,023 1,986,252 2,089,531 2,040,137

69
Table 4.1
Panel B: The descriptive statistics of components of CFO Compensation (Pounds)
Variable 2010 2011 2012 2013 2014
Base Salary (£)
Mean 363,119 373,576 374,442 381,408 401,521
Median 326,000 340,000 344,000 357,500 386,110
Bonus (£)
Mean 346,617 373,576 317,319 322,954 317,861
Median 292,500 305,206 253,000 289,720 308,000
Short Term Pay (£)
Mean 705,703 735,885 690,134 693,374 719,382
Median 617,000 655,495 594,463 630,000 710,666
Equity Pay (£)
Mean 487,996 584,921 829,249 833,773 860,031
Median 303,211 310,287 471,920 529,998 639,226
Realized Pay (£)
Mean 786,214 1,010,051 1,196,986 1,128,793 1,273,896
Median 659,213 803,169 819,501 872,200 941,000
Total Pay (£)
Mean 1,062,704 1,386,209 1,570,582 1,529,118 1,583,531
Median 900,652 1,122,222 1,138,190 1,234,998 1,328,986

70
Table 4.1
Panel C: CEO and CFO compensation within different number of long-term incentives
awarded (Pounds)
Variable Plan 1 Plan 2 Plan 3 Plan 4
Base Salary (£)
CEO 556,073 607,549 714,061 981,833
CFO 360,338 394,226 455,840 581,500
Bonus (£)
CEO 519,586 632,625 850,420 988,500
CFO 307,203 355,628 403,913 608,155
Short Term Pay (£)
CEO 1,077,753 1,231,929 1,506,773 1,970,333
CFO 649,220 745,138 859,392 976,440
Equity Pay (£)
CEO 1,068,767 1,784,975 2,736,854 5,027,344
CFO 599,298 822,616 1,840,030 2,192,858
Realized Pay (£)
CEO 1,448,453 2,215,911 3,628,373 5,237,313
CFO 889,541 1,149,597 2,113,304 2,938,108
Total Pay (£)
CEO 1,941,436 2,985,804 4,822,604 6,997,678
CFO 1,193,436 1,582,395 2,076,290 3,199,818

71
Table 4.1
Panel D: Descriptive statistics on average number of active long-term incentive plans
granted three-years before the compensation is awarded
2007 2008 2009 2010 2011
No. of active LTIP plans 1.69 1.78 1.86 1.97 1.9
Table 4.1
Panel E: The descriptive statistics of board size, % of 4 largest institutional ownership, % of
non-executive directors, market capitalization, CEO/CFO age, and CEO/CFO tenure
Variable
2010 2011 2012 2013 2014
Board_size Mean 8.9 8.9 9.1 9.1 8.8
Median 9.0 9.0 9.0 9.0 9.0
4_largest_institutional % Mean 31.6 30.3 31.6 31.6 29.1
Median 28.3 27.9 28.1 28.1 26.6
Market_cap Mean 20.9 21.1 21.3 21.5 21.6
Median 20.8 20.9 21.1 21.3 21.4
Non_exec % Mean 55.5 55.8 56.2 57.1 57.3
Median 55.2 55.6 56.2 57.0 57.2
CEO Age Mean 51.8 51.7 52.4 52.4 52.7
Median 51.5 51.0 52.0 53.0 52.0
CEO Tenure Mean 7.1 7.1 7.5 7.3 6.7
Median 6.0 5.0 6.0 6.0 6.0
CFO Age Mean 49.0 48.8 49.2 49.7 50.8
Median 48.0 49.0 49.0 50.0 51.0
CFO Tenure Mean 5.0 5.7 6.0 6.3 6.6
Median 5.8 5.0 5.0 5.0 5.0

72
Table 4.1
Panel F: The descriptive statistics of financial performance of the firm
Variable 2010 2011 2012 2013 2014
TSR (1 year) Mean 0.37 0.07 0.21 0.33 0.27
Median 0.30 0.04 0.21 0.29 0.26
TSR (3 year) Mean 0.21 0.87 0.74 0.76 0.63
Median 0.11 0.51 0.63 0.65 0.57
Table 4.1
Panel G: Correlation Matrix of Main Independent Variables
(1) (2) (3) (4) (5) (6) (7) (8)
(1) Age 1
(2) Tenure 0.29*** 1
(3) CEO_chair_dual 0.07** 0.07** 1
(4) Board_size 0.07** -0.08** 0.00 1
(5) Non_exec % -0.02 -0.10*** 0.02 -0.10*** 1
(6) 4_larget_institutional % 0.02 0.11*** 0.02 -0.08** -0.05 1
(7) Market_cap 0.09*** -0.15*** 0.06 0.35*** 0.15* ** -0.19*** 1
(8) TSR 0.01 0.06* -0.03 -0.05** -0.01 0.10*** 0.02 1
Panel G reports the correlation matrix of the main independent variables. ***, **, * denote significance at 1%,
5%, and 10%.

73
Table 4.1
Panel H: VIF Test Results
Variable VIF 1/VIF
Age 1.15 0.866
Tenure 1.19 0.843
CEO_chair_dual 1.01 0.987
Board_size 1.36 0.734
Non_exec % 1.09 0.914
4_larget_institutional % 1.07 0.938
TSR 1.03 0.971
Market_cap 1.38 0.725
Mean VIF 1.16
4.4.3 Panel Data-Fixed Effects Model
The panel data has been used by previous studies on executive compensation, e.g. Ozkan
(2011), who implemented panel data analysis between the periods 2007-2012, testing
performance variables on compensation variables. Also, similar to other executive
compensation studies (e.g. Conyon, 2014; Brick et al., 2006), this study employs fixed effects
since it removes individial-specific unobserved effects.37 The sample consists of firms with
varying sizes, so there is a chance of the existence of differences amongst these firms that
consist of management quality and the firm’s organizational structure. In this case, the fixed
effect estimator is applied to test the relationship between compensation and performance in
order to allow for this unobserved heterogeneity, as each firm has a different strategy on
executive compensation and a different style of management. By applying the fixed effect
approach, the estimation helps to remove much of the error variance that is due to the distortions
37 Note: In order to select between the fixed effects and random effects estimator, we conduct the Hausman test
(1978). The results are reported in Table A.4.1 of Appendix to Chapter 4.

74
arising from the individual differences between groups that come from the omitted variables or
the unobserved heterogeneity that is correlated with the regressors.
4.5 Empirical Results
In this section, we analyse the association between the level of compensation and firm
performance after controlling for corporate governance mechanisms. The results in Panel A of
Table 4.2 demonstrates that short-term firm performance is significantly related to all
components of CEO compensation, except for equity pay. In Column 3, the coefficient for total
shareholder return is 0.102 and statistically significant at 1% level in determining realized pay.
This estimate implies that CEO will receive an increase of 1.02% in realized pay for a 10
percentage point increase in total shareholder return. However, 10 percentage point increase in
total shareholder return has immediate 0.2% increase on CEO short-term pay. One possible
explanation for this result is that short-term pay is also sensitive to short-term firm performance
since it includes the elements of bonus, which are directly associated with one year performance
condition. The study by Bruce et al. (2007) which employs short-term pay as a proxy for
executive compensation and finds coefficient of a similar magnitude. Overall, these results are
consistent with the findings of Gregg et al. (2005) and Ozkan (2011).
The results in Column 3 of Table 2 (Panel A) reveal that the coefficient on firm performance is
insignificant and positive in explaining equity compensation. A possible explanation for this
result is that since equity compensation contains components which are associated with three-
year firm performance, so a one-year performance, alone, will not determine the level of equity
compensation. Taken together, these results strongly indicate that financial indicators of FTSE
350 firms impact the level and structure of the compensation, except for equity compensation.
The results support the principal-agent hypothesis which asserts that executives should be

75
compensated for adding to the success of the firm and this is consistent with the findings of
Core et al. (1999) and Brick et al. (2006). The adjusted R2 of the regression is 73% for short
term pay, 63% for equity pay, 72% for total compensation and 73% for total realized pay,
showing higher explanatory power for all model specifications.
Turning towards a discussion on control variables, market capitalization has a significant and
positive impact on equity pay, realized pay, and total pay. These findings are in line with
Conyon and Murphy (2000). However, the magnitude of the coefficient on market
capitalization in determining equity pay is the greatest. Usually, large firms have a complex
structure of executive compensation with a greater capacity to granting higher incentive
compensation to retain talented CEOs than smaller firms. CEO tenure influences all elements
of CEO compensation, suggesting that CEOs who stay longer in the company get paid more
since they have greater control and power. Also, the size of the coefficient on tenure is greater
when we use equity pay as a dependent variable. These results are consistent with those of
Allgood et al. (2012) and Janakiraman et al. (2010). However, there exists an insignificant
relationship between components of CEO pay and CEO duality. Untabulated results reveal that
very few firms engage in chair duality. The CEOs in firms with chair duality are not awarded a
higher pay than firms where CEO is not the chairman of the board. This finding is congruent
with the results of Conyon and Peck (1998) but different to that of Core et al. (1999).
The results also show that there exists an insignificant relationship between components of
compensation and board size. These findings are contrary to those of Firth et al. (2007), who
find a negative association between compensation and board size, implying that boards play an
effective role in monitoring executive compensation. We also note from the results that the
coefficient of top 4 institutional ownership concentration is negative and significant in
determining equity pay, realized pay and total pay. This suggests that institutional investors are

76
solely concerned about components of CEO pay which include performance-based elements
and are open to manipulation. While the presence of institutional investors has no impact on
short-term pay, a greater concentration of institutional owners monitors only specific
components of CEO compensation. Overall, this finding is consistent with the previous
empirical evidence reported by Ozkan (2007) and Hartzell and Starks (2003), who find that
institutional shareholders are active and their greater concentration leads to lower levels of
compensation. Concerning percentage of non-executive directors, the coefficient is negative
and significant with all measures except for short-term pay. This implies that firms with greater
non-executive directors on board offer lower levels of equity pay, realized pay and total pay.
These results are consistent with that of Mehran (1995) but contrary to Ozkan (2007) and Frank
et al. (2001).
The first three columns in Table 4.2 of Panel B report the association between components of
pay and long-term firm performance. Since LTIPs are three-year plans, we use three year TSR
to study its impact on the level of equity pay, realized pay, and total pay. The results indicate
that there is a significant relationship between components of compensation and long-term firm
performance but the magnitude of the coefficients on shareholder returns varies for different
elements of CEO compensation. Additionally, equity pay, realized pay and total pay are
positively related to long-term performance and statistically significant at 1% level. However,
the coefficient on long-term shareholder return is higher in determining equity pay. The results
in Column 1 of this Table show that a CEO will receive an increase of 2.01% in equity pay for
a 10% increase in three-year shareholder return; while 10 percentage point increase in three-
year shareholder return corresponds to 1.23% increase in realized pay. These findings are in
line with the principle-agent theory, showing that executives are compensated to act in the best
interest of shareholders.

77
Additionally, in Columns 4 and 5 of Table 4.2 (Panel B), we also include an interaction of long-
run performance (three-year TSR) with a number of long-term incentives granted by the
company. We note that the coefficients on Dummy plan 2 × TSR and Dummy plan 3 × TSR
are positive and statistically significant at 1% level, indicating that firms which grant greater
number of plans strengthen the link between pay and performance.
In realized pay specification, adjusting for logarithms, the coefficient on Dummy plan 2 × TSR
tells us that, on an average, 10 percentage point increase in TSR will bring 1.44 % increase in
realized pay, which is less than 1.86 % increase, due to the presence of three long-term incentive
plans in compensation contracts.38 The coefficient on Dummy plan 1 × TSR is also statistically
significant at 10% level. This higher pay-performance responsiveness in firms which operate
two and three plans suggest that imposing greater performance conditions encourages greater
CEO effort.
Conversely, the coefficient on Dummy plan 4 × TSR is negatively significant. A possible
explanation for the negative existence of pay-performance responsiveness is that companies
which offer four LTIPs have too many performance conditions attached that are not solely based
on increasing shareholder value. Hence, CEOs work towards achieving too many performance
targets which might effect the performance of the company. Consequently, an increase in
compensation is negatively associated with total shareholder return. Irrespective of whether we
use realized pay or total pay as a proxy for compensation, in companies offering one, two or
three plans, CEOs are awarded greater compensation for adding three year’s shareholder return.
From the results, we observe that coefficient on dummy plans are statistically significant in
38 Note: In order to find pay-performance responsiveness for firms which operate 2 plans, we only use coefficient
of Dummy_plan_2*TSR (0.144) and do not add the coefficient of TSR (0.016) because it is statistically
insignificant. This applies to firms which grant one, three and four plans, as well.

78
determining the components of CEO compensation. The companies which use two or three
long-term incentives award a higher realized pay and total pay than companies which do not
include long-term incentives in their compensation contracts.
Turning now to the incentive strength of the number of long-term incentive plans, Panel C of
Table 4.2 shows that there exists strong evidence that higher incentives granted within two and
three plans strengthen the link between realized pay and firm performance. These results remain
consistent when using total pay as a dependent variable. Overall, these results lead us to suggest
that for CEOs, the number of plans is equally motivating as the value of incentives within one,
two and three plans being offered by the company.
Now, we attempt to explore the pay-performance responsiveness within the type of plans (i.e.
stock options and performance share plans). In order to explain pay-performance
responsiveness, we include an interaction between total shareholder return and performance
share plans dummy granted by the company. The dummy interaction for share option is also
constructed in a similar way. In Column 1 of Table 4.2 (Panel D), results show that the
coefficient on Dummy PSP × TSR is significant at 5% level and it also shows 10 percentage
point increase in TSR corresponds to 1.46% [i.e., 10 × (0.054+ 0.092) %] increase in realized
pay when PSPs are included in compensation contracts. Whereas the coefficient on Dummy
Option × TSR is positive but statistically insignificant in determining realized pay. Thus, the
presence of PSP induces CEO to put greater effort that will lead to alignment between CEO
and shareholders interest. One possible explanation for this is that since TSR, as a performance
condition, is more commonly employed in PSPs, this leads to an increase in pay-performance
sensitivity. Also, analyzing the strength measurement, the positive significance of ln (Value
PSP) implies that PSP compensation leads to larger pay-performance responsiveness relative
to the use of share options, as shown in Columns 3 and 4 of Table 4.2 (Panel D).

79
We can conclude that not all companies that offer a higher number of LTIPs are compensated
for adding shareholder wealth. Overall, our results are consistent with agency perspective,
showing that the adoption of long-term incentives aligns executives’ interest with that of the
shareholders. Although CEOs receive higher compensation in firms which grant four plans,
their awards are not aligned with the shareholders’ interests. These could be a way to make the
remuneration package appear more complex and challenging from an external perspective or,
perhaps, to camouflage high rewards granted to the CEOs.

80
Table 4.2
Panel A: CEO compensation as a function of corporate performance at previous interval (t-
1→t)
This table represents the estimation of results for components of CEO compensation against short-
term firm performance (one-year return to shareholders), board size, % of non-executive directors,
% top 4 largest institutional ownership, CEO chair duality, CEO age, CEO tenure and market
capitalization. The dependent variable consists of (1) short-term compensation (2) equity pay (3)
realized pay (4) total pay, expressed in the natural logarithm of their values. Standard errors are
clustered at the firm level and are reported in parentheses. ***, **, * denote significance at 1%, 5%,
and 10%, respectively.
Variable Short term Pay Equity Pay Realized Pay Total Pay
(1) (2) (3) (4)
Constant 12.936*** 5.489* 9.452*** 12.186***
(0.49) (3.24) (1.48) (1.14)
Age 0.003 0.004 0.007 0.006
(0.00) (0.01) (0.01) (0.01)
Tenure 0.011** 0.044*** 0.032*** 0.019***
(0.00) (0.02) (0.00) (0.00)
CEO_chair_dual -0.165 0.283 -0.075 -0.051
(0.22) (0.43) (0.18) (0.14)
Board_size 0.032 0.062 0.05 0.019
(0.02) (0.03) (0.03) (0.05)
Non_exec % -0.004 -0.008** -0.007** -0.005*
(0.00) (0.00) (0.00) (0.00)
4_largest_institutional % -0.001 -0.004** -0.004*** -0.003**
(0.00) (0.00) (0.00) (0.00)
Ln_market_Cap 0.055 0.194*** 0.095** 0.051**
(0.06) (0.06) (0.05) (0.02)
TSR 0.023`** 0.003 0.102*** 0.073**
(0.01) (0.06) (0.03) (0.03)
R-squared 0.81 0.76 0.81 0.81
Adjusted R-squared 0.73 0.63 0.73 0.72
Fixed firm effects Yes Yes Yes Yes
Fixed year effects Yes Yes Yes Yes
Observations 740 740 740 740

81
Table 4.2
Panel B: CEO compensation as a function of corporate performance at previous interval (t-
3→t)
This table represents the estimation of results for different components of CEO compensation
against long-term firm performance (three-year return to shareholders), board size, % of non-
executive directors, % of top 4 largest institutional ownership, CEO age, CEO tenure, chair duality
and market capitalization. The dependent variable consists of (1) equity pay (2) realized pay (3)
total pay (4) realized pay (5) total pay, expressed in the natural logarithm of their values.
Variable Equity Pay
Realized
Pay Total Pay Realized Pay Total Pay
(1) (2) (3) (4) (5)
Constant 6.39*** 8.921*** 5.571*** 10.932*** 5.362***
(1.53) (1.38) (0.62) (1.32) (0.31)
Age 0.006 0.007 0.003 0.006 -0.001
(0.01) (0.00) (0.00) (0.00) (0.00)
Tenure 0.031** 0.035*** 0.012*** 0.032*** 0.011***
(0.01) (0.01) (0.00) (0.01) (0.00)
CEO_chair_dual 0.403 -0.033 0.021 -0.072 -0.038
(0.47) (0.16) (0.11) (0.06) (0.10)
Board_size 0.056 0.047 0.011 0.043 0.021
(0.05) (0.04) (0.01) (0.03) (0.01)
Non_exec % -0.005** -0.005** -0.002* -0.006** -0.002*
(0.00) (0.00) (0.00) (0.00) (0.00)
4_largest_institutional % -0.005* -0.005*** -0.001** -0.004*** -0.001*
(0.00) (0.00) (0.00) (0.00) (0.00)
Ln_market_Cap 0.301** 0.127*** 0.079*** 0.116* 0.040***
(0.13) (0.03) (0.03) (0.06) (0.01)
TSR 0.201*** 0.123*** 0.092*** 0.016 0.014
(0.0) (0.04) (0.01) (0.05) (0.02)
Dummy_plan_1 0.105** 0.044***
(0.05) (0.01)
Dummy_plan_2 0.198*** 0.082***
(0.06) (0.01)
Dummy_plan_3 0.453*** 0.268***
(0.11) (0.02)
Dummy_plan_4 0.526*** 0.201***
(0.11) (0.02)
Dummy_plan_1 × TSR 0.062* 0.072**
(0.03) (0.03)
Dummy_plan_2 × TSR 0.144*** 0.065***
(0.05) (0.03)
Dummy_plan_3 × TSR 0.186** 0.055**
(0.08) (0.02)
Dummy_plan_4 × TSR -1.445** -0.395**
(0.61) (0.16)
R-squared 0.78 0.79 0.84 0.80 0.87
Adjusted R-squared 0.67 0.69 0.77 0.72 0.81
Fixed firm effects Yes Yes Yes Yes Yes
Fixed year effects Yes Yes Yes Yes Yes
Observations 690 690 690 690 690

82
Table 4.2
Panel C: Multivariate model examining the effectiveness of number of plans for CEO at
previous interval (t-3→t)
This table represents the estimation of results for components of CEO compensation against long-
term firm performance (three-year return to shareholders), board size, % of non-executive
directors, % of top 4 largest institutional ownership, CEO age, CEO tenure, CEO chair duality,
granted value, CEO value plan 1, value plan 2, value plan 3, value plan 4 and market capitalization.
The dependent variable consists of (1) realized pay (2) total pay, expressed in the natural logarithm
of their values. Standard errors are clustered at the firm level and are reported in parentheses. ***,
**, * denote significance at 1%, 5%, and 10%, respectively.
Variable Realized Pay Total Pay
(1) (2)
Constant 10.534*** 5.245***
(1.31) (0.30)
Age 0.007 -0.001
(0.00) (0.00)
Tenure 0.034*** 0.012***
(0.01) (0.00)
CEO_chair_dual -0.072 -0.050
(0.17) (0.06)
Board_size 0.048 0.011
(0.04) (0.01)
Non_exec % -0.004** -0.002**
(0.00) (0.00)
4_largest_institutional % -0.004** -0.001*
(0.00) (0.00)
Ln_market_Cap 0.115* 0.039***
(0.06) (0.01)
TSR -0.011 -0.012
(0.03) (0.01)
Ln_value_grant 0.033*** 0.014*** (0.01) (0.00)
Ln (Value_plan_1) × TSR 0.001* 0.001* (0.00) (0.00)
Ln (Value_plan_2) × TSR 0.012*** 0.005*** (0.00) (0.00)
Ln (Value_plan_3) × TSR 0.021*** 0.008*** (0.01) (0.00)
Ln (Value_plan_4) × TSR -0.002*** -0.010*** (0.005) (0.004)
R-squared 0.80 0.86
Adjusted R-squared 0.72 0.80
Fixed firm effects Yes Yes
Fixed year effects Yes Yes
Observations 690 690

83
Table 4.2
Panel D: Multivariate model examining the effectiveness of type of plans for CEO
This table represents the estimation of results for total compensation against long-term firm
performance (three-year return to shareholders), board size, % of institutional ownership, % of top
4 largest institutional ownership, age, tenure, chair duality, granted value, dummy option, dummy
PSP, value option, value restricted stock share and market capitalization. The dependent variable
consists of (1) realized pay (2) total pay (3) realized pay (4) total pay, expressed in the natural
logarithm of their values. Standard errors are clustered at the firm level and are reported in
parentheses. ***, **, * denote significance at 1%, 5%, and 10%, respectively.
Variable Realized Pay Total Pay Realized Pay Total Pay
(1) (2) (3) (4)
Constant 10.964*** 5.501*** 10.773*** 5.384***
(1.53) (0.32) (1.58) (0.33)
Age 0.006 0.001 0.006 0.001
(0.01) (0.00) (0.01) (0.00)
Tenure 0.036*** 0.013*** 0.036*** 0.013***
(0.01) (0.00) (0.01) (0.00)
CEO_chair_dual 0.145 0.159 0.144 0.151
(0.53) (0.97) (0.53) (0.96)
Board_size 0.049 0.009 0.047 0.010
(0.05) (0.01) (0.05) (0.01)
Non_exec % -0.007** -0.002* -0.008** -0.003*
(0.00) (0.00) (0.00) (0.00)
4_largest_institutional % -0.003** -0.001** -0.003** -0.001*
(0.00) (0.00) (0.00) (0.00)
Ln_market_Cap 0.122* 0.040** 0.112* 0.034**
(0.07) (0.02) (0.07) (0.02)
TSR 0.054** 0.030*** 0.059*** 0.027***
(0.02) (0.01) (0.01) (0.00)
Dummy_PSP -0.009 -0.012
(0.03) (0.02)
Dummy_Option 0.013 0.013
(0.10) (0.04)
Dummy_PSP × TSR 0.092** 0.033***
(0.04) (0.00)
Dummy_Option × TSR 0.081 0.033
(0.10) (0.03)
Ln_value_grant 0.040*** 0.017***
(0.01) (0.00)
Ln (Value_PSP) × TSR 0.007*** 0.003***
(0.00) (0.00)
Ln (Value_Option) × TSR 0.006 0.002
(0.00) (0.00)
R-squared 0.80 0.86 0.80 0.86
Adjusted R-squared 0.70 0.79 0.71 0.80
Fixed firm effects Yes Yes Yes Yes
Fixed year effects Yes Yes Yes Yes
Observations 691 691 691 691

84
Turning to the discussion on CFO pay, the results presented in Panel A of Table 4.3 tests the
effect of short-term firm performance on the level of CFO short-term pay, equity pay, realized
pay, and total pay after controlling for corporate governance variables. The findings indicate
that the coefficient on TSR is positive and significant in determining short-term pay, realized
pay and total pay except for equity pay. This result is consistent with that of Conyon (2014),
who also employs three-year TSR for US firms. However, these regression results infer that a
CFO will receive an increase of 0.5% in realized pay for a 10-percentage point increase in total
shareholder return. Similar to the findings of CEO results, there is an insignificant association
between equity compensation and short-term firm performance. Taken as a whole, these results
reflect that there is an influence of firm performance to the level and structure of the CFO
compensation, thereby, supporting the principal-agent theory.
The results in Panel A of Table 4.3 also show that there exist insignificant associations between
board size and components of CEO pay. These findings suggest that bigger boards do not play
a monitoring role in the design of compensation contracts. Contrary to this, greater institutional
ownership concentration leads to lower levels of equity pay, realized pay and total pay for CFO.
These results imply that institutional owners show their concern on those components which
include performance-based elements. Similar to our findings for CEO tenure, there exists a
significant association between CFO tenure and the four components of pay, implying that
CFOs that stay longer in the firm receive higher levels of compensation. We note that greater
percentage of non-executive directors on board have a negative impact on equity pay, realized
pay and total pay. In contrast to CEO findings, these results are statistically significant at 10%.
This weak statistical evidence suggests that greater percentage of non-executive directors on
board show a greater concern for the levels of CEO pay when compared to the results for that
of CFO. However, we do not find any significant association between CFO age and the four
components of their pay. These results are contrary to the findings of El-Sayed (2013), where

85
age is an important determinant of the components of compensation. However, his study does
not exclusively analyse for CFO, rather, it considers all executives on the board.
Finally, the coefficients estimate for market capitalization, which is a proxy for firm size and
are positive and significant in determining all components of pay except for short-term pay.
These results are in line with the findings of Conyon and Murphy (2000). Usually, large sized
companies have a complex structure of executive compensation and grant more LTIPs than
small-sized firms. Large sized firms are in a better position to attract more talented CFOs due
to their greater capacity to pay. In turn, these talented CFOs will potentially enable the
achievement of targets leading to greater LTIPs vesting, resulting in increased CFO realized
pay, too.
Columns 1-3 of Table 4.3 (Panel B) show the effect of long-term performance on the level of
CFO equity pay, realized pay, and total pay. However, three-year total shareholder returns have
a positive and significant effect in determining equity pay, realized pay, and total pay at the 5%
significance level.
In Column 1, the coefficient for total shareholder return is 0.036 and statistically significant at
10% level in determining equity pay. This estimate implies that CFO will receive an increase
of 0.36 in equity pay for a 10-percentage point increase in total shareholder return. Although
there exists a positive association between these, the magnitude of coefficients on shareholder
return is much smaller for CFO in contrast to that of CEO, thus, suggesting that the relationship
between compensation and performance is stronger for CEO than that of CFO. This might be
due to since CEO holds higher position, therefore, firm places greater focus on the level of CEO
compensation. Overall, these findings lend support to the principal-agent model which asserts
that executives are rewarded to align their own interests with those of the shareholders.

86
Next, in Columns 4 and 5, we investigate the impact of the number of LTIPs granted on pay-
performance responsiveness. We include four dummies in order to differentiate between the
firms which grant long-term incentives relative to the firms which do not grant any LTIPs
(reference category). We find that the coefficients on Dummy plans 3 and 4 are high and
statistically significant in determining realized pay and total pay. Additionally, we include an
interaction between total shareholder return and the number of long-term incentive plans
granted by the company. The coefficients on Dummy 3 plan × TSR and Dummy 4 plan × TSR
show that in companies which grant three or four plans, there exist greater interest alignment
than those that do not offer LTIPs. However, the pay-performance responsiveness in companies
that offer one or two plans is not significantly different from those that do not grant any LTIPs.
Furthermore, in Column 4, for pay-performance responsiveness within four plans, the
coefficient of Dummy 4 plan interaction with TSR shows that a 10-percentage point increase
in TSR will lead to 1.94% increase in CFO realized pay. In contrast to this result, the pay-
performance responsiveness is weaker in firms which offer three plans. As discussed, previous
studies which take into account the equity component of compensation have only considered
the granted value of compensation as opposed to the vested value of equity compensation in
order to analyse pay and performance relationship or pay-performance responsiveness. Unlike
these studies, we employ total pay as well as realized pay, to get better insight into the
association between pay and performance.
Next, we examine the incentive strength of different long-term incentives. The results presented
in Panel C of Table 4.3 show that the pay-performance association further strengthens with the
greater amount awarded within the company that offers three or four LITPs. The association
between pay and performance for number of LTIPs and amount within these plans for CFO
differs to the findings for CEO. These results suggest that implementing greater number of

87
plans, which possibly has greater number of performance conditions will encourage greater
CFO effort. Thus, higher components in LTIPs will align CFO reward with shareholders’
interests to a greater extent. These results are consistent with our hypothesis and support agency
theory that the higher the amount granted within long-term incentives, the higher is the pay-
performance responsiveness.
In Column 2 of Table 4.3 (Panel D), in contrast to CEO, the presence of share options in CFO
compensation contracts is not associated with pay-performance responsiveness. However, the
interaction between dummy PSP and TSR shows that 10-percentage point improvement in TSR
results in an increase of 0.63%. This relationship further strengthens as the rewards become
more valuable, as shown in Column 3 of Table 4.3 (Panel D). Taking the results of CEO and
CFO together, we can conclude that there exists greater pay performance responsiveness when
PSPs are adopted in compensation contracts, strengthening the interest alignment, relative to
the use of stock options in compensation contracts; such convergence of interests between
CEO/CFO and shareholders stimulates firm performance.
4.6 Robustness Check
In this section, the previous results are subjected to a variety of robustness tests, all of which
are available in the Appendix to Chapter 4. Having already employed realized pay as a proxy
of compensation to investigate the pay-performance relationship and pay-performance
responsiveness in numbers and types of plans in our main results, we also employ market
adjusted TSR to analyze its impact on component of pay. We find that the short-term firm
performance positively impacts the compensation of CEO and CFO, except for equity pay.
However, there exists positive association between components of pay and long-term firm
performance, providing further evidence in support of our hypothesis. When we analyse pay-

88
performance responsiveness of number of plans and their strength within these plans, the results
from the market adjusted TSR also remain robust to original findings and show that for CEO,
the firms operating up to three plans, the greater the number and value of plans, the greater is
the pay-performance responsiveness. However, for CFO, the greater the number or value of
LTIPs granted, the higher is the total compensation and realized pay and greater pay-
performance responsiveness.

89
Table 4.3
Panel A: CFO compensation as a function of corporate performance at previous interval (t-1→t)
This table represents the estimation of results for different components of CFO compensation against
short-term firm performance (one year return to shareholders), board size, % of non-executive directors,
% of top 4 largest institutional ownership, chair duality, CFO age, CFO tenure and market capitalization.
The dependent variable consists of (1) short-term pay (2) equity pay (3) realized pay (4) total pay,
expressed in the natural logarithm of their values. Standard errors are clustered at the firm level and
are reported in parentheses. ***, **, * denote significance at 1%, 5%, and 10%, respectively.
Variable Short term pay Equity Pay Realized Pay Total Pay
(1) (2) (3) (4)
Constant 14.440*** 0.215 8.923*** 10.501***
(0.92) (2.48) (0.82) (1.55)
Age 0.002 0.004 -0.001 -0.001
(0.00) (0.02) (0.01) (0.01)
Tenure 0.013** 0.054*** 0.042*** 0.039***
(0.01) (0.01) (0.01) (0.01)
CEO_chair_dual 0.088 0.524 0.242 0.270
(0.09) (0.35) (0.40) (0.24)
Board_size 0.011 0.091 0.039 0.036
(0.01) (0.07) (0.03) (0.02)
Non_exec % -0.001 -0.003* -0.003* -0.004*
(0.00) (0.00) (0.00) (0.00)
4_largest_institutional % -0.002 -0.006** -0.004** -0.002*
(0.00) (0.00) (0.00) (0.00)
Ln_market_Cap -0.060 0.072*** 0.052*** 0.041*
(0.05) (0.01) (0.01) (0.02)
TSR 0.063** 0.003 0.051* 0.032*
(0.03) (0.06) (0.029) (0.018)
R-squared 0.76 0.72 0.71 0.75
Adjusted R-squared 0.67 0.58 0.61 0.63
Fixed firm effects Yes Yes Yes Yes
Fixed year effects Yes Yes Yes Yes
Observations 697 629 697 697

90
Table 4.3
Panel B: CFO compensation as a function of corporate performance at previous interval (t-
3→t)
This table represents the estimation of results for different components of CFO compensation against
long-term firm performance (three-year return to shareholders), board size, % of non-executive
directors, % of top 4 largest institutional ownership, CFO age, CFO tenure, chair duality, CFO
Dummy plan 1, Dummy plan 2, Dummy plan 3, Dummy plan 4 and market capitalization. The
dependent variable consists of (1) equity pay (2) realized pay (3) total pay (4) total realized pay (5)
total pay, expressed in the natural logarithm of their values.
Variable
Equity Pay Realized Pay Total
Pay
Realized Pay Total Pay
(1) (2) (3) (4) (5)
Constant 0.924 3.784*** 4.796*** 4.045*** 4.890***
(1.56) (0.52) (0.35) (0.39) (0.39)
Age 0.001 0.002 0.004 0.002 0.005
(0.01) (0.01) (0.00) (0.00) (0.00)
Tenure 0.026*** 0.011*** 0.010*** 0.009* 0.009***
(0.01) (0.00) (0.00) (0.01) (0.00)
CEO_chair_dual 0.23 0.132 0.189 0.223 0.171
(0.21) (0.26) (0.15) (0.26) (0.14)
Board_size 0.022 0.000 0.021 0.049 0.019
(0.02) (0.01) (0.02) (0.04) (0.01)
Non_exec % -0.002 -0.004* -0.001* -0.004* -0.002*
(0.00) (0.002) (0.00) (0.00) (0.00)
4_largest_institutional % -0.003*** -0.004** -0.002** -0.004* -0.001**
(0.00) (0.00) (0.00) (0.00) (0.00)
Ln_market_Cap 0.098*** 0.061*** 0.043*** 0.066*** 0.034**
(0.03) (0.02) (0.01) (0.02) (0.01)
TSR 0.036* 0.054** 0.031** 0.009 -0.029
(0.02) (0.02) (0.013) (0.02) (0.05)
Dummy_plan_1
0.109 0.098**
(0.08) (0.05)
Dummy_plan_2
0.173*** 0.107***
(0.06) (0.03)
Dummy_plan_3
0.276*** 0.196***
(0.07) (0.05)
Dummy_plan_4
0.378*** 0.289**
(0.11) (0.14)
Dummy_plan_1 × TSR 0.045 0.082
(0.05) (0.05)
Dummy_plan_2 × TSR 0.074 0.003
(0.05) (0.06)
Dummy_plan_3 × TSR 0.111** 0.050**
(0.05) (0.02)
Dummy_plan_4 × TSR 0.194* 0.081**
(0.11) (0.03)
R-squared 0.71 0..78 0.79 0.70 0.82
Adjusted R-squared 0.65 0.69 0.70 0.58 0.73
Fixed firm effects Yes Yes Yes Yes Yes
Fixed year effects Yes Yes Yes Yes Yes
Observations 647 647 647 647 647

91
Table 4.3
Panel C: Multivariate model examining the effectiveness of number of plans for CFO at
previous interval (t-3→t)
This table represents the estimation of results for different components of CFO compensation
against long-term firm performance (three-year return to shareholders), board size, % of non-
executive directors, % of top 4 largest institutional ownership, CFO age, CFO tenure, CEO chair
duality, granted value, value plan 1, value plan 2, value plan 3, value plan 4, and market
capitalization. The dependent variable consists of 1) realized pay 2) total pay, expressed in the
natural logarithm of their values. Standard errors are clustered at the firm level and are reported
in parentheses. ***, **, * denote significance at 1%, 5%, and 10%, respectively.
Variable Realized Pay Total Pay
(1) (2)
Constant 4.296*** 5.073***
(0.27) (0.43)
Age 0.002 0.004
(0.00) (0.00)
Tenure 0.009** 0.009***
(0.00) (0.00)
CEO_chair_dual 0.234 0.171
(0.27) (0.14)
Board_size 0.052 0.020
(0.04) (0.01)
Non_exec % -0.004* -0.002*
(0.002) (0.00)
4_largest_institutional % -0.004* -0.001**
(0.00) (0.00)
Ln_market_Cap 0.054*** 0.026*
(0.02) (0.02)
TSR 0.026 0.017
(0.02) (0.01)
Ln_value_grant 0.010*** 0.009** (0.00) (0.00)
Ln (Value_plan_1) × TSR 0.004 0.000 (0.00) (0.00)
Ln (Value_plan_2) × TSR 0.003* 0.002* (0.00) (0.00)
Ln (Value_plan_3) × TSR 0.008*** 0.008*** (0.00) (0.00)
Ln (Value_plan_4) × TSR 0.019*** 0.018***
(0.01) (0.01)
R-squared 0.69 0.83
Adjusted R-squared 0.79 0.73
Fixed firm effects Yes Yes
Fixed year effects Yes Yes
Observations 647 647

92
Table 4.3
Panel D: Multivariate model examining the effectiveness of type of plans for CFO
This table represents the estimation of results for CFO total compensation and total realized pay
against long-term firm performance (three-year return to shareholders), board size, % of non-
executive directors, % of top 4 largest institutional ownership, age, tenure, chair duality, dummy
Option, dummy PSP, value option, value restricted stock share and market capitalization. The
dependent variable consists of (1) realized pay (2) total pay (3) realized pay (2) total pay, expressed
in the natural logarithm of their values. Standard errors are clustered at the firm level and are
reported in parentheses. ***, **, * denote significance at 1%, 5%, and 10%, respectively.
Variable Realized Pay Total Pay Realized Pay Total Pay
(1) (2) (3) (4)
Constant 5.112*** 5.749*** 5.003*** 5.610***
(0.54) (0.43) (0.56) (0.38)
Age 0.002 0.001 0.003 0.001
(0.01) (0.00) (0.01) (0.00)
Tenure 0.014** 0.013*** 0.012** 0.013***
(0.00) (0.00) (0.01) (0.00)
CEO_chair_dual 0.238 0.201 0.234 0.194
(0.27) (0.16) (0.26) (0.15)
Board_size 0.051 0.020 0.051 0.020
(0.04) (0.01) (0.03) (0.01)
Non_exec % -0.004** -0.002* -0.004* -0.002*
(0.00) (0.00) (0.00) (0.00)
4_largest_institutional % -0.004** -0.002** -0.004* -0.001**
(0.00) (0.00) (0.00) (0.00)
Ln_market_Cap 0.062** 0.065** 0.054*** 0.026*
(0.02) (0.02) (0.02) (0.02)
TSR 0.031 0.020 0.021 0.030
(0.02) (0.01) (0.02) (0.02)
Dummy_PSP 0.008 0.024
(0.05) (0.03)
Dummy_Option 0.075 0.002
(0.08) (0.07)
Dummy_PSP × TSR 0.063*** 0.020**
(0.02) (0.01)
Dummy_Option × TSR -0.099 -0.014
(0.08) (0.05)
Ln_value_grant 0.011*** 0.009**
(0.00) (0.00)
Ln (Value_PSP) × TSR 0.003*** 0.002**
(0.00) (0.00)
Ln (Value_Option) × TSR -0.005 -0.002
(0.00) (0.00)
R-squared 0.80 0.86 0.80 0.86
Adjusted R-squared 0.70 0.79 0.71 0.80
Fixed firm effects Yes Yes Yes Yes
Fixed year effects Yes Yes Yes Yes
Observations 647 647 647 647

93
4.7 Conclusion
The current chapter studies different measures of CEO/CFO compensation in analyzing pay for
performance relationship for a sample of FTSE 350 firms (minus financial companies). In
contrast to previous UK studies, we employ a total realized pay which is the sum of base salary,
bonus and payouts/vested amount from LTIPs. As equity part of the compensation runs for
three years, we use three-year shareholder return to determine the impact on equity pay, total
pay, and realized pay. This chapter takes into account the effect of different numbers, amount,
and types of long-term incentive plans in analysing pay-performance responsiveness.
Additionally, we provide a novel contribution to the existing literature by analyzing CFO
compensation, since prior literature predominantly focuses on CEO compensation. In our
analysis, we control for several corporate governance variables such as chair duality, age and
tenure, top 4 institutional ownership, board size and percentage of non-executive directors.
Our results show that components of CEO/CFO compensation are determined by long-term
firm performance. However, there also exist positive associations between previous year’s total
shareholder return and components of pay except for equity pay. This finding suggests that
equity pay (long-term pay) is only determined by longer-term firm performance of three years.
We also observe that among all components of compensation, the magnitude of the coefficient
on three year shareholder return is higher in determining equity pay. This is because equity pay
includes the vested values from equity grants which are directly linked with performance.
Hence, these results are consistent with the principal-agent model. However, we also find that
CEO/CFO tenure is statistically significant in explaining measures of compensation. We also
document that non-executive directors and institutional investors actively monitor the equity
part of the compensation as it is the most variable component of the compensation.

94
The results of this study will help to lessen the concern of blockholders and institutional
investors about executives receiving higher levels of compensation and that this pay should be
adequately linked with firm performance. For CFO, the companies that use three or four long-
term incentives give higher realized pay and total remuneration than companies that do not
award long-term incentives. For CEO, our results indicate that companies which operate one,
two and three plans in compensation contracts, there exists greater pay performance
responsiveness than firms which do not offer any long-term incentive plan. This relationship
further strengthens the association between pay and performance if greater amount of incentives
are granted within these LTIPs. Furthermore, different performance conditions attached to the
compensation which are not solely based on total shareholder return can be a possible cause of
the negative existence of pay-performance responsiveness within companies which operates
four LTIPs. It is also possible that companies tilt the design of compensation package so that it
appears more complex but is, actually, not quite efficient. For CEO, the companies that operate
two or three plans provide a higher level of compensation than firms which do not operate any
LTIPs. For CFO, the greater the components in compensation package are, the higher the pay-
performance association. Lastly, for CEO as well as CFO, adopting performance share plans in
compensation contracts leads to a greater alignment between executives and shareholders’
interests. The pay-performance responsiveness is stronger for CEO than that of CFO. Finally,
there exists no pay performance responsiveness when share options are adopted in
compensation contracts.

95
APPENDIX TO CHAPTER 4
Variable Definition
This table provides a detailed description of the construction of all the variables used in this
chapter.
Dependent Variables Definition
Base Salary
Natural logarithm of fixed amount received by both CEO and CFO for
that financial year
Bonus Natural logarithm of amount paid to CEO and CFO for the financial
year inclusive of any deferred element (provided there is no
performance requirement on release)
Short-term Pay Natural logarithm of total cash value received from first two pay
components and other benefits and allowances received by both CEO
and CFO
Equity pay
Realized Pay
Total Pay
Natural logarithm of the granted value of performance shares, option
grants, grant value of matching plans, vested value of performance
share plans, exercised value of options, and vested value of matching
plans. Total remuneration includes total cash plus the granted value of
long-term incentives for that financial year
Natural logarithm of the sum of base pay, bonus and the vested value
of long-term incentives (options, performance share plans, matching
plans and others that are vested for that financial year)
Natural logarithm of short-term pay plus the granted value of long-term
incentives (options, performance share plans, matching plans and
others) for that financial year

96
Independent Variables Definition
CEO/ CFO Age
Age of CEO and CFO
CEO/ CFO Tenure
The number of years, respectively, served in these positions
4_largest_institutional % The percentage ownership held by the top-four institutional investors
Non_exec % Percentage of number of non-executive directors over total number of
directors
Board_size Total number of directors on the board
Ln_market_Cap
Dummy plan (1,2,3,4)
Value_plan (1, 2, 3, 4)
Natural Logarithm of the Stock’s Market Capitalization; i.e. the product
of the price per share and the number of shares outstanding at the end of
financial year, expressed in thousands of pounds
Dummy plan 1 is a dummy variable which is equal to one if the firm
operates one long-term incentive plan in CEO/CFO compensation
contract, zero otherwise. Similarly, for Dummy plan 2, it works as
follows: if the company rewards two long-term incentives, it takes the
value of 1 and zero-otherwise. The other two Dummy plans 3 and 4 are
similarly constructed.
The value of awards within the dummy plans 1, 2, 3 and 4, respectively,
as granted by the company

97
Table A. 4.1: Hausman Test
In order to select between the fixed effects and random effects estimator, we conduct the
Hausman (1978) test. Its null hypothesis states that the error terms are not correlated with the
independent variables, implying that the random effects estimator is the more efficient
alternative (Greene, 2012).
E. 1 Hypothesis test
Null hypothesis: Random-effects model is appropriate
Alternative hypothesis: fixed effects model is appropriate
Based on the results if null is rejected, then the alternative hypothesis or fixed effects model
would be preferred over random effects model.
The Hausman test results
The Hausman test results Test: Ho: difference in coefficients
not systematic
chi2(22) = (b-B)'[(V_b-V_B)^(-1)](b-B)
= 50.02
Prob>chi2 = 0.000
where b is the vector of fixed effect estimate, and B is a vector of random effect estimate. The
null hypothesis is that the difference in coefficients is not systematic. This implies that that
there is no correlation between heterogeneous effects and the explanatory variables. When
random effect is valid, the difference in test statistics between random effect and fixed effect is
tiny or close to zero (Wooldridge, 2010). However, when random effect is not valid, then

98
random and fixed effect will have a large difference and the test statistic will be different from
zero, thus rejecting the null hypothesis.
According to the above table, the p-value for the Hausman test is less than 1% which indicates
that random effects are not appropriate and that the fixed effects should be estimated, instead.
Therefore, the Hausman test rejects the null hypothesis and the use of fixed effects model is
favoured over the use of random effects model. Thus, we estimate our pay-performance model
by using the fixed effects model.

99
Table A. 4.2: Robustness test: Impact of Market adjusted TSR (1 year) on components of CEO
pay
For simplicity, we only report results of our main variables (TSR). The dependent variable consists of
1) short-term compensation (2) equity pay (3) realized pay (4) total pay. Standard errors are clustered at
the firm level and are reported in parentheses. ***, **, * denote significance at 1%, 5%, and 10%,
respectively.
(1) (2) (3) (4)
TSR 0.031* 0.002 0.089** 0.062*
(0.016) (0.059) (0.039) (0.036)
Table A.4.3: Robustness test: Impact of market adjusted TSR (3 years) on components of CEO
pay
For simplicity, we only report results of our main variables (TSR and their interactions with numbers
and value of plans). The dependent variable consists of (2) equity pay (3) realized pay (4) total pay.
Standard errors are clustered at the firm level and are reported in parentheses. ***, **, * denote
significance at 1%, 5%, and 10%, respectively.
(2) (3) (4) (3) (4) (3) (4)
TSR 0.060** 0.112*** 0.086** 0.025 0.039 0.041 0.012 (0.028) (0.010) (0.040) (0.061) (0.028) (0.021) (0.008)
Dummy_plan_1 × TSR 0.129* 0.056
(0.067)) (0.037)
Dummy_plan_2 × TSR 0.099** 0.053**
(0.046) (0.024)
Dummy_plan_3 × TSR 0.110** 0.055**
(0.070) (0.025)
Dummy_plan_4 × TSR -2.185** -0.605**
(0.935) (0.256)
Ln (Value_plan_1) ×
TSR 0.007* 0.001*
(0.003) (0.000)
Ln (Value_plan_2) ×
TSR 0.012*** 0.004***
(0.002) (0.001)
Ln (Value_plan_3) ×
TSR 0.021*** 0.102**
(0.005) (0.014) Ln (Value_plan_4) ×
TSR -0.002* -0.001**
(0.001) (0.000)

100
Table A.4.4: Robustness test: Impact of Market adjusted TSR (1 year) on component of CFO Pay
For simplicity, we only report results of our main variables (TSR). The dependent variable consists of
1) short-term compensation (2) equity pay (3) realized pay (4) total pay. Standard errors are clustered at
the firm level and are reported in parentheses. ***, **, * denote significance at 1%, 5%, and 10%,
respectively.
(1) (2) (3) (4)
TSR 0.067** 0.032 0.041** 0.029*
(0.031) (0.024) (0.019) (0.016)
Table A.4.5: Robustness test: Impact of market adjusted TSR (3 years) on components of CFO
pay
For simplicity, we only report results of our main variables (TSR and their interactions with numbers
and value of plans). The dependent variable consists of (2) equity pay (3) realized pay (4) total pay. For
simplicity, we only report results of our main variables (TSR). Standard errors are clustered at the firm
level and are reported in parentheses. ***, **, * denote significance at 1%, 5%, and 10%, respectively.
(2) (3) (4) (3) (4) (3) (4)
TSR 0.037* 0.043** 0.027** 0.010 0.030 0.023 0.012
(0.021) (0.021) (0.012) (0.061) (0.060) (0.015) (0.013)
Dummy_plan_1 × TSR 0.089 0.054
(0.059) (0.042)
Dummy_plan_2 × TSR 0.086* 0.045
(0.049) (0.063)
Dummy_plan_3 × TSR 0.126** 0.076*
(0.051) (0.042)
Dummy_plan_4 × TSR 0.231** 0.120*
(0.101) (0.057)
Ln (Value_plan_1) ×
TSR 0.004 0.000
(0.003) (0.000)
Ln (Value_plan_2) ×
TSR 0.002* 0.003**
(0.001) (0.001)
Ln (Value_plan_3) ×
TSR 0.008*** 0.009***
(0.001) (0.000)
Ln (Value_plan_4) ×
TSR 0.022*** 0.021***
(0.008) (0.007)

101
5 THE CHOICE OF PERFORMANCE MEASURES, TARGET SETTING AND
VESTING LEVELS IN UK FIRMS CEO COMPENSATION CONTRACT
5.1 Introduction
There have been widespread concerns not only on excessive levels of CEO pay but also on the
mechanics of incentivization. Prior to the 1990s, the vesting of stock options and restricted
shares were time-dependent. As noted in Section 2.1.2, in 1995 the Greenbury Report
recommended that UK firms should incorporate rewards dependent upon the firm performance,
in preference to traditional time-vested options and restricted stock shares. Successive versions
of corporate governance code have resulted in the shift of the landscape for long-term incentive
plans, to strengthen interest alignment between executives and shareholders. Since 2002, UK
firms have been required to disclose the components of their long-term incentive plans and the
performance targets attached to the compensation contracts as per the Directors’ Remuneration
Report Regulations 2002 (DRRR, 2002) and other corporate governance codes as reviewed in
Section 2.1.2.
The executive compensation literature has generally focused on examining the association
between executive compensation and firm performance (Jensen and Murphy, 1990; Bebchuk
and Fried, 2004 and Ozkan, 2007). Even though, as Murphy (1999) notes, the type of
performance measure forms an integral part of compensation structures, along with the levels
of target setting, only a limited number of studies have analysed these contractual terms (e.g.
Gao et al., 2017; De Angelis and Grinstein, 2015 and Li and Wang, 2016), and whether
contracts are designed optimally is still a matter of debate. Additionally, we observe a paradox:
while there is greater transparency within annual reports as to the details of their remuneration
processes, there is little understanding of the general norms and trends in performance targets,

102
and their effects in terms of how the detail of the contractual terms affect actual payout are not
well understood by investors or the general public.
This chapter contributes to the debate by drawing on a novel dataset whose richness and breadth
provides the opportunity to examine the current landscape of long-term incentive plans and
their features. While most studies have examined the US firms, research on executive
compensation in the UK has made a limited survey of performance measures and targets with
sample period for these studies ending in 2003 (e.g. Conyon et al., 2000; Pass et al., 2000 and
Zakaria, 2012).
This chapter makes a number of contributions to the global literature on the contractual terms
of executive compensation. First, we document a wider array of performance categories
employed in CEO compensation contracts than previous studies. Secondly, we provide novel
details on vesting levels pertaining to minimum and maximum thresholds of EPS performance
measures. Thirdly, we provide new detail on the different relative benchmarks and the use of
outperformance plans which trigger vesting when market-based performance measures are set
beyond the upper quartile percentile ranking (i.e. in the highest quintile). In a new analysis, we
show how the choice of performance benchmark affects how many plans vest and attain
minimum and maximum thresholds in actuality. We uncover evidence that some peer groups
and benchmarks are easier to beat than others, suggesting that managers could have an influence
in the selection of “soft targets”. Fourthly, for accounting-based performance measures, we
present new detail on the breakdown of different types of EPS and relative targets, and examine
their influence on actual vesting, and show again that the formulation of the EPS target has a
substantial influence on actual vesting. Finally, we perform a novel empirical analysis on the
effect of EPS and TSR volatility on the performance choices made by firms in CEO
compensation, after controlling for firm-specific-characteristics, industry and the identity of the

103
remuneration advisor. In this, we extend the analysis to consider plans which use both EPS and
TSR simultaneously as performance measures, and also those which use neither EPS nor TSR,
categories which together make up more than half our sample, but which all previous studies
have neglected to consider, opting instead for a simplistic EPS vs TSR dichotomy. We find
evidence in line with optimal contracting theory as firms select performance measures which
are less volatile in nature and our findings also indicate that some remuneration advisors have
a clear preference for some performance measures over others. The descriptive statistics show
that there exists significant variation in the design of compensation contracts.
The rest of the chapter is structured as follows: Section 5.2 provides an overview of the
underlying literature and hypothesis development. Section 5.3 provides an overview of the plan
structure. In Section 5.4, we discuss the methodology of our research. Section 5.5 presents the
data analysis and empirical results of the model. Section 5.6 focuses on the detailed design of
compensation contracts. Section 5.7 provides a summary and conclusion.
5.2 Theory, Related Literature and Hypothesis Development
The separation of ownership and control represents a classical principal-agent problem
as management tends to pursue activities that increase their own well-being. Optimal
contracting theory views stock-based compensation as a key corporate governance mechanism
that mitigates or aligns the divergent interests of management and shareholders of the company.
Compensation schemes ought to be designed in such a way as to serve this objective, and firms
ought to seek more sophisticated ways of tying executive compensation to firm performance.
Hence, optimal contracting theory predicts that firms should incorporate all performance
measures which might motivate managers to act in the manner desired by the firm’s
shareholders.

104
The Association of British Insurers (ABI), now merged with IVIS, in 1996 published guidelines
on the framework of long-term incentives, which promote the following principles39: 1)
Performance targets should be challenging and linked to corporate performance, 2)
Performance targets should be transparent and subject to disclosure, and 3) Performance in
long-term incentives should be measured relative to an appropriate peer group or other relevant
benchmarks. Interestingly, neither agency theory nor the ABI guidelines specifically mention
to employ certain performance measures in compensation contracts, but the theory can be
applied to determine the properties of suitable metrics in order to evaluate executive’s
performance. Hence, this study will seek to determine how firms use different performance
metrics in order to align executives' interests with those of shareholders.
5.2.1 Related Literature
5.2.1.1 The Development of the Study of Performance Measures
In examining the history of the construction of executive compensation contracts, we observe
that the first generation of performance contracts predominantly utilised market-based
measures, while subsequent development has seen the wider introduction of accounting-based
measures, and a greater sophistication in the levels and mechanisms of vesting of the rewards.
We also see a move towards much greater transparency and disclosure in executive pay-setting.
As an example, previous studies show that the firms use accounting measures to evaluate firms’
performance when designing compensation contracts (Larcker, 1983; Kumar and Sopariwala,
1992). While others report the introduction of non-financial measures in compensation
39 Note: Presently, ABI guidelines is part of the Investment Association.
https://www.ivis.co.uk/guidelines
[accessed 20 June, 2017].

105
contracts (Ittner et al., 1997; Kaplan and Norton, 1992). Later on, the study of executive
compensation has moved into examining the pay-performance relationship. A number of
studies (e.g. Jensen and Murphy, 1990; Gregg et al., 2012 and Conyon and Peck, 1998) describe
the use of the financial and accounting performance measures in examining the pay-
performance relationship.
As reviewed in Section 3.3.2, the usefulness of accounting metrics has been discussed by earlier
researchers, for example, Lambert and Larcker (1987) and Sloan (1993). Sloan (1993) analyses
the cross-section variation in sensitivity of executive remuneration to stock price and earnings
firm performance. The author concludes that earnings play a vital role in shielding executive
compensation from market fluctuation in equity pay. However, the results of Lambert and
Larcker’s (1987) study conclude that US firms place more weight on market performance
measures when accounting performance measures are more volatile.
Until the reforms brought in by the DRRR in 2002 and Security Exchange Commission (SEC)
in 2006, the disclosure of details of executive compensation contracts was limited in the UK
and the US respectively, however, annual reports now provide much greater transparency.
Previous research which found a prevalence of non-financial measures in executive
compensation may, therefore, have been employing an implicit rather than an explicit approach
(Davila and Venkatachalam, 2004).
Since then, researchers have started to hand-collect compensation data on US firms, for
example, Kim and Yang (2010) examine performance metrics in annual bonus contracts during
2006-2009, Bettis et al. (2010) study 983 US equity-based grants with performance contingency
from 1995 to 2001, and De Angelis and Grinstein (2015) analyse the performance criteria in
US equity-based grants in 2007. However, far fewer studies have examined the UK.

106
The only comparable UK study for the present analysis is that of Zakaria (2012), who presents
a breakdown of performance measures into options and restricted shares for UK firms for the
single year 2002/2003. The study provides a breakdown of performance targets into EPS and
TSR measures. We extend this study by taking into account all elements of equity compensation
including matching plans and also analyzing the breakdown of minimum and maximum
threshold targets required to achieve minimum and upper quartile vesting, neither of which are
captured by Zakaria (2012). In addition, our empirical analysis includes companies which
employ EPS and TSR measures in combination. We consider this to be an important
methodological advance since this latter category accounts for over 45% of the firms in our
sample.
5.2.1.2 The Problem of Volatility in Measuring Management Effort
Holmstrom (1979) formulates the theory of the optimal contact under the moral-hazard
problem, and develops the “Informativeness Principle”, that any performance measure that
reveals information about the level of effort provided by an agent (CEO) should be included as
a performance metric. He further shows the negative relationship between the noise present in
a performance measure and its usefulness in a compensation package. Further, Aggarwal and
Samwick (1999b) conclude that CEO pay becomes less sensitive to performance as TSR
volatility increases. High pay-performance sensitivity (PPS) evidences a greater alignment
between the interests of shareholders and executives. PPS is, therefore, the responsiveness of
pay to the change in company performance.
Firms should choose performance measures that strengthen the link between pay and
performance in an executive compensation package. Consequently, CEOs should prefer a less
volatile performance measure to one which is more volatile, as this reduces uncertainty as to

107
their level of reward, leading them to make more effort. Hence, optimal contracting theory
assists the empirical design of the performance measure, stating that it should not be noisy and
insensitive to managerial actions.
Over time, one accounting measure, namely, earnings, has become predominant as a
performance metric in incentive contracts. One possible explanation is that earnings figures are
more under the direct control of management (Sloan, 1993; O’Byrne, 1990; Watts and
Zimmerman, 1990). By contrast, stock prices are affected by market factors which are outside
the control of management. In a working paper, Chemmanur et al. (2010) highlight how
management can manipulate earnings per share, and show that firms repurchase shares from
the market in order to meet EPS targets. An increase in stock repurchases will decrease the
number of shares in the market, hence, an increase in EPS can be engineered.
Until the 1980s, the use of accounting performance measures was considered to be the only
remedy to the issue of volatility in share prices, making market-based measure an unreliable
indicator of management effort. Firms' use of market and accounting-based measures have been
observed by Murphy (1999) and Pass et al. (2000). However, in the last two decades, it has
become increasingly common to use comparator groups within TSR measures in order to
identify and reward relative outperformance and factor out fluctuations which are due to overall
market movements. Holmstrom (1982) conducts a pioneering study in measuring relative
performance evaluation (RPE), focusing on the need to remove common risk within
compensation packages by using the share price relative to a peer group of companies within
the same industry or market. RPE in compensation contracts enables common uncertainties to
be filtered out and provides more efficient schemes (Lazear and Rosen, 1981).
More recently, Li and Wang (2016) explore the relationship between volatility and the choice
of each individual long-term accounting measure in the compensation contracts of US firms.

108
Their results show that firms are more likely to choose those performance metrics which are
less volatile in nature.
5.2.1.3 Hypotheses
In light of the above, we formulate the following research hypotheses:
Hypothesis 5.1 a: The higher the volatility of the market-based (TSR) measure, the greater the
likelihood of choosing an accounting-based measure (EPS) only.
Hypothesis 5.1 b: The higher the volatility of the accounting-based measure (EPS), the greater
the likelihood of choosing a market-based measure (TSR) only.
5.2.1.4 Isomorphism in Executive Compensation Contracts
The separation of ownership and control can affect the manager's choice of action that
potentially influences the wealth of a company's shareholders; efficient contracts should,
therefore, be designed in such a way that greater manager-shareholder interest alignment can
take place (Conyon et al., 2009). However, other constraints and influences inform the
construction of executive contracts: in its simplest form, companies are liable to copy existing
practice, and compensation consultants may diffuse the adoption of certain pay practices to
other firms, as they may tend to recommend similar structures to a number of different clients.
Additionally, executives may bring with them their own expectations of how contracts should
be structured, drawing on their own experience-based standard as developed through service
on other boards.
More formally, the literature of institutional theory addresses these using a discourse of
"isomorphism" to account for these socially-mediated similarities (Di Maggio & Powell 1983).

109
Three different forms of isomorphism have been identified: mimetic, coercive and normative.
Mimetic isomorphism exists when firms follow what other firms are doing in the absence of
clear guidelines (Porac et al, 1999; Zajac and Westphal, 1995). Normative isomorphism exists
when firms follow standard procedures owing to the influence of common personnel, for
example, when executives moving from one board to another leads to common practices being
introduced (O’ Reilly et al, 1988; Perkins and Hendry, 2005). Coercive isomorphism arises
from regulations or codes of conduct forcing the adoption of certain pay-performance practices
(Barreto and Baden-Fuller, 2006). In regard to executive compensation, we, therefore, suspect
that all three forms of isomorphism may be involved.
5.2.1.5 The Structure of Compensation Contracts
While the above notes studies focusing on the pay-performance relationship for UK and US
firms, fewer studies have looked at the detailed structure of compensation contracts, and here,
most research has focused on US firms. Murphy (1999) conducts an analysis on the pay
practices of US firms, looking at the level and structure of incentive contracts in terms of shares
and options employed by the firm within different industries, but does not detail the breakdown
of these performance measures. The US pay-setting process is both less transparent and less
complex compared to the UK, which makes the research of executive compensation in the UK
potentially more informative.
Pass et al. (2000) analyse the breakdown of options and long-term incentives for 150 large
companies in the UK, and note that there has been a rapid increase in the use of long-term
incentives. Further, they recommend that firms should operate TSR based schemes and
benchmark it with appropriate index. Their study does not shed light on vesting percentage at
minimum and maximum thresholds targets.

110
5.2.1.6 The Role of Compensation Consultants
With an increase in the complexity of equity-based pay, the role of the compensation consultant
has become crucial as they are considered experts with technical knowledge on the design of
compensation packages (Bender, 2011). It has become a widespread practice in US and UK
firms to hire compensation consultants to advise on the design and implementation of
compensation packages. Conyon et al. (2009) report that the majority of firms in the FTSE 350
Index hire two consultants, with one consultant providing data services and the other providing
advice on remuneration packages. Most firms use compensation consultants to gain a
perspective on industry-wide compensation practices and those of their competitors. It is
possible that as consultants devise new innovative compensation designs, pay-performance
practice becomes similar across their clients they advise. Hence, this represents an example of
normative isomorphism. Since there is an increase in the number of long-term incentive
arrangements in the market, practices will tend to evolve and solidify.
Usually, a remuneration committee will seek independent advice from a remuneration
consultant on the design of their compensation packages. The consultant further assists
remuneration committees in determining the structure and level of compensation, and the
performance measure to be applied.
However, little is known about the factors that influence the actual choice of performance
measure. One potential explanation is that firms select specific performance metrics based on
the standard practice by their competitors in their industry, or in the market.

111
5.3 Executive Compensation Plan Structure
5.3.1 The Dataset
Our sample consists of 400 UK with largest market capitalization, from 2007 to 2015. Data on
executive compensation contracts comes from the commercial MEIS database, supplemented
by hand-collected data from annual reports for 2007 to 2010. To ensure data integrity, MEIS
data was verified by checking against hand-collected annual reports.
We study a total of 3400 long-term incentive plans. Many of these plans are inactive and not
used in a current year. As a result, our final sample consists of 2970 long-term incentive plans.
We categorize industries using the top-level FTSE ICB (Industry Classified Benchmark),
consisting of the following industries: basic materials, consumer goods, consumer services,
financial, healthcare, technology, oil and gas, utilities and industrials.
5.3.2 The Design of Executive Compensation Contracts
In this section, we analyse the design of executives’ equity compensation. We find that long-
term incentives take different forms, and usually, in the UK context, “long-term” refers to those
plans that last for three years.
We identify three very different forms of compensation. Firstly, traditional share options are
options on the company’s stock with a non-zero strike price, so that the executive receives cash
equal to the difference between the share price and the exercise price on the day they are
exercised. Secondly, performance share plans (PSPs), also known as nil cost options, are
options on the company’s stock with a zero-strike price, which pay cash on the day they are
exercised in a similar manner. Finally, share matching plans, also known as co-investment
plans, are those in which executives invest part of their annual bonus in shares, and if long-term

112
performance conditions are met after three years, they receive a multiple of their initial
investment in the form of shares. For some firms, this deferral is compulsory rather than
voluntary. For example, in a “2:1” match, a deferral of 200,000 shares leads to the grant of an
additional 200,000 shares if performance targets are met. Finally, long-term compensation may
be given in the form of cash.
Performance targets can be further classified as the range of company performance in which
rewards will vest: many plans have lower threshold targets, which are the minimum that must
be attained for any rewards at all to vest, and upper threshold targets, at which the maximum
possible reward is paid out. Further, performance targets can be classified as being relative to a
benchmark or comparator group, or absolute.
Long-term incentive plans will not usually vest without the achievement of performance
hurdles as assessed over a three-year performance period. These awards are made on a rolling
basis and are frequently updated or modified depending on a company’s objectives.
5.4 Methodology
5.4.1 Independent Variables
For independent variables, we use volatility in earnings per share (hereafter, EPS volatility) and
volatility in total shareholder return (hereafter, TSR volatility). Furthermore, we also include
corporate governance characteristics: board size, percentage of non-executive directors, firm
age and CEO tenure which, potentially, have an influence on performance choices.
Following Zakaria (2012), we employ a set of control variables using free cash flow, market to
book value and sales. We hypothesize that the choice of performance measure will be
influenced by sales and firms will select market-based performance measures if they find

113
appropriate peers to compare their relative performance. Murphy (2000) finds that firms with
higher level of growth opportunities are more likely to employ TSR over internal based
measures, as TSR incentivizes manager of higher growth firms to smooth out any fluctuations.
All of these variables relate to the previous year as the observation. MTB is defined as the
Market to Book value, using the MTBV datatype from Datastream.
Total shareholder returns and earnings per share are derived from the Return Index data
published by Datastream. In addition, we use Datastream to collect the percentage of non-
executive directors on the board. We collect data for board size from Bloomberg.
We follow Zakaria (2012) and define TSR volatility as the past Total Return volatility,
measured quarterly, over the prior 36 months. We define EPS volatility as the volatility of EPS
growth measured on a semi-annual basis, over the prior 36 months, since UK firms disclose
EPS twice a year.
5.4.2 Sample Construction
Firms use a wide range of performance measures in CEO compensation and have different
payment methods, which include matching plans, options and performance share plans.
Interestingly, most firms use the same performance measure category for all payment methods
(i.e. options, restricted stock shares and matching plans). A few firms, however, employ
different performance measure categories for different payment methods, for example,
choosing EPS and TSR jointly in one long-term incentive plan while using EPS only in an
additional long-term incentive plan.

114
For the purposes of the present analysis, if more than one long-term incentive plan exists, we
include only firms which have the same performance measure category across all long-term
incentive plans. This restriction loses 3% of the overall sample by firm-years.
Initially, our sample consists of 2970 active long-term incentive plans. For the purposes of
descriptive statistics, we exclude plans that relate to one-off circumstance, e.g. mergers and
acquisitions, spin-offs, retention plans and recruitment plans, since in most cases, these are
specific to named executives, and many do not have any performance conditions attached.
We also exclude those firms which use a combination of TSR and some other performance
measure (not including EPS or income-based measures) in a single year, and also, those firms
which use a combination of EPS and some other performance measure (not including TSR) in
a single year.
Additionally, to be included in a regression, a company must have valid corporate governance
variables and valid data on total shareholder return and earnings per share for the prior three
years for each year. The sample used for regression analysis is at the firm level and consists of
1931 firm-years.
5.4.3 Data Coding
The central testable prediction of the optimal contracting theory is that volatility in performance
measures will affect the choice of performance measure. Accordingly, we test this using a
multinomial logit model, in which the dependent variable, namely, the choice of performance
measure, consists of four different categories: we code "EPS and TSR jointly" as category 0,
TSR as category 1, EPS as category 2, and "neither EPS nor TSR" as category 3.

115
In the following analysis, the "neither EPS nor TSR" category includes plans where the
performance measure is either qualitative or where it includes neither a TSR nor an earnings
measure.
5.4.4 Model Estimation
Multinomial Logit Model
Let Pi,j be the probability that the ith firm chooses performance measure j , given by
, , ,Pr( ) for , {0,1,2,3}i j i j i kP R R k j j , (5.1)
where Ri,j is the maximum utility attainable for firm i if it chooses performance measure j. Then,
'
, ,,i j j i i jR X (5.2)
where Xi is a vector of firm characteristics, and βj is a vector of corresponding coefficients.
If the stochastic terms εi,j are independent and identically distributed, and follow the Weibull
distribution, then the probability of performance choices can be modelled by the multinomial
logit model:
'
, 3'
0
exp( )P
exp( )
j i
i j
j i
j
X
X
(5.3)
In this model, we use the firms that choose EPS and TSR jointly as a performance measure as
the reference category and normalize the corresponding vector β0 = 0. Hence, the probability
of firm i having (EPS and TSR jointly) as a performance measure in a compensation contract
is given by:

116
,0 3'
1
1P
1 exp( )i
j i
j
X
(5.4)
And the probability of firm i having EPS only, TSR only, or (neither EPS nor TSR), is given
by:
'
, 3'
1
exp( )P
1 exp( )
j i
i j
j i
j
X
X
for j = 1,2, and 3. (5.5)
We estimate this model using maximum likelihood. The estimated coefficient βj should be
interpreted as the change in the probability of choice j (EPS, TSR, or neither EPS nor TSR)
relative to the probability of choosing (EPS and TSR jointly), for a one-unit change in the
independent variable.
The multinomial logit model can be seen as simultaneously estimating a binary logit model
comparing among the dependent categories and reference category (Long, 1997). When
estimating a multinomial logit model, we need to select a reference category to which the
estimated coefficient will relate.
The results from the model will tell us whether the type of performance measure is influenced
by volatility where Xi is a vector of firm characteristics. Our model is therefore:
i , t-1 i ,
, 1 , 1 2 , 1
3 , 1 1 4 , 1 ,
1
t
1
Prob. of Performance Measure EPS Volatility TSR Volatility
Sales Firm Tenure Corporate Governance Variables
n control variable
j t i t t i t
p
i t i t j i t
j
(5.6)
for firm i at time period t, where ɛi,t is the error term
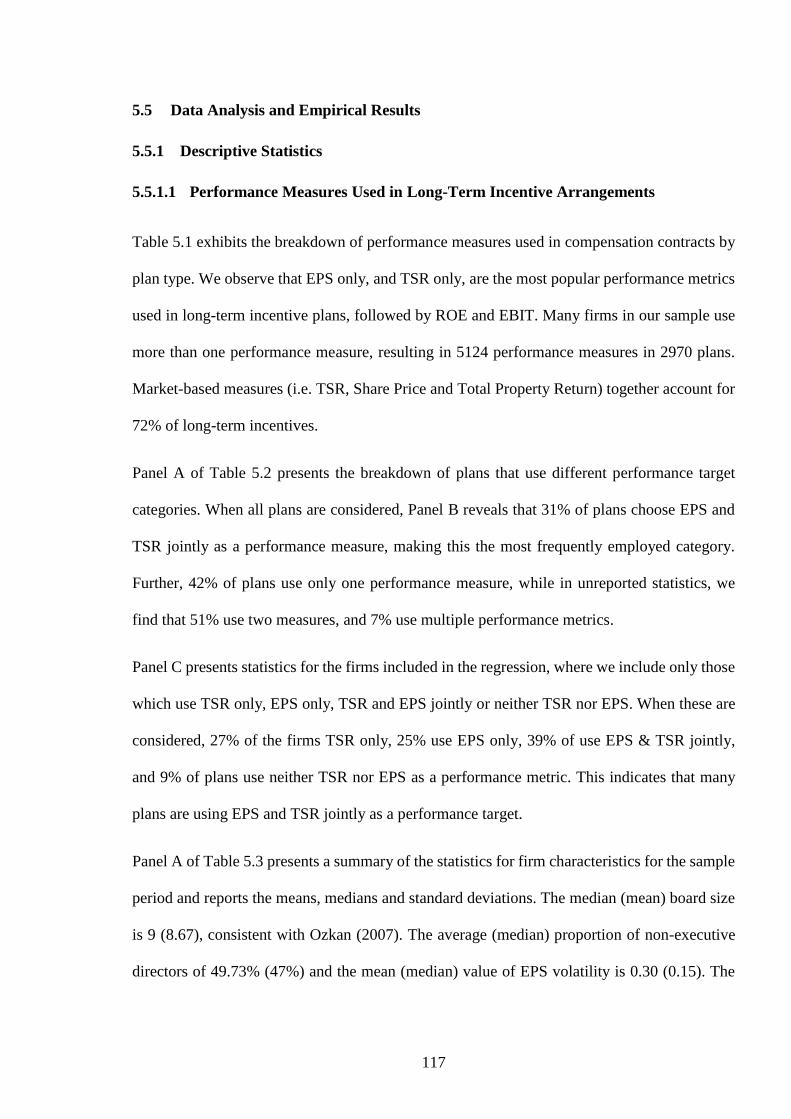
117
5.5 Data Analysis and Empirical Results
5.5.1 Descriptive Statistics
5.5.1.1 Performance Measures Used in Long-Term Incentive Arrangements
Table 5.1 exhibits the breakdown of performance measures used in compensation contracts by
plan type. We observe that EPS only, and TSR only, are the most popular performance metrics
used in long-term incentive plans, followed by ROE and EBIT. Many firms in our sample use
more than one performance measure, resulting in 5124 performance measures in 2970 plans.
Market-based measures (i.e. TSR, Share Price and Total Property Return) together account for
72% of long-term incentives.
Panel A of Table 5.2 presents the breakdown of plans that use different performance target
categories. When all plans are considered, Panel B reveals that 31% of plans choose EPS and
TSR jointly as a performance measure, making this the most frequently employed category.
Further, 42% of plans use only one performance measure, while in unreported statistics, we
find that 51% use two measures, and 7% use multiple performance metrics.
Panel C presents statistics for the firms included in the regression, where we include only those
which use TSR only, EPS only, TSR and EPS jointly or neither TSR nor EPS. When these are
considered, 27% of the firms TSR only, 25% use EPS only, 39% of use EPS & TSR jointly,
and 9% of plans use neither TSR nor EPS as a performance metric. This indicates that many
plans are using EPS and TSR jointly as a performance target.
Panel A of Table 5.3 presents a summary of the statistics for firm characteristics for the sample
period and reports the means, medians and standard deviations. The median (mean) board size
is 9 (8.67), consistent with Ozkan (2007). The average (median) proportion of non-executive
directors of 49.73% (47%) and the mean (median) value of EPS volatility is 0.30 (0.15). The

118
mean value of TSR volatility is 0.05, suggesting that EPS is a much more volatile measure
compared to TSR.
Panel B of Table 5.3 reports the correlations between the independent variables of the sample.
The correlation between the EPS volatility and TSR volatility is only -0.02. Turning to the
correlations between the control variables, we find that the largest correlations are no higher
than 39% (Panel B of Table 5.5.2). Thus, we infer that concerns of multicollinearity are not a
major issue in the data.
Panel C of Table 5.3 reports summary statistics for compensation consultants. New Bridge
Street is the most popular consultant, with a market share of 34.4%, followed by Deloitte
(14.9%), Kepler (11.9%), PwC (9.8%), Towers (10.4%) and Mercer (1.2%). The "big six"
remuneration consultants account for 83% of total market share, similar to the US, where the
largest six remuneration advisors account for more than 67% of total market share (Cadman et
al., 2010). Other smaller advisors include MEIS, EY, MM&K, Fit, Aon Hewitt, M C Lutyens,
Pinsent, RSA Consulting, KPMG and Hay.

119
Table 5.1: Performance measures used in long-term incentive arrangement
Performance share
plans2176 1721 38 1415 269 56 135 34 88 106 73 133 3 4063
Share options 347 114 8 244 15 0 16 6 0 5 0 7 8 423
Matching plans 447 190 5 234 69 9 32 3 31 26 28 11 5 638
Total 2970 2025 51 1893 353 65 183 43 119 137 101 151 16 5124
Other
qualitative
measures
Other
accounting
measures
No condition TotalTSR Share price EPS ROE TPR Profit Revenue Cash flow NAVNo.
This table presents the number of plans falling into each respective category.
“No.” indicates the number of plans, “TSR” indicates the use of Total Shareholder Return, defined as the increase in share price in addition to dividend income, 'Share price'
indicates the use of share price alone, i.e. the increase in share price exclusive of dividend income. “EPS” indicates the use of earnings per share, “ROE” indicates the return on
common equity as a measure, and “NAV” indicates the use of net asset value. “TPR” stands for total property return, in the case of Real Estate firms. “Total” indicates the total
number of performance measures used across all plans so that one plan can have several performance measures.
Other qualitative measures include the use of non-financial/personal objectives in the executive compensation contracts (e.g. customer satisfaction, safety, health and strategy).
Other accounting measures include all other accounting measures which cannot be classified in other categories.

120
Table 5.2: Performance measures categories in long-term incentive arrangements
1 2 3 4 5 6
TSR only
TSR and
other
measure
EPS only
EPS and
other
measure
EPS & TSR
Neither
TSR nor
EPS
Total
including all
plans
Total of
columns 1, 3,
5 and 6 Panel A Performance share plans 508 379 289 98 792 111 2177 1700
Options 71 7 193 0 69 36 376 369
Matching plans 59 69 112 44 58 75 417 304
Total 638 455 594 142 919 222 2970 2373
Panel B Performance share plans 17.1% 12.8% 9.7% 3.3% 26.7% 3.7%
Options 2.4% 0.2% 6.5% 0.0% 2.3% 1.2%
Matching plans 2.0% 2.3% 3.8% 1.5% 2.0% 2.5%
Total 21.5% 15.3% 20.0% 4.8% 30.9% 7.5% 100.0%
Panel C Performance share plans 21.4% 12.2% 33.4% 4.7%
71.6%
Options 3.0% 8.1% 2.9% 1.5%
15.5%
Matching plans 2.5% 4.7% 2.4% 3.2%
12.8%
Total 26.9% 25.0% 38.7% 9.4%
100.0%
This table presents the number of plans falling into each respective category.
“TSR only” indicates the number of plans that exclusively select TSR as a performance measure. “TSR and others” indicate the number of plans that use TSR in combination
with other performance measures (e.g. net asset value, return on common equity, total property return and revenue). “EPS and TSR” indicates the number of plans that use TSR
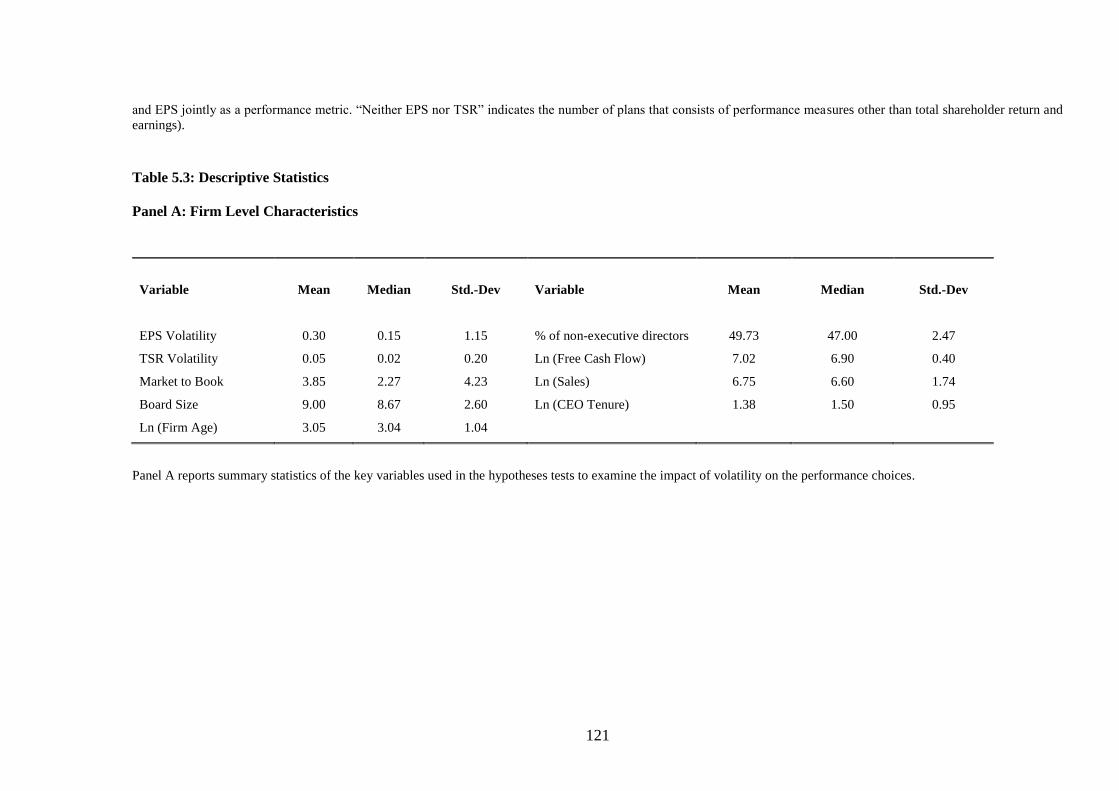
121
and EPS jointly as a performance metric. “Neither EPS nor TSR” indicates the number of plans that consists of performance measures other than total shareholder return and
earnings).
Table 5.3: Descriptive Statistics
Panel A: Firm Level Characteristics
Variable Mean Median
Std.-Dev Variable Mean Median
Std.-Dev
EPS Volatility 0.30 0.15
1.15 % of non-executive directors 49.73 47.00
2.47
TSR Volatility 0.05 0.02 0.20 Ln (Free Cash Flow) 7.02 6.90 0.40
Market to Book 3.85 2.27 4.23 Ln (Sales) 6.75 6.60 1.74
Board Size 9.00 8.67 2.60 Ln (CEO Tenure) 1.38 1.50 0.95
Ln (Firm Age) 3.05 3.04 1.04
Panel A reports summary statistics of the key variables used in the hypotheses tests to examine the impact of volatility on the performance choices.

122
Panel B: Correlation Matrix of Main Independent Variables
(1) (2) (3) (4) (5) (6) (7) (8) (9)
(1) EPS Volatility 1
(2) TSR Volatility -0.02 1
(3) Market to book -0.00 -0.02 1
(4) Ln (Board size) 0.01 -0.03* 0.01 1
(5) Non-executive directors % -0.04* -0.02 0.05** 0.22*** 1
(6) Ln (Sales £’000) -0.10*** -0.03 0.01 0.30*** 0.36*** 1
(7) Ln (Free cash flow) -0.05** -0.03 0.00 0.29*** 0.25*** 0.39*** 1
(8) Ln (CEO Tenure) -0.05** -0.00 -0.01 -0.09**** -0.11*** -0.16*** -0.06*** 1
(9) Ln (Firm Age) -0.11*** 0.02 -0.11*** -0.05*** -0.018 -0.00 0.00 0.13*** 1
Panel B reports the pairwise correlation of the main independent variables. ***, **, * denote significance at 1%, 5%, and 10%.
Panel C: Compensation Consultant Statistics
Name of Advisor No of Plans Percent
Deloitte 377 14.96%
High New Bridge Street 868 34.44%
Kepler 301 11.94%
Mercer 32 1.27%
Others 430 17.06%
PwC 249 9.88%
Towers 263 10.44%
Total 2520 100%
Panel C reports breakdown of compensation consultants

123
Table 5.4 details the multinomial logit regression results for the determinants of performance
choices. In multinomial logit, the dependent variable is limited, hence its interpretation differs
from that of an OLS regression coefficient. In order to test whether the volatility of a
performance measure impacts the choice of performance measure category employed by the
firm, in Model 1, we control for industry and the identity of the consultant, and in Model 2, we
additionally control for plan effects (i.e. options, performance share plans, and matching plans).
Therefore, in Table 5.5, we include marginal effects to clarify the magnitude effect of each
variable. Marginal effects represent the change in the dependent variable that is produced by a
unit change in the independent variable.
We observe from Table 5.2 that categorizing by the type of plan, in contrast to performance
share plans, options are rarely used in this sample. Instead, many firms use nil-cost options that
are categorized as performance share plans.
Table 5.4: Multinomial logit model estimating the probability of performance measures in
compensation contracts
Multinomial logistic regression of performance measures in compensation contracts against EPS
volatility, TSR volatility, board size, market to book, firm sales, % of non-executive dire, free cash flow,
CEO tenure and firm age. All results are relative to the base category of (EPS and TSR jointly). “TSR
vol” is the three-year volatility before plan adoption, “EPS vol” is the three-year volatility in EPS before
plan adoption. Robust standard errors are reported in parentheses. ***, **, * denote significance at 1%,
5%, and 10%, respectively. Industry dummies are included in both specifications. Detailed description
of variable definitions can be found in Appendix A to Chapter 5.
Model 1 Model 2 (with Plan Dummies)
Variable TSR EPS
Neither
TSR nor
EPS
TSR EPS
Neither
TSR nor
EPS
Column 1 Column 2 Column 3 Column 4 Column 5 Column 6
EPS vol 0.119*** -0.120** 0.051 0.116*** -0.115** 0.023
(0.021) (0.058) (0.033) (0.020) (0.056) (0.037)
TSR vol -3.673*** -2.193 -1.726 -3.935*** -2.218 -1.140
(1.304) (1.334) (1.642) (1.349) (1.356) (1.126)
Market to book 0.000 -0.001 -0.060** 0.002 0.000 -0.094***
(0.004) (0.004) (0.025) (0.004) (0.004) (0.032)
Ln (Board size) 1.341*** 0.874*** 0.154 1.417*** 0.869*** 0.294
(0.323) (0.307) (0.427) (0.330) (0.322) (0.433)

124
Non-executives% 0.024*** -0.021*** -0.012 0.025*** -0.019*** -0.007
(0.005) (0.005) (0.008) (0.005) (0.005) (0.008)
Ln (Sales) -0.362*** -0.035 -0.219*** -0.348*** -0.015 -0.181**
(0.059) (0.060) (0.084) (0.059) (0.062) (0.089)
Ln (Free Cash Flow) 0.550*** -0.687*** -0.107 0.638*** -0.604*** -0.238
(0.202) (0.218) (0.357) (0.210) (0.220) (0.345)
Ln (Tenure) 0.201*** 0.225*** 0.239* 0.194*** 0.228*** 0.131
(0.066) (0.076) (0.127) (0.069) (0.079) (0.132)
Ln (Firm Age) -0.324*** 0.135* -0.388*** -0.316*** 0.152** -0.381*** (0.0634) (0.074) (0.121) (0.064) (0.075) (0.133)
Industry
Basic Material 0.586** -1.657*** -0.994** 0.707*** -1.570*** -0.685*
(0.264) (0.471) (0.458) (0.270) (0.461) (0.411)
Consumer Goods -0.501** 0.592*** -16.03*** -0.428* 0.608*** -16.37***
(0.246) (0.199) (0.240) (0.251) (0.205) (0.276)
Financials 1.846*** 0.696** 1.959*** 1.782*** 0.700** 2.083***
(0.307) (0.346) (0.363) (0.314) (0.354) (0.389)
Healthcare 0.833** -1.068* -16.07*** 0.898** -1.007* -16.52***
(0.364) (0.592) (0.375) (0.362) (0.589) (0.383)
Industrials -0.921*** -1.495*** -2.198*** -0.853*** -1.455*** -2.041***
(0.185) (0.202) (0.370) (0.188) (0.204) (0.382)
Oil & gas 0.183 -0.830* -15.93*** 0.218 -0.793* -16.59***
(0.328) (0.470) (0.418) (0.319) (0.467) (0.461)
Technology -1.278*** 0.471* -0.255 -1.079*** 0.532** -0.307
(0.365) (0.260) (0.390) (0.370) (0.269) (0.409)
Utilities 0.906*** -2.116*** -1.733 0.969*** -1.956** -1.293 (0.315) (0.780) (1.078) (0.329) (0.797) (1.107)
Consultant dummies
HNBS 0.729*** -0.447** -1.092*** 0.781*** -0.403* -1.009***
(0.224) (0.202) (0.315) (0.228) (0.206) (0.330)
Kepler 0.837*** -0.080 -1.524*** 0.873*** -0.062 -1.446**
(0.256) (0.247) (0.577) (0.261) (0.251) (0.574)
Mercer 0.243 2.388*** 2.799*** 0.170 2.327*** 2.974***
(1.230) (0.806) (1.019) (1.380) (0.837) (1.075)
Other 0.905*** -0.622** 0.247 0.926*** -0.600** -0.323
(0.278) (0.278) (0.326) (0.283) (0.292) (0.358)
PwC 0.805*** -0.237 -0.702 0.814*** -0.212 -0.977**
(0.277) (0.269) (0.461) (0.284) (0.277) (0.488)
Towers -0.228 -1.132*** -0.994*** -0.153 -1.163*** -1.168***
(0.268) (0.253) (0.367) (0.271) (0.259) (0.448)
Constant -5.406*** 3.886** 3.141 -6.032*** 3.659** 5.752** (1.407) (1.546) (2.529) (1.512) (1.635) (2.541)
Plan types dummies Yes
Observations 1931 1931 Log-likelihood -1834 -1767 Pseudo R-squared 0.230 0.263

125
Table 5.5: Marginal effects of the impact of volatilities on performance choices
Marginal effects of the impact of volatilities and corporate governance variables on performance
choices in compensation contracts for Model 1. Marginal effects represent the effect of a unit change
in the variable on the probability of an outcome (EPS, TSR, EPS and TSR, Neither EPS nor TSR).
TSR EPS TSR & EPS Neither TSR nor EPS
Variable Column 1 Column 2 Column 3 Column 4
EPS vol 0.035*** -0.026*** -0.008 -0.000
(0.013) (0.009) (0.007) (0.008)
TSR vol -0.692** -0.091 0.783** -0.000
(0.341) (0.203) (0.329) (0.007)
Market to book 0.000 -0.000 0.000 -0.000
(0.005) (0.003) (0.007) (0.015)
Ln (Board size) 0.248*** 0.044 -0.291** -0.001
(0.067) (0.048) (0.145) (0.121)
Non-executives % 0.007*** -0.005** -0.002 -0.000
(0.001) (0.002) (0.002) (0.004)
Ln (Sales) -0.080*** 0.018** 0.061*** -0.000
(0.030) (0.008) (0.014) (0.021)
Ln (Free cash flow) 0.171*** -0.140** -0.029 -0.000
(0.049) (0.055) (0.048) (0.043)
Ln (Tenure) 0.030 0.020 -0.052*** 0.000
(0.024) (0.015) (0.014) (0.031)
Ln (Firm Age) -0.082* 0.042*** 0.0412 -0.000
(0.049) (0.011) (0.028) (0.075)
Industry dummies
Basic materials 0.248*** -0.196*** 0.006 -0.058***
(0.053) (0.029) (0.052) (0.021)
Consumer goods -0.115*** 0.203*** 0.005 -0.093***
(0.036) (0.040) (0.041) (0.016)
Financials 0.256*** -0.101*** -0.257*** 0.101***
(0.048) (0.034) (0.036) (0.036)
Healthcare 0.307*** -0.170*** -0.043 -0.093***
(0.0741) (0.042) (0.071) (0.016)
Industrials -0.081** -0.144*** 0.300*** -0.074***
(0.032) (0.026) (0.034) (0.016)
Oil & gas 0.134* -0.116** 0.074 -0.093***
(0.078) (0.049) (0.076) (0.016)
Technology -0.208*** 0.185*** 0.036 -0.014
(0.037) (0.054) (0.055) (0.026)
Utilities 0.345*** -0.218*** -0.047 -0.079***
(0.074) (0.029) (0.071) (0.021)
Consultant dummies
HNBS 0.184*** -0.126 -0.054 -0.004
(0.067) (0.139) (0.201) (0.386)
Kepler 0.183* -0.078 -0.099 -0.005
(0.096) (0.148) (0.236) (0.455)
Mercer -0.150** 0.495 -0.363*** 0.019
(0.073) (1.616) (0.093) (1.648)
Other 0.237 -0.160* -0.077 0.000
(0.160) (0.092) (0.061) (0.041)
PwC 0.187*** -0.101 -0.082 -0.003
(0.059) (0.126) (0.185) (0.324)
Towers 0.012 -0.167 0.158 -0.003
(0.072) (0.133) (0.105) (0.280)

126
5.5.2 Empirical Results
5.5.2.1 Multinomial Logistic Regression
Table 5.4 reports the results of the multinomial logit model with four performance choices. The
R2 of 0.23 is in line with the previous studies of Zakaria (2012) and Crespi et al. (2004).
In Model 1, Column 1 reveals that firms are significantly more likely to choose TSR only rather
than TSR and EPS jointly if they have higher EPS volatility. Additionally, firms are
significantly less likely to use TSR only rather than TSR and EPS jointly if they have higher
TSR volatility.
In Column 2, relating to the selection of EPS only, we find a negative and highly significant
coefficient for EPS volatility, indicating that firms are less likely to use EPS only, over the
alternative of EPS and TSR jointly, when firms have volatile EPS. Our findings are consistent
with Lambert and Larcker (1987) and Sloan (1993), who argue that firms prefer to choose
performance measures that are less volatile. This is also in line with the predictions of the
optimal contracting theory, suggesting that volatility has a significant role in the choice of
performance measure. However, we do not find evidence of an association between the
probability of choosing neither TSR nor EPS and the volatilities of EPS and TSR.
Column 1 shows that the coefficient of sales is negatively associated with the selection of TSR
only and neither EPS nor TSR category relative to reference category so that firms with higher
sales are significantly less likely to use TSR alone. It could be argued that as large firms tend
to be pioneers of innovative designs (Kole, 1997), and are more likely to include several
different performance measures in their remuneration contracts.
De Angelis and Grinstein (2015) compare the likelihood of using either market-based or
accounting-based measure for US firms, in contrast to our methodology of comparing to a

127
reference group of EPS and TSR together. While they find that firms with longer CEO tenure
are more likely to use accounting based measures, we find that firms with longer CEO tenure
are more likely move away from using EPS and TSR jointly, to using TSR alone or EPS alone.
We speculate that this may be because CEOs dislike dual targets and that longer tenure gives
them more influence in the pay-setting process. One possible explanation of this result could
be that their study considers a different dataset from a separate demography.
Our findings also show that firms rely more on accounting-based measures, and less on TSR
alone, as firm age increases. These are in line with De Angelis and Grinstein (2015), who
likewise find that young firms tend to use market-based measures rather than accounting
measures in performance contracts. They argue that this is in line with optimal contracting
theory since market value is a better indicator of long-term outcomes than current-year
accounting measures.
The coefficients of market to book ratio are insignificant in Column 1 and Column 2, indicating
that firms with higher growth opportunities have no clear preference for choosing EPS only or
TSR only.
Firms with a higher percentage of non-executive directors on the board are less likely to favour
EPS only but are more likely to favour TSR only relative to the base category. These results
suggest that firms with a higher proportion of non-executive directors on the board are
motivated to employ TSR, either alone, or in conjunction with EPS, as it is in the greater interest
of shareholders.
Concerning consultant-specific effects, the reference group used in the present study for the
identity of the remuneration advisor is “Deloitte”. Based on the results in Column 1, firms that
use HNBS, Kepler, PwC and the “Others” category as their remuneration consultants are more
likely to employ TSR only as a performance measure, relative to Deloitte. This is in line with

128
Kuang et al. (2014), who find that Deloitte is less likely to use TSR only than New Bridge Street
or Towers Perrin.
However, firms that hire HNBS, Towers and consultants in the “Others” category are less likely
to favour EPS over EPS and TSR jointly, relative to Deloitte. Finally, we detect a significantly
positive association between the choice of Mercer and the choice of neither TSR nor EPS
relative the base category. These findings strongly suggest that compensation consultants play
an influential role in the design of remuneration contracts, and indicates the operation of
normative isomorphism, as consultants who provide services to multiple firms use similar
performance metrics.
Turning now to industry-specific factors, the reference category used is the “consumer services”
group. Basic Materials and Utilities are significantly more likely to choose TSR only, and less
likely to choose EPS only, than EPS and TSR jointly. Consumer Goods and Technology firms
are significantly more likely to choose EPS only over EPS and TSR jointly. Financials are
significantly more likely to choose TSR only, and EPS only, and neither EPS nor TSR than
(EPS and TSR jointly), whereas the reverse is true for Industrials. Finally, Oil & Gas are
significantly less likely to choose EPS only over EPS and TSR jointly.
Since these industry dummies are significant after controlling for all the other independent
variables, this provides strong evidence for norms operating inside distinct industries, so that
normative isomorphism is one of the key influences on the choice of the performance measure.
Broadly speaking, these results do not vary when controlling for plan type as shown in Columns
4, 5 and 6.
129
5.5.2.2 Marginal Effects
Addition to multinomial logit coefficient and the levels of significance, we have also shown the
marginal effects, evaluated at the mean, of a change in the independent variable in Table 5. The
marginal effects display the relative importance of each explanatory variable in predicting the
probability of each event occurrence. For a dummy variable, marginal effects show by how
much the probability of performance choices will change with a change in a dummy variable;
while for a continuous variable, they show how much the probability will change with a one-
unit change in the value of the independent variable.
In Table 5.5, Column 1 reveals that the estimated marginal effect of EPS volatility on TSR only
is 0.035. This implies that an increase of 1 unit in 3-year earnings per share volatility raises the
probability of choosing TSR only by 3.5 percentage points. The results in Column 2 show that
a 1-unit increase in 3-year EPS volatility results in 2.6 percentage points decreases in the
probability of choosing EPS only as performance criteria; this result is statistically significant
at the 1% level. The pattern of results observed in Model 1 and Model 2 is in line with the
optimal contracting hypothesis, since under optimal contracting theory, the more volatile the
performance measure, the less likely it is to be chosen as a performance measure. Hence,
volatility in EPS impacts the choice of performance measure as seen in both models. These
results are in line with Banker and Datar (1989). Nevertheless, from Column 3, EPS volatility
is not associated with the probability of choosing EPS and TSR jointly.
In Table 5.5, Column 3, the coefficient on TSR volatility for choosing EPS and TSR jointly is
positive and statistically significant at the 1% level, so that a unit increase in 3-year TSR
volatility is associated with a 78.3 percent increase in the probability of EPS and TSR jointly
being selected. This shows that TSR volatility is an important factor in the selection of EPS in
conjunction with TSR in compensation contracts. However, 3-year TSR volatility is not

130
significant in influencing the choice of EPS alone. This suggests that TSR alone is not viewed
as a reasonable way to control for noise, consistent with Holmstrom (1982) and that high TSR
volatility is countered by using EPS and TSR jointly as a guard against volatility in any one
measure. The inclusion of an accounting measure in firms with higher values of TSR volatility,
therefore, helps to filter some out noise in TSR.
The results in Table 5.5, Column 1 indicate that when remuneration advisors HNBS, Kepler
and PwC consultant category provide advice to firms, the probability of selecting TSR only as
a performance measure is 18%, 18% and 19% points higher respectively than Deloitte.
However, relative to Deloitte, none of the other consultants shows a preference for EPS-
contingent plans as shown in Column 2. A likely interpretation is that since Deloitte is an
accounting firm, they tend to frequently recommend plans with accounting performance
conditions.
By contrast, in Column 3, which relates to the choice of EPS and TSR jointly, only Mercer has
a significant coefficient, so that the choice of Mercer is associated with a 36 percentage point
reduction in the probability of selecting EPS and TSR jointly. Finally, in Column 4, relating to
the choice of neither EPS nor TSR, none of the coefficients are significant. This is interesting
since it shows that the institutional isomorphism identified above, pertains only to the issue of
selecting TSR only. It appears that some advisors hold much more positive views on TSR only,
but that they do not hold such strongly divergent on the other performance measures.
The probability of firms operating TSR-based plans in basic materials, financials, healthcare,
oil and gas, and utility industries is 0.25, 0.26, 0.31, 0.13 and 0.34 higher respectively than
firms in the consumer services group (reference category). However, the probability of
employing EPS-contingent plans is 18% and 20% in technology and consumer goods industries

131
respectively. Technology firms prefer EPS based performance metrics and one possible
interpretation is that executives are incentivized through methods which generate net income.
In case of Dummy variables in column 2 indicate that industries other than technology and
consumer goods have a reduced probability of employing EPS exclusively than consumer
services industry. More interestingly, no industry except industrials employs EPS and TSR
jointly significantly more than the reference category. Furthermore, there exists a negative and
statistically significant association between all industries except financial and the selection of
neither EPS nor TSR. Further, untabulated results reveal that within the real estate and insurance
sectors of the financial industry, the use of NAV and ROE measures is more prevalent.
According to column 1, a one-unit increase in log sales results in an 8 percentage points
decrease in the probability of TSR being selected. While these results are not consistent with
Zakaria (2012), who finds that large firms more often use TSR as a performance measure than
EPS, her study was based on a much older sample, from 2003/2004. Also, sales has a strong
marginal effect with an increase in the probability of EPS and TSR jointly by 6.1 percentage
points for a one-unit increase in log sales. However, the marginal effect for non-executive
directors (column 1, TSR only) and (column 2, EPS alone) is 0.007 and 0.005 percent
respectively, showing that a greater presence of non-executive directors influences the choice
of performance measure.
There is an interesting contrast in the effects of volatility in performance measures: whereas in
columns 1 & 2, they are strongly significant in influencing the likelihood of EPS alone or TSR
only being selected, in column 4, they play no role in the likelihood of neither EPS nor TSR
being selected. Likewise, corporate governance factors and remuneration consultants do not
significantly influence the probability of choosing neither EPS nor TSR category. This clearly
highlights the significant impact of volatility on the choice of EPS and TSR being selected by

132
a firm. Nonetheless, the results also show that for firms within the financial industry, there is a
0.10 probability of choosing the neither EPS nor TSR category. This could be because of strong
dependence on measures other than total shareholder returns or earnings within these industries.
Summarising the results from the marginal effects, our results suggest that out of all four
categories, the use of TSR only in incentive contracts is industry-specific, and some consultants
prefer using one performance measure relative to another. Industry forces drive the choice of
accounting and financial performance measures, providing evidence of normative isomorphism
in the design of pay packages. Firms with highly volatile TSR prefer to choose EPS and TSR
jointly as a performance measure. One possible explanation is even if TSR is volatile, firms
still use TSR along with an accounting measure to filter out noise in the market-based measure.
The use of EPS and TSR jointly is influenced by firm size and in general is not specific to
consultant and industry; only one consultant (Mercer) and financial industry show a strong
negative association with selection of EPS and TSR jointly.
5.5.2.3 Robustness
In this section, we subject the previous results to a variety of robustness tests, all of them are
available in the Appendix to Chapter 5. We use different measures of volatility: we use basic
EPS and basic TSR volatilities instead of using cumulative EPS and cumulative TSR volatility,
as many of these plans use basic EPS as a performance measure. The negative relationship
between the choice of EPS as a performance measure and EPS volatility still holds. As shown
in Table A.5.1 in the Appendix to Chapter 5, we also introduce industry-adjusted EPS and TSR
volatility as a benchmark for the volatility measure. Interestingly, once these industry-adjusted
measures are added, the main results remain qualitatively similar and show that firms with high
values of TSR volatility are more likely to choose TSR over EPS and TSR jointly. The second

133
robustness test includes the use of time fixed effects. The main results again do not change
qualitatively. Table A.5.4 in the Appendix to Chapter 5 presents the results when we use total
assets to replace sales and find similar results on this alternative proxy. Finally, in Table A.5.5
in the Appendix to Chapter 5, we also include EPS along with net income measure and find
consistent results that firms with higher volatile earnings are less likely to prefer earnings
measures.
5.6 Design of Compensation Contracts
Next, we turn our attention to the design of compensation contracts. Every performance
measure has hurdles with lower and upper threshold targets: for minimum vesting, firm
performance needs to trigger the lower threshold target, and for full vesting, firms must meet
the upper threshold target, as specified in the executive compensation contract. Vesting refers
to the restriction on ownership of shares being lifted, meaning that executives can now transfer
or sell the shares they are entitled to. For example, in a standard three-year long-term incentive
plan, if the performance-contingent shares are offered in 2010, then executives can vest their
shares in 2013 based on the subsequent achievement of performance targets. The amount of
shares vesting depends upon where firm performance lies between the lower and upper
threshold ranges. The value of these awards is usually determined by the share price on the day
the share vests. Usually, from the date of the grant, executives have ten years before options or
restricted stock shares lapse.
TSR is usually measured relative to a sector, or an index or a bespoke (i.e. hand-picked) group
which the firm chooses. Frequently, the minimum reward is triggered if the firm’s growth in
TSR ranks in excess of the median (50th percentile) group of companies in their comparator
group, and for full vesting of equity, a firm’s TSR growth should usually rank in the upper

134
quartile (75th percentile) relative to the comparator group over the three-year performance
period. Vesting between these two limits is usually on a straight-line basis.
ABI (1999) recommended that EPS growth targets should be measured in absolute terms in
executive compensation contracts. Generally, firms use either EPS absolute growth or EPS
growth in excess of the Retail Price Index (RPI). EPS is most commonly expressed as a
compound annual growth rate (CAGR) over a three-year performance period. As an example
of EPS thresholds, a typical minimum performance hurdle is 3% p.a. (i.e. 9% over the
performance period). The firm needs to have a minimum threshold of an average growth rate
of 3% p.a. in order for the CEO to vest 25% of the equity. In order to get a maximum payout
(100%) of the equity, firms typically have to exhibit an average growth rate of 6% p.a. (i.e. 18%
over the performance period). Some firms use EPS growth benchmarks against RPI or CPI.
Different firms in the same sector may select different vesting criteria. As an example, in 2012
Atkins, a multinational firm in the support services industry, used only EPS as a performance
measure in their LTIPs. In order to trigger the basic reward, Atkins should meet a minimum
performance hurdle of 5% annual growth rate in EPS resulting in 25% of the equity vesting. By
contrast, in 2012, Michael Page, another multinational firm in the support services industry,
minimum performance hurdle was set at EPS growth of 5% per annum leading to 50% of the
equity vesting.
5.6.1 Market-Based Measures
5.6.1.1 Peer Group Choices for TSR Only Contracts
Once firms decide to use market-based measures in their compensation contracts, the next key
step is to select the peer group against which to compare their own performance. The

135
Government’s Directors’ Remuneration Report (2002) requires companies to disclose the peer
firms used in determining executive compensation.
Table 5.6: Market-based performance targets and relative benchmarks
The above table indicates the respective number of plans that use market-based measures in remuneration
contracts. “Bespoke” indicates when group members are hand-picked by the firm. “Sector” and “index” indicate
the use of a specific sector or index, respectively, as a comparator group (e.g. the FTSE 250 Support Services
Index). “Bespoke sector” indicates the use of a peer group of companies from a specific sector (e.g. oil companies).
“Bespoke sector” indicates the use of a peer group of companies from a specific sector (e.g. oil companies).
“Bespoke index” refers to the use of specific companies from an index (e.g. choosing the 51st to 150th firms in the
FTSE 350 as ranked by market capitalization). “Bespoke sector and index” is the use of self-selected firms from
both a sector and an Index (e.g. the FTSE All Share Media companies excluding FTSE 100 participants). “Sector”
indicates the use of specific sectors as a comparator group (e.g. Media/Mining). “TSR absolute” refers to the
absolute growth in total shareholder returns. “Target share price” refers to the achievement of a specific target
share price. “TSR underpin” refers to when it is used as a precondition with another performance measure.
Table 5.6 shows a breakdown of benchmarks relating to TSR as a performance measure. The
results indicate that 34% and 32% of the plans use bespoke (disclosed and undisclosed) and
index TSR, respectively, to proportion the vesting of equity compensation. It is easier for firms
to choose indices, as this requires less effort than the self-selection of peer groups. However,
choosing the right peer group is crucial, otherwise, it will introduce volatility to the payout,
eventually demotivating executives.40
40 This is discussed in more details by Kapinos et al. (2014) in the industry paper titled, Relative Total Shareholder
Return (TSR) Plan Design Across the Atlantic, Aon
Market-based Measure PSPs Share options Matching plans
Relative to TSR
Bespoke (Disclosed) 614 25 56
Bespoke (Not Disclosed) 13 0 0
Bespoke index 142 5 17
Bespoke sector 25 0 13
Bespoke sector and index 36 6 0
Index 566 54 49
Sector 83 1 8
Sector and index 168 6 25
TSR (Underpin) 11 4 0
Absolute TSR Target share price 38 8 5
TSR absolute growth 63 13 22
Total 1759 122 195

136
On the other hand, only 4.7% of firms use TSR absolute growth as a performance measure
within their equity plans. The results also show that it is more common that TSR is subject to
comparison with a peer group than a specific rate of increase (i.e. absolute TSR growth) in all
types of long-term incentive arrangements. One possible explanation is that absolute TSR does
not take into account the general movements in the market and is not a true reflection of
executives’ effort (Barty and Jones, 2012). Infrequently, some firms also use a specific share
price figure in their long-term incentive plans. Only 10% of plans use both sector and index
together as a relative benchmark. Firms in the general retail, travel and leisure, media and real
estate investment sectors more commonly use sectors as a TSR peer group.
Next, we analyse the comparator groups within the components of long-term incentive plans,
where we find that many firms use bespoke peer groups in their plans. We further break down
the different market indices to study the various peer group used in long-term incentive plans.
Table 5.7: Comparator Groups (Index) in Relative to TSR Plans
Index PSPs Share options Matching plans
Small Cap 115 8 17
FTSE 100 102 3 4
FTSE 250 277 18 20
FTSE 350 32 12 5
FTSE All Share 22 7 0
Others (HSBC /Morgan Stanley) 18 6 3
Total 566 54 49
Table 5.7 summarizes the comparators used by companies to benchmark their own TSR performance. “FTSE 250”
refers to the firms in the FTSE 250 UK Index; similarly, “FTSE 100”, “FTSE 350” and “FTSE Small Cap” refer
to the firms in the FTSE 100, FTSE 350 Index and FTSE Small Capitalization Index, respectively. “Others” refers
to firms that use alternative categories of the index (e.g. HSBC/Morgan Stanley Index). Firms may have more than
one plan, each of which may reference a different comparator group.
https://www.radford.com/home/insights/articles/2014/relativ.e_tsr_plan_design_across_the_atlantic.asp
[accessed on July 21, 2016].

137
Table 5.7 shows that 47% of the plans in the sample use the FTSE 250 peer group. Only 16%
of plans choose TSR relative to the FTSE 100 Index, and interestingly, 21% of the plans are
identified as using FTSE Small Cap peer group, so that the FTSE 250 peer group is the most
widely used comparator group choice in compensation contracts.
5.6.1.2 Vesting Levels in TSR Based Contracts
After making the choice of performance measure and peer group, firms choose payouts at
different levels of performance. While it is common for US companies to have a maximum
payout between 100% and 200% of base salary, the payout policy for UK firms rarely exceeds
100% of base salary.41 According to ABI guidelines, vesting conditions in performance
measures should be fully transparent, explained and linked to the achievement of shareholders’
value (ABI, 2013).
Table 5.8
Panel A: The distribution of vesting levels at median threshold and upper quartile targets in LTIP
schemes.
Median threshold
vesting level PSPs
Share
options
Matching
plans
Upper quartile
vesting level PSPs
Share
options
Matching
plans
0.00%-10.00% 44 4 16 50.01%-60.00% 0 0 0
10.01%-20.00% 217 3 46 60.01%-70.00% 32 0 4
20.01%-30.00% 1303 72 117 71.01%-80.00% 161 6 28
30.01%-40.00% 93 26 8 81.01%-90.00% 204 17 32
40.01%-50.00% 57 10 8 91.01%-100.00% 1329 95 131
Not Disclosed 25 0 0 Not Disclosed 16 0 0
Complex 6 3 0 Complex 6 0 0
Single threshold 3 0 0 Single threshold 0 0 0
Underpin 11 4 0 Underpin 11 4 0
Total 1759 122 195 Total 1759 122 195
0% vesting 37 4 16 25% vesting 951 45 78 100% vesting 1162 84 118
Minimum vesting of awards ranges from 0% to 50% after meeting lower threshold targets. Vesting at upper
quartile ranges from 60% to 100%. “Single Threshold” refers to firms using only a single threshold hurdle in their

138
plans. “0% Vesting” refers to contracts which assign a zero percent vesting of equity for the achieving median
TSR performance. “Upper quartile vesting levels” presents the percentage of equity which vests when TSR
performance is at least equal to the upper quartile of the comparator group’s TSR. Most plans set 100% equity
vesting if firms’ performance is at least equal to the upper quartile of the comparator group. The remaining plans,
where less than 100% of the equity vests at this level, are here classified as “Outperformance TSR plans” and are
detailed in Panel B below. “Underpin” refers to the situation in which TSR is used as an initial indicator in
conjunction with another performance measure.
Panel A of Table 5.8 documents the vesting level of equity at the median and upper quartile
threshold performance with respect to the comparator group’s TSR. As discussed earlier,
performance at least equal to the median of the peer group is frequently used by firm as a
minimum performance threshold.
Table 5.8.
Panel B: Outperformance TSR plans
Maximum Vesting Levels PSPs Options Matching plans
Upper Quintile 177 13 17
Upper Decile 79 4 9
Outperformance Over the Index 244 21 26
Outperformance Over the Median 97 0 25
Table 5.8, Panel B reports the breakdown of plans where TSR performance criteria for maximum vesting is above
the upper quartile of comparator groups’ TSR.
As shown in Panel A in the above table, there is a wide variation in the percentage of equity
which vests if the firm’s relative TSR places it in at least the 50th percentile rank over a three-
year performance period. In 2.7% of our plans, 0% of the award vests at this level. 3% of plans
set between 0% to 10% to vest at this level, and 72% of plans set between 20% and 30% of
equity to vest at this level. Of these, 52% of plans set exactly 25% of equity to vest, making it
the most popular vesting level used by these firms. By contrast, in 4% of our plans, exactly 50%
of the award vests at this level. This implies that two firms could set different minimum vesting
percentages of equity at median performance relative to the comparator group, so that the firm
with the lower percentage of equity vesting at the minimum vesting threshold has the tougher
performance conditions, provided they use the same peer group.

139
The upper quartile vesting levels reveal that 66% of the plans’ awards permit maximum payout
(full vesting) if the TSR of the company exceeds the performance of 75% of the comparator
group (upper quartile) over a three-year performance period, while only 9% of plans allow
between 70% and 80% of equity to vest after meeting upper quartile performance. This clearly
suggests the presence of either normative or mimetic isomorphism, since a high proportion of
firms choose to adopt identical practices in this regard.
There exists diversity within the LTIP plans awarded by firms: the presence of similar
performance measures but with different comparator groups introduces a considerable variation
in the median and upper quartile threshold vesting in practice, adding further complexity to the
design of compensation contracts, even though vesting levels do not vary widely if we break
down these long-term incentive plans.
The term “underpin” functions as a threshold or hurdle. In cases where firms have two or more
performance measures, one of them may be designated as an “underpin” so that the underpin
performance target must be achieved before any of the awards will vest. As an example of this,
consider Dechra Pharma that granted a performance shares plan in 2010 with a primary EPS
target, and a TSR “underpin” performance target. The underpin TSR performance target
required TSR performance to be at least equivalent to the median group of companies, and once
this was met, the EPS performance measure with lower and upper threshold targets came into
operation. In the case that the TSR underpin target was not met, no equity would vest, even if
the EPS upper threshold target was attained.
As described here earlier, many plans employ a standard set of TSR growth thresholds: the
initial vesting threshold is set to the median of the comparator group, and the upper vesting
threshold is set to the upper quartile of the comparator group. Away from these standard
settings, Panel B of Table 5 shows the alternative upper thresholds. For example, Wincanton in

140
2010 selected an upper threshold of TSR to be greater than or equal to 20% per annum in excess
of the FTSE 250 Index for maximum payout and so is included in the “Outperformance over
the Index” category. In some plans, the maximum threshold is above the upper quartile of the
comparator group, usually, the upper quintile or decile, while for others, some firms choose
plans in which growth in TSR should be equal to the median plus an additional margin, in order
to trigger maximum payout. Panel B of Table 5.8 reveals that that out of 1759 performance
share plans, 244 use outperformance relative to an index in order for the maximum payout to
vest. In contrast, 177 plans require firms’ TSR growth relative to the group of companies to be
in the upper quintile for the maximum vesting. In contrast to Zakaria (2012) and Pass et al.
(2000), there has been a shift in the landscape of remuneration contracts, as firms increasingly
opt for TSR performance criteria that set performance beyond the upper quartile for maximum
vesting.

141
5.6.2 Accounting-Based Measures
5.6.2.1 Breakdown of Types of EPS
Table 5.9: Type of EPS plans (performance share plans/options/matching plans)
Adjusted
EPS
Diluted
EPS
Underlying
EPS Basic EPS
Cumulative
EPS
Normalized
EPS
Aggregate
EPS
Relative
RPS Underpin Total
Real EPS
Growth
116/34/12 49/4/6 26/4/0 486/108/118 8/0/1 20/6/5 0/3/0 0/0/0 32/4/6 737/163/148
Absolute EPS
Growth
83/5/15 22/2/5 15/0/8 169/38/32 17/0/0 11/0/0 2/0/0 11/0/0 0/0/0 330/45/60
Target EPS
figure
59/0/7 3/2/0 17/0/0 228/32/10 24/6/9 0/0/0 17/0/0 0/0/0 0/0/0 348/40/26
Table 5.9 shows the different forms of EPS used by firms in their plans.

142
In a similar manner to the TSR targets analysed previously, EPS targets also have initial and maximum
vesting thresholds which function in a similar way. The principal difference arises in that EPS target is
usually absolute, and do not refer to a comparator group, as with TSR targets. These descriptive statistics
indicate that firms incorporate diverse performance targets, and as before, lower or upper threshold targets
often have different vesting levels of equity.
We note from Table 5.9 that within long-term incentive arrangements, there are different definitions of EPS
owing to different calculation methods, though most firms prefer using basic earnings per share, 68% of
plans choose a performance target based on basic EPS growth in excess of RPI, while 55% use EPS absolute
growth over a three-year performance period. After basic EPS, the next most popular performance measure
is adjusted earnings per share, with 17% of the plans employing this, and about 6% of plans use diluted
EPS as performance criteria. Diluted earnings per share denote the conversion of dilutive securities into
common stock, resulting in an adjustment of the number of shares outstanding as well as earnings. Lastly,
4% of plans employ underlying EPS-contingent compensation arrangements. Unlike TSR, EPS is measured
in absolute terms rather than relative to the companies. Relative EPS is less common as firms find it difficult
to find a peer group for which the profit growth is similar to that of the company.
5.6.2.2 EPS targets and Vesting levels
Next, Table 5.10 reveals that while the minimum threshold range is relatively compressed, the upper
threshold range is more dispersed, whether real or absolute terms are used.
Turning first to minimum thresholds, Panel A of Table 5.10 reports minimum thresholds for EPS where
these are stated in real terms, as an RPI + x% figure. 82% of plans lie in the range of RPI + 2% p.a. to RPI
+ 6% p.a., and a small number of plans do not disclose vesting levels within their compensation contracts.

143
Table 5.10. Panel A: Distribution of EPS growth in excess of RPI required for minimum and maximum threshold (in per annum equivalent)
Minimum threshold targets (RPI + x %) PSPs Options Matching
plans Maximum threshold targets (RPI + x %) PSP Options
Matching
plans
0.01% to 0.99% 8 0 0 1.00% to 1.99% 1 6 0
1.00% to 1.99% 14 0 0 2.00% to 2.99% 3 7 15
2.00% to 2.99% 222 64 62 3.00% to 3.99% 1 1 0
3.00% to 3.99% 196 7 47 4.00% to 4.99% 24 11 20
4.00% to 4.99% 132 38 11 5.00% to 5.99% 27 10 22
5.00% to 5.99% 71 8 3 6.00% to 6.99% 39 20 10
6.00% to 6.99% 24 2 4 7.00% to 7.99% 86 29 13
7.00% to 7.99% 6 7 0 8.00% to 8.99% 46 11 0
8.00% to 8.99% 6 4 0 9.00% to 9.99% 156 27 24
9.00% to 9.99% 13 3 0 10.00% to 10.99% 45 4 7
10.00% to 10.99% 0 0 0 11.00% to 11.99% 124 4 6
11.00% to 11.99% 4 0 0 12.00% to 12.99% 27 0 14
12.00% to 12.99% 1 4 0 13.00% to 13.99% 8 21 1
13.00% and above 3 0 0 14.00% to 14.99% 64 6 7
Not disclosed 4 0 0 15.00% to 15.99% 20 2 3
No lower threshold 1 22 15 16.00% and above 31 0 0
Relative to the Index 0 0 0 Not disclosed 3 0 0
Underpin 32 4 6 Underpin 32 4 6
Minimum vesting levels Maximum vesting levels
1.00% to 9.99% 41 2 25 90.00% to 99.99% 737 159 148
10.00% to 19.99% 71 2 9 Not disclosed 0 0 0
20.00% to 29.99% 491 97 58 Complex 0 0 0
30.00% to 39.99% 56 20 18 Single threshold 0 0 0
40.00% to 49.99% 29 16 17 Underpin 32 0 6
Not Disclosed 14 0 0 Total 737 163 148
Complex 0 0 0 Single Threshold 3 22 15 0% Vesting 26 2 12
Underpin 32 0 6 25% Vesting 376 77 14
Total 737 163 148

144
Table 5.10. Panel B: Distribution of EPS absolute growth required for minimum and maximum threshold (in per annum equivalent)
Minimum absolute threshold targets PSPs Options Matching Maximum absolute threshold targets PSP Option Matching
0.01% to 0.99% 1 0 0 4.00% to 4.99% 0 3 3
1.00% to 1.99% 0 0 0 5.00% to 5.99% 8 0 0
2.00% to 2.99% 18 8 8 6.00% to 6.99% 2 5 1
3.00% to 3.99% 21 12 17 7.00% to 7.99% 8 13 0
4.00% to 4.99% 86 6 5 8.00% to 8.99% 15 7 10
5.00% to 5.99% 78 10 11 9.00% to 9.99% 38 6 9
6.00% to 6.99% 26 0 8 10.00% to 10.99% 12 1 5
7.00% to 7.99% 19 4 7 11.00% to 11.99% 55 1 3
8.00% to 8.99% 9 0 0 12.00% to 12.99% 22 1 2
9.00% to 9.99% 28 4 4 13.00% to 13.99% 20 1 14
10.00% to 10.99% 4 0 0 14.00% to 14.99% 63 7 9
11.00% to 11.99% 3 0 0 15.00% to 15.99% 5 0 0
12.00% to 12.99% 1 0 0 16.00% to 16.99% 15 0 4
13.00% to 13.99% 0 0 0 17.00% to 17.99% 0 0 0
14.00% to 14.99% 8 0 0 18.00% to 18.99% 0 0 0
15.00% to 15.99% 7 0 0 19.00% to 19.99% 20 0 0
Not disclosed 8 0 0 20.00% and above 28 0 0
Single threshold 2 1 0 Not disclosed 8 0 0
Relative to the Index 11 0 0 Relative to Index 11 0 0
Minimum vesting levels Maximum vesting levels 1.00% to 9.99% 34 3 6 90.00% to 99.99% 314 45 60
10.00% to 19.99% 50 6 3 Not disclosed 10 0 0
20.00% to 29.99% 191 12 33 Complex 6 0 0
30.00% to 39.99% 26 20 6 Single Threshold 0 0 0
40.00% to 49.99% 5 3 12 Underpin 0 0 0
Not disclosed 14 0 0 Total 330 45 60
Complex 8 0 0 Single Threshold 2 1 0 0% Vesting 29 3 2
Underpin 0 0 0 25% Vesting 144 12 27
Total 330 45 60

145
Panel A and B of Table 5.10 present the distribution of EPS growth corresponding to the
minimum and maximum threshold target range.
Panel B of Table 5.10 documents the distribution of EPS absolute growth targets, as opposed
to the real-terms growth targets presented in Panel A. 79% of the plans, have a minimum
threshold hurdle range between 2% p.a. to 8% p.a.
Turning next to upper thresholds, Panel A of Table 5.10 reveals that 69% of the plans in our
sample have an upper threshold target range of RPI + 7% p.a. to RPI + 15% p.a. with a particular
concentration in the range of RPI + 9% p.a. to 9.99% p.a. These results are in line with Ward
(2000), who finds that EPS growth plus RPI of 2% is most commonly used in incentive plans
from 1994 to 1998, and also with Zakaria (2012), who finds that 68.1% of plans have a
minimum vesting threshold in the range of RPI + 2% p.a. to RPI + 6% p.a. Zakaria (2012) does
not disclose specific range data for upper thresholds. With regards to absolute targets in Panel
B, 79% of plans have upper growth targets between 7% and 16.99%. The descriptive statistics
of Zakaria (2012) show that during 2002/2003, less than half of plans with EPS based
compensation contracts employed upper thresholds hurdles, showing that the use of upper
threshold targets have increased over time, and overall targets are more demanding.
Table 5.10 additionally presents information on the level of equity which vests at the minimum
EPS target. In Panel A, discussing real EPS targets, 62% of the plans have a vesting range of
between 20.00% and 29.99%. Similar to the comparable results for TSR, minimum equity
vesting has a particular peak at 25%, which is used by 44% of plans. In Panel B, concerning
absolute EPS targets, 54% of plans have a vesting of between 20.00% and 29.99%, and there is
a peak at 25%, used by 42% of plans. Overall, these results suggest that normative or mimetic
isomorphism is not limited to the choice of performance measure but is also present in the
setting of growth targets and equity vesting ranges.

146
5.7 Performance Target Achievements
Prior studies suggest that firms exhibit a bias in the selection of their TSR comparator group,
choosing them in such a way as to make outperformance more likely and lead to greater vesting
of equity. Consistent with the analysis in Lewellen et al. (1996) study, we examine the three-
year return in firms which select different indices, in order to shed light on whether the different
selection of relative TSR benchmarks helps executives achieve their minimum and maximum
performance hurdles, and whether the selection of the FTSE 100, FTSE 250 or FTSE Small
Cap indices was most beneficial for executives. It is easier to perform TSR calculation for firms
which select a pre-defined market index, since firms which select bespoke comparator groups
frequently have a global set of peers, making it difficult to calculate their TSRs individually. In
the following analysis, we, therefore, exclude such companies from our sample and include
only firms which choose a named index in their relative TSR plans.
Table 5.11: This table presents the breakdown of the number of plans achieving median or upper
quartile performance thresholds of relative TSR benchmarks against the FTSE 100, FTSE 250,
FTSE 350, and FTSE Small Cap, by year
Year Avg (Median)
TSR Firm
Avg (Median) TSR
Index
No. of
plans
Targets
not
achieved
Median
threshold
targets
achieved
Upper
threshold
targets
achieved
2007 0.56(0.61) 0.10(0.04) 14 6 2 6
2008 0.52(0.51) 0.45(0.30) 23 11 2 10
FTSE 100
2009 0.51(0.49) 1.13(0.73) 14 8 2 4
2010 0.65(0.79) 0.75(0.52) 15 4 2 9
2011 0.52(0.54) 0.80(0.58) 21 9 6 6
2012 0.38(0.35) 0.91(0.82) 18 12 5 1
Total
105 50 19 36

147
Year Avg (Median)
TSR Firm
Avg (Median) TSR
Index
No. of
plans
Targets
not
achieved
Median
threshold
targets
achieved
Upper
threshold
targets
achieved
2007 0.59(0.64) 0.01(0.12) 23 8 5 10
2008 0.55(0.71) 0.44(0.36) 27 14 3 10
FTSE 250 2009 0.58(0.59) 1.20(0.83) 36 16 7 13
2010 0.51(0.57) 0.66(0.55) 37 15 11 11
2011 0.57(0.65) 0.73(0.63) 40 15 10 15
2012 0.42(0.32) 0.88(0.77) 37 24 4 9
Total
200 92 40 68
Year Avg (Median)
TSR Firm
Avg (Median TSR
Index
No. of
plans
Targets
not
achieved
Median
threshold
targets
achieved
Upper
quartile
threshold
targets
achieved
2007 0.36(0.48) 0.00(0.06) 4 2 2 0
2008 0.35(0.49) 0.42(.32) 6 3 2 1
FTSE 350 2009 0.35(0.25) 1.18(0.81) 6 4 1 1
2010 0.55(0.87) 0.68(0.52) 6 2 0 4
2011 0.17(0.19) 0.74(0.60) 3 2 0 1
2012 0.17(0.23) 0.88(0.77) 3 2 1 0
Total
28 15 6 7
Year Avg (Median)
TSR Firm
Avg (Median TSR
Index
No. of
plans
Targets
not
achieved
Median
threshold
targets
achieved
Upper
threshold
targets
achieved
2007 0.93 (0.98) -0.13(0.17) 8 0 1 7
2008 0.73(0.90) 0.32(0.22) 12 3 1 8
2009 0.47(0.50) 1.21(0.72) 15 3 5 7
FTSE Small
Cap 2010 0.64(0.72) 0.57(0.42) 15 4 6 5
2011 0.57(0.68) 0.49(0.39) 17 4 6 7
2012 0.61(0.55) 0.63(0.55) 20 5 6 9
Total
87 19 25 43

148
“Avg (Median) TSR Index” indicates the average (median) three-year change in total shareholder returns for the
index. “Avg (Median) TSR Firm” indicates the average (median) of three-year change in total shareholder returns
for all firms using the FTSE 100, FTSE 250, FTSE 350 and FTSE Small Cap indices, by year. “No. of plans”
refers to the number of plans using a specific index. “Targets not achieved” represents the number of plans that do
not achieve any performance hurdles in a particular year using a specific index. “Median threshold targets
achieved” stands for the number of plans achieving the lower threshold hurdles only. “Upper threshold targets
achieved” refers to the number of plans achieving upper threshold hurdles. A prior three-month averaging period
has been used in the TSR calculations. Firms with unavailable data for the past and actual 3-year EPS (TSR)
growth are excluded from our sample. In addition, we consider actual 3-year EPS (TSR) growth figures, so that
the latest year considered is 2012. This results in a final sample which is different from that shown in Table 5.7.
Table 5.11 shows the number of plans which select a TSR benchmark relative to the FTSE 100,
FTSE 250 or FTSE Small Cap indices. Many firms in their compensation contracts select the
50th and 75th TSR percentile ranking for minimum and maximum payouts, respectively, as
shown previously. The findings above show that around half of the plans of firms that selected
the FTSE 100 in 2007, 2008 and 2010 met the upper threshold targets in addition to the median
threshold targets, and only 18% of plans achieve the median threshold hurdle while failing to
attain the upper threshold hurdle.
The most popular index used by firms is the FTSE 250 with 47% of plans employing it. From
the above table, we observe that on average 46% of plans do not achieve their median threshold
targets, while 34% of such plans achieve both the median and the upper threshold targets. Only
a few firms use the FTSE 350 index as a relative index, among whom, only 25% of plans meet
both the median and the upper threshold targets, and 53% of plans do not even meet the median
performance hurdle.
We also notice that an average TSR growth in FTSE Small Capitalization ranges from -0.13%
to 0.63, as indicated by the Avg (Median) TSR Index column. From 2007 to 2012, we observe
that there are high and lower TSR values, the results from Table 5.11 show that the firms do
not achieve the initial performance hurdle with 2007 as an exception. More than 49% of the
plans that use FTSE Small Cap as a comparator group attain both median and upper threshold

149
targets, so that among all indices, there is greater percentage of upper threshold targets achieved
in plans which use the FTSE Small Cap as a relative Index.
Next, in Tables 5.12 and 5.13, we focus on target attainability for plans that employ EPS as a
performance measure. RPI growth figures are collected from the National Statistics website.
Table 5.12.
Panel A: Descriptive Statistics of EPS Real/RPI growth targets
EPS real/ RPI growth No. of
plans Mean
Standard
deviation
First
quartile Median
Third
quartile Maximum
Initial threshold 511 4.42% 1.78% 3.00% 4.00% 5.00% 21.50%
Maximum threshold 511 10.29% 3.34% 8.00% 10.00% 12.00% 30.00%
Past 3-year EPS
growth 511 14.41% 30.96% 0.16% 10.90% 20.62% 90.00%
Actual 3-year EPS
growth 511 8.06% 22.46% -3.06% 6.68% 15.90% 140.00%
Table 5.12
Panel B: The breakdown of number of plans achieving minimum or maximum performance
thresholds of EPS real / RPI growth, by year
Year No. of
plans
Minimum
threshold
targets
p.a.
Maximum
threshold
targets
p.a.
Minimum
threshold
targets
achieved
Minimum
and
maximum
threshold
targets
achieved
Targets
not
achieved
Past 3-
year
EPS
growth
Actual
3-year
EPS
growth
2007 74 0.083 0.143 10 28 36 0.050 0.080
2008 88 0.080 0.140 14 29 45 0.048 0.084
2009 82 0.045 0.095 16 45 21 0.163 0.108
2010 87 0.086 0.146 16 34 37 0.113 0.093
2011 91 0.092 0.152 11 19 61 0.097 0.047
2012 89 0.082 0.142 24 27 38 0.045 0.105
Total 511 91 182 238

150
Table 5.13
Panel A: Descriptive Statistics of EPS absolute growth targets
EPS Absolute
growth
No. of
plans Mean
Standard
deviation First quartile Median
Third
quartile Maximum
Minimum
threshold target 228 4.80% 3.17% 3.20% 4.00% 6.70% 20.00%
Maximum
threshold target 228 10.93% 4.67% 9.00% 10.00% 15.00% 28.00%
Past 3-year EPS
growth 228 23.63% 56.00% 1.75% 15.02% 26.00% 107.00%
Actual 3-year EPS
growth 228 20.80% 28.90% 4.90% 16.14% 21.00% 150.00%
Table 5.13.
Panel B: The breakdown of a number of plans achieving minimum or maximum performance
thresholds of EPS absolute growth, by year
Year
No. of
plans
Minimum
threshold
targets p.a.
Maximum
threshold
targets p.a.
Minimum
threshold
targets
achieved
Minimum
and
maximum
threshold
targets
achieved
Targets
not
achieved
Past 3-
year
EPS
growth
Actual
3-year
EPS
growth
2007 34 5.00% 10.00% 4 22 8 17.15% 15.25%
2008 39 5.00% 10.00% 3 23 13 16.30% 14.57%
2009 31 5.00% 10.50% 5 26 0 15.13% 15.50%
2010 45 5.00% 11.75% 5 33 7 12.15% 15.83%
2011 38 5.00% 12.00% 10 16 12 7.60% 10.80%
2012 41 5.50% 13.00% 5 18 18 7.85% 7.81%
Total 228
32 138 58
“No of plans” refers to the number of firms using EPS performance measure in their plans. “Past 3-year EPS
growth” is the earnings per share growth for each company over the past three years prior to the plan. “Actual 3-
year growth” is the earnings per share growth for the company over the next three years after plan adoption.
“Minimum threshold” is the median earnings per share growth of the minimum threshold target set by firms.
“Maximum threshold” is the median earnings per share growth of the upper threshold set by firms. “Minimum
threshold targets achieved” signifies the number of plans achieving lower threshold targets only. “Minimum and
maximum target achieved” refers to the number of plans achieving both minimum and maximum threshold targets.
“Targets not achieved” refer to number of plans achieving neither minimum nor maximum threshold targets.

151
The results in the Panel A of Table 5.12 indicate that on average, 46% of the plans in our sample
do not meet a minimum performance hurdle. By contrast, 36% of the plans achieve lower and
the maximum threshold targets. One exception is 2009 when 19% and 54% of the plans
achieved minimum and maximum threshold targets due to lower RPI respectively. Looking at
the 3-year past EPS growth, we observe that minimum threshold targets are set below three-
year prior EPS growth in 2009, 2010 and 2011.
Panel B of Table 5.13 presents the results relating to absolute EPS targets. In contrast to firms
using real EPS targets, we observe that firms using absolute EPS growth attain their upper and
lower thresholds targets with greater ease; only 25% of plans do not meet lower or upper-
performance hurdles. Panel A of Table 10 shows that there exists greater variance in minimum
and maximum threshold targets, due to targets being widely spread over the sample. On
average, minimum threshold targets do not vary much over time, and range between 5% to
5.5% p.a. from 2007 to 2012.
Interestingly, on average, firms using absolute EPS measures tend to set lower minimum EPS
threshold targets compared to their actual past 3-year EPS growth results and in addition, there
exists a difference in target attainability in firms using absolute EPS over firms which employ
EPS in excess of RPI.
5.8 Conclusion
Using a comprehensive sample of 400 large firms from 2007 until 2015, we examine the
influence of volatility and corporate governance variables on firms’ choice of performance
measures. We find that the choice of a performance measure is not arbitrary, but instead,
corporate governance factors and the volatility of both EPS and TSR influence the choice of

152
firm performance measure. Consistent with the optimal contracting approach, we find that firms
tend to choose performance measures which are less volatile, implying that contracts are
designed optimally. Further, remuneration advisors and the volatility in performance measure
neither influence the selection of TSR nor EPS category.
Some consultants exhibit a preference to select TSR, while other consultants prefer the use of
EPS, so that consultant identity is an important factor in the choice of performance metrics in
compensation contracts, providing evidence of normative isomorphism within executives’
compensation contracts. Furthermore, firms with higher sales prefer to choose a combination
of EPS and TSR as a performance metric, indicating that larger firms prefer to rely on a
combination of EPS and TSR performance measures as key indicators of the firm’s value
creation.
This study provides an in-depth analysis of the design of executive contracts and the different
plan characteristics of long-term incentive arrangements. We observe from our descriptive
statistics that there has been a decline in the use of options, while performance share plans
appear to remain a key element of long-term incentive plans.
Key findings from our descriptive analysis show that firms use various types of market-based
measures. Among market-based measures, the use of relative TSR is most frequent, and the
FTSE 250 is the most common Index employed in relative TSR plans. However, firms are
increasingly setting stretching targets away from traditional benchmarking through the use of
outperformance plans, in which maximum vesting is above the traditional median or upper
quartile. Moreover, there also exists different target attainability within different TSR index, so
that the FTSE Small Cap offers the greater potential for target attainment.
Our findings also indicate that firms use different versions of EPS and that growth in EPS can
be measured in absolute terms or in growth in excess of RPI. We observe that a minimum

153
threshold range of 2% p.a. to 8% p.a. is most popular in plans using an EPS absolute growth
target, while for plans using an EPS growth benchmark against growth in RPI, the target range
of 2% p.a. to 6% p.a. is most popular. There exists a wider spread of upper threshold targets in
plans that use EPS benchmark against growth in RPI compared to absolute EPS targets: the RPI
targets are concentrated in the range of RPI + 7% p.a. to RPI +17% p.a., while EPS absolute
growth targets mostly range from 7% p.a. to 15% p.a. After adjusting for the effect of RPI in
EPS targets, we observe that minimum and maximum threshold targets are set lower in absolute
EPS growth targets, and hence, achievement of targets is higher in firms using absolute EPS
growth figures. Since the ABI guidelines provide no clear structure for determining the
appropriate standards, we argue that this represents a case of mimetic isomorphism, in which
firms copy each other’ standards.
This study will reassure shareholders and institutional holders since we show that the choice of
performance measure in compensation contracts tends to reflect optimal contracting. From a
policy perspective, we find that remuneration advisors play an influential role in contract design
and there exist many forms of isomorphism in one form or another, which arise from hiring
consultants, selection of performance measures, setting targets and payout level.

154
APPENDIX TO CHAPTER 5
Variable Definition
This table provides a detailed description of the construction of all the variables used in this
chapter.
Dependent Variable Definition
Performance measure 0 if long-term incentives consist of EPS and TSR jointly, 1 if firms’
incentive grants have only TSR condition, 2 if firms’ incentive grants
consist of EPS measure exclusively and 3 if firms’ incentive grants
contain neither EPS nor TSR condition
Independent Variables Definition
TSR vol
The standard deviation in stock returns three-years before the plan
adoption
TSR vol The standard deviation in EPS growth three-years prior to the plan
adoption
Market to book ratio
Book value of the common equity divided by the market value of the
common equity
Firm Age Firm Age is defined as the year the firm was founded and is a proxy of
firm maturity. It is the natural logarithm of the difference between the
years in consideration42 and the year firm was founded plus one
Tenure
The natural logarithm of number of years served as the CEO and is a
proxy of CEO experience
Non-executive directors % Percentage of number of non-executive directors over total number of
directors on board
Board size Total number of directors on the board
Sales Natural Logarithm of the firm’s sales/turnover
42 Note: In the case of our study, the sample is from 2010 to 2014, Thus, for example, for the firm which was
founded in 2008 and the year of consideration being 2010, the firm age is (2010-2008+1) 3.

155
Table A.5.1: Robustness test
Multinomial logistic model estimating the effects of industry-adjusted EPS and TSR
volatilities on performance measures
Multinomial logistic regression of performance measures in compensation contracts against
industry-adjusted TSR, industry EPS volatility, TSR volatility, board size, market to book, firm
sales, % of non-executive directors, free cash flow, CEO tenure and firm age. All results are relative
to the base category of (EPS and TSR jointly). Robust standard errors are reported in parentheses.
***, **, * denote significance at 1%, 5%, and 10%, respectively.
Variable TSR EPS Neither EPS nor TSR Column1 Column 3 Column 5
Multinomial logit
model results
Multinomial logit
model results
Multinomial logit model
results
EPS vol 0.070** -0.299*** 0.009
(0.033) (0.105) (0.050)
TSR vol -3.749*** -0.560 -1.203
(0.765) (0.517) (1.167)
Market to book 0.0014 -0.001 -0.059** (0.004) (0.005) (0.025)
Ln (Board size) 1.359*** 0.869*** 0.135 (0.322) (0.309) (0.425)
Non-executives% 0.022*** -0.022*** -0.013* (0.005) (0.005) (0.008)
Ln (Sales £’000) -0.342*** -0.025 -0.210** (0.059) (0.060) (0.082)
Ln (Free Cash Flow) 0.535*** -0.655*** -0.054 (0.204) (0.208) (0.304)
Ln (Tenure) 0.165** 0.207*** 0.225* (0.067) (0.075) (0.127)
Ln (Firm Age) -0.346*** 0.132* -0.402***
(0.063) (0.075) (0.120)
Constant -4.969*** 3.650** 2.947
(1.395) (1.496) (2.229)
Industry effects Yes
Consultant effects Yes
Observations 1931
Log likelihood -1844
Pseudo R-squared 0.23
Please refer the footnote in Table 4, and Industry-adjusted TSR vol is the standard deviation of firm’s stock
returns growth minus the mean standard deviation of stock returns growth of the industry over three-year
period before plan adaptation and EPS vol is standard deviation of firm’s eps growth minus the mean
standard deviation of eps growth of the industry over three-year period before plans.

156
Table A.5.2: Robustness test 2
Multinomial logistic model estimating the effects of basic EPS volatility and TSR
volatility on performance measures
Multinomial logistic regression of performance measures in compensation contracts against
basic EPS volatility, TSR volatility, board size, market to book, firm sales, % of non-
executive directors, free cash flow, CEO tenure and firm age. All results are relative to the
base category of (EPS and TSR jointly). Robust standard errors are reported in parentheses.
***, **, * denote significance at 1%, 5%, and 10%, respectively.
Variable TSR EPS Neither earnings
nor TSR
Column 1 Column 2 Column 3
Multinomial logit
model results
Multinomial
logit model
results
Multinomial logit
model results
EPS vol 0.008*** -0.014** 0.005
(0.002) (0.006) (0.004)
TSR vol -0.397*** -0.178 -0.095
(0.122) (0.156) (0.142)
Market to book 0.001 -0.002 -0.057**
(0.004) (0.004) (0.025)
Board size 1.394*** 0.795*** 0.161
(0.320) (0.305) (0.427)
Non-executives% 0.022*** -0.020*** -0.013 (0.005) (0.005) (0.008)
Ln (Sales £’000) -0.371*** -0.039 -0.219***
(0.060) (0.059) (0.082)
Ln (Free Cash Flow) 0.533** -0.575*** -0.121
(0.215) (0.196) (0.313)
Ln (Tenure) 0.162** 0.232*** 0.225*
(0.067) (0.076) (0.127)
Ln (Firm Age) -0.354*** 0.150** -0.409***
(0.063) (0.074) (0.121)
Constant -4.990*** 3.195** 3.261
(1.446) (1.434) (2.272)
Industry effects Yes
Consultant effects Yes
Observations 1931 Log likelihood -1834 Pseudo R-squared 0.23

157
Table A.5.3: Robustness test 3
Multinomial logit model estimating the probability of performance measures in
compensation contracts with time dummies
Multinomial logistic regression of performance measures in compensation contracts
against TSR volatility, EPS volatility, board size, market to book, firm sales, % of non-
executive directors, free cash flow, CEO tenure and firm age. All results are relative to the
base category of (EPS and TSR jointly). Robust standard errors are reported in parentheses.
***, **, * denote significance at 1%, 5%, and 10%, respectively.
Variable TSR EPS Neither earnings nor
TSR
Column 1 Column 2 Column 3
Multinomial logit
model results
Multinomial logit
model results
Multinomial logit
model results
EPS vol 0.117*** -0.138** 0.049
(0.021) (0.062) (0.033)
TSR vol -3.185** -1.247 -1.311
(1.330) (1.073) (1.206)
Market to book 0.000 -0.002 -0.059**
(0.004) (0.004) (0.025)
Board size 1.348*** 0.840*** 0.144
(0.321) (0.306) (0.425)
Non-executives % 0.025*** -0.019*** -0.012
(0.005) (0.006) (0.008)
Ln (Sales £’000) -0.361*** -0.034 -0.217**
(0.058) (0.060) (0.085)
Ln (Free Cash Flow) 0.524*** -0.705*** -0.136
(0.203) (0.219) (0.361)
Ln (Tenure) 0.218*** 0.273*** 0.254*
(0.0683) (0.079) (0.132)
Ln (Firm Age) -0.318*** 0.148** -0.382***
(0.064) (0.074) (0.121)
Constant -4.990*** 3.195** 3.261
(1.446) (1.434) (2.272)
Industry effects Yes
Consultant effects Yes
Observations 1931 Log likelihood -1827 Pseudo R-squared 0.23

158
Table A.5.4: Robustness test 4
Multinomial logit model estimating the probability of performance measures in
compensation contracts (using total assets as a proxy for firm size)
Multinomial logistic regression of performance measures in compensation contracts
against TSR volatility, EPS volatility, board size, market to book, firm sales, % of non-
executive directors, free cash flow, CEO tenure and firm age. All results are relative to the
base category of (EPS and TSR jointly). Robust standard errors are reported in parentheses.
***, **, * denote significance at 1%, 5%, and 10%, respectively.
Variable TSR EPS Neither earnings
nor TSR
Column 1 Column 2 Column 3
Multinomial logit
model results
Multinomial logit
model results
Multinomial logit
model results
EPS vol 0.131*** -0.137** 0.070 (0.023) (0.062) (0.038)
TSR vol -3.521*** -1.994 -1.610 (1.264) (1.256) (1.547)
Market to book 0.000 -0.005 -0.063** (0.004) (0.005) (0.025)
Board size 0.655** 1.561*** 0.357 (0.325) (0.334) (0.443)
Non-executives % 0.013** -0.010* -0.010 (0.005) (0.005) (0.007)
Ln (Assets) -0.322*** -0.052 -0.253** (0.069) (0.062) (0.099)
Ln (Free Cash Flow) 0.119 -0.287 -0.194 (0.170) (0.263) (0.438)
Ln (Tenure) 0.241*** 0.224*** 0.273** (0.065) (0.072) (0.126)
Ln (Firm Age) -0.321*** 0.174** -0.386*** (0.063) (0.075) (0.120)
Constant -4.969*** 3.650** 2.947
(1.395) (1.496) (2.229)
Industry effects Yes
Consultant effects Yes
Observations 1931 Log likelihood -1845 Pseudo R-squared 0.23

159
Table A.5.5: Robustness test 5
Multinomial logit model estimating the probability of performance measures in
compensation contracts (inclusion of EPS along with income measures in earnings
category)
Multinomial logistic regression of performance measures in compensation contracts against
TSR volatility, EPS volatility, board size, market to book, firm sales, % of non-executive
directors, free cash flow, CEO tenure and firm age. All results are relative to the base
category of (EPS and TSR jointly). Robust standard errors are reported in parentheses. ***,
**, * denote significance at 1%, 5%, and 10%, respectively.
Variable TSR EPS Neither earnings
nor TSR
Column 1 Column 2 Column 3
Multinomial logit
model results
Multinomial logit
model results
Multinomial logit
model results
Earnings vol 0.129*** -0.109** 0.048
(0.023) (0.055) (0.035)
TSR vol -3.858*** -2.070 -1.672
(1.133) (1.130) (1.447)
Market to book 0.000 -0.001 -0.045**
(0.004) (0.004) (0.021)
Board size 1.266*** 0.730** 0.014
(0.321) (0.305) (0.410)
Non-executives % 0.025*** -0.021*** -0.009
(0.005) (0.005) (0.008)
Ln (Sales) -0.361*** -0.018 -0.168**
(0.058) (0.060) (0.080)
Ln (Free Cash Flow) 0.551*** -0.721*** -0.083
(0.204) (0.222) (0.319)
Ln (Tenure) 0.204*** 0.222*** 0.231*
(0.066) (0.075) (0.123)
Ln (Firm Age) -0.336*** 0.102 -0.439***
(0.061) (0.073) (0.117)
Constant -4.969*** 3.650** 2.947
(1.395) (1.496) (2.229)
Industry effects Yes
Consultant effects Yes
Observations 1964 Log likelihood -1885 Pseudo R-squared 0.23

160
6 RPE CHOICES IN COMPENSATION CONTRACTS OF UK FIRMS
6.1 Introduction
Equity-based compensation has become an increasingly significant element of executive
compensation for UK CEOs. Historically, firms granted time-based options and restricted stock
shares, however, as discussed in Section 2.1.2, in 1995 the Greenbury report recommended that
incentive compensation should be linked to relative performance in order to trigger or accelerate
the vesting of equity. Agency theory views performance-related pay as a key mechanism that
fosters incentive alignment between the interests of shareholders and executives, and hence, it
is crucial for firms to set an appropriate level of compensation, and alongside, set challenging
but achievable performance targets (Stedry and Kay, 1966). Usually, the board remuneration
committee determines the design of executive compensation contracts on behalf of
shareholders, but, the terms by which remuneration committees determine the design of relative
performance plans have not been well understood and explored.
Executives’ equity-based compensation is the most variable component of their compensation
package. Many reforms and policies have stressed the importance of transparency and
toughness in the performance criteria of equity compensation. Corporate performance, which
is often a key determinant of CEO pay in such packages, can be measured in relative or absolute
terms. Relative performance evaluation (RPE) is the use of peers’ performance in evaluating
the company’s performance. Holmstrom (1982) argues that firms should exclude components
of performance measures that are driven by exogenous shocks, indicating that RPE ought to
exclude the effects of common shocks when determining executive compensation.
In the context of executive compensation, it has become common practice for firms to examine
the pay packages offered by peers in order to determine the appropriate pay for their executives,

161
termed “compensation benchmarking”, to providing competitive pay packages relative to peer
firms of similar industry or market capitalization. Interestingly, there is full disclosure of peers
used for “compensation benchmarking” in the US, while such details are rarely seen in UK
annual reports. Similar to the process of compensation benchmarking, remuneration
committees also use peer groups to compare the firm’s relative performance. There exist greater
disclosure and transparency in peers selected for “relative performance evaluation” purposes in
the UK compared to the US.
There are two different ways of studying RPE usage. In the explicit method, researchers use
regulatory filings to observe whether firms use RPE. In the UK, since 2002, the Directors’
Remuneration Report (DRR, 2002) requires firms to be transparent in producing information
related to executive compensation contracts, and subsequently, there has been an increase in
disclosure of explicit methods.43 Currently, UK companies disclose detailed information
related to components and level of pay in their annual reports.
In the implicit method, the more common approach to test the RPE hypothesis is to regress
executive pay on average industry or market performance (e.g. Gibbons and Murphy, 1990;
Janakiraman et al., 1992; Aggarwal and Samwick, 1999b; Albuquerque, 2009). However, due
to limited data availability on peer groups, researchers do not identify the actual peer groups,
making it difficult to test accurately whether or not the use of RPE is present in compensation
contracts. Since 2006, the Securities and Exchange Commission (SEC) requires US-listed firms
to disclose RPE utilisation, benchmarks and peers in their proxy statements. Only very recently,
43 The Directors' Remuneration Report Regulations (2002). http://www.opsi.gov.uk/si/si2002/20021986.html
[accessed on September 19, 2016].

162
studies make use of new disclosure rules and investigate implicit RPE tests while incorporating
explicit RPE details for US firms (e.g. Gong et al., 2011; Black et al., 2016; Bizjak et al., 2017)
Over, the last few years there has been a change in a way in which executives are awarded
equity compensation, with an introduction of a mix of RPE and absolute growth measures in
long-term incentive plans. In addition, greater disclosure and scrutiny in executive pay have led
firms to select innovative compensation designs, thereby making compensation structure more
complex for shareholders and the general public to evaluate and understand.
The advantage of studying the determinants of RPE use in the UK is that the enhanced
disclosure and transparency present in the reporting provides us with a superior opportunity to
examine the process of performance benchmarking. In addition, the majority of firms in the UK
employ performance vested long-term incentives in their compensation contracts. There exist
considerable variation in the choice of the peer groups, minimum and maximum performance
targets, and the corresponding percentages of equity vesting at these threshold targets (Ferri,
2009). The descriptive statistics of Zakaria’s (2012) study reveals that it is uncommon for UK
firms to employ RPE based measures in short-term bonuses, as opposed to long-term incentive
plans. Therefore, the focus of this study will be on long-term incentive plans.
This chapter is devoted to providing detailed evidence on the explicit usage and characteristics
of RPE in long-term incentive plans awarded by firms in the FTSE 350. We examine the
relationship between common risk and the explicit use of RPE. Results reveal that common risk
is associated with the decision by firms to use RPE in compensation contracts after controlling
for corporate governance characteristics. This factor also influences the specific plan
characteristics including the use of peer group choice and percentage of equity vesting at initial
or upper quartile performance set by the firms. We also find that 42%, 42% and 16% of total

163
plans pick custom, index, and sector peer group as categories, respectively, in their long-term
incentive plans.
This chapter makes several contributions to the limited literature on the explicit use of RPE for
UK firms. Firstly, this study uses a large comprehensive dataset covering the years 2010 to
2014, while the only existing study in the literature which examines performance characteristics
of RPE plans for UK firms was carried out by Carter et al. (2009), although, for only 2002. In
investigating the explicit use of RPE, we consider all the performance standards (i.e. absolute
only, relative only, and absolute and relative jointly) used in compensation contracts. Further,
we employ different measures of common risk which are calculated using the benchmark
returns from market, industry and supersector. Secondly, to the best of our knowledge, we are
the first to provide an in-depth breakdown of peers and performance target characteristics in
RPE plans and their determinants, though there exists limited literature on target setting
especially in the context of US firms (Kole, 1997; Indjejikian and Nanda, 2002; Leone and
Rock, 2002). Lastly, in our descriptive analysis, we examine the extent to which the nature of
the peer group (i.e. self-selected firms, sector peers, or a broader index peers) and other long-
term incentive characteristics affects the equity vesting in actuality at different ranges.
The rest of this chapter is structured as follows: Section 6.2 covers the literature review and
hypothesis development, Section 6.3 discusses the variables, and Section 6.4 focuses on the
detailed design of RPE-based contracts and vesting percentages by industry. In Section 6.5, we
discuss the empirical tools we use to examine firms’ decisions to use RPE-based contracts while
Section 6.6 focuses on empirical results. Finally, Section 6.7 concludes.

164
6.1.1 Discussion on the use of Relative Performance Evaluation (RPE) presence
Agency costs emerge when principals (shareholders) hire agents (directors) to act in their
interests since the two parties have divergent interests and information asymmetry prevents
shareholders from monitoring CEO actions directly. Nevertheless, the agency problem can be
mitigated by tying executive compensation to firm performance (Jensen and Meckling 1976;
Holmstrom, 1982; Diamond and Verrecchia 1982). In order to evaluate managerial actions,
firms can choose either absolute or relative performance measures. During the target setting
process, absolute targets are set at the start of the period and are based on analysts’ forecast and
past performance (Murphy, 2000), whereas the relative performance approach selects peers at
the start of the process but uses ex-post peer group performance to assess actual managerial
performance.
As discussed in Section 3.3.1, the initial literature on executive compensation mainly explores
the relationship between pay and performance, seeking to answer the question of whether higher
pay is justified by higher performance; subsequently, the literature has shifted to focus on the
choice of metric used to evaluate corporate performance contracts (e.g. Lambert and Larcker,
1987; Ittner et al., 1997 and Core et al., 2003). For example, Lambert and Larcker (1987), who
study the selection of performance metrics between market versus accounting measures in
salary plus bonus contracts. However, only very recently have researchers started to focus on
detailed contractual terms and analyze ways in which firms set performance measures and the
extent to which such practices support the predictions of optimal contracting theories. Among
this latter group, key studies include De Angelis and Grinstein (2015), who examine a selection
of contractual choices and firm characteristics in bonus and equity plans of US firms. Their
study shows that performance choices are related to a metric’s relative informativeness, as

165
suggested by the Informativeness Principle (Holmstrom, 1982), which states that firms should
rely more heavily on a measure that is highly sensitive to a CEO’s actions.
Economic theory states that if exogenous shocks affect the performance of multiple agents’, it
will be beneficial for firms to employ relative performance instead of absolute performance
when there exists greater common uncertainty (e.g. Holmstrom (1979, 1982)). The presence of
RPE filters out common shocks, which leads to risk-sharing benefits between shareholders and
managers and provides shareholders with a more informative measure while assessing
managerial actions and “de-noising” CEO effort (Holmstorm, 1982; Holmstrom and Milgrom,
1987). Consequently, firms that benchmark against their peers can insulate non-firm-specific
risks common to the firm’s peers and hence make equity compensation more efficient.
As discussed in Section 3.3.3, while testing implicit RPE use, researchers regress executive pay
against the firm’s and the market’s performance. A positive coefficient on firm performance is
taken to show a positive correlation between firm performance and the level of executive pay,
while a negative coefficient on market performance indicates a filtering out of the market risk
component of firm performance. As Antle and Smith (1986) note, higher peer performance, as
measured by accounting and market measures, decreases the level of compensation.
Only a limited number of studies have tested explicit RPE use in incentive contracts (Murphy,
2000; Bannister and Newman, 2003; Carter et al., 2009; Gong et al., 2011; Black et al., 2016;
Bizjak et al., 2017). Murphy (2000) investigates a sample of 177 U.S. firms in the 1997 Towers
Perrin survey and finds that 28.8% of firms use RPE in incentive plans. Their research also
argues that prior studies which identify RPE presence by employing an implicit approach are
more likely to have used a misspecified model, by assuming similar peer groups
(industry/market) in RPE firms. Before the advent of mandatory SEC disclosure of peer groups
in 2006, prior studies on the US were obliged to employ implicit techniques to detect RPE, with

166
mixed results. Gibbons and Murphy (1990), Janakiraman et al. (1992) and Rajgopal et al. (2006)
document support for the use of RPE using implicit methods.
As reviewed in Section 3.3.3, much of the existing literature focuses on US firms, making
explicit use of mandatory SEC disclosure and testing for evidence of implicit RPE use in
compensation contracts by regressing pay against performance. Concerning the literature on
determinants of RPE use in compensation contracts, there exist two principal studies, namely,
Carter et al. (2009) and Gong et al. (2011). The Carter et al. (2009) study is restricted to a
sample of 180 UK plans for a single year, 2002, for FTSE 350 firms, while Gong et al. (2011)
study the S&P 1500 companies, again for only one year, 2006; they find that firms select peers
in a manner that captures common risk, consistent with agency theory. These studies’
categorization of companies however lacks subtlety, in that they neglect to identify those firms
which use absolute rather than relative measures: Carter et al. (2009) classify firms into “RPE
only”, “Some RPE” and “No RPE”, while Gong et al. (2011) classify firms into “RPE only”
and “Non-RPE”, omitting those firms that use some RPE or absolute measures. In the present
study, we seek to advance over both of these, by classifying firms into “RPE only”, “absolute
only” and “absolute and RPE”. In addition, the characteristics of relative performance
incentives have not yet been thoroughly explored in the current literature.
The Carter et al. (2009) study failed to find evidence that economic determinants are associated
with the decision to use RPE in the long-term incentive plans of UK firms (e.g. common risk)
and only uses a single proxy to capture common risk. By contrast, our study extends the
literature by taking into account several proxies of common risk. Further, we also consider the
marginal effects of various performance categories, implying a unit change in an independent
variable on the probability of selecting performance standards. We also control for industry and

167
the identity of the compensation consultant, neither of which are captured by Carter et al.
(2009).
To the best of our knowledge, the dataset used in this study employed in analyzing the explicit
use of RPE is the most detailed in the context of investigating long-term incentive contracts for
UK firms. We also extend the literature by including corporate governance variables such as
independent directors and board size. Since 2002, the structure of UK remuneration contracts
has changed and performance contingencies are increasingly more varied and complex (Ferri,
2009). Thus, it is useful to test RPE in the current UK settings. As noted above, the prior
literature on RPE has only considered RPE and non-RPE (absolute) categories exclusively, but
this study, additionally, considers companies which employ absolute and relative measures
jointly. We consider this to be an important methodological advance since this latter category
accounts for over 50% of the firms in our sample.
RPE firms incentivize executives to perform better while insulating their compensation from
common shocks that likewise influence the performance of similar firms, the market or the
industry. Consequently, RPE improves the alignment between pay and performance. Agency
theory guides our empirical design as it suggests that the efficiency of a compensation contract
can be improved by employing the performance of agents exposed to similar risks.
6.1.2 On Peer Groups used in RPE
Albuquerque et al. (2013) and Faulkender and Jun Yang (2010) employ an explicit approach to
analyze compensation benchmarking peers of US firms. The disclosing firm compares the CEO
compensation of their peers on the level of their own CEOs and further investigates the
characteristics between potential and actual peer. Their findings suggest that industry and size

168
are two important components that explain peer group selection. Moreover, the level of peers’
compensation is another important factor in determining the selection of peers. Faulkender and
Jun Yang (2010) demonstrate that firms are more likely to pick peers which compensate their
executives with a higher level of remuneration, providing evidence of self-serving bias in
compensation benchmarking.
Lazear and Rosen (1981) conduct a pioneering study on an RPE style of tournament theory,
where the main aim is to create a tournament to incentivize managers to outperform their peers,
eventually leading to higher relative performance for greater reward. Within these models, pay
rises with greater relative performance instead of absolute performance. In plans with RPE
conditions, executives are continuously evaluated based on their performance relative to their
peers. Thus, the selection of peers is a vital part of the incentive system in addressing agency
problems. On the other hand, rent extraction theory advocates that firms will select peers in
their RPE based plans in such a way as to maximize relative performance and award higher pay
to executives (Gibbons and Murphy, 1990).
As discussed earlier, much of the existing literature investigates peer selection for compensation
benchmarking. Contrary to compensation benchmarking, the primary aim of performance
benchmarking is to remove common risk. From firm selection bias or rent extraction point of
view, the effect of peer performance is the opposite for RPE peers relative to pay benchmarking
peers, since better-performing companies award higher levels of compensation, and
accordingly will be chosen as benchmarking peers. However, underperforming companies are
more likely to be selected as RPE peers to improve relative performance for the purposes of
maximizing compensation (Bizjak et al., 2008). Another example of rent extraction in
performance benchmarking is to pick a set of peers which do not face similar external shocks
neither do they share common ability to respond to those shocks with respect to that of RPE

169
firm (Albuquerque, 2009). This makes such contracts less efficient. The selection of peers in
compensation benchmarking serves a different purpose for the selection of peers used for
performance benchmarking purposes, hence the finding from compensation benchmarking does
not necessarily apply to RPE peers.
In a working paper, Bizjak et al. (2017) test the explicit use of RPE in US firms. Similar to
prior studies on compensation benchmarking, they investigate determinants of peer firm
selection in relative performance evaluation plans. Their results conclude that firms select peers
to filter out common shocks, which is in line with the economic motivation behind RPE use.
These findings also show evidence of bias in peer selection and benchmarking which results in
higher levels of executive compensation, as selected firms tend to have lower market betas and
lower estimates of future stock returns.
Turning towards other RPE characteristics, Hvide (2002) concludes that tournament style RPE
can have a significant impact on the selection of performance conditions. In this regard,
theoretical work by Brisley (2006) indicates that for a stretching performance target (i.e. payout
range) vesting of options as an increasing function of share price can improve risk-taking
incentives more than vesting at a single point; while Brennan (2001) contends that the use of
performance hurdles in options are unlikely to be considered as optimal. Lazear and Rosen
(1981) discuss target spread (the difference between median and maximum performance
required for equity vesting of executives), which is one of the characteristics in evaluating RPE
and argue that magnitude of the spread across different levels of pay at several percentile
rankings can be used to manage CEO effort. Only limited studies have investigated
characteristics of RPE directly. In this present study, however, we focus on analysing the impact
of common risk on the target spread, selection of peer group, and vesting payout at initial and
maximum thresholds in long-term incentive plans.

170
6.1.3 RPE Award Design
In RPE-based plans, the most common award is a rank-order tournament, where the level of
equity payout is conditioned on the percentile ranking at the end of a pre-specified performance
period, which can be measured against total shareholder returns or EPS relative to a peer group.
Firms select defined peer groups to evaluate agent’s performance and the proportion of initial
shares’ vesting depends on the firm’s relative rank at the upper and lower bounds and between
these two bonds. The payout is usually a straight line between the upper and lower bounds of
the performance target. The lower bound, required for minimum vesting, is conventionally set
at median performance (i.e. the 50th percentile ranking), whereas the upper bound, beyond
which no additional benefits are awarded, is most commonly set when relative performance is
at the upper quartile (i.e. the 75th percentile ranking). The maximum threshold is defined as the
maximum performance beyond which no additional incremental incentives are awarded.
Firms occasionally select a stepped payout, where payout increases in a series of steps. In the
target setting process, firms that employ outperformance plans determine the payout level based
on magnitude by which the company outperforms its peer group. To give an example, in 2010,
Petrofac, used TSR outperformance relative to self-selected peers a performance target in their
long-term incentive plan. The firm needs to have an initial threshold of TSR equal to the index,
in order for 30% of the equity to vest. The maximum payout was set to a TSR outperformance
above the index by 25% over three years. If TSR was below the index, no equity will vest.

171
6.2 Related Literature and Hypothesis development
Based on the above discussions, we formulate the following research hypothesis:
Hypothesis 6.1: The higher the common risk faced by the firm, the greater the likelihood of
choosing RPE based measures.
6.3 Research Variables
6.3.1 Use of RPE in remuneration contracts
In this section, by using the explicit approach, we examine factors that may affect firms’
decision to employ RPE in remuneration contracts. We also control for the operation of multiple
plans in their compensation contracts.
Common Risk
Agency theory predicts that the risk-sharing benefits of RPE increase when common risk affects
both peer and firm performance as it filters out common risk (e.g. Holmstrom 1982). Consistent
with theory, we expect to find a positive association between RPE implementation and common
risk between a firm and its peers. Similar to the approach of Gao et al. (2017) and Gong et al.
(2011) and, also, due to the greater prevalence of total shareholder return as an RPE measure,
we use total shareholder return to compute proxies for common risk.
We measure common risk by regressing each firm’s stock return (ri) on market returns (rm),
FTSE 350 Index). We apply a similar procedure with industry and supersector return based on
the FTSE ICB industry or supersector, to explore the possibility that the firm’s return
experiences similar shocks to those of its peers in the same industry or supersector, implying

172
greater use of RPE. Previous research has also tested the use of industry peer groups in RPE
(e.g. Jensen and Murphy, 1990 and Janakiraman et al., 2012).
𝑟𝑖= 𝛽0 + 𝛽1𝑟𝑚 + ε𝑖 (6.1)
In our robustness tests, we also employ other different proxies to measure common risk as used
in previous literature i.e. Gao et al. (2017) which uses data for US companies. Thus, we employ
R squared from the regression of firm-level returns on the value of weighted index returns over
the prior 48 months. Finally, in our robustness tests, we also use correlation as a proxy for
common risk.
Industry Concentration
Aggarwal and Samwick (1999b) argue that firms operating in competitive industries are less
inclined to use relative performance-based incentives as it may encourage destructive
competition, thus, influencing the shareholders’ value. Their empirical results show that as the
competition increases, the sensitivity of pay to rival firms also increase, suggesting that the
lower the industry concentration (i.e. the more competitive) the less likely it is to use RPE-
based plans. Following Gong et al. (2011), we use industry concentration, measured as
Herfindahl Index of sales within each FTSE ICB industry, as a proxy for the industry
concentration.
Compensation Consultant
With greater complexity in contract designs, the role of the remuneration consultant becomes
crucial in determining the level and structure of executive compensation. Therefore, firms seek
independent advice from an expert on best market practices. In the UK, the majority of FTSE
350 companies hire at least one compensation consultant due to their expertise in matters related
to executive compensation (Kabir and Minhat, 2014). Consultants are also hired to devise

173
contracts with RPE condition as shown by Murphy and Sandino (2009). It was revealed further
in the descriptive statistics conducted by Kuang et al. (2014) that a consultancy firm- HNBS,
advised their clients on RPE based contracts in stocks and options more than their competitors.
Board Size
Board size is measured as the total number of non-executives and executives on the board. Prior
studies state that large boards are formed of a higher number of individuals that bring greater
expertise and knowledge to the board. However, it has also been argued that the size of board
impacts its ability to control and monitor activities, thereby, making them less effective due to
the lack of coordination and communication. Thus, large boards are not always an assurance of
good corporate governance quality. Previously, board size has been studied to analyse its effects
on executive compensation, as discussed in Section 4.3. These studies have found that board
size plays a monitoring role in determining the different forms of executive pay (e.g., Mehran,
1995; Core et al. 1999). This suggests that board size could also potentially play a role in
determining decisions related to executive pay, such as the use of RPE or selection of firms’
performance target.
Independent Directors
Board independence is usually defined as the proportion of outside directors on a board. They
are members of the board but do not play a direct role in the everyday operation of the business
as part of the executive team. A greater percentage of independent directors on board is
considered a sign of good internal corporate governance as they represent shareholders’
interests.
In the current study, we seek to explain the influence of board independence on the selection of
RPE. Previous studies, Gong et al. (2011) and Gao et al. (2017) both find a positive association

174
between a greater percentage of non-executive directors and RPE selection in US firms. These
findings lead us to expect that the use of RPE is associated with good internal corporate
governance.
Institutional Investors
In 2002, the Directors’ Remuneration Report (DRRR) introduced mandatory non-binding
annual shareholders vote on executive pay at each firm’s Annual General Meeting, also referred
to as say-on-pay (SOP) in the UK (Conyon and Sadler, 2002). This provides the shareholders
with an opportunity to have a voice on matters related to executive compensation. In recent
years, the role of institutional investors has become crucial in monitoring executive pay as they
desire to set relevant targets which are also more difficult to achieve by executives. Institutional
owners influence accountability due to their investments in the business. Moreover, in the
annual general meeting (AGM), there exists a vote in favour of or against CEO pay rise, or on
performance measures managerial actions through a high level of ownership. They are
considered as effective monitors and mitigators of agency problems. According to the Institute
of British Insurers (2002), institutional investors argue that better corporate governance should
influence firms’ selection of RPE-based plans in compensation contracts. Thus, we expect the
selection of RPE based contracts to occur in better-governed firms. Hence, in this present study,
we use the sum of top 4 institutional ownership who own more than 5% of company shares as
a proxy for the quality of corporate governance. Other measures of corporate governance
quality used in this study are board size and percentage of independent directors.
Sales
There is limited evidence on the association between RPE and firm size. Himmelberg and
Hubbard (2000) empirical testing for CEO talent with firm size and argue that firms are less

175
likely to filter market and industry fluctuations while awarding talented CEOs. Additionally,
the organisational complexity of large corporations makes it difficult to find appropriate peers.
Thus, we do not expect large firms to opt for RPE as a performance standard in executive
compensation contracts.
Firm Performance
The introduction of RPE in compensation contracts can be used as a justification to award
higher level of executive pay by companies which already perform relatively better than their
peers. Alternately, Rajgopal et al. (2006) suggest industry-adjusted market performance as a
proxy for CEO talent and observe that better performing firms display less evidence of RPE
use. Following the previous literature on RPE, for example, Gong et al. (2011), we also include
industry-adjusted stock performance in our empirical model.
Dividend Yield
Carter et al. (2009) find no effect of dividend yield on the use of RPE in compensation contracts.
However, the authors find that firms which pay higher dividends opt for easy performance
targets by employing performance hurdles and lower payout target spread while evaluating their
executives.
Market to Book
Murphy (2000) finds that firms with higher level of growth opportunities are more inclined to
employ external standards (RPE) than internal standards, such as earnings, which tend to
incentivize managers of higher growth firms to smooth out fluctuations (Leone and Rock,
2002). This study employs market to book ratio as a proxy of growth opportunity.

176
6.4 Executive Compensation Contracts
Table 6.1: Breakdown of type of performance standards in remuneration contracts
Performance Measurement
No. of firm-year
observations Percentage
Absolute (Non-RPE) 263 24.5%
Relative Exclusively 189 17.6%
Relative & Absolute Jointly 620 57.8%
Total 1,072 100
The sample consists of constituents of the FTSE 350 UK index from 2007 to 2014. Table 6.1
demonstrates that 24.5% of firms in the sample use non-RPE measures, while 17.6% of firms
implement RPE based plans exclusively and another 58% employ a mixture of RPE and non-
RPE measures. Overall, the sample consists of 1072 firm-year observations. In their study of
firms in 2004, Carter et al. (2009) find that on an average, 17% of UK firms use a mixture of
absolute and relative measures compared to 58% in the present sample. This provides further
evidence that with time, performance standards have undergone a change in compensation
contracts in the context of UK firms.

177
Table 6.2: Industrial breakdown of performance standards in long-term incentive plans
Absolute
measure only
Relative
measure only
Absolute and Relative
measures jointly Total
Basic Resources 12(17%) 33(46%) 27(37%) 72(7%)
Consumer Goods 37(34%) 29(28%) 41(38%) 107(10%)
Consumer Services 75(32%) 36(15%) 124(52%) 235(21%)
Financials 34(24%) 19(13%) 87(62%) 140(13%)
Healthcare 11(22%) 4(8%) 35(70%) 50(5%)
Industrials 65(22%) 17(6%) 209(72%) 291(27%)
Oil and Gas 4(7%) 25(43%) 30(50%) 59(6%)
Technology 17(35%) 7(14%) 25(51%) 49(5%)
Telecommunications 6(18%) 6(19%) 20(62%) 32(3%)
Utilities 2(6%) 13(35%) 22(59%) 37(4%)
Total 263 189 620 1072
Table 6.2 represents performance standards by industry in long-term incentive arrangements.
Oil and Gas firms frequently select relative measures; this could be because fluctuations in oil
prices can be filtered using industry comparators. Similarly, companies in the Basic Resources
industry frequently adopt plans with relative measures. However, the dominance of absolute
measures in the Technology industry could be explained by R&D expenditures and innovation
growth targets. These descriptive statistics indicate that industry-specific effects should be
employed in our empirical design as the selection of RPE is more prevalent in certain industries.
Gong et al. (2011) find that 25% of US firms disclosed RPE use in 2006, compared to over 74%
in the current sample, indicating that a greater number of UK companies incorporate RPE
standards in their incentive arrangements, as shown in Table 6.1.

178
Table 6.3: Breakdown of relative performance evaluation (RPE) and non-RPE in long-term
incentive plans of FTSE 350 UK firms
Panel A: Breakdown of RPE plans in long-term incentive in remuneration contracts
No. of firm-year observations
Performance payout range 802
Performance payout range and hurdle 7
Total 809
Performance Measures No. of firm-year observations
Total Shareholder Returns 769
Earnings per share 25
Return on Investment 15
Total 809
Panel B: Breakdown for non-RPE firms based on long-term incentives in remuneration
contracts
No. of firm-year observations
Performance payout range 806
Hurdle/underpin and performance payout range 77
Total 883
Performance Measures No. of firm-year observations
Earnings per share (EPS) only 615
EPS and ROIC 42
Net Asset Value 19
Earnings Measure (EBIT, Net Profit or Return on
Common Equity only) 77
EPS and others 115
Total Shareholder Return 15
Total 883
Table 6.3 presents a breakdown of performance measures and the use of a payout range or
hurdle in RPE and non-RPE based measures. Carter et al. (2009) descriptive statistics show that
a majority of firms select a hurdle over a payout range. In comparison, our descriptive statistics

179
suggest that recently it has become a less common practice to adopt a single performance hurdle
in RPE based plans, as most of these plans select a payout range. In plans with non-RPE
conditions, we observe that some firms employ a single performance hurdle or “underpin”
terminology. Generally, an underpin measure is used in conjunction with another performance
measure and the firm needs to achieve both performance metrics in order for executives to vest
their equity, as shown in Table 6.3.

180
Table 6.4: Industry breakdown of comparator groups which incorporate RPE conditions
Table 6.4 summarises the comparator groups used by firms in long-term incentive plans to benchmark-relative performance. Some firms in our sample use
more than one long-term incentive plan, resulting in 1291 long-term incentive plans in 809 firm-year observations. More than 70% of Oil and Gas and
Telecommunication firms pick bespoke/self-selected peers to measure relative performance, while Industrial firms predominantly pick FTSE 250 UK firms as
a relative benchmark. In the Financials sector, 47 out of the 150 RPE plans aspire to compare with sector plus index category in financials’ industry. One likely
interpretation for this is that the fluctuations in Real Estate and Financial industries can be best filtered out using the analogous index and industry performance.
Overall, 42% of plans incorporate self-selected peers (bespoke) in relative performance contingencies.
Index FTSE
51-130
FTSE
Small
Cap
FTSE All
Share FTSE 250 FTSE 350 FTSE 100 Sector
Sector +
Index Bespoke Total
Basic Resources 7 - 4 21 2 7 22 6 40 109
Consumer Goods 7 - 7 23 9 5 5 5 73 134
Consumer Services - 8 - 44 23 25 20 49 83 252
Financials - - - 7 3 10 3 47 88 158
Industrials 20 22 7 117 5 27 4 42 131 375
Oil and Gas - - - 4 - 7 - 1 60 72
Technology - - - 15 12 2 - 10 7 46
Telecommunications 3 - - - 5 - - - 20 28
Utilities 9 - - 7 - 24 4 - 20 64
Healthcare - 13 - 10 - 6 3 - 21 53
46(4.6%) 43(3.3%) 18(1.3%) 248(19.2%) 59(4.6%) 113(8.7%) 61(4.7%) 160(12.4%) 543(42.1%) 1291

181
Table 6.5: Breakdown of sector and index peer groups in RPE plans
Index
FTSE 100 88 FTSE 100 excl. financial firms 25
FTSE 51-150 33 FTSE 51-150 (excl. investment trusts) 13
FTSE Small Cap 16 FTSE Small Cap (excl. investment trusts) 27
FTSE All Share 18
FTSE 250 (excl. financial, insurance and
investment trusts) 5
FTSE 250 118 FTSE 250 (excl. investment trusts) 107
FTSE 250 (excl. financial companies) 10
FTSE 250 (excl. financial and investment
trusts) 8
FTSE 350 41 FTSE 350 (excl. investment trusts) 13
FTSE 350 (excl. financial companies) 5 FTSE Morgan Stanley/HSBC Index 10
FTSE Global Index 5
The above table illustrates the breakdown of sector and index comparator groups used to
benchmark relative performance and is a sub-category of sector and index peers used in Table
6.4. We note that some plans explicitly use a named index while others prefer to select
constituents of the index (e.g. FTSE 51-150). However, 19.2% of firms in their plans compare
their own performance relative to the FTSE 250 companies which is the most popular category
to benchmark relative performance. This clearly shows that there is diversity in the selection of
peers when evaluating the relative performance of the company. In contrast to Pass et al. (2000),
the descriptive statistics of this study reveal that firms which employ a broader market index
category (e.g. FTSE 100 or 250), often choose to exclude financial firms from their peer group.
Sector
FTSE Pharma and Biotech 4 FTSE Travel and Leisure 21
FTSE Oil and Gas 5 FTSE Mining and Oil 12
FTSE REIT 10 FTSE Beverages 7
FTSE Electricity 6
Sector plus Index FTSE All Share Tech Index 3 FTSE World Media Index 10
FTSE All Share Media Index 17 FTSE 350 Support Services 15
FTSE 350 Real Estate Index 47 FTSE World Technology Index 10
FTSE 350 Industrials 15 FTSE 350 Mining Companies 5
FTSE 350 General Retailers 18 FTSE 350 Travel and Leisure 2
FTSE Global Telecom 5 FTSE 100 Tech-mark Index 7
FTSE Global Mining Index 10
Dow Jones U.S. Oil Equipment Index and
STOXX Europe Oil Equipment and Services
sector index. 5

182
An exclusion of certain comparator group from the index appears to be a recent practice within
the pay-setting process. Further, 8.7% firms benchmark their performance against the FTSE
100 in determining the level of executive pay in their plans. A small proportion of these, 3.3%,
benchmark their performance against the FTSE Small Cap Index. Lastly, firms in the Financial
and Consumer Services industries (e.g. Media, Real Estate) evaluate performance relative to
sector peers. This suggests that the firms in these industries filter out shocks using industry
relative performance.
Table 6.6 below shows the breakdown by industry of the firms that employ outperformance
plans and plans with upper quintile or decile performance for maximum award payout. We find
that around 62% of plans in the Basic Resources industry and 58% of the financial firms adopted
plans where the maximum payout is not triggered at the traditional 75th percentile ranking. This
suggests that financial firms select tighter performance conditions than other industries.
Additionally, 48% of firms in the Utility industry use plans with relative performance
contingencies which set its maximum payout as different from the traditional upper quartile.
We note that all RPE firms set their initial threshold target at the median performance which
must, first, be attained if at all, any rewards are to vest. Finally, Columns Avg_ RPE_IV and
Avg_RPE_UQV suggest that the average percentage of equity vesting at 50th percentile and
upper quartile percentile ranking vary by industry and some industries set lower initial vesting
target than others, such as financial or basic materials.

183
Table 6.6: Breakdown by industry of plans with non-traditional relative percentile ranking for maximum payout and percentage vesting at initial and upper
quartile percentile rankings set by RPE firms.
Note: No. stands for the number of RPE-based plans. “80th PR” indicates the number of plans where the maximum payout is at the upper quintile performance levels (80th percentile ranking).
“90th PR” indicates the number of plans where the maximum payout is at the upper decile performance levels (90th percentile ranking). “OP over Median” indicates the number of plans where
the required firm performance should be above the median performance plus an additional percentage growth p.a. to receive the maximum payout. “OP over Index” indicates the number of
plans where the required firm performance should be above the index plus an additional percentage growth p.a. to reward the maximum payout. “% of plans” indicates the total number of
plans where the maximum payout is only awarded when maximum performance is different from the traditional upper quartile (75th percentile) in RPE based plans. “Avg_RPE_IV” indicates
the average percentage of initial vesting after achieving median performance (i.e. the 50th percentile ranking) by industry. “Avg_RPE_UQV” indicates the average percentage of equity which
vests once the firm achieves upper quartile percentile ranking in each specific industry.
Industry No. 80th PR 90th PR % OP over
Median
% OP over
Index
Total no.
of plans
% of
plans Avg_RPE_IV Avg_RPE_UQV
Basic Resources 109 6 10 12 40 68 62.4% 25.2% 95.0%
Consumer Goods 134 0 10 8 10 28 20.9% 25.9% 94.0%
Consumer Services 252 50 18 7 27 102 40.5% 25.9% 96.0%
Financials 158 31 0 11 49 91 57.6% 24.8% 95.6%
Industrials 375 18 9 43 18 88 23.5% 27.4% 97.8%
Oil and gas 72 7 8 20 0 35 48.6% 27.9% 91.5%
Technology 46 6 12 0 0 18 39.1% 30.0% 96.7%
Telecom 28 6 0 0 0 6 21.4% 31.6% 98.4%
Utilities 64 0 2 21 8 31 48.4% 25.7% 96.5%
Healthcare 53 8 0 3 0 11 20.8% 26.0% 96.0%
Total 1291 132(10.2%) 69(5.3%) 125(9.6%) 152(11.7%) 478

184
6.5 Empirical Strategy
6.5.1 Data Coding
The hypothesis we test in our analysis is whether firms subject to greater common risk affect
the likelihood of choice of performance type. Our dependent variable consists of three different
categories. Each year firms face the choice of performance metrics in their long-term incentive
plans. The strategic choice of firm i as Yi=j, where j is equal to {0, 1, 2}. Accordingly, we test
this using a multinomial logit model, in which the dependent variable, namely, the choice of
performance standard consists of three different categories: we code (absolute and relative
measures jointly) as category 0, absolute measures only as category 1 and relative measure
exclusively as category 2. The values allocated to performance standards only indicate different
choices, and the ordinal value has no meaning.
6.5.2 Empirical Model
Multinomial Logit Model
Let Pi,j be the probability that the ith firm chooses performance standard j , given by
, , ,Pr( ) for , {0,1,2}i j i j i kP R R k j j , (6.2)
where Ri,j is the maximum utility attainable for firm i if it chooses performance measure j. Then,
𝑅𝑖𝑗= 𝛽′𝑗𝑋𝑖, ε𝑖𝑗
where Xi is a vector of firm characteristics. βj is the vector of corresponding coefficients.

185
If the stochastic terms εi,j are independent and identically distributed, and follow the Weibull
distribution, then the probability of performance standard can be modelled by the multinomial
logit model:
Pr(𝑌𝐼=𝑗) =𝑒
𝛽′𝑗𝑋𝑖
∑ 𝑒𝛽′𝑗𝑋𝑖2
𝑗=0
(6.3)
In this model, we use the firms that employ absolute and relative measures jointly as the base
category and normalise the corresponding coefficient β0 = 0. Hence, the probability of having
absolute and relative performance measures across their long-term incentive plan is given by:
Pr(𝑌𝑖=0) =1
1+∑ 𝑒𝛽′𝑗𝑋𝑖2
𝑗=1
(6.4)
Moreover, the probability of absolute measure only and relative measure only is given by:
Pr(𝑌𝑖=𝑗) =𝑒
𝛽′𝑗𝑋𝑖
1+∑ 𝑒𝛽′𝑗𝑋𝑖2
𝑗=1
for j = 1 and 2 (6.5)
The explanatory variables consist of common risk, industry concentration, and set of control
variables. Following Gong et al. (2011) and Gao et al. (2017), we proxy for firm characteristics
using market to book, dividend yield and sales. We also include board size, non-executive
directors and institutional ownership as proxies for corporate governance characteristics.
The multinomial logit model can be seen as simultaneously estimating a binary logit model
comparing among the dependent categories and reference category (Long, 1997). When
estimating a multinomial logit model, we need to select a reference category to which the
estimate coefficient will relate.
The results from the model will tell us whether the type of performance type is influenced by
common risk where Xi is a vector of firm characteristics. Our model is therefore:

186
, 1 , 1 2 , 1
3 , 1 1 4 ,
i , t-1
1 ,
i ,
1
t
1
Prob. of Performance Type Common Risk Industry Concentration
Sales MTB Corporate Governance Variables
n control variable
j t i t i t
p
i t i t j i t
j
for firm i at time period t, where ɛi,t is the error term (6.6)
6.5.3 Data Sources, Sample Construction, and Variable Definition
6.5.3.1 Independent Variables
The sample consists of all constituents of the FTSE 350 UK index from 2010 to 2014. Total
shareholder returns and industry-adjusted returns are derived from the Datastream Return
Index. The corporate governance data which includes board size and number of independent
directors is extracted from Datastream and Bloomberg, respectively. Data for institutional
ownership has been gathered from Fame. Definitions for all the variables used are included in
Appendix to Chapter 6.
6.5.3.2 Dependent Variables
Sample Construction
Data on executive compensation characteristics has been hand-collected from annual reports.
Following Gong et al. (2011), if the firm states that one long-term incentive plan is evaluated
based on firm performance relative to the peer group, and an additional long-term incentive
plan is determined on an absolute measure, then we code this under the category of absolute
and relative measure jointly. Similarly, if the firm employs relative measures across their long-
term equity plans, the firm is identified as an RPE firm exclusively. We exclude plans that are

187
one-off (e.g. recruitment plans) or plans with no performance conditions attached. This study
considers long-term incentive plans that were active and in use for the given period of study.
This analysis is performed at the firm level.
Four variables are used to study plan-level characteristics of RPE. Peer Group Choice is an
indicator variable that equals 0 if the plan uses a pre-defined index such as the FTSE 350 or
250 for its comparator group, and 1 if the plan selects custom peers as comparator group, and
2 if the plan includes sector peers as a comparator group. RPE_IV is the percentage of equity
vesting set by the firms after achieving median percentile performance. RPE_UQV is the
percentage of equity vesting target set by the firms after achieving upper quartile percentile
ranking. Finally, “target spread” is the difference between the maximum and median percentile
rankings relative to peers in order for vesting to occur.
6.5.4 Variable Classification
For common risk proxies, namely, beta, R-squared and correlation, we run separate multinomial
logit regressions by estimating three models separately. These regressions are categorised in
columns named ‘‘Market’’, ‘‘Industry’’ and ‘‘Supersector’’ and indicate that the common risk
variables are calculated using benchmark returns from the FTSE 350, the appropriate industry
or supersector index respectively. The common risk variables in Table 6.8 are labelled as
“Common risk_industry”, which is calculated using benchmark returns within each FTSE ICB
Industry, “Common risk_market”, which is calculated using benchmark returns from the FTSE
350 and “Common risk_ supersector”, which is calculated using benchmark returns within each
FTSE ICB Supersector.

188
6.5.5 Descriptive Statistics
Following Tables 6.7 and 6.8, provide a descriptive statistic of the main variables and
correlation matrix of independent variables used in the regression model.
Table 6.7 shows that the maximum value and standard deviation of beta_industry and
beta_super sector are greater than beta_market; this implies that industry and supersector
market returns are more volatile than the market. Average institutional ownership is 25% with
a maximum value of 74%. The main objective for long-term incentive plans is to achieve long-
term goals for the company (Mallin, 2007). However, surprisingly, in the US, greater numbers
of firms still grant time-contingent shares. The UK adopted long-term incentive schemes before
the US and share vests after three years, once the plan has been devised. Over time, the level of
detail and complexity in the design of long-term incentive pay has increased considerably.
Consistent with Ozkan (2007). The minimum value of board size is 5, with a mean of 9.3.
Finally, the average value of the percentage of independent directors is 58%.

189
Table 6.7: Descriptive statistics for the independent variables. (Variables are defined in the Table
A. 6.1 in the Appendix to Chapter 6)
Variables Mean Std. Dev Min Max
R-square_Market 0.29 0.18 0.00 0.78
Beta_Market 0.86 0.46 0.02 2.78
Corr_Market 0.49 0.19 0.00 0.93
R-square_Industry 0.33 0.25 0.00 0.97
Beta_Industry 0.87 0.48 0.01 3.33
Corr_Industry 0.52 0.47 0.00 0.96
R-square_Supersector 0.33 0.22 0.00 0.96
Beta_Supersector 0.88 0.49 0.01 3.14
Corr_Supersector 0.59 0.48 0.00 0.94
Ind_Con 0.19 0.18 0.04 1.00
Multiple plans 0.35 0.47 0.00 1.00
Ln_Sales 14.21 1.75 5.0 19.7
Board_Size 9.28 2.26 5.00 17.00
% of Ind_Directors 0.58 0.11 0.25 0.79
MTB 2.81 7.60 0.10 25.00
Instit_Own 0.30 0.11 0.10 0.74
Adj_Ret 0.30 0.66 -0.89 1.63
Div_Yld 3.20 2.18 0.00 11.46
Before proceeding to the regression analysis stage, Table 6.8 presents correlation matrix for all
independent variables. Common risk is positively correlated with the dividend yield, indicating
that firms having more volatile returns than the market, industry and super sector are more
likely to pay higher dividends. In addition, firms subject to greater common risk have lower
growth opportunities. Wooldridge (2010) and Gujarati (2004) suggest that multicollinearity
might threaten the coherence of the regression analyses if correlation exceeds 80%. In this
study, none of the correlation magnitudes of independent variables is greater 30%, and thus, we
infer that multicollinearity should not be an issue. Correlations between common risk_mrk,
common risk_ind, and common risk_sup are blank since these variables are not used in the
same regression.

190
Table 6.8: Correlation matrix of Independent Variables
.
(1) (2) (3) (4) (5) (6) (7) (8) (9) (10) (11) (12)
(1) Common risk_mrk 1
(2) Common risk_ind 1
(3) Common risk_sup
1
(4) Board_Size -0.04** -0.07* -0.05* 1
(5) Ind_Directors -0.03 -0.01 -0.01 0.14*** 1
(6) Ln_Sales 0.06 0.06 0.09 0.25* 0.27 1
(7) Div_Yld 0.14** 0.23** 0.21* -0.06* 0.00 -0.13* 1
(8) MTB -0.06 -0.01 0.01 0.03 -0.02 -0.03 0.14* 1
(9) Multiple 0.05* 0.09* 0.12* 0.06* 0.16 0.12* 0.03 0.07 1
(10) Instit_Own 0.03 -0.01 -0.01 0.13 -0.04** -0.11 -0.01 -0.02 0.00 1
(11) Ind_Con -0.11 -0.20 -0.20 0.06 -0.01 0.15 -0.07* -0.04* 0.06* -0.03 1
(12) Adj_Ret 0.02 0.06 0.06 -0.06 -0.11** 0.09* -0.05* -0.07 -0.06* -0.04 0.01 1

191
6.6 Empirical Results
6.6.1 Multinomial Logistic Regression
Panel A of Table 6.9 reports results of the multinomial logit model with three performance
standards. The R2 of 0.16 is in line with previous studies conducted by Carter et al. (2009) and
Gong et al. (2011). The results in Column 2 demonstrate that firms which share greater common
risk with their market peers are significantly more likely to prefer RPE exclusively over the
joint use of relative and absolute measures in their long-term incentive plans. This is consistent
with the intuition that firms select RPE-based conditions exclusively when they face greater
common risk with peers. Similarly, firms subject to higher levels of common risk are
significantly less likely to adopt absolute measures than the alternative absolute and relative
measure jointly in compensation contracts. As shown in Table 6.5, industry and supersector
also represent potential peers for relative evaluation purposes. Subsequently, we also estimate
separate models using industry beta and supersector beta to compute common risk, and the
results in Columns 3 to 6 of Panel A in Table 6.9 reinforce our previous finding that companies
aim to filter exogenous shocks in selecting performance standards in executive compensation
contracts.
Column 1 shows that the coefficient of sales is positive and significant, implying firms with
higher sales are more likely to employ absolute measures exclusively. One interpretation of this
finding is that large firms have a more complex business structure with various segments which
could make the selection of similar peer group difficult. Thus, they prefer to implement absolute
growth measures, which can be further evidenced from the insignificant association between
sales and the exclusive use of RPE in Column 2. The results in Column 1 also show that as
board size increases, the likelihood of selecting absolute measures decreases in comparison to

192
the alternative of absolute and relative measures jointly. Additionally, the coefficent of board
size is positive but statistically insignificant for the likelihood of the selection of relative
measures over reference category. This suggests that firms with larger boards prefer to, at least,
include relative measures in a compensation contract. The coefficients for independent directors
are negative and significant for both the likelihood of selecting the absolute measures
exclusively and relative measures exclusively. These results indicate that firms with a higher
percentage of independent directors prefer to employ both relative and absolute measures
signifying better corporate governance, leading to effective monitoring of compensation
packages.
Further, we also detect a negative relationship between the percentage of institutional
ownership and the selection of RPE exclusively. That is, there exists a significant probability
that as institutional ownership increases, the multinomial log odds for preferring relative
measures exclusively over the alternative of absolute and relative jointly decreases. This gives
an indication of good corporate governance, in that a greater presence of institutional owners
leads to a greater use of both relative and absolute measures in compensation contracts.
Evidence for the effective monitoring role of institutional investors has been observed in
previous UK studies (e.g. Ozkan, 2007).
Concerning market to book ratio, the coefficient is negative and significant in determining
relative measures exclusively, showing that firms with greater market growth opportunities are
less likely to use RPE exclusively relative to the base category. This result is in line with the
study by Albuquerque (2009), which argues that RPE is less beneficial for firms with higher
growth opportunities. The coefficient on multiple plans is negative and significant for the
likelihood of RPE selection exclusively (-1.29, p-value<0.01), and the likelihood of absolute

193
measure exclusively (-0.65, p-value<0.01) compared to firms that do not award RPE. This
suggests that firms which award multiple plans are less inclined to employ relative or absolute
measures exclusively over the alternative base category. One interpretation is that firms employ
a mix of relative and absolute performance targets if they operate multiple long-term incentive
plans.
Firms from more highly concentrated industries are less likely to implement RPE in all of their
grants relative to base category. This finding is consistent with Carter et al. (2009), suggesting
that firms in more concentrated industries do not prefer to employ RPE exclusively as a
performance standard.
Turning now to industry-specific factors, the reference category used is the “consumer services”
group. Based on the results in Column 2, firms in Basic Resources, Oil and Gas, Technology,
Telecommunications and Utilities are more likely to select relative measures exclusively than
firms in the consumer services industry. The choice of performance category is not influenced
by year specific dummies.
Table 6.9: Multinomial logistic model estimating the probability of performance standards
in compensation contracts
Panel A: Multinomial logistic model predicting various performance standards in compensation
contracts with common risk, multiple plans, board size, institutional ownership, independent
directors, multiple plans, market to book ratio, industry-adjusted returns, industry concentration,
and corporate governance variables. Significance levels are indicated by ***p < 0.01(1%), **p <
0.05(5%) and *p < 0.1(10%), based on robust standard errors and are reported in parentheses.
Definition of all variables used in this study is included in Appendix A to Chapter 6. Base
Category: Absolute and RPE measure jointly.

194
Model 1 Model 2 Model 3
Variable Absolute RPE
exclusively
Absolute RPE
exclusively
Absolute RPE
exclusively exclusively exclusively exclusively
(1) (2) (3) (4) (5) (6) Market Market Industry Industry Supersector Supersector
Common_Risk -0.498*** 0.753*** -0.510** 0.769*** -0.274 0.677*** (0.184) (0.180) (0.218) (0.266) (0.216) (0.260)
Board_Size -0.976** 0.293 -0.924** 0.355 -0.893** 0.326 (0.404) (0.551) (0.408) (0.554) (0.406) (0.544)
Ind_Directors % -0.022** -0.030*** -0.025** -0.031*** -0.025** -0.030*** (0.010) (0.011) (0.010) (0.011) (0.010) (0.011)
Ln_Sales 0.208*** -0.081 0.205*** -0.081 0.204*** -0.087 (0.063) (0.087) (0.063) (0.087) (0.063) (0.087)
Div_Yld -0.009 -0.007 -0.007 -0.022 -0.018 0.001 (0.051) (0.058) (0.050) (0.061) (0.049) (0.058)
MTB -0.015 -0.053** -0.015 -0.056*** -0.014 -0.054** (0.012) (0.021) (0.012) (0.021) (0.012) (0.021)
Multiple -0.647*** -1.293*** -0.645*** -1.191*** -0.660*** -1.205*** (0.191) (0.261) (0.189) (0.251) (0.190) (0.250)
Instit_Own % -0.005 -0.029*** -0.005 -0.030*** -0.005 -0.029*** (0.006) (0.011) (0.006) (0.011) (0.006) (0.011)
Ind_Con 0.646 -3.583*** 0.451 -3.838*** 0.481 -4.312*** (1.114) (1.263) (1.094) (1.250) (1.104) (1.249)
Adj_Ret 0.157 0.146 0.142 0.096 0.114 0.100 (0.253) (0.302) (0.254) (0.287) (0.249) (0.287)
Industry
Basic Resources -0.942* 1.998*** -1.195** 2.548*** -1.148** 2.588*** (0.501) (0.518) (0.474) (0.478) (0.469) (0.475)
Consumer Goods -0.511 -0.075 -0.580* 0.052 -0.555* 0.043 (0.325) (0.451) (0.326) (0.450) (0.330) (0.451)
Financials -0.016 -0.268 -0.223 0.021 -0.132 -0.112 (0.288) (0.426) (0.290) (0.422) (0.288) (0.418)
Industrials -0.368 -2.662*** -0.458* -2.633*** -0.439 -2.772*** (0.270) (0.599) (0.269) (0.591) (0.268) (0.602)
Oil & Gas -2.497** 1.829*** -2.746*** 2.201*** -2.706*** 2.225*** (1.056) (0.522) (1.035) (0.520) (1.046) (0.518)
Technology 0.316 0.864 0.235 1.079* 0.228 1.135** (0.403) (0.572) (0.400) (0.560) (0.398) (0.556)
Telecommunications -1.597** 2.018** -1.690** 2.360*** -1.520** 2.321*** (0.778) (0.786) (0.773) (0.786) (0.770) (0.791)
Utilities -1.942** 1.783*** -1.950** 2.134*** -1.777** 2.009*** (0.806) (0.499) (0.810) (0.528) (0.803) (0.522)
Year
2010 0.123 -0.050 0.114 -0.053 0.106 -0.069 (0.277) (0.361) (0.274) (0.352) (0.272) (0.353)
2011 0.007 -0.111 -0.012 -0.147 0.011 -0.198 (0.270) (0.380) (0.270) (0.363) (0.270) (0.363)
2012 0.147 -0.072 0.107 -0.045 0.115 -0.029 (0.271) (0.370) (0.272) (0.363) (0.271) (0.360)
2013 0.072 -0.206 -0.111 -0.052 -0.045 -0.088 (0.278) (0.379) (0.288) (0.389) (0.287) (0.386)
Constant 0.638 2.107 0.874 2.075 0.607 2.303* (1.035) (1.402) (1.058) (1.393) (1.047) (1.390)
Observations 894
894
894
Log likelihood -675 -679 -683
Pseudo R-squared 0. 17 0.15 0.16

195
6.6.2 Marginal Effects
In addition to multinomial logit coefficient and the levels of significance, we also present
marginal effects, evaluated at the mean, of a change in the independent variable (Table 6.9,
Panel B). The marginal effects display the relative importance of each explanatory variable in
predicting the probability of event occurrence. For a dummy variable, marginal effects show
by how much the probability of performance choices will change for shift in the dummy
variable from 0 to 1; however, for a continuous variable, they show how much the probability
will change with a one-unit change in the value of the independent variable.
Panel B of Table 6.9 reports the marginal effects of multinomial logistic regression. Column 2
shows that one unit increase in common risk_market is associated with a 6.0 percent increase
in the probability of incorporating RPE exclusively in their long-term incentive plans. By
contrast, the results in Column 1 reveal that one-unit increase in common risk_market results
in a 9.6 percent decrease in the probability of selecting absolute measure exclusively. To look
more specifically at the joint use of RPE and absolute measure sample, according to Column 7,
a one-unit increase in common risk_market results in a 3.6 percent increase in the likelihood of
selection of relative and absolute measures jointly. These results are in line with our hypothesis
and show that firms filter common shocks and yield a more informative measure to assess
agents’ performance.
Column 1 reveals that the estimated marginal effect of sales is 0.036, implying that an increase
of 1 unit in log sales raises the probability of the absolute measure in compensation contracts
by 3.6 percentage points. However, the marginal effect of institutional ownership (column 7,
absolute and relative measure jointly) is 0.002, which indicates that the probability of absolute

196
and relative measure selected increases by 0.2 percent for a 1-unit increase in institutional
ownership. In addition, greater board size and percentage of independent directors are also
associated with adoption of absolute and relative measures jointly. However, the magnitude of
the board size coefficient is higher, where the marginal effect of board size shows that an
increase in one unit of board size will increase the probability of absolute and relative measures
jointly by 13.4 percent (column 7). These results may be interpreted as evidence that board
members and independent directors provide monitoring role on the choice of performance
standards in compensation contracts.
In regard to marginal effects of the coefficient on multiple plan dummy in Column 7, the
probability of firms choosing absolute and relative measures jointly in multiple plans is 16.7%
higher respectively than firms which do not operate multiple equity plans. In Column 1,
concerning industry dummies, the probability of employing the absolute measure exclusively
reduces by 27.1%, 24.7% and 25.6% in the Oil and Gas, Telecommunications and Utility
industries, respectively compared to the Consumer Services group, demonstrating that firms
prefer not to employ absolute measures within these industries. Also, only Industrials firms
employ absolute and relative measures jointly in compensation contracts. The marginal effects
for firms with higher industry betas display larger positive coefficients than that of firms with
higher market beta as shown in Columns 2 and 4. This suggests that there is greater likelihood
that firms with highly volatile industry returns filter out common shocks than for firms with
highly volatile market returns.

197
Table 6.9: Marginal effects of impact of common shocks on performance standards
Panel B: Marginal effects of common risk, multiple plans, board size, institutional ownership,
independent directors, multiple plans, market to book ratio, industry-adjusted returns, industry
concentration, and corporate governance variables on different performance standards in
compensation contracts. Marginal effects represent the effect of a unit change in the variable on
the probability of an outcome (RPE exclusively, absolute exclusively, and RPE and absolute
measures jointly). Significance levels are indicated by ***p < 0.01(1%), **p < 0.05(5%) and *p
< 0.1(10%), based on robust standard errors and are reported in parentheses.
Model 1 Model 2 Model 3
Variable Absolute RPE
exclusively
Absolute RPE
exclusively
Absolute RPE
exclusively exclusively exclusively exclusively
(1) (2) (3) (4) (5) (6) Market Market Industry Industry Supersector Supersector
Common_Risk -0.096*** 0.060*** -0.100*** 0.062*** -0.059 0.052*** (0.030) (0.014) (0.037) (0.019) (0.037) (0.019)
Board_Size -0.170** 0.036 -0.164** 0.040 -0.159** 0.038 (0.067) (0.038) (0.069) (0.038) (0.069) (0.038)
Ind_Directors % -0.003** -0.002** -0.004** -0.002** -0.004** -0.002** (0.002) (0.001) (0.002) (0.001) (0.002) (0.001)
Ln_Sales 0.036*** -0.009 0.036*** -0.009 0.037*** -0.009 (0.010) (0.006) (0.011) (0.006) (0.011) (0.006)
Div_Yld -0.001 -0.000 -0.001 -0.001 -0.003 0.000 (0.008) (0.004) (0.008) (0.004) (0.008) (0.004)
MTB -0.002 -0.003** -0.002 -0.004*** -0.002 -0.004** (0.002) (0.001) (0.002) (0.001) (0.002) (0.001)
Multiple -0.089*** -0.079*** -0.091*** -0.072*** -0.094*** -0.073*** (0.032) (0.021) (0.032) (0.020) (0.032) (0.020)
Instit_Own % -0.000 -0.002*** -0.000 -0.002*** -0.000 -0.002*** (0.001) (0.001) (0.001) (0.001) (0.001) (0.001)
Ind_Con 0.167 -0.257*** 0.140 -0.273*** 0.155 -0.310*** (0.185) (0.088) (0.184) (0.088) (0.187) (0.089)
Adj_Ret 0.024 0.008 0.023 0.004 0.018 0.005 (0.042) (0.020) (0.042) (0.019) (0.042) (0.019)
Industry
Basic Resources -0.210*** 0.392*** -0.263*** 0.513*** -0.259*** 0.533*** (0.049) (0.104) (0.042) (0.089) (0.041) (0.087)
Consumer Goods -0.092* 0.005 -0.113* 0.017 -0.106* 0.017 (0.055) (0.039) (0.058) (0.037) (0.058) (0.039)
Financials 0.003 -0.020 -0.047 0.007 -0.025 -0.005 (0.059) (0.031) (0.058) (0.032) (0.059) (0.031)
Industrials -0.046 -0.085*** -0.070 -0.072*** -0.063 -0.079*** (0.051) (0.022) (0.053) (0.019) (0.052) (0.020)
Oil & Gas -0.271*** 0.382*** -0.305*** 0.456*** -0.298*** 0.474*** (0.041) (0.108) (0.039) (0.106) (0.038) (0.105)
Technology 0.032 0.086 0.007 0.109 -0.001 0.125 (0.083) (0.073) (0.084) (0.074) (0.082) (0.078)
Telecom -0.247*** 0.416** -0.281*** 0.481*** -0.268*** 0.480*** (0.046) (0.176) (0.046) (0.172) (0.048) (0.173)
Utilities -0.256*** 0.364*** -0.285*** 0.430*** -0.272*** 0.408*** (0.042) (0.103) (0.043) (0.111) (0.045) (0.110)
Year-specific effects Yes
Yes
Yes
Observations 894
894
894

198
Table 6.9. Panel B- continued
Definition of all variables used in this study is included in Appendix A to Chapter 6.
Model 1 Model 2 Model 3
Variable Absolute &
RPE jointly
Absolute &
RPE jointly
Absolute &
RPE jointly
(7) (8) (9) Market Industry Supersector
Common_Risk 0.036* 0.038* 0.007 (0.021) (0.022) (0.039)
Board_Size 0.134* 0.124* 0.122 (0.072) (0.074) (0.074)
Ind_Directors % 0.005*** 0.005*** 0.005*** (0.002) (0.002) (0.002)
Ln_Sales -0.028** -0.028** -0.027** (0.012) (0.012) (0.012)
Div_Yld 0.002 0.002 0.003 (0.009) (0.009) (0.009)
MTB 0.005* 0.005* 0.005* (0.003) (0.003) (0.003)
Multiple 0.167*** 0.163*** 0.167*** (0.035) (0.035) (0.035)
Instit_Own % 0.002** 0.002** 0.002* (0.001) (0.001) (0.001)
Ind_Con 0.090 0.133 0.155 (0.197) (0.196) (0.198)
Adj_Ret -0.032 -0.027 -0.023 (0.045) (0.045) (0.045)
Industry
Basic Resources -0.181* -0.250*** -0.274*** (0.103) (0.090) (0.087)
Consumer Goods 0.086 0.095 0.089 (0.062) (0.063) (0.064)
Financials 0.017 0.040 0.030 (0.060) (0.061) (0.061)
Industrials 0.132** 0.142*** 0.142***
(0.053) (0.054) (0.054)
Oil & Gas -0.111 -0.152 -0.176 (0.111) (0.109) (0.108)
Technology -0.118 -0.116 -0.124 (0.091) (0.091) (0.091)
Telecom -0.168 -0.200 -0.211 (0.169) (0.164) (0.164)
Utilities -0.108 -0.144 -0.136 (0.107) (0.115) (0.114)
Year-specific effects Yes Yes Yes
Observations 894 894 894

199
6.6.3 RPE Plan Characteristics
6.6.3.1 Peer Group Choice
The previous tests confirm the association between common risk and choice of RPE plan, but
they do not shed light on characteristics of the RPE plans themselves. One key RPE
characteristic is the comparator group used to evaluate relative performance. Firms can select
different peer groups, with RPE theories proposing that the choice of peer group should be
based on their ability to filter common risk. We now turn our attention to the issue of peer group
selection, and the focus will be on RPE based plans for the remainder of the study. As shown
in Table 6.5, peer group choices consist of three categories: index, custom peers (self-selected
peers), and sector peers. The dependent variable used in this study is nominal and consists of
three independent choices which cannot be ordered in a meaningful way. Thus, similar to the
previous section, we perform multinomial logistic regressions to examine peer group choices,
with a reference category against which to test. Here, we choose the reference category as the
use of a broad index as a peer group in long-term incentive plans. We control for plan types by
using dummies; dummy option is equal to one if the company grants only options in their
compensation contract, and zero otherwise. The dummy for matching plans is constructed in a
similar way.
, 1 , 1 2 , 1
3 , 1 1 4 , 1 , 1
i , t-1 i , t
1
Prob. of RPE Peer Group Choice Common Risk Industry Concentration
Sales MTB Corporate Governance Variable
n control variable
s
j t i t i t
p
i t i t j i t
j
(6.6)
for firm i at time period t, where ɛi,t is the error term.

200
The results are presented in Table 6.10 and use similar independent variables to the previous
section. Column 1 reveals that firms subject to high levels of exogenous shocks are significantly
less likely to select custom peers over a predefined index. In Column 2, relating to the selection
of sector peers, we find a negative and highly significant coefficient for common risk_market.
This indicates that firms are less likely to select sector peers, over the alternative of broad index,
when firms have a higher market beta. Both of these findings imply that when companies face
greater common risk with FTSE 350 peers, they are less likely to employ bespoke or sector peer
group relative to broad-based market peer group.
Column 3 shows that firms with highly volatile industry returns are less likely to prefer custom
peers relative to the broad index category. This result suggests that market indices do a better
job in filtering common risk if shocks are specific to the industry or supersector, consistent with
Carter et al. (2009). However, in Columns 4 and 6, the coefficients for common risk_industry
and common risk_supersector are positive but statistically insignificant for the likelihood of
selection of sector peers. This indicates that firms with higher market or sector beta do not
influence the selection of sector peer group. This is puzzling since we expect firms with greater
common risk with sector peers should opt for sector category as opposed to broad index.
Albuquerque (2009) argues that if external shocks are industry specific then broad index is not
appropriate peer group, which is in line with what we expected. By contrast, our results show a
positive but insignificant relationship between common risk_industry and sector peer selection.
To conclude, these results show mixed support for theories that firms select peer group in such
a manner to filter shocks from their relative performance.

201
Interestingly, the coefficients for sales show positive and significant association for both the
likelihood of custom and sector peer group selection over the alternative broad index category.
One possible interpretation of this association is that larger firms have a more complex business
structure with many dimensions and the constituents of the market index (FTSE 350) are very
different in their business operations as opposed to sector or custom peers. Thus, large firms do
not select the broader index as an appropriate peer group, instead of selecting custom or sector
peers to evaluate firm’s performance. In Column 2, there is a significantly negative relationship
at the 5% level between the probability of sector peer selection and the percentage of
independent directors, implying firms with a greater proportion of independent directors are
less likely to favour sector peers over the broad index category. This preference for broad index
as a comparator group against which they benchmark firm’s performance could be due to their
limited understanding of the complexities involved in selection of peer group. Overall, we find
little evidence that corporate governance characteristics impact the choice of peer group in RPE
based contracts.
The coefficients for industry concentration are negative and significant for both the likelihood
of custom and sector peer selection, suggesting that firms in more concentrated industries prefer
to select a broad index relative to the other two categories. With respect to the multiple plan
dummy, we find a positive and significant coefficient which indicates that companies which
operate multiple plans are more likely to use sector peers than firms that grant single plans. This
may be because firms grant multiple plans in order to select several peer groups to evaluate the
performance of executives. The coefficients of year dummy indicate insignificant associations
between different peer group choices. However, this result is not surprising, since we have
already noted earlier in Table 6.9 that the choice of RPE also does not vary significantly with

202
time. This implies that peer group choices and the selection of RPE are not influenced by year
specific dummies.
Overall, these results show some evidence of an association between common shocks and peer
group selection. Regarding corporate governance characteristics, there is evidence that
independent directors monitor the choice of the peer group in RPE based plans.
Table 6.10: Multinomial logistic model estimating the probability of peer group choices in
compensation contracts
Multinomial logistic model predicting peer group choices in compensation contracts with common
risk, multiple plans, board size, institutional ownership, independent directors, multiple plans, market
to book ratio, industry-adjusted returns, and industry concentration. Significance levels are indicated
by ***p < 0.01(1%), **p < 0.05(5%), *p < 0.1(10%), based on clustered standard errors at the RPE
firm level and are reported in parentheses. Definition of all variables used in this study is included in
Appendix A to Chapter 6.
Base Category: RPE Peer Group Choice (Broad Index)
Model 1 Model 2 Model 3
Custom
Peers
Sector
Peers
Custom
Peers
Sector
Peers
Custom
Peers Sector Peers
(1) (2) (3) (4) (5) (6)
Variable Market Market Industry Industry Supersector Supersector
Common_Risk -0.693*** -0.572** -0.854*** 0.167 -0.740*** 0.113
(0.223) (0.232) (0.250) (0.274) (0.254) (0.292)
Board_Size -0.414 -0.687 -0.537 -0.357 -0.458 -0.413 (0.575) (0.642) (0.582) (0.664) (0.581) (0.657)
Ind_Directors % 0.016 -0.023** 0.011 -0.025** 0.011 -0.025** (0.011) (0.011) (0.011) (0.011) (0.011) (0.011)
Ln_Sales 0.294*** 0.229** 0.274*** 0.195** 0.274*** 0.198** (0.102) (0.098) (0.100) (0.097) (0.100) (0.097)
Div_Yld -0.077 -0.074 -0.065 -0.111 -0.079 -0.107 (0.056) (0.071) (0.058) (0.069) (0.057) (0.071)
MTB 0.011 -0.001 0.012 0.000 0.012 -0.000 (0.011) (0.008) (0.011) (0.008) (0.011) (0.008)
Multiple 0.122 0.541** 0.091 0.563** 0.116 0.547** (0.222) (0.247) (0.222) (0.248) (0.220) (0.248)
Instit_Own % -0.268 1.009 -0.037 1.011 -0.113 1.038 (1.159) (1.286) (1.152) (1.286) (1.147) (1.275)
Ind_Con -10.334*** -9.402*** -9.716*** -8.168*** -9.193*** -8.365*** (1.783) (2.065) (1.725) (2.054) (1.638) (2.031)
Adj_Ret -0.585* -0.325 -0.539* -0.334 -0.563* -0.334 (0.306) (0.358) (0.318) (0.355) (0.314) (0.359)
Industry
Basic Resources 2.566*** 3.461*** 2.001*** 2.678*** 1.932*** 2.728***

203
(0.708) (0.703) (0.625) (0.596) (0.626) (0.604)
Consumer Goods 2.092*** 1.691*** 2.014*** 1.524*** 1.986*** 1.504*** (0.397) (0.544) (0.403) (0.536) (0.396) (0.537)
Financials 1.014** 1.691*** 0.843* 1.568*** 0.962** 1.548*** (0.425) (0.432) (0.430) (0.447) (0.427) (0.435)
Industrials -1.516*** -2.016*** -1.416*** -2.065*** -1.314*** -2.084*** (0.348) (0.426) (0.346) (0.431) (0.337) (0.427)
Oil & Gas 1.980*** 17.666*** 1.909*** 17.638*** 1.701*** 17.719*** (0.474) (0.747) (0.482) (0.723) (0.454) (0.722)
Technology -0.447 2.549*** -0.642 2.123*** -0.759 2.168*** (1.188) (0.655) (1.196) (0.649) (1.190) (0.649)
Telecommunications 3.044*** 3.972*** 2.814*** 3.741*** 2.811*** 3.770*** (0.913) (1.002) (0.883) (1.002) (0.886) (1.008)
Utilities 0.134 1.790*** 0.105 1.929*** 0.234 1.933*** (0.673) (0.599) (0.682) (0.605) (0.680) (0.606)
Year
2010 0.200 0.257 0.211 0.199 0.218 0.182 (0.321) (0.392) (0.324) (0.396) (0.320) (0.396)
2011 -0.008 0.264 0.003 0.315 0.048 0.284 (0.316) (0.381) (0.319) (0.380) (0.317) (0.382)
2012 -0.297 0.261 -0.316 0.285 -0.346 0.299 (0.319) (0.378) (0.319) (0.385) (0.320) (0.384)
2013 -0.512 0.053 -0.623* 0.152 -0.591* 0.130 (0.349) (0.395) (0.351) (0.403) (0.349) (0.401)
Options -0.531 0.461 -0.855* 0.484 -0.772 0.474 (0.444) (0.397) (0.499) (0.414) (0.483) (0.412)
Matching plans 1.452*** 1.134* 1.389** 1.298** 1.400*** 1.283**
(0.539) (0.592) (0.541) (0.584) (0.537) (0.584)
Constant -1.504 0.632 -0.690 -0.269 -1.050 -0.100 (1.619) (1.830) (1.605) (1.822) (1.590) (1.798)
Plan types dummies Yes Yes Yes
Observations 672
672
672
Log likelihood
-551 -545 -549
Pseudo R-squared 0.16 0.16 0.16
6.6.3.2 Initial and Maximum Threshold Vesting
Previous research by Zakaria (2012) revealed that firms tended to employ single performance
hurdles to achieve a maximum payout in UK compensation contracts. By contrast, the present
study finds that firms rarely use performance hurdles in compensation contracts, as depicted in
the descriptive statistics in Table 6.1. This infrequent use of single performance hurdles sheds

204
light on the optimal contracting approach since Brennan (2001) shows that firms’ inclusion of
performance hurdles in performance-vested equity grants is unlikely to be considered as
optimal, as performance hurdles is a fixed point and not a range. Therefore, even if firms include
a performance hurdle, they will still employ another performance measure which will include
a payout range as shown in Section 5.6.
Carter et al. (2009) show that there exists a variation in the percentile ranking that must be
attained for initial rewards to vest. By contrast, the descriptive statistics of our present study
reveals that firms usually incentivize executives at median (50th percentile ranking)
performance and this remains unchanged. Nonetheless, there exist variations which belong to
the maximum performance required to achieve full reward. The vesting levels at minimum
threshold can vary from 0% to 50% for different firms. Hence, we investigate the determinants
of vesting of equity at initial and upper quartile performance thresholds.
We now progress to examining the differences in the payout structure of RPE plans, using OLS
regression models with industry and time dummies. We perform this analysis at the plan level,
as individual plan characteristics can vary, and in our estimation, standard errors are clustered
by firm.
, 1 , 1 2 , 1
3 , 1 1 4 , 1 , 1
i , t-1 i
1
, t
RPE Plan Characteristics Common Risk Industry Concentration
Sales MTB Corporate Governance Variables
n control variable
i t i t i t
p
i t i t j i t
j
(6.7)
The results in Panel A of Table 6.11 demonstrate that the coefficient on common risk is negative
and statistically significant at the 1% level in determining the percentage of equity vesting at
the initial threshold. This indicates that firms facing greater common risk tend to employ
tougher conditions by setting lower percentage of equity vest at median percentile ranking.

205
Concerning corporate governance variables, firms with a greater percentage of independent
directors also tend to set lower vesting levels at or above median performance. This suggests
that independent directors play a monitoring role which is not just limited to the selection of
RPE or peer group. On the other hand, firms which grant multiple plans employ higher levels
of initial equity vesting at median performance. One possible explanation is that firms with
multiple long-term incentive plans set different performance metrics, and thus, they do not
employ tougher performance conditions than firms which operate a single plan in their long-
term incentive plan.
To investigate the determinants of vesting at upper quartile performance, we exclude plans
where the required firm performance should be above the median plus an additional percentage
growth p.a. and the plans where the required performance should be above the Index plus an
additional percentage growth p.a. over a three-year period to receive the maximum payout. In
these plans, performance targets are determined ex-post and remain unknown. This is because
it is nearly impossible to work out the required performance which would result in percentage
vesting at the upper quartile.
In Panel B of Table 6.11, we show that the coefficient of common risk is negatively related to
the percentage of equity vesting at the 75th percentile ranking, indicating that firms which face
greater common risk tend to employ lower vesting levels at upper quartile percentile ranking.
This suggests that firms opt for tougher performance conditions by operating outperformance
plans that have a maximum reward at the upper quintile or decile, and also indicates that firms
have shifted away from traditional benchmarking evaluation, where the maximum reward is at
the 75th percentile. Multiple plans, on the other hand, are not associated with the percentage of
equity vesting at upper quartile percentile ranking. Firms with higher board size and percentage

206
of independent directors employ a lower percentage of equity vesting at the upper quartile
threshold. These findings suggest that the board and independent directors play a monitoring
role in compensation contracts.
6.6.3.3 Target Spread
The results discussed above indicate that common risk and corporate governance factors impact
the percentage of equity vesting set at median and upper quartile percentile rankings. However,
they do not consider these threshold targets for vesting to occur. The current study also observes
variations in threshold targets, most of which belong to maximum performance required to
achieve full vesting.
Another important RPE characteristic is the target spread, that is, the difference between the
maximum and minimum percentile rankings for vesting to occur, in order to evaluate relative
performance. Typically, the initial and maximum percentile rankings are the 50th percentile
(median) and the 75th percentile (upper quartile) respectively, with a target spread of 25. The
target spread for firms with a maximum percentile ranking of 80th percentile (upper quintile)
is therefore 30. Hence, the target spread is greater in firms, where the percentile ranking
required for maximum vesting is at the upper quintile or decile than firms which opt for
maximum vesting at the traditional upper quartile percentile ranking. There exists greater
diversity in the maximum percentile ranking at which the maximum possible reward is paid
out, as observed in Table 6.6.
The spread relates to the performance target (percentile ranking), and the equity payout
corresponds to the achievement of percentile ranking. If the main aim of the target setting is to

207
incentivize executives, then we would expect a greater target spread. Companies with a wider
performance spread and a lower percentage of equity vesting at initial or upper quartile
performance target are considered to have challenging performance conditions. Here, we are
keen to explore whether there exists a relationship between the spread and the impact of
common shocks. Similar to the previous section, we employ an OLS regression model, with
standard errors robust to clustering at the firm level.
The results in Column 1 and 2 of Table 6.11 (Panel C) demonstrate that the coefficient on the
target spread is positive and statistically significant at 10% level. This result infers weak
evidence of the existence of a relationship between the spread and common risk. Meanwhile,
in Column 3, the coefficient on common risk_supersector are found to be insignificantly
associated with the spread. This finding contrasts with the previous empirical evidence reported
by Carter et al. (2009), who find that the spread is negatively associated with common risk. It
could be argued that characteristics of RPE have been changed in the meantime, so that the
firms, now, tend to operate plans with maximum payout at upper quintile or decile percentile
rankings. At the same time, firms employ fewer single performance hurdles in their long-term
incentive plans. Due to different settings, the previous results cannot be generalized. The
coefficient on board size is positive and statistically significant at the 5% level, implying that
firms with a larger board size use tougher performance criteria by setting wider target spreads.
This is in line with the view that larger boards provide more effective monitoring of the design
of compensation packages as they tend to have larger remuneration committees.
The results in the previous section indicate that firms which operate multiple equity plans for
their executives tend to set higher levels of equity vesting at the initial performance threshold.
However, multiple plans have no significant effect on the target spread. Finally, we detect a

208
significant relationship between sales and target spread. These results are similar to those using
a percentage of equity vesting at the initial threshold as a dependent variable but in opposite
directions, implying that firms with higher sales tend to select tougher performance conditions.
To sum up, these results clearly suggest the impact of common risk and corporate governance
variables on characteristics of RPE. However, institutional ownership does not influence the
characteristics of RPE.
6.6.4 Robustness Tests
In this section, we subject the results presented in a variety of robustness tests, all of them
available in the Appendix to Chapter 6. In order to study the determinants of RPE selection, we
also use alternative proxies for common risk (correlation and R-squared) as shown in Table
A.6.1 and Table A.6.2 in the Appendix to Chapter 6. The results reinforce our main findings
and show a positive association between common risk and firms’ selection of RPE. As observed
in Chapter 5, some consultants prefer to select certain performance measures. Hence, we also
control for the identity of the remuneration consultant in determining the selection of RPE-
based compensation contracts. In Table A.6.3 in the Appendix to Chapter 6, the reference group
used in the present study for the identity of the remuneration advisor is “HNBS”. The main
results remain statistically significant between the choice of RPE plan and common risk. In
addition, we find that firms which appoint Deloitte, Kepler, Mercer and Towers Watson as
remuneration advisors are more likely to employ absolute measures relative to the remuneration
advisor “HNBS”. This suggests the presence of institutional isomorphism in performance
standards of compensation contracts.

209
Table 6.11
Panel A: Regressions of impact of common risk on Initial Vesting
This table represents the estimation of results for percentage of vesting level occurring at minimum performance, as
set by the firms against common risk, multiple plans, board size, institutional ownership, independent directors,
multiple plans, market to book ratio, industry-adjusted returns and industry concentration. The dependent variable is
RPE_IV. This table presents the results of OLS with industry and time dummies. Significance levels are indicated by
***p < 0.01(1%), **p < 0.05(5%), *p < 0.1(10%), based on clustered standard errors at the RPE firm level and are
reported in parentheses. Definition of all variables used in this study is included in Appendix A to Chapter 6.
(1) (2) (3)
Variables Market Industry Supersector
Common_Risk -2.393*** -2.109** -2.168** (0.898) (1.034) (1.036)
Board_Size 1.319 1.471 1.460 (2.535) (2.548) (2.535)
Ind_Directors % -0.107** -0.105** -0.106** (0.050) (0.050) (0.049)
Ln_Sales 0.044 -0.005 0.005 (0.324) (0.325) (0.324)
Div_Yld -0.471** -0.413* -0.441** (0.227) (0.222) (0.219)
MTB -0.015 -0.015 -0.015 (0.023) (0.024) (0.023)
Multiple 2.333** 2.383** 2.469*** (0.929) (0.925) (0.914)
Instit_Own % 0.01 0.008 0.007 (0.022) (0.023) (0.023)
Ind_Con -1.478 -1.908 -1.481 (5.415) (5.223) (5.034)
Adj_Ret -0.504 -0.576 -0.573 (0.761) (0.735) (0.726)
Industry
Basic Resources 5.454* 4.565* 4.589* (2.791) (2.712) (2.703)
Consumer Goods 1.397 1.244 1.343 (1.203) (1.194) (1.182)
Financials -0.0625 -0.772 -0.461 (1.375) (1.267) (1.308)
Industrials 0.449 0.297 0.575 (1.672) (1.617) (1.677)
Oil & Gas 1.719 1.195 1.274 (2.373) (2.308) (2.301)
Technology 3.392** 3.188* 3.248** (1.654) (1.634) (1.639)
Telecommunications 9.553** 9.011* 9.292** (4.610) (4.647) (4.577)
Utilities 0.170 0.113 0.470 (1.595) (1.511) (1.531)
Year
2010 0.299 0.373 0.423 (0.444) (0.464) (0.467)
2012 -1.377* -0.130 -0.021 (0.713) (0.455) (0.443)
2013 -0.824 -0.567 -0.653 (0.568) (0.541) (0.559)
2014 -1.582** -1.397** -1.355* (0.675) (0.683) (0.687)
Constant 32.02*** 31.95*** 31.71*** (6.011) (5.972) (6.002)
Plan types dummies Yes Yes Yes
Observations 672 672 672
R-squared 0.218 0.214 0.215

210
Table 6.11
Panel B: Regressions of impact of common risk on Upper Quartile Vesting
This table represents the estimation of results for percentage of vesting level which occurs at upper quartile performance as
set by the firms against common risk, multiple plans, board size, institutional ownership, independent directors, multiple
plans, market to book ratio, industry-adjusted returns, and industry concentration. The dependent variable is RPE_UQV
This table presents the results of OLS with industry and time dummies. Significance levels are indicated by ***p <
0.01(1%), **p < 0.05(5%), *p < 0.1(10%), based on clustered standard errors at the RPE firm level and are reported in
parentheses. Definition of all variables used in this study is included in Appendix A to Chapter 6.
(1) (2) (3)
Variable Market Industry Supersector
Common_Risk -2.820** -3.412** -3.447** (1.116) (1.418) (1.380)
Board_Size -4.511** -5.867*** -5.878*** (2.095) (2.102) (2.119)
Ind_Directors % -0.143** -0.140** -0.139** (0.0671) (0.0678) (0.0675)
Ln_Sales -0.812** -0.742* -0.730* (0.377) (0.377) (0.375)
Div_Yld -0.359 -0.317 -0.362 (0.223) (0.246) (0.229)
MTB 0.0583 0.066 0.068 (0.0541) (0.053) (0.051)
Multiple 0.275 0.237 0.337 (1.031) (1.033) (1.038)
Instit_Own % 0.012 0.015 0.014 (0.040) (0.039) (0.040)
Ind_Con -4.442 -4.487 -3.784 (8.422) (8.497) (8.268)
Adj_Ret 1.059 1.212 1.178 (0.959) (0.968) (0.966)
Industry
Basic Resources 5.492 3.635 3.634 (3.441) (3.355) (3.357)
Consumer Goods 3.870 3.739 3.907 (2.796) (2.835) (2.844)
Financials 4.551** 3.646* 4.157* (2.091) (2.161) (2.114)
Industrials 3.452 3.288 3.743* (2.126) (2.187) (2.161)
Oil & Gas 3.640 2.537 2.737 (3.725) (3.475) (3.462)
Technology 4.227 3.950 4.039* (2.560) (2.559) (2.433)
Telecommunications 6.314 5.290 5.775 (3.965) (3.938) (3.950)
Utilities 6.561*** 5.410** 6.212** (2.493) (2.448) (2.405)
Year
2010 -0.00562 -0.231 -0.171 (0.681) (0.652) (0.653)
2012 0.482 0.456 0.583 (0.455) (0.467) (0.475)
2013 0.931 0.672 0.525 (0.628) (0.635) (0.612)
2014 0.561 -0.273 -0.199 (0.816) (0.864) (0.857)
Constant 128.1*** 130.6*** 130.1*** (7.354) (7.371) (7.328)
Plan types dummies Yes Yes Yes
Observations 530 530 530
R-squared 0.226 0.232 0.232

211
Table 6.11
Panel C: Regressions of impact of common risk on Target Spread
This table represents the estimation of results for different between minimum and maximum threshold performance target
against common risk, multiple plans, board size, institutional ownership, independent directors, multiple plans, market to
book ratio, industry-adjusted returns and industry concentration. The dependent variable is RPE_Spread. This table presents
the results of OLS with industry and time dummies. Significance levels are indicated by ***p < 0.01(1%), **p < 0.05(5%),
*p < 0.1(10%), based on clustered standard errors at the RPE firm level and are reported in parentheses. Definition of all
variables used in this study is included in Appendix A to Chapter 6.
(1) (2) (3)
Variable Market Industry Supersector
Common_Risk 0.754* 0.815* 0.917
(0.402) (0.432) (0.674)
Board_Size 2.170** 2.492** 2.470**
(1.091) (1.073) (1.085)
Ind_Directors -0.025 -0.025 -0.024
(0.034) (0.034) (0.034)
Ln_Sales 0.524** 0.508** 0.504**
(0.231) (0.227) (0.229)
Div_Yld -0.057 -0.052 -0.044
(0.127) (0.139) (0.133)
MTB -0.019 -0.021 -0.022
(0.035) (0.034) (0.034)
Multiple 0.425 0.477 0.446
(0.634) (0.632) (0.641)
Instit_Own 0.010 0.009 0.009
(0.013) (0.013) (0.013)
Ind_concent -6.821** -7.249** -7.398**
(3.204) (3.290) (3.320)
Adj_Ret -0.543 -0.603 -0.602
(0.650) (0.702) (0.715)
Industry
Basic Resources 2.322* 2.982** 2.993**
(1.379) (1.233) (1.265)
Consumer Goods -1.839 -1.764 -1.792
(1.215) (1.238) (1.242)
Financials -2.873** -2.700** -2.792**
(1.256) (1.238) (1.235)
Industrials -2.698*** -2.743*** -2.847***
(0.837) (0.853) (0.845)
Oil & Gas -1.182 -0.813 -0.848
(1.458) (1.343) (1.350)
Technology -0.718 -0.507 -0.487
(1.101) (1.061) (1.056)
Telecommunications 1.487 1.805 1.701
(1.720) (1.669) (1.709)
Utilities -1.149 -0.684 -0.846
(1.956) (1.761) (1.767)
Year
2010 0.386 0.488 0.483
(0.520) (0.517) (0.520)
2012 -0.294 -0.319 -0.345
(0.491) (0.498) (0.495)
2013 0.0778 0.133 0.195
(0.522) (0.528) (0.533)
2014 -0.0207 0.170 0.182
(0.621) (0.644) (0.643)
Constant 17.52*** 17.00*** 17.02***
(3.735) (3.807) (3.755)
Plan types dummies Yes Yes Yes
Observations 530 530 530
R-squared 0.146 0.147 0.149

212
6.6.5 Actual Equity Vesting Percentages
Our next objective is to analyze the impact of different RPE plan characteristics on percentage
of equity vesting. This analysis sheds light on the issue whether peer groups and other
characteristics of the plan are chosen in a manner such as to attain greater vesting, resulting in
greater executive compensation.
Table 6.12: Effect of RPE characteristics on percentage of equity vesting
Table 6.12 provides descriptive information on actual vesting of the number of plans for
different RPE characteristics which are as follows: RPE peer group, target spread which is the
difference between maximum and median percentile ranking, and initial vesting at median and
vesting at upper quartile percentile ranking.
Panel A: Peer Group
Peer Group Total
Plans
Targets
not achieved Targets achieved
% of plans
achieving target
Index 270 165 105 38.8%
Sector 48 39 9 18.7%
Custom 247 183 64 25.9%
Peer
Group
Equity Vesting
Ranges
No. of
plans
Peer
Group
Equity Vesting
Ranges
No. of
plans
Peer
Group
Equity
Vesting
Ranges
No. of
plans
Index Peers 0.00% 165
Sector
Peers
0.00% 0 Bespoke
peers 0.00% 183
0.01%-25.00% 1 0.01%-25.00% 3 0.01%-25% 3
25.01%-50.00% 14 25.01%-50.00% 22 25.01%-50% 8
50.01%-75.00% 82 50.01%-75.00% 1 50.01%-75% 53
75.01%-100.00% 8 75.01%-
100.00% 0 75.01%-100% 0

213
Panel B: Target Spread
Spread Total Plans Targets not
achieved Targets achieved
% of plans
achieving target
25.00-29.99 457 275 182 40.00%
30.00-34.99 65 52 13 18.5%
35.00-39.99 43 35 8 18.6%
Panel C: Initial Vesting
IV Total Plans Targets not
achieved Targets achieved
% of plans
achieving target
0.00%-10.00% 9 7 2 22.2%
10.01%-20.00% 59 38 21 35.5%
20.01%-30.00% 443 316 127 28.6%
30.01%-40.00% 29 20 9 31.0%
40.01%-50.00% 25 12 13 52.0%
Spread Equity Vesting
Ranges
No.
of
plans
Spread Equity Vesting
Ranges
No.
of
plans
Spread Equity Vesting
Ranges
No. of
plans
25.00-
29.99 0.00% 257
30.00-
34.99 0.00% 42
35.00-
39.99 0.00% 35
0.01%-25.00% 0 0.01%-25.00% 2 0.01%-25.00% 1
25.01%-
50.00% 0 25.01%-50.00% 10 25.01%-50.00% 7
50.01%-
75.00% 168 50.01%-75.00% 1 50.01%-75.00% 0
75.01%-
100.00% 14 75.01%-
100.00% 0 75.01%-
100.00% 0

214
IV Equity Vesting
Ranges
No. of
plans IV
Equity
Vesting
Ranges
No. of
plans IV
Equity
Vesting
Ranges
No. of
plans
0.00%-
10.00% 0.00% 7
10.01%-
20.00% 0.00% 38
20.01%-
30% 0.00% 316
0.01%-25.00% 0 0.01%-25% 0 0.01%-25% 0
25.01%-50.00% 2 25.01%-50% 11 25.01%-50% 14
50.01%-75.00% 0 50.01%-75% 10 50.01%-75% 110
75.01%-100.00% 0 75.01%-100% 0 75.01%-100% 2
IV Equity Vesting
Ranges
No. of
plans IV
Equity Vesting
Ranges
No. of
plans
30.01%-40.00% 0.00% 20 40.01%-50.00% 0.00% 12
0.01%-25.00% 1 0.01%-25.00% 5
25.01%-50.00% 0 25.01%-50.00% 0
50.01%-75.00% 6 50.01%-75.00% 0
75.01%-100.00% 2 75.01%-100.00% 8
Panel D: Vesting on achieving upper quartile performance
UQV
Total Plans
Targets not
achieved Targets achieved
% of plans
achieving target
60.01%-70.00% 20 15 5 25.0%
70.01%-80.00% 29 24 5 17.2%
80.01%-90.00% 58 41 17 29.3%
90.01%-100.00% 468 325 143 30.5%
UQV
Equity Vesting
Ranges
No. of
plans UQV
Equity Vesting
Ranges
No. of
plans
60.01%-70.00% 0.00% 15 70.01%-80.00% 0.00% 24
0.01%-25.00% 2 0.01%-25.00% 0
25.01%-50.00% 3 25.01%-50.00% 5
50.01%-75.00% 0 50.01%-75.00% 0
75.01%-100% 0 75.01%-100% 0

215
Table 6.12
Descriptive statistics on the breakdown of different RPE characteristics on targets achieved/ not achieved and
actual range of vesting percentages, after three years, once the plan has been adopted, in long-term incentive plans.
Panel A refers to the RPE characteristic dealing with the breakdown of plans that employ index, custom, and sector
as RPE peer group. Panel B refers to the breakdown of plans which employ different target spread, difference
between the maximum and minimum percentile ranking for initial and maximum vesting to occur in their
compensation contracts. Panel C presents the breakdown of plans which achieve/not achieve median percentile
ranking which, respectively, lead/ not lead to initial vesting as set by the firms. These plans with initial vesting are
further studied on how many of these fall across the range of equity vesting percentages at the end of three years.
Panel D presents the breakdown of plans which vest/ not vest after achieving/not achieving upper quartile
percentile as set by the firms. These plans with upper quartile vesting are further examined on how many of these
fall across the different range of equity vesting percentages at the end of three years. “Targets not achieved”
represents the number of plans that have not achieved any performance target at all. “Targets achieved” represents
the number of plans that have achieved some target for RPE characteristic under consideration. “% of plans
achieving target” refers to the % of plans that have achieved some target for RPE characteristic under
consideration. “No. of plans” refers to the number of plans that have or have not achieved the target and lies in
that specific range for the specific type of RPE characteristic under consideration. “% of plans achieving target”
refers to the % of plans that have achieved some target for RPE characteristic under consideration. “No. of plans”
refers to the number of plans that have or have not achieved the target and lies in that specific vesting range for
RPE characteristic under consideration. “Equity Vesting Ranges” refers to the range at which percentage of equity
vesting occurs depending upon achieving or not achieving the target after three years of the plans’ adoption.
Panel A of Table 6.12 provides a breakdown of RPE characteristics and its effect on equity
vesting. The percentage of equity vesting depends upon the extent to which these performance
criteria are met. Firstly, it clearly indicates that a greater number of firms selecting Index peers
achieve some form of target than the firms selecting bespoke peers. Around 26% of the firms
achieve the minimum performance threshold for bespoke peers as opposed to 39% of firms
which select Index peers. Those achieving the target in the latter category, 78% of the firms lie
between the range of 50% and 75%. This suggests that firms which select FTSE Index as a peer
group not only meet the minimum threshold but also lie at a higher percentile ranking leads
towards greater equity vesting.
UQV Equity Vesting
Ranges No. of
plans UQV
Equity Vesting
Ranges
No. of
plans
80.01%-90.00% 0.00% 41 90.01%-100.00% 0.00% 325
0.01%-25.00% 1 0.01%-25.00% 0
25.01%-50.00% 14 25.01%-50.00% 0
50.01%-75.00% 2 50.01%-75.00% 135
75.01%-100.00% 0 75.01%-100.00% 8

216
Turning towards target spread, another RPE characteristic, Panel B of Table 6.12 shows that
the more difficult the target, i.e. the wider the target spread, the harder it becomes for firms to
achieve greater equity vesting. This is evident from the 80% of firms with target spread in the
range of 30.00% to 34.99% which have not met at least the minimum threshold. This result also
holds true for firms where the target spread is between the range of 35.00% and 39.99%. The
results, therefore, indicate that 40% of firms which select traditional plans with a maximum
performance at the 75th percentile, target spread between 25.00% and 29.99%, have in some
way met their target. Now, of those achieving the performance target, 92% of plans lie in the
range of 50% and 75%. This result implies that easier performance targets are met with greater
ease.
However, we observe on Panel C of Table 6.12, that initial vesting at median percentile ranking
are mostly concentrated in the range between 20.01% and 30%. Of these, 29% of firms have
met the target in some way. Very few plans vest which set initial vesting between the range of
0% and 9.99%. Overall, no fixed pattern has been observed in plans with initial vesting at
median percentile ranking.
Concerning upper quartile vesting in Panel D of Table 6.12, only 21% of firms meet the
performance target which set vesting range of 60% to 80%. However, 31% of firms meet some
form of target with a vesting range of 80% to 100%. This further strengthens our previous
findings from target spread that softer targets are easier to achieve than more difficult targets.
To conclude, the results show that firms which select index as a peer group achieve greater
percentile ranking than firms opting for sector or custom peers. Although the choice of
comparator group is of significance, nonetheless, there also exists considerable difference
within the various characteristics of RPE.

217
6.7 Conclusion
This study examines the explicit use of RPE and peer group choices in a comprehensive sample
of FTSE 350 UK firms from 2010 until 2015. The results from the multinomial logit model
show that common shock influences the choice of absolute measures exclusively and RPE
measures exclusively relative to base category in compensation contracts. These findings are in
line with the predictions of agency theory that firms implement RPE based measures
exclusively when performance metrics contain significant shocks which are common among
peer companies. Additionally, the marginal effects show that common risk influences the
choice of absolute and relative measures jointly (base category) and the results from alternate
proxies (R-squared and correlation) reinforce the agency theory perspective.
Our findings on the choice of peer group show that firms choose broad market peers when
external shocks are mostly dominated by market-specific shocks. On the other hand, if shocks
are industry specific, firms prefer to employ broad market peers instead of opting for sector
peers. Overall, we find mixed results on the associations between common risk and the choice
of peer group.
There exists limited research on the characteristics of long-term incentive plans set by the firms,
such as the target spread, initial threshold vesting, vesting at upper quartile performance and
the choice of the peer group in compensation contracts. We document that firms with higher
level of common risk tend to set tougher performance conditions. These results remain robust
after common risk_industry and common risk_supersector are calculated using benchmark
returns from the appropriate industry or supersector, respectively. However, the evidence

218
related to the effect of common risk on target spread is weak but statistically significant. Taken
together, common shocks influence the characteristics of RPE-based contracts.
Our study is the first to provide a detailed industry breakdown of the various peer group
categories used in relative performance evaluation, as reported in Table 6.4 and Table 6.5. We
find that 42%, 42% and 16% of plans select custom (self-selected), index, and sector peers
respectively, in their equity-based pay. In addition, this study also provides a breakdown of
various outperformance conditions, and percentage of equity vesting at the initial and maximum
threshold by industry. Almost 35% of plans employ performance conditions that have a
maximum reward at upper quintile or decile in RPE-based measures. In contrast to the
descriptive statistics of Carter et al. (2009) and Zakaria (2012), we find a shift in characteristics
and selection of RPE across long-term incentive arrangements of UK firms.
Firms with high sales prefer to employ absolute measures which could be due to large firms
finding it difficult to pick suitable peer groups. Furthermore, large companies also tend to
employ a lower percentage of vesting at upper quartile percentile ranking and wider target
spreads in RPE-based measures.
The board size, role of independent directors, and institutional ownership in determining
performance choices has been an unexplored area. Our study finds that firms with greater
percentage of independent directors are more likely to employ absolute and relative based
measures jointly in compensation contracts. Their greater presence also brings tougher
performance conditions in the form of lower percentage of equity vesting at median and upper
quartile percentile ranking. However, board size has a negative influence on equity vesting at
upper quartile performance and has positive impact on target spread. This implies the existence

219
of active monitoring by independent directors and board members. Although the presence of
institutional investors influences the selection of RPE and absolute measures jointly, their
greater presence is not associated with the RPE characteristics. This shows that institutional
investors have powers to impose RPE preference in long-term incentive plans.
Finally, for the effect of RPE characteristics on equity vesting, we detect that firms which select
Index as a peer group achieve greater equity vesting. For other RPE characteristics set by the
firms, i.e. target spread and equity vesting at upper quartile, the results show that the easier the
target, the more likely it is to be achieved, implying lower target spread and greater equity
vesting at upper quartile percentile ranking.
The main aim of RPE is to filter out common shocks in evaluating the performance of the
company. RPE could also be used opportunistically when firms select inappropriate peers in
evaluating firms’ relative performance or even firms employ RPE based contracts when
absolute measures are more appropriate performance standards. This opportunistic behaviour
leads executives to receive more long-term incentive CEO pay since they are picking such peers
that make the relative performance target easier to meet.

220
APPENDIX TO CHAPTER 6
Variable Definition
This table provides a detailed description of the construction of all the variables used in this
chapter.
Dependent Variables Definition
Performance Standard
0 if long-term incentives consist of both RPE and non-RPE/absolute
measures, 1 if firms’ incentive grants have only RPE condition, and
2 if firms’ incentive grants consist of absolute measure exclusively
Peer Group Choice 0 if firms choose Market Index as a comparator in RPE based plans,
1 if firms select custom peers in RPE plans, and 2 if firms employ
sector peers as a comparator group in RPE based measures
RPE_IV (Initial Vesting) % of initial RPE payout at median performance in RPE plans
ranging from 0 to 50% (0% being the toughest)
RPE_UQV (Upper Quartile Vesting) % of RPE payout at upper quartile percentile ranking in RPE plans
ranging from 50 to 100%
RPE Spread (Target Spread) Spread is the difference between the median and maximum percentile
rankings for vesting to occur

221
Independent Variables Definition
Common Risk (Beta)44
Absolute value of the coefficient on value-weighted
market/industry/supersector returns when regressed on firm-level returns
over prior 48 months
Alternate Proxy 1
Common Risk (R-Square)
R2 of the regression of a firm’s stock returns on value-weighted
Market/industry/supersector returns over prior 48 months
Alternate Proxy 2
Common Risk (Corr)
Absolute correlation of a firm’s stock returns on value-weighted FTSE
ICB Market/industry/supersector index returns over prior 48 months
Instit_Own % The percentage ownership held by the top-four institutional investors
Ind_Directors % Percentage of number of independent directors over total number of
independent directors
Board_Size Total number of directors on board
Ind_Con The sum of the squares of the market shares of the firms’ sales within
each FTSE ICB Industry Classification
MTB Market value of equity/book market of equity
Div_Yld Average dividend yield over the prior 3 years
Adj_Ret Adjusted return is the absolute difference between the firm’s annual stock
returns and the median annual stock returns
Ln_Sales Log of total sales
Multiple 1 refers if more than one performance metric is employed and 0 otherwise
44 Note: All common risk variables are calculated using benchmark returns from the FTSE 350, appropriate
industry or supersector index respectively and are indicated by “Market”, “Industry”, and “Supersector”.

222
Table A.6.1: Robustness Test 1
Multinomial logit model estimating the probability of performance types in compensation
contracts (R-square as proxy of common risk)
Multinomial logistic model predicting various performance standards in compensation
contracts with common risk (R-square), multiple plans, board size, institutional ownership,
independent directors, multiple plans, market to book ratio, industry-adjusted returns, industry
concentration, and corporate governance variables. Significance levels are indicated by ***p <
0.01(1%), **p < 0.05(5%) and *p < 0.1(10%), based on robust standard errors and are reported
in parentheses. For simplicity, we do not report results from industry and time dummies. Base
Category: Absolute and RPE measure jointly.
Model 1 Model 2 Model 3
Variable Absolute RPE
exclusively
Absolute RPE
exclusively
Absolute RPE
exclusively exclusively exclusively exclusively
(1) (2) (3) (4) (5) (6)
Market Market Industry Industry Supersector Supersector
Common_Risk -1.601*** 2.070*** -1.337*** 1.300** -1.491*** 1.290** (0.598) (0.692) (0.499) (0.575) (0.468) (0.582)
Board_Size -0.841** 0.172 -0.801* 0.225 -0.731* 0.213 (0.413) (0.553) (0.412) (0.543) (0.418) (0.544)
Ind_Directors % -0.023** -0.029*** -0.024** -0.028*** -0.024** -0.027** (0.010) (0.011) (0.010) (0.011) (0.010) (0.011)
Ln_Sales 0.225*** -0.113 0.238*** -0.126 0.250*** -0.144 (0.065) (0.090) (0.066) (0.092) (0.067) (0.095)
Div_Yld -0.034 0.036 -0.024 0.023 -0.040 0.037 (0.048) (0.061) (0.047) (0.063) (0.047) (0.064)
MTB -0.014 -0.055** -0.014 -0.055*** -0.014 -0.053*** (0.012) (0.022) (0.012) (0.020) (0.012) (0.020)
Multiple -0.650*** -1.224*** -0.661*** -1.162*** -0.647*** -1.181*** (0.189) (0.263) (0.190) (0.255) (0.189) (0.258)
Instit_Own % -0.005 -0.027** -0.006 -0.028*** -0.006 -0.025** (0.006) (0.011) (0.006) (0.011) (0.006) (0.011)
Ind_Con 0.648 -4.205*** 0.142 -3.941*** 0.649 -4.384*** (1.137) (1.251) (1.105) (1.275) (1.105) (1.227)
Adj_Ret 0.119 0.127 0.095 0.168 0.081 0.196 (0.241) (0.299) (0.238) (0.289) (0.235) (0.294)
Constant 0.398 2.593* 0.210 2.976** 0.179 3.099** (1.029) (1.384) (1.040) (1.377) (1.148) (1.396)
Industry effects Yes Yes Yes
Year-specific effects Yes Yes Yes
Observations 894 894 894
Log likelihood -677
-679
-677
Pseudo R-squared 0.16 0.15 0.15

223
Table A.6.2: Robustness Test 2
Multinomial logit model estimating the probability of performance standards in compensation
contracts (Correlation as proxy of common risk)
Multinomial logistic model predicting various performance standards in compensation contracts
with common risk (correlation), multiple plans, board size, institutional ownership, independent
directors, multiple plans, market to book ratio, industry- adjusted returns, industry concentration,
and corporate governance variables. Significance levels are indicated by ***p < 0.01(1%), **p <
0.05(5%) and *p < 0.1(10%), based on robust standard errors and are reported in parentheses. For
simplicity, we do not report results from industry and time dummies. Base Category: Absolute and
RPE measure jointly.
Model 1 Model 2 Model 3
Variable Absolute RPE
exclusively
Absolute RPE
exclusively
Absolute RPE
exclusively exclusively exclusively exclusively
(1) (2) (3) (4) (5) (6) Market Market Industry Industry Supersector Supersector
Common_Risk -1.605*** 1.942*** -1.343*** 1.412*** -1.301*** 1.232** (0.501) (0.726) (0.491) (0.493) (0.490) (0.417)
Board_Size -0.831** 0.201 -0.821* 0.213 -0.823* 0.253
(0.423) (0.538) (0.422) (0.535) (0.422) (0.531)
Ind_Directors % -0.022** -0.032*** -0.021** -0.031*** -0.021** -0.032***
(0.008) (0.011) (0.008) (0.011) (0.008) (0.011)
Ln_Sales 0.237*** -0.108 0.235*** -0.098 0.236*** -0.084 (0.07) (0.079) (0.070) (0.079) (0.07) (0.079)
Div_Yld -0.0481 0.023 -0.047 0.026 -0.045 0.027 (0.043) (0.058) (0.043) (0.058) (0.043) (0.057)
MTB -0.014 -0.047*** -0.013 -0.047*** -0.012 -0.049*** (0.012) (0.014) (0.012) (0.013) (0.012) (0.01)
Multiple -0.684*** -1.100*** -0.692*** -1.083*** -0.690*** -1.084*** (0.193) (0.276) (0.192) (0.274) (0.193) (0.273)
Instit_Own % -0.002 -0.028** -0.002 -0.029*** -0.001 -0.030***
(0.006) (0.011) (0.006) (0.011) (0.006) (0.011)
Ind_Con 0.580 -4.404*** 0.608 -4.715*** 0.598 -4.884***
(1.276) (1.440) (1.259) (1.435) (1.256) (1.433)
Adj_Ret 0.126 0.195 0.120 0.187 0.125 0.174 (0.239) (0.323) (0.239) (0.319) (0.239) (0.314)
Constant 0.179 2.526* 0.115 2.713* 0.076 2.959** (1.148) (1.508) (1.145) (1.499) (1.142) (1.488)
Industry effects Yes Yes Yes
Year-specific effects Yes Yes Yes
Observations 894 898 894 Log likelihood -680
-684
-683
Pseudo R-squared 0.16
0.15
0.15

224
Table A.6.3: Robustness Test 3
Consultant specific effects
Multinomial logistic model predicting various performance standards in compensation contracts with
common risk, multiple plans, board size, institutional ownership, independent directors, multiple plans,
market to book ratio, industry-adjusted returns, industry concentration, corporate governance variables
and consultant dummies. Significance levels are indicated by ***p < 0.01(1%), **p < 0.05(5%) and *p
< 0.1(10%), based on robust standard errors and are reported in parentheses. For simplicity, we do not
report results from industry and time dummies. Base Category: Absolute and RPE measure jointly.
Model 1 Model 2 Model 3
Absolute RPE
exclusively
Absolute RPE
exclusively
Absolute RPE
exclusively exclusively exclusively exclusively (1) (2) (3) (4) (5) (6)
Variable Market Market Industry Industry Supersector Supersector
Common_Risk -0.578*** 0.741*** -0.560** 0.750*** -0.323 0.648** (0.203) (0.190) (0.225) (0.265) (0.218) (0.256)
Board_Size -1.240*** 0.404 -1.101** 0.446 -1.052** 0.418 (0.432) (0.579) (0.437) (0.579) (0.433) (0.570)
Ind_Directors % -0.029*** -0.031*** -0.033*** -0.031*** -0.033*** -0.030*** (0.010) (0.011) (0.010) (0.011) (0.010) (0.011)
Ln_Sales 0.159** -0.042 0.141** -0.039 0.143** -0.042 (0.069) (0.091) (0.069) (0.091) (0.068) (0.091)
Div_Yld -0.022 -0.014 -0.022 -0.028 -0.034 -0.007 (0.058) (0.055) (0.058) (0.059) (0.056) (0.057)
MTB -0.017 -0.049*** -0.015 -0.053*** -0.014 -0.050*** (0.014) (0.017) (0.013) (0.017) (0.013) (0.017)
Multiple -0.619*** -1.308*** -0.617*** -1.224*** -0.632*** -1.238*** (0.200) (0.254) (0.199) (0.244) (0.201) (0.243)
Instit_Own % -0.005 -0.026** -0.005 -0.028** -0.004 -0.027** (0.006) (0.011) (0.006) (0.011) (0.006) (0.011)
Ind_Con 0.618 -4.055*** 0.415 -4.471*** 0.427 -4.897*** (1.196) (1.337) (1.181) (1.330) (1.226) (1.318)
Adj_Ret 0.254 0.117 0.248 0.093 0.217 0.089 (0.267) (0.304) (0.266) (0.296) (0.262) (0.298)
Advisor
Deloitte 1.607*** -0.504 1.641*** -0.533 1.612*** -0.557 (0.262) (0.405) (0.262) (0.407) (0.260) (0.404)
Kepler 1.175*** 0.241 1.201*** 0.199 1.185*** 0.213 (0.314) (0.322) (0.308) (0.319) (0.309) (0.316)
Mercer 1.712*** -13.575*** 2.121*** -13.498*** 2.048*** -13.488*** (0.611) (0.581) (0.675) (0.600) (0.675) (0.601)
“Others” 0.322 0.322 0.397 0.282 0.357 0.276 (0.389) (0.406) (0.374) (0.403) (0.372) (0.400)
PWC 0.148 -1.424** 0.138 -1.460** 0.124 -1.444** (0.367) (0.696) (0.365) (0.694) (0.364) (0.693)
Towers Watson 0.757** -0.128 0.756** -0.206 0.757** -0.235 (0.321) (0.387) (0.323) (0.391) (0.320) (0.398)
Constant 1.918* 1.549 2.198** 1.506 1.867* 1.689 (1.068) (1.470) (1.102) (1.475) (1.083) (1.477)
Industry Effects Yes Yes Yes
Observations 894
894
894
LR chi2 331*** 323*** 316***
Log likelihood -639 -643 -647
Pseudo R-squared 0.19 0.19 0.19

225
7 SUMMARY AND CONCLUSION
This chapter presents a discussion and the concluding remarks for this research. It consists of
three sections. Section 7.1 briefly summarizes all the all the chapters of the thesis, also bringing
together the empirical results of the studies shown earlier, recognizing the main contribution of
this study and presents the implications for policymakers as well as investors. Section 7.2 points
out the limitations of the present scope of the study. In the end, Section 7.3 suggests the possible
avenues for future empirical enquiry in the area of executive compensation.
7.1 Summary of the Findings
In the recent years, a widespread concern exists about the sustained rise in executive pay that
the media, general public, academia, and legislators argue as having been driven by a growing
complexity in long-term incentives which deviates from shareholder interests. Presently, the
regulatory bodies have led to the transparency in executive compensation packages, which
gives us an opportunity to explore these complex long-term incentive plans in this thesis, also
questioning whether these compensation contracts are designed optimally. Thus, the aim of this
thesis is to extend our knowledge beyond the present understanding of executive compensation
schemes prevalent in the UK by analyzing it from various perspectives as discussed below.
Chapter 1 of the thesis introduces motivations and objectives of this study. At a later part in the
chapter, we discuss the potential contributions of this study and also outline the structure of the
thesis.
Chapter 2 provides a background on the corporate governance regulations in the UK. Then, this
chapter provides the structure of executive compensation contracts and the way these elements

226
of compensation differ from each other. Chapter 3 offers a critical review of the related
literature on executive compensation and performance, discussing the choice of performance,
and the use of relative performance condition in compensation contracts.
Chapter 4, 5, and 6 provide an empirical work which shed light on the pay for performance
relationship using different elements of compensation, the role of performance volatility on the
choice of performance measure, and whether these compensation schemes are formed upon the
informativeness principle.
Chapter 4 examines the association between compensation and firm performance of CEO and
CFO by investigating UK non-financial firms in the FTSE 350 Index over the period 2007 till
2013. One of the main limitations of previous studies on executive compensation is that they
consider only few measures of compensation in their analysis and do not employ the realised
pay, which is what executives receive based on actual performance. In this regard, we examine
the research question by employing four measures of compensation and also takes into account
short-term as well as long-term performance. In investigating pay and performance relationship
we employ fixed effect regression model to examine the impact of performance on the level of
compensation. Our results indicate that there exists a positive association between previous
year’s total shareholder return and different components of CEO pay except for equity pay. The
results are similar in the case of CFO as well. There exists a positive link between all
components of CEO pay and long-term-firm performance but coefficient on long-term firm
performance is higher in determining the equity pay since equity pay is highly sensitive to firm
performance. These results also hold true for CFO but the relationship is not as strong as that
for CEO. Further, this chapter analyses the association between pay and long-term performance
in different numbers, value and types of long-term incentive plans. The findings show that for

227
CEOs, companies that operate one, two or three plans in a compensation package, align the
interests of CEOs with those of the shareholders. However, for CFOs, the greater the number
or amount of LTIPs granted, the higher is the total compensation and realized pay and greater
pay-performance responsiveness. The findings suggest that higher grants will encourage greater
CFO effort, leading to higher compensation. Lastly, for CEO as well as CFO, adopting
performance share plans in the companies’ compensation design leads to a greater alignment
between manager and shareholders’ interests. The pay-performance responsiveness is,
therefore, stronger for CEO than that of CFO. This is because the coefficient of TSR for CEO
is greater than that of CFO when regressed against their respective compensation levels.
Chapter 5 examines the new dataset for a sample of 3400 plans for 400 UK firms from 2007 to
2015. The first part of the chapter explores the link between the volatility and the choice of
performance measure in compensation contracts by taking into account the identity of a
compensation consultant and set of industry-specific controls, following earlier studies (e.g.
Sloan, 1993; Zakaria, 2012; Li and Wang, 2016) which suggest that firms should not employ
volatile performance measure as it reduces the pay-performance sensitivity. More specifically,
we analyze the impact of TSR volatility and EPS volatility on the choice of TSR alone, EPS
exclusively, neither EPS nor TSR, and the joint selection of TSR and EPS performance
categories. We find evidence that the firms with higher volatility prefer to select EPS only and
with lower volatility opt for TSR only plans. However, firms with higher TSR volatility select
plans with EPS and TSR as a performance metric. We employ different proxies of volatility,
for example, basic volatility, cumulative volatility, and industry-adjusted volatility. These
findings remain robust to different proxies of volatility and also after controlling for different
plan categories in compensation contracts. The second part of Chapter 5 provides richer insights

228
on the design of compensation contracts. These descriptive statistics show that the initial and
maximum performance thresholds targets lie in certain ranges in the absence of any government
guidelines, representing a case of mimetic isomorphism. The empirical findings also show that
some consultants devise specific performance metrics to their clients which represent a case of
normative isomorphism. Additionally, firms use different types of EPS and TSR in their
compensation contracts, vesting percentages pertaining to their initial and maximum threshold
targets which are, nonetheless, varied. Finally, we perform a unique investigation of how
performance measures and performance benchmarks influence target attainability in these
contracts. Our findings indicate that some performance metrics make for “softer” targets than
others, where “softer” implies both to EPS and TSR benchmarks.
Chapter 6 investigates whether firms facing greater common risk influences the choice of RPE
in compensation contracts for 350 FTSE UK firms from 2010 to 2015, following earlier studies
(e.g., Carter et al., 2009; Gong et al. 2011). By classifying firms into “RPE only”, “absolute
only” and “absolute and RPE” categories, we are able to show that common risk has a positive
impact on the choice of RPE in compensation contracts. This chapter employs a number of
different proxies of common risk, including market/industry/sector beta- when regressed on
market/industry/sector returns against firm returns. The primary results remain robust in spite
by using r-square and correlation proxies for common risk and are also consistent after
controlling for the identity of the compensation consultant. This chapter also pioneers in
providing rich and up-to-date description on characteristics of RPE plans such as selection of
peer group, the percentage of vesting pertaining to minimum and maximum thresholds by
industry. Further, in Chapter 6, we analyze the characteristics of plans with relative performance
conditions and investigate an impact of common risk on these characteristics. Our findings

229
show that common shock influences the characteristics of relative performance evaluation and
firms tend to select a tougher performance target in the form of plans with a greater spread and
lower percentage of equity vesting at the median or upper quartile percentile ranking. These are
in line with the view that firms which face greater common risk tend to employ tougher RPE
conditions in compensation contracts. Lastly, we investigate the effect of different RPE
characteristics, since there exists the possibility that some of these characteristics are set in a
way that executives attain greater equity vesting, which eventually leads to a higher total
compensation. These findings indicate that plans which opt for Index peers achieve greater
equity vesting in contrast to firms which select custom or sector peers. However, results relating
to target spread and percentage of equity vesting at upper quartile relative performance show
that softer performance targets are met with greater ease.
Institutional investors and regulatory bodies require CEO performance to be determined by the
corporate performance, alongside, having concerns about the effectiveness of LTIPs in the
compensation contract. The results in Chapter 4 addresses these concerns by showing, overall,
that there exists a positive association between pay and performance for CEOs. The findings
further indicate that the granting of greater number of LTIPs provides a stronger pay-
performance association and that CEOs get paid for adding shareholder wealth. Furthermore,
this relationship strengthens as the value of the LTIP grants become more.
The empirical results from Chapter 5 show that in regard to the choice of performance measure,
compensation contracts are designed optimally, as firms choose a performance measure which
is less volatile in nature. As the results indicate, relative to Deloitte, none of the other
consultants shows a preference for the selection of EPS contingent plans. While HNBS, Kepler
and PWC opt for TSR only plans. This indicates that consultants have marked preferences on

230
the choice of performance measure. Also. the descriptive statistics shown in Section 5.6.2.2
reveal that minimum EPS absolute and real growth in RPI range lie in the range of 2% p.a. to
8% p.a. and 2% p.a. to 6% p.a., respectively. While maximum threshold targets lie in the range
of 7% p.a. to 15% p.a. Although, firms are very different and the nature of business model they
operate upon is varied. To date, the Association of British Insurers (2004), now known as IVIS,
has not set any specific remuneration guidelines on the way these performance targets should
be set except that a greater focus has been given on tightening the relationship between pay and
performance by setting sliding scale instead of single performance hurdle as a way of ensuring
performance targets are stretching. Both the results from consultant choice of performance
measure, along with the prevalence of certain performance threshold, offer advice to regulators
by setting at least some form of benchmark criteria in performance measures.
The results from the Chapter 6 indicate that firms tend to employ relative measures when they
face greater common shocks, in line with the informativeness principle. However, results
related to the choice of peer group in compensation contracts are mixed. IVIS guidelines
mention very few technical elements in the evaluation of relative performance with TSR based
measure; firms should avoid taking spontaneous or lengthy averages in the calculation of the
TSR. Further, it only highlights that TSR can be measured against peer group or broad index
category.45 So far, there is no position of regulators on the criteria in which firms select its peers
for relative performance evaluation purposes. If manipulation occurs in the selection of peer
group, then it would potentially render the RPE usage and tougher performance threshold
targets, and lower level of equity vesting percentage meaningless. Thus, we argue that
45 Andrew Ninian (2016), The Investment Association Principles of Remuneration.
https://www.ivis.co.uk/media/12445/Principles-of-Remuneration-2016-Final.pdf
[accessed 20 June, 2017].

231
regulators should provide guidelines in matters related to the selection of peer group, which
could emerge from encouraging firms in analysing prior firm performance relative to its chosen
peers. Additionally, the returns of peer firms’ to be highly correlated with the firm of interest.
In a nutshell, the firms should select such peers that are exposed to common shocks and share
a similar ability to respond to these shocks. Thus, an inappropriate selection of peers which
does not filter common shocks or even the selection of easier threshold targets and their
respective vesting percentages give rise to firms’ opportunistic behaviour to improve their
relative performance of the firm while setting incentive compensation.
In Chapter 4, we find an existence of agency theory in analysing the link between pay and
performance in different settings. The findings in Chapters 5 and 6 indicate an existence of
optimal contracting theory and informativeness principle/agency theory in the choice of
performance measures and the selection of performance standards respectively, in
compensation contracts. Optimal theory argues that compensation contracts are to be formed
optimally. However, informativeness principle contends that firms should opt for performance
measures which truly reflects CEO action and agency theory focuses on closely tying the reward
to actual or perceived firm performance. Taken together, our results in Chapter 4 show that
there exists a positive association between pay and performance. The empirical evidence from
Chapters 5 demonstrates that firms choose less volatility performance measures in
compensation contracts. Chapter 6 results show that firms which face greater common shocks
tend to employ RPE as a performance standard, these RPE firms select greater spread and a
lower percentage of equity vesting when they face greater external shocks. Therefore, these
theories can be tied together as the results show the structure of compensation contracts is
designed optimally in various settings, which is the main aim of contracting.

232
7.2 Limitations of the Findings
Similar to any scholarly study, the results obtained from our empirical analysis are subject to
some limitations. Therefore, we will discuss some limitations of this work.
In Chapter 4, we examine the impact of performance on the level of compensation by
considering different measures of firm performance and components of executive
compensation. In determining the magnitude and structure of executive compensation, there
exists the possibility that other factors, such as CEO/CFO education and qualifications, as a
reflection of boardroom-quality, which are not employed in the current study due to limited
data availability, might effect the outcome of results. Despite this, we factor in a range of control
variables to account for economic and human determinants, for instance, age and tenure of
CEO/CFO etc, in our empirical model which is in line with prior empirical research.
In the empirical section of Chapter 5, we analyse the link between the choice of performance
choices measure and the volatility of EPS and TSR in the construction of CEO compensation
contracts. In our regression model, we control for the identity of remuneration consultant, plan
types, industry, corporate governance variables and firm-specific variables. However, there
exists the possibility that other variables such as the composition of the remuneration committee
and CEO shareholdings in the company, which are not controlled in the current study due to
limited data availability which could potentially influence the choice of EPS and TSR
individually as well as jointly in compensation contracts. We consider other financial categories
such as cash flow and NPV in our empirical analysis. One limitation is that we do not include
non-financial KPI measures in our empirical model since there exist very few firms that employ
KPIs in their equity plans. This could be studied in the future when a greater percentage of firms

233
will start employing KPIs in their LTIPs to analyse whether their inclusion influences the
association between volatility and choice of the performance measure.
The third empirical study in Chapter 6 also focuses on RPE characteristics. These characteristics
of relative based plans may be interlinked with each other, for e.g. if firms lower their vesting
percentage after achieving median percentile performance, they may possibly even lower their
vesting percentage at upper quartile percentile performance, when devising long-term incentive
plans. Hence, future research may use the adequate instruments and estimate a series of
simultaneous equations with several RPE choices as dependent variables, examining the
influence of common risk on these performance threshold targets and their corresponding
vesting percentage, as set by the respective firms.
In all of our three empirical chapters, we also employ several governance proxies, such as board
size, non-executive directors and percentage of institutional ownership in various executive
compensation settings. The collection of data on networks of non- executive directors, such as
number of boards they serve and how their network could reflect their role in this firm is a time-
consuming process as it would have to be hand-collected, thus, potentially posing a limitation
on our findings. For future research, we may examine the characteristics of non-executive
directors and their networks with other companies which could potentially influence the level
of compensation and the design of the compensation contracts.

234
7.3 Suggestions for Future Research
Inevitably, there exists limitation that could be addressed in the future with further empirical
research.
In Chapter 4, we study pay-performance responsiveness for FTSE 350 UK non-financial firms.
Much time has been spent on analysing annual reports to check how many LTIPs are active and
the granted value of these LTIPs which are awarded three-years prior to them being vested.
Nonetheless, we would like to explore the incentive mechanisms and how strongly they are
related with medium and small-sized firms. A greater complexity in the design of compensation
structure and change in market and regulations also means that it is worthwhile to revisit this
analysis at a later point to investigate whether the documented relationships have changed.
These results would not only be of interest to academics but also provide information to
policymakers as to whether a greater number of LTIPs or complex schemes strengthen the
relationship between pay and performance. Moreover, this would shed light on corporate
governance mechanisms and whether they might even have the potential to improve the design
of executive compensation packages.
The results of the descriptive statistics from the second part of Chapter 5 indicate that broadly
speaking, some performance metrics make for “softer” targets than others. It stimulates further
research on what may lead firms to select EPS growth criteria in their long-term incentive plans.
Some studies offer empirical evidence on this issue. For instance, Kim and Yang (2010)
investigate the influence of corporate governance variables on several characteristics of annual
incentive plans for US firms. These annual incentive plans include selection of EPS target and
pay-performance sensitivity. They do not find evidence that corporate governance mechanisms
impact the EPS target. Their descriptive statistics also reveal that EPS targets are set lower than

235
projected by analyst consensus. We would like to extend these studies and focus on whether
previous year’s actual firm EPS, Institutional Brokers' Estimate System (I/B/E/S) EPS
forecasts, historical actual growth of peer firms in the same sector and corporate governance
variables impact the target setting of EPS growth figure for the next year. The limitation of data
access to analysts’ forecast of EPS restricts us from investigating the research questions at this
stage, but we may examine these in the near future.
In Section 6.4, the descriptive statistics reveal that firms vary in their selection of peers in order
to evaluate the relative performance of the firm. We analyze the impact of market, industry and
supersector betas on the selection of industry, sector and custom peer group categories in firms
who employ RPE conditions in Section 6.6.3. As well as looking at these categories, it is worth
exploring in more detail the individual set of firms within these categories. Therefore, we
suggest that future research should analyse the determinants of an individual set of firms who
are selected or not selected for relative performance evaluation purposes from within broad
market index, custom, and sector peer group categories. To measure the common risk of
potential peers with RPE firm of interest, we would capture similarities between the index
membership and industry membership. Along with this, the correlation in stock returns,
difference in beta, and difference in market capitalization between a potential peer and the RPE
firm of interest could also be investigated. This would shed light on the factors which lead RPE
firms to select peer firms in their RPE pool, relative to other candidate firms which are not
selected in RPE pool. This would indicate whether there exists efficient contracting or
managerial self -serving bias in the selection of peer group.
Sections 3.3.3 and 6.1.1 review some previous studies using the implicit method by utilizing
market and/or industry performance to capture peer performance to analyze pay and firm

236
performance relationship and pay and peer performance relationship (Gibbons and Murphy,
1990; Janakiraman et al., 1992). The results from these studies are mixed and inconclusive.
Later studies have employed peer group performance by matching peers using median stock
return in the same size quartile and similar industry (e.g. Albuquerque, 2009). Employing
industry or market peer performance may erroneously effect such studies’ results as not all
firms select industry or market indices as their actual peer group to evaluate relative
performance. Unlike the studies stated above, we employ our current dataset of actual peer
group to capture peer performance instead of assuming market/industry as potential peer for all
RPE firms. For this, we would regress executive pay on the firm performance and executive
pay on actual peer group performance broad market index, custom, and sector peer group
categories, indicating whether incorporating explicit details of actual peer performance
enhances the power of the implicit test to detect RPE use. Additionally, we may compare these
results without incorporating explicit RPE details by using combinations of industry and similar
size matched peers and examine whether these results change by analyzing the full sample of
combination of RPE and non-RPE firms in one sample. Lastly, we would like to extend by
running regression models on separate sub-samples for RPE and non-RPE firms. This may
indicate whether the RPE detection using explicit approach provides a similar evidence on
applying an implicit approach as well. Additionally, the results from separate samples may
point out, if in comparison to non-RPE firms, RPE firms filter out market-wide performance
from executive compensation. If these results hold true, they would be consistent with the
agency theory.
Presently, standard LTIPs are three-year plans which are evaluated and awarded after analysing
the firm performance of three years. However, the new code is up for consultation which

237
suggests that LTIPs should be five to seven years.46 Three-year LTIPs can be a small period to
evaluate the true performance of the company, especially, if executives have just recently joined
the company or implemented major policy changes within the organization. With the suggestion
of longer LTIPs of five to seven years will keep executives to wait for an additional two to four
years. With so much criticism on a standard LTIP model that they are ineffective, it is worth
opting for longer LTIPs to see if they can better align executive pay with long-term
performance. It could also possibly retain executives for a long-time period as well as keep
vested interested in the company and executives can focus on enhancing the share price of the
company which would eventually increase their wealth and that of shareholders. However, it is
difficult to know the true effectiveness of these LTIPs unless they are put into practice.
46 Charlotte Fleck (2017), Putting a lid on the LTIP jar, Governance and Compliance.
https://www.icsa.org.uk/knowledge/governance-and-compliance/features/ltip-long-term-incentive-plan-
executive-pay
[accessed on May 21, 2018].

238
BIBLIOGRAPHY
Aggarwal, R. K., & Samwick, A. A. (1999a). The other side of the trade-off: The impact of risk
on executive compensation. Journal of Political Economy, 107(1), pp. 65-105.
http://www.jstor.org/stable/10.1086/250051
Aggarwal, R. K., & Samwick, A. A. (1999b). Executive compensation, strategic competition,
and relative performance evaluation: Theory and evidence. The Journal of Finance,
54(6), pp. 1999–2043. doi: 10.1111/0022-1082.00180
Albuquerque, A. (2009). Peer firms in relative performance evaluation. Journal of Accounting
and Economics, 48(1), pp. 69–89. https://doi.org/10.1016/j.jacceco.2009.04.001
Albuquerque, A. M., De Franco, G., & Verdi, R. S. (2013). Peer choice in CEO compensation.
Journal of Financial Economics, 108(1), pp. 160–181.
https://doi.org/10.1016/j.jfineco.2012.10.002
Allgood, S., Farrell, K. A., & Kamal, R. (2012). Do boards know when they hire a CEO that is
a good match? Evidence from initial compensation. Journal of Corporate Finance,
18(5), pp. 1051–1064. https://doi.org/10.1016/j.jcorpfin.2012.06.010
Alregab, H. A. (2016). CEO pay: the role of performance, governance and political connection.
School of Management, University of Leicester. https://lra.le.ac.uk/handle/2381/36206
Antle, R., & Smith, A. (1986). An empirical investigation of the relative performance
evaluation of corporate executives. Journal of Accounting Research, 24(1), pp. 1–39.
https://doi.org/10.2307/2490802
Armstrong, C. S., Jagolinzer, A. D., & Larcker, D. F. (2010). Chief executive officer equity
incentives and accounting irregularities. Journal of Accounting Research, 48(2), pp.
225–271. doi: 10.1111/j.1475-679X.2009. 00361.x
Baiman, S., & Demski, J. S. (1980). Economically optimal performance evaluation and control
systems. Journal of Accounting Research, 18, pp. 184–220.
http://www.jstor.org/stable/2490338
Banker, R. D., & Datar, S. M. (1989). Sensitivity, precision, and linear aggregation of signals
for performance evaluation. Journal of Accounting Research, 27(1), pp. 21–39.
doi: 10.2307/2491205
Bannister, J. W., & Newman, H. A. (2003). Analysis of Corporate Disclosures on Relative
Performance Evaluation. Accounting Horizons, 17(3), pp. 235–246.
https://doi.org/10.2308/acch.2003.17.3.235
Barreto, I., & Baden-Fuller, C. (2006). To conform or to perform? Mimetic behaviour,
legitimacy-based groups and performance consequences. Journal of Management

239
Studies, 43(7), pp. 1559–1581. doi: 10.1111/j.1467-6486.2006.00620.x
Barro, J. R., & Barro, R. J. (1990). Pay, performance, and turnover of bank CEOs. Journal of
Labor Economics, 8(4), pp. 448–481. https://doi.org/10.1086/298230
Barty, J., & Jones, B. (2012). Executive Compensation: Rewards for Success Not Failure.
Policy Exchange. https://policyexchange.org.uk/publication/executive-compensation-
rewards-for-success-not-failure/
Bebchuk, L. A., Fried, J. M., & Walker, D. I. (2002). Managerial power and rent extraction in
the design of executive compensation (No. 9068). National Bureau of Economic
Research. http://www.nber.org/papers/w9068
Bebchuk, L. A., & Fried, J. M. (2003). Executive Compensation as an Agency Problem. Journal
of Economic Perspectives, 17(3), pp. 71–92.
https://doi.org/10.1257/089533003769204362
Bebchuk, L. A., & Fried, J. (2004). Pay without performance: The Unfulfilled Promise of
Executive Compensation.
http://www.pay-without-performance.com/Preface%20and%20Introduction.pdf
Bebchuk, L. A., & Fried, J. M. (2005). Pay without performance: Overview of the issues.
Journal of Applied Corporate Finance, 17(4), pp. 8-23. doi: 10.1111/j.1745-
6622.2005.00056.x
Bender, R. (2011). Paying for advice: The role of the remuneration consultant in UK listed
companies. Vand. L. Rev., 64, p. 359.
http://heinonline.org/HOL/LandingPage?handle=hein.journals/vanlr64&div=13&id=
&page=
Benito, A., & Conyon, M. J. (1999). The governance of directors’ pay: Evidence from UK
companies. Journal of Management and Governance, 3(2), pp. 117–136.
https://doi.org/10.1023/A:1009995710541
Berrone, P., & Gomez-Mejia, L. R. (2009). Environmental performance and executive
compensation: An integrated agency-institutional perspective. Academy of Management
Journal, 52(1), pp. 103–126. doi: 10.5465/AMJ.2009.36461950
Bettis, C., Bizjak, J., Coles, J., & Kalpathy, S. (2010). Stock and option grants with
performance-based vesting provisions. The Review of Financial Studies, 23(10), pp.
3849–3888. https://doi.org/10.1093/rfs/hhq060
Bizjak, J. M., Lemmon, M. L., & Naveen, L. (2008). Does the use of peer groups contribute to
higher pay and less efficient compensation? Journal of Financial Economics, 90(2), pp.
152–168. https://doi.org/10.1016/j.jfineco.2007.08.007

240
Bizjak, J. M., Kalpathy, S. L., Li, Z. F., & Young, B. (2016). The role of peer firm selection in
explicit relative performance awards. http://dx.doi.org/10.2139/ssrn.2833309
Black, D. E., Dikolli, S. S., & Hofmann, C. (2016). Peer Group Composition, Peer
Performance Aggregation, and Detecting Relative Performance Evaluation (SSRN
Scholarly Paper No. ID 1910846). Rochester, NY: Social Science Research Network.
https://papers.ssrn.com/abstract=1910846
Brennan, M. J. (2001). Discussion of the pricing of relative performance based incentives for
executive compensation. Journal of Business Finance & Accounting, 28(9-10), pp.
1189–1191. doi: 10.1111/1468-5957.00411
Brick, I. E., Palmon, O., & Wald, J. K. (2006). CEO compensation, director compensation, and
firm performance: Evidence of cronyism? Journal of Corporate Finance, 12(3), pp.
403–423. https://doi.org/10.1016/j.jcorpfin.2005.08.005
Brisley, N. (2006). Executive stock options: Early exercise provisions and risk-taking
incentives. The Journal of Finance, 61(5), pp. 2487–2509. doi: 10.1111/j.1540-
6261.2006.01064.x
Bruce, A., Buck, T., & Main, B. G. (2005). Top executive remuneration: A view from Europe.
Journal of Management Studies, 42(7), pp. 1493–1506.
doi: 10.1111/j.1467-6486.2005.00553.x
Bruce, A., Skovoroda, R., Fattorusso, J., & Buck, T. (2007). Executive bonus and firm
performance in the UK. https://dspace.lboro.ac.uk/dspace/handle/2134/2084
Buck, T., Bruce, A., Main, B. G., & Udueni, H. (2003). Long Term Incentive Plans, Executive
Pay and UK Company Performance. Journal of Management Studies, 40(7), pp. 1709–
1727. doi: 10.1111/1467-6486.00397
Cadbury, A. (1992), The Financial Aspects of Corporate Governance, London: GEE.
Cadman, B., Carter, M. E., & Hillegeist, S. (2010). The incentives of compensation consultants
and CEO pay. Journal of Accounting and Economics, 49(3), pp. 263–280.
https://doi.org/10.1016/j.jacceco.2009.03.002
Câmara, A. (2001). The pricing of relative performance based incentives for executive
compensation. Journal of Business Finance & Accounting, 28(9-10), pp. 1115–1139.
doi: 10.1111/1468-5957.00410
Cao, T., & O’Halloran, G. (2012). CEO Long Term Incentive Compensation Plans and Firm
Performance. International Review of Business Research Papers, 8(7), pp. 1–16.
http://irbrp.com/static/documents/November/2012/1.%20Tongyu.pdf
Carter, M. E., Ittner, C. D., & Zechman, S. L. (2009). Explicit relative performance evaluation
in performance-vested equity grants. Review of Accounting Studies, 14(2-3), pp. 269–

241
306. https://doi.org/10.1007/s11142-009-9085-8
Chemmanur, T. J., Cheng, Y., & Zhang, T. (2010). Why do firms undertake accelerated share
repurchase programs? https://papers.ssrn.com/sol3/papers.cfm?abstract_id=1570842
Clarke, T. (2007). International corporate governance: A comparative approach. Routledge.
Conyon, M. J. (1997). Corporate governance and executive compensation. International
Journal of Industrial Organization, 15(4), pp. 493–509.
https://doi.org/10.1016/S0167-7187(96)01032-6
Conyon, M. J., & Peck, S. I. (1998). Board control, remuneration committees, and top
management compensation. Academy of Management Journal, 41(2), pp. 146–157.
doi: 10.2307/257099
Conyon, M. J., & Murphy, K. J. (2000). The prince and the pauper? CEO pay in the United
States and United Kingdom. The Economic Journal, 110(467), pp. 640–671. doi:
10.1111/1468-0297.00577
Conyon, M. J., Peck, S. I., Read, L. E., & Sadler, G. V. (2000). The structure of executive
compensation contracts: UK evidence. Long Range Planning, 33(4), pp. 478–503.
https://doi.org/10.1016/S0024-6301(00)00054-6
Conyon, M. J., & Sadler, G. V. (2001). Executive pay, tournaments and corporate performance
in UK firms. International Journal of Management Reviews, 3(2), pp. 141–168. doi:
10.1111/1468-2370.00060
Conyon, M. J., Peck, S. I., & Sadler, G. V. (2009). Compensation Consultants and Executive
Pay: Evidence from the United States and the United Kingdom. The Academy of
Management Perspectives, 23(1), pp. 43–55. doi:10.5465/AMP.2009.37008002
Conyon, M. J., Core, J. E., & Guay, W. R. (2010). Are US CEOs paid more than UK CEOs?
Inferences from risk-adjusted pay. The Review of Financial Studies, 24(2), pp. 402–438.
https://doi.org/10.1093/rfs/hhq112
Conyon, M., & Sadler, G. (2010). Shareholder Voting and Directors’ Remuneration Report
Legislation: Say on Pay in the UK. Corporate Governance: An International Review,
18(4), 296–312. https://doi.org/10.1111/j.1467-8683.2010.00802.x
Conyon, M. J. (2014). Executive compensation and board governance in US firms. The
Economic Journal, 124(574), pp. F60–F89. doi: 10.1111/ecoj.12120
Core, J. E., Holthausen, R. W., & Larcker, D. F. (1999). Corporate governance, chief executive
officer compensation, and firm performance. Journal of Financial Economics, 51(3),
pp. 371–406. https://doi.org/10.1016/S0304-405X(98)00058-0

242
Core, J. E., Guay, W. R., & Verrecchia, R. E. (2003). Price versus non-price performance
measures in optimal CEO compensation contracts. The Accounting Review, 78(4), pp.
957–981. https://doi.org/10.2308/accr.2003.78.4.957
Crespı́, R., Garcı́a-Cestona, M. A., & Salas, V. (2004). Governance mechanisms in Spanish
banks. Does ownership matter? Journal of Banking & Finance, 28(10), pp. 2311–2330.
https://doi.org/10.1016/j.jbankfin.2003.09.005
Davila, A., & Venkatachalam, M. (2004). The relevance of non-financial performance
measures for CEO compensation: Evidence from the airline industry. Review of
Accounting Studies, 9(4), pp. 443–464. https://doi.org/10.1007/s11142-004-7792-8
De Angelis, D., & Grinstein, Y. (2015). Performance terms in CEO compensation contracts.
Review of Finance, 19(2), pp. 619–651. https://doi.org/10.1093/rof/rfu014
Deckop, J. R. (1988). Determinants of chief executive officer compensation. Industrial and
Labor Relations Review, 41(2), pp. 215–226.
https://doi.org/10.1177/001979398804100204
Devers, C. E., Cannella Jr, A. A., Reilly, G. P., & Yoder, M. E. (2007). Executive
compensation: A multidisciplinary review of recent developments. Journal of
Management, 33(6), pp. 1016–1072. https://doi.org/10.1177/0149206307308588
Dey, A. (2008). Corporate Governance and Agency Conflicts. Journal of Accounting Research,
46(5), pp. 1143–1181. doi: 10.1111/j.1475-679X.2008.00301.x
Diamond, D. W., & Verrecchia, R. E. (1982). Optimal managerial contracts and equilibrium
security prices. The Journal of Finance, 37(2), pp. 275–287. doi: 10.1111/j.1540-
6261.1982.tb03550.x
Diamond, D. W., & Verrecchia, R. E. (1987). Constraints on short-selling and asset price
adjustment to private information. Journal of Financial Economics, 18(2), pp. 277–311.
https://doi.org/10.1016/0304-405X(87)90042-0
Dikolli, S. S., Hofmann, C., & Pfeiffer, T. (2013). Relative performance evaluation and peer-
performance summarization errors. Review of Accounting Studies, 18(1), pp. 34–65.
https://doi.org/10.1007/s11142-012-9212-9
DiMaggio, P. J., & Powell, W. W. (1983). The Iron Cage Revisited: Institutional Isomorphism
and Collective Rationality in Organizational Fields. American Sociological Review,
48(2), p.147. https://doi.org/10.2307/2095101
Duffhues, P., & Kabir, R. (2008). Is the pay–performance relationship always positive?:
Evidence from the Netherlands. Journal of Multinational Financial Management,
18(1), pp. 45–60. https://doi.org/10.1016/j.mulfin.2007.02.004
El-Sayed, N. M. (2013). An Examination of Executive Directors’ Remuneration in FTSE 350

243
Companies, University of Exeter.
https://ore.exeter.ac.uk/repository/handle/10871/14025
Fahlenbrach, R. (2009). Shareholder Rights, Boards, and CEO Compensation. Review of
Finance, 13(1), pp. 81–113. https://doi.org/10.1093/rof/rfn011
Faulkender, M., & Yang, J. (2010). Inside the black box: The role and composition of
compensation peer groups. Journal of Financial Economics, 96(2), pp. 257–270.
https://doi.org/10.1016/j.jfineco.2010.01.006
Ferri, F. (2009). Discussion of “Explicit relative performance evaluation in performance-vested
equity grants.” Review of Accounting Studies, 14(2-3), pp. 307–313.
https://doi.org/10.1007/s11142-009-9092-9
Ferri, F., & Maber, D. A. (2013). Say on pay votes and CEO compensation: Evidence from the
UK. Review of Finance, 17(2), pp. 527–563. https://doi.org/10.1093/rof/rfs003
Finkelstein, S., & Boyd, B. K. (1998). How much does the CEO matter? The role of managerial
discretion in the setting of CEO compensation. Academy of Management Journal, 41(2),
pp. 179–199. doi: 10.2307/257101
Firth, M., Fung, P. M., & Rui, O. M. (2007). How ownership and corporate governance
influence chief executive pay in China’s listed firms. Journal of Business Research,
60(7), pp. 776–785. https://doi.org/10.1016/j.jbusres.2007.01.014
Foo, KY, & Hameed, B. H. (2010). Insights into the modeling of adsorption isotherm systems.
Chemical Engineering Journal, 156(1), pp. 2–10.
https://doi.org/10.1016/j.cej.2009.09.013
Franco-Santos, M. (2007). The Performance Impact of Using Measurement Diversity in
Executives’ Annual Incentive Systems, School of Management, Cranfield University.
http://dspace.lib.cranfield.ac.uk/handle/1826/2305
Franks, J., Mayer, C., & Renneboog, L. (2001). Who disciplines management in poorly
performing companies? Journal of Financial Intermediation, 10(3-4), pp. 209–248.
https://doi.org/10.1006/jfin.2001.0317
Frederickson, J.R. (1992). Relative performance information: The effects of common
uncertainty and contract type on agent effort. The Accounting Review 67(4), pp. 647-
669. http://www.jstor.org/stable/248317
Gao, Z., Hwang, Y., & Wu, W.-T. (2017). Contractual Features of CEO Performance-Vested
Equity Compensation (SSRN Scholarly Paper No. ID 1896289). Rochester, NY: Social
Science Research Network. https://papers.ssrn.com/abstract=1896289
Garvey, G., & Milbourn, T. (2003). Incentive Compensation When Executives Can Hedge the
Market: Evidence of Relative Performance Evaluation in the Cross Section. The Journal

244
of Finance, 58(4), pp. 1557–1582. doi: 10.1111/1540-6261.00577
Garvey, G. T., & Milbourn, T. T. (2006). Asymmetric benchmarking in compensation:
Executives are rewarded for good luck but not penalized for bad. Journal of Financial
Economics, 82(1), pp. 197–225. https://doi.org/10.1016/j.jfineco.2004.01.006
Gerakos, J. J., Goodman, T. H., Ittner, C. D., & Larcker, D. F. (2005). The adoption and
characteristics of performance stock option grants.
https://papers.ssrn.com/sol3/papers.cfm?abstract_id=701481
Gibbons, R., & Murphy, K. J. (1990). Relative performance evaluation for chief executive
officers. Industrial & Labor Relations Review, 43(3), pp. 30-S–51-S.
https://doi.org/10.1177/001979399004300303
Girma, S., Thompson, S., & Wright, P. W. (2007). Corporate governance reforms and executive
compensation determination: evidence from the UK. The Manchester School, 75(1), pp.
65–81. doi: 10.1111/j.1467-9957.2007.01003.x
Gong, G., Li, L. Y., & Shin, J. Y. (2011). Relative performance evaluation and related peer
groups in executive compensation contracts. The Accounting Review, 86(3), pp. 1007–
1043. https://doi.org/10.2308/accr.00000042
Greenbury, R. (1995), Directors’ Remuneration: Report of a Study Group Chaired by Sir
Richard Greenbury, London: GEE.
Gregg, P., Jewell, S., & Tonks, I. (2005). Executive Pay and Performance in the UK 1994-
2002.
https://ore.exeter.ac.uk/repository/bitstream/handle/10036/22200/0505.pdf?sequence=
1
Gregg, P., Jewell, S., & Tonks, I. (2012). Executive pay and performance: did bankers’ bonuses
cause the crisis? International Review of Finance, 12(1), pp. 89–122.
doi: 10.1111/j.1468-2443.2011.01136.x
Guest, P. M. (2010). Board structure and executive pay: evidence from the UK. Cambridge
Journal of Economics, 34(6), pp. 1075–1096. https://doi.org/10.1093/cje/bep031
Gujarati, D. (2004). Basic Econometrics. United States Military Academy, West Point. Tata
McGraw-Hill.
Hair, J. F., Black, W. C., Babin, B. J., Anderson, R. E., Tatham, R. L., & others. (1998).
Multivariate data analysis, 5. Prentice hall Upper Saddle River, NJ.
https://pdfs.semanticscholar.org/6885/bb9a29e8a5804a71bf5b6e813f2f966269bc.pdf
Hall, B. J., & Liebman, J. B. (1998). Are CEOs really paid like bureaucrats? The Quarterly
Journal of Economics, 113(3), pp. 653–691. https://doi.org/10.1162/003355398555702

245
Hampel, R. (1998). Committee on Corporate Governance – Final Report, London: GEE.
http://www.ecgi.org/codes/documents/hampel_index.htm
Hannan, R.L., Krishnan, R., Newman, A.H. (2008). The effects of disseminating relative
performance feedback in tournament and individual performance compensation plans.
The Accounting Review, 83(4), pp. 893-913. http://www.jstor.org/stable/30243529
Hartzell, J. C., & Starks, L. T. (2003). Institutional investors and executive compensation. The
Journal of Finance, 58(6), pp. 2351–2374. doi: 10.1046/j.1540-6261.2003.00608.x
Hill, C. W., & Phan, P. (1991). CEO tenure as a determinant of CEO pay. The Academy of
Management Journal, 34(3), pp. 707–717. doi: 10.2307/256413
Himmelberg, C. P., & Hubbard, R. G. (2000). Incentive pay and the market for CEOs: An
analysis of pay-for-performance sensitivity. Tuck-JFE Contemporary Corporate
Governance Conference. http://papers.ssrn.com/sol3/papers.cfm?abstract_id=236089
Hölmstrom, B. (1979). Moral hazard and observability. The Bell Journal of Economics, 10(1),
pp. 74–91. http://www.jstor.org/stable/3003320
Hölmstrom, B. (1982). Moral hazard in teams. The Bell Journal of Economics, 13(2), pp. 324–
340. http://www.jstor.org/stable/3003457
Hölmstrom, B., & Milgrom, P. (1987). Aggregation and linearity in the provision of
intertemporal incentives. Econometrica: Journal of the Econometric Society, 55(2), pp.
303–328. http://www.jstor.org/stable/1913238
Hvide, H. K. (2002). Tournament rewards and risk taking. Journal of Labor Economics, 20(4),
pp. 877–898. https://doi.org/10.1086/342041
Indjejikian, R. J., & Nanda, D. (2002). Executive target bonuses and what they imply about
performance standards. The Accounting Review, 77(4), pp. 793–819.
https://doi.org/10.2308/accr.2002.77.4.793
Ittner, C. D., Larcker, D. F., & Rajan, M. V. (1997). The choice of performance measures in
annual bonus contracts. Accounting Review, 72(2), pp. 231–255.
http://www.jstor.org/stable/248554
Ittner, C. D., & Larcker, D. F. (2002). Determinants of performance measure choices in worker
incentive plans. Journal of Labor Economics, 20(S2), pp. S58–S90.
https://doi.org/10.1086/338674
Izan, H. Y., Sidhu, B., & Taylor, S. (1998). Does CEO pay reflect performance? Some
Australian evidence. Corporate Governance: An International Review, 6(1), pp. 39–47.
doi: 10.1111/1467-8683.00078

246
Janakiraman, S. N., Lambert, R. A., & Larcker, D. F. (1992). An empirical investigation of the
relative performance evaluation hypothesis. Journal of Accounting Research, 30(1), pp.
53–69. http://www.jstor.org/stable/2491091
Janakiraman, S., Radhakrishnan, S., & Tsang, A. (2010). Institutional investors, managerial
ownership, and executive compensation. Journal of Accounting, Auditing & Finance,
25(4), pp. 673–707. https://doi.org/10.1177/0148558X1002500409
Jensen, M. C., & Meckling, W. H. (1976). Theory of the firm: Managerial behavior, agency
costs and ownership structure. Journal of Financial Economics, 3(4), pp. 305–360.
https://doi.org/10.1016/0304-405X(76)90026-X
Jensen, M. C., & Murphy, K. J. (1990). Performance pay and top-management incentives.
Journal of Political Economy, 98(2), pp. 225–264. https://doi.org/10.1086/261677
Kaplan, R. S., & Norton, D. P. (1992). The Balanced Scorecard: Measures That Drive
Performance. Harvard Business Review, 70(1), pp. 71-79. https://hbr.org/1992/01/the-
balanced-scorecard-measures-that-drive-performance-2
Kaplan, S. N. (1994a). Top executive rewards and firm performance: A comparison of Japan
and the United States. Journal of Political Economy, 102(3), pp. 510–546.
https://doi.org/10.1086/261944
Kaplan, S. N. (1994b). Top executives, turnover and firm performance in Germany. Journal of
Law, Economics and Organization, 10(1), pp. 142-159. doi: 10.3386/w4416
Kaplan, S. N. (1999). Top executive incentives in Germany, Japan and the USA: A comparison.
Executive compensation and shareholder value, 4, pp. 3–12.
https://doi.org/10.1007/978-1-4757-5192-5_1
Kato, T. (1997). Chief executive compensation and corporate groups in Japan: New evidence
from micro data. International Journal of Industrial Organization, 15(4), pp. 455–467.
https://doi.org/10.1016/S0167-7187(96)01030-2
Kim, A.K. and Nofsinger, J.R. (2007). Corporate Governance. (2nd ed). NJ: Pearson Prentice
Hall
Kim, D. S., & Yang, J. (2010). Beating the target: A closer look at annual incentive plans.
Unpublished Working Paper, Indiana University.
http://www.business.uzh.ch/professorships/managerialaccounting/lehre/veranstaltunge
n/fs2014/ds2/KimYang2010.pdf
Kole, S. R. (1997). The complexity of compensation contracts. Journal of Financial
Economics, 43(1), pp. 79–104. https://doi.org/10.1016/S0304-405X(96)00888-4
Kuang, Y. F., & Qin, B. (2009). Performance-vested stock options and interest alignment. The
British Accounting Review, 41(1), pp. 46–61. https://doi.org/10.1016/j.bar.2008.10.001

247
Kuang, Y. F., Qin, B., & Van Teijen, A. S. (2014). Do compensation consultants assist in setting
easy targets in performance-vested equity plans for CEOs? Management Control &
Accounting, 2, pp. 26–32. https://ssrn.com/abstract=2388728
Kumar, R., & Sopariwala, P. R. (1992). The effect of adoption of long-term performance plans
on stock prices and accounting numbers. Journal of Financial and Quantitative
Analysis, 27(04), pp. 561–573. https://doi.org/10.2307/2331140
Lambert, R. A., & Larcker, D. F. (1987). An analysis of the use of accounting and market
measures of performance in executive compensation contracts. Journal of Accounting
Research, 25, pp. 85–125. http://www.jstor.org/stable/2491081
Lambert, R. A., Larcker, D. F., & Weigelt, K. (1993). The structure of organizational incentives.
Administrative Science Quarterly, 38(3), pp. 438–461.
http://www.jstor.org/stable/2393375
Larcker, D. F. (1983). The association between performance plan adoption and corporate
capital investment. Journal of Accounting and Economics, 5, pp. 3–30.
https://doi.org/10.1016/0165-4101(83)90003-4
Lazear, E. P., & Rosen, S. (1981). Rank-order tournaments as optimum labor contracts. Journal
of Political Economy, 89(5), pp. 841–864. https://doi.org/10.1086/261010
Lee, E., Stathopoulos, K., & Vonatsos, K. (2007). UK Executive Stock Option Valuation: A
Conditional Model. Corporate Governance: An International Review, 15(6), pp. 1469–
1479. https://doi.org/10.1111/j.1467-8683.2007.00658.x
Leonard, J. S. (1990). Executive pay and firm performance. ILR Review, 43(3), pp. 13-S-29-S.
https://doi.org/10.1177/001979399004300302
Leone, A. J., & Rock, S. (2002). Empirical tests of budget ratcheting and its effect on managers’
discretionary accrual choices. Journal of Accounting and Economics, 33(1), pp. 43–67.
https://doi.org/10.1016/S0165-4101(01)00044-1
Lewellen, W. G., Park, T., & Ro, B. T. (1996). Self-serving behavior in managers’ discretionary
information disclosure decisions. Journal of Accounting and Economics, 21(2), pp.
227–251. https://doi.org/10.1016/0165-4101(95)00417-3
Li, Z., & Wang, L. (2016). Executive Compensation Incentives Contingent on Long-Term
Accounting Performance. The Review of Financial Studies, 29(6), pp. 1586–1633.
https://doi.org/10.1093/rfs/hhw011
Main, B. G., Bruce, A., & Buck, T. (1996). Total board remuneration and company
performance. The Economic Journal, 106(439), pp. 1627–1644.
http://www.jstor.org/stable/2235204

248
Main, B. G., Thiess, R., & Wright, V. (2010). Vesting of Long Term Incentives and CEO
Careers: Holding their feet to the fire.
Mallin, C. (2002). The relationship between corporate governance, transparency and financial
disclosure. Corporate Governance: An International Review, 10(4), pp. 253–255.
doi: 10.1111/1467-8683.00289
Mallin, C. A. (2007). Corporate Governance (2nd Ed.), Oxford: University Press.
Mehran, H. (1995). Executive compensation structure, ownership, and firm performance.
Journal of Financial Economics, 38(2), pp. 163–184.
https://doi.org/10.1016/0304-405X(94)00809-F
Murphy, K. J. (1999). Executive compensation. Handbook of Labor Economics, 3, pp. 2485–
2563.
Murphy, K. J. (2000). Performance standards in incentive contracts. Journal of Accounting and
Economics, 30(3), pp. 245–278. https://doi.org/10.1016/S0165-4101(01)00013-1
Murphy, K. J., & Sandino, T. (2010). Executive pay and “independent” compensation
consultants. Journal of Accounting and Economics, 49(3), pp. 247–262.
https://doi.org/10.1016/j.jacceco.2009.12.001
Murphy, K. J. (2013). Executive compensation: Where we are, and how we got there. Handbook
of the Economics of Finance, 2(A), pp. 211- 356. https://doi.org/10.1016/B978-0-44-
453594-8.00004-5
Muth, M., & Donaldson, L. (1998). Stewardship theory and board structure: A contingency
approach. Corporate Governance: An International Review, 6(1), pp. 5–28.
https://doi.org/10.1111/1467-8683.00076
Ndzi, E. (2014). The Regulation of the Determination of Executive Remuneration. University
of Portsmouth.
https://researchportal.port.ac.uk/portal/files/5948571/The_Regulation_of_the_Determi
nation_of_Executive_Remuneration.pdf
O’Byrne, S. F. (1990). Shareholder return and management performance. Compensation &
Benefits Review, 22(2), pp. 30–37. https://doi.org/10.1177/088636879002200204
O’Reilly, C. A., Main, B. G., & Crystal, G. S. (1988). CEO compensation as tournament and
social comparison: A tale of two theories. Administrative Science Quarterly, 33(2), pp.
257–274. https://doi.org/10.2307/2393058
Ozkan, N. (2007). Do corporate governance mechanisms influence CEO compensation? An
empirical investigation of UK companies. Journal of Multinational Financial
Management, 17(5), pp. 349–364. https://doi.org/10.1016/j.mulfin.2006.08.002

249
Ozkan, N. (2011). CEO compensation and firm performance: An empirical investigation of UK
panel data. European Financial Management, 17(2), pp. 260–285.
https://doi.org/10.1111/j.1468-036X.2009.00511.x
Pass, C., Robinson, A., & Ward, D. (2000). Performance criteria of corporate option and long‐
term incentive plans: a survey of 150 UK companies 1994‐1998. Management Decision,
38(2), pp. 130–137. https://doi.org/10.1108/00251740010317487
Pepper, A., Gore, J., & Crossman, A. (2013). Are long-term incentive plans an effective and
efficient way of motivating senior executives? Human Resource Management Journal,
23(1), 36–51. https://doi.org/10.1111/j.1748-8583.2011.00188.x
Perkins, S. J., & Hendry, C. (2005). Ordering top pay: Interpreting the signals. Journal of
Management Studies, 42(7), pp. 1443–1468.
https://doi.org/10.1111/j.1467-6486.2005.00550.x
Perrin, T. (2005). Equity incentives around the world: The 2005 study.
http://www.towersperrin.com/tp/getwebcachedoc?webc=HRS/USA/2005/200507/Equ
ity_Report.pdf
Petrin, M. (2015). Executive Compensation in the United Kingdom–Past, Present, and Future.
https://ssrn.com/abstract=2616495
Porac, J. F., Wade, J. B., & Pollock, T. G. (1999). Industry categories and the politics of the
comparable firm in CEO compensation. Administrative Science Quarterly, 44(1), pp.
112–144. https://doi.org/10.2307/2667033
Qin, B. (2012). The influence of firm and executive characteristics on performance-vested stock
option grants. International Business Review, 21(5), pp. 906–928.
https://doi.org/10.1016/j.ibusrev.2011.10.004
Rajgopal, S., Shevlin, T., & Zamora, V. (2006). CEOs’ outside employment opportunities and
the lack of relative performance evaluation in compensation contracts. The Journal of
Finance, 61(4), pp. 1813–1844. https://doi.org/10.1111/j.1540-6261.2006.00890.x
Renneboog, L., & Trojanowski, G. (2010). Managerial remuneration and disciplining in the
UK: a tale of two governance regimes, ECGI- Finance Working Paper No. 301/2010.
https://dx.doi.org/10.2139/ssrn.1723462
Ross, S. A. (1973). The economic theory of agency: The principal’s problem. The American
Economic Review, 63(2), pp. 134–139. http://www.jstor.org/stable/1817064
Ryan, H. E., & Wiggins, R. A. (2001). The influence of firm- and manager-specific
characteristics on the structure of executive compensation. Journal of Corporate
Finance, 7(2), pp. 101–123. https://doi.org/10.1016/S0929-1199(00)00021-3
Sapp, S. G. (2008). The impact of corporate governance on executive compensation. European

250
Financial Management, 14(4), pp. 710–746. https://doi.org/10.1111/j.1468-
036X.2008.00443.x
Sigler, K. J. (2011). CEO compensation and company performance. Business and Economics
Journal, 31(1), pp. 1–8.
https://pdfs.semanticscholar.org/64c6/b239ff0d606a51481737dcd816bef058f89b.pdf
Sloan, R. G. (1993). Accounting earnings and top executive compensation. Journal of
Accounting and Economics, 16(1), pp. 55–100.
https://doi.org/10.1016/0165-4101(93)90005-Z
Solomon, J. (2007). Corporate governance and accountability. John Wiley & Sons.
Sridharan, U. V. (1996). CEO Influence and Executive Compensation. Financial Review, 31(1),
pp. 51–66. https://doi.org/10.1111/j.1540-6288.1996.tb00863.x
Stedry, A. C., & Kay, E. (1966). The effects of goal difficulty on performance: A field
experiment. Behavioral Science, 11(6), pp. 459–470.
https://doi.org/10.1002/bs.3830110605
The Directors’ Remuneration Report Regulations (2002).
http://www.opsi.gov.uk/si/si2002/20021986.htm
Thompson, S. (2005). The impact of corporate governance reforms on the remuneration of
executives in the UK. Corporate Governance: An International Review, 13(1), pp. 19–
25. https://doi.org/10.1111/j.1467-8683.2005.00400.x
Watson, R. (1994). An empirical analysis of financial and non-financial managers’
remuneration in small and medium-sized UK enterprises. Accounting and Business
Research, 24(94), pp. 176–188. https://doi.org/10.1080/00014788.1994.9729475
Watts, R. L., & Zimmerman, J. L. (1990). Positive accounting theory: A ten year perspective.
The Accounting Review, 65(1), pp. 131–156. http://www.jstor.org/stable/247880
Wooldridge, J. M. (2010). Econometric analysis of cross section and panel data. MIT Press.
Yermack, D. (1996). Higher market valuation of companies with a small board of directors.
Journal of Financial Economics, 40(2), pp. 185–211. https://doi.org/10.1016/0304-
405X(95)00844-5
Zahra, S. A., Neubaum, D. O., & Huse, M. (2000). Entrepreneurship in medium-size
companies: Exploring the effects of ownership and governance systems. Journal of
Management, 26(5), pp. 947–976. https://doi.org/10.1177/014920630002600509
Zajac, E. J., & Westphal, J. D. (1995). Accounting for the explanations of CEO compensation:
Substance and symbolism. Administrative Science Quarterly, 40(2), pp. 283–308.
https://doi.org/10.2307/2393639

251
Zakaria, I. (2012). Performance measures, benchmarks and targets in executive remuneration
contracts of UK firms. The British Accounting Review, 44(3), pp. 189–203.
https://doi.org/10.1016/j.bar.2012.07.005
Zhou, X. (2000). CEO pay, firm size, and corporate performance: evidence from Canada.
Canadian Journal of Economics/Revue Canadienne D’économique, 33(1), pp. 213–
251. https://doi.org/10.1111/0008-4085.00013