ESSAY #2 OUTDOOR CITY-WIDE WI-FI ASSESSMENT
6
ESSAY #2 OUTDOOR CITY-WIDE WI-FI ASSESSMENT BY FRANÇOIS VERGÈS CWNE APPLICANT FEBRUARY 23, 2016
Transcript of ESSAY #2 OUTDOOR CITY-WIDE WI-FI ASSESSMENT

ESSAY #2 OUTDOOR CITY-WIDE WI-FI ASSESSMENT
BY FRANÇOIS VERGÈS CWNE APPLICANT
FEBRUARY 23, 2016
CWNE Application – Essay #2
Essay #2 – Outdoor City-Wide Wi-Fi Assessment 2
A city-wide IEEE802.11n Wi-Fi network was once deployed in a small city having a land area of about 27km2. The initial purpose of this network was to transmit hydro smart meters updates from homes back to the local hydro company offices. Then, internet services for local businesses became available over the same Wi-Fi infrastructure. The company maintaining this network was looking at installing new services on top of their current infrastructure; services like voice over IP (VoIP) and live streaming video mainly for local public security purposes.
They had multiples issues and decided to contact me in order to help them performing an assessment of their current wireless network infrastructure. Here were the objectives of the project:
• Perform a passive site survey throughout the whole city • Scan both frequency bands (2.4GHz and 5GHz) for any Wi-Fi networks • Evaluate RF health of both frequency bands (2.4GHz and 5GHz) throughout the city • Quantify the effect of the utilization of the smart meters on the 2.4GHz band • Get a starting point to start analyzing the Wi-Fi infrastructure and start working on the re-design
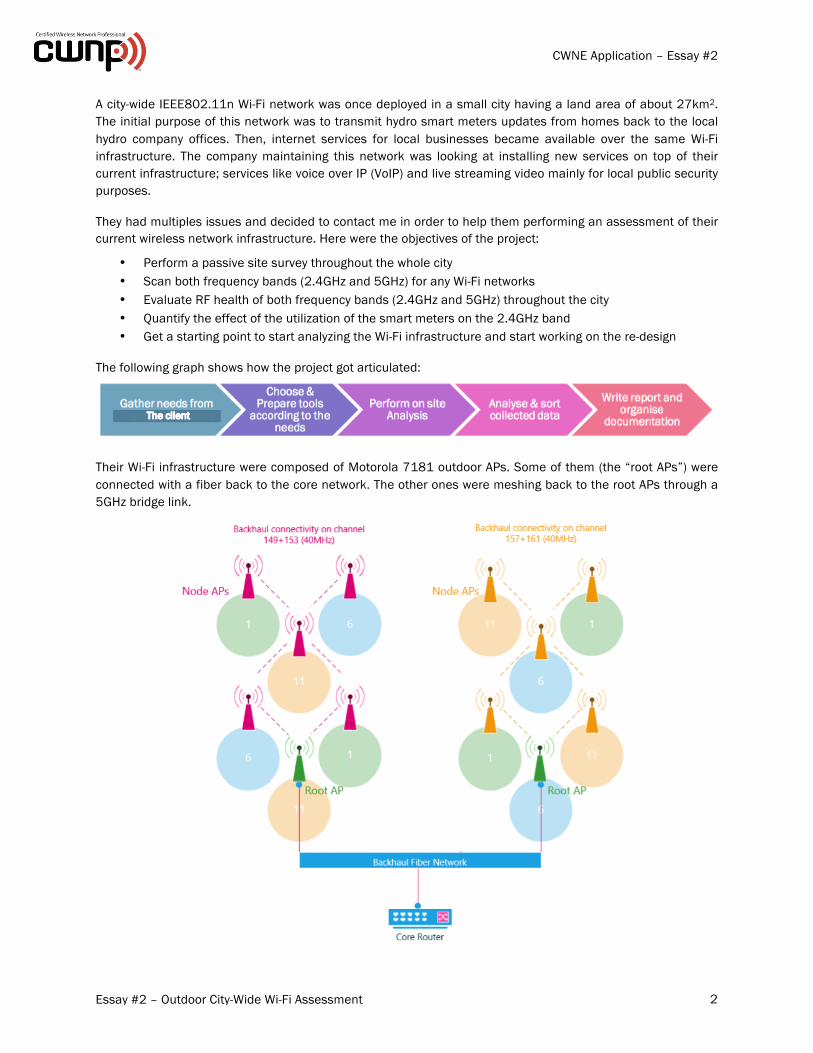
The following graph shows how the project got articulated:
Their Wi-Fi infrastructure were composed of Motorola 7181 outdoor APs. Some of them (the “root APs”) were connected with a fiber back to the core network. The other ones were meshing back to the root APs through a 5GHz bridge link.
The client
CWNE Application – Essay #2
Essay #2 – Outdoor City-Wide Wi-Fi Assessment 3
Ubiquity NanoStations were used as customer premise equipment (CPE) for those who subscribed to the internet service. The following picture presents some technical specifications related to the client access:
The company did not have a lot of money to work with so they were using an open source solution to monitor their network infrastructure. A program called QGIS was used to display the equipment on a map. A script was used to poll the status of the access points. This data was then displayed on the map. A database was used to store the monitoring data.
One of the tasks to perform onsite was the passive site survey. The customer wanted to be able to export the survey data into a XML file format factor so they could import the data into their own monitoring solution. I tried to export the survey data from the 3 major survey programs used (Ekahau Site Survey, Air Magnet Survey Pro and TamoGraph) but I could not manage to export all the useful data. The best I was able to extract was the information about the access point detected but not the information about the RSSI received at specific GPS coordinates (which was what the customer wanted). So we ended up using a hybrid solution where we would use TamoGraph Site Survey and a Linux based tool called Kismet.
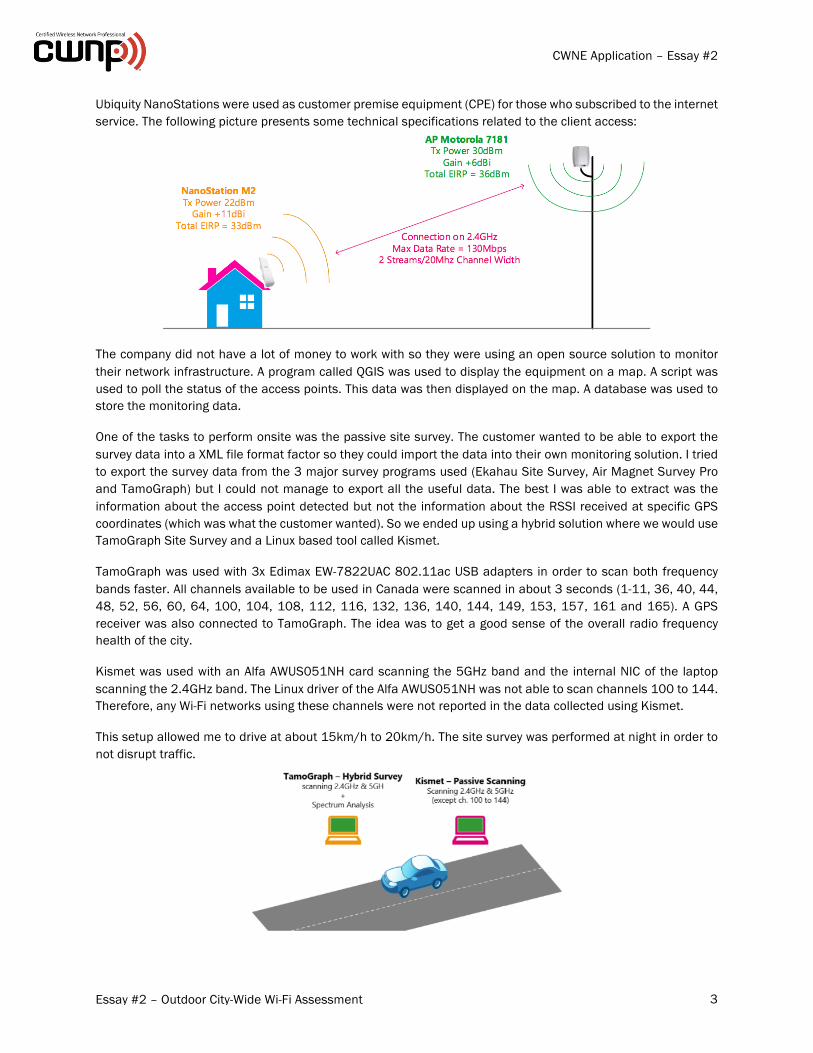
TamoGraph was used with 3x Edimax EW-7822UAC 802.11ac USB adapters in order to scan both frequency bands faster. All channels available to be used in Canada were scanned in about 3 seconds (1-11, 36, 40, 44, 48, 52, 56, 60, 64, 100, 104, 108, 112, 116, 132, 136, 140, 144, 149, 153, 157, 161 and 165). A GPS receiver was also connected to TamoGraph. The idea was to get a good sense of the overall radio frequency health of the city.
Kismet was used with an Alfa AWUS051NH card scanning the 5GHz band and the internal NIC of the laptop scanning the 2.4GHz band. The Linux driver of the Alfa AWUS051NH was not able to scan channels 100 to 144. Therefore, any Wi-Fi networks using these channels were not reported in the data collected using Kismet.
This setup allowed me to drive at about 15km/h to 20km/h. The site survey was performed at night in order to not disrupt traffic.

CWNE Application – Essay #2
Essay #2 – Outdoor City-Wide Wi-Fi Assessment 4
When you are about to survey a large area, it requires a little preparation. In my case, I used Google Earth to delimiter the area we wanted to study. I, then, selected the best routes possible and prepared the survey paths. Each survey path ended up being between 5km to 10km long. I kept them short because it was flexible and convenient for me. I also wanted to prevent any potential issues with the software and hardware I was using. The following images presents the area studied as well as the different survey paths defined (47 in total representing 302.56km or roads):
For each survey path, the following method was used:
Prior to the survey, I performed some testing using an Ubiquity NanoStation. The objective was to find out the exact Rx sensitivity in order to achieve the highest MCS possible (15 in our case). According to the specification sheet, the maximum Tx power to achieve a MCS of 15 was 22dBm and the Rx sensitivity was -75dBm at MCS 15. According to my testing, the Rx sensitivity was closer to -70dBm at MCS 15. So, for the site survey, I considered an area to be covered if the RSSI measured was above or equal to -70dBm.
The MCS is the Modulation Coding Scheme used between two Wi-Fi stations. It specifies what data rate will be used. Modulation is the fact of encoding a digital signal (“0” and “1”) into an electromagnetic wave. Coding is the process of inserting error correction bits into the data sequence so the initial data can be mathematically recovered if the signal is altered along the transmission way. The quantity of error correction bit is usually represented with a ratio (example: ½ means that for every 1 bit of data, 2 bits are transmitted). The more error correction bits you have, the more likely the receiver will be able to decode the signal but the less data you will
Drive to the
starting location Start
Kismet on the
Lenovo Laptop
Start TamoGraph on the MacBook
Drive around
following the
survey path
Save the data from
Kismet (.netxml, .nettext)
Save the project on TamoGraph (.ssprj)
Update duration
information in Excel
table

CWNE Application – Essay #2
Essay #2 – Outdoor City-Wide Wi-Fi Assessment 5
be able to send. This is why lower data rates are easier to decode for Wi-Fi stations (even when the signal is weaker).
The onsite measurements or site survey took place over 5 nights. It was then time to analyze the data collected. Dealing with such large areas brings some new challenges. I have written a blog article explaining how I have faced some of these challenges: http://www.semfionetworks.com/blog/city-wide-site-survey-using-tamograph.
The analysis revealed that the coverage of the city-wide Wi-Fi network was not consistent throughout the city. In fact, only about 70% of the city was covered with a signal equal or greater than -70dBm.
The analysis also revealed that the channel distribution on the 2.4Ghz band (used for access) was not optimal and some adjacent APs were using the same channel. This situation was introducing some co-channel contention, reducing the capacity of some part of the Wi-Fi Infrastructure. Especially down town where the density of access point was higher. The following drawing is a visual explanation of co-channel contention that I had included in the report I delivered to my client:
Another important part of the assessment was to quantify how much traffic would the smart meters generate and their impact on the 2.4Ghz spectrum. In order to do so, we performed some stress test in the client’s lab using different smart meters and generating traffic. These smart meters use a proprietary protocol to communicate with their node on the 2.4GHz frequency band. While the customer was generating traffic, I was analysing the 2.4GHz spectrum using a spectrum analyzer (MetaGeek Chanalyzer).
We noticed that the communications were not using a single channel. They were, in fact, using a different number of frequencies spread over the 2.4GHz band. These frequencies were used for a very short amount of time and by intervals of about 10 seconds. These frequencies appeared to be changing randomly. These communications are represented by the little red dotted lines on the lower part of the graph below:

CWNE Application – Essay #2
Essay #2 – Outdoor City-Wide Wi-Fi Assessment 6
During our testing, we generated about 10 times more traffic than the actual smart meters in service. These communications were only happening for very short amount of time and by intervals. So they were not utilizing a lot of spectrum. The duty cycle was not affected. So I have concluded that the smart meters might generate a little bit of retransmission traffic if used heavily but they won’t disrupt the Wi-Fi networks deployed around the city.
At the time of the study, the client was in the process of re-designing the whole Wi-Fi infrastructure. They were about to perform some proof of concept using different vendors’ equipment. So, based on the facts and the results of the analysis, they definitely needed more access points. However, adding more access point, at this stage, had to be part of the new re-design. It needed to be studied and the number of access points would depend on a number of different factors:
• What data rates do we want to use on the new infrastructure? • What client are going to be using the new infrastructure? • What applications will be used? • What transmit power will be used? • What type of antennas will be installed on these new access points? • What radio bands will be used for access and backhaul connectivity?
So I finished the assessment by presenting the results and guiding them into the re-design process asking them these questions so they could be on the right track to successfully deploy a new city wide Wi-Fi network.