ESG Performance Data - Fresenius Medical Care
10
ESG Performance Data
Transcript of ESG Performance Data - Fresenius Medical Care

E S G P e r f o r m a n c e D a t a
ESG Performance Data | Page 1 out of 9
ESG Performance Data Table
We assess the effectiveness of our sustainability activities by monitoring key performance indicators (KPI). The KPI below give an indication of
our performance in environment, social, and governance (ESG) topics over the past five years. For more information, please refer to our Non-
Financial Report.
This index is currently only available in English.
2020 2019 2018 2017 2016
PATIENTS
Patients treated 346,553 ✓1 345,096 ✓ 333,331 ✓ 320,960 ✓ 308,471 ✓
Dialysis centers worldwide 4,092 ✓ 3,994 ✓ 3,928 ✓ 3,752 ✓ 3,624 ✓
Dialysis treatments (millions) 53.6 ✓ 52.1 ✓ 50.0 ✓ 48.3 ✓ 46.5 ✓
Share of dialysis product market (%) 35 ✓ 36 ✓ 35 ✓ 35 ✓ 34 ✓
Share of dialysis patients treated worldwide (%) 9 ✓ 10 ✓ 10 ✓ 10 ✓ 10 ✓
North America (%) 31 ✓ 31 ✓ 31 ✓ 31 ✓ 30 ✓
Europe, Middle East and Africa (%) 8 ✓ 8 ✓ 8 ✓ 8 ✓ 8 ✓
Asia-Pacific (%) 2 ✓ 2 ✓ 2 ✓ 2 ✓ 2 ✓
Latin America (%) 12 ✓ 12 ✓ 11 ✓ 11 ✓ 11 ✓
1 Figures marked with an ✓ icon are included in the Annual Report, which has been subject to a third-party assessment.
ESG Performance Data | Page 2 out of 9
2020 2019 2018 2017 2016
QUALITY OF CARE AND PATIENT SATISFACTION
Net Promoter Score 67 ✓ n/a2 n/a n/a n/a
Patients who would highly recommend our services to a
friend (%)
75 ✓ n/a n/a n/a n/a
Coverage rate of patient experience survey (%) 78 ✓ n/a n/a n/a n/a
Response rate of patient experience survey (%) 76 ✓ n/a n/a n/a n/a
PRODUCT QUALITY AND SAFETY
Number of production sites worldwide 44 ✓ 45 ✓ 42 ✓ 41 ✓ 37 ✓
Operations covered by quality management systems (%)3 98 n/a n/a n/a n/a
Product improvements to dialysis machines > 440 ✓ n/a n/a n/a n/a
Audit score4 0.2 ✓ 0.2 ✓ 0.3 n/a n/a
INNOVATION
R&D expenditures (thousand €) 193,774 ✓ 168,028 ✓ 114,074 ✓ 110,997 ✓ 146,5115 ✓
R&D expenditures as a percentage of health care product
revenue (%)
5 ✓ 5 ✓ 3 ✓ 3 5 ✓
Property rights 11,223 ✓ 10,658 ✓ 9,152 ✓ 8,396 ✓ 7,748 ✓
Number of patent families 1,626 ✓ 1,518 ✓ ~1,340 ✓ 1,253 ✓ 1,163 ✓
New patent families produced 135 ✓ 163 ✓ 126 ✓ 126 ✓ 107 ✓
2 n/a = figure unavailable. 3 Includes ISO 9001/13485, Good Manufacturing Practice (GMP)/Current Good Manufacturing Practice (cGMP) and Medical Device Single Audit Program (MDSAP). 4 The audit score measures our performance in certification audits and indicates the ratio of major and critical findings to the number of external audits. 5 Due to the reclassification of expenses in the years 2017 and 2018, 2016 expenses are only comparable to a limited extent.

ESG Performance Data | Page 3 out of 9
2020 2019 2018 2017 2016
EMPLOYEES6
Number of employees (headcount) 133,129 ✓ 128,300 ✓ 120,328 ✓ 121,245 ✓ n/a
Number of employees (FTE) 125,364 ✓ 120,659 ✓ 112,658 ✓ 114,000 ✓ 109,319 ✓
EMPLOYEES PER REGION
North America (%) 50 ✓ 50 ✓ 50 ✓ 51 ✓ 52 ✓
Latin America (%) 9 ✓ 9 ✓ 8 ✓ 8 ✓ 8 ✓
Europe, Middle East and Africa (incl. Germany) (%) 17 ✓ 17 ✓ 17 ✓ 17 ✓ 17 ✓
Germany (%) 6 ✓ 6 ✓ 6 ✓ 5 ✓ 5 ✓
Asia-Pacific (%) 10 ✓ 10 ✓ 10 ✓ 9 ✓ 8 ✓
Corporate (%) 14 ✓ 14 ✓ 15 ✓ 15 ✓ 15 ✓
EMPLOYEES PER FUNCTIONAL AREA
Production and services (%) 86 ✓ 86 ✓ 86 ✓ 87 ✓ 87 ✓
Administration (%) 10 ✓ 10 ✓ 10 ✓ 9 ✓ 9 ✓
Sales and marketing (%) 3 ✓ 3 ✓ 3 ✓ 3 ✓ 3 ✓
Research and development (%) 1 ✓ 1 ✓ 1 ✓ 1 ✓ 1 ✓
INCLUSION AND DIVERSITY
Average age (years) 42 ✓ 41 ✓ 41 ✓ 42 ✓ n/a
Employees under 30 years (%) 17 ✓ 18 ✓ 16 ✓ 18 ✓ n/a
Employees between 30 and 50 years (%) 58 ✓ 56 ✓ 57 ✓ 56 ✓ n/a
6 2016 employee numbers are based on full-time equivalents. From 2017 onwards, employee numbers are based on headcount.

ESG Performance Data | Page 4 out of 9
2020 2019 2018 2017 2016
Employees over 50 years (%) 25 ✓ 26 ✓ 27 ✓ 26 ✓ n/a
Female employees in entire company (%) 69 ✓ 69 ✓ 69 ✓ 69 ✓ 69 ✓
Female employees in North America (%) 71 72 ✓ 72 ✓ 70 ✓ n/a
Female employees in Europe, Middle East and Africa (%) 66 66 ✓ 67 ✓ 67 ✓ n/a
Female employees in Latin America (%) 66 65 ✓ 67 ✓ 68 ✓ n/a
Female employees in Asia-Pacific (%) 65 64 ✓ 65 ✓ 65 ✓ n/a
Management Board members between 30 and 50 years (%) 12.5 14.3 14.3 28.6 28.6
Management Board members over 50 years (%) 87.5 85.7 85.7 71.4 71.4
Share of women in the Management Board (%) 25 ✓ 29 ✓ 14 ✓ 0 ✓ 0 ✓
Supervisory Board members between 30 and 50 years (%) 0 16.7 0 16.7 16.7
Supervisory Board members over 50 years (%) 100 83.3 100 83.3 83.3
Share of women in the Supervisory Board (%) 33 ✓ 33 ✓ 33 ✓ 33 ✓ 33 ✓
Women at first management level (%) 22 ✓ 23 ✓ 21 ✓ 19 ✓ 19 ✓
Women at second management level (%) 31 ✓ 30 ✓ 27 ✓ 28 ✓ 25 ✓
Female Long-Term Incentive Plan (LTIP) participants (%) 34 ✓ 34 ✓ 33 ✓ 33 ✓ 33 ✓
Non-Germans within the Management Board (%) 75 71 71 86 71
Non-German leaders within LTIP population (%) 85 ✓ 86 ✓ n/a n/a n/a
EMPLOYMENT CONTRACTS AND EMPLOYMENT TYPES
Permanent contracts (%) 96 n/a n/a n/a n/a
Out of which are for women (%) 70 n/a n/a n/a n/a
Temporary contracts (%) 4 n/a n/a n/a n/a
Out of which are for women (%) 67 n/a n/a n/a n/a
ESG Performance Data | Page 5 out of 9
2020 2019 2018 2017 2016
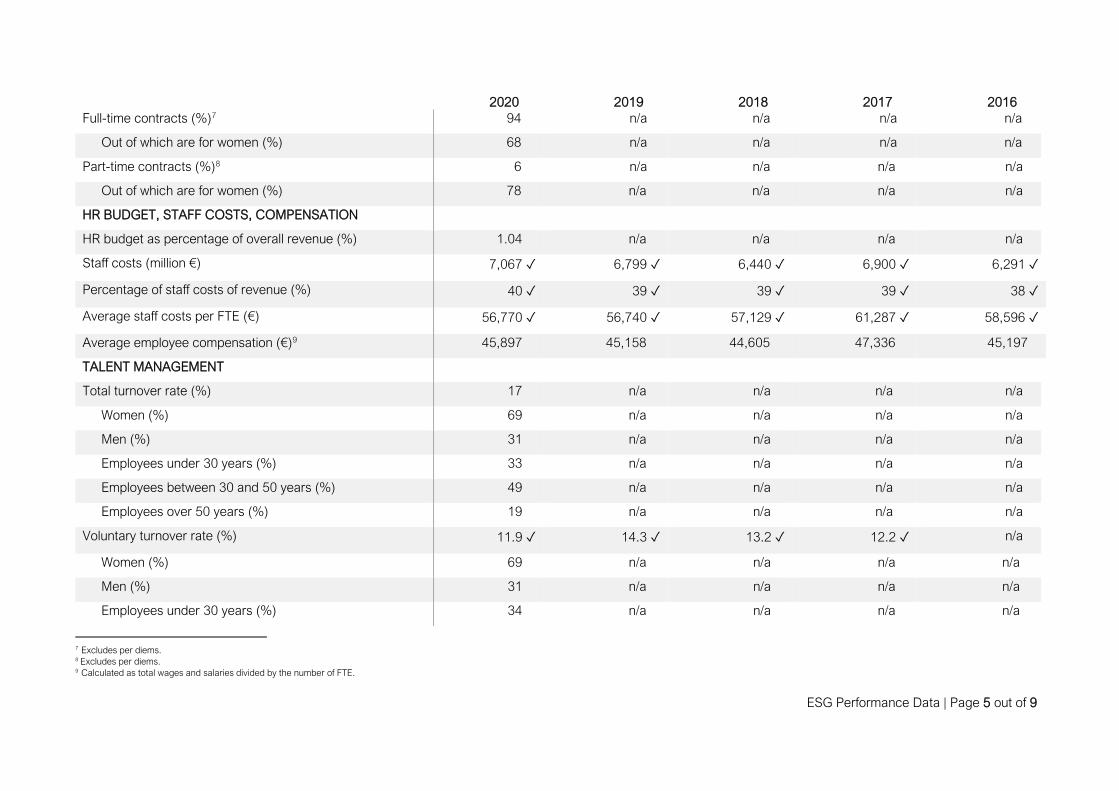
Full-time contracts (%)7 94 n/a n/a n/a n/a
Out of which are for women (%) 68 n/a n/a n/a n/a
Part-time contracts (%)8 6 n/a n/a n/a n/a
Out of which are for women (%) 78 n/a n/a n/a n/a
HR BUDGET, STAFF COSTS, COMPENSATION
HR budget as percentage of overall revenue (%) 1.04 n/a n/a n/a n/a
Staff costs (million €) 7,067 ✓ 6,799 ✓ 6,440 ✓ 6,900 ✓ 6,291 ✓
Percentage of staff costs of revenue (%) 40 ✓ 39 ✓ 39 ✓ 39 ✓ 38 ✓
Average staff costs per FTE (€) 56,770 ✓ 56,740 ✓ 57,129 ✓ 61,287 ✓ 58,596 ✓
Average employee compensation (€)9 45,897 45,158 44,605 47,336 45,197
TALENT MANAGEMENT
Total turnover rate (%) 17 n/a n/a n/a n/a
Women (%) 69 n/a n/a n/a n/a
Men (%) 31 n/a n/a n/a n/a
Employees under 30 years (%) 33 n/a n/a n/a n/a
Employees between 30 and 50 years (%) 49 n/a n/a n/a n/a
Employees over 50 years (%) 19 n/a n/a n/a n/a
Voluntary turnover rate (%) 11.9 ✓ 14.3 ✓ 13.2 ✓ 12.2 ✓ n/a
Women (%) 69 n/a n/a n/a n/a
Men (%) 31 n/a n/a n/a n/a
Employees under 30 years (%) 34 n/a n/a n/a n/a
7 Excludes per diems. 8 Excludes per diems. 9 Calculated as total wages and salaries divided by the number of FTE.

ESG Performance Data | Page 6 out of 9
2020 2019 2018 2017 2016
Employees between 30 and 50 years (%) 48 n/a n/a n/a n/a
Employees over 50 years (%) 18 n/a n/a n/a n/a
Involuntary turnover rate (%) 5 n/a n/a n/a n/a
Women (%) 68 n/a n/a n/a n/a
Men (%) 32 n/a n/a n/a n/a
Employees under 30 years (%) 28 n/a n/a n/a n/a
Employees between 30 and 50 years (%) 52 n/a n/a n/a n/a
Employees over 50 years (%) 20 n/a n/a n/a n/a
External hire rate (%) 23.1 ✓ 24.7 ✓ 21.7 ✓ n/a n/a
Women (%) 69 n/a n/a n/a n/a
Men (%) 31 n/a n/a n/a n/a
Employees under 30 years (%) 41 n/a n/a n/a n/a
Employees between 30 and 50 years (%) 49 n/a n/a n/a n/a
Employees over 50 years (%) 10 n/a n/a n/a n/a
Average service length (years) 7.3 ✓ 6.8 ✓ 7.1 ✓ 7.0 ✓ n/a
Women (years) 7.3 n/a n/a n/a n/a
Men (years) 7.3 n/a n/a n/a n/a
Employees under 30 years (years) 2.3 n/a n/a n/a n/a
Employees between 30 and 50 years (years) 6.5 n/a n/a n/a n/a
Employees over 50 years (years) 12.3 n/a n/a n/a n/a
EMPLOYEE ENGAGEMENT
Engagement score (%) 64 ✓ 56 ✓ n/a n/a n/a
Women (%) 65 56 n/a n/a n/a

ESG Performance Data | Page 7 out of 9
2020 2019 2018 2017 2016
Men (%) 62 54 n/a n/a n/a
Participation rate (%) 3610 ✓ 68 ✓ n/a n/a n/a
SUPERVISORY BOARD
Independent Supervisory Board members 5 ✓ 5 ✓ 4 ✓ 4 ✓ 4 ✓
Participation rate in Supervisory Board meetings (%) 100 ✓ 97.6 ✓ 96.4 97.6 97.6
OCCUPATIONAL HEALTH AND SAFETY
Total OSHA recordable incident rate11 4.48 4.50 4.35 4.67 5.21
Total OSHA lost time incident rate12 1.24 1.22 1.07 1.26 0.98
ENVIRONMENT
Production sites covered by a certified environmental
management system (%)
24 n/a n/a n/a n/a
Production sites with ISO 14001 certification (%)13 24 20 20 n/a n/a
Production sites with ISO 50001 certification (%)14 5 5 5 n/a n/a
Produced resource-friendly dialysis machines (%) 47.9 47.6 22.3 25.2 n/a
Conducted product life cycle assessments (%)15 40 28 25 23 20
WATER CONSUMPTION
10 Pulse survey with representative sample of 16,000 employees. 11 The Occupational Safety and Health Administration (OSHA) recordable incident rate is calculated as follows: number of OSHA recordable injuries and illnesses x 200,000 / employee total hours worked. The number applies to the North
America region. From 2020, this figure also includes the production sites in our Latin America region. 12 The OSHA lost time incident rate is calculated as follows: number of OSHA lost time injuries and illnesses x 200,000 / employee total hours worked. The number applies to the North America region. From 2020, this figure also includes the
production sites in our Latin America region. 13 Applies to manufacturing sites in the environmental reporting scope. 14 Applies to manufacturing sites in the environmental reporting scope. 15 The figure refers to Fresenius Medical Care’s product portfolio. In the region Europe, Middle East and Africa, several screening life cycle assessments and/or comprehensive comparative life cycle assessments have been implemented.
These assessments cover an increasing number of our products in major product groups.

ESG Performance Data | Page 8 out of 9
2020 2019 2018 2017 2016
Water (million m3) 41.7 ✓ 43.2 ✓ 42.1 ✓ 35.716 ✓ n/a
Municipal water (million m3) 41.2 ✓ 42.7 ✓ 41.6 ✓ - n/a
Ground water (million m3) 0.5 ✓ 0.5 ✓ 0.5 ✓ - n/a
Water consumption (m3) / € 1 million revenue 2,334 2,470 2,542 2,006 n/a
Water consumption (m3) / FTE 333 358 373 313 n/a
ENERGY CONSUMPTION
Energy (million MWh) 2.5 ✓ 2.4 ✓ 2.4 ✓ 2.817 ✓ n/a
Electricity (million MWh) 1.3 ✓ 1.3 ✓ 1.3 ✓ - n/a
Natural gas (million MWh) 1.1 ✓ 1.1 ✓ 1.1 ✓ - n/a
Others (incl. fuel oil, diesel, liquid gas, district heating)
(million MWh)
< 0.1 ✓ < 0.1 ✓ < 0.1 ✓ - n/a
Energy consumption (MWh) / € 1 million revenue 139.7 139.0 143.8 156.7 n/a
Energy consumption (MWh) / FTE 19.9 20.1 21.1 24.4 n/a
Renewables in energy consumption (%)18 21.1 ✓ 20.4 18.4 17.0 n/a
GREENHOUSE GAS (GHG) EMISSIONS
Scope 1 CO2 equivalents (thousand tons) 242.2 ✓ 227.3 ✓ 218.7 ✓ 325.719✓ n/a
Natural gas (thousand tons) 228 ✓ 224.6 ✓ 215.6 ✓ - n/a
Liquid gas (thousand tons) 13.6 ✓ 2.2 ✓ 2.3 ✓ - n/a
Fuel oil (thousand tons) 0.3 ✓ 0.3 ✓ 0.5 ✓ - n/a
16 The 2017 figure of our water consumption is displayed as published in the 2017 Non-Financial Report without a detailed breakdown of water sources. 17 The 2017 figure of our energy consumption is displayed as published in the 2017 Non-Financial Report without a detailed breakdown of energy sources. 18 The share of renewables in energy consumption is entirely accounted for by renewables in electricity consumption. To calculate this, we used the country-specific average share of renewables in total electricity consumption. 19 The 2017 figure of our GHG emissions is displayed as published in the 2017 Non-Financial Report without a detailed breakdown of GHG emissions sources.

ESG Performance Data | Page 9 out of 9
2020 2019 2018 2017 2016
Diesel (thousand tons) 0.3 ✓ 0.3 ✓ 0.3 ✓ - n/a
Scope 2 CO2 equivalents (thousand tons) 527.2 ✓ 547.2 ✓ 557.2 ✓ 529.820 ✓ n/a
Electricity (thousand tons) 526.8 ✓ 546.9 ✓ 557.1 ✓ - n/a
District heating (thousand tons) 0.4 ✓ 0.3 ✓ 0.2 ✓ - n/a
GHG emissions (tons CO2 equivalents) / € 1 million revenue 43.1 44.3 46.9 48.1 n/a
GHG emissions (tons CO2 equivalents) / FTE 6.1 6.4 6.9 7.5 n/a
BUSINESS INTEGRITY
New parties assessed for compliance risks ˃ 37,000 ✓ ~ 20,000 n/a n/a n/a
Reports received via various reporting channels 3,003 ✓ 2,803 n/a n/a n/a
Reports related to business integrity incl. anti-corruption 52 ✓ 98 ✓ n/a n/a n/a
Reports related to data protection 342 ✓ 428 ✓ n/a n/a n/a
Reports related to patient care and products 1,516 ✓ 1,304 ✓ n/a n/a n/a
Reports related to human resources/workplace 906 ✓ 713 ✓ n/a n/a n/a
Reports related to other topics 187 ✓ 260 ✓ n/a n/a n/a
Reports passed on to Compliance department 84 ✓ 500 ✓ n/a n/a n/a
Reports passed on to Legal department 15 ✓ 18 ✓ n/a n/a n/a
Reports passed on to Patient Care department 1,090 ✓ 739 ✓ n/a n/a n/a
Reports passed on to HR department 945 ✓ 752 ✓ n/a n/a n/a
Reports passed on to other departments 869 ✓ 794 ✓ n/a n/a n/a
20 The 2017 figure of our GHG emissions is displayed as published in the 2017 Non-Financial Report without a detailed breakdown of GHG emissions sources.