
ESE Lab Report Guidelines Document Structure*ese205/205docs/ESELabReportGuide.pdf · 2.4.2...
13
Prepared with the help of the SEAS Technical Communication Program 1 Ed. July, 2010 ESE Lab Report Guidelines Document Structure* 1 General Lab Report Guidelines 1.1 Purpose of a lab report 1.2 Important points to keep in mind when writing lab reports 1.3 Collaborative Writing 2 Lab Report Requirements (with summary of purpose of each component) 2.1 Title 2.2 Introduction 2.3 Prelab (where applicable) 2.4 Experimental Results & Discussion 2.4.1 Experimental Results 2.4.2 Discussion 2.5 Conclusion 2.6 Authors’ Signatures 3 Experimental Results Details 3.1 Equations and Calculations 3.2 Tables 3.3 Graphics 3.3.1 Graphs and Data Presentation 3.3.2 Captured Scope Images 3.3.3 Schematics and Diagrams 3.4 Error Analysis * Check particular course website for labspecific guidelines
Transcript of ESE Lab Report Guidelines Document Structure*ese205/205docs/ESELabReportGuide.pdf · 2.4.2...
Prepared with the help of the SEAS Technical Communication Program 1 Ed. July, 2010
ESE Lab Report Guidelines
Document Structure*
1 General Lab Report Guidelines 1.1 Purpose of a lab report 1.2 Important points to keep in mind when writing lab reports 1.3 Collaborative Writing
2 Lab Report Requirements (with summary of purpose of each component) 2.1 Title 2.2 Introduction 2.3 Prelab (where applicable) 2.4 Experimental Results & Discussion
2.4.1 Experimental Results 2.4.2 Discussion
2.5 Conclusion 2.6 Authors’ Signatures
3 Experimental Results Details
3.1 Equations and Calculations 3.2 Tables 3.3 Graphics
3.3.1 Graphs and Data Presentation 3.3.2 Captured Scope Images 3.3.3 Schematics and Diagrams
3.4 Error Analysis
* Check particular course website for labspecific guidelines

Prepared with the help of the SEAS Technical Communication Program 2 Ed. July, 2010
Section 1: General Lab Report Guidelines
1.1 Purpose of a lab report
The main purpose for the report is to communicate the results to others and to enable others to duplicate the work in a straightforward manner.
1.2 Important Points to keep in mind when writing a lab report
A lab report should be as succinct as possible without leaving out relevant detail: every word should count. It should be easy to read and the organization should be easily discernible. The following points should therefore be considered when writing a lab report:
§ Keep your reader in mind always. The reader should understand your report (purpose of the lab, process and results, and conclusions) in one reading without having to go back and forth within your paper, and without access to the list of questions you were given.
§ All sections and subsections should have a clear heading and should be numbered. Doing so will make it easier for you to refer back to an earlier section or subsection if you need to. All main section headings (i.e. Introduction, Experimental Results and Discussion, and Conclusion) should be bold.
§ Make sure information in a given section or subsection of the report belongs there. Avoid restating information or reproducing the same graphic in later sections or subsections; instead, refer the reader back to the relevant part of the report (“As stated in section 2.3, …” or, “These figures are given in section 2.3.”)
§ Avoiding cutting up sections at the end of a page, or stranding a graphic or equation on a page separate from the explanation. If only one line of a new section will fit at the end a page, move the whole section to the next page.
§ Define technical terms and abbreviations the first time they are used. After the first time, you can use them without defining them. Do not overuse abbreviations or your text will look like ‘alphabet soup.’
§ In graphics, be sure to include both labels and units (see Sections 3.2 and 3.3). Avoid shaded backgrounds; they make graphs and charts harder to read. (Also avoid color graphics if your reader will be printing the document in grayscale. Lines on graphs tend to disappear when converted from color to grayscale.)
§ Avoid the use of jargon or slang.
§ Avoid using ‘this’ to refer back to an indefinite antecedent, especially if there is no appropriate singular antecedent for ‘this’ to refer to. Here is an example:
Prepared with the help of the SEAS Technical Communication Program 3 Ed. July, 2010
The design focused on simplicity and on minimizing weight and use of materials. To achieve this, ….
Does ‘this’ refer to ‘simplicity’, or to ‘minimizing weight and use of materials? The writer can clarify by using a phrase (with the correct pronoun) instead of the single word ‘this’:
The design focused on simplicity and on minimizing weight and use of materials. To achieve these goals, ….
§ Use consistent verb time. Most reports are detailing what happened in the past. Keep to the past tense unless you are detailing scientific facts (“Our measured value was…”, as opposed to “Maxwell’s equations are…”)
§ Be sure to number pages and to include the authors’ last names on each page except the page with the title. This ensures that if the papers come loose for some reason, they can easily be sorted and identified.
1.3 Collaborative Writing
Typically, lab reports are submitted by a group rather than an individual. A common way to write group reports is to assign each group member to write a section of the report, and then to simply paste the different sections together. Don’t use this process. The result is invariably poorly organized and repetitive, and important details often get left out.
Your lab report should be coherent and concise, and this can only be ensured if each contributor has at least reviewed the entire document. A good practice is for lab partners to draft at least the first draft of the entire report together. This method proves to be more efficient than having each person work on a different section and later putting the sections together. After the first draft is done, the draft can be passed around for editing and finalizing. At this stage, each writer benefits from the feedback of the other group members o writing. The result should be a coherent, well written report.
Finally, a good test of whether the collaborative writing process was executed well is to see if each author can explain or account for every bit of the final report.

Prepared with the help of the SEAS Technical Communication Program 4 Ed. July, 2010
Section 2: Lab Report Requirements
Every lab report should have the following parts:
§ Title § Introduction § Prelab (if required) § Experimental Results § Conclusion § Authors’ Signatures
2.1 Title
You can either use a cover page containing your names, title of the report (including the lab number) and other information; or you can simply put this information at the top of the first page, centering the title on a line spaced down from your names and other information.
Example 2.1 Cover Page:
Ben Franklin Jorge Santiago
ESE 205 101 (Circuits Lab I) October 15, 1728
Lab 3: Basics of Power Supplies
The body of the report, beginning with the Introduction, will begin on the following page.
Example 2.2 – No Cover Page:
Benjamin Franklin Jorge Santiago ESE 205 – 101 (Circuits Lab I) October 15, 1728
Lab 3: Basics of Power Supplies
1 Introduction The purpose of this lab was to ….

Prepared with the help of the SEAS Technical Communication Program 5 Ed. July, 2010
2.2 Introduction
The Introduction should be a paragraph summarizing the purpose of the lab. Do not just copy the bullet list out of the lab manual.
The Introduction is not an Abstract. An Abstract summarizes the entire report. An Introduction simply prepares the reader to understand the lab report. In a longer report, the Introduction would give background information and would state the motivation for the current experiment.
Example 2.3: Sample Introduction
The purpose of this lab was to find the differences in the actual (measured) and the computed resistances of simple circuits, and to compare these to the allowed tolerances. In order to achieve this aim, we had to familiarize ourselves with the color code on resistors, the functions of the HP34401A Digital Multimeter (DMM), and Benchlink, which we used as the interface between the DMM and the computer.
2.3 Prelab (if necessary)
Most lab reports will normally not require a prelab section; however, for those that do, your pre lab section should summarize all calculations and theoretical work done in preparation for the lab and the expected values obtained.
2.4 Experimental Results & Discussion
When it comes to this part of your paper, you normally have two choices: combining the experimental results and discussion, or having separate experimental results and discussion sections. It is advisable to combine the two sections when the discussion of your data is short and each point you make refers to a specific result; however, you must separate the sections if your discussion is lengthy and refers to more than one part of your results.
2.4.1 Experimental Results
This section should describe the work that you did and the results obtained. It is important to include the experimental setup including the instruments used. This is usually done in the form of a schematic that shows all components and connections in such a way that somebody who reads the report can duplicate exactly what you did. Give the name and model number of the instruments.
Organize results in a readable manner. Write for a general interested audience rather than just for graders looking for answers to specific questions. A logical organization which emphasizes the motivation for each step, rather than just the results obtained, is preferred.
Organize your results using subsection headings. Headings should be in the same grammatical form in order to help your reader see the unity of the overall section.

Prepared with the help of the SEAS Technical Communication Program 6 Ed. July, 2010
Example 2.4 – Subheadings in the same grammatical form:
Resistor Selection Current and Voltage Measurements (not ‘Measuring the Current and Voltage’) Application of the Voltage Divider (not just, ‘Voltage Divider’)
Present all relevant calculations. Put relevant data in table form and use graphs and other graphics where necessary; however, do not submit raw data or graphics containing large amounts of information which is not relevant to the goals you stated in the introduction. Consult section three for more information on presenting experimental data.
2.4.2 Discussion
The discussion is the heart of your paper. This is the section where you compare the results you obtained from the experiment to theory and simulations you made before the experiment. In this section, you should also discuss errors and/or anomalous values in the results. What caused these anomalies? Do they undermine the value of the results you obtained? How did you take them into account during the experiment, or what further steps would you take to eliminate them in a similar experiment or lab exercise? You might suggest ways to minimize errors or test for the cause of anomalous results.
NOTE: Try to step back from the list of questions you were given for the lab. Answering a list of questions does not prepare you for professional technical writing. The answers should be in your report, but an organized and coherent lab report will not read like a list of answers.
2.5 Conclusion
The Conclusion section must be related to the aims stated in your introduction. Keeping in mind the aim of the lab, discuss the certainty and reliability of your results, and draw appropriate conclusions. You might want to talk about other interesting things you stumbled across in the course of your experiments which were not included in your aims. However, use careful wording and organization to make sure that the reader can keep sight of the main point of your conclusion, which is to relate your results to your initial aims. The conclusion is also the section for suggesting further work that needs to be done to support your current results.
2.6 Authors’ Signatures
Include the authors’ signatures and the date of the final report after your conclusion section.

Prepared with the help of the SEAS Technical Communication Program 7 Ed. July, 2010
Section 3: Experimental Results Details
3.1 Equations and Calculations
Equations are like graphics, but they are woven into the main body of your paper rather than set apart. An equation might form part of a sentence, but it still gets its own line in the text. Number your equations so you can easily refer back to them. Use an equation editor to format your equations correctly.
Example 3.1: An equation appropriately formatted
These results can be summarized in Ohm’s Law:
R V I IR V = ⇒ = (1)
If the discussion of the equation or variable flows naturally in the text of the discussion, don’t set it off. Be sure to define any variables, and to alter the line spacing so that subscripts, superscripts and the like still fit.
Example 3.2: An equation woven into the text of the document
From Ohm’s Law, we deduced that the current, I, through the resistor would be R V ,
where V is the voltage across the resistor and R is the resistance of that resistor.
Sample calculations should be labeled and treated like any other equation. For multipleline calculations make sure that lines are aligned at the appropriate equals (“=”) sign.
Example 3.3: A sample calculation
We found n to be approximately 1.73 as shown in Equation 2.
73 . 1 009313 . 0 018564 . 0 ln 025 . 0
0687 . 0 7168 . 0
ln ln
1
2
1 2
1
2 1 2
≈
− =
− = ⇒ = −
I I V
V V n I I nV V V
T
T
(2)

Prepared with the help of the SEAS Technical Communication Program 8 Ed. July, 2010
3.2 Tables
Tables should be labeled with a number (usually with the section number and the order of appearance—see examples) and a title at the top of the table and should be centered. Variables in a table may be defined in the paragraph or a graphic preceding the table, or in a caption underneath the table. Columns in the table with values that have the same units should have the units in the column heading.
Example 3.4: Formation of a table
Example 3.5: A table and the related figure
Our complex power values for the source, line, and load are shown in Table 3.1.
Table 3.1: Complex Power Values
Circuit Section Nominal Value (VA) Actual Value (VA) Source 0.0472∠ 37.40° 0.0448∠ 36.75° Line 0.0004∠ 43.66° 0.0004∠ 47.85° Load 0.0472∠ 37.34° 0.0443∠ 36.70°
Source: Modified from student lab report
Table 3.2 shows the circuit element values for figure 3.1.
Figure 3.1: Power Analysis Circuit Setup Source: Modified from lab manual
Table 3.2: Circuit Element Values for Power Analysis Circuit Setup Circuit Element Nominal Value Actual Value
Rline 10 Ω 10.00 Ω Lline 1mH 0.9235mH + 2.08 Ω Rp
Lload 100mH 105.4mH + 70.05 Ω Rp
Rload 820 Ω 812.4 Ω Rp denotes the parasitic resistance of the inductor.
Source: Modified from student lab report
Prepared with the help of the SEAS Technical Communication Program 9 Ed. July, 2010
3.3 Graphics
All graphics must be labeled (usually with the section number and the order of appearance— see examples) and must be explained briefly with a caption where necessary.
3.3.1 Graphs and Data Presentation
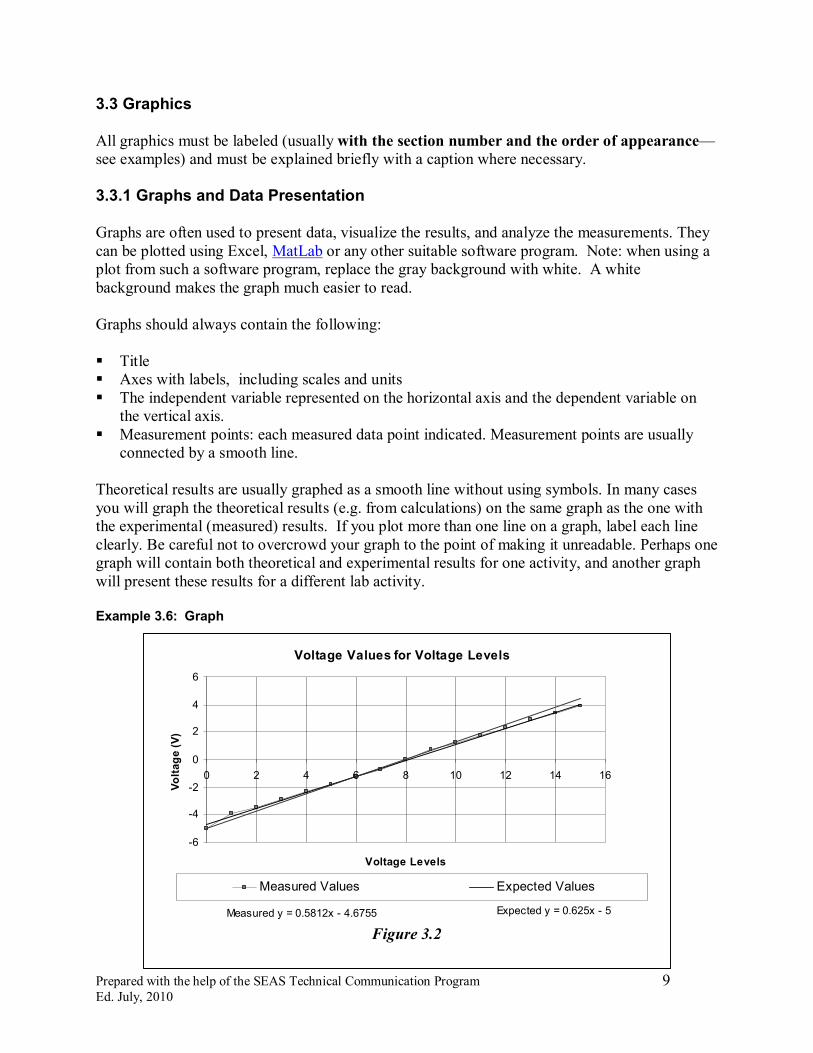
Graphs are often used to present data, visualize the results, and analyze the measurements. They can be plotted using Excel, MatLab or any other suitable software program. Note: when using a plot from such a software program, replace the gray background with white. A white background makes the graph much easier to read.
Graphs should always contain the following:
§ Title § Axes with labels, including scales and units § The independent variable represented on the horizontal axis and the dependent variable on
the vertical axis. § Measurement points: each measured data point indicated. Measurement points are usually
connected by a smooth line.
Theoretical results are usually graphed as a smooth line without using symbols. In many cases you will graph the theoretical results (e.g. from calculations) on the same graph as the one with the experimental (measured) results. If you plot more than one line on a graph, label each line clearly. Be careful not to overcrowd your graph to the point of making it unreadable. Perhaps one graph will contain both theoretical and experimental results for one activity, and another graph will present these results for a different lab activity.
Example 3.6: Graph
Voltage Values for Voltage Levels
Measured y = 0.5812x 4.6755 Expected y = 0.625x 5
6
4
2
0
2
4
6
0 2 4 6 8 10 12 14 16
Voltage Levels
Volta
ge (V
)
Measured Values Expected Values
Figure 3.2
Prepared with the help of the SEAS Technical Communication Program 10 Ed. July, 2010
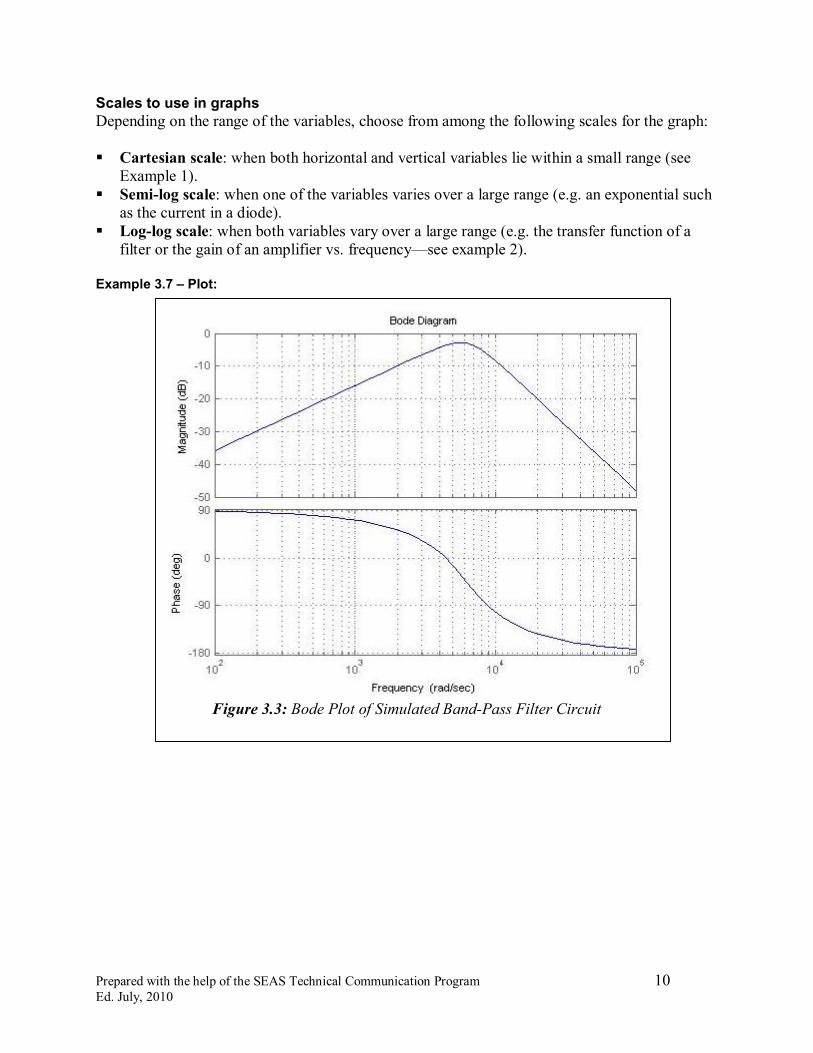
Scales to use in graphs Depending on the range of the variables, choose from among the following scales for the graph:
§ Cartesian scale: when both horizontal and vertical variables lie within a small range (see Example 1).
§ Semilog scale: when one of the variables varies over a large range (e.g. an exponential such as the current in a diode).
§ Loglog scale: when both variables vary over a large range (e.g. the transfer function of a filter or the gain of an amplifier vs. frequency—see example 2).
Example 3.7 – Plot:
Figure 3.3: Bode Plot of Simulated BandPass Filter Circuit

Prepared with the help of the SEAS Technical Communication Program 11 Ed. July, 2010
3.3.2 Captured Scope Images
Images from the scope, captured with Benchlink, can be pasted into the lab; however, do not paste in unformatted images or raw data that show information which is irrelevant to the purpose of your report. Make sure you label each graph and include units and scale.
Example 3.8: Scope Capture
Figure 3.4:Most Significant Bit pulse and input signal Vpp(1) Represents peaktopeak voltage of the input signal (sine wave [1]) Vpp(2) Represents the peaktopeak of the output pulse (square wave [2])
3.3.4 Schematics and Diagrams
State the source of your schematic or diagram if you copied it from the lab manual or another source.
Example 3.9: Circuit Schematic
Figure 3.5: 1 st Order low pass filter Source: Lab Manual
[1]
[2]
Prepared with the help of the SEAS Technical Communication Program 12 Ed. July, 2010
3.4 Error Analysis
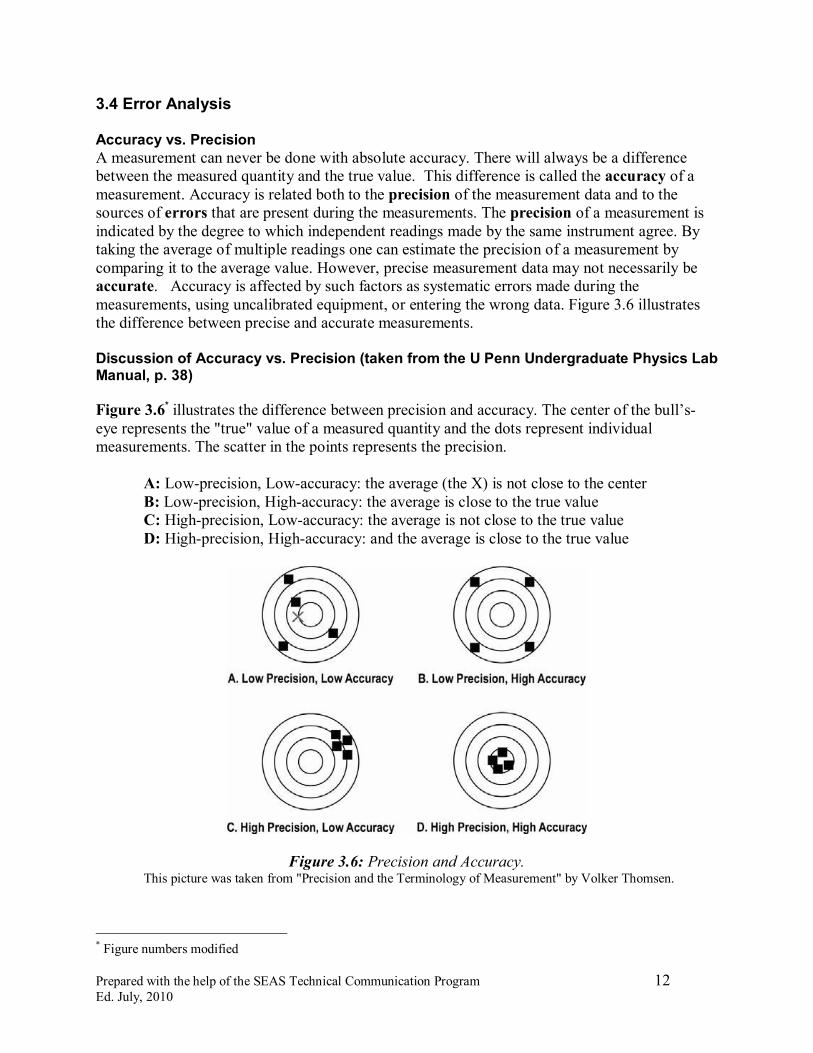
Accuracy vs. Precision A measurement can never be done with absolute accuracy. There will always be a difference between the measured quantity and the true value. This difference is called the accuracy of a measurement. Accuracy is related both to the precision of the measurement data and to the sources of errors that are present during the measurements. The precision of a measurement is indicated by the degree to which independent readings made by the same instrument agree. By taking the average of multiple readings one can estimate the precision of a measurement by comparing it to the average value. However, precise measurement data may not necessarily be accurate. Accuracy is affected by such factors as systematic errors made during the measurements, using uncalibrated equipment, or entering the wrong data. Figure 3.6 illustrates the difference between precise and accurate measurements.
Discussion of Accuracy vs. Precision (taken from the U Penn Undergraduate Physics Lab Manual, p. 38)
Figure 3.6 * illustrates the difference between precision and accuracy. The center of the bull’s eye represents the "true" value of a measured quantity and the dots represent individual measurements. The scatter in the points represents the precision.
A: Lowprecision, Lowaccuracy: the average (the X) is not close to the center B: Lowprecision, Highaccuracy: the average is close to the true value C: Highprecision, Lowaccuracy: the average is not close to the true value D: Highprecision, Highaccuracy: and the average is close to the true value
Figure 3.6: Precision and Accuracy. This picture was taken from "Precision and the Terminology of Measurement" by Volker Thomsen.
* Figure numbers modified
Prepared with the help of the SEAS Technical Communication Program 13 Ed. July, 2010
Sources of Error It is important to recognize the sources of error in order to avoid them or minimize their effect.
§ Systematic errors are caused by wrongly calibrated equipment, environmental influences (e.g. temperature, pressure and humidity) and systematically reading or entering the data incorrectly. Systematic errors can not be reduced by averaging multiple independent measurements.
§ Random or statistical errors are caused by a variety of sources and are randomly distributed. These errors can usually be reduced by taking multiple measurements and averaging them.
Instrument accuracy and tolerance (expressed as a percent of the measurement) is a possible source of error which it may not be possible to eliminate; however, it must be considered in an evaluation of the results.
Meaningful Significant Numbers Since a measurement always has a limited accuracy, one has to take this into account when recording the measured data. Each quantity is represented by a number that consists of
§ Significant figures (How many digits are listed to the right of the decimal point) § Units
The significant figures and the position of the decimal point indicate the accuracy of the measurements. Assume that you measure a voltage over a resistance. Each of the following numbers expresses a different level of certainty about the value of the measured voltage:
§ 7.3 V: indicates that the value is closer to 7.3V than to 7.2 or 7.4V § 7.30 V: indicates that the value is closer to 7.30 than to 7.29 or 7.31. The additional zero
indicates that one knows the value up to three significant numbers.
The last digit in a number indicates the level of uncertainty, so do not use more digits than can be justified based on the level of accuracy.
Assume that you have measured a resistor with three significant figures (which is quite accurate for a resistor). Any of the following representations will accurately represent your results:
§ 47.5 kOhm § 47.5 x 10 3 Ohm § 0.0475 MOhm
However, do not write: 47500.0 Ohm since that would imply that you have determined the value to 0.1 Ohm or with six significant figures!
Use power of 10 to indicate the number of significant digits (e.g. 47.5 x 10 3 instead of 47500).