Escola Superior d'Agricultura de Barcelona, Departament de ... · Spain....
12
leC i(i): pp-pp, year ISSN 1726-670X http://www.triple-c.at CC: Creative Commons License, 2011. Agent-based Models in malaria elimination strategy design J. Ferrer 1* , J. Albuquerque 2 , C. Prats 1 , D. López 1 and J. Valls 1 11 Escola Superior d'Agricultura de Barcelona, Departament de Física i Enginyeria Nuclear. Universitat Politècnica de Catalunya. C/ Esteve Terradas, 8. E-08860 Castelldefels (Barcelona), Spain. 1 Department de Física i Enginyeria Nuclear, Escola Superior d´Agricultura de Barcelona, Universitat Politècnica de Catalunya, Castelldefels, Spain. [email protected], [email protected], [email protected] [email protected]. +34.93.552.11.28. 2 Departamento de Estatística e Informática – Universidade Federal Rural de Pernambuco. Recife, PE, Brasil., [email protected], , +55.81.3320.6491. Abstract: The present work evaluates the methodology to plan, communicate and discuss specific interventions to tackle malaria spreading by comparing three representative and deliberately simple epidemic models: A) an epidemic continuous model of the human population, B) a population-based model that accounts for both hosts and vectors, and C) an Individual-based model that considers the same scenario as in (B). The paper proposes a standard protocol and the use of open-source and user-friendly simulation environments to communicate and discuss the models. Keywords: Agent-based models, Malaria, Epidemiology, Computational Modeling Acknowledgement: We thank the financial support of the Ministerio de Ciencia y Tecnología (CGL 2007-65142)
Transcript of Escola Superior d'Agricultura de Barcelona, Departament de ... · Spain....
leC i(i): pp-pp, year
ISSN 1726-670X
http://www.triple-c.at
CC: Creative Commons License, 2011.
Agent-based Models in malaria elimination strategy design
J. Ferrer1*, J. Albuquerque2, C. Prats1, D. López1 and J. Valls1
11
Escola Superior d'Agricultura de Barcelona, Departament de Física i Enginyeria Nuclear.
Universitat Politècnica de Catalunya. C/ Esteve Terradas, 8. E-08860 Castelldefels
(Barcelona), Spain.
1Department de Física i Enginyeria Nuclear, Escola Superior d´Agricultura de Barcelona, Universitat Politècnica de Catalunya, Castelldefels,
Spain. [email protected], [email protected], [email protected] [email protected]. +34.93.552.11.28.
2 Departamento de Estatística e Informática – Universidade Federal Rural de Pernambuco. Recife, PE, Brasil., [email protected], ,
+55.81.3320.6491.
Abstract: The present work evaluates the methodology to plan, communicate and discuss specific interventions to tackle malaria spreading by comparing three representative and deliberately simple epidemic models: A) an epidemic continuous model of the human population, B) a population-based model that accounts for both hosts and vectors, and C) an Individual-based model that considers the same scenario as in (B). The paper proposes a standard protocol and the use of open-source and user-friendly simulation environments to communicate and discuss the models.
Keywords: Agent-based models, Malaria, Epidemiology, Computational Modeling
Acknowledgement: We thank the financial support of the Ministerio de Ciencia y Tecnología (CGL 2007-65142)
tripleC i(i): pp-pp, year74111SN 1726-670X
http://www.triple-c.at
CC: Creative Commons License, 2011.
1. BACKGROUND
1. Strategies for malaria control, elimination and eradication
Malaria is a preventable and treatable disease that kills more than one million people per year, most of them children in the poorest countries of the equatorial and tropical biomes. Despite the efforts carried out to fight malaria, the burden of the disease is still severe in those regions where the disease is endemic (WHO, 2008a).
Today, malaria eradication is back on the agenda (WHO, 2008b). Global programs against malaria tackle a complex reality and deal with socioeconomic, logistic and environmental factors. From the scope of health care alone, the scheme to be followed must consider medical coverage scale-up and improvement, increasing control of the disease, generalized elimination and sustained surveillance (Molyneux et al, 2004, Greenwood, 2009). Global strategies regard temporal scales of the order of the decades and they contemplate unforeseen events such as the advent of new parasite resistance to drugs or the breakdown of local health systems (WHO, 2005). Yet, global strategies finally lie on local specific interventions, carried out by agents with a limited scope of action.
Elimination in areas of high, stable malaria transmission and with unrelenting vector prevalence requires new tools and the combination of interventions in multiple fronts (Boni, 2008; White et al, 2009). It also requires complicity and coordination of local agents and communities. The economic and human cost to carry out each intervention is substantial. Therefore, strategies at a local level must be carefully planned, easily communicated and continually evaluated (Rosensweig, 2009).
2. Epidemiology measurements and actions to tackle malaria
Planning strategies finally reposes on experience, heuristics and keen insight. However, several tools may serve to support and guide decision making.
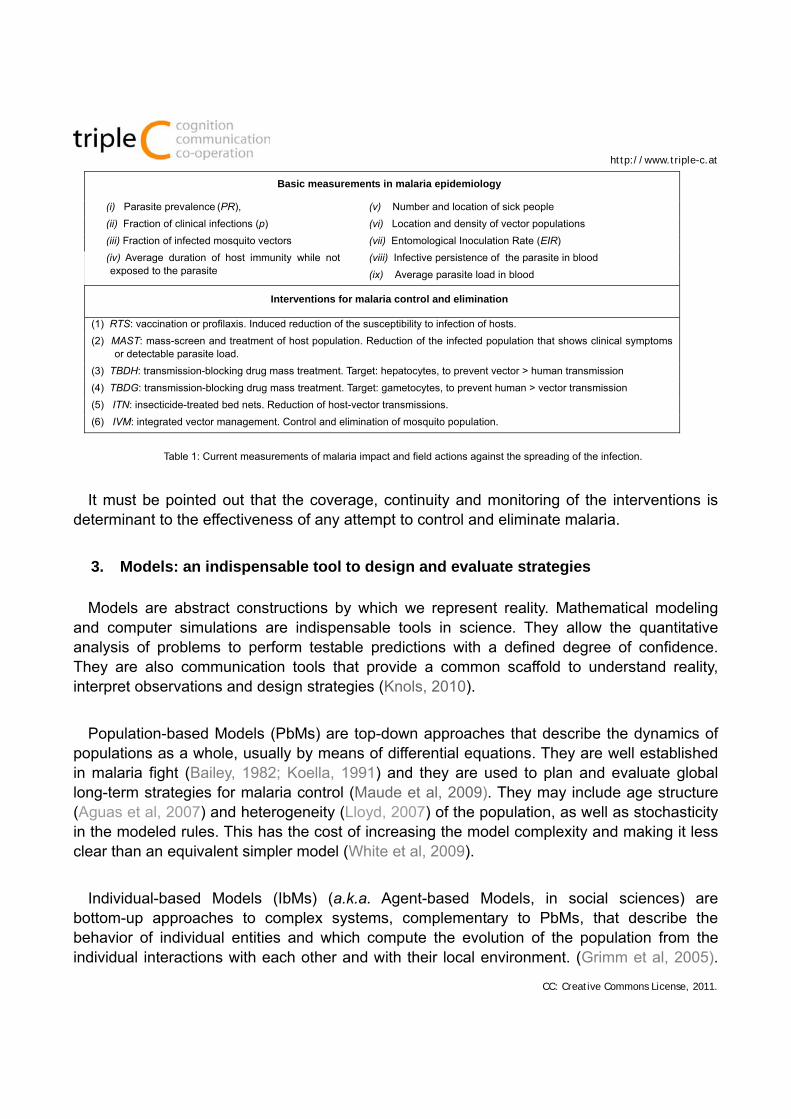
Impact of malaria is usually assessed through parasite prevalence (PR) and the fraction of clinical infections (p) (Smith and Hay, 2009). Predictions on malaria spreading are usually based on a single population-based calculated parameter: the reproduction number (R0) (Bailey, 1982). Interventions to target malaria aim to reduce R0 through the control of the vector population (mosquitoes), the reduction of human exposition to bites, and the treatment of symptomatic patients. Table 1 lists the usual measurements of malaria epidemics and the potential interventions to control the disease (White et al, 2009).
leC i(i): pp-pp, year
ISSN 1726-670X
http://www.triple-c.at
CC: Creative Commons License, 2011.
Basic measurements in malaria epidemiology
(i) Parasite prevalence (PR), (v) Number and location of sick people
(ii) Fraction of clinical infections (p) (vi) Location and density of vector populations
(iii) Fraction of infected mosquito vectors (vii) Entomological Inoculation Rate (EIR)
(iv) Average duration of host immunity while not exposed to the parasite
(viii) Infective persistence of the parasite in blood
(ix) Average parasite load in blood
Interventions for malaria control and elimination
(1) RTS: vaccination or profilaxis. Induced reduction of the susceptibility to infection of hosts.
(2) MAST: mass-screen and treatment of host population. Reduction of the infected population that shows clinical symptoms or detectable parasite load.
(3) TBDH: transmission-blocking drug mass treatment. Target: hepatocytes, to prevent vector > human transmission
(4) TBDG: transmission-blocking drug mass treatment. Target: gametocytes, to prevent human > vector transmission
(5) ITN: insecticide-treated bed nets. Reduction of host-vector transmissions.
(6) IVM: integrated vector management. Control and elimination of mosquito population.
Table 1: Current measurements of malaria impact and field actions against the spreading of the infection.
It must be pointed out that the coverage, continuity and monitoring of the interventions is determinant to the effectiveness of any attempt to control and eliminate malaria.
3. Models: an indispensable tool to design and evaluate strategies
Models are abstract constructions by which we represent reality. Mathematical modeling and computer simulations are indispensable tools in science. They allow the quantitative analysis of problems to perform testable predictions with a defined degree of confidence. They are also communication tools that provide a common scaffold to understand reality, interpret observations and design strategies (Knols, 2010).
Population-based Models (PbMs) are top-down approaches that describe the dynamics of populations as a whole, usually by means of differential equations. They are well established in malaria fight (Bailey, 1982; Koella, 1991) and they are used to plan and evaluate global long-term strategies for malaria control (Maude et al, 2009). They may include age structure (Aguas et al, 2007) and heterogeneity (Lloyd, 2007) of the population, as well as stochasticity in the modeled rules. This has the cost of increasing the model complexity and making it less clear than an equivalent simpler model (White et al, 2009).
Individual-based Models (IbMs) (a.k.a. Agent-based Models, in social sciences) are bottom-up approaches to complex systems, complementary to PbMs, that describe the behavior of individual entities and which compute the evolution of the population from the individual interactions with each other and with their local environment. (Grimm et al, 2005).
tripleC i(i): pp-pp, year74111SN 1726-670X
http://www.triple-c.at
CC: Creative Commons License, 2011.
The main role of IbM in malaria is to provide a better understanding of the host-vector system (Mckenzie et al, 1998; Keeling and Grenfell, 2000; Gu et al, 2003).
IbMs are mechanistically rich: they offer an explicit connection between the parameters and structure of the model and the mechanisms operating in reality (Ferrer et al, 2008). In consequence, they are a clear and intuitive representation of the reality, as it is experienced by the local agents (i.e. policy managers, health care workers and affected communities).
The purpose of this paper is to illustrate the suitability of the IbM approach as a prediction and communication tool in the design implementation and evaluation of field interventions at a local and short-range scales, complementary to the established PbM approach. It also proposes the use of standard forms to communicate and analize models.
2. METHODS
We present three deliberately simple epidemiological models of stable falciparum malaria in endemic region, we briefly review their structure and compare them one with each other and with experimental data. These models are too naive to capture important features of the disease, such as seasonality, multiplicity and coexistence of Plasmodium species and strains or age structure in the host population, yet, they can provide deeper insight regarding methodological issues. For this reason, their calibration is qualitative, and their comparison to reality is approximate.
Two of the models are PbMs (Models A and B), and the third one is an IbM with the same scheme as model B (Model C). Extended descriptions of each model and simulator are presented in the Appendix (see Additional file). The three models have been implemented and solved in the simulator platform NetLogo 4.1 (Wilensky, 1999).
2.1 Presentation of the models
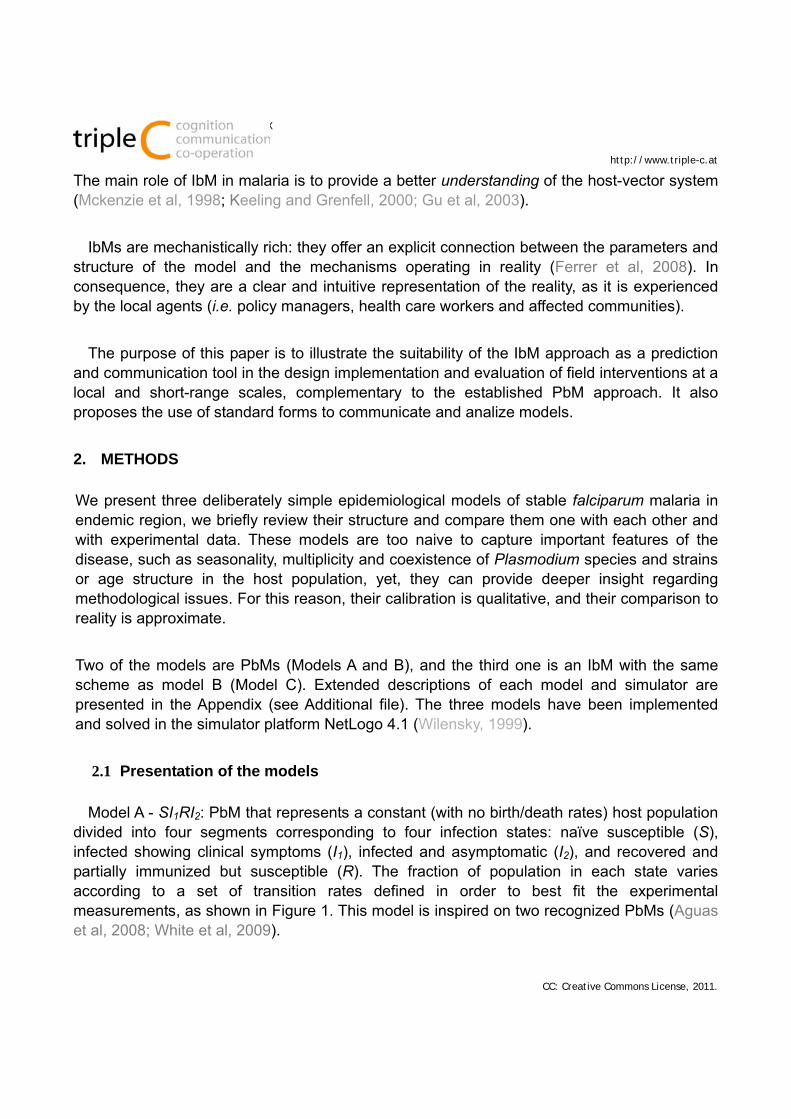
Model A - SI1RI2: PbM that represents a constant (with no birth/death rates) host population divided into four segments corresponding to four infection states: naïve susceptible (S), infected showing clinical symptoms (I1), infected and asymptomatic (I2), and recovered and partially immunized but susceptible (R). The fraction of population in each state varies according to a set of transition rates defined in order to best fit the experimental measurements, as shown in Figure 1. This model is inspired on two recognized PbMs (Aguas et al, 2008; White et al, 2009).
leC i(i): pp-pp, year
ISSN 1726-670X
http://www.triple-c.at
CC: Creative Commons License, 2011.
Model B - H(SI1RI2)-M(SI): PbM with the same structure as Model A for the host population (S, I1, I2 and R) but which also considers a mosquito population divided into two segments: susceptible (MS) and infectious (MI) vectors (Figure 1). It uses the same set of transition rates as Model A but includes two new parameters for transitions between vector subpopulations.
Model C: Spatially explicit IbM operating with the scheme of Model B applied to each individual (Figure 1). Its parameters are defined at an individual level and can be related to field measurements.
A B
+S I1 I2R
MS
MI
1
1
τ
pM rM
C
2
1
τ
A B
+S I1 I2R
MS
MI
1
1
τ
pM rM
C
2
1
τ
Figure 1: Schemes of the three models. Model A: PbM SI1RI1, Model B: PbM H(SI1RI2)-M(SI). Model C: IbM H(SI1RI2)-M(SI). Human figures represent subpopulations in A,B and individuals in C, in the infection states: susceptible -green, S-, clinically infected -red, I1-- asymptomatic infected -orange, I2- and recovered -grey, R-. Mosquitoes represent infectious and susceptible vector populations in Models A, B and individuals in Model C. Black –healthy mosquito MS -, and white – infected carrier MI- . force of infection, irecovery time of infection stage i, rate of loss of acquired immunity, pM: probability of infection of vector, rM: renewal rate of vector.
The direct outputs of the models are parasite prevalence (PR) and fraction of clinical infections (p). They are obtained at each time step (t) with:
(t)I+(t)I+R(t)+S(t)
(t)I+(t)I=(t)PR
21
21
[1]
(t)I
(t)I=(t)p
2
1
. [2]
Model C has two additional output variables, the force of infection, , and the Entomological Inoculation Rate, (EIR, Kelly-Hope and McKenzie, 2009) which can be compared with field measurements and with the input parameters of the PbMs.
nesscontagiousofdurationxhostsesusceptiblofNumber
contagionshostofNumber=λ(t) [3]
hostsofNumber
contagionshostofNumber=EIR(t) . [4]
tripleC i(i): pp-pp, year74111SN 1726-670X
http://www.triple-c.at
CC: Creative Commons License, 2011.
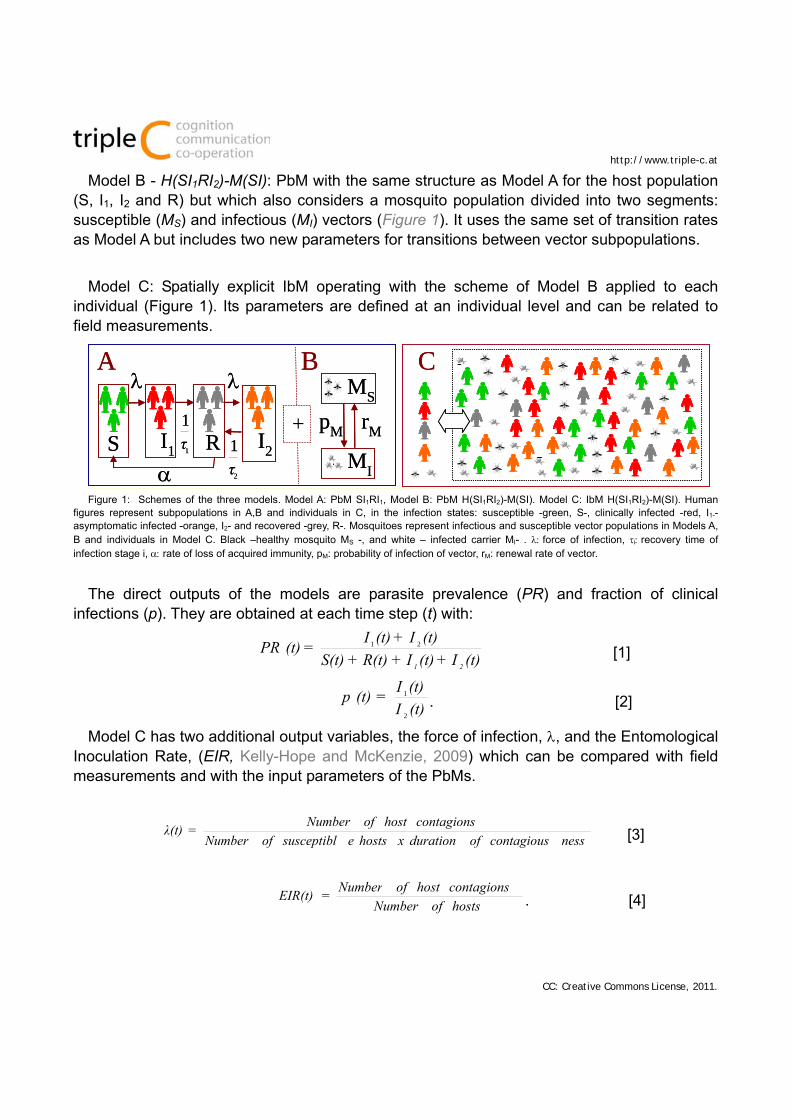
2.2 Relation between the parameters of the models and the real measurements
Parameter and biological meaning Models Real-world
observation* Real-world action*
force of infection A (i)-(viii) (1)-(6)
irecovery rate of Ii A,B,C (viii) (2)
relative infectivity of 1 to 2 A,B,C (viii) (1)
loss of immunity A,B,C (iv) -
pH: infection probability of host B,C (vii) (1,3,5)
pM: infection probability of vector B,C (vi) ( 4, 5)
rM: death rate of vectors B,C (iii) (6)
Table 2: Parameters of equivalent PbM and IbM models and their relation with the real-world measurements and field interventions (* see Table 1).
Table 2 presents the model parameters and relates them with real interventions and measurements. Their values are inferred from data in the literature, taken from average measurements or adjusted in such a way that model outcomes best fit the field observations (Aguas et al, 2008). Table 2 shows that Model A is highly aggregated (Ferrer et al, 2009): it incorporates a lot of the measurable information into a single parameter, the force of infection (�). This makes it quite obscure, as alone mainly drives the evolution of the infection. Moreover, this parameter is defined rather circularly:
21
2
0 I+R+I+Sα
I+IR=λ 1
, [5]
where
21
0
1
τ
p+
τ
pβ·=R , [6]
and
2
φI+I
λ=β
1
. [7]
Actually, this poses no problem from the practical point of view, as its value is set to best fit the field data. Nevertheless, it makes a blind hodgepodge parameter, barely usable for the design of particular strategies.
Model B replaces the parameter by the infection probability of hosts (pH), and adds two parameters for the vector population: infection probability of (pM) and renewal rate (rM). Shifting from Model B to Model A only requires calculating as:
leC i(i): pp-pp, year
ISSN 1726-670X
http://www.triple-c.at
CC: Creative Commons License, 2011.
M
MH
r
·pp=λ [8]
Model C uses the same infection scheme as Model B but its parameters are individually defined. For instance, pH stands for the probability of a host being infected when coming upon a carrier vector, rather than the rate of vectors infecting hosts. Thus, they are more easily linked one-to-one with real-world phenomena, which may be independently modified by different field interventions.
3 RESULTS AND DISCUSSION
3.1 Comparison of the outcome of the three models
Models A, B and C have been compared one to each other and to experimental data available in the literature (Aguas et al, 2008; White et al, 2009). As a result of this comparison, it is found that:
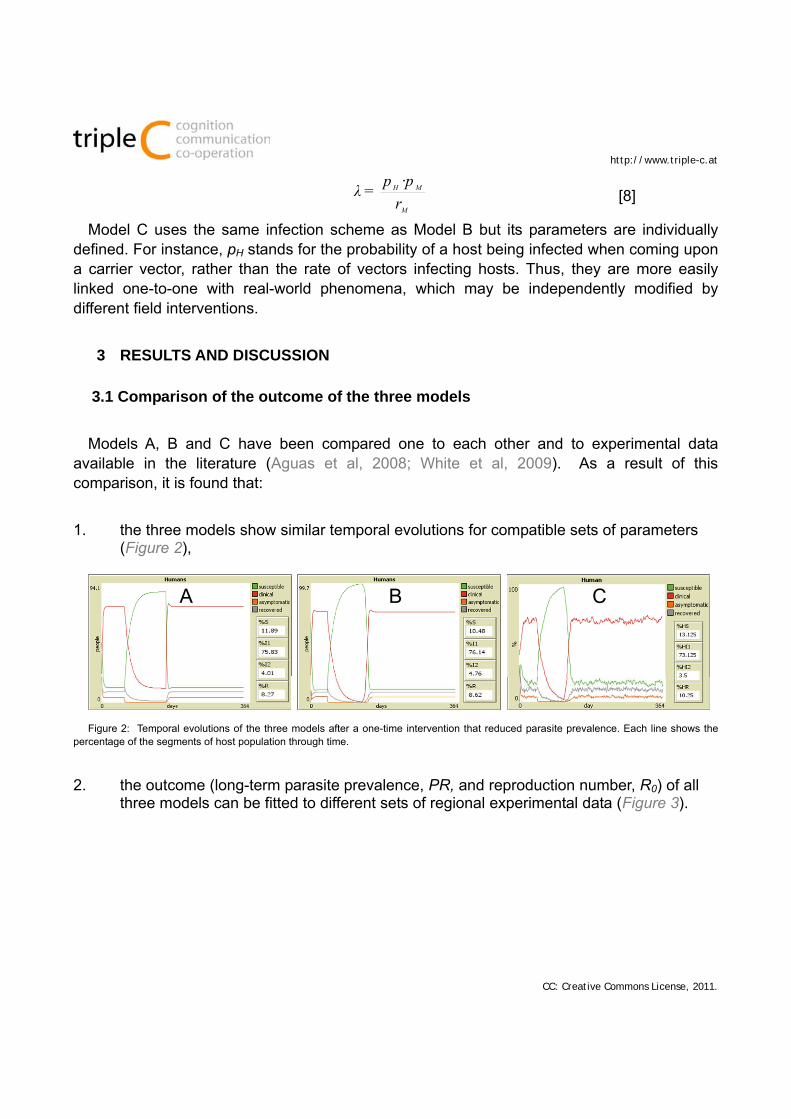
1. the three models show similar temporal evolutions for compatible sets of parameters (Figure 2),
CBA CBA
Figure 2: Temporal evolutions of the three models after a one-time intervention that reduced parasite prevalence. Each line shows the
percentage of the segments of host population through time.
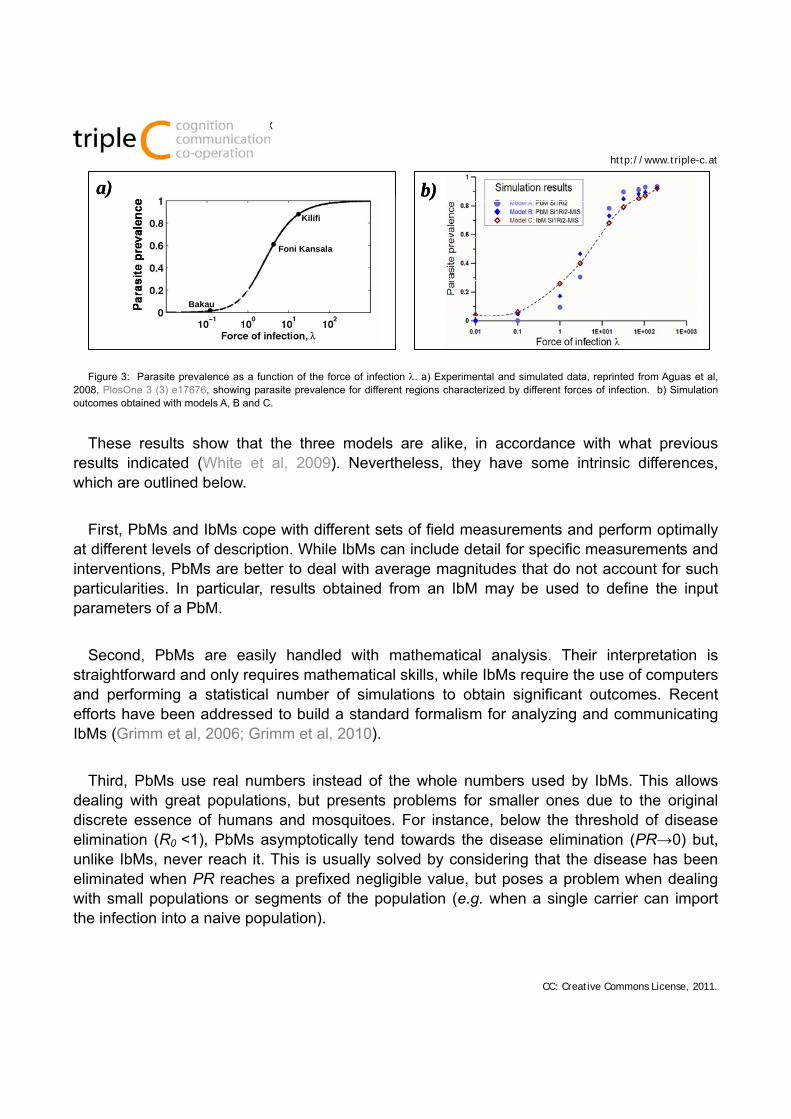
2. the outcome (long-term parasite prevalence, PR, and reproduction number, R0) of all three models can be fitted to different sets of regional experimental data (Figure 3).
tripleC i(i): pp-pp, year74111SN 1726-670X
http://www.triple-c.at
CC: Creative Commons License, 2011.
a) b)
Bakau
Foni Kansala
Kilifi
a) b)
Bakau
Foni Kansala
Kilifi
Figure 3: Parasite prevalence as a function of the force of infection . a) Experimental and simulated data, reprinted from Aguas et al, 2008, PlosOne 3 (3) e17676, showing parasite prevalence for different regions characterized by different forces of infection. b) Simulation outcomes obtained with models A, B and C.
These results show that the three models are alike, in accordance with what previous results indicated (White et al, 2009). Nevertheless, they have some intrinsic differences, which are outlined below.
First, PbMs and IbMs cope with different sets of field measurements and perform optimally at different levels of description. While IbMs can include detail for specific measurements and interventions, PbMs are better to deal with average magnitudes that do not account for such particularities. In particular, results obtained from an IbM may be used to define the input parameters of a PbM.
Second, PbMs are easily handled with mathematical analysis. Their interpretation is straightforward and only requires mathematical skills, while IbMs require the use of computers and performing a statistical number of simulations to obtain significant outcomes. Recent efforts have been addressed to build a standard formalism for analyzing and communicating IbMs (Grimm et al, 2006; Grimm et al, 2010).
Third, PbMs use real numbers instead of the whole numbers used by IbMs. This allows dealing with great populations, but presents problems for smaller ones due to the original discrete essence of humans and mosquitoes. For instance, below the threshold of disease elimination (R0 <1), PbMs asymptotically tend towards the disease elimination (PR→0) but, unlike IbMs, never reach it. This is usually solved by considering that the disease has been eliminated when PR reaches a prefixed negligible value, but poses a problem when dealing with small populations or segments of the population (e.g. when a single carrier can import the infection into a naive population).
leC i(i): pp-pp, year
ISSN 1726-670X
http://www.triple-c.at
CC: Creative Commons License, 2011.
Finally, simple PbMs are often deterministic but IbMs usually consider stochasticity. Thus, a PbM always gives the same outcome for a fixed set of parameters. An indirect consequence of this is that qualitative changes in the outcome of a PbM may occur in very sharp transitions. For instance, in the threshold R0 ≈ 1, if the model concludes that a certain intervention must be maintained for a span teff in order to lead to elimination, it is actually stating that any intervention lasting t = teff -is ineffective, while it works well as soon as t = teff + , even for minute values of (Aguas et al, 2008). Such non-realistic behavior of deterministic PbMs arises from the fact that continuous variables may present mathematical singularities near some particular values. A similar phenomenon occurs due to the chaotic behavior of the deterministic equations for certain sets of parameters. In this case, the outcome is highly sensitive to initial conditions, rendering long-term prediction impossible. In contrast, the dynamics of IbMs usually evolve towards fixed or limited attractors, this meaning that their predictions are circumscribed around an average outcome, and show a definite variance.
3.2 Results obtained with the IbM
Over 10,000 simulations have been carried out to scan the parameter space of Model C in a closed system, in the short and middle-term (each run representing 1 year). Some general results are listed below.
Stochastic variability of the model outcome is PR < 5 % after modifying only the random seed.
Modifications on the density of host and/or vector populations strongly influence the simulator outcome.
Several modeled actions may lead to local disease elimination: Reducing the transmission rates pH and pM. These represent RTS and TBDH, and
TBDG strategies, respectively, in the real world. In order to reduce pM, it is important to block the transmission from both the clinically infected and asymptomatic hosts.
Permanently reducing the population density of vectors, so that the host-vector encounter is less probable. This represents IVM interventions.
The number of infective encounters is also reduced with ITN, which can be represented in the model by the joint reduction of pM and pH.
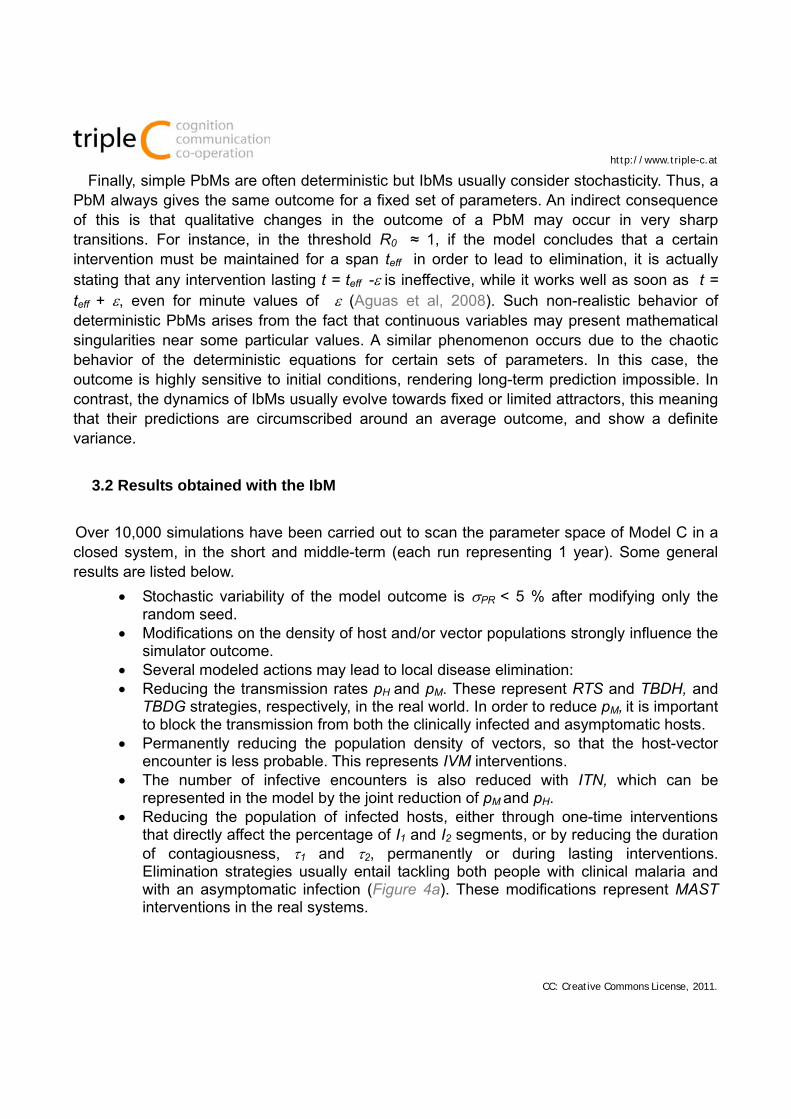
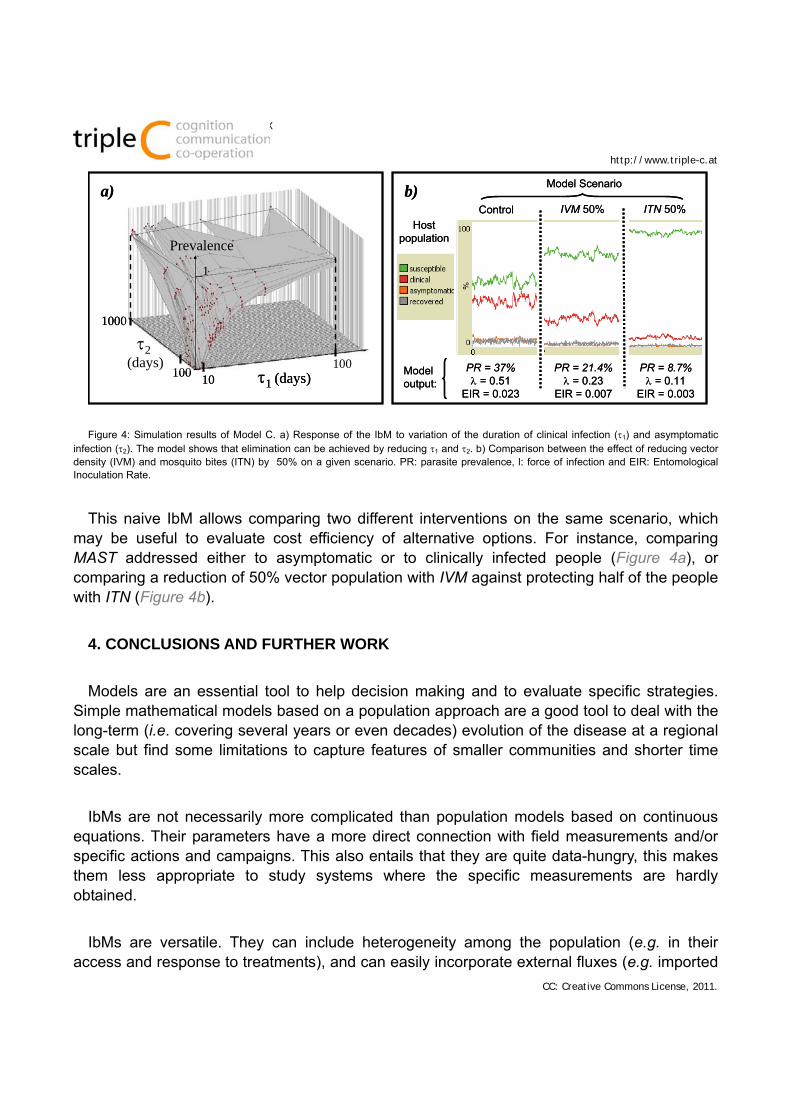
Reducing the population of infected hosts, either through one-time interventions that directly affect the percentage of I1 and I2 segments, or by reducing the duration of contagiousness, 1 and 2, permanently or during lasting interventions. Elimination strategies usually entail tackling both people with clinical malaria and with an asymptomatic infection (Figure 4a). These modifications represent MAST interventions in the real systems.
tripleC i(i): pp-pp, year74111SN 1726-670X
http://www.triple-c.at
CC: Creative Commons License, 2011.
Control IVM 50% ITN 50%
PR = 37% = 0.51
EIR = 0.023
PR = 21.4% = 0.23
EIR = 0.007
PR = 8.7% = 0.11
EIR = 0.003
Modeloutput:
Model Scenario
Hostpopulation
b)
Prevalence
1 (days)
2 (days)
_1
100
1000
10010
a)Control IVM 50% ITN 50%
PR = 37% = 0.51
EIR = 0.023
PR = 21.4% = 0.23
EIR = 0.007
PR = 8.7% = 0.11
EIR = 0.003
Modeloutput:
Model Scenario
Hostpopulation
b)
Prevalence
1 (days)
2 (days)
_1
100
1000
10010
a)
Figure 4: Simulation results of Model C. a) Response of the IbM to variation of the duration of clinical infection (1) and asymptomatic infection (2). The model shows that elimination can be achieved by reducing 1 and 2. b) Comparison between the effect of reducing vector density (IVM) and mosquito bites (ITN) by 50% on a given scenario. PR: parasite prevalence, l: force of infection and EIR: Entomological Inoculation Rate.
This naive IbM allows comparing two different interventions on the same scenario, which may be useful to evaluate cost efficiency of alternative options. For instance, comparing MAST addressed either to asymptomatic or to clinically infected people (Figure 4a), or comparing a reduction of 50% vector population with IVM against protecting half of the people with ITN (Figure 4b).
4. CONCLUSIONS AND FURTHER WORK
Models are an essential tool to help decision making and to evaluate specific strategies. Simple mathematical models based on a population approach are a good tool to deal with the long-term (i.e. covering several years or even decades) evolution of the disease at a regional scale but find some limitations to capture features of smaller communities and shorter time scales.
IbMs are not necessarily more complicated than population models based on continuous equations. Their parameters have a more direct connection with field measurements and/or specific actions and campaigns. This also entails that they are quite data-hungry, this makes them less appropriate to study systems where the specific measurements are hardly obtained.
IbMs are versatile. They can include heterogeneity among the population (e.g. in their access and response to treatments), and can easily incorporate external fluxes (e.g. imported
leC i(i): pp-pp, year
ISSN 1726-670X
http://www.triple-c.at
CC: Creative Commons License, 2011.
malaria), discrete interventions and unexpected events (e.g. abrupt cessation of interventions) with slight modification of the model structure. For this reason, they represent a good tool for the planning and evaluation of realistic field strategies in short temporal scales.
NetLogo and other user-friendly IbM modeling environments are appropriate frameworks to use IbMs as communication tools, to represent and discuss local strategies against malaria with decisive agents (MOSIMBIO, 2010). They are adequate for non-modelers and policy makers because they present very simple interfaces that allow an easy manipulation of the real-world schemes.
The models presented here are deliberately simple in nature. They are put forward to illustrate essential differences in the methodological approaches to model malaria epidemics, rather than to present realistic results on specific systems. Nevertheless, even such simple models provide important insight. The most remarkable result in this sense is that asymptomatic infected people represent a permanent pool of the parasite that must be tackled to achieve elimination.
Perspectives for the current model include its application to the analysis of past and future strategies for controlled real-world communities, for instance, IBMs can include Geographic Information Systems (GIS) in spatially explicit frameworks and they can account for particularities of specific scenarios (Perez and Dragicevic, 2009). The IbM is currently in the process of being adapted to allow for the description of the epidemiology in the national park of Jaú, Brasil. This requires an increase of complexity of the model to incorporate geoepidemiological constraints of the rainforest biomes, ecological landscapes of multiple parasite and strains, and specific traits of P. vivax. Nevertheless, these improvements do not affect the scaffolding of the model and can be easily integrated in the IbM structure.
REFERENCES
- Aguas R, White L J, Snow R W and Gomes M G M, 2008. Prospects for Malaria Eradication in Sub-Saharan Africa. PlosOne 3 (3) e17676
- Bailey, N T J, 1982. The Biomathematics of Malaria. Charles Griffin & Co Ltd. - Ferrer J, Prats C, López D, 2008. Individual based modeling, an essential tool for J. Biol. Phys. 34 (1-2) 19-37. - Ferrer J, Prats C, López D and Vives-Rego J., 2009. Mathematical modeling methodologies in predictive food microbiology: a SWOT
analysis. Int. J. Food Micro. 134 (1-2), 2-8. - Greenwood B, 2009 Can malaria be eliminated? Trans. R. Soc. Trop. Med. Hyg. 2009, 103:S2-5. - Grimm V., Revilla, E., Berger, U., Jeltsch, F., Mooij, W.M., Railsback, S.F., Thulke, H. H., Weiner, J., Wiegand,T. and DeAngelis, D.L.,
2005. Pattern-oriented modeling of agent-based complex systems: lessons from ecology. Science 310 (5750), 987-991. - Grimm, V., Berger, U., Bastiansen, F., Eliassen, S., Ginot, V., Giske, J., Goss-Custard, J., Grand, T., Heinz, S.K., Huse, G., Huth, A.,
Jepsen, J.U., Jorgensen, C., Mooij, W.M., Muller, B., Pe'er, G., Piou, C., Railsback, S.F., Robbins, A.M., Robbins, M.M., Rossmanith, E., Ruger, N., Strand, E., Souissi, S., Stillman, R.A., Vabo, R., Visser, U., DeAngelis, D.L., 2006. A standard protocol for describing individual-based and agent-based models. J. Ecol. Model. 198 (1), 115-126.
- Grimm, V., et al., 2010. The ODD protocol: A review and first update. J. Ecol. Model. 221, 2760–2768. - Gu W, Killen G F, Mbogo C M, Regens J L, Githure J I and Beier J C, 2003. An individual-based model of Plasmodium falciparum
malaria transmission on the coast of Kenya. Trans. Roy. Soc. Med. Hyg. 97, 43-50. - Keeling, M J and GrenfellB, T, 2000. Individual-based perspectives on R0. J. Theor Biol. 2000.
tripleC i(i): pp-pp, year74111SN 1726-670X
http://www.triple-c.at
CC: Creative Commons License, 2011.
- Kelly-Hope L A and McKenzie F E, 2009. The multiplicity of malaria transmission: a review of entomological inoculation rate measurements and methods across sub-saharan Africa. Malar. J. 8:19
- Knols, 2010 Malaria Elimination: When the Tools Are Great but Implementation Falters. Am. J. Trop. Med. Hyg., 82(2), 2010, pp. 174–175
- Koella, J C, 1991. On the use of mathematical models of malaria transmission. Acta Tropica 49, 1-25. - Lloyd L, Zhang J and Root A M, 2007. Stochasticity and heterogeneity in host–vector models. J. R. Soc. Interfaces 4, 851-863. - McKenzie, F.E, Wong R C and Bosset W H, 1998. Discrete event simulation of Plasmodium falciparum malaria. Simulation 71, 256-261. - Molyneux DH, Hopkins DR, Zagaria N, 2004. Disease eradication, elimination and control: the need for accurate and consistent usage.
Trends Parasitol 2004, 20:347-51. Trends in Parasitol. 20. - MOSIMBIO, 2010. Web site of the group. http://mosimbio.upc.edu/research-topics/malaria/indisim-epi/introepi) - Perez L and Dragicevic S, 2009. An agent-based approachfor modeling dynamics of contagious disease spread. Int. J. Health Geo.
8:50. - Rosensweig, F and Williams J, 2008. Guidelines for assessing the Management and Organizational Capacity of National Malaria
Control Programs. USAID-RBM. Bethesda, MD. Health Systems 20/20 project, Abt Associates Inc. - Smith DL, Hay SI, 2009. Endemicity response timelines for Plasmodium falciparum elimination. Malar. J., 8:87. - White LJ:, Maude RJ, Pontavornpinyo W, Saralamba S, Dondorp AM, Day NP, White NJ, 2009. The role of mathematical modeling in
malaria elimination and eradication. Malar. J., 8:212. - WHO, 2005, Malaria control in complex emergencies- an Inter-agency-Field-handbook. Ed.: Sarah balance, WHO press, Geneva,
Switzerland. - WH0, 2008a. Global malaria control and eradication. Report of a technical review. Ed.: Katherine Mendis, WHO Press, Geneva,
Switzerland. - WHO, 2008b. Malaria eradication back on the table. Ed.: Tanner M, Savigny D. WHO Bull. 82 (2) 81-160. - Wilensky, U, 1999. NetLogo. http://ccl.northwestern.edu/netlogo/. Center for Connected Learning and Computer-Based Modeling,
Northwestern University, Evanston, IL.
AUTHOR INFORMATION AND CONTRIBUTIONS
DL and JV are senior researchers in IbM of complex systems in the context of theoretical ecology and applied microbiology. JF and CP are two postdocs from the same group, MOSIMBIO. JA is a Professor at the Department of Statistics and Informatics of the Federal Rural University of Pernambuco, Brazil, where he coordinates the Research Group for Computational Modeling..
JF designed the models and carried out the simulations. CP and DL proposed the virtual experiments and criteria to compare the models with each other and with the experimental results. CP and JV assisted in the calibration, analysis of sensitivity and optimization of the simulator. JF and JA shaped the discourse of the manuscript