ESADE_PoliticalEconomyLAC
49
Latin America — The Political Economy of The Possible or of The Impossible? Fiscal policy in slowdown times Angel Melguizo OECD Development Centre Latin American Economies in a Globalised World ESADE – June 3 2015
-
Upload
oecd-ocde -
Category
Economy & Finance
-
view
110 -
download
0
Transcript of ESADE_PoliticalEconomyLAC

Latin America — The Political Economy of The
Possible or of The Impossible?
Fiscal policy in slowdown times
Angel Melguizo
OECD Development Centre
Latin American Economies in a Globalised World
ESADE – June 3 2015

Latin American Economic Outlook
1 Short-term slowdown, medium-term reforms?
More than revenues: Fiscal policy for development 2
Latin America – Fiscal policy in slowdown times
Enabling tax reforms 3

Growth forecasts for LAC have adjusted downwards…
3 Source: OECD Economic outlook 2014. For LAC, IMF and Consensus Forecast
GDP Growth (% annual)
-4
-2
0
2
4
6
8
2000 2001 2002 2003 2004 2005 2006 2007 2008 2009 2010 2011 2012 2013 2014 2015
%OECD Latin America and the Caribbean

Source: OECD Economic Outlook 2015, OECD Secretariat forecasts and Consensus (Venezuela) 4
GDP growth in selected LAC countries (% annual)
…with significant variation across countries
-8
-6
-4
-2
0
2
4
6
8
Argentina Brazil Chile Colombia Costa Rica Mexico Peru Venezuela
2002-2013 2014 2015 2016

Note: Output gap calculated with HP filter and IMF forecasts (April 2015)
Source: OECD Development Centre 5
2015 Cyclical position (selected countries; output gap)
The cyclical position of LAC is difficult to determine…
BRIICS
America Latina EspañaItalia
Francia
Reino Unido
AlemaniaEEUUJapon
-0.04
-0.03
-0.02
-0.01
0
0.01
0.02
0.03
0.04
Crecimiento por encima de la tendencia

6
… in fact, there are “several Latin Americas”
Argentina
The Bahamas
Barbados
Bolivia
Brazil
ChileCosta Rica
ColombiaDominican Republic
Ecuador
El Salvador
Guatemala
Honduras
Jamaica
Mexico
Nicaragua
Panama
Paraguay
Peru
Trinidad and Tobago
Uruguay
Venezuela
-0.04
-0.03
-0.02
-0.01
0
0.01
0.02
0.03
0.04Series1ArgentinaThe BahamasBarbadosBoliviaBrazilChileColombiaCosta RicaDominican RepublicEcuadorEl SalvadorGuatemalaHondurasJamaicaMexicoNicaraguaPanamaParaguayPeruTrinidad and TobagoUruguayVenezuela
2015 Cyclical position (selected countries; output gap)
Note: Output gap calculated with HP filter and IMF forecasts (April 2015)
Source: OECD Development Centre

7
Less so in terms of trend growth
Argentina
Colombia
Peru
ChileCosta Rica
Brazil
Mexico
Venezuela
-0.1
-0.08
-0.06
-0.04
-0.02
0
0.02
0.04
0.06
0.08
0.1
LAC 7 and Costa Rica
Cycle 2015
Argentina forecasts
Colombia forecasts
Peru forecasts
Chile forecasts
Mexico forecasts
Brazil forecasts
Costa Rica forecasts
Venezuela forecasts
2015-2017 Cyclical position - LAC (selected countries; output gap)
Note: Output gap calculated with HP filter and IMF forecasts (April 2015)
Source: OECD Development Centre

The Middle Income Trap is a persistent phenomenon for the entire
region
Middle Income Trap in LAC and selected OECD countries (per capita GDP, 1990 USD PPP)
Source: OECD-CAF-ECLAC (2014), Latin American Economic Outlook 2015 8
0
5000
10000
15000
20000
25000
CHL URY ARG VEN CRI MEX COL BRA PERU DOM COR IRL ESP
1950
RB
RA
RB
RM
RA

Source: OECD-CAF-ECLAC (2014), Latin American Economic Outlook 2015 9
0
5000
10000
15000
20000
25000
CHL URY ARG VEN CRI MEX COL BRA PERU DOM COR IRL ESP
1980 1950
RB
RM
RA
Middle Income Trap in LAC and selected OECD countries (per capita GDP, 1990 USD PPP)
The Middle Income Trap is a persistent phenomenon for the entire
region

The Middle Income Trap is a persistent phenomenon for the entire
region
10
0
5000
10000
15000
20000
25000
CHL URY ARG VEN CRI MEX COL BRA PERU DOM COR IRL ESP
2013 1980 1950
RB
RM
RA
Middle Income Trap in LAC and selected OECD countries (per capita GDP, 1990 USD PPP)
Source: OECD-CAF-ECLAC (2014), Latin American Economic Outlook 2015

Latin America in Shifting Wealth: more an spectator than an actor
Contribution to global growth (%)
50%
19%
8%
4%
1%
18%
1990-1995
32%
41%
9%
6%
3%
9%
2005-2012
Economies avancées Asie émergente Amérique latine
Moyen Orient et Afrique du Nord Afrique subsaharienne Reste du monde
Source: OECD-CAF-ECLAC (2013), Latin American Economic Outlook 2014 11

Productivity is not everything, but in the long run is almost everything
(P. Krugman)
Source: Melguizo, A. y J.R. Perea (2015), “Skill gaps in emerging economies: An empirical
analysis”, Working Papers, OECD Development Centre.
Labour productivity in selected Latin American and Asian countries (% of US productivity, 5-year moving average, PPP)
12
0%
10%
20%
30%
40%
50%
60%
70%
1954 1958 1962 1966 1970 1974 1978 1982 1986 1990 1994 1998 2002 2006 2010
Chile
Corea
AL-7
Colombia
China
Mexico

The region stands out in income inequality
13 Source: OECD (2014), “Does income inequality hurt economic growth?”, Focus in Inequality and Growth.
Inequality in Chile, Mexico, the US and the OECD (Gini of income inequality)
0.20
0.25
0.30
0.35
0.40
0.45
0.50
0.55
1975 1980 1985 1990 1995 2000 2005 2010
Gin
i co
effi
cien
t o
f in
com
e in
equ
alit
y

Inequality is similar in OECD and Latin America before paying taxes
and getting transfers and services
14 Source: ECLAC (2014), El impacto distributivo de la accion fiscal en America Latina.
Inequality in Latin America and the OECD (Gini indexes before direct taxes, education and health services)
0.2
0.3
0.4
0.5
0.6A
RG
BO
L
BR
A
CH
L
CO
L
CR
I
ECU
SLV
HN
D
MEX NIC
PA
N
PA
R
PER
DO
M
UR
Y
OEC
D
Redistribution in Latin America is much weaker
15
Inequality in Latin America and the OECD (Gini indexes before and after direct taxes, education and health services)
0.2
0.3
0.4
0.5
0.6A
RG
BO
L
BR
A
CH
L
CO
L
CR
I
ECU
SLV
HN
D
MEX NIC
PA
N
PA
R
PER
DO
M
UR
Y
OEC
D
Market income Disposable extended income
Source: ECLAC (2014), El impacto distributivo de la accion fiscal en America Latina.

16
Macroeconomic outlook: some policy implications
• Short-term measures to face the slowdown:
• Recover fiscal space through tax base expansion and
expenditure containment
• Countercyclical monetary policy
• Long-term policies to expand potential growth
• The political economy of reforms: is the momentum over after 14
presidential elections 2012-2014?

Latin American Economic Outlook
1 Short-term slowdown, medium-term reforms?
More than revenues: Fiscal policy for development 2
Latin America - fiscal policy in times of economic slowdown
Enabling tax reforms 3
Education
Infrastructures
Fiscal policy

Fiscal policy for development – I. Education
Public expenditure has converged with OECD average …
18
Source: OECD-CAF-ECLAC (2014), Latin American Economic Outlook 2015, with data from UNESCO Institute for Statistics
Public expenditure in education by category, LAC and OECD (% GDP, circa 2012)
0.0
0.5
1.0
1.5
2.0
2.5
3.0
3.5
4.0
4.5
5.0
5.5
PAN PER GTM SLV ECU PRY CRI COL CHL DOM MEX VEN BOL BRA ARG ALC OCDE
Secundaria
Primaria
Pre-primaria

Fiscal policy for development – I. Education
…there are still challenges related to quality and equity
Performance and equity in secondary education
HKG
MAC
CHL
FIN
KOR
MEX
ARG
BRA
COL
CRI
PER
URY
OtrosOCDE
AL
350
400
450
500
550
600
650
0 5 10 15 20 25 30 35 40 45 50
Porcentaje de variación del desempeño en matemáticas explicado por el estatus económico, social y cultural del estudiante y de la escuela
Desempeño en matemáticas, puntos de PISA 2012
Source: OECD-CAF-ECLAC (2014), Latin American Economic Outlook 2015, with data from PISA database

Fiscal policy for development – I. Education
It is critical to invest in education for work
20
Firms that consider the lack of adequately trained workforce a key constraint to their performance (% formal firms, circa 2010)
35.9
22.3 21.5 20.9
17.414.8
13.6
0
5
10
15
20
25
30
35
40
América Latina yel Caribe
África Sub-sahariana
Asia-Este yPacífico
Media mundial Asia-Sur OCDE Europa-Este yAsia-Central
%
Source: OECD-CAF-ECLAC (2014), Latin American Economic Outlook 2015

Fiscal policy for development – I. Education
Lack of or inadequate skills represents an important restriction
Firms that consider the lack of adequately trained workforce a key constraint to their performance – LAC and OECD (% formal firms, circa 2010)
0
10
20
30
40
50
60
70
80
BRA ARG PRY COL CRI BOL DOM ALC ECU GTM MEX SLV PER HND BLZ VEN NIC JAM PANOCDEKOR
21 Source: OECD-CAF-ECLAC (2014), Latin American Economic Outlook 2015

Fiscal policy for development – I. Education
Sector-specific skill development policies are crucial
Firms that consider the lack of adequately trained workforce a key constraint to their performance – Colombia (% formal firms, circa 2010)
0
5
10
15
20
25
30
35
40
45
50
Metalesbásicos
Metaleselaborados
Maquinaria Alimentación Automoción Productosquímicos
Textil Muebles
22 Source: OECD-CAF-ECLAC (2014), Latin American Economic Outlook 2015

Fiscal policy for development – I. Education
High informality is reflects low productivity...
Source: BID, IDB Labor Markets and Social Security Information System (SIMS)
Labor informality in Latin America
(% workers 15-64 years old who do not contribute to a pension scheme, circa 2013)
ALC-19, 55%
0
10
20
30
40
50
60
70
80
90
HND NIC BOL GTM PER PRY SLV MEX ECU VEN DOM COL JAM ARG PAN BRA CHL CRI URY
23

Fiscal policy for development – I. Education
… concentrated over self-employed, SMEs and low & middle income
Labor informality in Latin America, by occupation and income (% workers 15-64 years old who do not contribute to pension scheme, LAC-19, circa 2010)
Source: Bosch, M., A. Melguizo and C. Pagés (2013), Better pensions, better jobs. IADB 24
0%
20%
40%
60%
80%
100%
D1 D2 D3 D4 D5 D6 D7 D8 D9 D10
Pequeña (2-5) Mediana (6-50)
Grande (50 +)
0%
20%
40%
60%
80%
100%
D1 D2 D3 D4 D5 D6 D7 D8 D9 D10
Independientes (cuenta propia y patrones) Asalariados

Fiscal policy for development – I. Education
Particularly among middle-income workers (middle class)
Informality in middle income households in Latin America (% households without contributing members, circa 2010)
Source: Lustig , N.and A. Melguizo (2015), How middle class are middle-income households in Latin
America?. VoxLACEA , May 20, 2015
0%
10%
20%
30%
40%
50%
60%
70%
80%
90%
100%
URY CRI BRA MEX COL PER BOL SLV GTM
Vulnerable Clase media
25

Fiscal policy for development – II. Infrastructure
Latin America has underinvested for decades
26 Source: Carranza, L., C. Daude and A. Melguizo (2014), “Public investment and fiscal sustainability in Latin America:
Incompatible goals?” , Journal of Economic Studies, vol.41, n.1, pp.29-50
Infrastructure investment in selected economies of Latin America (% GDP)
0.0%
0.5%
1.0%
1.5%
2.0%
2.5%
3.0%
3.5%
4.0%
4.5%19
80
198
2
198
4
198
6
198
8
199
0
1992
199
4
199
6
199
8
200
0
200
2
2004
200
6
Total Publica

Infrastructure trends in Latin America (the good)
In Colombia and especially Chile the increase in private infrastructure investment
has more than compensated the reduction in public investment.
Chile Colombia
0.0%
1.0%
2.0%
3.0%
4.0%
5.0%
6.0%
7.0%
19
80
19
82
19
84
19
86
19
88
19
90
19
92
19
94
19
96
19
98
20
00
20
02
20
04
20
06
Total Public
0.0%
1.0%
2.0%
3.0%
4.0%
5.0%
19
80
19
82
19
84
19
86
19
88
19
90
19
92
19
94
19
96
19
98
20
00
20
02
20
04
20
06
Total Public
Public and total investment in infrastructure (% of nominal GDP)
Fiscal policy for development – II. Infrastructure
Infrastructure trends in Latin America (the good)
Source: Carranza, L., C. Daude and A. Melguizo (2014), “Public investment and fiscal sustainability in Latin America:
Incompatible goals?” , Journal of Economic Studies, vol.41, n.1, pp.29-50

Argentina, Brazil and Mexico drive the regional trend.
Argentina Brazil
0.0%
1.0%
2.0%
3.0%
4.0%
19
80
19
82
19
84
19
86
19
88
19
90
19
92
19
94
19
96
19
98
20
00
20
02
20
04
20
06
Total Public
0.0%
1.0%
2.0%
3.0%
4.0%
5.0%
6.0%
7.0%
19
80
19
82
19
84
19
86
19
88
19
90
19
92
19
94
19
96
19
98
20
00
20
02
20
04
20
06
Total Public
Fiscal policy for development – II. Infrastructure
Infrastructure trends in Latin America (the bad)
Public and total investment in infrastructure (% of nominal GDP)
Source: Carranza, L., C. Daude and A. Melguizo (2014), “Public investment and fiscal sustainability in Latin America:
Incompatible goals?” , Journal of Economic Studies, vol.41, n.1, pp.29-50

Infrastructure trends in Latin America (and the ugly)
good)
Peru is an extreme case: for its low level at the start of the period of analysis and also
the collapse in total investment flows in the late 1980s.
Mexico Peru
0.0%
1.0%
2.0%
3.0%
19
80
19
82
19
84
19
86
19
88
19
90
19
92
19
94
19
96
19
98
20
00
20
02
20
04
20
06
Total Public
0.0%
1.0%
2.0%
3.0%
4.0%
19
80
19
82
19
84
19
86
19
88
19
90
19
92
19
94
19
96
19
98
20
00
20
02
20
04
20
06
Total Public
Fiscal policy for development – II. Infrastructure
Infrastructure trends in Latin America (and the ugly)
Public and total investment in infrastructure (% of nominal GDP)
Source: Carranza, L., C. Daude and A. Melguizo (2014), “Public investment and fiscal sustainability in Latin America:
Incompatible goals?” , Journal of Economic Studies, vol.41, n.1, pp.29-50

Fiscal policy for development – II. Infrastructure
Heightened in periods of fiscal consolidation
30
Public investment in infrastructure and fiscal balance in LAC (% GDP)
-6.0%
-5.0%
-4.0%
-3.0%
-2.0%
-1.0%
0.0%
1.0%
2.0%
0.0%
0.5%
1.0%
1.5%
2.0%
2.5%
3.0%
3.5%
4.0%
4.5%1
980
198
2
198
4
198
6
198
8
199
0
199
2
199
4
199
6
199
8
2000
200
2
200
4
200
6
Inversion (izda) Saldo (dcha)
Source: Carranza, L., C. Daude and A. Melguizo (2014), “Public investment and fiscal sustainability in Latin America:
Incompatible goals?” , Journal of Economic Studies, vol.41, n.1, pp.29-50
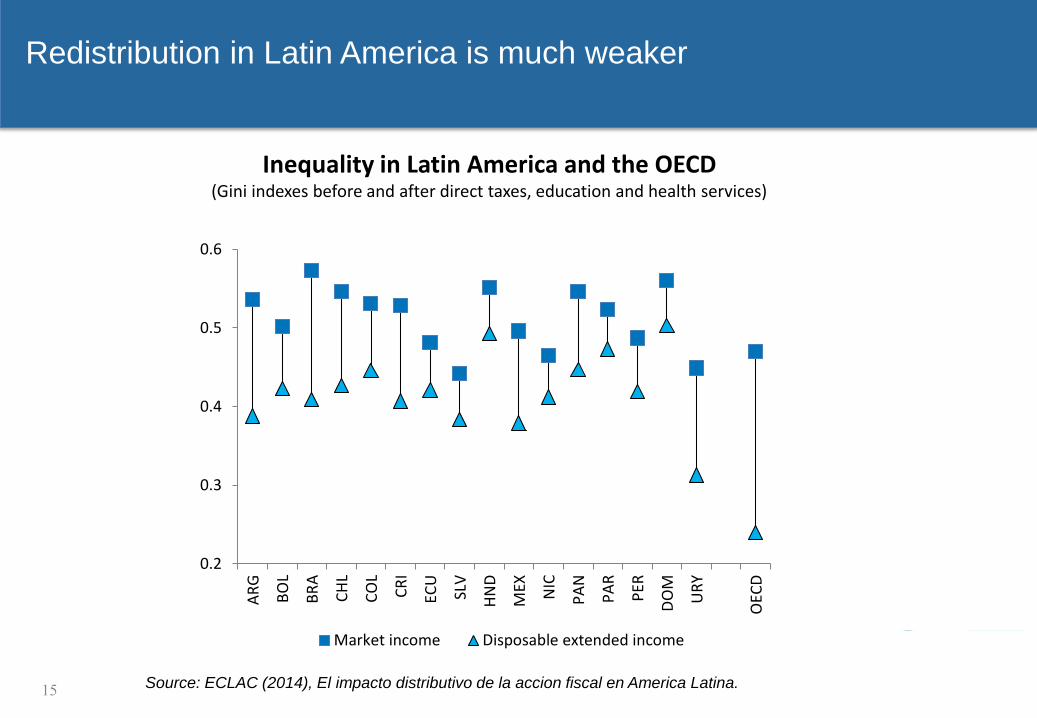
Fiscal policy for development – II. Infrastructure
Transport and energy are the bulk of the gap
31
Source: Balmaseda, M. et al (2010), “Infrastructure patterns in emerging markets: An empirical analysis with a focus on Latin
America” , Global Economic and Construction Outlook, June, pp. 25-31, CEMEX Economic Analysis
Infrastructure gap in LAC and emerging economies (%)
Carreteras pavimentadas Energía eléctrica
0%
40%
80%
120%
160%
200%
240%
280%
1986
1988
1990
1992
1994
1996
1998
2000
2002
2004
LatAm MAX-min LatAm
Asia
Eastern Europe
0%
20%
40%
60%
80%
100%
120%
140%
160%
1986
1988
1990
1992
1994
1996
1998
2000
2002
2004
2006
LatAm MAX-MIN LatAm
Asia
Eastern Europe

• Expansion of fiscal rules in Latin America:
• Budget balance rules (all except Brazil) & second rules (expenditure or
debt)
• Escape clauses and correction mechanisms in case of non-compliance
32
Fiscal rule
Country
Argentina 2000-2008 2000-2008
Brazil 2000-2013 2000-2013
Chile 2001-2013
Colombia 2000-2013 2011-2013
Costa Rica 2001-2013
Ecuador 2010-2013 2003-2009 2003-2009
Jamaica 2010-2013 2010-2013
Mexico 2006-2013
Panama 2002-2003, 2009-2013 2002-2003, 2009-2013
Peru 2000-2013 2000-2013
Expenditure rule Revenue rule Budget balance rule Debt rule
Number of countries using fiscal rules Countries with fiscal rules and date of validity
Fiscal policy for development – II. Infrastructure
Can fiscal rules help? Getting the story right
0
5
10
15
20
25
30
35
1992 1993 1994 1995 1996 1997 1998 1999 2000 2001 2002 2003 2004 2005 2006 2007 2008 2009 2010 2011 2012 2013
LATAM OECD
Source: Alberola, Kataryniuk, Melguizo y Orozco (2015), “The long (and unfinished) march towards fiscal policy stabilization in
Latin America: The role of financial conditions and fiscal rules”, Bank of Span working paper, forthcoming

Fiscal policy by country
• Procyclicality of fiscal policy in Argentina, Uruguay and (weakly) Mexico
• Improvement in the 2000s in Brazil, Chile, Colombia, Costa Rica, Peru and, to
a lesser extent, Mexico
33
Fiscal stance by country
Fiscal policy for development – II. Infrastructure
Latin Americas in terms of stabilization policies
-1
-0.8
-0.6
-0.4
-0.2
0
0.2
0.4
0.6
0.8
-0.6
-0.5
-0.4
-0.3
-0.2
-0.1
0
0.1
0.2
0.3
Argentina Brasil Chile Colombia CostaRica
México Perú Uruguay
Full sample First half Second half
Source: Alberola, Kataryniuk, Melguizo y Orozco (2015), “The long (and unfinished) march towards fiscal policy stabilization in
Latin America: The role of financial conditions and fiscal rules”, Bank of Span working paper, forthcoming

THE WHOLE PICTURE: fiSCAL RULES
34
Evolution of the coefficient of the gap in a rolling-window regression (FE estimation)
Fiscal policy for development – II. Infrastructure
Fiscal rules seem to help (or reflect preferences)…
-0.4
-0.3
-0.2
-0.1
0
0.1
0.2
0.3
0.4
0.5
1996 1997 1998 1999 2000 2001 2002 2003 2004 2005 2006 2007 2008 2009 2010 2011 2012 2013
With FC With FC, no FR With FC + FR
Source: Alberola, Kataryniuk, Melguizo y Orozco (2015), “The long (and unfinished) march towards fiscal policy stabilization in
Latin America: The role of financial conditions and fiscal rules”, Bank of Span working paper, forthcoming

• Main fiscal policy options on fiscal frameworks (budgets, rules and
institutions) and infrastructure investment:
• Golden rule: targets on the current balance excluding capital
expenditures
• Accounting: exclude from the fiscal targets the operations of
commercially-run public enterprises
• Macro-fiscal rule: legislation forcing the accumulation of savings during
the good times, in order to generate the fiscal space to maintain public
investment during economic downturns
Work in progress
Fiscal policy for development – II. Infrastructure
… less progress in expenditure composition

Fiscal policy for development – III. Taxes
Not only revenues, but also revenues…
36
Tax collection in LAC and OECD (% GDP, 1990-2013)
Source: OECD-CIAT-ECLAC-IDB (2015), Revenue Statistics in Latin America and the Caribbean
0
5
10
15
20
25
30
35
40
1991 1993 1995 1997 1999 2001 2003 2005 2007 2009 2011 2013
Diferencia (A-B) ALC (20)¹ (A) OCDE (34)² (B)

Fiscal policy for development – III. Taxes
Commodity dependence remains excessive
37
Fiscal revenues from non-renewable resources (USD billion and % GDP, 2013)
0 20 40 60 80 100 120
Bolivia (Est.Plur. de)
Perú
Chile
Argentina
Ecuador
Colombia
Venezuela (Rep. Bol. de)
Brasil
México
Como % del PIB
PEMEX8.0
14.2
2.8
2.1
1.8
12.1
5.1
12.2
2.4
Source: OECD-CIAT-ECLAC-IDB (2015), Revenue Statistics in Latin America and the Caribbean

Tax collection in Latin America and the Caribbean and the OECD (%GDP, 2013)
Fiscal policy for development – III. Taxes
Most economies have low levels of tax collection…
38
0
10
20
30
40
Source: OECD-CIAT-ECLAC-IDB (2015), Revenue Statistics in Latin America and the Caribbean

Fiscal policy for development – III. Taxes
… particularly direct taxes and SS contributions
39
Tax structure in LAC and OECD (% of tax revenues, 2012)
Source: OECD-CIAT-ECLAC-IDB (2015), Revenue Statistics in Latin America and the Caribbean

- 40 -
Margen en otros impuestos para financiar salud y
pensiones
Tax collection on consumption and SS contributions in LAC (% GDP, circa 2012)
Fiscal policy for development – III. Taxes
Room for raise collection and improve structure
40
ARG
BRB
BOL
BRA
CHL
COL CRIDOM
ECU
SLV
GTM HND
JAMMEX
NIC
PAN
PRY
PER
URY
VEN
ALC
0
2
4
6
8
10
12
14
16
0 2 4 6 8 10 12
Impuestos generales sobre el
consumo
Contribuciones y aportes
Source: OECD-CIAT-ECLAC-IDB (2015), Revenue Statistics in Latin America and the Caribbean

41
Fiscal policy for development – III. Taxes
Tax policy: a few policy implications
• The outlook for convergence in collection is not favorable (slowdown
and lower revenues from commodities)
• LAC is below OECD average (even when we consider private
contributions and natural resources)
• A few countries are correctly weighing in structural fiscal reforms to
strenghthen expenditure capacity
• Need to identify the use of resources
• For natural resources it is important to establish mechanisms to
translate temporary booms into actual and durable development

Latin American Economic Outlook
1 Short-term slowdown, medium-term reforms?
More than revenues: Fiscal policy for development 2
Latin America - fiscal policy in times of economic slowdown
Enabling tax reforms 3

The political economy of structural tax reform is particularly defying:
low fiscal morale…
43
Fiscal morale in LAC and OECD (Do you think that cheating in tax declarations is justifiable?, 2010)
Source: OECD-ECLAC (2011), Latin American Economic Outlook 2012.
0%
10%
20%
30%
40%
50%
60%
70%
América Latina OCDE
Nunca justificable
Justificable

44
… and general absence of clear mandates in the results of presidential
elections
Note: Favorable tweets to Neves or Rouseff according to geographic location
Source: FT
Neves 48%
Rouseff 52%

Success in this area requires to communicate the future use of
resources and improve its management.
45
Legitimacy Tax are too high More redistribution
Education + - +/-
Middle sectors +/+ -/- -/-
Public services
(educ., health)+ - +
POUM +/+ - -
Meritocracyn.a. - +
Source: OECD (2010), Latin American Economic Outllook 2011. How middle-class in Latin America?

Fiscal policy, social mobility and democracy in Latin America
Attitudes towards democracy
(% support and satisfaction)
Distribution of political preferences
(0 extreme left, 1 extreme right)
Attitudes towards democracy
0%
10%
20%
30%
40%
50%
60%
70%
80%
1 2 3 4 5
Perceived Income Quintile
Support for democracy Satisfaction with functioning of democracy
0.0%
5.0%
10.0%
15.0%
20.0%
25.0%
30.0%
35.0%
40.0%
0 1 2 3 4 5 6 7 8 9 10
Freq
uenc
y
Left - Right self-reported preferences
Q1 Q2-Q4 Q5
Source: OECD (2010), Latin American Economic Outllook 2011. How middle-class in Latin America?
The middle sectors could be an agent for change: support of
democracy, politically moderate…

Fiscal policy, social mobility and democracy in Latin America
Fiscal policy
30
35
40
45
50
55
60
Q1 Q2 Q3 Q4 Q5
"Good Citizens pay their taxes"(percentage of respondents who agree)
25
30
35
40
45
50
Q1 Q2 Q3 Q4 Q5
"Taxes are too high"(percentage of respondents who agree)
25
27
29
31
33
35
37
Q1 Q2 Q3 Q4 Q5
"Tax evasion is never justified"(percentage of respondents who agree)
0
20
40
60
80
100
Q1 Q2 Q3 Q4 Q5
Satisfaction with health services
Satisfied Not satisfied No Access
Source: OECD (2010), Latin American Economic Outllook 2011. How middle-class in Latin America?
… higher tax morale. But unsatisfied!

Latin America – Fiscal policy in slowdown times: conclusions
48
• Latin America should improve its fiscal policy, not only to tackle the
economic slowdown, but also to strenghthen potential growth
• The majority of productive development policies (education,
infrastructure, …) require sizeable resources
• Structural tax reform needs to be framed within an empowered social
contract
• We cannot wait any longer