ERP2005 Appendixes 2
138
Appendix B STATISTICAL TABLES RELATING TO INCOME, EMPLOYMENT, AND PRODUCTION
-
Upload
fraser-federal-reserve-archive -
Category
Documents
-
view
240 -
download
4
Transcript of ERP2005 Appendixes 2
Appendix B
STATISTICAL TABLES RELATING TO INCOME, EMPLOYMENT, AND PRODUCTION

203
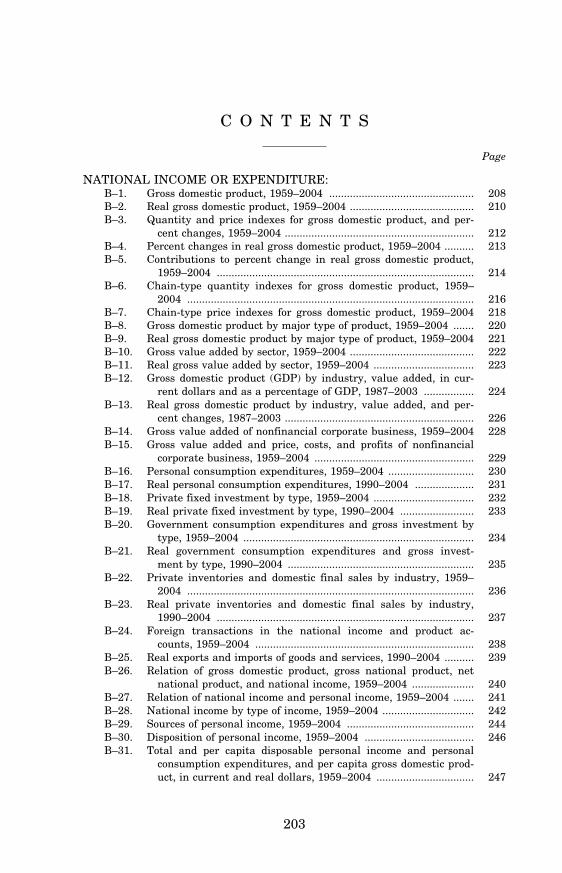
C O N T E N T S
Page
NATIONAL INCOME OR EXPENDITURE: B–1. Gross domestic product, 1959–2004 ................................................. 208 B–2. Real gross domestic product, 1959–2004 .......................................... 210 B–3. Quantity and price indexes for gross domestic product, and per-
cent changes, 1959–2004 ................................................................ 212 B–4. Percent changes in real gross domestic product, 1959–2004 .......... 213 B–5. Contributions to percent change in real gross domestic product,
1959–2004 ....................................................................................... 214 B–6. Chain-type quantity indexes for gross domestic product, 1959–
2004 ................................................................................................. 216 B–7. Chain-type price indexes for gross domestic product, 1959–2004 218 B–8. Gross domestic product by major type of product, 1959–2004 ....... 220 B–9. Real gross domestic product by major type of product, 1959–2004 221 B–10. Gross value added by sector, 1959–2004 .......................................... 222 B–11. Real gross value added by sector, 1959–2004 .................................. 223 B–12. Gross domestic product (GDP) by industry, value added, in cur-
rent dollars and as a percentage of GDP, 1987–2003 ................. 224 B–13. Real gross domestic product by industry, value added, and per-
cent changes, 1987–2003 ................................................................ 226 B–14. Gross value added of nonfinancial corporate business, 1959–2004 228 B–15. Gross value added and price, costs, and profits of nonfinancial
corporate business, 1959–2004 ...................................................... 229 B–16. Personal consumption expenditures, 1959–2004 ............................. 230 B–17. Real personal consumption expenditures, 1990–2004 .................... 231 B–18. Private fixed investment by type, 1959–2004 .................................. 232 B–19. Real private fixed investment by type, 1990–2004 ......................... 233 B–20. Government consumption expenditures and gross investment by
type, 1959–2004 .............................................................................. 234 B–21. Real government consumption expenditures and gross invest-
ment by type, 1990–2004 ............................................................... 235 B–22. Private inventories and domestic final sales by industry, 1959–
2004 ................................................................................................. 236 B–23. Real private inventories and domestic final sales by industry,
1990–2004 ....................................................................................... 237 B–24. Foreign transactions in the national income and product ac-
counts, 1959–2004 .......................................................................... 238 B–25. Real exports and imports of goods and services, 1990–2004 .......... 239 B–26. Relation of gross domestic product, gross national product, net
national product, and national income, 1959–2004 ..................... 240 B–27. Relation of national income and personal income, 1959–2004 ....... 241 B–28. National income by type of income, 1959–2004 ............................... 242 B–29. Sources of personal income, 1959–2004 ........................................... 244 B–30. Disposition of personal income, 1959–2004 ..................................... 246 B–31. Total and per capita disposable personal income and personal
consumption expenditures, and per capita gross domestic prod-uct, in current and real dollars, 1959–2004 ................................. 247
204
Page
B–32. Gross saving and investment, 1959–2004 ........................................ 248 B–33. Median money income (in 2003 dollars) and poverty status of
families and persons, by race, selected years, 1989–2003 ........... 250
POPULATION, EMPLOYMENT, WAGES, AND PRODUCTIVITY: B–34. Population by age group, 1929–2004 ................................................ 251 B–35. Civilian population and labor force, 1929–2004 .............................. 252 B–36. Civilian employment and unemployment by sex and age, 1959–
2004 ................................................................................................. 254 B–37. Civilian employment by demographic characteristic, 1959–2004 .. 255 B–38. Unemployment by demographic characteristic, 1959–2004 ........... 256 B–39. Civilian labor force participation rate and employment/popu-
lation ratio, 1959–2004 .................................................................. 257 B–40. Civilian labor force participation rate by demographic char-
acteristic, 1965–2004 ...................................................................... 258 B–41. Civilian employment/population ratio by demographic char-
acteristic, 1965–2004 ...................................................................... 259 B–42. Civilian unemployment rate, 1959–2004 ......................................... 260 B–43. Civilian unemployment rate by demographic characteristic,
1965–2004 ....................................................................................... 261 B–44. Unemployment by duration and reason, 1959–2004 ....................... 262 B–45. Unemployment insurance programs, selected data, 1978–2004 .... 263 B–46. Employees on nonagricultural payrolls, by major industry, 1959–
2004 ................................................................................................. 264 B–47. Hours and earnings in private nonagricultural industries, 1959–
2004 ................................................................................................. 266 B–48. Employment cost index, private industry, 1984–2004 .................... 267 B–49. Productivity and related data, business sector, 1959–2004 ........... 268 B–50. Changes in productivity and related data, business sector, 1959–
2004 ................................................................................................. 269
PRODUCTION AND BUSINESS ACTIVITY: B–51. Industrial production indexes, major industry divisions, 1959–
2004 ................................................................................................. 270 B–52. Industrial production indexes, market groupings, 1959–2004 ....... 271 B–53. Industrial production indexes, selected manufacturing industries,
1967–2004 ....................................................................................... 272 B–54. Capacity utilization rates, 1959–2004 .............................................. 273 B–55. New construction activity, 1964–2004 .............................................. 274 B–56. New private housing units started, authorized, and completed,
and houses sold, 1959–2004 ........................................................... 275 B–57. Manufacturing and trade sales and inventories, 1965–2004 ......... 276 B–58. Manufacturers’ shipments and inventories, 1965–2004 ................. 277 B–59. Manufacturers’ new and unfilled orders, 1965–2004 ...................... 278
PRICES: B–60. Consumer price indexes for major expenditure classes, 1959–
2004 ................................................................................................. 279 B–61. Consumer price indexes for selected expenditure classes, 1959–
2004 ................................................................................................. 280 B–62. Consumer price indexes for commodities, services, and special
groups, 1960–2004 .......................................................................... 282 B–63. Changes in special consumer price indexes, 1960–2004 ................. 283 B–64. Changes in consumer price indexes for commodities and services,
1929–2004 ....................................................................................... 284
205
Page
B–65. Producer price indexes by stage of processing, 1959–2004 ............. 285 B–66. Producer price indexes by stage of processing, special groups,
1974–2004 ....................................................................................... 287 B–67. Producer price indexes for major commodity groups, 1959–2004 288 B–68. Changes in producer price indexes for finished goods, 1965–2004 290
MONEY STOCK, CREDIT, AND FINANCE: B–69. Money stock and debt measures, 1959–2004 ................................... 291 B–70. Components of money stock measures, 1959–2004 ......................... 292 B–71. Aggregate reserves of depository institutions and the monetary
base, 1959–2004 .............................................................................. 294 B–72. Bank credit at all commercial banks, 1959–2004 ............................ 295 B–73. Bond yields and interest rates, 1929–2004 ...................................... 296 B–74. Credit market borrowing, 1996–2004 ............................................... 298 B–75. Mortgage debt outstanding by type of property and of financing,
1949–2004 ....................................................................................... 300 B–76. Mortgage debt outstanding by holder, 1949–2004 .......................... 301 B–77. Consumer credit outstanding, 1955–2004 ........................................ 302
GOVERNMENT FINANCE: B–78. Federal receipts, outlays, surplus or deficit, and debt, fiscal
years, 1939–2006 ............................................................................ 303 B–79. Federal receipts, outlays, surplus or deficit, and debt, as percent
of gross domestic product, fiscal years 1934–2006 ...................... 304 B–80. Federal receipts and outlays, by major category, and surplus or
deficit, fiscal years 1940–2006 ....................................................... 305 B–81. Federal receipts, outlays, surplus or deficit, and debt, fiscal years
2001–2006 ....................................................................................... 306 B–82. Federal and State and local government current receipts and ex-
penditures, national income and product accounts (NIPA), 1959–2004 ....................................................................................... 307
B–83. Federal and State and local government current receipts and ex-penditures, national income and product accounts (NIPA), by major type, 1959–2004 ................................................................... 308
B–84. Federal Government current receipts and expenditures, national income and product accounts (NIPA), 1959–2004 ....................... 309
B–85. State and local government current receipts and expenditures, national income and product accounts (NIPA), 1959–2004 ........ 310
B–86. State and local government revenues and expenditures, selected fiscal years, 1927–2002 .................................................................. 311
B–87. U.S. Treasury securities outstanding by kind of obligation, 1967– 2004 ................................................................................................. 312
B–88. Maturity distribution and average length of marketable interest- bearing public debt securities held by private investors, 1967– 2004 ................................................................................................. 313
B–89. Estimated ownership of U.S. Treasury securities, 1993–2004 ....... 314
CORPORATE PROFITS AND FINANCE: B–90. Corporate profits with inventory valuation and capital consump-
tion adjustments, 1959–2004 ......................................................... 315 B–91. Corporate profits by industry, 1959–2004 ........................................ 316 B–92. Corporate profits of manufacturing industries, 1959–2004 ............ 317 B–93. Sales, profits, and stockholders’ equity, all manufacturing cor-
porations, 1965–2004 ..................................................................... 318
206
Page
B–94. Relation of profits after taxes to stockholders’ equity and to sales, all manufacturing corporations, 1955–2004 ................................. 319
B–95. Historical stock prices and yields, 1949–2003 ................................. 320 B–96. Common stock prices and yields, 2000–2004 ................................... 321
AGRICULTURE: B–97. Farm income, 1945–2004 ................................................................... 322 B–98. Farm business balance sheet, 1950–2003 ........................................ 323 B–99. Farm output and productivity indexes, 1948–2002 ......................... 324 B–100. Farm input use, selected inputs, 1948–2004 ................................... 325 B–101. Agricultural price indexes and farm real estate value, 1975–2004 326 B–102. U.S. exports and imports of agricultural commodities, 1945–2004 327
INTERNATIONAL STATISTICS: B–103. U.S. international transactions, 1946–2004 ..................................... 328 B–104. U.S. international trade in goods by principal end-use category,
1965–2004 ....................................................................................... 330 B–105. U.S. international trade in goods by area, 1999–2004 .................... 331 B–106. U.S. international trade in goods on balance of payments (BOP)
and Census basis, and trade in services on BOP basis, 1979– 2004 ................................................................................................. 332
B–107. International investment position of the United States at year- end, 1995–2003 ............................................................................... 333
B–108. Industrial production and consumer prices, major industrial countries, 1979–2004 ...................................................................... 334
B–109. Civilian unemployment rate, and hourly compensation, major in-dustrial countries, 1979–2004 ....................................................... 335
B–110. Foreign exchange rates, 1983–2004 .................................................. 336 B–111. International reserves, selected years, 1962–2004 .......................... 337 B–112. Growth rates in real gross domestic product, 1986–2004 ............... 338
207
General Notes
Detail in these tables may not add to totals because of rounding.
Because of the formula used for calculating real gross domestic product (GDP), the chained (2000) dollar estimates for the detailed components do not add to the chained-dollar value of GDP or to any intermediate aggregate. The Department of Commerce (Bureau of Economic Analysis) no longer publishes chained-dollar estimates prior to 1990, except for selected series.
Unless otherwise noted, all dollar figures are in current dollars.
Symbols used: p Preliminary. ... Not available (also, not applicable).
Data in these tables reflect revisions made by the source agencies through Janu-ary 31, 2005. In particular, tables containing national income and product ac-counts (NIPA) estimates reflect revisions released by the Department of Com-merce in July 2004.
208
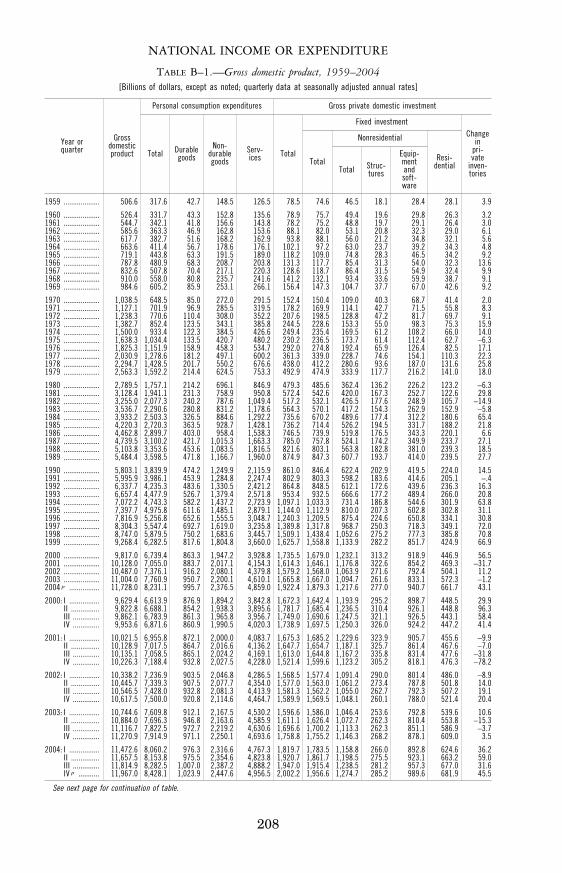
NATIONAL INCOME OR EXPENDITURE
TABLE B–1.—Gross domestic product, 1959–2004 [Billions of dollars, except as noted; quarterly data at seasonally adjusted annual rates]
Year or quarter
Gross domestic product
Personal consumption expenditures Gross private domestic investment
Total Durable goods
Non- durable goods
Serv- ices Total
Fixed investment Change
in pri- vate
inven- tories
Total
Nonresidential
Resi- dential Total Struc-
tures
Equip- ment and soft- ware
1959 ................... 506.6 317.6 42.7 148.5 126.5 78.5 74.6 46.5 18.1 28.4 28.1 3.9
1960 ................... 526.4 331.7 43.3 152.8 135.6 78.9 75.7 49.4 19.6 29.8 26.3 3.2 1961 ................... 544.7 342.1 41.8 156.6 143.8 78.2 75.2 48.8 19.7 29.1 26.4 3.0 1962 ................... 585.6 363.3 46.9 162.8 153.6 88.1 82.0 53.1 20.8 32.3 29.0 6.1 1963 ................... 617.7 382.7 51.6 168.2 162.9 93.8 88.1 56.0 21.2 34.8 32.1 5.6 1964 ................... 663.6 411.4 56.7 178.6 176.1 102.1 97.2 63.0 23.7 39.2 34.3 4.8 1965 ................... 719.1 443.8 63.3 191.5 189.0 118.2 109.0 74.8 28.3 46.5 34.2 9.2 1966 ................... 787.8 480.9 68.3 208.7 203.8 131.3 117.7 85.4 31.3 54.0 32.3 13.6 1967 ................... 832.6 507.8 70.4 217.1 220.3 128.6 118.7 86.4 31.5 54.9 32.4 9.9 1968 ................... 910.0 558.0 80.8 235.7 241.6 141.2 132.1 93.4 33.6 59.9 38.7 9.1 1969 ................... 984.6 605.2 85.9 253.1 266.1 156.4 147.3 104.7 37.7 67.0 42.6 9.2
1970 ................... 1,038.5 648.5 85.0 272.0 291.5 152.4 150.4 109.0 40.3 68.7 41.4 2.0 1971 ................... 1,127.1 701.9 96.9 285.5 319.5 178.2 169.9 114.1 42.7 71.5 55.8 8.3 1972 ................... 1,238.3 770.6 110.4 308.0 352.2 207.6 198.5 128.8 47.2 81.7 69.7 9.1 1973 ................... 1,382.7 852.4 123.5 343.1 385.8 244.5 228.6 153.3 55.0 98.3 75.3 15.9 1974 ................... 1,500.0 933.4 122.3 384.5 426.6 249.4 235.4 169.5 61.2 108.2 66.0 14.0 1975 ................... 1,638.3 1,034.4 133.5 420.7 480.2 230.2 236.5 173.7 61.4 112.4 62.7 −6.3 1976 ................... 1,825.3 1,151.9 158.9 458.3 534.7 292.0 274.8 192.4 65.9 126.4 82.5 17.1 1977 ................... 2,030.9 1,278.6 181.2 497.1 600.2 361.3 339.0 228.7 74.6 154.1 110.3 22.3 1978 ................... 2,294.7 1,428.5 201.7 550.2 676.6 438.0 412.2 280.6 93.6 187.0 131.6 25.8 1979 ................... 2,563.3 1,592.2 214.4 624.5 753.3 492.9 474.9 333.9 117.7 216.2 141.0 18.0
1980 ................... 2,789.5 1,757.1 214.2 696.1 846.9 479.3 485.6 362.4 136.2 226.2 123.2 −6.3 1981 ................... 3,128.4 1,941.1 231.3 758.9 950.8 572.4 542.6 420.0 167.3 252.7 122.6 29.8 1982 ................... 3,255.0 2,077.3 240.2 787.6 1,049.4 517.2 532.1 426.5 177.6 248.9 105.7 −14.9 1983 ................... 3,536.7 2,290.6 280.8 831.2 1,178.6 564.3 570.1 417.2 154.3 262.9 152.9 −5.8 1984 ................... 3,933.2 2,503.3 326.5 884.6 1,292.2 735.6 670.2 489.6 177.4 312.2 180.6 65.4 1985 ................... 4,220.3 2,720.3 363.5 928.7 1,428.1 736.2 714.4 526.2 194.5 331.7 188.2 21.8 1986 ................... 4,462.8 2,899.7 403.0 958.4 1,538.3 746.5 739.9 519.8 176.5 343.3 220.1 6.6 1987 ................... 4,739.5 3,100.2 421.7 1,015.3 1,663.3 785.0 757.8 524.1 174.2 349.9 233.7 27.1 1988 ................... 5,103.8 3,353.6 453.6 1,083.5 1,816.5 821.6 803.1 563.8 182.8 381.0 239.3 18.5 1989 ................... 5,484.4 3,598.5 471.8 1,166.7 1,960.0 874.9 847.3 607.7 193.7 414.0 239.5 27.7
1990 ................... 5,803.1 3,839.9 474.2 1,249.9 2,115.9 861.0 846.4 622.4 202.9 419.5 224.0 14.5 1991 ................... 5,995.9 3,986.1 453.9 1,284.8 2,247.4 802.9 803.3 598.2 183.6 414.6 205.1 −.4 1992 ................... 6,337.7 4,235.3 483.6 1,330.5 2,421.2 864.8 848.5 612.1 172.6 439.6 236.3 16.3 1993 ................... 6,657.4 4,477.9 526.7 1,379.4 2,571.8 953.4 932.5 666.6 177.2 489.4 266.0 20.8 1994 ................... 7,072.2 4,743.3 582.2 1,437.2 2,723.9 1,097.1 1,033.3 731.4 186.8 544.6 301.9 63.8 1995 ................... 7,397.7 4,975.8 611.6 1,485.1 2,879.1 1,144.0 1,112.9 810.0 207.3 602.8 302.8 31.1 1996 ................... 7,816.9 5,256.8 652.6 1,555.5 3,048.7 1,240.3 1,209.5 875.4 224.6 650.8 334.1 30.8 1997 ................... 8,304.3 5,547.4 692.7 1,619.0 3,235.8 1,389.8 1,317.8 968.7 250.3 718.3 349.1 72.0 1998 ................... 8,747.0 5,879.5 750.2 1,683.6 3,445.7 1,509.1 1,438.4 1,052.6 275.2 777.3 385.8 70.8 1999 ................... 9,268.4 6,282.5 817.6 1,804.8 3,660.0 1,625.7 1,558.8 1,133.9 282.2 851.7 424.9 66.9
2000 ................... 9,817.0 6,739.4 863.3 1,947.2 3,928.8 1,735.5 1,679.0 1,232.1 313.2 918.9 446.9 56.5 2001 ................... 10,128.0 7,055.0 883.7 2,017.1 4,154.3 1,614.3 1,646.1 1,176.8 322.6 854.2 469.3 −31.7 2002 ................... 10,487.0 7,376.1 916.2 2,080.1 4,379.8 1,579.2 1,568.0 1,063.9 271.6 792.4 504.1 11.2 2003 ................... 11,004.0 7,760.9 950.7 2,200.1 4,610.1 1,665.8 1,667.0 1,094.7 261.6 833.1 572.3 −1.2 2004 p ................ 11,728.0 8,231.1 995.7 2,376.5 4,859.0 1,922.4 1,879.3 1,217.6 277.0 940.7 661.7 43.1
2000: I ................ 9,629.4 6,613.9 876.9 1,894.2 3,842.8 1,672.3 1,642.4 1,193.9 295.2 898.7 448.5 29.9 II ............... 9,822.8 6,688.1 854.2 1,938.3 3,895.6 1,781.7 1,685.4 1,236.5 310.4 926.1 448.8 96.3 III .............. 9,862.1 6,783.9 861.3 1,965.8 3,956.7 1,749.0 1,690.6 1,247.5 321.1 926.5 443.1 58.4 IV .............. 9,953.6 6,871.6 860.9 1,990.5 4,020.3 1,738.9 1,697.5 1,250.3 326.0 924.2 447.2 41.4
2001: I ................ 10,021.5 6,955.8 872.1 2,000.0 4,083.7 1,675.3 1,685.2 1,229.6 323.9 905.7 455.6 −9.9 II ............... 10,128.9 7,017.5 864.7 2,016.6 4,136.2 1,647.7 1,654.7 1,187.1 325.7 861.4 467.6 −7.0 III .............. 10,135.1 7,058.5 865.1 2,024.2 4,169.1 1,613.0 1,644.8 1,167.2 335.8 831.4 477.6 −31.8 IV .............. 10,226.3 7,188.4 932.8 2,027.5 4,228.0 1,521.4 1,599.6 1,123.2 305.2 818.1 476.3 −78.2
2002: I ................ 10,338.2 7,236.9 903.5 2,046.8 4,286.5 1,568.5 1,577.4 1,091.4 290.0 801.4 486.0 −8.9 II ............... 10,445.7 7,339.3 907.5 2,077.7 4,354.0 1,577.0 1,563.0 1,061.2 273.4 787.8 501.8 14.0 III .............. 10,546.5 7,428.0 932.8 2,081.3 4,413.9 1,581.3 1,562.2 1,055.0 262.7 792.3 507.2 19.1 IV .............. 10,617.5 7,500.0 920.8 2,114.6 4,464.7 1,589.9 1,569.5 1,048.1 260.1 788.0 521.4 20.4
2003: I ................ 10,744.6 7,609.8 912.1 2,167.5 4,530.2 1,596.6 1,586.0 1,046.4 253.6 792.8 539.6 10.6 II ............... 10,884.0 7,696.3 946.8 2,163.6 4,585.9 1,611.1 1,626.4 1,072.7 262.3 810.4 553.8 −15.3 III .............. 11,116.7 7,822.5 972.7 2,219.2 4,630.6 1,696.6 1,700.2 1,113.3 262.3 851.1 586.9 −3.7 IV .............. 11,270.9 7,914.9 971.1 2,250.1 4,693.6 1,758.8 1,755.2 1,146.3 268.2 878.1 609.0 3.5
2004: I ................ 11,472.6 8,060.2 976.3 2,316.6 4,767.3 1,819.7 1,783.5 1,158.8 266.0 892.8 624.6 36.2 II ............... 11,657.5 8,153.8 975.5 2,354.6 4,823.8 1,920.7 1,861.7 1,198.5 275.5 923.1 663.2 59.0 III .............. 11,814.9 8,282.5 1,007.0 2,387.2 4,888.2 1,947.0 1,915.4 1,238.5 281.2 957.3 677.0 31.6 IV p ........... 11,967.0 8,428.1 1,023.9 2,447.6 4,956.5 2,002.2 1,956.6 1,274.7 285.2 989.6 681.9 45.5
See next page for continuation of table.
209
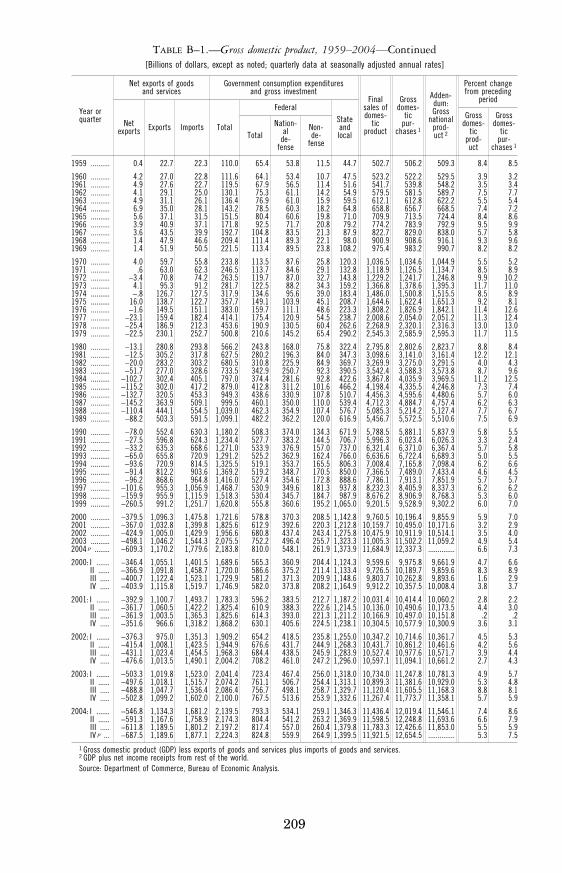
TABLE B–1.—Gross domestic product, 1959–2004—Continued [Billions of dollars, except as noted; quarterly data at seasonally adjusted annual rates]
Year or quarter
Net exports of goods and services
Government consumption expenditures and gross investment
Final sales of domes-
tic product
Gross domes-
tic pur-
chases 1
Adden- dum: Gross
national prod- uct 2
Percent change from preceding
period
Net exports Exports Imports Total
Federal State and local
Gross domes-
tic prod- uct
Gross domes-
tic pur-
chases 1 Total
Nation- al
de- fense
Non- de-
fense
1959 .......... 0.4 22.7 22.3 110.0 65.4 53.8 11.5 44.7 502.7 506.2 509.3 8.4 8.5
1960 .......... 4.2 27.0 22.8 111.6 64.1 53.4 10.7 47.5 523.2 522.2 529.5 3.9 3.2 1961 .......... 4.9 27.6 22.7 119.5 67.9 56.5 11.4 51.6 541.7 539.8 548.2 3.5 3.4 1962 .......... 4.1 29.1 25.0 130.1 75.3 61.1 14.2 54.9 579.5 581.5 589.7 7.5 7.7 1963 .......... 4.9 31.1 26.1 136.4 76.9 61.0 15.9 59.5 612.1 612.8 622.2 5.5 5.4 1964 .......... 6.9 35.0 28.1 143.2 78.5 60.3 18.2 64.8 658.8 656.7 668.5 7.4 7.2 1965 .......... 5.6 37.1 31.5 151.5 80.4 60.6 19.8 71.0 709.9 713.5 724.4 8.4 8.6 1966 .......... 3.9 40.9 37.1 171.8 92.5 71.7 20.8 79.2 774.2 783.9 792.9 9.5 9.9 1967 .......... 3.6 43.5 39.9 192.7 104.8 83.5 21.3 87.9 822.7 829.0 838.0 5.7 5.8 1968 .......... 1.4 47.9 46.6 209.4 111.4 89.3 22.1 98.0 900.9 908.6 916.1 9.3 9.6 1969 .......... 1.4 51.9 50.5 221.5 113.4 89.5 23.8 108.2 975.4 983.2 990.7 8.2 8.2
1970 .......... 4.0 59.7 55.8 233.8 113.5 87.6 25.8 120.3 1,036.5 1,034.6 1,044.9 5.5 5.2 1971 .......... .6 63.0 62.3 246.5 113.7 84.6 29.1 132.8 1,118.9 1,126.5 1,134.7 8.5 8.9 1972 .......... −3.4 70.8 74.2 263.5 119.7 87.0 32.7 143.8 1,229.2 1,241.7 1,246.8 9.9 10.2 1973 .......... 4.1 95.3 91.2 281.7 122.5 88.2 34.3 159.2 1,366.8 1,378.6 1,395.3 11.7 11.0 1974 .......... −.8 126.7 127.5 317.9 134.6 95.6 39.0 183.4 1,486.0 1,500.8 1,515.5 8.5 8.9 1975 .......... 16.0 138.7 122.7 357.7 149.1 103.9 45.1 208.7 1,644.6 1,622.4 1,651.3 9.2 8.1 1976 .......... −1.6 149.5 151.1 383.0 159.7 111.1 48.6 223.3 1,808.2 1,826.9 1,842.1 11.4 12.6 1977 .......... −23.1 159.4 182.4 414.1 175.4 120.9 54.5 238.7 2,008.6 2,054.0 2,051.2 11.3 12.4 1978 .......... −25.4 186.9 212.3 453.6 190.9 130.5 60.4 262.6 2,268.9 2,320.1 2,316.3 13.0 13.0 1979 .......... −22.5 230.1 252.7 500.8 210.6 145.2 65.4 290.2 2,545.3 2,585.9 2,595.3 11.7 11.5
1980 .......... −13.1 280.8 293.8 566.2 243.8 168.0 75.8 322.4 2,795.8 2,802.6 2,823.7 8.8 8.4 1981 .......... −12.5 305.2 317.8 627.5 280.2 196.3 84.0 347.3 3,098.6 3,141.0 3,161.4 12.2 12.1 1982 .......... −20.0 283.2 303.2 680.5 310.8 225.9 84.9 369.7 3,269.9 3,275.0 3,291.5 4.0 4.3 1983 .......... −51.7 277.0 328.6 733.5 342.9 250.7 92.3 390.5 3,542.4 3,588.3 3,573.8 8.7 9.6 1984 .......... −102.7 302.4 405.1 797.0 374.4 281.6 92.8 422.6 3,867.8 4,035.9 3,969.5 11.2 12.5 1985 .......... −115.2 302.0 417.2 879.0 412.8 311.2 101.6 466.2 4,198.4 4,335.5 4,246.8 7.3 7.4 1986 .......... −132.7 320.5 453.3 949.3 438.6 330.9 107.8 510.7 4,456.3 4,595.6 4,480.6 5.7 6.0 1987 .......... −145.2 363.9 509.1 999.5 460.1 350.0 110.0 539.4 4,712.3 4,884.7 4,757.4 6.2 6.3 1988 .......... −110.4 444.1 554.5 1,039.0 462.3 354.9 107.4 576.7 5,085.3 5,214.2 5,127.4 7.7 6.7 1989 .......... −88.2 503.3 591.5 1,099.1 482.2 362.2 120.0 616.9 5,456.7 5,572.5 5,510.6 7.5 6.9
1990 .......... −78.0 552.4 630.3 1,180.2 508.3 374.0 134.3 671.9 5,788.5 5,881.1 5,837.9 5.8 5.5 1991 .......... −27.5 596.8 624.3 1,234.4 527.7 383.2 144.5 706.7 5,996.3 6,023.4 6,026.3 3.3 2.4 1992 .......... −33.2 635.3 668.6 1,271.0 533.9 376.9 157.0 737.0 6,321.4 6,371.0 6,367.4 5.7 5.8 1993 .......... −65.0 655.8 720.9 1,291.2 525.2 362.9 162.4 766.0 6,636.6 6,722.4 6,689.3 5.0 5.5 1994 .......... −93.6 720.9 814.5 1,325.5 519.1 353.7 165.5 806.3 7,008.4 7,165.8 7,098.4 6.2 6.6 1995 .......... −91.4 812.2 903.6 1,369.2 519.2 348.7 170.5 850.0 7,366.5 7,489.0 7,433.4 4.6 4.5 1996 .......... −96.2 868.6 964.8 1,416.0 527.4 354.6 172.8 888.6 7,786.1 7,913.1 7,851.9 5.7 5.7 1997 .......... −101.6 955.3 1,056.9 1,468.7 530.9 349.6 181.3 937.8 8,232.3 8,405.9 8,337.3 6.2 6.2 1998 .......... −159.9 955.9 1,115.9 1,518.3 530.4 345.7 184.7 987.9 8,676.2 8,906.9 8,768.3 5.3 6.0 1999 .......... −260.5 991.2 1,251.7 1,620.8 555.8 360.6 195.2 1,065.0 9,201.5 9,528.9 9,302.2 6.0 7.0
2000 .......... −379.5 1,096.3 1,475.8 1,721.6 578.8 370.3 208.5 1,142.8 9,760.5 10,196.4 9,855.9 5.9 7.0 2001 .......... −367.0 1,032.8 1,399.8 1,825.6 612.9 392.6 220.3 1,212.8 10,159.7 10,495.0 10,171.6 3.2 2.9 2002 .......... −424.9 1,005.0 1,429.9 1,956.6 680.8 437.4 243.4 1,275.8 10,475.9 10,911.9 10,514.1 3.5 4.0 2003 .......... −498.1 1,046.2 1,544.3 2,075.5 752.2 496.4 255.7 1,323.3 11,005.3 11,502.2 11,059.2 4.9 5.4 2004 p ........ −609.3 1,170.2 1,779.6 2,183.8 810.0 548.1 261.9 1,373.9 11,684.9 12,337.3 .............. 6.6 7.3
2000: I ....... −346.4 1,055.1 1,401.5 1,689.6 565.3 360.9 204.4 1,124.3 9,599.6 9,975.8 9,661.9 4.7 6.6 II ...... −366.9 1,091.8 1,458.7 1,720.0 586.6 375.2 211.4 1,133.4 9,726.5 10,189.7 9,859.6 8.3 8.9 III ..... −400.7 1,122.4 1,523.1 1,729.9 581.2 371.3 209.9 1,148.6 9,803.7 10,262.8 9,893.6 1.6 2.9 IV ..... −403.9 1,115.8 1,519.7 1,746.9 582.0 373.8 208.2 1,164.9 9,912.2 10,357.5 10,008.4 3.8 3.7
2001: I ....... −392.9 1,100.7 1,493.7 1,783.3 596.2 383.5 212.7 1,187.2 10,031.4 10,414.4 10,060.2 2.8 2.2 II ...... −361.7 1,060.5 1,422.2 1,825.4 610.9 388.3 222.6 1,214.5 10,136.0 10,490.6 10,173.5 4.4 3.0 III ..... −361.9 1,003.5 1,365.3 1,825.6 614.3 393.0 221.3 1,211.2 10,166.9 10,497.0 10,151.8 .2 .2 IV ..... −351.6 966.6 1,318.2 1,868.2 630.1 405.6 224.5 1,238.1 10,304.5 10,577.9 10,300.9 3.6 3.1
2002: I ....... −376.3 975.0 1,351.3 1,909.2 654.2 418.5 235.8 1,255.0 10,347.2 10,714.6 10,361.7 4.5 5.3 II ...... −415.4 1,008.1 1,423.5 1,944.9 676.6 431.7 244.9 1,268.3 10,431.7 10,861.2 10,461.6 4.2 5.6 III ..... −431.1 1,023.4 1,454.5 1,968.3 684.4 438.5 245.9 1,283.9 10,527.4 10,977.6 10,571.7 3.9 4.4 IV ..... −476.6 1,013.5 1,490.1 2,004.2 708.2 461.0 247.2 1,296.0 10,597.1 11,094.1 10,661.2 2.7 4.3
2003: I ....... −503.3 1,019.8 1,523.0 2,041.4 723.4 467.4 256.0 1,318.0 10,734.0 11,247.8 10,781.3 4.9 5.7 II ...... −497.6 1,018.1 1,515.7 2,074.2 761.1 506.7 254.4 1,313.1 10,899.3 11,381.6 10,929.0 5.3 4.8 III ..... −488.8 1,047.7 1,536.4 2,086.4 756.7 498.1 258.7 1,329.7 11,120.4 11,605.5 11,168.3 8.8 8.1 IV ..... −502.8 1,099.2 1,602.0 2,100.0 767.5 513.6 253.9 1,332.6 11,267.4 11,773.7 11,358.1 5.7 5.9
2004: I ....... −546.8 1,134.3 1,681.2 2,139.5 793.3 534.1 259.1 1,346.3 11,436.4 12,019.4 11,546.1 7.4 8.6 II ...... −591.3 1,167.6 1,758.9 2,174.3 804.4 541.2 263.2 1,369.9 11,598.5 12,248.8 11,693.6 6.6 7.9 III ..... −611.8 1,189.5 1,801.2 2,197.2 817.4 557.0 260.4 1,379.8 11,783.3 12,426.6 11,853.0 5.5 5.9 IV p ... −687.5 1,189.6 1,877.1 2,224.3 824.8 559.9 264.9 1,399.5 11,921.5 12,654.5 .............. 5.3 7.5
1 Gross domestic product (GDP) less exports of goods and services plus imports of goods and services. 2 GDP plus net income receipts from rest of the world. Source: Department of Commerce, Bureau of Economic Analysis.
210
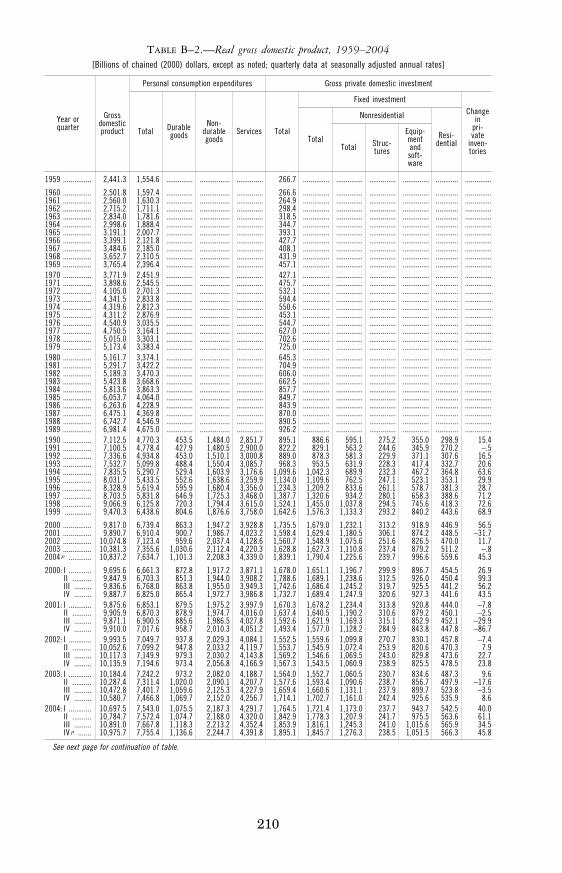
TABLE B–2.—Real gross domestic product, 1959–2004 [Billions of chained (2000) dollars, except as noted; quarterly data at seasonally adjusted annual rates]
Year or quarter
Gross domestic product
Personal consumption expenditures Gross private domestic investment
Total Durable goods
Non- durable goods
Services Total
Fixed investment Change
in pri- vate
inven- tories
Total
Nonresidential
Resi-dential Total Struc-
tures
Equip- ment and soft- ware
1959 ............... 2,441.3 1,554.6 .............. ................ .............. 266.7 .............. .............. .............. .............. ............ ..............
1960 ............... 2,501.8 1,597.4 .............. ................ .............. 266.6 .............. .............. .............. .............. ............ ..............1961 ............... 2,560.0 1,630.3 .............. ................ .............. 264.9 .............. .............. .............. .............. ............ ..............1962 ............... 2,715.2 1,711.1 .............. ................ .............. 298.4 .............. .............. .............. .............. ............ ..............1963 ............... 2,834.0 1,781.6 .............. ................ .............. 318.5 .............. .............. .............. .............. ............ ..............1964 ............... 2,998.6 1,888.4 .............. ................ .............. 344.7 .............. .............. .............. .............. ............ ..............1965 ............... 3,191.1 2,007.7 .............. ................ .............. 393.1 .............. .............. .............. .............. ............ ..............1966 ............... 3,399.1 2,121.8 .............. ................ .............. 427.7 .............. .............. .............. .............. ............ ..............1967 ............... 3,484.6 2,185.0 .............. ................ .............. 408.1 .............. .............. .............. .............. ............ ..............1968 ............... 3,652.7 2,310.5 .............. ................ .............. 431.9 .............. .............. .............. .............. ............ ..............1969 ............... 3,765.4 2,396.4 .............. ................ .............. 457.1 .............. .............. .............. .............. ............ ..............1970 ............... 3,771.9 2,451.9 .............. ................ .............. 427.1 .............. .............. .............. .............. ............ ..............1971 ............... 3,898.6 2,545.5 .............. ................ .............. 475.7 .............. .............. .............. .............. ............ ..............1972 ............... 4,105.0 2,701.3 .............. ................ .............. 532.1 .............. .............. .............. .............. ............ ..............1973 ............... 4,341.5 2,833.8 .............. ................ .............. 594.4 .............. .............. .............. .............. ............ ..............1974 ............... 4,319.6 2,812.3 .............. ................ .............. 550.6 .............. .............. .............. .............. ............ ..............1975 ............... 4,311.2 2,876.9 .............. ................ .............. 453.1 .............. .............. .............. .............. ............ ..............1976 ............... 4,540.9 3,035.5 .............. ................ .............. 544.7 .............. .............. .............. .............. ............ ..............1977 ............... 4,750.5 3,164.1 .............. ................ .............. 627.0 .............. .............. .............. .............. ............ ..............1978 ............... 5,015.0 3,303.1 .............. ................ .............. 702.6 .............. .............. .............. .............. ............ ..............1979 ............... 5,173.4 3,383.4 .............. ................ .............. 725.0 .............. .............. .............. .............. ............ ..............1980 ............... 5,161.7 3,374.1 .............. ................ .............. 645.3 .............. .............. .............. .............. ............ ..............1981 ............... 5,291.7 3,422.2 .............. ................ .............. 704.9 .............. .............. .............. .............. ............ ..............1982 ............... 5,189.3 3,470.3 .............. ................ .............. 606.0 .............. .............. .............. .............. ............ ..............1983 ............... 5,423.8 3,668.6 .............. ................ .............. 662.5 .............. .............. .............. .............. ............ ..............1984 ............... 5,813.6 3,863.3 .............. ................ .............. 857.7 .............. .............. .............. .............. ............ ..............1985 ............... 6,053.7 4,064.0 .............. ................ .............. 849.7 .............. .............. .............. .............. ............ ..............1986 ............... 6,263.6 4,228.9 .............. ................ .............. 843.9 .............. .............. .............. .............. ............ ..............1987 ............... 6,475.1 4,369.8 .............. ................ .............. 870.0 .............. .............. .............. .............. ............ ..............1988 ............... 6,742.7 4,546.9 .............. ................ .............. 890.5 .............. .............. .............. .............. ............ ..............1989 ............... 6,981.4 4,675.0 .............. ................ .............. 926.2 .............. .............. .............. .............. ............ ..............1990 ............... 7,112.5 4,770.3 453.5 1,484.0 2,851.7 895.1 886.6 595.1 275.2 355.0 298.9 15.4 1991 ............... 7,100.5 4,778.4 427.9 1,480.5 2,900.0 822.2 829.1 563.2 244.6 345.9 270.2 −.5 1992 ............... 7,336.6 4,934.8 453.0 1,510.1 3,000.8 889.0 878.3 581.3 229.9 371.1 307.6 16.5 1993 ............... 7,532.7 5,099.8 488.4 1,550.4 3,085.7 968.3 953.5 631.9 228.3 417.4 332.7 20.6 1994 ............... 7,835.5 5,290.7 529.4 1,603.9 3,176.6 1,099.6 1,042.3 689.9 232.3 467.2 364.8 63.6 1995 ............... 8,031.7 5,433.5 552.6 1,638.6 3,259.9 1,134.0 1,109.6 762.5 247.1 523.1 353.1 29.9 1996 ............... 8,328.9 5,619.4 595.9 1,680.4 3,356.0 1,234.3 1,209.2 833.6 261.1 578.7 381.3 28.7 1997 ............... 8,703.5 5,831.8 646.9 1,725.3 3,468.0 1,387.7 1,320.6 934.2 280.1 658.3 388.6 71.2 1998 ............... 9,066.9 6,125.8 720.3 1,794.4 3,615.0 1,524.1 1,455.0 1,037.8 294.5 745.6 418.3 72.6 1999 .............. 9,470.3 6,438.6 804.6 1,876.6 3,758.0 1,642.6 1,576.3 1,133.3 293.2 840.2 443.6 68.9
2000 ............... 9,817.0 6,739.4 863.3 1,947.2 3,928.8 1,735.5 1,679.0 1,232.1 313.2 918.9 446.9 56.5 2001 ............... 9,890.7 6,910.4 900.7 1,986.7 4,023.2 1,598.4 1,629.4 1,180.5 306.1 874.2 448.5 −31.7 2002 ............... 10,074.8 7,123.4 959.6 2,037.4 4,128.6 1,560.7 1,548.9 1,075.6 251.6 826.5 470.0 11.7 2003 ............... 10,381.3 7,355.6 1,030.6 2,112.4 4,220.3 1,628.8 1,627.3 1,110.8 237.4 879.2 511.2 −.8 2004 p ............ 10,837.2 7,634.7 1,101.3 2,208.3 4,339.0 1,839.1 1,790.4 1,225.6 239.7 996.6 559.6 45.3
2000: I ............ 9,695.6 6,661.3 872.8 1,917.2 3,871.1 1,678.0 1,651.1 1,196.7 299.9 896.7 454.5 26.9 II .......... 9,847.9 6,703.3 851.3 1,944.0 3,908.2 1,788.6 1,689.1 1,238.6 312.5 926.0 450.4 99.3 III ......... 9,836.6 6,768.0 863.8 1,955.0 3,949.3 1,742.6 1,686.4 1,245.2 319.7 925.5 441.2 56.2 IV ......... 9,887.7 6,825.0 865.4 1,972.7 3,986.8 1,732.7 1,689.4 1,247.9 320.6 927.3 441.6 43.5
2001: I ............ 9,875.6 6,853.1 879.5 1,975.2 3,997.9 1,670.3 1,678.2 1,234.4 313.8 920.8 444.0 −7.8 II .......... 9,905.9 6,870.3 878.9 1,974.7 4,016.0 1,637.4 1,640.5 1,190.2 310.6 879.2 450.1 −2.5 III ......... 9,871.1 6,900.5 885.6 1,986.5 4,027.8 1,592.6 1,621.9 1,169.3 315.1 852.9 452.1 −29.9 IV ......... 9,910.0 7,017.6 958.7 2,010.3 4,051.2 1,493.4 1,577.0 1,128.2 284.9 843.8 447.8 −86.7
2002: I ............ 9,993.5 7,049.7 937.8 2,029.3 4,084.1 1,552.5 1,559.6 1,099.8 270.7 830.1 457.8 −7.4 II .......... 10,052.6 7,099.2 947.8 2,033.2 4,119.7 1,553.7 1,545.9 1,072.4 253.9 820.6 470.3 7.9 III ......... 10,117.3 7,149.9 979.3 2,030.2 4,143.8 1,569.2 1,546.6 1,069.5 243.0 829.8 473.6 22.7 IV ......... 10,135.9 7,194.6 973.4 2,056.8 4,166.9 1,567.3 1,543.5 1,060.9 238.9 825.5 478.5 23.8
2003: I ............ 10,184.4 7,242.2 973.2 2,082.0 4,188.7 1,564.0 1,552.7 1,060.5 230.7 834.6 487.3 9.6 II .......... 10,287.4 7,311.4 1,020.0 2,090.1 4,207.7 1,577.6 1,593.4 1,090.6 238.7 856.7 497.9 −17.6 III ......... 10,472.8 7,401.7 1,059.6 2,125.3 4,227.9 1,659.4 1,660.6 1,131.1 237.9 899.7 523.8 −3.5 IV ......... 10,580.7 7,466.8 1,069.7 2,152.0 4,256.7 1,714.1 1,702.7 1,161.0 242.4 925.6 535.9 8.6
2004: I ............ 10,697.5 7,543.0 1,075.5 2,187.3 4,291.7 1,764.5 1,721.4 1,173.0 237.7 943.7 542.5 40.0 II .......... 10,784.7 7,572.4 1,074.7 2,188.0 4,320.0 1,842.9 1,778.3 1,207.9 241.7 975.5 563.6 61.1 III ......... 10,891.0 7,667.8 1,118.3 2,213.2 4,352.4 1,853.9 1,816.1 1,245.3 241.0 1,015.6 565.9 34.5 IV p ....... 10,975.7 7,755.4 1,136.6 2,244.7 4,391.8 1,895.1 1,845.7 1,276.3 238.5 1,051.5 566.3 45.8
See next page for continuation of table.
211
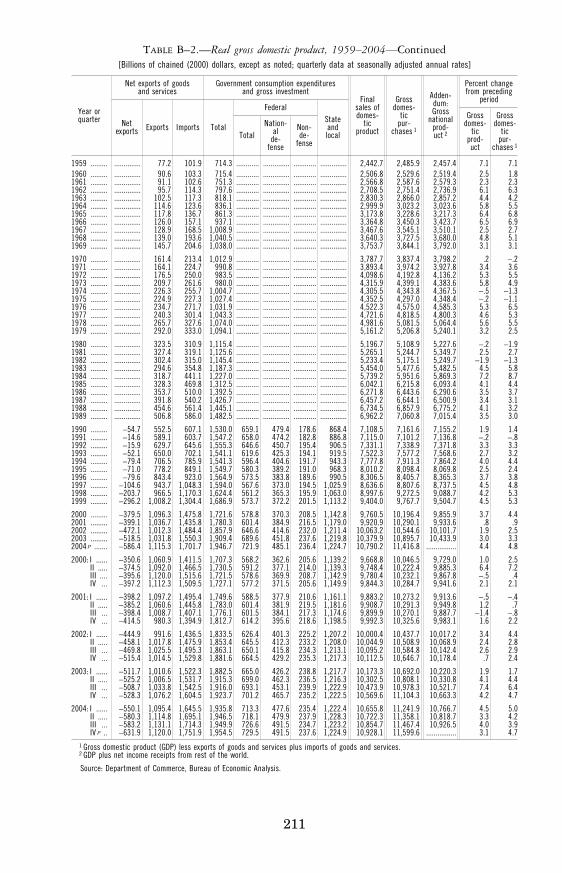
TABLE B–2.—Real gross domestic product, 1959–2004—Continued [Billions of chained (2000) dollars, except as noted; quarterly data at seasonally adjusted annual rates]
Year or quarter
Net exports of goods and services
Government consumption expenditures and gross investment
Final sales of domes-
tic product
Gross domes-
tic pur-
chases 1
Adden- dum: Gross
national prod- uct 2
Percent change from preceding
period
Net exports Exports Imports Total
Federal State and local
Gross domes-
tic prod- uct
Gross domes-
tic pur-
chases 1 Total
Nation- al
de- fense
Non- de-
fense
1959 ......... .............. 77.2 101.9 714.3 ............ .............. ............ .............. 2,442.7 2,485.9 2,457.4 7.1 7.1 1960 ......... .............. 90.6 103.3 715.4 ............ .............. ............ .............. 2,506.8 2,529.6 2,519.4 2.5 1.8 1961 ......... .............. 91.1 102.6 751.3 ............ .............. ............ .............. 2,566.8 2,587.6 2,579.3 2.3 2.3 1962 ......... .............. 95.7 114.3 797.6 ............ .............. ............ .............. 2,708.5 2,751.4 2,736.9 6.1 6.3 1963 ......... .............. 102.5 117.3 818.1 ............ .............. ............ .............. 2,830.3 2,866.0 2,857.2 4.4 4.2 1964 ......... .............. 114.6 123.6 836.1 ............ .............. ............ .............. 2,999.9 3,023.2 3,023.6 5.8 5.5 1965 ......... .............. 117.8 136.7 861.3 ............ .............. ............ .............. 3,173.8 3,228.6 3,217.3 6.4 6.8 1966 ......... .............. 126.0 157.1 937.1 ............ .............. ............ .............. 3,364.8 3,450.3 3,423.7 6.5 6.9 1967 ......... .............. 128.9 168.5 1,008.9 ............ .............. ............ .............. 3,467.6 3,545.1 3,510.1 2.5 2.7 1968 ......... .............. 139.0 193.6 1,040.5 ............ .............. ............ .............. 3,640.3 3,727.5 3,680.0 4.8 5.1 1969 ......... .............. 145.7 204.6 1,038.0 ............ .............. ............ .............. 3,753.7 3,844.1 3,792.0 3.1 3.1
1970 ......... .............. 161.4 213.4 1,012.9 ............ .............. ............ .............. 3,787.7 3,837.4 3,798.2 .2 −.2 1971 ......... .............. 164.1 224.7 990.8 ............ .............. ............ .............. 3,893.4 3,974.2 3,927.8 3.4 3.6 1972 ......... .............. 176.5 250.0 983.5 ............ .............. ............ .............. 4,098.6 4,192.8 4,136.2 5.3 5.5 1973 ......... .............. 209.7 261.6 980.0 ............ .............. ............ .............. 4,315.9 4,399.1 4,383.6 5.8 4.9 1974 ......... .............. 226.3 255.7 1,004.7 ............ .............. ............ .............. 4,305.5 4,343.8 4,367.5 −.5 −1.3 1975 ......... .............. 224.9 227.3 1,027.4 ............ .............. ............ .............. 4,352.5 4,297.0 4,348.4 −.2 −1.1 1976 ......... .............. 234.7 271.7 1,031.9 ............ .............. ............ .............. 4,522.3 4,575.0 4,585.3 5.3 6.5 1977 ......... .............. 240.3 301.4 1,043.3 ............ .............. ............ .............. 4,721.6 4,818.5 4,800.3 4.6 5.3 1978 ......... .............. 265.7 327.6 1,074.0 ............ .............. ............ .............. 4,981.6 5,081.5 5,064.4 5.6 5.5 1979 ......... .............. 292.0 333.0 1,094.1 ............ .............. ............ .............. 5,161.2 5,206.8 5,240.1 3.2 2.5
1980 ......... .............. 323.5 310.9 1,115.4 ............ .............. ............ .............. 5,196.7 5,108.9 5,227.6 −.2 −1.9 1981 ......... .............. 327.4 319.1 1,125.6 ............ .............. ............ .............. 5,265.1 5,244.7 5,349.7 2.5 2.7 1982 ......... .............. 302.4 315.0 1,145.4 ............ .............. ............ .............. 5,233.4 5,175.1 5,249.7 −1.9 −1.3 1983 ......... .............. 294.6 354.8 1,187.3 ............ .............. ............ .............. 5,454.0 5,477.6 5,482.5 4.5 5.8 1984 ......... .............. 318.7 441.1 1,227.0 ............ .............. ............ .............. 5,739.2 5,951.6 5,869.3 7.2 8.7 1985 ......... .............. 328.3 469.8 1,312.5 ............ .............. ............ .............. 6,042.1 6,215.8 6,093.4 4.1 4.4 1986 ......... .............. 353.7 510.0 1,392.5 ............ .............. ............ .............. 6,271.8 6,443.6 6,290.6 3.5 3.7 1987 ......... .............. 391.8 540.2 1,426.7 ............ .............. ............ .............. 6,457.2 6,644.1 6,500.9 3.4 3.1 1988 ......... .............. 454.6 561.4 1,445.1 ............ .............. ............ .............. 6,734.5 6,857.9 6,775.2 4.1 3.2 1989 ......... .............. 506.8 586.0 1,482.5 ............ .............. ............ .............. 6,962.2 7,060.8 7,015.4 3.5 3.0
1990 ......... −54.7 552.5 607.1 1,530.0 659.1 479.4 178.6 868.4 7,108.5 7,161.6 7,155.2 1.9 1.4 1991 ......... −14.6 589.1 603.7 1,547.2 658.0 474.2 182.8 886.8 7,115.0 7,101.2 7,136.8 −.2 −.8 1992 ......... −15.9 629.7 645.6 1,555.3 646.6 450.7 195.4 906.5 7,331.1 7,338.9 7,371.8 3.3 3.3 1993 ......... −52.1 650.0 702.1 1,541.1 619.6 425.3 194.1 919.5 7,522.3 7,577.2 7,568.6 2.7 3.2 1994 ......... −79.4 706.5 785.9 1,541.3 596.4 404.6 191.7 943.3 7,777.8 7,911.3 7,864.2 4.0 4.4 1995 ......... −71.0 778.2 849.1 1,549.7 580.3 389.2 191.0 968.3 8,010.2 8,098.4 8,069.8 2.5 2.4 1996 ......... −79.6 843.4 923.0 1,564.9 573.5 383.8 189.6 990.5 8,306.5 8,405.7 8,365.3 3.7 3.8 1997 ......... −104.6 943.7 1,048.3 1,594.0 567.6 373.0 194.5 1,025.9 8,636.6 8,807.6 8,737.5 4.5 4.8 1998 ......... −203.7 966.5 1,170.3 1,624.4 561.2 365.3 195.9 1,063.0 8,997.6 9,272.5 9,088.7 4.2 5.3 1999 ......... −296.2 1,008.2 1,304.4 1,686.9 573.7 372.2 201.5 1,113.2 9,404.0 9,767.7 9,504.7 4.5 5.3
2000 ......... −379.5 1,096.3 1,475.8 1,721.6 578.8 370.3 208.5 1,142.8 9,760.5 10,196.4 9,855.9 3.7 4.4 2001 ......... −399.1 1,036.7 1,435.8 1,780.3 601.4 384.9 216.5 1,179.0 9,920.9 10,290.1 9,933.6 .8 .9 2002 ......... −472.1 1,012.3 1,484.4 1,857.9 646.6 414.6 232.0 1,211.4 10,063.2 10,544.6 10,101.7 1.9 2.5 2003 ......... −518.5 1,031.8 1,550.3 1,909.4 689.6 451.8 237.6 1,219.8 10,379.9 10,895.7 10,433.9 3.0 3.3 2004 p ....... −586.4 1,115.3 1,701.7 1,946.7 721.9 485.1 236.4 1,224.7 10,790.2 11,416.8 ................ 4.4 4.8
2000: I ...... −350.6 1,060.9 1,411.5 1,707.3 568.2 362.6 205.6 1,139.2 9,668.8 10,046.5 9,729.0 1.0 2.5 II ..... −374.5 1,092.0 1,466.5 1,730.5 591.2 377.1 214.0 1,139.3 9,748.4 10,222.4 9,885.3 6.4 7.2 III .... −395.6 1,120.0 1,515.6 1,721.5 578.6 369.9 208.7 1,142.9 9,780.4 10,232.1 9,867.8 −.5 .4 IV ... −397.2 1,112.3 1,509.5 1,727.1 577.2 371.5 205.6 1,149.9 9,844.3 10,284.7 9,941.6 2.1 2.1
2001: I ...... −398.2 1,097.2 1,495.4 1,749.6 588.5 377.9 210.6 1,161.1 9,883.2 10,273.2 9,913.6 −.5 −.4 II ..... −385.2 1,060.6 1,445.8 1,783.0 601.4 381.9 219.5 1,181.6 9,908.7 10,291.3 9,949.8 1.2 .7 III ... −398.4 1,008.7 1,407.1 1,776.1 601.5 384.1 217.3 1,174.6 9,899.9 10,270.1 9,887.7 −1.4 −.8 IV ... −414.5 980.3 1,394.9 1,812.7 614.2 395.6 218.6 1,198.5 9,992.3 10,325.6 9,983.1 1.6 2.2
2002: I ...... −444.9 991.6 1,436.5 1,833.5 626.4 401.3 225.2 1,207.2 10,000.4 10,437.7 10,017.2 3.4 4.4 II ..... −458.1 1,017.8 1,475.9 1,853.4 645.5 412.3 233.2 1,208.0 10,044.9 10,508.9 10,068.9 2.4 2.8 III ... −469.8 1,025.5 1,495.3 1,863.1 650.1 415.8 234.3 1,213.1 10,095.2 10,584.8 10,142.4 2.6 2.9 IV ... −515.4 1,014.5 1,529.8 1,881.6 664.5 429.2 235.3 1,217.3 10,112.5 10,646.7 10,178.4 .7 2.4
2003: I ...... −511.7 1,010.6 1,522.3 1,882.5 665.0 426.2 238.8 1,217.7 10,173.3 10,692.0 10,220.3 1.9 1.7 II ..... −525.2 1,006.5 1,531.7 1,915.3 699.0 462.3 236.5 1,216.3 10,302.5 10,808.1 10,330.8 4.1 4.4 III ... −508.7 1,033.8 1,542.5 1,916.0 693.1 453.1 239.9 1,222.9 10,473.9 10,978.3 10,521.7 7.4 6.4 IV ... −528.3 1,076.2 1,604.5 1,923.7 701.2 465.7 235.2 1,222.5 10,569.6 11,104.3 10,663.3 4.2 4.7
2004: I ...... −550.1 1,095.4 1,645.5 1,935.8 713.3 477.6 235.4 1,222.4 10,655.8 11,241.9 10,766.7 4.5 5.0 II ..... −580.3 1,114.8 1,695.1 1,946.5 718.1 479.9 237.9 1,228.3 10,722.3 11,358.1 10,818.7 3.3 4.2 III ... −583.2 1,131.1 1,714.3 1,949.9 726.6 491.5 234.7 1,223.2 10,854.7 11,467.4 10,926.5 4.0 3.9 IV p .. −631.9 1,120.0 1,751.9 1,954.5 729.5 491.5 237.6 1,224.9 10,928.1 11,599.6 ................ 3.1 4.7
1 Gross domestic product (GDP) less exports of goods and services plus imports of goods and services. 2 GDP plus net income receipts from rest of the world.
Source: Department of Commerce, Bureau of Economic Analysis.
212
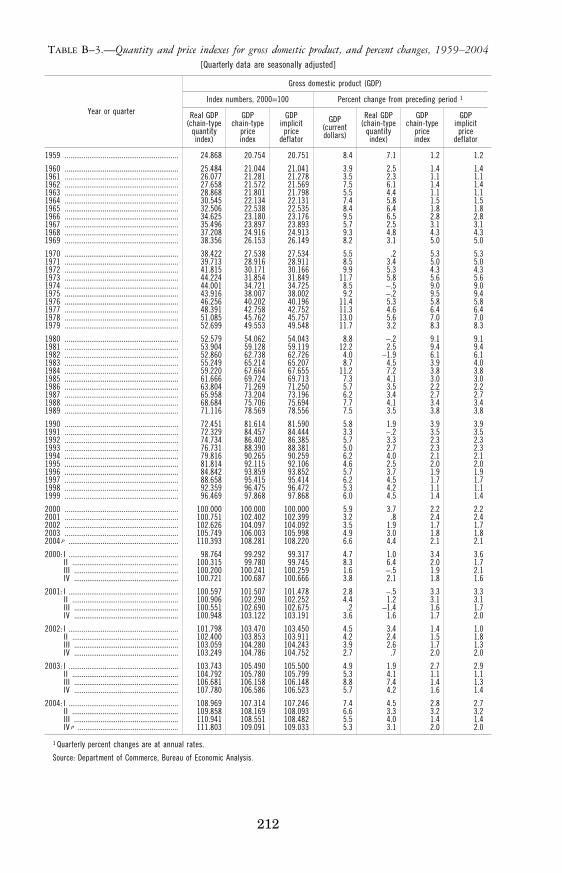
TABLE B–3.—Quantity and price indexes for gross domestic product, and percent changes, 1959–2004 [Quarterly data are seasonally adjusted]
Year or quarter
Gross domestic product (GDP)
Index numbers, 2000=100 Percent change from preceding period 1
Real GDP (chain-type
quantity index)
GDP chain-type
price index
GDP implicit
price deflator
GDP (current dollars)
Real GDP (chain-type
quantity index)
GDP chain-type
price index
GDP implicit
price deflator
1959 ............................................................ 24.868 20.754 20.751 8.4 7.1 1.2 1.2
1960 ............................................................ 25.484 21.044 21.041 3.9 2.5 1.4 1.4 1961 ............................................................ 26.077 21.281 21.278 3.5 2.3 1.1 1.1 1962 ............................................................ 27.658 21.572 21.569 7.5 6.1 1.4 1.4 1963 ............................................................ 28.868 21.801 21.798 5.5 4.4 1.1 1.1 1964 ............................................................ 30.545 22.134 22.131 7.4 5.8 1.5 1.5 1965 ............................................................ 32.506 22.538 22.535 8.4 6.4 1.8 1.8 1966 ............................................................ 34.625 23.180 23.176 9.5 6.5 2.8 2.8 1967 ............................................................ 35.496 23.897 23.893 5.7 2.5 3.1 3.1 1968 ............................................................ 37.208 24.916 24.913 9.3 4.8 4.3 4.3 1969 ............................................................ 38.356 26.153 26.149 8.2 3.1 5.0 5.0
1970 ............................................................ 38.422 27.538 27.534 5.5 .2 5.3 5.3 1971 ............................................................ 39.713 28.916 28.911 8.5 3.4 5.0 5.0 1972 ............................................................ 41.815 30.171 30.166 9.9 5.3 4.3 4.3 1973 ............................................................ 44.224 31.854 31.849 11.7 5.8 5.6 5.6 1974 ............................................................ 44.001 34.721 34.725 8.5 −.5 9.0 9.0 1975 ............................................................ 43.916 38.007 38.002 9.2 −.2 9.5 9.4 1976 ............................................................ 46.256 40.202 40.196 11.4 5.3 5.8 5.8 1977 ............................................................ 48.391 42.758 42.752 11.3 4.6 6.4 6.4 1978 ............................................................ 51.085 45.762 45.757 13.0 5.6 7.0 7.0 1979 ............................................................ 52.699 49.553 49.548 11.7 3.2 8.3 8.3
1980 ............................................................ 52.579 54.062 54.043 8.8 −.2 9.1 9.1 1981 ............................................................ 53.904 59.128 59.119 12.2 2.5 9.4 9.4 1982 ............................................................ 52.860 62.738 62.726 4.0 −1.9 6.1 6.1 1983 ............................................................ 55.249 65.214 65.207 8.7 4.5 3.9 4.0 1984 ............................................................ 59.220 67.664 67.655 11.2 7.2 3.8 3.8 1985 ............................................................ 61.666 69.724 69.713 7.3 4.1 3.0 3.0 1986 ............................................................ 63.804 71.269 71.250 5.7 3.5 2.2 2.2 1987 ............................................................ 65.958 73.204 73.196 6.2 3.4 2.7 2.7 1988 ............................................................ 68.684 75.706 75.694 7.7 4.1 3.4 3.4 1989 ............................................................ 71.116 78.569 78.556 7.5 3.5 3.8 3.8
1990 ............................................................ 72.451 81.614 81.590 5.8 1.9 3.9 3.9 1991 ............................................................ 72.329 84.457 84.444 3.3 −.2 3.5 3.5 1992 ............................................................ 74.734 86.402 86.385 5.7 3.3 2.3 2.3 1993 ............................................................ 76.731 88.390 88.381 5.0 2.7 2.3 2.3 1994 ............................................................ 79.816 90.265 90.259 6.2 4.0 2.1 2.1 1995 ............................................................ 81.814 92.115 92.106 4.6 2.5 2.0 2.0 1996 ............................................................ 84.842 93.859 93.852 5.7 3.7 1.9 1.9 1997 ............................................................ 88.658 95.415 95.414 6.2 4.5 1.7 1.7 1998 ............................................................ 92.359 96.475 96.472 5.3 4.2 1.1 1.1 1999 ............................................................ 96.469 97.868 97.868 6.0 4.5 1.4 1.4
2000 ............................................................ 100.000 100.000 100.000 5.9 3.7 2.2 2.2 2001 ............................................................ 100.751 102.402 102.399 3.2 .8 2.4 2.4 2002 ............................................................ 102.626 104.097 104.092 3.5 1.9 1.7 1.7 2003 ............................................................ 105.749 106.003 105.998 4.9 3.0 1.8 1.8 2004 p .......................................................... 110.393 108.281 108.220 6.6 4.4 2.1 2.1
2000: I .......................................................... 98.764 99.292 99.317 4.7 1.0 3.4 3.6 II ........................................................ 100.315 99.780 99.745 8.3 6.4 2.0 1.7 III ....................................................... 100.200 100.241 100.259 1.6 −.5 1.9 2.1 IV ....................................................... 100.721 100.687 100.666 3.8 2.1 1.8 1.6
2001: I .......................................................... 100.597 101.507 101.478 2.8 −.5 3.3 3.3 II ........................................................ 100.906 102.290 102.252 4.4 1.2 3.1 3.1 III ....................................................... 100.551 102.690 102.675 .2 −1.4 1.6 1.7 IV ....................................................... 100.948 103.122 103.191 3.6 1.6 1.7 2.0
2002: I .......................................................... 101.798 103.470 103.450 4.5 3.4 1.4 1.0 II ........................................................ 102.400 103.853 103.911 4.2 2.4 1.5 1.8 III ....................................................... 103.059 104.280 104.243 3.9 2.6 1.7 1.3 IV ....................................................... 103.249 104.786 104.752 2.7 .7 2.0 2.0
2003: I .......................................................... 103.743 105.490 105.500 4.9 1.9 2.7 2.9 II ........................................................ 104.792 105.780 105.799 5.3 4.1 1.1 1.1 III ....................................................... 106.681 106.158 106.148 8.8 7.4 1.4 1.3 IV ....................................................... 107.780 106.586 106.523 5.7 4.2 1.6 1.4
2004: I .......................................................... 108.969 107.314 107.246 7.4 4.5 2.8 2.7 II ........................................................ 109.858 108.169 108.093 6.6 3.3 3.2 3.2 III ....................................................... 110.941 108.551 108.482 5.5 4.0 1.4 1.4 IV p ..................................................... 111.803 109.091 109.033 5.3 3.1 2.0 2.0
1 Quarterly percent changes are at annual rates.
Source: Department of Commerce, Bureau of Economic Analysis.
213
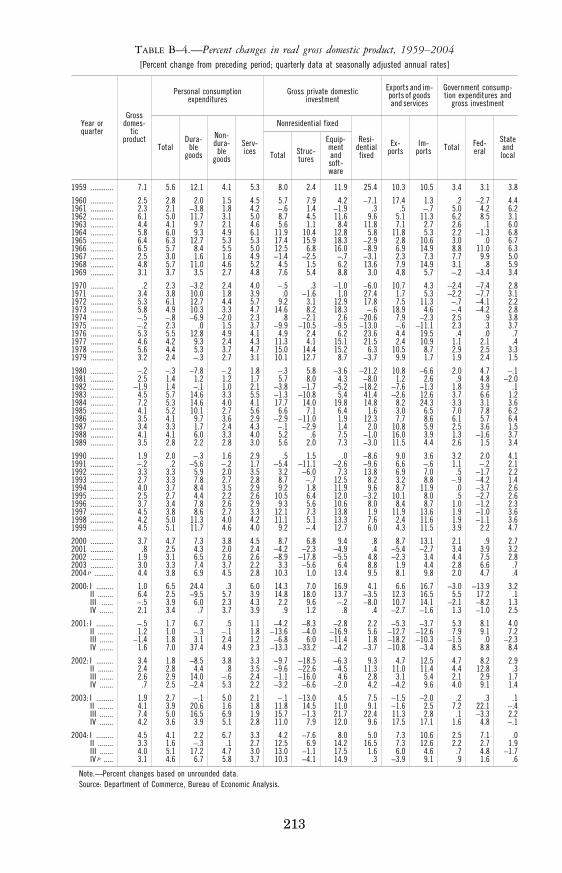
TABLE B–4.—Percent changes in real gross domestic product, 1959–2004 [Percent change from preceding period; quarterly data at seasonally adjusted annual rates]
Year or quarter
Gross domes-
tic product
Personal consumption expenditures
Gross private domestic investment
Exports and im- ports of goods and services
Government consump-tion expenditures and
gross investment
Total Dura-
ble goods
Non- dura-
ble goods
Serv-ices
Nonresidential fixed
Resi- dential fixed
Ex-ports
Im-ports Total Fed-
eral State and local Total Struc-
tures
Equip- ment and soft- ware
1959 ............ 7.1 5.6 12.1 4.1 5.3 8.0 2.4 11.9 25.4 10.3 10.5 3.4 3.1 3.8
1960 ............ 2.5 2.8 2.0 1.5 4.5 5.7 7.9 4.2 −7.1 17.4 1.3 .2 −2.7 4.4 1961 ............ 2.3 2.1 −3.8 1.8 4.2 −.6 1.4 −1.9 .3 .5 −.7 5.0 4.2 6.2 1962 ............ 6.1 5.0 11.7 3.1 5.0 8.7 4.5 11.6 9.6 5.1 11.3 6.2 8.5 3.1 1963 ............ 4.4 4.1 9.7 2.1 4.6 5.6 1.1 8.4 11.8 7.1 2.7 2.6 .1 6.0 1964 ............ 5.8 6.0 9.3 4.9 6.1 11.9 10.4 12.8 5.8 11.8 5.3 2.2 −1.3 6.8 1965 ............ 6.4 6.3 12.7 5.3 5.3 17.4 15.9 18.3 −2.9 2.8 10.6 3.0 .0 6.7 1966 ............ 6.5 5.7 8.4 5.5 5.0 12.5 6.8 16.0 −8.9 6.9 14.9 8.8 11.0 6.3 1967 ............ 2.5 3.0 1.6 1.6 4.9 −1.4 −2.5 −.7 −3.1 2.3 7.3 7.7 9.9 5.0 1968 ............ 4.8 5.7 11.0 4.6 5.2 4.5 1.5 6.2 13.6 7.9 14.9 3.1 .8 5.9 1969 ............ 3.1 3.7 3.5 2.7 4.8 7.6 5.4 8.8 3.0 4.8 5.7 −.2 −3.4 3.4
1970 ............ .2 2.3 −3.2 2.4 4.0 −.5 .3 −1.0 −6.0 10.7 4.3 −2.4 −7.4 2.8 1971 ............ 3.4 3.8 10.0 1.8 3.9 .0 −1.6 1.0 27.4 1.7 5.3 −2.2 −7.7 3.1 1972 ............ 5.3 6.1 12.7 4.4 5.7 9.2 3.1 12.9 17.8 7.5 11.3 −.7 −4.1 2.2 1973 ............ 5.8 4.9 10.3 3.3 4.7 14.6 8.2 18.3 −.6 18.9 4.6 −.4 −4.2 2.8 1974 ............ −.5 −.8 −6.9 −2.0 2.3 .8 −2.1 2.6 −20.6 7.9 −2.3 2.5 .9 3.8 1975 ............ −.2 2.3 .0 1.5 3.7 −9.9 −10.5 −9.5 −13.0 −.6 −11.1 2.3 .3 3.7 1976 ............ 5.3 5.5 12.8 4.9 4.1 4.9 2.4 6.2 23.6 4.4 19.5 .4 .0 .7 1977 ............ 4.6 4.2 9.3 2.4 4.3 11.3 4.1 15.1 21.5 2.4 10.9 1.1 2.1 .4 1978 ............ 5.6 4.4 5.3 3.7 4.7 15.0 14.4 15.2 6.3 10.5 8.7 2.9 2.5 3.3 1979 ............ 3.2 2.4 −.3 2.7 3.1 10.1 12.7 8.7 −3.7 9.9 1.7 1.9 2.4 1.5
1980 ............ −.2 −.3 −7.8 −.2 1.8 −.3 5.8 −3.6 −21.2 10.8 −6.6 2.0 4.7 −.1 1981 ............ 2.5 1.4 1.2 1.2 1.7 5.7 8.0 4.3 −8.0 1.2 2.6 .9 4.8 −2.0 1982 ............ −1.9 1.4 −.1 1.0 2.1 −3.8 −1.7 −5.2 −18.2 −7.6 −1.3 1.8 3.9 .1 1983 ............ 4.5 5.7 14.6 3.3 5.5 −1.3 −10.8 5.4 41.4 −2.6 12.6 3.7 6.6 1.2 1984 ............ 7.2 5.3 14.6 4.0 4.1 17.7 14.0 19.8 14.8 8.2 24.3 3.3 3.1 3.6 1985 ............ 4.1 5.2 10.1 2.7 5.6 6.6 7.1 6.4 1.6 3.0 6.5 7.0 7.8 6.2 1986 ............ 3.5 4.1 9.7 3.6 2.9 −2.9 −11.0 1.9 12.3 7.7 8.6 6.1 5.7 6.4 1987 ............ 3.4 3.3 1.7 2.4 4.3 −.1 −2.9 1.4 2.0 10.8 5.9 2.5 3.6 1.5 1988 ............ 4.1 4.1 6.0 3.3 4.0 5.2 .6 7.5 −1.0 16.0 3.9 1.3 −1.6 3.7 1989 ............ 3.5 2.8 2.2 2.8 3.0 5.6 2.0 7.3 −3.0 11.5 4.4 2.6 1.5 3.4
1990 ............ 1.9 2.0 −.3 1.6 2.9 .5 1.5 .0 −8.6 9.0 3.6 3.2 2.0 4.1 1991 ............ −.2 .2 −5.6 −.2 1.7 −5.4 −11.1 −2.6 −9.6 6.6 −.6 1.1 −.2 2.1 1992 ............ 3.3 3.3 5.9 2.0 3.5 3.2 −6.0 7.3 13.8 6.9 7.0 .5 −1.7 2.2 1993 ............ 2.7 3.3 7.8 2.7 2.8 8.7 −.7 12.5 8.2 3.2 8.8 −.9 −4.2 1.4 1994 ............ 4.0 3.7 8.4 3.5 2.9 9.2 1.8 11.9 9.6 8.7 11.9 .0 −3.7 2.6 1995 ............ 2.5 2.7 4.4 2.2 2.6 10.5 6.4 12.0 −3.2 10.1 8.0 .5 −2.7 2.6 1996 ............ 3.7 3.4 7.8 2.6 2.9 9.3 5.6 10.6 8.0 8.4 8.7 1.0 −1.2 2.3 1997 ............ 4.5 3.8 8.6 2.7 3.3 12.1 7.3 13.8 1.9 11.9 13.6 1.9 −1.0 3.6 1998 ............ 4.2 5.0 11.3 4.0 4.2 11.1 5.1 13.3 7.6 2.4 11.6 1.9 −1.1 3.6 1999 ............ 4.5 5.1 11.7 4.6 4.0 9.2 −.4 12.7 6.0 4.3 11.5 3.9 2.2 4.7
2000 ............ 3.7 4.7 7.3 3.8 4.5 8.7 6.8 9.4 .8 8.7 13.1 2.1 .9 2.7 2001 ............ .8 2.5 4.3 2.0 2.4 −4.2 −2.3 −4.9 .4 −5.4 −2.7 3.4 3.9 3.2 2002 ............ 1.9 3.1 6.5 2.6 2.6 −8.9 −17.8 −5.5 4.8 −2.3 3.4 4.4 7.5 2.8 2003 ............ 3.0 3.3 7.4 3.7 2.2 3.3 −5.6 6.4 8.8 1.9 4.4 2.8 6.6 .7 2004 p .......... 4.4 3.8 6.9 4.5 2.8 10.3 1.0 13.4 9.5 8.1 9.8 2.0 4.7 .4
2000: I ......... 1.0 6.5 24.4 .3 6.0 14.3 7.0 16.9 4.1 6.6 16.7 −3.0 −13.9 3.2 II ........ 6.4 2.5 −9.5 5.7 3.9 14.8 18.0 13.7 −3.5 12.3 16.5 5.5 17.2 .1 III ...... −.5 3.9 6.0 2.3 4.3 2.2 9.6 −.2 −8.0 10.7 14.1 −2.1 −8.2 1.3 IV ....... 2.1 3.4 .7 3.7 3.9 .9 1.2 .8 .4 −2.7 −1.6 1.3 −1.0 2.5
2001: I ......... −.5 1.7 6.7 .5 1.1 −4.2 −8.3 −2.8 2.2 −5.3 −3.7 5.3 8.1 4.0 II ........ 1.2 1.0 −.3 −.1 1.8 −13.6 −4.0 −16.9 5.6 −12.7 −12.6 7.9 9.1 7.2 III ....... −1.4 1.8 3.1 2.4 1.2 −6.8 6.0 −11.4 1.8 −18.2 −10.3 −1.5 .0 −2.3 IV ....... 1.6 7.0 37.4 4.9 2.3 −13.3 −33.2 −4.2 −3.7 −10.8 −3.4 8.5 8.8 8.4
2002: I ......... 3.4 1.8 −8.5 3.8 3.3 −9.7 −18.5 −6.3 9.3 4.7 12.5 4.7 8.2 2.9 II ........ 2.4 2.8 4.4 .8 3.5 −9.6 −22.6 −4.5 11.3 11.0 11.4 4.4 12.8 .3 III ....... 2.6 2.9 14.0 −.6 2.4 −1.1 −16.0 4.6 2.8 3.1 5.4 2.1 2.9 1.7 IV ....... .7 2.5 −2.4 5.3 2.2 −3.2 −6.6 −2.0 4.2 −4.2 9.6 4.0 9.1 1.4
2003: I ......... 1.9 2.7 −.1 5.0 2.1 −.1 −13.0 4.5 7.5 −1.5 −2.0 .2 .3 .1 II ........ 4.1 3.9 20.6 1.6 1.8 11.8 14.5 11.0 9.1 −1.6 2.5 7.2 22.1 −.4 III ....... 7.4 5.0 16.5 6.9 1.9 15.7 −1.3 21.7 22.4 11.3 2.8 .1 −3.3 2.2 IV ....... 4.2 3.6 3.9 5.1 2.8 11.0 7.9 12.0 9.6 17.5 17.1 1.6 4.8 −.1
2004: I ......... 4.5 4.1 2.2 6.7 3.3 4.2 −7.6 8.0 5.0 7.3 10.6 2.5 7.1 .0 II ........ 3.3 1.6 −.3 .1 2.7 12.5 6.9 14.2 16.5 7.3 12.6 2.2 2.7 1.9 III ....... 4.0 5.1 17.2 4.7 3.0 13.0 −1.1 17.5 1.6 6.0 4.6 .7 4.8 −1.7 IV p ..... 3.1 4.6 6.7 5.8 3.7 10.3 −4.1 14.9 .3 −3.9 9.1 .9 1.6 .6
Note.—Percent changes based on unrounded data. Source: Department of Commerce, Bureau of Economic Analysis.
214
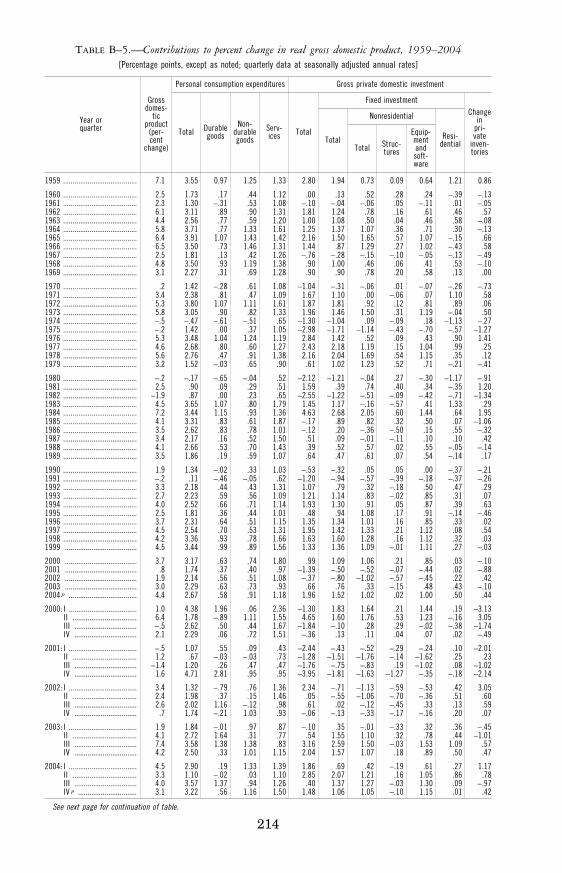
TABLE B–5.—Contributions to percent change in real gross domestic product, 1959–2004 [Percentage points, except as noted; quarterly data at seasonally adjusted annual rates]
Year or quarter
Gross domes-
tic product
(per-cent
change)
Personal consumption expenditures Gross private domestic investment
Total Durable goods
Non- durable goods
Serv-ices Total
Fixed investment Change
in pri- vate
inven- tories
Total
Nonresidential
Resi- dential Total Struc-
tures
Equip- ment and soft- ware
1959 ....................................... 7 .1 3 .55 0 .97 1 .25 1 .33 2 .80 1 .94 0 .73 0 .09 0 .64 1 .21 0 .86
1960 ....................................... 2 .5 1 .73 .17 .44 1 .12 .00 .13 .52 .28 .24 − .39 − .13 1961 ....................................... 2 .3 1 .30 − .31 .53 1 .08 − .10 − .04 − .06 .05 − .11 .01 − .05 1962 ....................................... 6 .1 3 .11 .89 .90 1 .31 1 .81 1 .24 .78 .16 .61 .46 .57 1963 ....................................... 4 .4 2 .56 .77 .59 1 .20 1 .00 1 .08 .50 .04 .46 .58 − .08 1964 ....................................... 5 .8 3 .71 .77 1 .33 1 .61 1 .25 1 .37 1 .07 .36 .71 .30 − .13 1965 ....................................... 6 .4 3 .91 1 .07 1 .43 1 .42 2 .16 1 .50 1 .65 .57 1 .07 − .15 .66 1966 ....................................... 6 .5 3 .50 .73 1 .46 1 .31 1 .44 .87 1 .29 .27 1 .02 − .43 .58 1967 ....................................... 2 .5 1 .81 .13 .42 1 .26 − .76 − .28 − .15 − .10 − .05 − .13 − .49 1968 ....................................... 4 .8 3 .50 .93 1 .19 1 .38 .90 1 .00 .46 .06 .41 .53 − .10 1969 ....................................... 3 .1 2 .27 .31 .69 1 .28 .90 .90 .78 .20 .58 .13 .00
1970 ....................................... .2 1 .42 − .28 .61 1 .08 −1 .04 − .31 − .06 .01 − .07 − .26 − .73 1971 ....................................... 3 .4 2 .38 .81 .47 1 .09 1 .67 1 .10 .00 − .06 .07 1 .10 .58 1972 ....................................... 5 .3 3 .80 1 .07 1 .11 1 .61 1 .87 1 .81 .92 .12 .81 .89 .06 1973 ....................................... 5 .8 3 .05 .90 .82 1 .33 1 .96 1 .46 1 .50 .31 1 .19 − .04 .50 1974 ....................................... − .5 − .47 − .61 − .51 .65 −1 .30 −1 .04 .09 − .09 .18 −1 .13 − .27 1975 ....................................... − .2 1 .42 .00 .37 1 .05 −2 .98 −1 .71 −1 .14 − .43 − .70 − .57 −1 .27 1976 ....................................... 5 .3 3 .48 1 .04 1 .24 1 .19 2 .84 1 .42 .52 .09 .43 .90 1 .41 1977 ....................................... 4 .6 2 .68 .80 .60 1 .27 2 .43 2 .18 1 .19 .15 1 .04 .99 .25 1978 ....................................... 5 .6 2 .76 .47 .91 1 .38 2 .16 2 .04 1 .69 .54 1 .15 .35 .12 1979 ....................................... 3 .2 1 .52 − .03 .65 .90 .61 1 .02 1 .23 .52 .71 − .21 − .41
1980 ....................................... − .2 − .17 − .65 − .04 .52 −2 .12 −1 .21 − .04 .27 − .30 −1 .17 − .91 1981 ....................................... 2 .5 .90 .09 .29 .51 1 .59 .39 .74 .40 .34 − .35 1 .20 1982 ....................................... −1 .9 .87 .00 .23 .65 −2 .55 −1 .22 − .51 − .09 − .42 − .71 −1 .34 1983 ....................................... 4 .5 3 .65 1 .07 .80 1 .79 1 .45 1 .17 − .16 − .57 .41 1 .33 .29 1984 ....................................... 7 .2 3 .44 1 .15 .93 1 .36 4 .63 2 .68 2 .05 .60 1 .44 .64 1 .95 1985 ....................................... 4 .1 3 .31 .83 .61 1 .87 − .17 .89 .82 .32 .50 .07 −1 .06 1986 ....................................... 3 .5 2 .62 .83 .78 1 .01 − .12 .20 − .36 − .50 .15 .55 − .32 1987 ....................................... 3 .4 2 .17 .16 .52 1 .50 .51 .09 − .01 − .11 .10 .10 .42 1988 ....................................... 4 .1 2 .66 .53 .70 1 .43 .39 .52 .57 .02 .55 − .05 − .14 1989 ....................................... 3 .5 1 .86 .19 .59 1 .07 .64 .47 .61 .07 .54 − .14 .17
1990 ....................................... 1 .9 1 .34 − .02 .33 1 .03 − .53 − .32 .05 .05 .00 − .37 − .21 1991 ....................................... − .2 .11 − .46 − .05 .62 −1 .20 − .94 − .57 − .39 − .18 − .37 − .26 1992 ....................................... 3 .3 2 .18 .44 .43 1 .31 1 .07 .79 .32 − .18 .50 .47 .29 1993 ....................................... 2 .7 2 .23 .59 .56 1 .09 1 .21 1 .14 .83 − .02 .85 .31 .07 1994 ....................................... 4 .0 2 .52 .66 .71 1 .14 1 .93 1 .30 .91 .05 .87 .39 .63 1995 ....................................... 2 .5 1 .81 .36 .44 1 .01 .48 .94 1 .08 .17 .91 − .14 − .46 1996 ....................................... 3 .7 2 .31 .64 .51 1 .15 1 .35 1 .34 1 .01 .16 .85 .33 .02 1997 ....................................... 4 .5 2 .54 .70 .53 1 .31 1 .95 1 .42 1 .33 .21 1 .12 .08 .54 1998 ....................................... 4 .2 3 .36 .93 .78 1 .66 1 .63 1 .60 1 .28 .16 1 .12 .32 .03 1999 ...................................... 4 .5 3 .44 .99 .89 1 .56 1 .33 1 .36 1 .09 − .01 1 .11 .27 − .03
2000 ...................................... 3 .7 3 .17 .63 .74 1 .80 .99 1 .09 1 .06 .21 .85 .03 − .10 2001 ...................................... .8 1 .74 .37 .40 .97 −1 .39 − .50 − .52 − .07 − .44 .02 − .88 2002 ...................................... 1 .9 2 .14 .56 .51 1 .08 − .37 − .80 −1 .02 − .57 − .45 .22 .42 2003 ...................................... 3 .0 2 .29 .63 .73 .93 .66 .76 .33 − .15 .48 .43 − .10 2004 p .................................... 4 .4 2 .67 .58 .91 1 .18 1 .96 1 .52 1 .02 .02 1 .00 .50 .44
2000: I .................................... 1 .0 4 .38 1 .96 .06 2 .36 −1 .30 1 .83 1 .64 .21 1 .44 .19 −3 .13 II .................................. 6 .4 1 .78 − .89 1 .11 1 .55 4 .65 1 .60 1 .76 .53 1 .23 − .16 3 .05 III ................................. − .5 2 .62 .50 .44 1 .67 −1 .84 − .10 .28 .29 − .02 − .38 −1 .74 IV ................................. 2 .1 2 .29 .06 .72 1 .51 − .36 .13 .11 .04 .07 .02 − .49
2001: I .................................... − .5 1 .07 .55 .09 .43 −2 .44 − .43 − .52 − .29 − .24 .10 −2 .01 II .................................. 1 .2 .67 − .03 − .03 .73 −1 .28 −1 .51 −1 .76 − .14 −1 .62 .25 .23 III ................................. −1 .4 1 .20 .26 .47 .47 −1 .76 − .75 − .83 .19 −1 .02 .08 −1 .02 IV ................................. 1 .6 4 .71 2 .81 .95 .95 −3 .95 −1 .81 −1 .63 −1 .27 − .35 − .18 −2 .14
2002: I .................................... 3 .4 1 .32 − .79 .76 1 .36 2 .34 − .71 −1 .13 − .59 − .53 .42 3 .05 II .................................. 2 .4 1 .98 .37 .15 1 .46 .05 − .55 −1 .06 − .70 − .36 .51 .60 III ................................. 2 .6 2 .02 1 .16 − .12 .98 .61 .02 − .12 − .45 .33 .13 .59 IV ................................. .7 1 .74 − .21 1 .03 .93 − .06 − .13 − .33 − .17 − .16 .20 .07
2003: I .................................... 1 .9 1 .84 − .01 .97 .87 − .10 .35 − .01 − .33 .32 .36 − .45 II .................................. 4 .1 2 .72 1 .64 .31 .77 .54 1 .55 1 .10 .32 .78 .44 −1 .01 III ................................. 7 .4 3 .58 1 .38 1 .38 .83 3 .16 2 .59 1 .50 − .03 1 .53 1 .09 .57 IV ................................. 4 .2 2 .50 .33 1 .01 1 .15 2 .04 1 .57 1 .07 .18 .89 .50 .47
2004: I .................................... 4 .5 2 .90 .19 1 .33 1 .39 1 .86 .69 .42 − .19 .61 .27 1 .17 II .................................. 3 .3 1 .10 − .02 .03 1 .10 2 .85 2 .07 1 .21 .16 1 .05 .86 .78 III ................................. 4 .0 3 .57 1 .37 .94 1 .26 .40 1 .37 1 .27 − .03 1 .30 .09 − .97 IV p ............................... 3 .1 3 .22 .56 1 .16 1 .50 1 .48 1 .06 1 .05 − .10 1 .15 .01 .42
See next page for continuation of table.
215
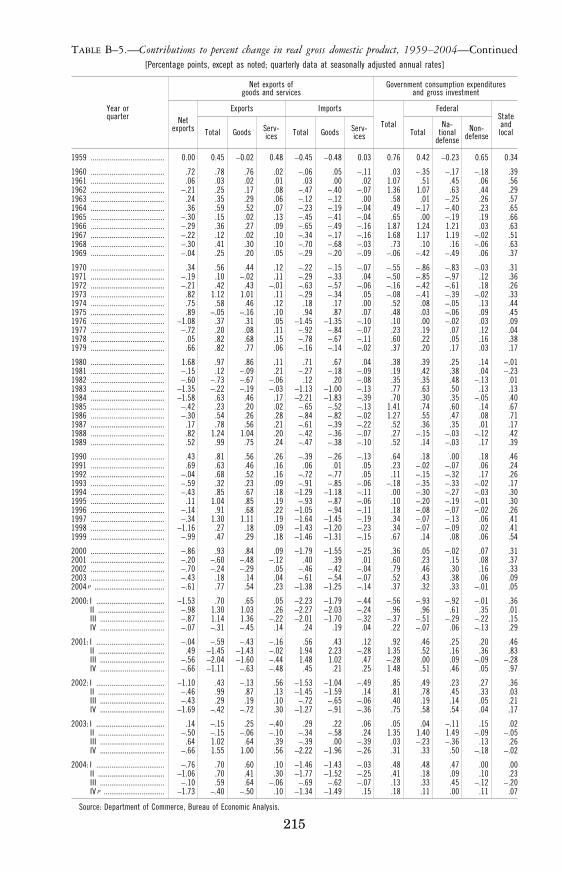
TABLE B–5.—Contributions to percent change in real gross domestic product, 1959–2004—Continued [Percentage points, except as noted; quarterly data at seasonally adjusted annual rates]
Year or quarter
Net exports of goods and services
Government consumption expenditures and gross investment
Net exports
Exports Imports
Total
Federal State and local Total Goods Serv-
ices Total Goods Serv-ices Total
Na-tional
defense Non-
defense
1959 ....................................... 0 .00 0 .45 −0 .02 0 .48 −0 .45 −0 .48 0 .03 0 .76 0 .42 −0 .23 0 .65 0 .34
1960 ....................................... .72 .78 .76 .02 − .06 .05 − .11 .03 − .35 − .17 − .18 .39 1961 ....................................... .06 .03 .02 .01 .03 .00 .02 1 .07 .51 .45 .06 .56 1962 ....................................... − .21 .25 .17 .08 − .47 − .40 − .07 1 .36 1 .07 .63 .44 .29 1963 ....................................... .24 .35 .29 .06 − .12 − .12 .00 .58 .01 − .25 .26 .57 1964 ....................................... .36 .59 .52 .07 − .23 − .19 − .04 .49 − .17 − .40 .23 .65 1965 ....................................... − .30 .15 .02 .13 − .45 − .41 − .04 .65 .00 − .19 .19 .66 1966 ....................................... − .29 .36 .27 .09 − .65 − .49 − .16 1 .87 1 .24 1 .21 .03 .63 1967 ....................................... − .22 .12 .02 .10 − .34 − .17 − .16 1 .68 1 .17 1 .19 − .02 .51 1968 ....................................... − .30 .41 .30 .10 − .70 − .68 − .03 .73 .10 .16 − .06 .63 1969 ....................................... − .04 .25 .20 .05 − .29 − .20 − .09 − .06 − .42 − .49 .06 .37
1970 ....................................... .34 .56 .44 .12 − .22 − .15 − .07 − .55 − .86 − .83 − .03 .31 1971 ....................................... − .19 .10 − .02 .11 − .29 − .33 .04 − .50 − .85 − .97 .12 .36 1972 ....................................... − .21 .42 .43 − .01 − .63 − .57 − .06 − .16 − .42 − .61 .18 .26 1973 ....................................... .82 1 .12 1 .01 .11 − .29 − .34 .05 − .08 − .41 − .39 − .02 .33 1974 ....................................... .75 .58 .46 .12 .18 .17 .00 .52 .08 − .05 .13 .44 1975 ....................................... .89 − .05 − .16 .10 .94 .87 .07 .48 .03 − .06 .09 .45 1976 ....................................... −1 .08 .37 .31 .05 −1 .45 −1 .35 − .10 .10 .00 − .02 .03 .09 1977 ....................................... − .72 .20 .08 .11 − .92 − .84 − .07 .23 .19 .07 .12 .04 1978 ....................................... .05 .82 .68 .15 − .78 − .67 − .11 .60 .22 .05 .16 .38 1979 ....................................... .66 .82 .77 .06 − .16 − .14 − .02 .37 .20 .17 .03 .17
1980 ....................................... 1 .68 .97 .86 .11 .71 .67 .04 .38 .39 .25 .14 − .01 1981 ....................................... − .15 .12 − .09 .21 − .27 − .18 − .09 .19 .42 .38 .04 − .23 1982 ....................................... − .60 − .73 − .67 − .06 .12 .20 − .08 .35 .35 .48 − .13 .01 1983 ....................................... −1 .35 − .22 − .19 − .03 −1 .13 −1 .00 − .13 .77 .63 .50 .13 .13 1984 ....................................... −1 .58 .63 .46 .17 −2 .21 −1 .83 − .39 .70 .30 .35 − .05 .40 1985 ....................................... − .42 .23 .20 .02 − .65 − .52 − .13 1 .41 .74 .60 .14 .67 1986 ....................................... − .30 .54 .26 .28 − .84 − .82 − .02 1 .27 .55 .47 .08 .71 1987 ....................................... .17 .78 .56 .21 − .61 − .39 − .22 .52 .36 .35 .01 .17 1988 ....................................... .82 1 .24 1 .04 .20 − .42 − .36 − .07 .27 − .15 − .03 − .12 .42 1989 ....................................... .52 .99 .75 .24 − .47 − .38 − .10 .52 .14 − .03 .17 .39
1990 ....................................... .43 .81 .56 .26 − .39 − .26 − .13 .64 .18 .00 .18 .46 1991 ....................................... .69 .63 .46 .16 .06 .01 .05 .23 − .02 − .07 .06 .24 1992 ....................................... − .04 .68 .52 .16 − .72 − .77 .05 .11 − .15 − .32 .17 .26 1993 ....................................... − .59 .32 .23 .09 − .91 − .85 − .06 − .18 − .35 − .33 − .02 .17 1994 ....................................... − .43 .85 .67 .18 −1 .29 −1 .18 − .11 .00 − .30 − .27 − .03 .30 1995 ....................................... .11 1 .04 .85 .19 − .93 − .87 − .06 .10 − .20 − .19 − .01 .30 1996 ....................................... − .14 .91 .68 .22 −1 .05 − .94 − .11 .18 − .08 − .07 − .02 .26 1997 ....................................... − .34 1 .30 1 .11 .19 −1 .64 −1 .45 − .19 .34 − .07 − .13 .06 .41 1998 ....................................... −1 .16 .27 .18 .09 −1 .43 −1 .20 − .23 .34 − .07 − .09 .02 .41 1999 ....................................... − .99 .47 .29 .18 −1 .46 −1 .31 − .15 .67 .14 .08 .06 .54
2000 ....................................... − .86 .93 .84 .09 −1 .79 −1 .55 − .25 .36 .05 − .02 .07 .31 2001 ....................................... − .20 − .60 − .48 − .12 .40 .39 .01 .60 .23 .15 .08 .37 2002 ....................................... − .70 − .24 − .29 .05 − .46 − .42 − .04 .79 .46 .30 .16 .33 2003 ....................................... − .43 .18 .14 .04 − .61 − .54 − .07 .52 .43 .38 .06 .09 2004 p ..................................... − .61 .77 .54 .23 −1 .38 −1 .25 − .14 .37 .32 .33 − .01 .05
2000: I .................................... −1 .53 .70 .65 .05 −2 .23 −1 .79 − .44 − .56 − .93 − .92 − .01 .36 II ................................... − .98 1 .30 1 .03 .26 −2 .27 −2 .03 − .24 .96 .96 .61 .35 .01 III .................................. − .87 1 .14 1 .36 − .22 −2 .01 −1 .70 − .32 − .37 − .51 − .29 − .22 .15 IV .................................. − .07 − .31 − .45 .14 .24 .19 .04 .22 − .07 .06 − .13 .29
2001: I .................................... − .04 − .59 − .43 − .16 .56 .43 .12 .92 .46 .25 .20 .46 II ................................... .49 −1 .45 −1 .43 − .02 1 .94 2 .23 − .28 1 .35 .52 .16 .36 .83 III .................................. − .56 −2 .04 −1 .60 − .44 1 .48 1 .02 .47 − .28 .00 .09 − .09 − .28 IV .................................. − .66 −1 .11 − .63 − .48 .45 .21 .25 1 .48 .51 .46 .05 .97
2002: I .................................... −1 .10 .43 − .13 .56 −1 .53 −1 .04 − .49 .85 .49 .23 .27 .36 II ................................... − .46 .99 .87 .13 −1 .45 −1 .59 .14 .81 .78 .45 .33 .03 III .................................. − .43 .29 .19 .10 − .72 − .65 − .06 .40 .19 .14 .05 .21 IV .................................. −1 .69 − .42 − .72 .30 −1 .27 − .91 − .36 .75 .58 .54 .04 .17
2003: I .................................... .14 − .15 .25 − .40 .29 .22 .06 .05 .04 − .11 .15 .02 II ................................... − .50 − .15 − .06 − .10 − .34 − .58 .24 1 .35 1 .40 1 .49 − .09 − .05 III .................................. .64 1 .02 .64 .39 − .39 .00 − .39 .03 − .23 − .36 .13 .26 IV .................................. − .66 1 .55 1 .00 .56 −2 .22 −1 .96 − .26 .31 .33 .50 − .18 − .02
2004: I .................................... − .76 .70 .60 .10 −1 .46 −1 .43 − .03 .48 .48 .47 .00 .00 II ................................... −1 .06 .70 .41 .30 −1 .77 −1 .52 − .25 .41 .18 .09 .10 .23 III .................................. − .10 .59 .64 − .06 − .69 − .62 − .07 .13 .33 .45 − .12 − .20 IV p ................................ −1 .73 − .40 − .50 .10 −1 .34 −1 .49 .15 .18 .11 .00 .11 .07
Source: Department of Commerce, Bureau of Economic Analysis.
216
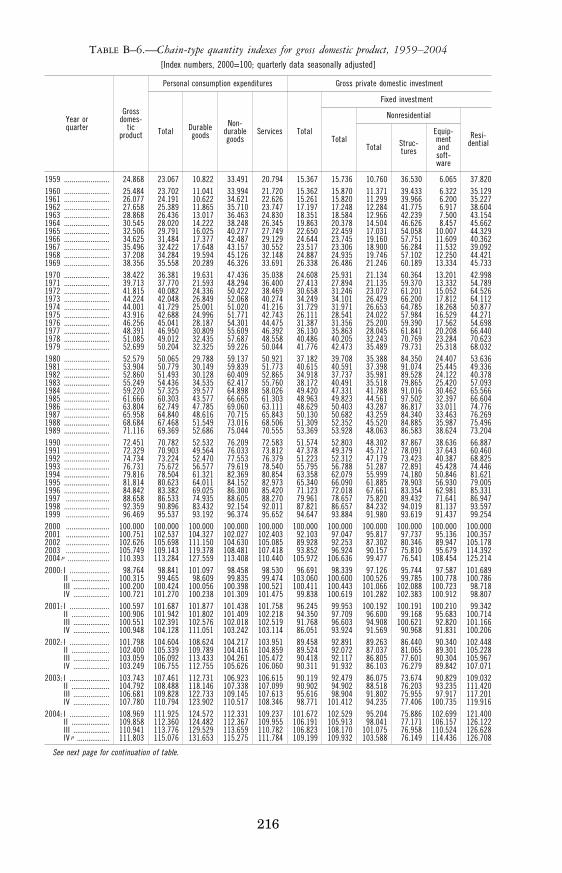
TABLE B–6.—Chain-type quantity indexes for gross domestic product, 1959–2004 [Index numbers, 2000=100; quarterly data seasonally adjusted]
Year or quarter
Gross domes-
tic product
Personal consumption expenditures Gross private domestic investment
Total Durable goods
Non- durable goods
Services Total
Fixed investment
Total
Nonresidential
Resi- dential Total Struc-
tures
Equip- ment and soft- ware
1959 ........................ 24.868 23.067 10.822 33.491 20.794 15.367 15.736 10.760 36.530 6.065 37.820 1960 ........................ 25.484 23.702 11.041 33.994 21.720 15.362 15.870 11.371 39.433 6.322 35.129 1961 ........................ 26.077 24.191 10.622 34.621 22.626 15.261 15.820 11.299 39.966 6.200 35.227 1962 ........................ 27.658 25.389 11.865 35.710 23.747 17.197 17.248 12.284 41.775 6.917 38.604 1963 ........................ 28.868 26.436 13.017 36.463 24.830 18.351 18.584 12.966 42.239 7.500 43.154 1964 ........................ 30.545 28.020 14.222 38.248 26.345 19.863 20.378 14.504 46.626 8.457 45.662 1965 ........................ 32.506 29.791 16.025 40.277 27.749 22.650 22.459 17.031 54.058 10.007 44.329 1966 ........................ 34.625 31,484 17.377 42.487 29.129 24.644 23.745 19.160 57.751 11.609 40.362 1967 ........................ 35.496 32.422 17.648 43.157 30.552 23.517 23.306 18.900 56.284 11.532 39.092 1968 ........................ 37.208 34.284 19.594 45.126 32.148 24.887 24.935 19.746 57.102 12.250 44.421 1969 ........................ 38.356 35.558 20.289 46.326 33.691 26.338 26.486 21.246 60.189 13.334 45.733 1970 ........................ 38.422 36.381 19.631 47.436 35.038 24.608 25.931 21.134 60.364 13.201 42.998 1971 ........................ 39.713 37.770 21.593 48.294 36.400 27.413 27.894 21.135 59.370 13.332 54.789 1972 ........................ 41.815 40.082 24.336 50.422 38.469 30.658 31.246 23.072 61.201 15.052 64.526 1973 ........................ 44.224 42.048 26.849 52.068 40.274 34.249 34.101 26.429 66.200 17.812 64.112 1974 ........................ 44.001 41.729 25.001 51.020 41.216 31.729 31.971 26.653 64.785 18.268 50.877 1975 ........................ 43.916 42.688 24.996 51.771 42.743 26.111 28.541 24.022 57.984 16.529 44.271 1976 ........................ 46.256 45.041 28.187 54.301 44.475 31.387 31.356 25.200 59.390 17.562 54.698 1977 ........................ 48.391 46.950 30.809 55.609 46.392 36.130 35.863 28.045 61.841 20.208 66.440 1978 ........................ 51.085 49.012 32.435 57.687 48.558 40.486 40.205 32.243 70.769 23.284 70.623 1979 ........................ 52.699 50.204 32.325 59.226 50.044 41.776 42.473 35.489 79.731 25.318 68.032 1980 ........................ 52.579 50.065 29.788 59.137 50.921 37.182 39.708 35.388 84.350 24.407 53.636 1981 ........................ 53.904 50.779 30.149 59.839 51.773 40.615 40.591 37.398 91.074 25.445 49.336 1982 ........................ 52.860 51.493 30.128 60.409 52.865 34.918 37.737 35.981 89.528 24.122 40.378 1983 ........................ 55.249 54.436 34.535 62.417 55.760 38.172 40.491 35.518 79.865 25.420 57.093 1984 ........................ 59.220 57.325 39.577 64.898 58.026 49.420 47.331 41.788 91.016 30.462 65.566 1985 ........................ 61.666 60.303 43.577 66.665 61.303 48.963 49.823 44.561 97.502 32.397 66.604 1986 ........................ 63.804 62.749 47.785 69.060 63.111 48.629 50.403 43.287 86.817 33.011 74.776 1987 ........................ 65.958 64.840 48.616 70.715 65.843 50.130 50.682 43.259 84.340 33.463 76.269 1988 ........................ 68.684 67.468 51.549 73.016 68.506 51.309 52.352 45.520 84.885 35.987 75.496 1989 ........................ 71.116 69.369 52.686 75.044 70.555 53.369 53.928 48.063 86.583 38.624 73.204 1990 ........................ 72.451 70.782 52.532 76.209 72.583 51.574 52.803 48.302 87.867 38.636 66.887 1991 ........................ 72.329 70.903 49.564 76.033 73.812 47.378 49.379 45.712 78.091 37.643 60.460 1992 ........................ 74.734 73.224 52.470 77.553 76.379 51.223 52.312 47.179 73.423 40.387 68.825 1993 ........................ 76.731 75.672 56.577 79.619 78.540 55.795 56.788 51.287 72.891 45.428 74.446 1994 ........................ 79.816 78.504 61.321 82.369 80.854 63.358 62.079 55.999 74.180 50.846 81.621 1995 ........................ 81.814 80.623 64.011 84.152 82.973 65.340 66.090 61.885 78.903 56.930 79.005 1996 ........................ 84.842 83.382 69.025 86.300 85.420 71.123 72.018 67.661 83.354 62.981 85.331 1997 ....................... 88.658 86.533 74.935 88.605 88.270 79.961 78.657 75.820 89.432 71.641 86.947 1998 ........................ 92.359 90.896 83.432 92.154 92.011 87.821 86.657 84.232 94.019 81.137 93.597 1999 ....................... 96.469 95.537 93.192 96.374 95.652 94.647 93.884 91.980 93.619 91.437 99.254 2000 ....................... 100.000 100.000 100.000 100.000 100.000 100.000 100.000 100.000 100.000 100.000 100.000 2001 ....................... 100.751 102.537 104.327 102.027 102.403 92.103 97.047 95.817 97.737 95.136 100.357 2002 ....................... 102.626 105.698 111.150 104.630 105.085 89.928 92.253 87.302 80.346 89.947 105.178 2003 ....................... 105.749 109.143 119.378 108.481 107.418 93.852 96.924 90.157 75.810 95.679 114.392 2004 p ...................... 110.393 113.284 127.559 113.408 110.440 105.972 106.636 99.477 76.541 108.454 125.214 2000: I ..................... 98.764 98.841 101.097 98.458 98.530 96.691 98.339 97.126 95.744 97.587 101.689
II .................... 100.315 99.465 98.609 99.835 99.474 103.060 100.600 100.526 99.785 100.778 100.786 III ................... 100.200 100.424 100.056 100.398 100.521 100.411 100.443 101.066 102.088 100.723 98.718 IV ................... 100.721 101.270 100.238 101.309 101.475 99.838 100.619 101.282 102.383 100.912 98.807
2001: I ..................... 100.597 101.687 101.877 101.438 101.758 96.245 99.953 100.192 100.191 100.210 99.342 II .................... 100.906 101.942 101.802 101.409 102.218 94.350 97.709 96.600 99.168 95.683 100.714 III ................... 100.551 102.391 102.576 102.018 102.519 91.768 96.603 94.908 100.621 92.820 101.166 IV ................... 100.948 104.128 111.051 103.242 103.114 86.051 93.924 91.569 90.968 91.831 100.206
2002: I ..................... 101.798 104.604 108.624 104.217 103.951 89.458 92.891 89.263 86.440 90.340 102.448 II .................... 102.400 105.339 109.789 104.416 104.859 89.524 92.072 87.037 81.065 89.301 105.228 III ................... 103.059 106.092 113.433 104.261 105.472 90.418 92.117 86.805 77.601 90.304 105.967 IV ................... 103.249 106.755 112.755 105.626 106.060 90.311 91.932 86.103 76.279 89.842 107.071
2003: I ..................... 103.743 107.461 112.731 106.923 106.615 90.119 92.479 86.075 73.674 90.829 109.032 II .................... 104.792 108.488 118.146 107.338 107.099 90.902 94.902 88.518 76.203 93.235 111.420 III ................... 106.681 109.828 122.733 109.145 107.613 95.616 98.904 91.802 75.955 97.917 117.201 IV ................... 107.780 110.794 123.902 110.517 108.346 98.771 101.412 94.235 77.406 100.735 119.916
2004: I ..................... 108.969 111.925 124.572 112.331 109.237 101.672 102.529 95.204 75.886 102.699 121.400 II .................... 109.858 112.360 124.482 112.367 109.955 106.191 105.913 98.041 77.171 106.157 126.122 III ................... 110.941 113.776 129.529 113.659 110.782 106.823 108.170 101.075 76.958 110.524 126.628 IV p ................. 111.803 115.076 131.653 115.275 111.784 109.199 109.932 103.588 76.149 114.436 126.708
See next page for continuation of table.
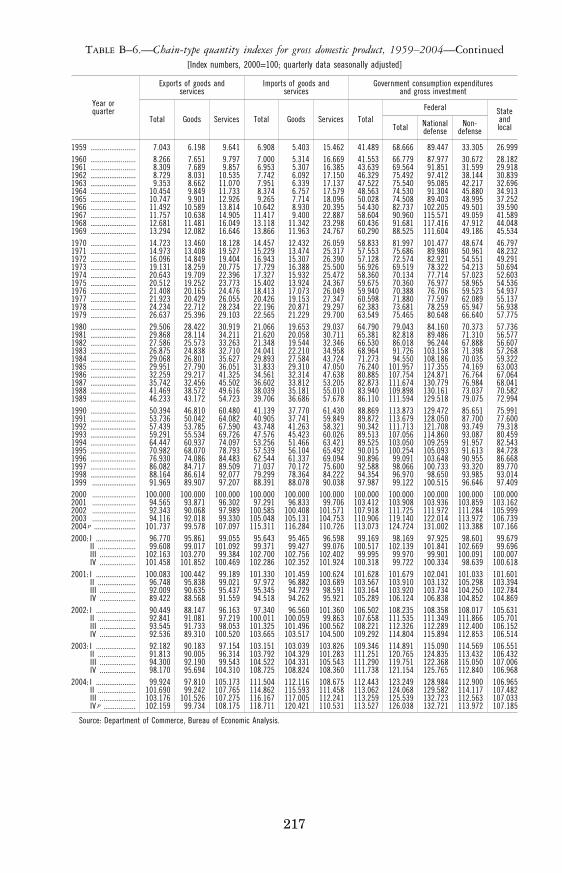
217
TABLE B–6.—Chain-type quantity indexes for gross domestic product, 1959–2004—Continued [Index numbers, 2000=100; quarterly data seasonally adjusted]
Year or quarter
Exports of goods and services
Imports of goods and services
Government consumption expenditures and gross investment
Total Goods Services Total Goods Services Total Federal State
and local Total National
defense Non-
defense
1959 ........................ 7.043 6.198 9.641 6.908 5.403 15.462 41.489 68.666 89.447 33.305 26.999 1960 ........................ 8.266 7.651 9.797 7.000 5.314 16.669 41.553 66.779 87.977 30.672 28.182 1961 ........................ 8.309 7.689 9.857 6.953 5.307 16.385 43.639 69.564 91.851 31.599 29.918 1962 ........................ 8.729 8.031 10.535 7.742 6.092 17.150 46.329 75.492 97.412 38.144 30.839 1963 ........................ 9.353 8.662 11.070 7.951 6.339 17.137 47.522 75.540 95.085 42.217 32.696 1964 ........................ 10.454 9.849 11.733 8.374 6.757 17.579 48.563 74.530 91.304 45.880 34.913 1965 ........................ 10.747 9.901 12.926 9.265 7.714 18.096 50.028 74.508 89.403 48.995 37.252 1966 ........................ 11.492 10.589 13.814 10.642 8.930 20.395 54.430 82.737 102.205 49.501 39.590 1967 ........................ 11.757 10.638 14.905 11.417 9.400 22.887 58.604 90.960 115.571 49.059 41.589 1968 ........................ 12.681 11.481 16.049 13.118 11.342 23.298 60.436 91.681 117.416 47.912 44.048 1969 ........................ 13.294 12.082 16.646 13.866 11.963 24.767 60.290 88.525 111.604 49.186 45.534 1970 ........................ 14.723 13.460 18.128 14.457 12.432 26.059 58.833 81.997 101.477 48.674 46.797 1971 ........................ 14.973 13.408 19.527 15.229 13.474 25.317 57.553 75.686 89.980 50.961 48.232 1972 ........................ 16.096 14.849 19.404 16.943 15.307 26.390 57.128 72.574 82.921 54.551 49.291 1973 ........................ 19.131 18.259 20.775 17.729 16.388 25.500 56.926 69.519 78.322 54.213 50.694 1974 ........................ 20.643 19.709 22.396 17.327 15.932 25.472 58.360 70.134 77.714 57.023 52.603 1975 ........................ 20.512 19.252 23.773 15.402 13.924 24.367 59.675 70.360 76.977 58.965 54.536 1976 ........................ 21.408 20.165 24.476 18.413 17.073 26.049 59.940 70.388 76.706 59.523 54.937 1977 ........................ 21.923 20.429 26.055 20.426 19.153 27.347 60.598 71.880 77.597 62.089 55.137 1978 ........................ 24.234 22.712 28.234 22.196 20.871 29.297 62.383 73.681 78.259 65.947 56.938 1979 ........................ 26.637 25.396 29.103 22.565 21.229 29.700 63.549 75.465 80.648 66.640 57.775 1980 ........................ 29.506 28.422 30.919 21.066 19.653 29.037 64.790 79.043 84.160 70.373 57.736 1981 ........................ 29.868 28.114 34.211 21.620 20.058 30.711 65.381 82.818 89.486 71.310 56.577 1982 ........................ 27.586 25.573 33.263 21.348 19.544 32.346 66.530 86.018 96.244 67.888 56.607 1983 ........................ 26.875 24.838 32.710 24.041 22.210 34.958 68.964 91.726 103.158 71.398 57.268 1984 ........................ 29.068 26.801 35.627 29.893 27.584 43.724 71.273 94.550 108.186 70.035 59.322 1985 ........................ 29.951 27.790 36.051 31.833 29.310 47.050 76.240 101.957 117.355 74.169 63.003 1986 ........................ 32.259 29.217 41.325 34.561 32.314 47.638 80.885 107.754 124.871 76.764 67.064 1987 ........................ 35.742 32.456 45.502 36.602 33.812 53.205 82.873 111.674 130.779 76.984 68.041 1988 ........................ 41.469 38.572 49.616 38.039 35.181 55.010 83.940 109.898 130.161 73.037 70.582 1989 ........................ 46.233 43.172 54.723 39.706 36.686 57.678 86.110 111.594 129.518 79.075 72.994 1990 ........................ 50.394 46.810 60.480 41.139 37.770 61.430 88.869 113.873 129.472 85.651 75.991 1991 ........................ 53.736 50.042 64.082 40.905 37.741 59.849 89.872 113.679 128.050 87.700 77.600 1992 ........................ 57.439 53.785 67.590 43.748 41.263 58.321 90.342 111.713 121.708 93.749 79.318 1993 ........................ 59.291 55.534 69.726 47.576 45.423 60.026 89.513 107.056 114.860 93.087 80.459 1994 ........................ 64.447 60.937 74.097 53.256 51.466 63.421 89.525 103.050 109.259 91.957 82.543 1995 ........................ 70.982 68.070 78.793 57.539 56.104 65.492 90.015 100.254 105.093 91.613 84.728 1996 ........................ 76.930 74.086 84.483 62.544 61.337 69.094 90.896 99.091 103.648 90.955 86.668 1997 ........................ 86.082 84.717 89.509 71.037 70.172 75.600 92.588 98.066 100.733 93.320 89.770 1998 ........................ 88.164 86.614 92.077 79.299 78.364 84.222 94.354 96.970 98.650 93.985 93.014 1999 ....................... 91.969 89.907 97.207 88.391 88.078 90.038 97.987 99.122 100.515 96.646 97.409 2000 ....................... 100.000 100.000 100.000 100.000 100.000 100.000 100.000 100.000 100.000 100.000 100.000 2001 ....................... 94.565 93.871 96.302 97.291 96.833 99.706 103.412 103.908 103.936 103.859 103.162 2002 ....................... 92.343 90.068 97.989 100.585 100.408 101.571 107.918 111.725 111.972 111.284 105.999 2003 ....................... 94.116 92.018 99.330 105.048 105.131 104.753 110.906 119.140 122.014 113.972 106.739 2004 p ...................... 101.737 99.578 107.097 115.311 116.284 110.726 113.073 124.724 131.002 113.388 107.166 2000: I ..................... 96.770 95.861 99.055 95.643 95.465 96.598 99.169 98.169 97.925 98.601 99.679
II .................... 99.608 99.017 101.092 99.371 99.427 99.076 100.517 102.139 101.841 102.669 99.696 III ................... 102.163 103.270 99.384 102.700 102.756 102.402 99.995 99.970 99.901 100.091 100.007 IV ................... 101.458 101.852 100.469 102.286 102.352 101.924 100.318 99.722 100.334 98.639 100.618
2001: I ..................... 100.083 100.442 99.189 101.330 101.459 100.624 101.628 101.679 102.041 101.033 101.601 II .................... 96.748 95.838 99.021 97.972 96.882 103.689 103.567 103.910 103.132 105.298 103.394 III ................... 92.009 90.635 95.437 95.345 94.729 98.591 103.164 103.920 103.734 104.250 102.784 IV ................... 89.422 88.568 91.559 94.518 94.262 95.921 105.289 106.124 106.838 104.852 104.869
2002: I ..................... 90.449 88.147 96.163 97.340 96.560 101.360 106.502 108.235 108.358 108.017 105.631 II .................... 92.841 91.081 97.219 100.011 100.059 99.863 107.658 111.535 111.349 111.866 105.701 III ................... 93.545 91.733 98.053 101.325 101.496 100.562 108.221 112.326 112.289 112.400 106.152 IV ................... 92.536 89.310 100.520 103.665 103.517 104.500 109.292 114.804 115.894 112.853 106.514
2003: I ..................... 92.182 90.183 97.154 103.151 103.039 103.826 109.346 114.891 115.090 114.569 106.551 II .................... 91.813 90.005 96.314 103.792 104.329 101.283 111.251 120.765 124.835 113.432 106.432 III ................... 94.300 92.190 99.543 104.522 104.331 105.543 111.290 119.751 122.368 115.050 107.006 IV ................... 98.170 95.694 104.310 108.725 108.824 108.360 111.738 121.154 125.765 112.840 106.968
2004: I ..................... 99.924 97.810 105.173 111.504 112.116 108.675 112.443 123.249 128.984 112.900 106.965 II .................... 101.690 99.242 107.765 114.862 115.593 111.458 113.062 124.068 129.582 114.117 107.482 III ................... 103.176 101.526 107.275 116.167 117.005 112.241 113.259 125.539 132.723 112.563 107.033 IV p ................. 102.159 99.734 108.175 118.711 120.421 110.531 113.527 126.038 132.721 113.972 107.185
Source: Department of Commerce, Bureau of Economic Analysis.
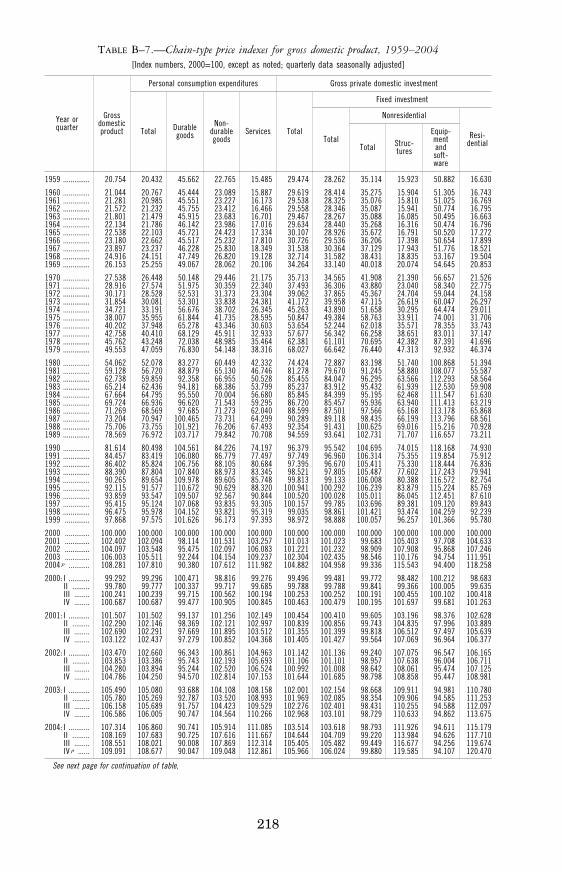
218
TABLE B–7.—Chain-type price indexes for gross domestic product, 1959–2004 [Index numbers, 2000=100, except as noted; quarterly data seasonally adjusted]
Year or quarter
Gross domestic product
Personal consumption expenditures Gross private domestic investment
Total Durable goods
Non- durable goods
Services Total
Fixed investment
Total
Nonresidential
Resi- dential Total Struc-
tures
Equip- ment and soft- ware
1959 .............. 20.754 20.432 45.662 22.765 15.485 29.474 28.262 35.114 15.923 50.882 16.630
1960 .............. 21.044 20.767 45.444 23.089 15.887 29.619 28.414 35.275 15.904 51.305 16.743 1961 .............. 21.281 20.985 45.551 23.227 16.173 29.538 28.325 35.076 15.810 51.025 16.769 1962 .............. 21.572 21.232 45.755 23.412 16.466 29.558 28.346 35.087 15.941 50.774 16.795 1963 .............. 21.801 21.479 45.915 23.683 16.701 29.467 28.267 35.088 16.085 50.495 16.663 1964 .............. 22.134 21.786 46.142 23.986 17.016 29.634 28.440 35.268 16.316 50.474 16.796 1965 .............. 22.538 22.103 45.721 24.423 17.334 30.107 28.926 35.672 16.791 50.520 17.272 1966 .............. 23.180 22.662 45.517 25.232 17.810 30.726 29.536 36.206 17.398 50.654 17.899 1967 .............. 23.897 23.237 46.228 25.830 18.349 31.538 30.364 37.129 17.943 51.776 18.521 1968 .............. 24.916 24.151 47.749 26.820 19.128 32.714 31.582 38.431 18.835 53.167 19.504 1969 .............. 26.153 25.255 49.067 28.062 20.106 34.264 33.140 40.018 20.074 54.645 20.853
1970 .............. 27.538 26.448 50.148 29.446 21.175 35.713 34.565 41.908 21.390 56.657 21.526 1971 .............. 28.916 27.574 51.975 30.359 22.340 37.493 36.306 43.880 23.040 58.340 22.775 1972 .............. 30.171 28.528 52.531 31.373 23.304 39.062 37.865 45.367 24.704 59.044 24.158 1973 .............. 31.854 30.081 53.301 33.838 24.381 41.172 39.958 47.115 26.619 60.047 26.297 1974 .............. 34.721 33.191 56.676 38.702 26.345 45.263 43.890 51.658 30.295 64.474 29.011 1975 .............. 38.007 35.955 61.844 41.735 28.595 50.847 49.384 58.763 33.911 74.001 31.706 1976 .............. 40.202 37.948 65.278 43.346 30.603 53.654 52.244 62.018 35.571 78.355 33.743 1977 .............. 42.758 40.410 68.129 45.911 32.933 57.677 56.342 66.258 38.651 83.011 37.147 1978 .............. 45.762 43.248 72.038 48.985 35.464 62.381 61.101 70.695 42.382 87.391 41.696 1979 .............. 49.553 47.059 76.830 54.148 38.316 68.027 66.642 76.440 47.313 92.932 46.374
1980 .............. 54.062 52.078 83.277 60.449 42.332 74.424 72.887 83.198 51.740 100.868 51.394 1981 .............. 59.128 56.720 88.879 65.130 46.746 81.278 79.670 91.245 58.880 108.077 55.587 1982 .............. 62.738 59.859 92.358 66.955 50.528 85.455 84.047 96.295 63.566 112.293 58.564 1983 .............. 65.214 62.436 94.181 68.386 53.799 85.237 83.912 95.432 61.939 112.530 59.908 1984 .............. 67.664 64.795 95.550 70.004 56.680 85.845 84.399 95.195 62.468 111.547 61.630 1985 .............. 69.724 66.936 96.620 71.543 59.295 86.720 85.457 95.936 63.940 111.413 63.219 1986 .............. 71.269 68.569 97.685 71.273 62.040 88.599 87.501 97.566 65.168 113.178 65.868 1987 .............. 73.204 70.947 100.465 73.731 64.299 90.289 89.118 98.435 66.199 113.796 68.561 1988 .............. 75.706 73.755 101.921 76.206 67.493 92.354 91.431 100.625 69.016 115.216 70.928 1989 .............. 78.569 76.972 103.717 79.842 70.708 94.559 93.641 102.731 71.707 116.657 73.211
1990 .............. 81.614 80.498 104.561 84.226 74.197 96.379 95.542 104.695 74.015 118.168 74.930 1991 .............. 84.457 83.419 106.080 86.779 77.497 97.749 96.960 106.314 75.355 119.854 75.912 1992 .............. 86.402 85.824 106.756 88.105 80.684 97.395 96.670 105.411 75.330 118.444 76.836 1993 .............. 88.390 87.804 107.840 88.973 83.345 98.521 97.805 105.487 77.602 117.243 79.941 1994 .............. 90.265 89.654 109.978 89.605 85.748 99.813 99.133 106.008 80.388 116.572 82.754 1995 .............. 92.115 91.577 110.672 90.629 88.320 100.941 100.292 106.239 83.879 115.224 85.769 1996 .............. 93.859 93.547 109.507 92.567 90.844 100.520 100.028 105.011 86.045 112.451 87.610 1997 .............. 95.415 95.124 107.068 93.835 93.305 100.157 99.785 103.696 89.381 109.120 89.843 1998 .............. 96.475 95.978 104.152 93.821 95.319 99.035 98.861 101.421 93.474 104.259 92.239 1999 ............. 97.868 97.575 101.626 96.173 97.393 98.972 98.888 100.057 96.257 101.366 95.780
2000 ............. 100.000 100.000 100.000 100.000 100.000 100.000 100.000 100.000 100.000 100.000 100.000 2001 ............. 102.402 102.094 98.114 101.531 103.257 101.013 101.023 99.683 105.403 97.708 104.633 2002 ............. 104.097 103.548 95.475 102.097 106.083 101.221 101.232 98.909 107.908 95.868 107.246 2003 ............. 106.003 105.511 92.244 104.154 109.237 102.304 102.435 98.546 110.176 94.754 111.951 2004 p ........... 108.281 107.810 90.380 107.612 111.982 104.882 104.958 99.336 115.543 94.400 118.258
2000: I ........... 99.292 99.296 100.471 98.816 99.276 99.496 99.481 99.772 98.482 100.212 98.683 II ......... 99.780 99.777 100.337 99.717 99.685 99.788 99.788 99.841 99.366 100.005 99.635 III ........ 100.241 100.239 99.715 100.562 100.194 100.253 100.252 100.191 100.455 100.102 100.418 IV ........ 100.687 100.687 99.477 100.905 100.845 100.463 100.479 100.195 101.697 99.681 101.263
2001: I ........... 101.507 101.502 99.137 101.256 102.149 100.454 100.410 99.605 103.196 98.376 102.628 II ......... 102.290 102.146 98.369 102.121 102.997 100.839 100.856 99.743 104.835 97.996 103.889 III ........ 102.690 102.291 97.669 101.895 103.512 101.355 101.399 99.818 106.512 97.497 105.639 IV ........ 103.122 102.437 97.279 100.852 104.368 101.405 101.427 99.564 107.069 96.964 106.377
2002: I ........... 103.470 102.660 96.343 100.861 104.963 101.142 101.136 99.240 107.075 96.547 106.165 II ......... 103.853 103.386 95.743 102.193 105.693 101.106 101.101 98.957 107.638 96.004 106.711 III ........ 104.280 103.894 95.244 102.520 106.524 100.992 101.008 98.642 108.061 95.474 107.125 IV ........ 104.786 104.250 94.570 102.814 107.153 101.644 101.685 98.798 108.858 95.447 108.981
2003: I ........... 105.490 105.080 93.688 104.108 108.158 102.001 102.154 98.668 109.911 94.981 110.780 II ......... 105.780 105.269 92.787 103.520 108.993 101.969 102.085 98.354 109.906 94.585 111.253 III ........ 106.158 105.689 91.757 104.423 109.529 102.276 102.401 98.431 110.255 94.588 112.097 IV ........ 106.586 106.005 90.747 104.564 110.266 102.968 103.101 98.729 110.633 94.862 113.675
2004: I ........... 107.314 106.860 90.741 105.914 111.085 103.514 103.618 98.793 111.926 94.611 115.179 II ......... 108.169 107.683 90.725 107.616 111.667 104.644 104.709 99.220 113.984 94.626 117.710 III ........ 108.551 108.021 90.008 107.869 112.314 105.405 105.482 99.449 116.677 94.256 119.674 IV p ...... 109.091 108.677 90.047 109.048 112.861 105.966 106.024 99.880 119.585 94.107 120.470
See next page for continuation of table,
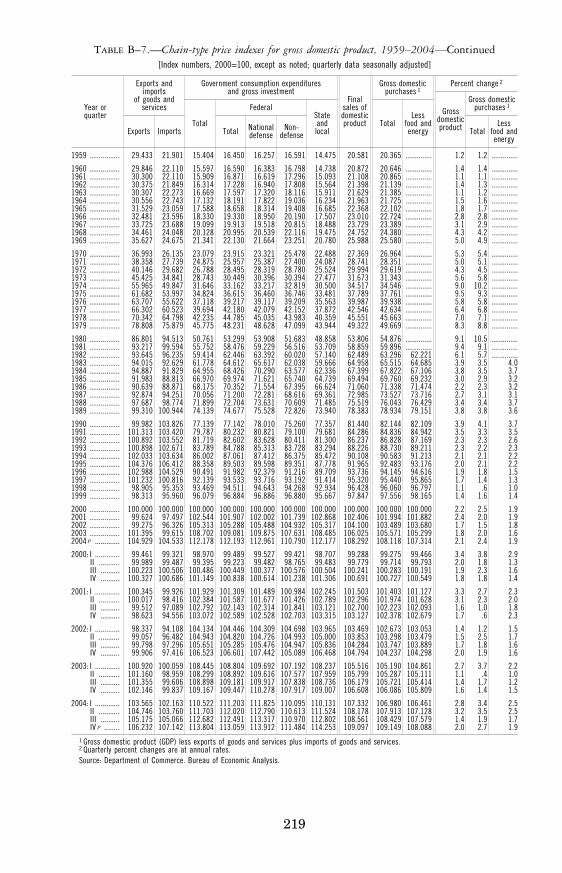
219
TABLE B–7.—Chain-type price indexes for gross domestic product, 1959–2004—Continued [Index numbers, 2000=100, except as noted; quarterly data seasonally adjusted]
Year or quarter
Exports and imports
of goods and services
Government consumption expenditures and gross investment
Final sales of domestic product
Gross domestic purchases 1
Percent change 2
Exports ImportsTotal
Federal State and local
Total Less
food and energy
Gross domestic product
Gross domestic purchases 1
Total National defense
Non- defense Total
Less food and energy
1959 ................ 29.433 21.901 15.404 16.450 16.257 16.591 14.475 20.581 20.365 .............. 1.2 1.2 ..............
1960 ................ 29.846 22.110 15.597 16.590 16.383 16.798 14.738 20.872 20.646 .............. 1.4 1.4 ..............1961 ................ 30.300 22.110 15.909 16.871 16.619 17.296 15.093 21.108 20.865 .............. 1.1 1.1 ..............1962 ................ 30.375 21.849 16.314 17.228 16.940 17.808 15.564 21.398 21.139 .............. 1.4 1.3 ..............1963 ................ 30.307 22.273 16.669 17.597 17.320 18.116 15.911 21.629 21.385 .............. 1.1 1.2 ..............1964 ................ 30.556 22.743 17.132 18.191 17.822 19.036 16.234 21.963 21.725 .............. 1.5 1.6 ..............1965 ................ 31.529 23.059 17.588 18.658 18.314 19.408 16.685 22.368 22.102 .............. 1.8 1.7 ..............1966 ................ 32.481 23.596 18.330 19.330 18.950 20.190 17.507 23.010 22.724 .............. 2.8 2.8 ..............1967 ................ 33.725 23.688 19.099 19.913 19.518 20.815 18.488 23.729 23.389 .............. 3.1 2.9 ..............1968 ................ 34.461 24.048 20.128 20.995 20.539 22.116 19.475 24.752 24.380 .............. 4.3 4.2 ..............1969 ................ 35.627 24.675 21.341 22.130 21.664 23.251 20.780 25.988 25.580 .............. 5.0 4.9 ..............
1970 ................ 36.993 26.135 23.079 23.915 23.321 25.478 22.488 27.369 26.964 .............. 5.3 5.4 ..............1971 ................ 38.358 27.739 24.875 25.957 25.387 27.400 24.087 28.741 28.351 .............. 5.0 5.1 ..............1972 ................ 40.146 29.682 26.788 28.495 28.319 28.780 25.524 29.994 29.619 .............. 4.3 4.5 ..............1973 ................ 45.425 34.841 28.743 30.449 30.396 30.394 27.477 31.673 31.343 .............. 5.6 5.8 ..............1974 ................ 55.965 49.847 31.646 33.162 33.217 32.819 30.500 34.517 34.546 .............. 9.0 10.2 ..............1975 ................ 61.682 53.997 34.824 36.615 36.460 36.746 33.481 37.789 37.761 .............. 9.5 9.3 ..............1976 ................ 63.707 55.622 37.118 39.217 39.117 39.209 35.563 39.987 39.938 .............. 5.8 5.8 ..............1977 ................ 66.302 60.523 39.694 42.180 42.079 42.152 37.872 42.546 42.634 .............. 6.4 6.8 ..............1978 ................ 70.342 64.798 42.235 44.785 45.035 43.983 40.359 45.551 45.663 .............. 7.0 7.1 ..............1979 ................ 78.808 75.879 45.775 48.231 48.628 47.099 43.944 49.322 49.669 .............. 8.3 8.8 ..............
1980 ................ 86.801 94.513 50.761 53.299 53.908 51.683 48.858 53.806 54.876 .............. 9.1 10.5 ..............1981 ................ 93.217 99.594 55.752 58.476 59.229 56.516 53.709 58.859 59.896 .............. 9.4 9.1 ..............1982 ................ 93.645 96.235 59.414 62.446 63.392 60.020 57.140 62.489 63.296 62.221 6.1 5.7 ..............1983 ................ 94.015 92.629 61.778 64.612 65.617 62.038 59.666 64.958 65.515 64.685 3.9 3.5 4.0 1984 ................ 94.887 91.829 64.955 68.426 70.290 63.577 62.336 67.399 67.822 67.106 3.8 3.5 3.7 1985 ................ 91.983 88.813 66.970 69.974 71.621 65.740 64.739 69.494 69.760 69.232 3.0 2.9 3.2 1986 ................ 90.639 88.871 68.175 70.352 71.554 67.395 66.624 71.060 71.338 71.474 2.2 2.3 3.2 1987 ................ 92.874 94.251 70.056 71.200 72.281 68.616 69.361 72.985 73.527 73.716 2.7 3.1 3.1 1988 ................ 97.687 98.774 71.899 72.704 73.631 70.609 71.485 75.519 76.043 76.429 3.4 3.4 3.7 1989 ................ 99.310 100.944 74.139 74.677 75.528 72.826 73.940 78.383 78.934 79.151 3.8 3.8 3.6
1990 ................ 99.982 103.826 77.139 77.142 78.010 75.260 77.357 81.440 82.144 82.109 3.9 4.1 3.7 1991 ................ 101.313 103.420 79.787 80.232 80.821 79.100 79.681 84.286 84.836 84.942 3.5 3.3 3.5 1992 ................ 100.892 103.552 81.719 82.602 83.628 80.411 81.300 86.237 86.828 87.169 2.3 2.3 2.6 1993 ................ 100.898 102.671 83.789 84.788 85.313 83.728 83.294 88.226 88.730 89.211 2.3 2.2 2.3 1994 ................ 102.033 103.634 86.002 87.061 87.412 86.375 85.472 90.108 90.583 91.213 2.1 2.1 2.2 1995 ................ 104.376 106.412 88.358 89.503 89.598 89.351 87.778 91.965 92.483 93.176 2.0 2.1 2.2 1996 ................ 102.988 104.529 90.491 91.982 92.379 91.216 89.709 93.736 94.145 94.616 1.9 1.8 1.5 1997 ................ 101.232 100.816 92.139 93.533 93.716 93.192 91.414 95.320 95.440 95.865 1.7 1.4 1.3 1998 ................ 98.905 95.353 93.469 94.511 94.643 94.268 92.934 96.428 96.060 96.797 1.1 .6 1.0 1999 ................ 98.313 95.960 96.079 96.884 96.886 96.880 95.667 97.847 97.556 98.165 1.4 1.6 1.4
2000 ................ 100.000 100.000 100.000 100.000 100.000 100.000 100.000 100.000 100.000 100.000 2.2 2.5 1.9 2001 ................ 99.624 97.497 102.544 101.907 102.002 101.739 102.868 102.406 101.994 101.882 2.4 2.0 1.9 2002 ................ 99.275 96.326 105.313 105.288 105.488 104.932 105.317 104.100 103.489 103.680 1.7 1.5 1.8 2003 ................ 101.395 99.615 108.702 109.081 109.875 107.631 108.485 106.025 105.571 105.299 1.8 2.0 1.6 2004 p ............. 104.929 104.533 112.178 112.193 112.961 110.790 112.177 108.292 108.118 107.314 2.1 2.4 1.9
2000: I ............. 99.461 99.321 98.970 99.489 99.527 99.421 98.707 99.288 99.275 99.466 3.4 3.8 2.9 II ........... 99.989 99.487 99.395 99.223 99.482 98.765 99.483 99.779 99.714 99.793 2.0 1.8 1.3 III .......... 100.223 100.506 100.486 100.449 100.377 100.576 100.504 100.241 100.283 100.191 1.9 2.3 1.6 IV .......... 100.327 100.686 101.149 100.838 100.614 101.238 101.306 100.691 100.727 100.549 1.8 1.8 1.4
2001: I ............. 100.345 99.926 101.929 101.309 101.489 100.984 102.245 101.503 101.403 101.127 3.3 2.7 2.3 II ........... 100.017 98.416 102.384 101.587 101.677 101.426 102.789 102.296 101.974 101.628 3.1 2.3 2.0 III .......... 99.512 97.089 102.792 102.143 102.314 101.841 103.121 102.700 102.223 102.093 1.6 1.0 1.8 IV .......... 98.623 94.556 103.072 102.589 102.528 102.703 103.315 103.127 102.378 102.679 1.7 .6 2.3
2002: I ............. 98.337 94.108 104.134 104.446 104.309 104.698 103.965 103.469 102.673 103.053 1.4 1.2 1.5 II ........... 99.057 96.482 104.943 104.820 104.726 104.993 105.000 103.853 103.298 103.479 1.5 2.5 1.7 III .......... 99.798 97.296 105.651 105.285 105.476 104.947 105.836 104.284 103.747 103.889 1.7 1.8 1.6 IV .......... 99.906 97.416 106.523 106.601 107.442 105.089 106.468 104.794 104.237 104.298 2.0 1.9 1.6
2003: I ............. 100.920 100.059 108.445 108.804 109.692 107.192 108.237 105.516 105.190 104.861 2.7 3.7 2.2 II ........... 101.160 98.959 108.299 108.892 109.616 107.577 107.959 105.799 105.287 105.111 1.1 .4 1.0 III .......... 101.355 99.606 108.898 109.181 109.917 107.838 108.736 106.179 105.721 105.414 1.4 1.7 1.2 IV .......... 102.146 99.837 109.167 109.447 110.278 107.917 109.007 106.608 106.086 105.809 1.6 1.4 1.5
2004: I ............. 103.565 102.163 110.522 111.203 111.825 110.095 110.131 107.332 106.980 106.461 2.8 3.4 2.5 II ........... 104.746 103.760 111.703 112.020 112.790 110.613 111.524 108.178 107.913 107.128 3.2 3.5 2.5 III .......... 105.175 105.066 112.682 112.491 113.317 110.970 112.802 108.561 108.429 107.579 1.4 1.9 1.7 IV p ........ 106.232 107.142 113.804 113.059 113.912 111.484 114.253 109.097 109.149 108.088 2.0 2.7 1.9
1 Gross domestic product (GDP) less exports of goods and services plus imports of goods and services. 2 Quarterly percent changes are at annual rates. Source: Department of Commerce. Bureau of Economic Analysis.
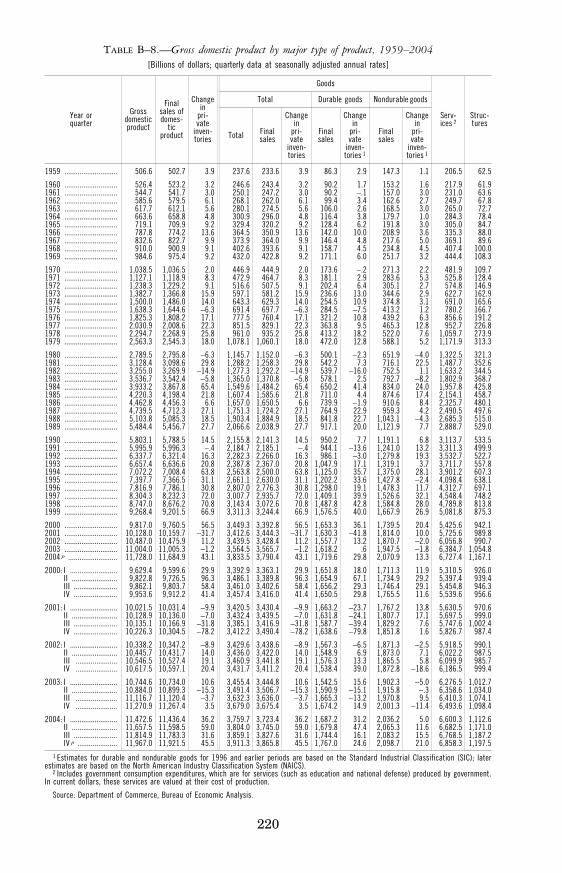
220
TABLE B–8.—Gross domestic product by major type of product, 1959–2004 [Billions of dollars; quarterly data at seasonally adjusted annual rates]
Year or quarter
Gross domestic product
Final sales of domes-
tic product
Change in
pri- vate
inven- tories
Goods
Serv- ices 2
Struc- tures
Total Durable goods Nondurable goods
Total Final sales
Change in
pri- vate
inven- tories
Final sales
Change in
pri- vate
inven- tories 1
Final sales
Change in
pri- vate
inven- tories 1
1959 ............................ 506.6 502.7 3.9 237.6 233.6 3.9 86.3 2.9 147.3 1.1 206.5 62.5
1960 ............................ 526.4 523.2 3.2 246.6 243.4 3.2 90.2 1.7 153.2 1.6 217.9 61.9 1961 ............................ 544.7 541.7 3.0 250.1 247.2 3.0 90.2 −.1 157.0 3.0 231.0 63.6 1962 ............................ 585.6 579.5 6.1 268.1 262.0 6.1 99.4 3.4 162.6 2.7 249.7 67.8 1963 ............................ 617.7 612.1 5.6 280.1 274.5 5.6 106.0 2.6 168.5 3.0 265.0 72.7 1964 ............................ 663.6 658.8 4.8 300.9 296.0 4.8 116.4 3.8 179.7 1.0 284.3 78.4 1965 ............................ 719.1 709.9 9.2 329.4 320.2 9.2 128.4 6.2 191.8 3.0 305.0 84.7 1966 ............................ 787.8 774.2 13.6 364.5 350.9 13.6 142.0 10.0 208.9 3.6 335.3 88.0 1967 ............................ 832.6 822.7 9.9 373.9 364.0 9.9 146.4 4.8 217.6 5.0 369.1 89.6 1968 ............................ 910.0 900.9 9.1 402.6 393.6 9.1 158.7 4.5 234.8 4.5 407.4 100.0 1969 ............................ 984.6 975.4 9.2 432.0 422.8 9.2 171.1 6.0 251.7 3.2 444.4 108.3
1970 ............................ 1,038.5 1,036.5 2.0 446.9 444.9 2.0 173.6 −.2 271.3 2.2 481.9 109.7 1971 ............................ 1,127.1 1,118.9 8.3 472.9 464.7 8.3 181.1 2.9 283.6 5.3 525.8 128.4 1972 ............................ 1,238.3 1,229.2 9.1 516.6 507.5 9.1 202.4 6.4 305.1 2.7 574.8 146.9 1973 ............................ 1,382.7 1,366.8 15.9 597.1 581.2 15.9 236.6 13.0 344.6 2.9 622.7 162.9 1974 ............................ 1,500.0 1,486.0 14.0 643.3 629.3 14.0 254.5 10.9 374.8 3.1 691.0 165.6 1975 ............................ 1,638.3 1,644.6 −6.3 691.4 697.7 −6.3 284.5 −7.5 413.2 1.2 780.2 166.7 1976 ............................ 1,825.3 1,808.2 17.1 777.5 760.4 17.1 321.2 10.8 439.2 6.3 856.6 191.2 1977 ............................ 2,030.9 2,008.6 22.3 851.5 829.1 22.3 363.8 9.5 465.3 12.8 952.7 226.8 1978 ............................ 2,294.7 2,268.9 25.8 961.0 935.2 25.8 413.2 18.2 522.0 7.6 1,059.7 273.9 1979 ............................ 2,563.3 2,545.3 18.0 1,078.1 1,060.1 18.0 472.0 12.8 588.1 5.2 1,171.9 313.3
1980 ............................ 2,789.5 2,795.8 −6.3 1,145.7 1,152.0 −6.3 500.1 −2.3 651.9 −4.0 1,322.5 321.3 1981 ............................ 3,128.4 3,098.6 29.8 1,288.2 1,258.3 29.8 542.2 7.3 716.1 22.5 1,487.7 352.6 1982 ............................ 3,255.0 3,269.9 −14.9 1,277.3 1,292.2 −14.9 539.7 −16.0 752.5 1.1 1,633.2 344.5 1983 ............................ 3,536.7 3,542.4 −5.8 1,365.0 1,370.8 −5.8 578.1 2.5 792.7 −8.2 1,802.9 368.7 1984 ............................ 3,933.2 3,867.8 65.4 1,549.6 1,484.2 65.4 650.2 41.4 834.0 24.0 1,957.8 425.8 1985 ............................ 4,220.3 4,198.4 21.8 1,607.4 1,585.6 21.8 711.0 4.4 874.6 17.4 2,154.1 458.7 1986 ............................ 4,462.8 4,456.3 6.6 1,657.0 1,650.5 6.6 739.9 −1.9 910.6 8.4 2,325.7 480.1 1987 ............................ 4,739.5 4,712.3 27.1 1,751.3 1,724.2 27.1 764.9 22.9 959.3 4.2 2,490.5 497.6 1988 ............................ 5,103.8 5,085.3 18.5 1,903.4 1,884.9 18.5 841.8 22.7 1,043.1 −4.3 2,685.3 515.0 1989 ............................ 5,484.4 5,456.7 27.7 2,066.6 2,038.9 27.7 917.1 20.0 1,121.9 7.7 2,888.7 529.0
1990 ............................ 5,803.1 5,788.5 14.5 2,155.8 2,141.3 14.5 950.2 7.7 1,191.1 6.8 3,113.7 533.5 1991 ............................ 5,995.9 5,996.3 −.4 2,184.7 2,185.1 −.4 944.1 −13.6 1,241.0 13.2 3,311.3 499.9 1992 ............................ 6,337.7 6,321.4 16.3 2,282.3 2,266.0 16.3 986.1 −3.0 1,279.8 19.3 3,532.7 522.7 1993 ............................ 6,657.4 6,636.6 20.8 2,387.8 2,367.0 20.8 1,047.9 17.1 1,319.1 3.7 3,711.7 557.8 1994 ............................ 7,072.2 7,008.4 63.8 2,563.8 2,500.0 63.8 1,125.0 35.7 1,375.0 28.1 3,901.2 607.3 1995 ............................ 7,397.7 7,366.5 31.1 2,661.1 2,630.0 31.1 1,202.2 33.6 1,427.8 −2.4 4,098.4 638.1 1996 ............................ 7,816.9 7,786.1 30.8 2,807.0 2,776.3 30.8 1,298.0 19.1 1,478.3 11.7 4,312.7 697.1 1997 ............................ 8,304.3 8,232.3 72.0 3,007.7 2,935.7 72.0 1,409.1 39.9 1,526.6 32.1 4,548.4 748.2 1998 ............................ 8,747.0 8,676.2 70.8 3,143.4 3,072.6 70.8 1,487.8 42.8 1,584.8 28.0 4,789.8 813.8 1999 ............................ 9,268.4 9,201.5 66.9 3,311.3 3,244.4 66.9 1,576.5 40.0 1,667.9 26.9 5,081.8 875.3
2000 ............................ 9,817.0 9,760.5 56.5 3,449.3 3,392.8 56.5 1,653.3 36.1 1,739.5 20.4 5,425.6 942.1 2001 ............................ 10,128.0 10,159.7 −31.7 3,412.6 3,444.3 −31.7 1,630.3 −41.8 1,814.0 10.0 5,725.6 989.8 2002 ............................ 10,487.0 10,475.9 11.2 3,439.5 3,428.4 11.2 1,557.7 13.2 1,870.7 −2.0 6,056.8 990.7 2003 ............................ 11,004.0 11,005.3 −1.2 3,564.5 3,565.7 −1.2 1,618.2 .6 1,947.5 −1.8 6,384.7 1,054.8 2004 p .......................... 11,728.0 11,684.9 43.1 3,833.5 3,790.4 43.1 1,719.6 29.8 2,070.9 13.3 6,727.4 1,167.1
2000: I ......................... 9,629.4 9,599.6 29.9 3,392.9 3,363.1 29.9 1,651.8 18.0 1,711.3 11.9 5,310.5 926.0 II ........................ 9,822.8 9,726.5 96.3 3,486.1 3,389.8 96.3 1,654.9 67.1 1,734.9 29.2 5,397.4 939.4 III ....................... 9,862.1 9,803.7 58.4 3,461.0 3,402.6 58.4 1,656.2 29.3 1,746.4 29.1 5,454.8 946.3 IV ....................... 9,953.6 9,912.2 41.4 3,457.4 3,416.0 41.4 1,650.5 29.8 1,765.5 11.6 5,539.6 956.6
2001: I ......................... 10,021.5 10,031.4 −9.9 3,420.5 3,430.4 −9.9 1,663.2 −23.7 1,767.2 13.8 5,630.5 970.6 II ........................ 10,128.9 10,136.0 −7.0 3,432.4 3,439.5 −7.0 1,631.8 −24.1 1,807.7 17.1 5,697.5 999.0 III ....................... 10,135.1 10,166.9 −31.8 3,385.1 3,416.9 −31.8 1,587.7 −39.4 1,829.2 7.6 5,747.6 1,002.4 IV ....................... 10,226.3 10,304.5 −78.2 3,412.2 3,490.4 −78.2 1,638.6 −79.8 1,851.8 1.6 5,826.7 987.4
2002: I ......................... 10,338.2 10,347.2 −8.9 3,429.6 3,438.6 −8.9 1,567.3 −6.5 1,871.3 −2.5 5,918.5 990.1 II ........................ 10,445.7 10,431.7 14.0 3,436.0 3,422.0 14.0 1,548.9 6.9 1,873.0 7.1 6,022.2 987.5 III ...................... 10,546.5 10,527.4 19.1 3,460.9 3,441.8 19.1 1,576.3 13.3 1,865.5 5.8 6,099.9 985.7 IV ...................... 10,617.5 10,597.1 20.4 3,431.7 3,411.2 20.4 1,538.4 39.0 1,872.8 −18.6 6,186.5 999.4
2003: I ......................... 10,744.6 10,734.0 10.6 3,455.4 3,444.8 10.6 1,542.5 15.6 1,902.3 −5.0 6,276.5 1,012.7 II ........................ 10,884.0 10,899.3 −15.3 3,491.4 3,506.7 −15.3 1,590.9 −15.1 1,915.8 −.3 6,358.6 1,034.0 III ...................... 11,116.7 11,120.4 −3.7 3,632.3 3,636.0 −3.7 1,665.3 −13.2 1,970.8 9.5 6,410.3 1,074.1 IV ...................... 11,270.9 11,267.4 3.5 3,679.0 3,675.4 3.5 1,674.2 14.9 2,001.3 −11.4 6,493.6 1,098.4
2004: I ......................... 11,472.6 11,436.4 36.2 3,759.7 3,723.4 36.2 1,687.2 31.2 2,036.2 5.0 6,600.3 1,112.6 II ........................ 11,657.5 11,598.5 59.0 3,804.0 3,745.0 59.0 1,679.8 47.4 2,065.3 11.6 6,682.5 1,171.0 III ....................... 11,814.9 11,783.3 31.6 3,859.1 3,827.6 31.6 1,744.4 16.1 2,083.2 15.5 6,768.5 1,187.2 IV p ..................... 11,967.0 11,921.5 45.5 3,911.3 3,865.8 45.5 1,767.0 24.6 2,098.7 21.0 6,858.3 1,197.5
1 Estimates for durable and nondurable goods for 1996 and earlier periods are based on the Standard Industrial Classification (SIC); later estimates are based on the North American Industry Classification System (NAICS).
2 Includes government consumption expenditures, which are for services (such as education and national defense) produced by government. In current dollars, these services are valued at their cost of production.
Source: Department of Commerce, Bureau of Economic Analysis.
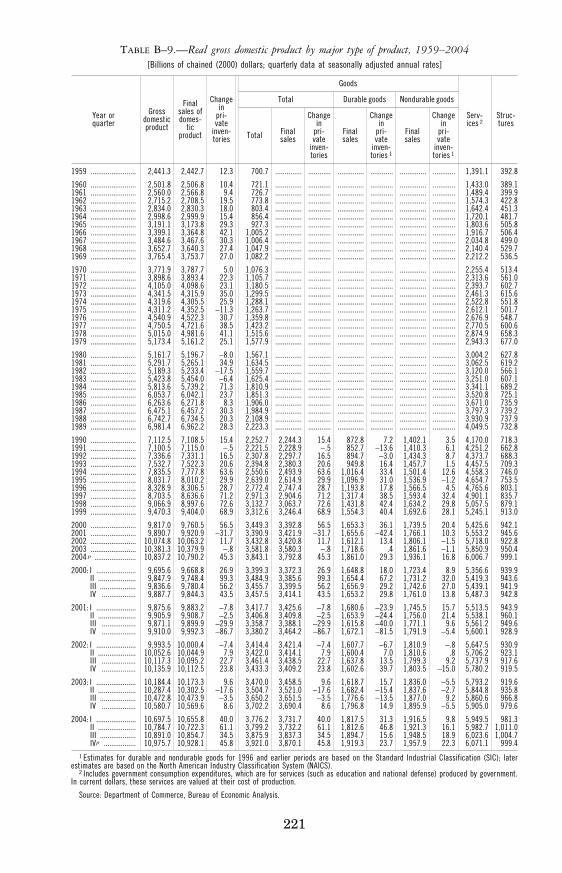
221
TABLE B–9.—Real gross domestic product by major type of product, 1959–2004 [Billions of chained (2000) dollars; quarterly data at seasonally adjusted annual rates]
Year or quarter
Gross domestic product
Final sales of domes-
tic product
Change in
pri- vate
inven- tories
Goods
Serv- ices 2
Struc- tures
Total Durable goods Nondurable goods
Total Final sales
Change in
pri- vate
inven- tories
Final sales
Change in
pri- vate
inven- tories 1
Final sales
Change in
pri- vate
inven- tories 1
1959 ........................ 2,441.3 2,442.7 12.3 700.7 .............. ............ .............. ............ .............. ............ 1,391.1 392.8
1960 ........................ 2,501.8 2,506.8 10.4 721.1 .............. ............ .............. ............ .............. ............ 1,433.0 389.1 1961 ........................ 2,560.0 2,566.8 9.4 726.7 .............. ............ .............. ............ .............. ............ 1,489.4 399.9 1962 ........................ 2,715.2 2,708.5 19.5 773.8 .............. ............ .............. ............ .............. ............ 1,574.3 422.8 1963 ........................ 2,834.0 2,830.3 18.0 803.4 .............. ............ .............. ............ .............. ............ 1,642.4 451.3 1964 ........................ 2,998.6 2,999.9 15.4 856.4 .............. ............ .............. ............ .............. ............ 1,720.1 481.7 1965 ........................ 3,191.1 3,173.8 29.3 927.3 .............. ............ .............. ............ .............. ............ 1,803.6 505.8 1966 ........................ 3,399.1 3,364.8 42.1 1,005.2 .............. ............ .............. ............ .............. ............ 1,916.7 506.4 1967 ........................ 3,484.6 3,467.6 30.3 1,006.4 .............. ............ .............. ............ .............. ............ 2,034.8 499.0 1968 ........................ 3,652.7 3,640.3 27.4 1,047.9 .............. ............ .............. ............ .............. ............ 2,140.4 529.7 1969 ........................ 3,765.4 3,753.7 27.0 1,082.2 .............. ............ .............. ............ .............. ............ 2,212.2 536.5
1970 ........................ 3,771.9 3,787.7 5.0 1,076.3 .............. ............ .............. ............ .............. ............ 2,255.4 513.4 1971 ........................ 3,898.6 3,893.4 22.3 1,105.7 .............. ............ .............. ............ .............. ............ 2,313.6 561.0 1972 ........................ 4,105.0 4,098.6 23.1 1,180.5 .............. ............ .............. ............ .............. ............ 2,393.7 602.7 1973 ........................ 4,341.5 4,315.9 35.0 1,299.5 .............. ............ .............. ............ .............. ............ 2,461.3 615.6 1974 ........................ 4,319.6 4,305.5 25.9 1,288.1 .............. ............ .............. ............ .............. ............ 2,522.8 551.8 1975 ........................ 4,311.2 4,352.5 −11.3 1,263.7 .............. ............ .............. ............ .............. ............ 2,612.1 501.7 1976 ........................ 4,540.9 4,522.3 30.7 1,359.8 .............. ............ .............. ............ .............. ............ 2,676.9 548.7 1977 ........................ 4,750.5 4,721.6 38.5 1,423.2 .............. ............ .............. ............ .............. ............ 2,770.5 600.6 1978 ........................ 5,015.0 4,981.6 41.1 1,515.6 .............. ............ .............. ............ .............. ............ 2,874.9 658.3 1979 ........................ 5,173.4 5,161.2 25.1 1,577.9 .............. ............ .............. ............ .............. ............ 2,943.3 677.0
1980 ........................ 5,161.7 5,196.7 −8.0 1,567.1 .............. ............ .............. ............ .............. ............ 3,004.2 627.8 1981 ........................ 5,291.7 5,265.1 34.9 1,634.5 .............. ............ .............. ............ .............. ............ 3,062.5 619.2 1982 ........................ 5,189.3 5,233.4 −17.5 1,559.7 .............. ............ .............. ............ .............. ............ 3,120.0 566.1 1983 ........................ 5,423.8 5,454.0 −6.4 1,625.4 .............. ............ .............. ............ .............. ............ 3,251.0 607.1 1984 ........................ 5,813.6 5,739.2 71.3 1,810.9 .............. ............ .............. ............ .............. ............ 3,341.1 689.2 1985 ........................ 6,053.7 6,042.1 23.7 1,851.3 .............. ............ .............. ............ .............. ............ 3,520.8 725.1 1986 ........................ 6,263.6 6,271.8 8.3 1,906.0 .............. ............ .............. ............ .............. ............ 3,671.0 735.9 1987 ........................ 6,475.1 6,457.2 30.3 1,984.9 .............. ............ .............. ............ .............. ............ 3,797.3 739.2 1988 ........................ 6,742.7 6,734.5 20.3 2,108.9 .............. ............ .............. ............ .............. ............ 3,930.9 737.9 1989 ........................ 6,981.4 6,962.2 28.3 2,223.3 .............. ............ .............. ............ .............. ............ 4,049.5 732.8
1990 ........................ 7,112.5 7,108.5 15.4 2,252.7 2,244.3 15.4 872.8 7.2 1,402.1 3.5 4,170.0 718.3 1991 ........................ 7,100.5 7,115.0 −.5 2,221.5 2,228.9 −.5 852.7 −13.6 1,410.3 6.1 4,251.2 662.8 1992 ........................ 7,336.6 7,331.1 16.5 2,307.8 2,297.7 16.5 894.7 −3.0 1,434.3 8.7 4,373.7 688.3 1993 ........................ 7,532.7 7,522.3 20.6 2,394.8 2,380.3 20.6 949.8 16.4 1,457.7 1.5 4,457.5 709.3 1994 ........................ 7,835.5 7,777.8 63.6 2,550.6 2,493.9 63.6 1,016.4 33.4 1,501.4 12.6 4,558.3 746.0 1995 ........................ 8,031.7 8,010.2 29.9 2,639.0 2,614.9 29.9 1,096.9 31.0 1,536.9 −1.2 4,654.7 753.5 1996 ........................ 8,328.9 8,306.5 28.7 2,772.4 2,747.4 28.7 1,193.8 17.8 1,566.5 4.5 4,765.6 803.1 1997 ........................ 8,703.5 8,636.6 71.2 2,971.3 2,904.6 71.2 1,317.4 38.5 1,593.4 32.4 4,901.1 835.7 1998 ........................ 9,066.9 8,997.6 72.6 3,132.7 3,063.7 72.6 1,431.8 42.4 1,634.2 29.8 5,057.5 879.1 1999 ........................ 9,470.3 9,404.0 68.9 3,312.6 3,246.4 68.9 1,554.3 40.4 1,692.6 28.1 5,245.1 913.0
2000 ........................ 9,817.0 9,760.5 56.5 3,449.3 3,392.8 56.5 1,653.3 36.1 1,739.5 20.4 5,425.6 942.1 2001 ........................ 9,890.7 9,920.9 −31.7 3,390.9 3,421.9 −31.7 1,655.6 −42.4 1,766.1 10.3 5,553.2 945.6 2002 ........................ 10,074.8 10,063.2 11.7 3,432.8 3,420.8 11.7 1,612.1 13.4 1,806.1 −1.5 5,718.0 922.8 2003 ........................ 10,381.3 10,379.9 −.8 3,581.8 3,580.3 −.8 1,718.6 .4 1,861.6 −1.1 5,850.9 950.4 2004 p ...................... 10,837.2 10,790.2 45.3 3,843.1 3,792.8 45.3 1,861.0 29.3 1,936.1 16.8 6,006.7 999.1
2000: I ..................... 9,695.6 9,668.8 26.9 3,399.3 3,372.3 26.9 1,648.8 18.0 1,723.4 8.9 5,356.6 939.9 II .................... 9,847.9 9,748.4 99.3 3,484.9 3,385.6 99.3 1,654.4 67.2 1,731.2 32.0 5,419.3 943.6 III ................... 9,836.6 9,780.4 56.2 3,455.7 3,399.5 56.2 1,656.9 29.2 1,742.6 27.0 5,439.1 941.9 IV .................. 9,887.7 9,844.3 43.5 3,457.5 3,414.1 43.5 1,653.2 29.8 1,761.0 13.8 5,487.3 942.8
2001: I ..................... 9,875.6 9,883.2 −7.8 3,417.7 3,425.6 −7.8 1,680.6 −23.9 1,745.5 15.7 5,513.5 943.9 II .................... 9,905.9 9,908.7 −2.5 3,406.8 3,409.8 −2.5 1,653.9 −24.4 1,756.0 21.4 5,538.1 960.1 III .................. 9,871.1 9,899.9 −29.9 3,358.7 3,388.1 −29.9 1,615.8 −40.0 1,771.1 9.6 5,561.2 949.6 IV .................. 9,910.0 9,992.3 −86.7 3,380.2 3,464.2 −86.7 1,672.1 −81.5 1,791.9 −5.4 5,600.1 928.9
2002: I ..................... 9,993.5 10,000.4 −7.4 3,414.4 3,421.4 −7.4 1,607.7 −6.7 1,810.9 −.8 5,647.5 930.9 II .................... 10,052.6 10,044.9 7.9 3,422.0 3,414.1 7.9 1,600.4 7.0 1,810.6 .8 5,706.2 923.1 III .................. 10,117.3 10,095.2 22.7 3,461.4 3,438.5 22.7 1,637.8 13.5 1,799.3 9.2 5,737.9 917.6 IV .................. 10,135.9 10,112.5 23.8 3,433.3 3,409.2 23.8 1,602.6 39.7 1,803.5 −15.0 5,780.2 919.5
2003: I ..................... 10,184.4 10,173.3 9.6 3,470.0 3,458.5 9.6 1,618.7 15.7 1,836.0 −5.5 5,793.2 919.6 II .................... 10,287.4 10,302.5 −17.6 3,504.7 3,521.0 −17.6 1,682.4 −15.4 1,837.6 −2.7 5,844.8 935.8 III ................... 10,472.8 10,473.9 −3.5 3,650.2 3,651.5 −3.5 1,776.6 −13.5 1,877.0 9.2 5,860.6 966.8 IV .................. 10,580.7 10,569.6 8.6 3,702.2 3,690.4 8.6 1,796.8 14.9 1,895.9 −5.5 5,905.0 979.6
2004: I ..................... 10,697.5 10,655.8 40.0 3,776.2 3,731.7 40.0 1,817.5 31.3 1,916.5 9.8 5,949.5 981.3 II .................... 10,784.7 10,722.3 61.1 3,799.2 3,732.2 61.1 1,812.6 46.8 1,921.3 16.1 5,982.7 1,011.0 III ................... 10,891.0 10,854.7 34.5 3,875.9 3,837.3 34.5 1,894.7 15.6 1,948.5 18.9 6,023.6 1,004.7 IVp ................. 10,975.7 10,928.1 45.8 3,921.0 3,870.1 45.8 1,919.3 23.7 1,957.9 22.3 6,071.1 999.4
1 Estimates for durable and nondurable goods for 1996 and earlier periods are based on the Standard Industrial Classification (SIC); later estimates are based on the North American Industry Classification System (NAICS).
2 Includes government consumption expenditures, which are for services (such as education and national defense) produced by government. In current dollars, these services are valued at their cost of production.
Source: Department of Commerce, Bureau of Economic Analysis.
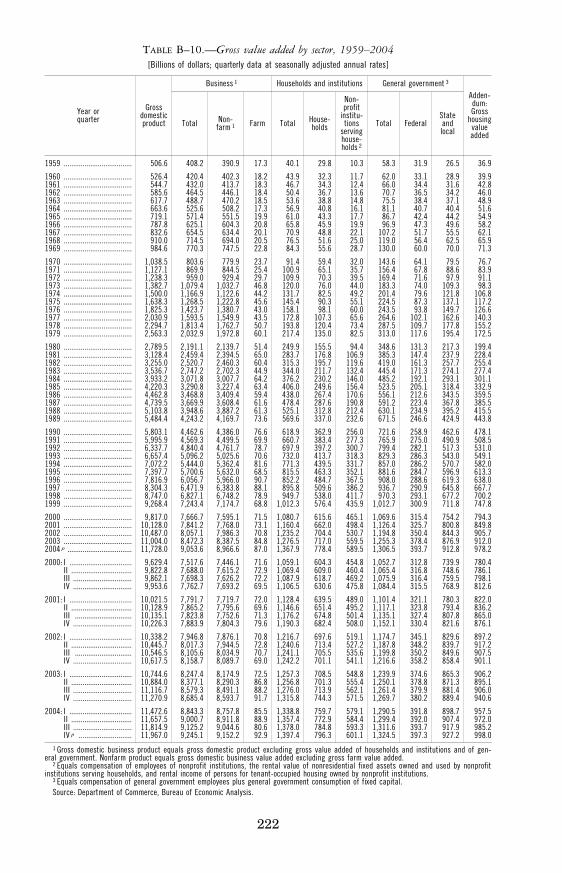
222
TABLE B–10.—Gross value added by sector, 1959–2004 [Billions of dollars; quarterly data at seasonally adjusted annual rates]
Year or quarter
Gross domestic product
Business 1 Households and institutions General government 3 Adden-dum: Gross
housing value added
Total Non-farm 1 Farm Total House-
holds
Non- profit
institu-tions
serving house-holds 2
Total Federal State and local
1959 .................................... 506.6 408.2 390.9 17.3 40.1 29.8 10.3 58.3 31.9 26.5 36.9
1960 .................................... 526.4 420.4 402.3 18.2 43.9 32.3 11.7 62.0 33.1 28.9 39.9 1961 .................................... 544.7 432.0 413.7 18.3 46.7 34.3 12.4 66.0 34.4 31.6 42.8 1962 .................................... 585.6 464.5 446.1 18.4 50.4 36.7 13.6 70.7 36.5 34.2 46.0 1963 .................................... 617.7 488.7 470.2 18.5 53.6 38.8 14.8 75.5 38.4 37.1 48.9 1964 .................................... 663.6 525.6 508.2 17.3 56.9 40.8 16.1 81.1 40.7 40.4 51.6 1965 .................................... 719.1 571.4 551.5 19.9 61.0 43.3 17.7 86.7 42.4 44.2 54.9 1966 .................................... 787.8 625.1 604.3 20.8 65.8 45.9 19.9 96.9 47.3 49.6 58.2 1967 .................................... 832.6 654.5 634.4 20.1 70.9 48.8 22.1 107.2 51.7 55.5 62.1 1968 .................................... 910.0 714.5 694.0 20.5 76.5 51.6 25.0 119.0 56.4 62.5 65.9 1969 .................................... 984.6 770.3 747.5 22.8 84.3 55.6 28.7 130.0 60.0 70.0 71.3
1970 .................................... 1,038.5 803.6 779.9 23.7 91.4 59.4 32.0 143.6 64.1 79.5 76.7 1971 .................................... 1,127.1 869.9 844.5 25.4 100.9 65.1 35.7 156.4 67.8 88.6 83.9 1972 .................................... 1,238.3 959.0 929.4 29.7 109.9 70.3 39.5 169.4 71.6 97.9 91.1 1973 .................................... 1,382.7 1,079.4 1,032.7 46.8 120.0 76.0 44.0 183.3 74.0 109.3 98.3 1974 .................................... 1,500.0 1,166.9 1,122.6 44.2 131.7 82.5 49.2 201.4 79.6 121.8 106.8 1975 .................................... 1,638.3 1,268.5 1,222.8 45.6 145.4 90.3 55.1 224.5 87.3 137.1 117.2 1976 .................................... 1,825.3 1,423.7 1,380.7 43.0 158.1 98.1 60.0 243.5 93.8 149.7 126.6 1977 .................................... 2,030.9 1,593.5 1,549.9 43.5 172.8 107.3 65.6 264.6 102.1 162.6 140.3 1978 .................................... 2,294.7 1,813.4 1,762.7 50.7 193.8 120.4 73.4 287.5 109.7 177.8 155.2 1979 .................................... 2,563.3 2,032.9 1,972.8 60.1 217.4 135.0 82.5 313.0 117.6 195.4 172.5
1980 .................................... 2,789.5 2,191.1 2,139.7 51.4 249.9 155.5 94.4 348.6 131.3 217.3 199.4 1981 .................................... 3,128.4 2,459.4 2,394.5 65.0 283.7 176.8 106.9 385.3 147.4 237.9 228.4 1982 .................................... 3,255.0 2,520.7 2,460.3 60.4 315.3 195.7 119.6 419.0 161.3 257.7 255.4 1983 .................................... 3,536.7 2,747.2 2,702.3 44.9 344.0 211.7 132.4 445.4 171.3 274.1 277.4 1984 .................................... 3,933.2 3,071.8 3,007.7 64.2 376.2 230.2 146.0 485.2 192.1 293.1 301.1 1985 .................................... 4,220.3 3,290.8 3,227.4 63.4 406.0 249.6 156.4 523.5 205.1 318.4 332.9 1986 .................................... 4,462.8 3,468.8 3,409.4 59.4 438.0 267.4 170.6 556.1 212.6 343.5 359.5 1987 .................................... 4,739.5 3,669.9 3,608.4 61.6 478.4 287.6 190.8 591.2 223.4 367.8 385.5 1988 .................................... 5,103.8 3,948.6 3,887.2 61.3 525.1 312.8 212.4 630.1 234.9 395.2 415.5 1989 .................................... 5,484.4 4,243.2 4,169.7 73.6 569.6 337.0 232.6 671.5 246.6 424.9 443.8
1990 .................................... 5,803.1 4,462.6 4,386.0 76.6 618.9 362.9 256.0 721.6 258.9 462.6 478.1 1991 .................................... 5,995.9 4,569.3 4,499.5 69.9 660.7 383.4 277.3 765.9 275.0 490.9 508.5 1992 .................................... 6,337.7 4,840.4 4,761.7 78.7 697.9 397.2 300.7 799.4 282.1 517.3 531.0 1993 .................................... 6,657.4 5,096.2 5,025.6 70.6 732.0 413.7 318.3 829.3 286.3 543.0 549.1 1994 .................................... 7,072.2 5,444.0 5,362.4 81.6 771.3 439.5 331.7 857.0 286.2 570.7 582.0 1995 .................................... 7,397.7 5,700.6 5,632.0 68.5 815.5 463.3 352.1 881.6 284.7 596.9 613.3 1996 .................................... 7,816.9 6,056.7 5,966.0 90.7 852.2 484.7 367.5 908.0 288.6 619.3 638.0 1997 ................................... 8,304.3 6,471.9 6,383.8 88.1 895.8 509.6 386.2 936.7 290.9 645.8 667.7 1998 .................................... 8,747.0 6,827.1 6,748.2 78.9 949.7 538.0 411.7 970.3 293.1 677.2 700.2 1999 .................................... 9,268.4 7,243.4 7,174.7 68.8 1,012.3 576.4 435.9 1,012.7 300.9 711.8 747.8
2000 .................................... 9,817.0 7,666.7 7,595.1 71.5 1,080.7 615.6 465.1 1,069.6 315.4 754.2 794.3 2001 .................................... 10,128.0 7,841.2 7,768.0 73.1 1,160.4 662.0 498.4 1,126.4 325.7 800.8 849.8 2002 .................................... 10,487.0 8,057.1 7,986.3 70.8 1,235.2 704.4 530.7 1,194.8 350.4 844.3 905.7 2003 .................................... 11,004.0 8,472.3 8,387.5 84.8 1,276.5 717.0 559.5 1,255.3 378.4 876.9 912.0 2004 p .................................. 11,728.0 9,053.6 8,966.6 87.0 1,367.9 778.4 589.5 1,306.5 393.7 912.8 978.2
2000: I ................................. 9,629.4 7,517.6 7,446.1 71.6 1,059.1 604.3 454.8 1,052.7 312.8 739.9 780.4 II ................................ 9,822.8 7,688.0 7,615.2 72.9 1,069.4 609.0 460.4 1,065.4 316.8 748.6 786.1 III ............................... 9,862.1 7,698.3 7,626.2 72.2 1,087.9 618.7 469.2 1,075.9 316.4 759.5 798.1 IV ............................... 9,953.6 7,762.7 7,693.2 69.5 1,106.5 630.6 475.8 1,084.4 315.5 768.9 812.6
2001: I ................................. 10,021.5 7,791.7 7,719.7 72.0 1,128.4 639.5 489.0 1,101.4 321.1 780.3 822.0 II ................................ 10,128.9 7,865.2 7,795.6 69.6 1,146.6 651.4 495.2 1,117.1 323.8 793.4 836.2 III .............................. 10,135.1 7,823.8 7,752.6 71.3 1,176.2 674.8 501.4 1,135.1 327.4 807.8 865.0 IV ............................... 10,226.3 7,883.9 7,804.3 79.6 1,190.3 682.4 508.0 1,152.1 330.4 821.6 876.1
2002: I ................................. 10,338.2 7,946.8 7,876.1 70.8 1,216.7 697.6 519.1 1,174.7 345.1 829.6 897.2 II ................................ 10,445.7 8,017.3 7,944.5 72.8 1,240.6 713.4 527.2 1,187.8 348.2 839.7 917.2 III .............................. 10,546.5 8,105.6 8,034.9 70.7 1,241.1 705.5 535.6 1,199.8 350.2 849.6 907.5 IV ............................... 10,617.5 8,158.7 8,089.7 69.0 1,242.2 701.1 541.1 1,216.6 358.2 858.4 901.1
2003: I ................................. 10,744.6 8,247.4 8,174.9 72.5 1,257.3 708.5 548.8 1,239.9 374.6 865.3 906.2 II ................................ 10,884.0 8,377.1 8,290.3 86.8 1,256.8 701.3 555.4 1,250.1 378.8 871.3 895.1 III ............................... 11,116.7 8,579.3 8,491.1 88.2 1,276.0 713.9 562.1 1,261.4 379.9 881.4 906.0 IV ............................... 11,270.9 8,685.4 8,593.7 91.7 1,315.8 744.3 571.5 1,269.7 380.2 889.4 940.6
2004: I ................................. 11,472.6 8,843.3 8,757.8 85.5 1,338.8 759.7 579.1 1,290.5 391.8 898.7 957.5 II ................................ 11,657.5 9,000.7 8,911.8 88.9 1,357.4 772.9 584.4 1,299.4 392.0 907.4 972.0 III ............................... 11,814.9 9,125.2 9,044.6 80.6 1,378.0 784.8 593.3 1,311.6 393.7 917.9 985.2 IV p ............................ 11,967.0 9,245.1 9,152.2 92.9 1,397.4 796.3 601.1 1,324.5 397.3 927.2 998.0
1 Gross domestic business product equals gross domestic product excluding gross value added of households and institutions and of gen-eral government. Nonfarm product equals gross domestic business value added excluding gross farm value added.
2 Equals compensation of employees of nonprofit institutions, the rental value of nonresidential fixed assets owned and used by nonprofit institutions serving households, and rental income of persons for tenant-occupied housing owned by nonprofit institutions.
3 Equals compensation of general government employees plus general government consumption of fixed capital. Source: Department of Commerce, Bureau of Economic Analysis.
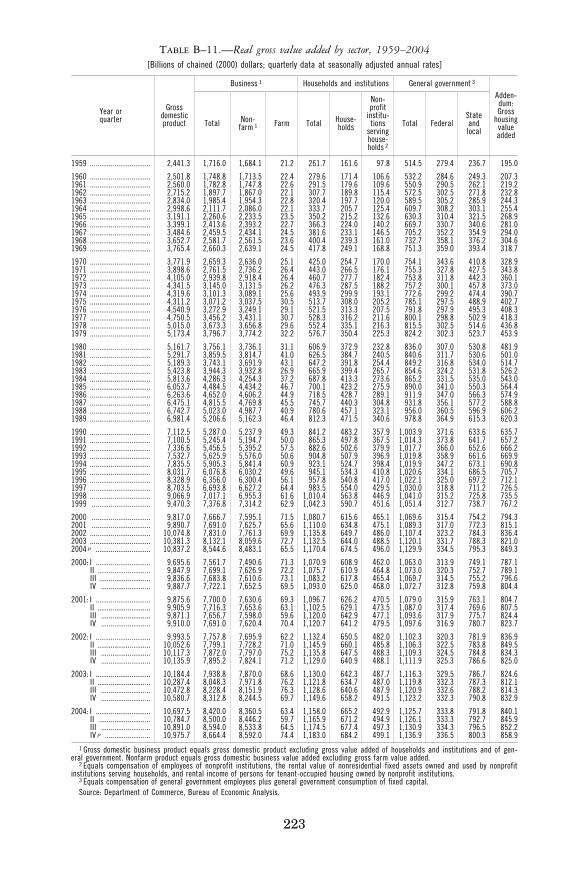
223
TABLE B–11.—Real gross value added by sector, 1959–2004 [Billions of chained (2000) dollars; quarterly data at seasonally adjusted annual rates]
Year or quarter
Gross domestic product
Business 1 Households and institutions General government 3 Adden-dum: Gross
housing value added
Total Non-farm 1 Farm Total House-
holds
Non-profit
institu-tions
serving house-holds 2
Total Federal State and local
1959 ................................ 2,441.3 1,716.0 1,684.1 21.2 261.7 161.6 97.8 514.5 279.4 236.7 195.0
1960 ................................ 2,501.8 1,748.8 1,713.5 22.4 279.6 171.4 106.6 532.2 284.6 249.3 207.3 1961 ................................ 2,560.0 1,782.8 1,747.8 22.6 291.5 179.6 109.6 550.9 290.5 262.1 219.2 1962 ................................ 2,715.2 1,897.7 1,867.0 22.1 307.7 189.8 115.4 572.5 302.5 271.8 232.8 1963 ................................ 2,834.0 1,985.4 1,954.3 22.8 320.4 197.7 120.0 589.5 305.2 285.9 244.3 1964 ................................ 2,998.6 2,111.7 2,086.0 22.1 333.7 205.7 125.4 609.7 308.2 303.1 255.4 1965 ................................ 3,191.1 2,260.6 2,233.5 23.5 350.2 215.2 132.6 630.3 310.4 321.5 268.9 1966 ................................ 3,399.1 2,413.6 2,393.2 22.7 366.3 224.0 140.2 669.7 330.7 340.6 281.0 1967 ................................ 3,484.6 2,459.5 2,434.1 24.5 381.6 233.1 146.5 705.2 352.2 354.9 294.0 1968 ................................ 3,652.7 2,581.7 2,561.5 23.6 400.4 239.3 161.0 732.7 358.1 376.2 304.6 1969 ................................ 3,765.4 2,660.3 2,639.1 24.5 417.8 249.1 168.8 751.3 359.0 393.4 318.7
1970 ................................ 3,771.9 2,659.3 2,636.0 25.1 425.0 254.7 170.0 754.1 343.6 410.8 328.9 1971 ................................ 3,898.6 2,761.5 2,736.2 26.4 443.0 266.5 176.1 755.3 327.8 427.5 343.8 1972 ................................ 4,105.0 2,939.8 2,918.4 26.4 460.7 277.7 182.4 753.8 311.8 442.3 360.1 1973 ................................ 4,341.5 3,145.0 3,131.5 26.2 476.3 287.5 188.2 757.2 300.1 457.8 373.0 1974 ................................ 4,319.6 3,101.3 3,089.1 25.6 493.9 299.9 193.1 772.6 299.2 474.4 390.7 1975 ................................ 4,311.2 3,071.2 3,037.5 30.5 513.7 308.0 205.2 785.1 297.5 488.9 402.7 1976 ................................ 4,540.9 3,272.9 3,249.1 29.1 521.5 313.3 207.5 791.8 297.9 495.3 408.3 1977 ................................ 4,750.5 3,456.2 3,431.1 30.7 528.3 316.2 211.6 800.1 298.8 502.9 418.3 1978 ................................ 5,015.0 3,673.3 3,656.8 29.6 552.4 335.1 216.3 815.5 302.5 514.6 436.8 1979 ................................ 5,173.4 3,796.7 3,774.2 32.2 576.7 350.4 225.3 824.2 302.3 523.7 453.9
1980 ................................ 5,161.7 3,756.1 3,736.1 31.1 606.9 372.9 232.8 836.0 307.0 530.8 481.9 1981 ................................ 5,291.7 3,859.5 3,814.7 41.0 626.5 384.7 240.5 840.6 311.7 530.6 501.0 1982 ................................ 5,189.3 3,743.1 3,691.9 43.1 647.2 391.8 254.4 849.2 316.8 534.0 514.7 1983 ................................ 5,423.8 3,944.3 3,932.8 26.9 665.9 399.4 265.7 854.6 324.2 531.8 526.2 1984 ................................ 5,813.6 4,286.3 4,254.3 37.2 687.8 413.3 273.6 865.2 331.5 535.0 543.0 1985 ................................ 6,053.7 4,484.5 4,434.2 46.7 700.1 423.2 275.9 890.0 341.0 550.3 564.4 1986 ................................ 6,263.6 4,652.0 4,606.2 44.9 718.5 428.7 289.1 911.9 347.0 566.3 574.9 1987 ................................ 6,475.1 4,815.5 4,769.8 45.5 745.7 440.3 304.8 931.8 356.1 577.2 588.8 1988 ................................ 6,742.7 5,023.0 4,987.7 40.9 780.6 457.1 323.1 956.0 360.5 596.9 606.2 1989 ................................ 6,981.4 5,206.6 5,162.3 46.4 812.3 471.5 340.6 978.8 364.9 615.3 620.3
1990 ................................ 7,112.5 5,287.0 5,237.9 49.3 841.2 483.2 357.9 1,003.9 371.6 633.6 635.7 1991 ................................ 7,100.5 5,245.4 5,194.7 50.0 865.3 497.8 367.5 1,014.3 373.8 641.7 657.2 1992 ................................ 7,336.6 5,456.5 5,395.2 57.5 882.6 502.6 379.9 1,017.7 366.0 652.6 666.2 1993 ................................ 7,532.7 5,625.9 5,576.0 50.6 904.8 507.9 396.9 1,019.8 358.9 661.6 669.9 1994 ................................ 7,835.5 5,905.3 5,841.4 60.9 923.1 524.7 398.4 1,019.9 347.2 673.1 690.8 1995 ................................ 8,031.7 6,076.8 6,030.2 49.6 945.1 534.3 410.8 1,020.6 334.1 686.5 705.7 1996 ................................ 8,328.9 6,356.0 6,300.4 56.1 957.8 540.8 417.0 1,022.1 325.0 697.2 712.1 1997 ................................ 8,703.5 6,693.8 6,627.2 64.4 983.5 554.0 429.5 1,030.0 318.8 711.2 726.5 1998 ................................ 9,066.9 7,017.1 6,955.3 61.6 1,010.4 563.8 446.9 1,041.0 315.2 725.8 735.5 1999 ............................... 9,470.3 7,376.8 7,314.2 62.9 1,042.3 590.7 451.6 1,051.4 312.7 738.7 767.2
2000 ............................... 9,817.0 7,666.7 7,595.1 71.5 1,080.7 615.6 465.1 1,069.6 315.4 754.2 794.3 2001 ............................... 9,890.7 7,691.0 7,625.7 65.6 1,110.0 634.8 475.1 1,089.3 317.0 772.3 815.1 2002 ................................ 10,074.8 7,831.0 7,761.3 69.9 1,135.8 649.7 486.0 1,107.4 323.2 784.3 836.4 2003 ................................ 10,381.3 8,132.1 8,059.6 72.7 1,132.5 644.0 488.5 1,120.1 331.7 788.3 821.0 2004 p ............................. 10,837.2 8,544.6 8,483.1 65.5 1,170.4 674.5 496.0 1,129.9 334.5 795.3 849.3
2000: I ............................. 9,695.6 7,561.7 7,490.6 71.3 1,070.9 608.9 462.0 1,063.0 313.9 749.1 787.1 II ............................ 9,847.9 7,699.1 7,626.9 72.2 1,075.7 610.9 464.8 1,073.0 320.3 752.7 789.1 III ........................... 9,836.6 7,683.8 7,610.6 73.1 1,083.2 617.8 465.4 1,069.7 314.5 755.2 796.6 IV .......................... 9,887.7 7,722.1 7,652.5 69.5 1,093.0 625.0 468.0 1,072.7 312.8 759.8 804.4
2001: I ............................. 9,875.6 7,700.0 7,630.6 69.3 1,096.7 626.2 470.5 1,079.0 315.9 763.1 804.7 II ............................ 9,905.9 7,716.3 7,653.6 63.1 1,102.5 629.1 473.5 1,087.0 317.4 769.6 807.5 III .......................... 9,871.1 7,656.7 7,598.0 59.6 1,120.0 642.9 477.1 1,093.6 317.9 775.7 824.4 IV .......................... 9,910.0 7,691.0 7,620.4 70.4 1,120.7 641.2 479.5 1,097.6 316.9 780.7 823.7
2002: I ............................. 9,993.5 7,757.8 7,695.9 62.2 1,132.4 650.5 482.0 1,102.3 320.3 781.9 836.9 II ............................ 10,052.6 7,799.1 7,728.2 71.0 1,145.9 660.1 485.8 1,106.3 322.5 783.8 849.5 III .......................... 10,117.3 7,872.0 7,797.0 75.2 1,135.8 647.5 488.3 1,109.3 324.5 784.8 834.3 IV .......................... 10,135.9 7,895.2 7,824.1 71.2 1,129.0 640.9 488.1 1,111.9 325.3 786.6 825.0
2003: I ............................. 10,184.4 7,938.8 7,870.0 68.6 1,130.0 642.3 487.7 1,116.3 329.5 786.7 824.6 II ............................ 10,287.4 8,048.3 7,971.8 76.2 1,121.8 634.7 487.0 1,119.8 332.3 787.3 812.1 III .......................... 10,472.8 8,228.4 8,151.9 76.3 1,128.6 640.6 487.9 1,120.9 332.6 788.2 814.3 IV .......................... 10,580.7 8,312.8 8,244.5 69.7 1,149.6 658.2 491.5 1,123.2 332.3 790.8 832.9
2004: I ............................. 10,697.5 8,420.0 8,360.5 63.4 1,158.0 665.2 492.9 1,125.7 333.8 791.8 840.1 II ........................... 10,784.7 8,500.0 8,446.2 59.7 1,165.9 671.2 494.9 1,126.1 333.3 792.7 845.9 III .......................... 10,891.0 8,594.0 8,533.8 64.5 1,174.5 677.4 497.3 1,130.9 334.3 796.5 852.2 IV p ........................ 10,975.7 8,664.4 8,592.0 74.4 1,183.0 684.2 499.1 1,136.9 336.5 800.3 858.9
1 Gross domestic business product equals gross domestic product excluding gross value added of households and institutions and of gen-eral government. Nonfarm product equals gross domestic business value added excluding gross farm value added.
2 Equals compensation of employees of nonprofit institutions, the rental value of nonresidential fixed assets owned and used by nonprofit institutions serving households, and rental income of persons for tenant-occupied housing owned by nonprofit institutions.
3 Equals compensation of general government employees plus general government consumption of fixed capital. Source: Department of Commerce, Bureau of Economic Analysis.
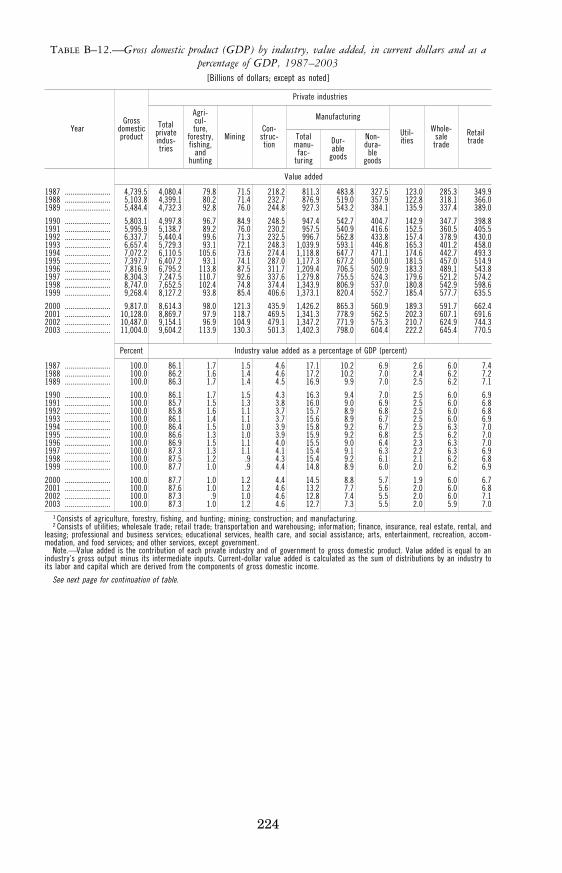
224
TABLE B–12.—Gross domestic product (GDP) by industry, value added, in current dollars and as a percentage of GDP, 1987–2003
[Billions of dollars; except as noted]
Year Gross
domestic product
Private industries
Total private indus- tries
Agri- cul- ture,
forestry, fishing,
and hunting
Mining Con-
struc- tion
Manufacturing
Util- ities
Whole- sale trade
Retail trade Total
manu- fac-
turing
Dur- able
goods
Non- dura-
ble goods
Value added
1987 ........................ 4,739.5 4,080.4 79.8 71.5 218.2 811.3 483.8 327.5 123.0 285.3 349.9 1988 ........................ 5,103.8 4,399.1 80.2 71.4 232.7 876.9 519.0 357.9 122.8 318.1 366.0 1989 ........................ 5,484.4 4,732.3 92.8 76.0 244.8 927.3 543.2 384.1 135.9 337.4 389.0
1990 ........................ 5,803.1 4,997.8 96.7 84.9 248.5 947.4 542.7 404.7 142.9 347.7 398.8 1991 ........................ 5,995.9 5,138.7 89.2 76.0 230.2 957.5 540.9 416.6 152.5 360.5 405.5 1992 ........................ 6,337.7 5,440.4 99.6 71.3 232.5 996.7 562.8 433.8 157.4 378.9 430.0 1993 ........................ 6,657.4 5,729.3 93.1 72.1 248.3 1,039.9 593.1 446.8 165.3 401.2 458.0 1994 ........................ 7,072.2 6,110.5 105.6 73.6 274.4 1,118.8 647.7 471.1 174.6 442.7 493.3 1995 ........................ 7,397.7 6,407.2 93.1 74.1 287.0 1,177.3 677.2 500.0 181.5 457.0 514.9 1996 ........................ 7,816.9 6,795.2 113.8 87.5 311.7 1,209.4 706.5 502.9 183.3 489.1 543.8 1997 ........................ 8,304.3 7,247.5 110.7 92.6 337.6 1,279.8 755.5 524.3 179.6 521.2 574.2 1998 ........................ 8,747.0 7,652.5 102.4 74.8 374.4 1,343.9 806.9 537.0 180.8 542.9 598.6 1999 ........................ 9,268.4 8,127.2 93.8 85.4 406.6 1,373.1 820.4 552.7 185.4 577.7 635.5
2000 ........................ 9,817.0 8,614.3 98.0 121.3 435.9 1,426.2 865.3 560.9 189.3 591.7 662.4 2001 ........................ 10,128.0 8,869.7 97.9 118.7 469.5 1,341.3 778.9 562.5 202.3 607.1 691.6 2002 ........................ 10,487.0 9,154.1 96.9 104.9 479.1 1,347.2 771.9 575.3 210.7 624.9 744.3 2003 ........................ 11,004.0 9,604.2 113.9 130.3 501.3 1,402.3 798.0 604.4 222.2 645.4 770.5
Percent Industry value added as a percentage of GDP (percent)
1987 ........................ 100.0 86.1 1.7 1.5 4.6 17.1 10.2 6.9 2.6 6.0 7.4 1988 ........................ 100.0 86.2 1.6 1.4 4.6 17.2 10.2 7.0 2.4 6.2 7.2 1989 ........................ 100.0 86.3 1.7 1.4 4.5 16.9 9.9 7.0 2.5 6.2 7.1
1990 ........................ 100.0 86.1 1.7 1.5 4.3 16.3 9.4 7.0 2.5 6.0 6.9 1991 ........................ 100.0 85.7 1.5 1.3 3.8 16.0 9.0 6.9 2.5 6.0 6.8 1992 ........................ 100.0 85.8 1.6 1.1 3.7 15.7 8.9 6.8 2.5 6.0 6.8 1993 ........................ 100.0 86.1 1.4 1.1 3.7 15.6 8.9 6.7 2.5 6.0 6.9 1994 ........................ 100.0 86.4 1.5 1.0 3.9 15.8 9.2 6.7 2.5 6.3 7.0 1995 ........................ 100.0 86.6 1.3 1.0 3.9 15.9 9.2 6.8 2.5 6.2 7.0 1996 ........................ 100.0 86.9 1.5 1.1 4.0 15.5 9.0 6.4 2.3 6.3 7.0 1997 ........................ 100.0 87.3 1.3 1.1 4.1 15.4 9.1 6.3 2.2 6.3 6.9 1998 ........................ 100.0 87.5 1.2 .9 4.3 15.4 9.2 6.1 2.1 6.2 6.8 1999 ........................ 100.0 87.7 1.0 .9 4.4 14.8 8.9 6.0 2.0 6.2 6.9
2000 ........................ 100.0 87.7 1.0 1.2 4.4 14.5 8.8 5.7 1.9 6.0 6.7 2001 ........................ 100.0 87.6 1.0 1.2 4.6 13.2 7.7 5.6 2.0 6.0 6.8 2002 ........................ 100.0 87.3 .9 1.0 4.6 12.8 7.4 5.5 2.0 6.0 7.1 2003 ........................ 100.0 87.3 1.0 1.2 4.6 12.7 7.3 5.5 2.0 5.9 7.0
1 Consists of agriculture, forestry, fishing, and hunting; mining; construction; and manufacturing. 2 Consists of utilities; wholesale trade; retail trade; transportation and warehousing; information; finance, insurance, real estate, rental, and
leasing; professional and business services; educational services, health care, and social assistance; arts, entertainment, recreation, accom-modation, and food services; and other services, except government.
Note.—Value added is the contribution of each private industry and of government to gross domestic product. Value added is equal to an industry’s gross output minus its intermediate inputs. Current-dollar value added is calculated as the sum of distributions by an industry to its labor and capital which are derived from the components of gross domestic income.
See next page for continuation of table.
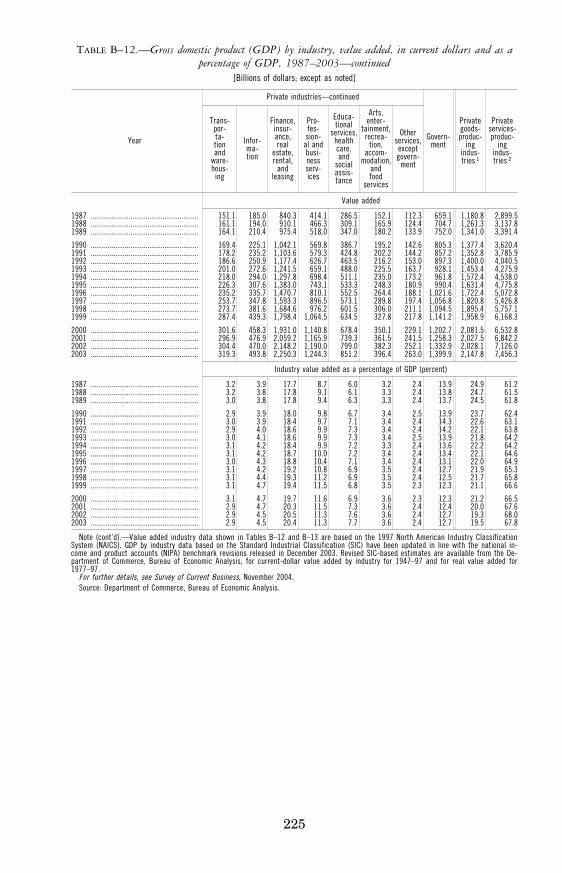
225
TABLE B–12.—Gross domestic product (GDP) by industry, value added, in current dollars and as a percentage of GDP, 1987–2003—continued
[Billions of dollars; except as noted]
Year
Private industries—continued
Govern- ment
Private goods- produc-
ing indus- tries 1
Private services- produc-
ing indus- tries 2
Trans- por- ta- tion and
ware- hous-
ing
Infor- ma- tion
Finance, insur- ance, real
estate, rental,
and leasing
Pro- fes- sion-
al and busi- ness serv- ices
Educa- tional
services, health care, and
social assis- tance
Arts, enter-
tainment, recrea-
tion, accom-
modation, and food
services
Other services, except govern-
ment
Value added
1987 ......................................................... 151.1 185.0 840.3 414.1 286.5 152.1 112.3 659.1 1,180.8 2,899.5 1988 ......................................................... 161.1 194.0 910.1 466.3 309.1 165.9 124.4 704.7 1,261.3 3,137.8 1989 ......................................................... 164.1 210.4 975.4 518.0 347.0 180.2 133.9 752.0 1,341.0 3,391.4
1990 ......................................................... 169.4 225.1 1,042.1 569.8 386.7 195.2 142.6 805.3 1,377.4 3,620.4 1991 ......................................................... 178.2 235.2 1,103.6 579.3 424.8 202.2 144.2 857.2 1,352.8 3,785.9 1992 ......................................................... 186.6 250.9 1,177.4 626.7 463.5 216.2 153.0 897.3 1,400.0 4,040.5 1993 ......................................................... 201.0 272.6 1,241.5 659.1 488.0 225.5 163.7 928.1 1,453.4 4,275.9 1994 ......................................................... 218.0 294.0 1,297.8 698.4 511.1 235.0 173.2 961.8 1,572.4 4,538.0 1995 ......................................................... 226.3 307.6 1,383.0 743.1 533.3 248.3 180.9 990.4 1,631.4 4,775.8 1996 ......................................................... 235.2 335.7 1,470.7 810.1 552.5 264.4 188.1 1,021.6 1,722.4 5,072.8 1997 ......................................................... 253.7 347.8 1,593.3 896.5 573.1 289.8 197.4 1,056.8 1,820.8 5,426.8 1998 ......................................................... 273.7 381.6 1,684.6 976.2 601.5 306.0 211.1 1,094.5 1,895.4 5,757.1 1999 ......................................................... 287.4 439.3 1,798.4 1,064.5 634.5 327.8 217.8 1,141.2 1,958.9 6,168.3
2000 ......................................................... 301.6 458.3 1,931.0 1,140.8 678.4 350.1 229.1 1,202.7 2,081.5 6,532.8 2001 ......................................................... 296.9 476.9 2,059.2 1,165.9 739.3 361.5 241.5 1,258.3 2,027.5 6,842.2 2002 ......................................................... 304.4 470.0 2,148.2 1,190.0 799.0 382.3 252.1 1,332.9 2,028.1 7,126.0 2003 ......................................................... 319.3 493.8 2,250.3 1,244.3 851.2 396.4 263.0 1,399.9 2,147.8 7,456.3
Industry value added as a percentage of GDP (percent)
1987 ......................................................... 3.2 3.9 17.7 8.7 6.0 3.2 2.4 13.9 24.9 61.2 1988 ......................................................... 3.2 3.8 17.8 9.1 6.1 3.3 2.4 13.8 24.7 61.5 1989 ......................................................... 3.0 3.8 17.8 9.4 6.3 3.3 2.4 13.7 24.5 61.8
1990 ......................................................... 2.9 3.9 18.0 9.8 6.7 3.4 2.5 13.9 23.7 62.4 1991 ......................................................... 3.0 3.9 18.4 9.7 7.1 3.4 2.4 14.3 22.6 63.1 1992 ......................................................... 2.9 4.0 18.6 9.9 7.3 3.4 2.4 14.2 22.1 63.8 1993 ......................................................... 3.0 4.1 18.6 9.9 7.3 3.4 2.5 13.9 21.8 64.2 1994 ......................................................... 3.1 4.2 18.4 9.9 7.2 3.3 2.4 13.6 22.2 64.2 1995 ......................................................... 3.1 4.2 18.7 10.0 7.2 3.4 2.4 13.4 22.1 64.6 1996 ......................................................... 3.0 4.3 18.8 10.4 7.1 3.4 2.4 13.1 22.0 64.9 1997 ......................................................... 3.1 4.2 19.2 10.8 6.9 3.5 2.4 12.7 21.9 65.3 1998 ......................................................... 3.1 4.4 19.3 11.2 6.9 3.5 2.4 12.5 21.7 65.8 1999 ......................................................... 3.1 4.7 19.4 11.5 6.8 3.5 2.3 12.3 21.1 66.6
2000 ......................................................... 3.1 4.7 19.7 11.6 6.9 3.6 2.3 12.3 21.2 66.5 2001 ......................................................... 2.9 4.7 20.3 11.5 7.3 3.6 2.4 12.4 20.0 67.6 2002 ......................................................... 2.9 4.5 20.5 11.3 7.6 3.6 2.4 12.7 19.3 68.0 2003 ......................................................... 2.9 4.5 20.4 11.3 7.7 3.6 2.4 12.7 19.5 67.8
Note (cont’d).—Value added industry data shown in Tables B–12 and B–13 are based on the 1997 North American Industry Classification System (NAICS). GDP by industry data based on the Standard Industrial Classification (SIC) have been updated in line with the national in-come and product accounts (NIPA) benchmark revisions released in December 2003. Revised SIC-based estimates are available from the De-partment of Commerce, Bureau of Economic Analysis, for current-dollar value added by industry for 1947–97 and for real value added for 1977–97.
For further details, see Survey of Current Business, November 2004. Source: Department of Commerce, Bureau of Economic Analysis.
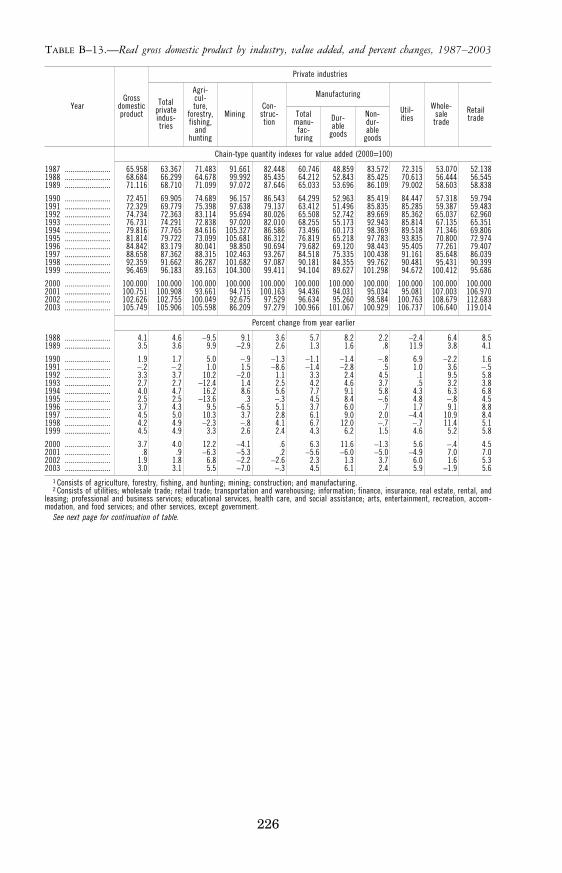
226
TABLE B–13.—Real gross domestic product by industry, value added, and percent changes, 1987–2003
Year Gross
domestic product
Private industries
Total private indus- tries
Agri- cul- ture,
forestry, fishing,
and hunting
Mining Con-
struc- tion
Manufacturing
Util- ities
Whole- sale trade
Retail trade Total
manu- fac-
turing
Dur- able
goods
Non- dur- able
goods
Chain-type quantity indexes for value added (2000=100)
1987 ........................ 65.958 63.367 71.483 91.661 82.448 60.746 48.859 83.572 72.315 53.070 52.138 1988 ........................ 68.684 66.299 64.678 99.992 85.435 64.212 52.843 85.425 70.613 56.444 56.545 1989 ........................ 71.116 68.710 71.099 97.072 87.646 65.033 53.696 86.109 79.002 58.603 58.838
1990 ........................ 72.451 69.905 74.689 96.157 86.543 64.299 52.963 85.419 84.447 57.318 59.794 1991 ........................ 72.329 69.779 75.398 97.638 79.137 63.412 51.496 85.835 85.285 59.387 59.483 1992 ........................ 74.734 72.363 83.114 95.694 80.026 65.508 52.742 89.669 85.362 65.037 62.960 1993 ........................ 76.731 74.291 72.838 97.020 82.010 68.255 55.173 92.943 85.814 67.135 65.351 1994 ........................ 79.816 77.765 84.616 105.327 86.586 73.496 60.173 98.369 89.518 71.346 69.806 1995 ........................ 81.814 79.722 73.099 105.681 86.312 76.819 65.218 97.783 93.835 70.800 72.974 1996 ........................ 84.842 83.179 80.041 98.850 90.694 79.682 69.120 98.443 95.405 77.261 79.407 1997 ........................ 88.658 87.362 88.315 102.463 93.267 84.518 75.335 100.438 91.161 85.648 86.039 1998 ........................ 92.359 91.662 86.287 101.682 97.087 90.181 84.355 99.762 90.481 95.431 90.399 1999 ........................ 96.469 96.183 89.163 104.300 99.411 94.104 89.627 101.298 94.672 100.412 95.686
2000 ........................ 100.000 100.000 100.000 100.000 100.000 100.000 100.000 100.000 100.000 100.000 100.000 2001 ........................ 100.751 100.908 93.661 94.715 100.163 94.436 94.031 95.034 95.081 107.003 106.970 2002 ........................ 102.626 102.755 100.049 92.675 97.529 96.634 95.260 98.584 100.763 108.679 112.683 2003 ........................ 105.749 105.906 105.598 86.209 97.279 100.966 101.067 100.929 106.737 106.640 119.014
Percent change from year earlier
1988 ........................ 4.1 4.6 −9.5 9.1 3.6 5.7 8.2 2.2 −2.4 6.4 8.5 1989 ........................ 3.5 3.6 9.9 −2.9 2.6 1.3 1.6 .8 11.9 3.8 4.1
1990 ........................ 1.9 1.7 5.0 −.9 −1.3 −1.1 −1.4 −.8 6.9 −2.2 1.6 1991 ........................ −.2 −.2 1.0 1.5 −8.6 −1.4 −2.8 .5 1.0 3.6 −.5 1992 ........................ 3.3 3.7 10.2 −2.0 1.1 3.3 2.4 4.5 .1 9.5 5.8 1993 ........................ 2.7 2.7 −12.4 1.4 2.5 4.2 4.6 3.7 .5 3.2 3.8 1994 ........................ 4.0 4.7 16.2 8.6 5.6 7.7 9.1 5.8 4.3 6.3 6.8 1995 ........................ 2.5 2.5 −13.6 .3 −.3 4.5 8.4 −.6 4.8 −.8 4.5 1996 ........................ 3.7 4.3 9.5 −6.5 5.1 3.7 6.0 .7 1.7 9.1 8.8 1997 ........................ 4.5 5.0 10.3 3.7 2.8 6.1 9.0 2.0 −4.4 10.9 8.4 1998 ........................ 4.2 4.9 −2.3 −.8 4.1 6.7 12.0 −.7 −.7 11.4 5.1 1999 ........................ 4.5 4.9 3.3 2.6 2.4 4.3 6.2 1.5 4.6 5.2 5.8
2000 ........................ 3.7 4.0 12.2 −4.1 .6 6.3 11.6 −1.3 5.6 −.4 4.5 2001 ........................ .8 .9 −6.3 −5.3 .2 −5.6 −6.0 −5.0 −4.9 7.0 7.0 2002 ........................ 1.9 1.8 6.8 −2.2 −2.6 2.3 1.3 3.7 6.0 1.6 5.3 2003 ........................ 3.0 3.1 5.5 −7.0 −.3 4.5 6.1 2.4 5.9 −1.9 5.6
1 Consists of agriculture, forestry, fishing, and hunting; mining; construction; and manufacturing. 2 Consists of utilities; wholesale trade; retail trade; transportation and warehousing; information; finance, insurance, real estate, rental, and
leasing; professional and business services; educational services, health care, and social assistance; arts, entertainment, recreation, accom-modation, and food services; and other services, except government.
See next page for continuation of table.
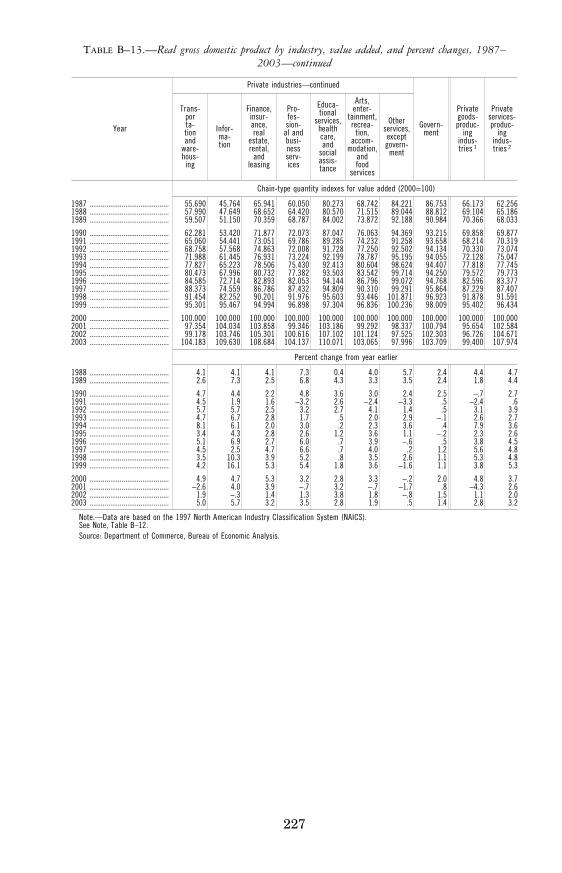
227
TABLE B–13.—Real gross domestic product by industry, value added, and percent changes, 1987– 2003—continued
Year
Private industries—continued
Govern- ment
Private goods- produc-
ing indus- tries 1
Private services- produc-
ing indus- tries 2
Trans- por ta- tion and
ware- hous-
ing
Infor- ma- tion
Finance, insur- ance, real
estate, rental,
and leasing
Pro- fes- sion-
al and busi- ness serv- ices
Educa- tional
services, health care, and
social assis- tance
Arts, enter-
tainment, recrea-
tion, accom-
modation, and food
services
Other services, except govern-
ment
Chain-type quantity indexes for value added (2000=100)
1987 .......................................... 55.690 45.764 65.941 60.050 80.273 68.742 84.221 86.753 66.173 62.256 1988 .......................................... 57.990 47.649 68.652 64.420 80.570 71.515 89.044 88.812 69.104 65.186 1989 .......................................... 59.507 51.150 70.359 68.787 84.002 73.872 92.188 90.984 70.366 68.033
1990 .......................................... 62.281 53.420 71.877 72.073 87.047 76.063 94.369 93.215 69.858 69.877 1991 .......................................... 65.060 54.441 73.051 69.786 89.285 74.232 91.258 93.658 68.214 70.319 1992 .......................................... 68.758 57.568 74.863 72.008 91.728 77.250 92.502 94.134 70.330 73.074 1993 .......................................... 71.988 61.445 76.931 73.224 92.199 78.787 95.195 94.055 72.128 75.047 1994 .......................................... 77.827 65.223 78.506 75.430 92.413 80.604 98.624 94.407 77.818 77.745 1995 .......................................... 80.473 67.996 80.732 77.382 93.503 83.542 99.714 94.250 79.572 79.773 1996 .......................................... 84.585 72.714 82.893 82.053 94.144 86.796 99.072 94.768 82.596 83.377 1997 .......................................... 88.373 74.559 86.786 87.432 94.809 90.310 99.291 95.864 87.229 87.407 1998 .......................................... 91.454 82.252 90.201 91.976 95.603 93.446 101.871 96.923 91.878 91.591 1999 .......................................... 95.301 95.467 94.994 96.898 97.304 96.836 100.236 98.009 95.402 96.434
2000 .......................................... 100.000 100.000 100.000 100.000 100.000 100.000 100.000 100.000 100.000 100.000 2001 .......................................... 97.354 104.034 103.858 99.346 103.186 99.292 98.337 100.794 95.654 102.584 2002 .......................................... 99.178 103.746 105.301 100.616 107.102 101.124 97.525 102.303 96.726 104.671 2003 .......................................... 104.183 109.630 108.684 104.137 110.071 103.065 97.996 103.709 99.400 107.974
Percent change from year earlier
1988 .......................................... 4.1 4.1 4.1 7.3 0.4 4.0 5.7 2.4 4.4 4.7 1989 .......................................... 2.6 7.3 2.5 6.8 4.3 3.3 3.5 2.4 1.8 4.4
1990 .......................................... 4.7 4.4 2.2 4.8 3.6 3.0 2.4 2.5 −.7 2.7 1991 .......................................... 4.5 1.9 1.6 −3.2 2.6 −2.4 −3.3 .5 −2.4 .6 1992 .......................................... 5.7 5.7 2.5 3.2 2.7 4.1 1.4 .5 3.1 3.9 1993 .......................................... 4.7 6.7 2.8 1.7 .5 2.0 2.9 −.1 2.6 2.7 1994 .......................................... 8.1 6.1 2.0 3.0 .2 2.3 3.6 .4 7.9 3.6 1995 .......................................... 3.4 4.3 2.8 2.6 1.2 3.6 1.1 −.2 2.3 2.6 1996 .......................................... 5.1 6.9 2.7 6.0 .7 3.9 −.6 .5 3.8 4.5 1997 .......................................... 4.5 2.5 4.7 6.6 .7 4.0 .2 1.2 5.6 4.8 1998 .......................................... 3.5 10.3 3.9 5.2 .8 3.5 2.6 1.1 5.3 4.8 1999 .......................................... 4.2 16.1 5.3 5.4 1.8 3.6 −1.6 1.1 3.8 5.3
2000 .......................................... 4.9 4.7 5.3 3.2 2.8 3.3 −.2 2.0 4.8 3.7 2001 .......................................... −2.6 4.0 3.9 −.7 3.2 −.7 −1.7 .8 −4.3 2.6 2002 .......................................... 1.9 −.3 1.4 1.3 3.8 1.8 −.8 1.5 1.1 2.0 2003 .......................................... 5.0 5.7 3.2 3.5 2.8 1.9 .5 1.4 2.8 3.2
Note.—Data are based on the 1997 North American Industry Classification System (NAICS). See Note, Table B–12. Source: Department of Commerce, Bureau of Economic Analysis.
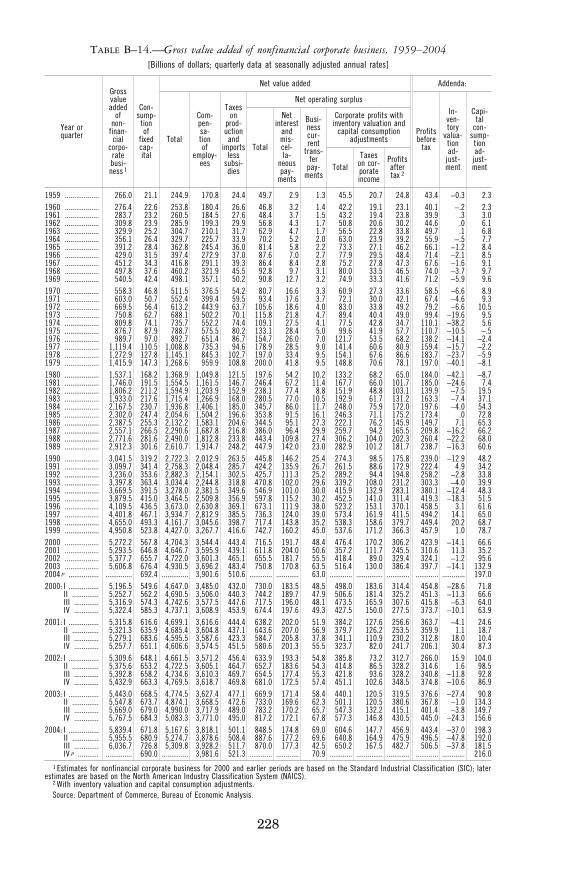
228
TABLE B–14.—Gross value added of nonfinancial corporate business, 1959–2004 [Billions of dollars; quarterly data at seasonally adjusted annual rates]
Year or quarter
Gross value added
of non-
finan- cial
corpo- rate busi- ness 1
Con- sump-
tion of
fixed cap- ital
Net value added Addenda:
Total
Com- pen- sa- tion of
employ- ees
Taxes on
prod- uction and
imports less
subsi- dies
Net operating surplus
Profits before
tax
In- ven- tory
valua- tion ad-
just- ment
Capi- tal
con- sump-
tion ad-
just- ment
Total
Net interest
and mis- cel- la-
neous pay-
ments
Busi- ness cur- rent
trans- fer
pay- ments
Corporate profits with inventory valuation and
capital consumption adjustments
Total Taxes
on cor- porate income
Profits after tax 2
1959 .................. 266.0 21.1 244.9 170.8 24.4 49.7 2.9 1.3 45.5 20.7 24.8 43.4 −0.3 2.3 1960 .................. 276.4 22.6 253.8 180.4 26.6 46.8 3.2 1.4 42.2 19.1 23.1 40.1 −.2 2.3 1961 .................. 283.7 23.2 260.5 184.5 27.6 48.4 3.7 1.5 43.2 19.4 23.8 39.9 .3 3.0 1962 .................. 309.8 23.9 285.9 199.3 29.9 56.8 4.3 1.7 50.8 20.6 30.2 44.6 .0 6.1 1963 .................. 329.9 25.2 304.7 210.1 31.7 62.9 4.7 1.7 56.5 22.8 33.8 49.7 .1 6.8 1964 .................. 356.1 26.4 329.7 225.7 33.9 70.2 5.2 2.0 63.0 23.9 39.2 55.9 −.5 7.7 1965 .................. 391.2 28.4 362.8 245.4 36.0 81.4 5.8 2.2 73.3 27.1 46.2 66.1 −1.2 8.4 1966 .................. 429.0 31.5 397.4 272.9 37.0 87.6 7.0 2.7 77.9 29.5 48.4 71.4 −2.1 8.5 1967 .................. 451.2 34.3 416.8 291.1 39.3 86.4 8.4 2.8 75.2 27.8 47.3 67.6 −1.6 9.1 1968 .................. 497.8 37.6 460.2 321.9 45.5 92.8 9.7 3.1 80.0 33.5 46.5 74.0 −3.7 9.7 1969 .................. 540.5 42.4 498.1 357.1 50.2 90.8 12.7 3.2 74.9 33.3 41.6 71.2 −5.9 9.6 1970 .................. 558.3 46.8 511.5 376.5 54.2 80.7 16.6 3.3 60.9 27.3 33.6 58.5 −6.6 8.9 1971 .................. 603.0 50.7 552.4 399.4 59.5 93.4 17.6 3.7 72.1 30.0 42.1 67.4 −4.6 9.3 1972 .................. 669.5 56.4 613.2 443.9 63.7 105.6 18.6 4.0 83.0 33.8 49.2 79.2 −6.6 10.5 1973 .................. 750.8 62.7 688.1 502.2 70.1 115.8 21.8 4.7 89.4 40.4 49.0 99.4 −19.6 9.5 1974 .................. 809.8 74.1 735.7 552.2 74.4 109.1 27.5 4.1 77.5 42.8 34.7 110.1 −38.2 5.6 1975 .................. 876.7 87.9 788.7 575.5 80.2 133.1 28.4 5.0 99.6 41.9 57.7 110.7 −10.5 −.5 1976 .................. 989.7 97.0 892.7 651.4 86.7 154.7 26.0 7.0 121.7 53.5 68.2 138.2 −14.1 −2.4 1977 .................. 1,119.4 110.5 1,008.8 735.3 94.6 178.9 28.5 9.0 141.4 60.6 80.9 159.4 −15.7 −2.2 1978 .................. 1,272.9 127.8 1,145.1 845.3 102.7 197.0 33.4 9.5 154.1 67.6 86.6 183.7 −23.7 −5.9 1979 .................. 1,415.9 147.3 1,268.6 959.9 108.8 200.0 41.8 9.5 148.8 70.6 78.1 197.0 −40.1 −8.1 1980 .................. 1,537.1 168.2 1,368.9 1,049.8 121.5 197.6 54.2 10.2 133.2 68.2 65.0 184.0 −42.1 −8.7 1981 .................. 1,746.0 191.5 1,554.5 1,161.5 146.7 246.4 67.2 11.4 167.7 66.0 101.7 185.0 −24.6 7.4 1982 .................. 1,806.2 211.2 1,594.9 1,203.9 152.9 238.1 77.4 8.8 151.9 48.8 103.1 139.9 −7.5 19.5 1983 .................. 1,933.0 217.6 1,715.4 1,266.9 168.0 280.5 77.0 10.5 192.9 61.7 131.2 163.3 −7.4 37.1 1984 .................. 2,167.5 230.7 1,936.8 1,406.1 185.0 345.7 86.0 11.7 248.0 75.9 172.0 197.6 −4.0 54.3 1985 .................. 2,302.0 247.4 2,054.6 1,504.2 196.6 353.8 91.5 16.1 246.3 71.1 175.2 173.4 .0 72.8 1986 .................. 2,387.5 255.3 2,132.2 1,583.1 204.6 344.5 95.1 27.3 222.1 76.2 145.9 149.7 7.1 65.3 1987 .................. 2,557.1 266.5 2,290.6 1,687.8 216.8 386.0 96.4 29.9 259.7 94.2 165.5 209.8 −16.2 66.2 1988 .................. 2,771.6 281.6 2,490.0 1,812.8 233.8 443.4 109.8 27.4 306.2 104.0 202.3 260.4 −22.2 68.0 1989 .................. 2,912.3 301.6 2,610.7 1,914.7 248.2 447.9 142.0 23.0 282.9 101.2 181.7 238.7 −16.3 60.6 1990 .................. 3,041.5 319.2 2,722.3 2,012.9 263.5 445.8 146.2 25.4 274.3 98.5 175.8 239.0 −12.9 48.2 1991 .................. 3,099.7 341.4 2,758.3 2,048.4 285.7 424.2 135.9 26.7 261.5 88.6 172.9 222.4 4.9 34.2 1992 .................. 3,236.0 353.6 2,882.3 2,154.1 302.5 425.7 111.3 25.2 289.2 94.4 194.8 258.2 −2.8 33.8 1993 .................. 3,397.8 363.4 3,034.4 2,244.8 318.8 470.8 102.0 29.6 339.2 108.0 231.2 303.3 −4.0 39.9 1994 .................. 3,669.5 391.5 3,278.0 2,381.5 349.6 546.9 101.0 30.0 415.9 132.9 283.1 380.1 −12.4 48.3 1995 .................. 3,879.5 415.0 3,464.5 2,509.8 356.9 597.8 115.2 30.2 452.5 141.0 311.4 419.3 −18.3 51.5 1996 .................. 4,109.5 436.5 3,673.0 2,630.8 369.1 673.1 111.9 38.0 523.2 153.1 370.1 458.5 3.1 61.6 1997 .................. 4,401.8 467.1 3,934.7 2,812.9 385.5 736.3 124.0 39.0 573.4 161.9 411.5 494.2 14.1 65.0 1998 .................. 4,655.0 493.3 4,161.7 3,045.6 398.7 717.4 143.8 35.2 538.3 158.6 379.7 449.4 20.2 68.7 1999 .................. 4,950.8 523.8 4,427.0 3,267.7 416.6 742.7 160.2 45.0 537.6 171.2 366.3 457.9 1.0 78.7 2000 .................. 5,272.2 567.8 4,704.3 3,544.4 443.4 716.5 191.7 48.4 476.4 170.2 306.2 423.9 −14.1 66.6 2001 .................. 5,293.5 646.8 4,646.7 3,595.9 439.1 611.8 204.0 50.6 357.2 111.7 245.5 310.6 11.3 35.2 2002 .................. 5,377.7 655.7 4,722.0 3,601.3 465.1 655.5 181.7 55.5 418.4 89.0 329.4 324.1 −1.2 95.6 2003 .................. 5,606.8 676.4 4,930.5 3,696.2 483.4 750.8 170.8 63.5 516.4 130.0 386.4 397.7 −14.1 132.9 2004 p ................ .............. 692.4 .............. 3,901.6 510.6 ............ ............ 63.0 ............ .............. ............ ............ ............ 197.0 2000: I ................ 5,196.5 549.6 4,647.0 3,485.0 432.0 730.0 183.5 48.5 498.0 183.6 314.4 454.8 −28.6 71.8
II .............. 5,252.7 562.2 4,690.5 3,506.0 440.3 744.2 189.7 47.9 506.6 181.4 325.2 451.3 −11.3 66.6 III ............. 5,316.9 574.3 4,742.6 3,577.5 447.6 717.5 196.0 48.1 473.5 165.9 307.6 415.8 −6.3 64.0 IV ............. 5,322.4 585.3 4,737.1 3,608.9 453.9 674.4 197.6 49.3 427.5 150.0 277.5 373.7 −10.1 63.9
2001: I ................ 5,315.8 616.6 4,699.1 3,616.6 444.4 638.2 202.0 51.9 384.2 127.6 256.6 363.7 −4.1 24.6 II .............. 5,321.3 635.9 4,685.4 3,604.8 437.1 643.6 207.0 56.9 379.7 126.2 253.5 359.9 1.1 18.7 III ............. 5,279.1 683.6 4,595.5 3,587.6 423.3 584.7 205.8 37.8 341.1 110.9 230.2 312.8 18.0 10.4 IV ............. 5,257.7 651.1 4,606.6 3,574.5 451.5 580.6 201.3 55.5 323.7 82.0 241.7 206.1 30.4 87.3
2002: I ................ 5,309.6 648.1 4,661.5 3,571.2 456.4 633.9 193.3 54.8 385.8 73.2 312.7 266.0 15.9 104.0 II .............. 5,375.6 653.2 4,722.5 3,605.1 464.7 652.7 183.6 54.3 414.8 86.5 328.2 314.6 1.6 98.5 III ............. 5,392.8 658.2 4,734.6 3,610.3 469.7 654.5 177.4 55.3 421.8 93.6 328.2 340.8 −11.8 92.8 IV ............. 5,432.9 663.3 4,769.5 3,618.7 469.8 681.0 172.5 57.4 451.1 102.6 348.5 374.8 −10.6 86.9
2003: I ................ 5,443.0 668.5 4,774.5 3,627.4 477.1 669.9 171.4 58.4 440.1 120.5 319.5 376.6 −27.4 90.8 II .............. 5,547.8 673.7 4,874.1 3,668.5 472.6 733.0 169.6 62.3 501.1 120.5 380.6 367.8 −1.0 134.3 III ............. 5,669.0 679.0 4,990.0 3,717.9 489.0 783.2 170.2 65.7 547.3 132.2 415.1 401.4 −3.8 149.7 IV ............. 5,767.5 684.3 5,083.3 3,771.0 495.0 817.2 172.1 67.8 577.3 146.8 430.5 445.0 −24.3 156.6
2004: I ................ 5,839.4 671.8 5,167.6 3,818.1 501.1 848.5 174.8 69.0 604.6 147.7 456.9 443.4 −37.0 198.3 II .............. 5,955.5 680.9 5,274.7 3,878.6 508.4 887.6 177.2 69.6 640.8 164.9 475.9 496.5 −47.8 192.0 III ............. 6,036.7 726.8 5,309.8 3,928.2 511.7 870.0 177.3 42.5 650.2 167.5 482.7 506.5 −37.8 181.5 IV p ........... .............. 690.0 .............. 3,981.6 521.3 ............ ............ 70.9 ............ .............. ............ ............ ............ 216.0
1 Estimates for nonfinancial corporate business for 2000 and earlier periods are based on the Standard Industrial Classification (SIC); later estimates are based on the North American Industry Classification System (NAICS).
2 With inventory valuation and capital consumption adjustments. Source: Department of Commerce, Bureau of Economic Analysis.
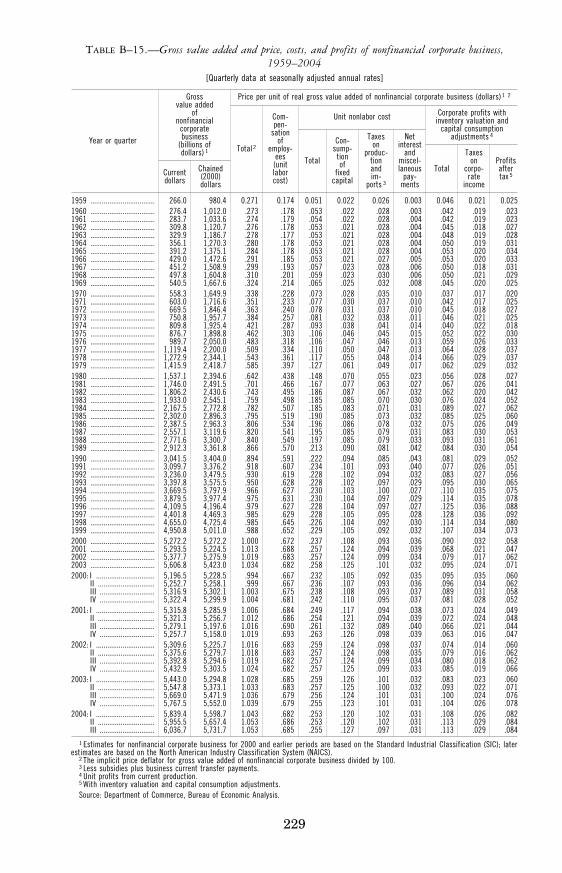
229
TABLE B–15.—Gross value added and price, costs, and profits of nonfinancial corporate business, 1959–2004
[Quarterly data at seasonally adjusted annual rates]
Year or quarter
Gross value added
of nonfinancial
corporate business
(billions of dollars) 1
Price per unit of real gross value added of nonfinancial corporate business (dollars) 1 2
Current dollars
Chained (2000) dollars
Total 2
Com- pen-
sation of
employ- ees
(unit labor cost)
Unit nonlabor cost Corporate profits with inventory valuation and
capital consumption adjustments 4
Total
Con- sump-
tion of
fixed capital
Taxes on
produc- tion and im-
ports 3
Net interest
and miscel- laneous
pay- ments
Total
Taxes on
corpo- rate
income
Profits after tax 5
1959 .................................. 266.0 980.4 0.271 0.174 0.051 0.022 0.026 0.003 0.046 0.021 0.025 1960 .................................. 276.4 1,012.0 .273 .178 .053 .022 .028 .003 .042 .019 .023 1961 .................................. 283.7 1,033.6 .274 .179 .054 .022 .028 .004 .042 .019 .023 1962 .................................. 309.8 1,120.7 .276 .178 .053 .021 .028 .004 .045 .018 .027 1963 .................................. 329.9 1,186.7 .278 .177 .053 .021 .028 .004 .048 .019 .028 1964 .................................. 356.1 1,270.3 .280 .178 .053 .021 .028 .004 .050 .019 .031 1965 .................................. 391.2 1,375.1 .284 .178 .053 .021 .028 .004 .053 .020 .034 1966 .................................. 429.0 1,472.6 .291 .185 .053 .021 .027 .005 .053 .020 .033 1967 .................................. 451.2 1,508.9 .299 .193 .057 .023 .028 .006 .050 .018 .031 1968 .................................. 497.8 1,604.8 .310 .201 .059 .023 .030 .006 .050 .021 .029 1969 .................................. 540.5 1,667.6 .324 .214 .065 .025 .032 .008 .045 .020 .025 1970 .................................. 558.3 1,649.9 .338 .228 .073 .028 .035 .010 .037 .017 .020 1971 .................................. 603.0 1,716.6 .351 .233 .077 .030 .037 .010 .042 .017 .025 1972 .................................. 669.5 1,846.4 .363 .240 .078 .031 .037 .010 .045 .018 .027 1973 .................................. 750.8 1,957.7 .384 .257 .081 .032 .038 .011 .046 .021 .025 1974 .................................. 809.8 1,925.4 .421 .287 .093 .038 .041 .014 .040 .022 .018 1975 .................................. 876.7 1,898.8 .462 .303 .106 .046 .045 .015 .052 .022 .030 1976 .................................. 989.7 2,050.0 .483 .318 .106 .047 .046 .013 .059 .026 .033 1977 .................................. 1,119.4 2,200.0 .509 .334 .110 .050 .047 .013 .064 .028 .037 1978 .................................. 1,272.9 2,344.1 .543 .361 .117 .055 .048 .014 .066 .029 .037 1979 .................................. 1,415.9 2,418.7 .585 .397 .127 .061 .049 .017 .062 .029 .032 1980 .................................. 1,537.1 2,394.6 .642 .438 .148 .070 .055 .023 .056 .028 .027 1981 .................................. 1,746.0 2,491.5 .701 .466 .167 .077 .063 .027 .067 .026 .041 1982 .................................. 1,806.2 2,430.6 .743 .495 .186 .087 .067 .032 .062 .020 .042 1983 .................................. 1,933.0 2,545.1 .759 .498 .185 .085 .070 .030 .076 .024 .052 1984 .................................. 2,167.5 2,772.8 .782 .507 .185 .083 .071 .031 .089 .027 .062 1985 .................................. 2,302.0 2,896.3 .795 .519 .190 .085 .073 .032 .085 .025 .060 1986 .................................. 2,387.5 2,963.3 .806 .534 .196 .086 .078 .032 .075 .026 .049 1987 .................................. 2,557.1 3,119.6 .820 .541 .195 .085 .079 .031 .083 .030 .053 1988 .................................. 2,771.6 3,300.7 .840 .549 .197 .085 .079 .033 .093 .031 .061 1989 .................................. 2,912.3 3,361.8 .866 .570 .213 .090 .081 .042 .084 .030 .054 1990 .................................. 3,041.5 3,404.0 .894 .591 .222 .094 .085 .043 .081 .029 .052 1991 .................................. 3,099.7 3,376.2 .918 .607 .234 .101 .093 .040 .077 .026 .051 1992 .................................. 3,236.0 3,479.5 .930 .619 .228 .102 .094 .032 .083 .027 .056 1993 .................................. 3,397.8 3,575.5 .950 .628 .228 .102 .097 .029 .095 .030 .065 1994 .................................. 3,669.5 3,797.9 .966 .627 .230 .103 .100 .027 .110 .035 .075 1995 .................................. 3,879.5 3,977.4 .975 .631 .230 .104 .097 .029 .114 .035 .078 1996 .................................. 4,109.5 4,196.4 .979 .627 .228 .104 .097 .027 .125 .036 .088 1997 .................................. 4,401.8 4,469.3 .985 .629 .228 .105 .095 .028 .128 .036 .092 1998 .................................. 4,655.0 4,725.4 .985 .645 .226 .104 .092 .030 .114 .034 .080 1999 .................................. 4,950.8 5,011.0 .988 .652 .229 .105 .092 .032 .107 .034 .073 2000 .................................. 5,272.2 5,272.2 1.000 .672 .237 .108 .093 .036 .090 .032 .058 2001 .................................. 5,293.5 5,224.5 1.013 .688 .257 .124 .094 .039 .068 .021 .047 2002 .................................. 5,377.7 5,275.9 1.019 .683 .257 .124 .099 .034 .079 .017 .062 2003 .................................. 5,606.8 5,423.0 1.034 .682 .258 .125 .101 .032 .095 .024 .071 2000: I ............................... 5,196.5 5,228.5 .994 .667 .232 .105 .092 .035 .095 .035 .060
II .............................. 5,252.7 5,258.1 .999 .667 .236 .107 .093 .036 .096 .034 .062 III ............................. 5,316.9 5,302.1 1.003 .675 .238 .108 .093 .037 .089 .031 .058 IV ............................. 5,322.4 5,299.9 1.004 .681 .242 .110 .095 .037 .081 .028 .052
2001: I ............................... 5,315.8 5,285.9 1.006 .684 .249 .117 .094 .038 .073 .024 .049 II .............................. 5,321.3 5,256.7 1.012 .686 .254 .121 .094 .039 .072 .024 .048 III ............................. 5,279.1 5,197.6 1.016 .690 .261 .132 .089 .040 .066 .021 .044 IV ............................. 5,257.7 5,158.0 1.019 .693 .263 .126 .098 .039 .063 .016 .047
2002: I ............................... 5,309.6 5,225.7 1.016 .683 .259 .124 .098 .037 .074 .014 .060 II .............................. 5,375.6 5,279.7 1.018 .683 .257 .124 .098 .035 .079 .016 .062 III ............................. 5,392.8 5,294.6 1.019 .682 .257 .124 .099 .034 .080 .018 .062 IV ............................. 5,432.9 5,303.5 1.024 .682 .257 .125 .099 .033 .085 .019 .066
2003: I ............................... 5,443.0 5,294.8 1.028 .685 .259 .126 .101 .032 .083 .023 .060 II .............................. 5,547.8 5,373.1 1.033 .683 .257 .125 .100 .032 .093 .022 .071 III ............................. 5,669.0 5,471.9 1.036 .679 .256 .124 .101 .031 .100 .024 .076 IV ............................. 5,767.5 5,552.0 1.039 .679 .255 .123 .101 .031 .104 .026 .078
2004: I ............................... 5,839.4 5,598.7 1.043 .682 .253 .120 .102 .031 .108 .026 .082 II .............................. 5,955.5 5,657.4 1.053 .686 .253 .120 .102 .031 .113 .029 .084 III ............................. 6,036.7 5,731.7 1.053 .685 .255 .127 .097 .031 .113 .029 .084
1 Estimates for nonfinancial corporate business for 2000 and earlier periods are based on the Standard Industrial Classification (SIC); later estimates are based on the North American Industry Classification System (NAICS).
2 The implicit price deflator for gross value added of nonfinancial corporate business divided by 100. 3 Less subsidies plus business current transfer payments. 4 Unit profits from current production. 5 With inventory valuation and capital consumption adjustments. Source: Department of Commerce, Bureau of Economic Analysis.
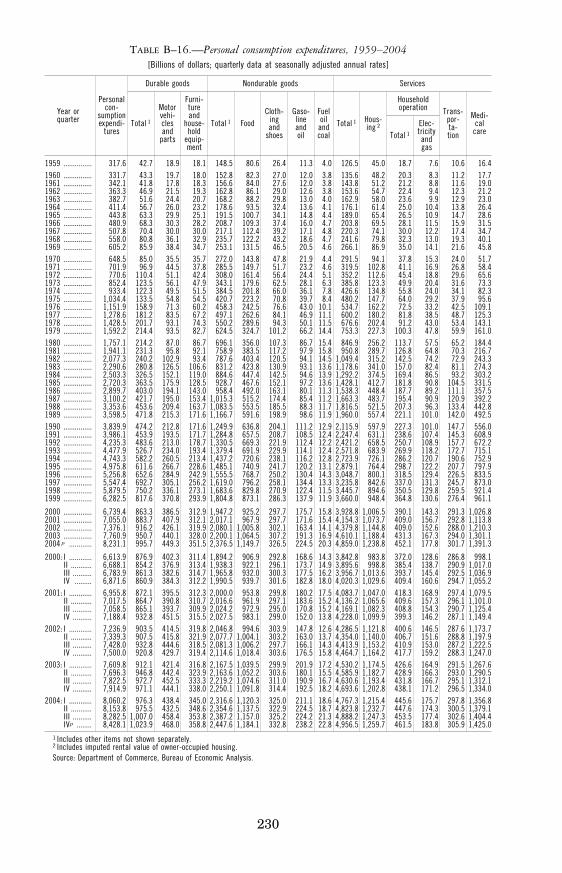
230
TABLE B–16.—Personal consumption expenditures, 1959–2004 [Billions of dollars; quarterly data at seasonally adjusted annual rates]
Year or quarter
Personal con-
sumption expendi-
tures
Durable goods Nondurable goods Services
Total 1
Motor vehi- cles and
parts
Furni- ture and
house- hold
equip- ment
Total 1 Food Cloth-
ing and
shoes
Gaso- line and oil
Fuel oil
and coal
Total 1 Hous- ing 2
Household operation Trans-
por- ta- tion
Medi- cal
care Total 1 Elec- tricity and gas
1959 ............... 317.6 42.7 18.9 18.1 148.5 80.6 26.4 11.3 4.0 126.5 45.0 18.7 7.6 10.6 16.4 1960 ............... 331.7 43.3 19.7 18.0 152.8 82.3 27.0 12.0 3.8 135.6 48.2 20.3 8.3 11.2 17.7 1961 ............... 342.1 41.8 17.8 18.3 156.6 84.0 27.6 12.0 3.8 143.8 51.2 21.2 8.8 11.6 19.0 1962 ............... 363.3 46.9 21.5 19.3 162.8 86.1 29.0 12.6 3.8 153.6 54.7 22.4 9.4 12.3 21.2 1963 ............... 382.7 51.6 24.4 20.7 168.2 88.2 29.8 13.0 4.0 162.9 58.0 23.6 9.9 12.9 23.0 1964 ............... 411.4 56.7 26.0 23.2 178.6 93.5 32.4 13.6 4.1 176.1 61.4 25.0 10.4 13.8 26.4 1965 ............... 443.8 63.3 29.9 25.1 191.5 100.7 34.1 14.8 4.4 189.0 65.4 26.5 10.9 14.7 28.6 1966 ............... 480.9 68.3 30.3 28.2 208.7 109.3 37.4 16.0 4.7 203.8 69.5 28.1 11.5 15.9 31.5 1967 ............... 507.8 70.4 30.0 30.0 217.1 112.4 39.2 17.1 4.8 220.3 74.1 30.0 12.2 17.4 34.7 1968 ............... 558.0 80.8 36.1 32.9 235.7 122.2 43.2 18.6 4.7 241.6 79.8 32.3 13.0 19.3 40.1 1969 ............... 605.2 85.9 38.4 34.7 253.1 131.5 46.5 20.5 4.6 266.1 86.9 35.0 14.1 21.6 45.8 1970 ............... 648.5 85.0 35.5 35.7 272.0 143.8 47.8 21.9 4.4 291.5 94.1 37.8 15.3 24.0 51.7 1971 ............... 701.9 96.9 44.5 37.8 285.5 149.7 51.7 23.2 4.6 319.5 102.8 41.1 16.9 26.8 58.4 1972 ............... 770.6 110.4 51.1 42.4 308.0 161.4 56.4 24.4 5.1 352.2 112.6 45.4 18.8 29.6 65.6 1973 ............... 852.4 123.5 56.1 47.9 343.1 179.6 62.5 28.1 6.3 385.8 123.3 49.9 20.4 31.6 73.3 1974 ............... 933.4 122.3 49.5 51.5 384.5 201.8 66.0 36.1 7.8 426.6 134.8 55.8 24.0 34.1 82.3 1975 ............... 1,034.4 133.5 54.8 54.5 420.7 223.2 70.8 39.7 8.4 480.2 147.7 64.0 29.2 37.9 95.6 1976 ............... 1,151.9 158.9 71.3 60.2 458.3 242.5 76.6 43.0 10.1 534.7 162.2 72.5 33.2 42.5 109.1 1977 ............... 1,278.6 181.2 83.5 67.2 497.1 262.6 84.1 46.9 11.1 600.2 180.2 81.8 38.5 48.7 125.3 1978 ............... 1,428.5 201.7 93.1 74.3 550.2 289.6 94.3 50.1 11.5 676.6 202.4 91.2 43.0 53.4 143.1 1979 ............... 1,592.2 214.4 93.5 82.7 624.5 324.7 101.2 66.2 14.4 753.3 227.3 100.3 47.8 59.9 161.0 1980 ............... 1,757.1 214.2 87.0 86.7 696.1 356.0 107.3 86.7 15.4 846.9 256.2 113.7 57.5 65.2 184.4 1981 ............... 1,941.1 231.3 95.8 92.1 758.9 383.5 117.2 97.9 15.8 950.8 289.7 126.8 64.8 70.3 216.7 1982 ............... 2,077.3 240.2 102.9 93.4 787.6 403.4 120.5 94.1 14.5 1,049.4 315.2 142.5 74.2 72.9 243.3 1983 ............... 2,290.6 280.8 126.5 106.6 831.2 423.8 130.9 93.1 13.6 1,178.6 341.0 157.0 82.4 81.1 274.3 1984 ............... 2,503.3 326.5 152.1 119.0 884.6 447.4 142.5 94.6 13.9 1,292.2 374.5 169.4 86.5 93.2 303.2 1985 ............... 2,720.3 363.5 175.9 128.5 928.7 467.6 152.1 97.2 13.6 1,428.1 412.7 181.8 90.8 104.5 331.5 1986 ............... 2,899.7 403.0 194.1 143.0 958.4 492.0 163.1 80.1 11.3 1,538.3 448.4 187.7 89.2 111.1 357.5 1987 ............... 3,100.2 421.7 195.0 153.4 1,015.3 515.2 174.4 85.4 11.2 1,663.3 483.7 195.4 90.9 120.9 392.2 1988 ............... 3,353.6 453.6 209.4 163.7 1,083.5 553.5 185.5 88.3 11.7 1,816.5 521.5 207.3 96.3 133.4 442.8 1989 ............... 3,598.5 471.8 215.3 171.6 1,166.7 591.6 198.9 98.6 11.9 1,960.0 557.4 221.1 101.0 142.0 492.5 1990 ............... 3,839.9 474.2 212.8 171.6 1,249.9 636.8 204.1 111.2 12.9 2,115.9 597.9 227.3 101.0 147.7 556.0 1991 ............... 3,986.1 453.9 193.5 171.7 1,284.8 657.5 208.7 108.5 12.4 2,247.4 631.1 238.6 107.4 145.3 608.9 1992 ............... 4,235.3 483.6 213.0 178.7 1,330.5 669.3 221.9 112.4 12.2 2,421.2 658.5 250.7 108.9 157.7 672.2 1993 ............... 4,477.9 526.7 234.0 193.4 1,379.4 691.9 229.9 114.1 12.4 2,571.8 683.9 269.9 118.2 172.7 715.1 1994 ............... 4,743.3 582.2 260.5 213.4 1,437.2 720.6 238.1 116.2 12.8 2,723.9 726.1 286.2 120.7 190.6 752.9 1995 ............... 4,975.8 611.6 266.7 228.6 1,485.1 740.9 241.7 120.2 13.1 2,879.1 764.4 298.7 122.2 207.7 797.9 1996 ............... 5,256.8 652.6 284.9 242.9 1,555.5 768.7 250.2 130.4 14.3 3,048.7 800.1 318.5 129.4 226.5 833.5 1997 ............... 5,547.4 692.7 305.1 256.2 1,619.0 796.2 258.1 134.4 13.3 3,235.8 842.6 337.0 131.3 245.7 873.0 1998 ............... 5,879.5 750.2 336.1 273.1 1,683.6 829.8 270.9 122.4 11.5 3,445.7 894.6 350.5 129.8 259.5 921.4 1999 ............... 6,282.5 817.6 370.8 293.9 1,804.8 873.1 286.3 137.9 11.9 3,660.0 948.4 364.8 130.6 276.4 961.1
2000 ............... 6,739.4 863.3 386.5 312.9 1,947.2 925.2 297.7 175.7 15.8 3,928.8 1,006.5 390.1 143.3 291.3 1,026.8 2001 ............... 7,055.0 883.7 407.9 312.1 2,017.1 967.9 297.7 171.6 15.4 4,154.3 1,073.7 409.0 156.7 292.8 1,113.8 2002 ............... 7,376.1 916.2 426.1 319.9 2,080.1 1,005.8 302.1 163.4 14.1 4,379.8 1,144.8 409.0 152.6 288.0 1,210.3 2003 ............... 7,760.9 950.7 440.1 328.0 2,200.1 1,064.5 307.2 191.3 16.9 4,610.1 1,188.4 431.3 167.3 294.0 1,301.1 2004 p ............ 8,231.1 995.7 449.3 351.5 2,376.5 1,149.7 326.5 224.5 20.3 4,859.0 1,238.8 452.1 177.8 301.7 1,391.3
2000: I ............ 6,613.9 876.9 402.3 311.4 1,894.2 906.9 292.8 168.6 14.3 3,842.8 983.8 372.0 128.6 286.8 998.1 II ........... 6,688.1 854.2 376.9 313.4 1,938.3 922.1 296.1 173.7 14.9 3,895.6 998.8 385.4 138.7 290.9 1,017.0 III .......... 6,783.9 861.3 382.6 314.7 1,965.8 932.0 300.3 177.5 16.2 3,956.7 1,013.6 393.7 145.4 292.5 1,036.9 IV ......... 6,871.6 860.9 384.3 312.2 1,990.5 939.7 301.6 182.8 18.0 4,020.3 1,029.6 409.4 160.6 294.7 1,055.2
2001: I ............ 6,955.8 872.1 395.5 312.3 2,000.0 953.8 299.8 180.2 17.5 4,083.7 1,047.0 418.3 168.9 297.4 1,079.5 II ........... 7,017.5 864.7 390.8 310.7 2,016.6 961.9 297.1 183.6 15.2 4,136.2 1,065.6 409.6 157.3 296.1 1,101.0 III .......... 7,058.5 865.1 393.7 309.9 2,024.2 972.9 295.0 170.8 15.2 4,169.1 1,082.3 408.8 154.3 290.7 1,125.4 IV .......... 7,188.4 932.8 451.5 315.5 2,027.5 983.1 299.0 152.0 13.8 4,228.0 1,099.9 399.3 146.2 287.1 1,149.4
2002: I ............ 7,236.9 903.5 414.5 319.8 2,046.8 994.6 303.9 147.8 12.6 4,286.5 1,121.8 400.6 146.5 287.6 1,173.7 II ........... 7,339.3 907.5 415.8 321.9 2,077.7 1,004.1 303.2 163.0 13.7 4,354.0 1,140.0 406.7 151.6 288.8 1,197.9 III .......... 7,428.0 932.8 444.6 318.5 2,081.3 1,006.2 297.7 166.1 14.3 4,413.9 1,153.2 410.9 153.0 287.2 1,222.5 IV .......... 7,500.0 920.8 429.7 319.4 2,114.6 1,018.4 303.6 176.5 15.8 4,464.7 1,164.2 417.7 159.2 288.3 1,247.0
2003: I ............ 7,609.8 912.1 421.4 316.8 2,167.5 1,039.5 299.9 201.9 17.2 4,530.2 1,174.5 426.6 164.9 291.5 1,267.6 II ........... 7,696.3 946.8 442.4 323.9 2,163.6 1,052.2 303.6 180.1 15.5 4,585.9 1,182.7 428.9 166.3 293.0 1,290.5 III .......... 7,822.5 972.7 452.5 333.3 2,219.2 1,074.6 311.0 190.9 16.7 4,630.6 1,193.4 431.8 166.7 295.1 1,312.1 IV .......... 7,914.9 971.1 444.1 338.0 2,250.1 1,091.8 314.4 192.5 18.2 4,693.6 1,202.8 438.1 171.2 296.5 1,334.0
2004: I ............ 8,060.2 976.3 438.4 345.0 2,316.6 1,120.3 325.0 211.1 18.6 4,767.3 1,215.4 445.6 175.7 297.8 1,356.8 II ........... 8,153.8 975.5 432.5 348.6 2,354.6 1,137.5 322.9 224.5 18.7 4,823.8 1,232.7 447.6 174.3 300.5 1,379.1 III .......... 8,282.5 1,007.0 458.4 353.8 2,387.2 1,157.0 325.2 224.2 21.3 4,888.2 1,247.3 453.5 177.4 302.6 1,404.4 IVp ........ 8,428.1 1,023.9 468.0 358.8 2,447.6 1,184.1 332.8 238.2 22.8 4,956.5 1,259.7 461.5 183.8 305.9 1,425.0
1 Includes other items not shown separately. 2 Includes imputed rental value of owner-occupied housing. Source: Department of Commerce, Bureau of Economic Analysis.
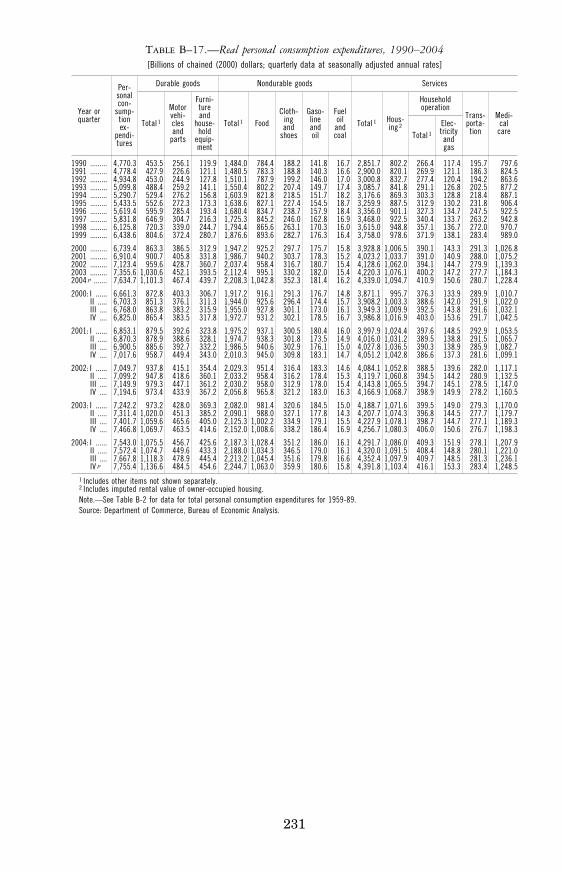
231
TABLE B–17.—Real personal consumption expenditures, 1990–2004 [Billions of chained (2000) dollars; quarterly data at seasonally adjusted annual rates]
Year or quarter
Per- sonal con-
sump- tion ex-
pendi- tures
Durable goods Nondurable goods Services
Total 1
Motor vehi- cles and
parts
Furni- ture and
house- hold
equip- ment
Total 1 Food Cloth-
ing and
shoes
Gaso- line and oil
Fuel oil
and coal
Total 1 Hous- ing 2
Household operation
Trans- porta- tion
Medi- cal
care Total 1 Elec- tricity and gas
1990 ......... 4,770.3 453.5 256.1 119.9 1,484.0 784.4 188.2 141.8 16.7 2,851.7 802.2 266.4 117.4 195.7 797.6 1991 ......... 4,778.4 427.9 226.6 121.1 1,480.5 783.3 188.8 140.3 16.6 2,900.0 820.1 269.9 121.1 186.3 824.5 1992 ......... 4,934.8 453.0 244.9 127.8 1,510.1 787.9 199.2 146.0 17.0 3,000.8 832.7 277.4 120.4 194.2 863.6 1993 ......... 5,099.8 488.4 259.2 141.1 1,550.4 802.2 207.4 149.7 17.4 3,085.7 841.8 291.1 126.8 202.5 877.2 1994 ......... 5,290.7 529.4 276.2 156.8 1,603.9 821.8 218.5 151.7 18.2 3,176.6 869.3 303.3 128.8 218.4 887.1 1995 ......... 5,433.5 552.6 272.3 173.3 1,638.6 827.1 227.4 154.5 18.7 3,259.9 887.5 312.9 130.2 231.8 906.4 1996 ......... 5,619.4 595.9 285.4 193.4 1,680.4 834.7 238.7 157.9 18.4 3,356.0 901.1 327.3 134.7 247.5 922.5 1997 ......... 5,831.8 646.9 304.7 216.3 1,725.3 845.2 246.0 162.8 16.9 3,468.0 922.5 340.4 133.7 263.2 942.8 1998 ......... 6,125.8 720.3 339.0 244.7 1,794.4 865.6 263.1 170.3 16.0 3,615.0 948.8 357.1 136.7 272.0 970.7 1999 ......... 6,438.6 804.6 372.4 280.7 1,876.6 893.6 282.7 176.3 16.4 3,758.0 978.6 371.9 138.1 283.4 989.0
2000 ......... 6,739.4 863.3 386.5 312.9 1,947.2 925.2 297.7 175.7 15.8 3,928.8 1,006.5 390.1 143.3 291.3 1,026.8 2001 ......... 6,910.4 900.7 405.8 331.8 1,986.7 940.2 303.7 178.3 15.2 4,023.2 1,033.7 391.0 140.9 288.0 1,075.2 2002 ......... 7,123.4 959.6 428.7 360.7 2,037.4 958.4 316.7 180.7 15.4 4,128.6 1,062.0 394.1 144.7 279.9 1,139.3 2003 ......... 7,355.6 1,030.6 452.1 393.5 2,112.4 995.1 330.2 182.0 15.4 4,220.3 1,076.1 400.2 147.2 277.7 1,184.3 2004 p ....... 7,634.7 1,101.3 467.4 439.7 2,208.3 1,042.8 352.3 181.4 16.2 4,339.0 1,094.7 410.9 150.6 280.7 1,228.4
2000: I ...... 6,661.3 872.8 403.3 306.7 1,917.2 916.1 291.3 176.7 14.8 3,871.1 995.7 376.3 133.9 289.9 1,010.7 II ..... 6,703.3 851.3 376.1 311.3 1,944.0 925.6 296.4 174.4 15.7 3,908.2 1,003.3 388.6 142.0 291.9 1,022.0 III .... 6,768.0 863.8 383.2 315.9 1,955.0 927.8 301.1 173.0 16.1 3,949.3 1,009.9 392.5 143.8 291.6 1,032.1 IV .... 6,825.0 865.4 383.5 317.8 1,972.7 931.2 302.1 178.5 16.7 3,986.8 1,016.9 403.0 153.6 291.7 1,042.5
2001: I ...... 6,853.1 879.5 392.6 323.8 1,975.2 937.1 300.5 180.4 16.0 3,997.9 1,024.4 397.6 148.5 292.9 1,053.5 II ..... 6,870.3 878.9 388.6 328.1 1,974.7 938.3 301.8 173.5 14.9 4,016.0 1,031.2 389.5 138.8 291.5 1,065.7 III .... 6,900.5 885.6 392.7 332.2 1,986.5 940.6 302.9 176.1 15.0 4,027.8 1,036.5 390.3 138.9 285.9 1,082.7 IV .... 7,017.6 958.7 449.4 343.0 2,010.3 945.0 309.8 183.1 14.7 4,051.2 1,042.8 386.6 137.3 281.6 1,099.1
2002: I ...... 7,049.7 937.8 415.1 354.4 2,029.3 951.4 316.4 183.3 14.6 4,084.1 1,052.8 388.5 139.6 282.0 1,117.1 II ..... 7,099.2 947.8 418.6 360.1 2,033.2 958.4 316.2 178.4 15.3 4,119.7 1,060.8 394.5 144.2 280.9 1,132.5 III .... 7,149.9 979.3 447.1 361.2 2,030.2 958.0 312.9 178.0 15.4 4,143.8 1,065.5 394.7 145.1 278.5 1,147.0 IV .... 7,194.6 973.4 433.9 367.2 2,056.8 965.8 321.2 183.0 16.3 4,166.9 1,068.7 398.9 149.9 278.2 1,160.5
2003: I ...... 7,242.2 973.2 428.0 369.3 2,082.0 981.4 320.6 184.5 15.0 4,188.7 1,071.6 399.5 149.0 279.3 1,170.0 II ..... 7,311.4 1,020.0 451.3 385.2 2,090.1 988.0 327.1 177.8 14.3 4,207.7 1,074.3 396.8 144.5 277.7 1,179.7 III .... 7,401.7 1,059.6 465.6 405.0 2,125.3 1,002.2 334.9 179.1 15.5 4,227.9 1,078.1 398.7 144.7 277.1 1,189.3 IV .... 7,466.8 1,069.7 463.5 414.6 2,152.0 1,008.6 338.2 186.4 16.9 4,256.7 1,080.3 406.0 150.6 276.7 1,198.3
2004: I ...... 7,543.0 1,075.5 456.7 425.6 2,187.3 1,028.4 351.2 186.0 16.1 4,291.7 1,086.0 409.3 151.9 278.1 1,207.9 II ..... 7,572.4 1,074.7 449.6 433.3 2,188.0 1,034.3 346.5 179.0 16.1 4,320.0 1,091.5 408.4 148.8 280.1 1,221.0 III .... 7,667.8 1,118.3 478.9 445.4 2,213.2 1,045.4 351.6 179.8 16.6 4,352.4 1,097.9 409.7 148.5 281.3 1,236.1 IV p 7,755.4 1,136.6 484.5 454.6 2,244.7 1,063.0 359.9 180.6 15.8 4,391.8 1,103.4 416.1 153.3 283.4 1,248.5
1 Includes other items not shown separately. 2 Includes imputed rental value of owner-occupied housing. Note.—See Table B-2 for data for total personal consumption expenditures for 1959-89. Source: Department of Commerce, Bureau of Economic Analysis.
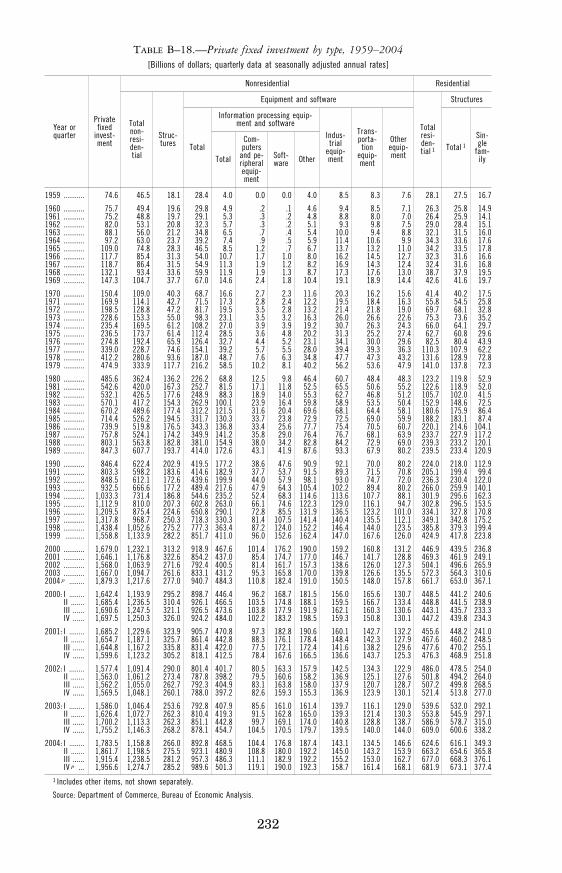
232
TABLE B–18.—Private fixed investment by type, 1959–2004 [Billions of dollars; quarterly data at seasonally adjusted annual rates]
Year or quarter
Private fixed
invest- ment
Nonresidential Residential
Total non- resi- den- tial
Struc- tures
Equipment and software
Total resi- den- tial 1
Structures
Total
Information processing equip-ment and software
Indus- trial
equip- ment
Trans- porta- tion
equip- ment
Other equip- ment
Total 1 Sin-gle
fam-ily Total
Com- puters
and pe- ripheral equip- ment
Soft- ware Other
1959 ........... 74.6 46.5 18.1 28.4 4.0 0.0 0.0 4.0 8.5 8.3 7.6 28.1 27.5 16.7
1960 ........... 75.7 49.4 19.6 29.8 4.9 .2 .1 4.6 9.4 8.5 7.1 26.3 25.8 14.9 1961 ........... 75.2 48.8 19.7 29.1 5.3 .3 .2 4.8 8.8 8.0 7.0 26.4 25.9 14.1 1962 ........... 82.0 53.1 20.8 32.3 5.7 .3 .2 5.1 9.3 9.8 7.5 29.0 28.4 15.1 1963 ........... 88.1 56.0 21.2 34.8 6.5 .7 .4 5.4 10.0 9.4 8.8 32.1 31.5 16.0 1964 ........... 97.2 63.0 23.7 39.2 7.4 .9 .5 5.9 11.4 10.6 9.9 34.3 33.6 17.6 1965 ........... 109.0 74.8 28.3 46.5 8.5 1.2 .7 6.7 13.7 13.2 11.0 34.2 33.5 17.8 1966 ........... 117.7 85.4 31.3 54.0 10.7 1.7 1.0 8.0 16.2 14.5 12.7 32.3 31.6 16.6 1967 ........... 118.7 86.4 31.5 54.9 11.3 1.9 1.2 8.2 16.9 14.3 12.4 32.4 31.6 16.8 1968 ........... 132.1 93.4 33.6 59.9 11.9 1.9 1.3 8.7 17.3 17.6 13.0 38.7 37.9 19.5 1969 ........... 147.3 104.7 37.7 67.0 14.6 2.4 1.8 10.4 19.1 18.9 14.4 42.6 41.6 19.7
1970 ........... 150.4 109.0 40.3 68.7 16.6 2.7 2.3 11.6 20.3 16.2 15.6 41.4 40.2 17.5 1971 ........... 169.9 114.1 42.7 71.5 17.3 2.8 2.4 12.2 19.5 18.4 16.3 55.8 54.5 25.8 1972 ........... 198.5 128.8 47.2 81.7 19.5 3.5 2.8 13.2 21.4 21.8 19.0 69.7 68.1 32.8 1973 ........... 228.6 153.3 55.0 98.3 23.1 3.5 3.2 16.3 26.0 26.6 22.6 75.3 73.6 35.2 1974 ........... 235.4 169.5 61.2 108.2 27.0 3.9 3.9 19.2 30.7 26.3 24.3 66.0 64.1 29.7 1975 ........... 236.5 173.7 61.4 112.4 28.5 3.6 4.8 20.2 31.3 25.2 27.4 62.7 60.8 29.6 1976 ........... 274.8 192.4 65.9 126.4 32.7 4.4 5.2 23.1 34.1 30.0 29.6 82.5 80.4 43.9 1977 ........... 339.0 228.7 74.6 154.1 39.2 5.7 5.5 28.0 39.4 39.3 36.3 110.3 107.9 62.2 1978 ........... 412.2 280.6 93.6 187.0 48.7 7.6 6.3 34.8 47.7 47.3 43.2 131.6 128.9 72.8 1979 ........... 474.9 333.9 117.7 216.2 58.5 10.2 8.1 40.2 56.2 53.6 47.9 141.0 137.8 72.3
1980 ........... 485.6 362.4 136.2 226.2 68.8 12.5 9.8 46.4 60.7 48.4 48.3 123.2 119.8 52.9 1981 ........... 542.6 420.0 167.3 252.7 81.5 17.1 11.8 52.5 65.5 50.6 55.2 122.6 118.9 52.0 1982 ........... 532.1 426.5 177.6 248.9 88.3 18.9 14.0 55.3 62.7 46.8 51.2 105.7 102.0 41.5 1983 ........... 570.1 417.2 154.3 262.9 100.1 23.9 16.4 59.8 58.9 53.5 50.4 152.9 148.6 72.5 1984 ........... 670.2 489.6 177.4 312.2 121.5 31.6 20.4 69.6 68.1 64.4 58.1 180.6 175.9 86.4 1985 ........... 714.4 526.2 194.5 331.7 130.3 33.7 23.8 72.9 72.5 69.0 59.9 188.2 183.1 87.4 1986 ........... 739.9 519.8 176.5 343.3 136.8 33.4 25.6 77.7 75.4 70.5 60.7 220.1 214.6 104.1 1987 ........... 757.8 524.1 174.2 349.9 141.2 35.8 29.0 76.4 76.7 68.1 63.9 233.7 227.9 117.2 1988 ........... 803.1 563.8 182.8 381.0 154.9 38.0 34.2 82.8 84.2 72.9 69.0 239.3 233.2 120.1 1989 ........... 847.3 607.7 193.7 414.0 172.6 43.1 41.9 87.6 93.3 67.9 80.2 239.5 233.4 120.9
1990 ........... 846.4 622.4 202.9 419.5 177.2 38.6 47.6 90.9 92.1 70.0 80.2 224.0 218.0 112.9 1991 ........... 803.3 598.2 183.6 414.6 182.9 37.7 53.7 91.5 89.3 71.5 70.8 205.1 199.4 99.4 1992 ........... 848.5 612.1 172.6 439.6 199.9 44.0 57.9 98.1 93.0 74.7 72.0 236.3 230.4 122.0 1993 ........... 932.5 666.6 177.2 489.4 217.6 47.9 64.3 105.4 102.2 89.4 80.2 266.0 259.9 140.1 1994 ........... 1,033.3 731.4 186.8 544.6 235.2 52.4 68.3 114.6 113.6 107.7 88.1 301.9 295.6 162.3 1995 ........... 1,112.9 810.0 207.3 602.8 263.0 66.1 74.6 122.3 129.0 116.1 94.7 302.8 296.5 153.5 1996 ........... 1,209.5 875.4 224.6 650.8 290.1 72.8 85.5 131.9 136.5 123.2 101.0 334.1 327.8 170.8 1997 ........... 1,317.8 968.7 250.3 718.3 330.3 81.4 107.5 141.4 140.4 135.5 112.1 349.1 342.8 175.2 1998 ........... 1,438.4 1,052.6 275.2 777.3 363.4 87.2 124.0 152.2 146.4 144.0 123.5 385.8 379.3 199.4 1999 .......... 1,558.8 1,133.9 282.2 851.7 411.0 96.0 152.6 162.4 147.0 167.6 126.0 424.9 417.8 223.8
2000 ........... 1,679.0 1,232.1 313.2 918.9 467.6 101.4 176.2 190.0 159.2 160.8 131.2 446.9 439.5 236.8 2001 ........... 1,646.1 1,176.8 322.6 854.2 437.0 85.4 174.7 177.0 146.7 141.7 128.8 469.3 461.9 249.1 2002 ........... 1,568.0 1,063.9 271.6 792.4 400.5 81.4 161.7 157.3 138.6 126.0 127.3 504.1 496.6 265.9 2003 ........... 1,667.0 1,094.7 261.6 833.1 431.2 95.3 165.8 170.0 139.8 126.6 135.5 572.3 564.3 310.6 2004 p ........ 1,879.3 1,217.6 277.0 940.7 484.3 110.8 182.4 191.0 150.5 148.0 157.8 661.7 653.0 367.1
2000: I ........ 1,642.4 1,193.9 295.2 898.7 446.4 96.2 168.7 181.5 156.0 165.6 130.7 448.5 441.2 240.6 II ....... 1,685.4 1,236.5 310.4 926.1 466.5 103.5 174.8 188.1 159.5 166.7 133.4 448.8 441.5 238.9 III ...... 1,690.6 1,247.5 321.1 926.5 473.6 103.8 177.9 191.9 162.1 160.3 130.6 443.1 435.7 233.3 IV ...... 1,697.5 1,250.3 326.0 924.2 484.0 102.2 183.2 198.5 159.3 150.8 130.1 447.2 439.8 234.3
2001: I ........ 1,685.2 1,229.6 323.9 905.7 470.8 97.3 182.8 190.6 160.1 142.7 132.2 455.6 448.2 241.0 II ....... 1,654.7 1,187.1 325.7 861.4 442.8 88.3 176.1 178.4 148.4 142.3 127.9 467.6 460.2 248.5 III ...... 1,644.8 1,167.2 335.8 831.4 422.0 77.5 172.1 172.4 141.6 138.2 129.6 477.6 470.2 255.1 IV ...... 1,599.6 1,123.2 305.2 818.1 412.5 78.4 167.6 166.5 136.6 143.7 125.3 476.3 468.9 251.8
2002: I ........ 1,577.4 1,091.4 290.0 801.4 401.7 80.5 163.3 157.9 142.5 134.3 122.9 486.0 478.5 254.0 II ....... 1,563.0 1,061.2 273.4 787.8 398.2 79.5 160.6 158.2 136.9 125.1 127.6 501.8 494.2 264.0 III ...... 1,562.2 1,055.0 262.7 792.3 404.9 83.1 163.8 158.0 137.9 120.7 128.7 507.2 499.8 268.5 IV ...... 1,569.5 1,048.1 260.1 788.0 397.2 82.6 159.3 155.3 136.9 123.9 130.1 521.4 513.8 277.0
2003: I ........ 1,586.0 1,046.4 253.6 792.8 407.9 85.6 161.0 161.4 139.7 116.1 129.0 539.6 532.0 292.1 II ....... 1,626.4 1,072.7 262.3 810.4 419.3 91.5 162.8 165.0 139.3 121.4 130.3 553.8 545.9 297.1 III ...... 1,700.2 1,113.3 262.3 851.1 442.8 99.7 169.1 174.0 140.8 128.8 138.7 586.9 578.7 315.0 IV ...... 1,755.2 1,146.3 268.2 878.1 454.7 104.5 170.5 179.7 139.5 140.0 144.0 609.0 600.6 338.2
2004: I ........ 1,783.5 1,158.8 266.0 892.8 468.5 104.4 176.8 187.4 143.1 134.5 146.6 624.6 616.1 349.3 II ....... 1,861.7 1,198.5 275.5 923.1 480.9 108.8 180.0 192.2 145.0 143.2 153.9 663.2 654.6 365.8 III ...... 1,915.4 1,238.5 281.2 957.3 486.3 111.1 182.9 192.2 155.2 153.0 162.7 677.0 668.3 376.1 IV p ... 1,956.6 1,274.7 285.2 989.6 501.3 119.1 190.0 192.3 158.7 161.4 168.1 681.9 673.1 377.4
1 Includes other items, not shown separately.
Source: Department of Commerce, Bureau of Economic Analysis.
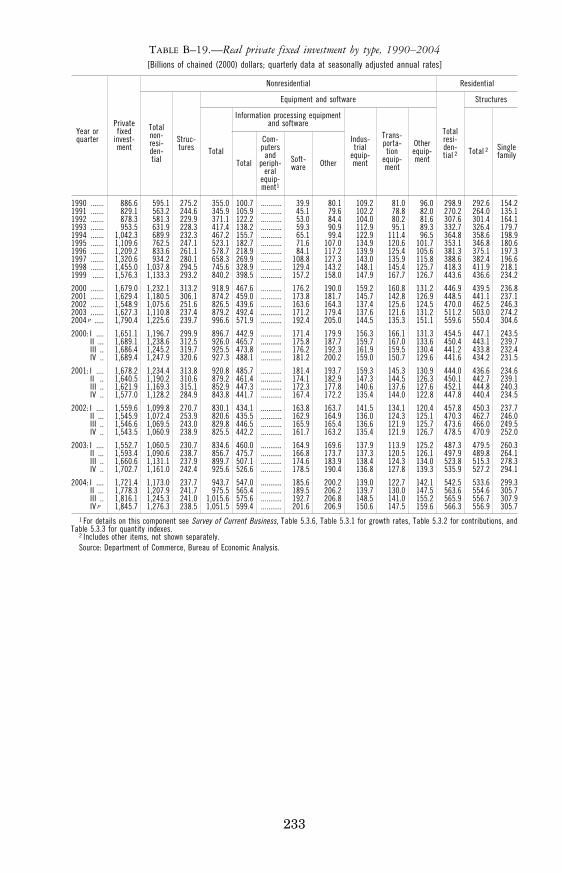
233
TABLE B–19.—Real private fixed investment by type, 1990–2004 [Billions of chained (2000) dollars; quarterly data at seasonally adjusted annual rates]
Year or quarter
Private fixed
invest- ment
Nonresidential Residential
Total non- resi- den- tial
Struc-tures
Equipment and software
Total resi-den-tial 2
Structures
Total
Information processing equipment and software
Indus-trial
equip-ment
Trans-porta-tion
equip-ment
Other equip-ment
Total 2 Single family
Total
Com-puters
and periph-
eral equip-ment1
Soft-ware Other
1990 ....... 886.6 595.1 275.2 355.0 100.7 ........... 39.9 80.1 109.2 81.0 96.0 298.9 292.6 154.2 1991 ....... 829.1 563.2 244.6 345.9 105.9 ........... 45.1 79.6 102.2 78.8 82.0 270.2 264.0 135.1 1992 ....... 878.3 581.3 229.9 371.1 122.2 ........... 53.0 84.4 104.0 80.2 81.6 307.6 301.4 164.1 1993 ....... 953.5 631.9 228.3 417.4 138.2 ........... 59.3 90.9 112.9 95.1 89.3 332.7 326.4 179.7 1994 ....... 1,042.3 689.9 232.3 467.2 155.7 ........... 65.1 99.4 122.9 111.4 96.5 364.8 358.6 198.9 1995 ....... 1,109.6 762.5 247.1 523.1 182.7 ........... 71.6 107.0 134.9 120.6 101.7 353.1 346.8 180.6 1996 ....... 1,209.2 833.6 261.1 578.7 218.9 ........... 84.1 117.2 139.9 125.4 105.6 381.3 375.1 197.3 1997 ....... 1,320.6 934.2 280.1 658.3 269.9 ........... 108.8 127.3 143.0 135.9 115.8 388.6 382.4 196.6 1998 ....... 1,455.0 1,037.8 294.5 745.6 328.9 ........... 129.4 143.2 148.1 145.4 125.7 418.3 411.9 218.1 1999 ...... 1,576.3 1,133.3 293.2 840.2 398.5 ........... 157.2 158.0 147.9 167.7 126.7 443.6 436.6 234.2
2000 ....... 1,679.0 1,232.1 313.2 918.9 467.6 ........... 176.2 190.0 159.2 160.8 131.2 446.9 439.5 236.8 2001 ....... 1,629.4 1,180.5 306.1 874.2 459.0 ........... 173.8 181.7 145.7 142.8 126.9 448.5 441.1 237.1 2002 ....... 1,548.9 1,075.6 251.6 826.5 439.6 ........... 163.6 164.3 137.4 125.6 124.5 470.0 462.5 246.3 2003 ....... 1,627.3 1,110.8 237.4 879.2 492.4 ........... 171.2 179.4 137.6 121.6 131.2 511.2 503.0 274.2 2004 p ..... 1,790.4 1,225.6 239.7 996.6 571.9 ........... 192.4 205.0 144.5 135.3 151.1 559.6 550.4 304.6
2000: I .... 1,651.1 1,196.7 299.9 896.7 442.9 ........... 171.4 179.9 156.3 166.1 131.3 454.5 447.1 243.5 II ... 1,689.1 1,238.6 312.5 926.0 465.7 ........... 175.8 187.7 159.7 167.0 133.6 450.4 443.1 239.7 III .. 1,686.4 1,245.2 319.7 925.5 473.8 ........... 176.2 192.3 161.9 159.5 130.4 441.2 433.8 232.4 IV .. 1,689.4 1,247.9 320.6 927.3 488.1 ........... 181.2 200.2 159.0 150.7 129.6 441.6 434.2 231.5
2001: I .... 1,678.2 1,234.4 313.8 920.8 485.7 ........... 181.4 193.7 159.3 145.3 130.9 444.0 436.6 234.6 II .. 1,640.5 1,190.2 310.6 879.2 461.4 ........... 174.1 182.9 147.3 144.5 126.3 450.1 442.7 239.1 III .. 1,621.9 1,169.3 315.1 852.9 447.3 ........... 172.3 177.8 140.6 137.6 127.6 452.1 444.8 240.3 IV .. 1,577.0 1,128.2 284.9 843.8 441.7 ........... 167.4 172.2 135.4 144.0 122.8 447.8 440.4 234.5
2002: I .... 1,559.6 1,099.8 270.7 830.1 434.1 ........... 163.8 163.7 141.5 134.1 120.4 457.8 450.3 237.7 II ... 1,545.9 1,072.4 253.9 820.6 435.5 ........... 162.9 164.9 136.0 124.3 125.1 470.3 462.7 246.0 III .. 1,546.6 1,069.5 243.0 829.8 446.5 ........... 165.9 165.4 136.6 121.9 125.7 473.6 466.0 249.5 IV .. 1,543.5 1,060.9 238.9 825.5 442.2 ........... 161.7 163.2 135.4 121.9 126.7 478.5 470.9 252.0
2003: I .... 1,552.7 1,060.5 230.7 834.6 460.0 ........... 164.9 169.6 137.9 113.9 125.2 487.3 479.5 260.3 II ... 1,593.4 1,090.6 238.7 856.7 475.7 ........... 166.8 173.7 137.3 120.5 126.1 497.9 489.8 264.1 III .. 1,660.6 1,131.1 237.9 899.7 507.1 ........... 174.6 183.9 138.4 124.3 134.0 523.8 515.3 278.3 IV .. 1,702.7 1,161.0 242.4 925.6 526.6 ........... 178.5 190.4 136.8 127.8 139.3 535.9 527.2 294.1
2004: I .... 1,721.4 1,173.0 237.7 943.7 547.0 ........... 185.6 200.2 139.0 122.7 142.1 542.5 533.6 299.3 II ... 1,778.3 1,207.9 241.7 975.5 565.4 ........... 189.5 206.2 139.7 130.0 147.5 563.6 554.6 305.7 III .. 1,816.1 1,245.3 241.0 1,015.6 575.6 ........... 192.7 206.8 148.5 141.0 155.2 565.9 556.7 307.9 IV p 1,845.7 1,276.3 238.5 1,051.5 599.4 ........... 201.6 206.9 150.6 147.5 159.6 566.3 556.9 305.7
1 For details on this component see Survey of Current Business, Table 5.3.6, Table 5.3.1 for growth rates, Table 5.3.2 for contributions, and Table 5.3.3 for quantity indexes.
2 Includes other items, not shown separately. Source: Department of Commerce, Bureau of Economic Analysis.
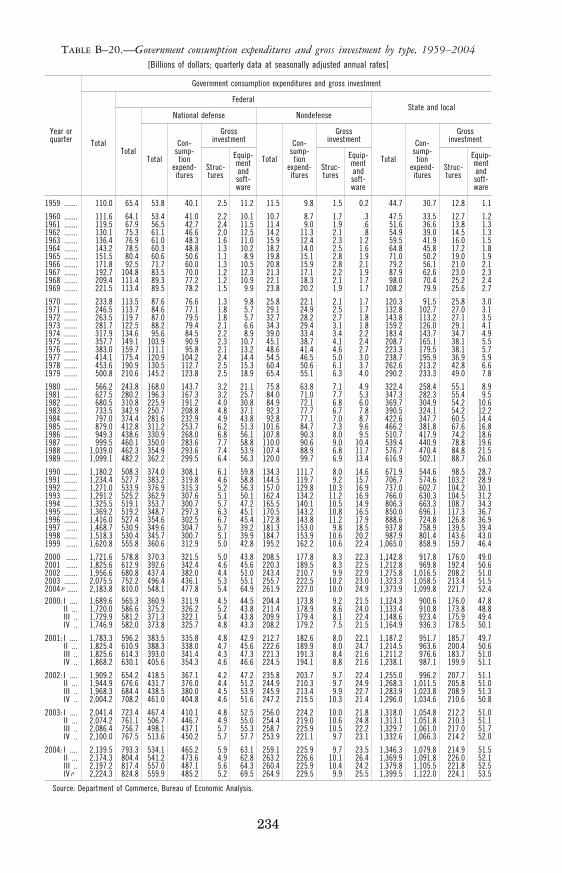
234
TABLE B–20.—Government consumption expenditures and gross investment by type, 1959–2004 [Billions of dollars; quarterly data at seasonally adjusted annual rates]
Year or quarter
Government consumption expenditures and gross investment
Total
Federal State and local
Total
National defense Nondefense
Total
Con- sump-
tion expend- itures
Gross investment
Total
Con- sump-
tion expend- itures
Gross investment
Total
Con- sump-
tion expend- itures
Gross investment
Struc- tures
Equip-ment and soft-ware
Struc- tures
Equip-ment and soft-ware
Struc- tures
Equip-ment and soft-ware
1959 ....... 110.0 65.4 53.8 40.1 2.5 11.2 11.5 9.8 1.5 0.2 44.7 30.7 12.8 1.1
1960 ....... 111.6 64.1 53.4 41.0 2.2 10.1 10.7 8.7 1.7 .3 47.5 33.5 12.7 1.2 1961 ....... 119.5 67.9 56.5 42.7 2.4 11.5 11.4 9.0 1.9 .6 51.6 36.6 13.8 1.3 1962 ....... 130.1 75.3 61.1 46.6 2.0 12.5 14.2 11.3 2.1 .8 54.9 39.0 14.5 1.3 1963 ....... 136.4 76.9 61.0 48.3 1.6 11.0 15.9 12.4 2.3 1.2 59.5 41.9 16.0 1.5 1964 ....... 143.2 78.5 60.3 48.8 1.3 10.2 18.2 14.0 2.5 1.6 64.8 45.8 17.2 1.8 1965 ....... 151.5 80.4 60.6 50.6 1.1 8.9 19.8 15.1 2.8 1.9 71.0 50.2 19.0 1.9 1966 ....... 171.8 92.5 71.7 60.0 1.3 10.5 20.8 15.9 2.8 2.1 79.2 56.1 21.0 2.1 1967 ....... 192.7 104.8 83.5 70.0 1.2 12.3 21.3 17.1 2.2 1.9 87.9 62.6 23.0 2.3 1968 ....... 209.4 111.4 89.3 77.2 1.2 10.9 22.1 18.3 2.1 1.7 98.0 70.4 25.2 2.4 1969 ....... 221.5 113.4 89.5 78.2 1.5 9.9 23.8 20.2 1.9 1.7 108.2 79.9 25.6 2.7
1970 ....... 233.8 113.5 87.6 76.6 1.3 9.8 25.8 22.1 2.1 1.7 120.3 91.5 25.8 3.0 1971 ....... 246.5 113.7 84.6 77.1 1.8 5.7 29.1 24.9 2.5 1.7 132.8 102.7 27.0 3.1 1972 ....... 263.5 119.7 87.0 79.5 1.8 5.7 32.7 28.2 2.7 1.8 143.8 113.2 27.1 3.5 1973 ....... 281.7 122.5 88.2 79.4 2.1 6.6 34.3 29.4 3.1 1.8 159.2 126.0 29.1 4.1 1974 ....... 317.9 134.6 95.6 84.5 2.2 8.9 39.0 33.4 3.4 2.2 183.4 143.7 34.7 4.9 1975 ....... 357.7 149.1 103.9 90.9 2.3 10.7 45.1 38.7 4.1 2.4 208.7 165.1 38.1 5.5 1976 ....... 383.0 159.7 111.1 95.8 2.1 13.2 48.6 41.4 4.6 2.7 223.3 179.5 38.1 5.7 1977 ....... 414.1 175.4 120.9 104.2 2.4 14.4 54.5 46.5 5.0 3.0 238.7 195.9 36.9 5.9 1978 ....... 453.6 190.9 130.5 112.7 2.5 15.3 60.4 50.6 6.1 3.7 262.6 213.2 42.8 6.6 1979 ....... 500.8 210.6 145.2 123.8 2.5 18.9 65.4 55.1 6.3 4.0 290.2 233.3 49.0 7.8
1980 ....... 566.2 243.8 168.0 143.7 3.2 21.1 75.8 63.8 7.1 4.9 322.4 258.4 55.1 8.9 1981 ....... 627.5 280.2 196.3 167.3 3.2 25.7 84.0 71.0 7.7 5.3 347.3 282.3 55.4 9.5 1982 ....... 680.5 310.8 225.9 191.2 4.0 30.8 84.9 72.1 6.8 6.0 369.7 304.9 54.2 10.6 1983 ....... 733.5 342.9 250.7 208.8 4.8 37.1 92.3 77.7 6.7 7.8 390.5 324.1 54.2 12.2 1984 ....... 797.0 374.4 281.6 232.9 4.9 43.8 92.8 77.1 7.0 8.7 422.6 347.7 60.5 14.4 1985 ....... 879.0 412.8 311.2 253.7 6.2 51.3 101.6 84.7 7.3 9.6 466.2 381.8 67.6 16.8 1986 ....... 949.3 438.6 330.9 268.0 6.8 56.1 107.8 90.3 8.0 9.5 510.7 417.9 74.2 18.6 1987 ....... 999.5 460.1 350.0 283.6 7.7 58.8 110.0 90.6 9.0 10.4 539.4 440.9 78.8 19.6 1988 ....... 1,039.0 462.3 354.9 293.6 7.4 53.9 107.4 88.9 6.8 11.7 576.7 470.4 84.8 21.5 1989 ....... 1,099.1 482.2 362.2 299.5 6.4 56.3 120.0 99.7 6.9 13.4 616.9 502.1 88.7 26.0
1990 ....... 1,180.2 508.3 374.0 308.1 6.1 59.8 134.3 111.7 8.0 14.6 671.9 544.6 98.5 28.7 1991 ....... 1,234.4 527.7 383.2 319.8 4.6 58.8 144.5 119.7 9.2 15.7 706.7 574.6 103.2 28.9 1992 ....... 1,271.0 533.9 376.9 315.3 5.2 56.3 157.0 129.8 10.3 16.9 737.0 602.7 104.2 30.1 1993 ....... 1,291.2 525.2 362.9 307.6 5.1 50.1 162.4 134.2 11.2 16.9 766.0 630.3 104.5 31.2 1994 ....... 1,325.5 519.1 353.7 300.7 5.7 47.2 165.5 140.1 10.5 14.9 806.3 663.3 108.7 34.3 1995 ....... 1,369.2 519.2 348.7 297.3 6.3 45.1 170.5 143.2 10.8 16.5 850.0 696.1 117.3 36.7 1996 ....... 1,416.0 527.4 354.6 302.5 6.7 45.4 172.8 143.8 11.2 17.9 888.6 724.8 126.8 36.9 1997 ...... 1,468.7 530.9 349.6 304.7 5.7 39.2 181.3 153.0 9.8 18.5 937.8 758.9 139.5 39.4 1998 ....... 1,518.3 530.4 345.7 300.7 5.1 39.9 184.7 153.9 10.6 20.2 987.9 801.4 143.6 43.0 1999 ...... 1,620.8 555.8 360.6 312.9 5.0 42.8 195.2 162.2 10.6 22.4 1,065.0 858.9 159.7 46.4
2000 ...... 1,721.6 578.8 370.3 321.5 5.0 43.8 208.5 177.8 8.3 22.3 1,142.8 917.8 176.0 49.0 2001 ...... 1,825.6 612.9 392.6 342.4 4.6 45.6 220.3 189.5 8.3 22.5 1,212.8 969.8 192.4 50.6 2002 ....... 1,956.6 680.8 437.4 382.0 4.4 51.0 243.4 210.7 9.9 22.9 1,275.8 1,016.5 208.2 51.0 2003 ....... 2,075.5 752.2 496.4 436.1 5.3 55.1 255.7 222.5 10.2 23.0 1,323.3 1,058.5 213.4 51.5 2004 p ..... 2,183.8 810.0 548.1 477.8 5.4 64.9 261.9 227.0 10.0 24.9 1,373.9 1,099.8 221.7 52.4 2000: I .... 1,689.6 565.3 360.9 311.9 4.5 44.5 204.4 173.8 9.2 21.5 1,124.3 900.6 176.0 47.8
II ... 1,720.0 586.6 375.2 326.2 5.2 43.8 211.4 178.9 8.6 24.0 1,133.4 910.8 173.8 48.8 III .. 1,729.9 581.2 371.3 322.1 5.4 43.8 209.9 179.4 8.1 22.4 1,148.6 923.4 175.9 49.4 IV .. 1,746.9 582.0 373.8 325.7 4.8 43.3 208.2 179.2 7.5 21.5 1,164.9 936.3 178.5 50.1
2001: I .... 1,783.3 596.2 383.5 335.8 4.8 42.9 212.7 182.6 8.0 22.1 1,187.2 951.7 185.7 49.7 II ... 1,825.4 610.9 388.3 338.0 4.7 45.6 222.6 189.9 8.0 24.7 1,214.5 963.6 200.4 50.6 III .. 1,825.6 614.3 393.0 341.4 4.3 47.3 221.3 191.3 8.4 21.6 1,211.2 976.6 183.7 51.0 IV .. 1,868.2 630.1 405.6 354.3 4.6 46.6 224.5 194.1 8.8 21.6 1,238.1 987.1 199.9 51.1
2002: I .... 1,909.2 654.2 418.5 367.1 4.2 47.2 235.8 203.7 9.7 22.4 1,255.0 996.2 207.7 51.1 II ... 1,944.9 676.6 431.7 376.0 4.4 51.2 244.9 210.3 9.7 24.9 1,268.3 1,011.5 205.8 51.0 III .. 1,968.3 684.4 438.5 380.0 4.5 53.9 245.9 213.4 9.9 22.7 1,283.9 1,023.8 208.9 51.3 IV .. 2,004.2 708.2 461.0 404.8 4.6 51.6 247.2 215.5 10.3 21.4 1,296.0 1,034.6 210.6 50.8
2003: I .... 2,041.4 723.4 467.4 410.1 4.8 52.5 256.0 224.2 10.0 21.8 1,318.0 1,054.8 212.2 51.0 II ... 2,074.2 761.1 506.7 446.7 4.9 55.0 254.4 219.0 10.6 24.8 1,313.1 1,051.8 210.3 51.1 III .. 2,086.4 756.7 498.1 437.1 5.7 55.3 258.7 225.9 10.5 22.2 1,329.7 1,061.0 217.0 51.7 IV .. 2,100.0 767.5 513.6 450.2 5.7 57.7 253.9 221.1 9.7 23.1 1,332.6 1,066.3 214.2 52.0
2004: I .... 2,139.5 793.3 534.1 465.2 5.9 63.1 259.1 225.9 9.7 23.5 1,346.3 1,079.8 214.9 51.5 II ... 2,174.3 804.4 541.2 473.6 4.9 62.8 263.2 226.6 10.1 26.4 1,369.9 1,091.8 226.0 52.1 III .. 2,197.2 817.4 557.0 487.1 5.6 64.3 260.4 225.9 10.4 24.2 1,379.8 1,105.5 221.8 52.5 IV p 2,224.3 824.8 559.9 485.2 5.2 69.5 264.9 229.5 9.9 25.5 1,399.5 1,122.0 224.1 53.5
Source: Department of Commerce, Bureau of Economic Analysis.
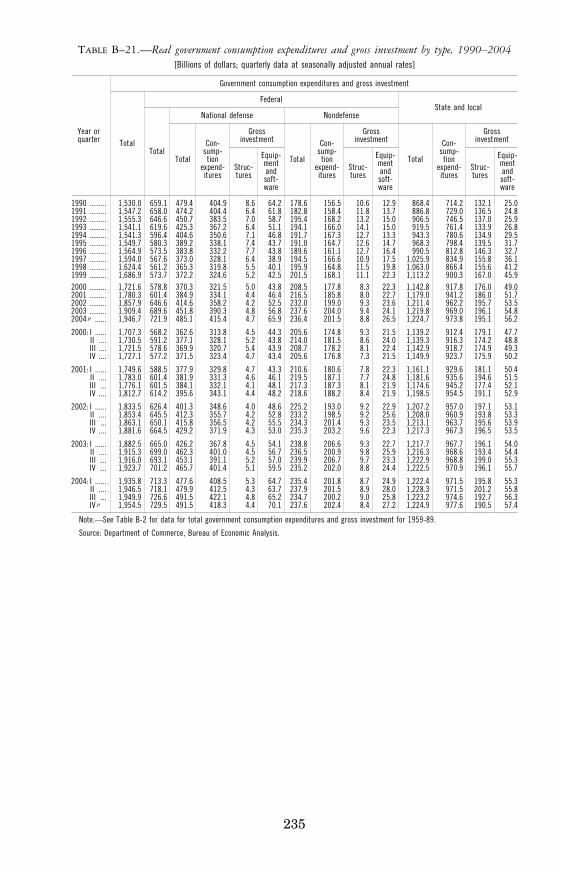
235
TABLE B–21.—Real government consumption expenditures and gross investment by type, 1990–2004 [Billions of dollars; quarterly data at seasonally adjusted annual rates]
Year or quarter
Government consumption expenditures and gross investment
Total
Federal State and local
Total
National defense Nondefense
Total
Con- sump-
tion expend- itures
Gross investment
Total
Con- sump-
tion expend- itures
Gross investment
Total
Con- sump-
tion expend- itures
Gross investment
Struc- tures
Equip-ment and soft-ware
Struc- tures
Equip-ment and soft-ware
Struc- tures
Equip-ment and soft-ware
1990 ......... 1,530.0 659.1 479.4 404.9 8.6 64.2 178.6 156.5 10.6 12.9 868.4 714.2 132.1 25.0 1991 ......... 1,547.2 658.0 474.2 404.4 6.4 61.8 182.8 158.4 11.8 13.7 886.8 729.0 136.5 24.8 1992 ......... 1,555.3 646.6 450.7 383.5 7.0 58.7 195.4 168.2 13.2 15.0 906.5 746.5 137.0 25.9 1993 ......... 1,541.1 619.6 425.3 367.2 6.4 51.1 194.1 166.0 14.1 15.0 919.5 761.4 133.9 26.8 1994 ......... 1,541.3 596.4 404.6 350.6 7.1 46.8 191.7 167.3 12.7 13.3 943.3 780.6 134.9 29.5 1995 ......... 1,549.7 580.3 389.2 338.1 7.4 43.7 191.0 164.7 12.6 14.7 968.3 798.4 139.5 31.7 1996 ......... 1,564.9 573.5 383.8 332.2 7.7 43.8 189.6 161.1 12.7 16.4 990.5 812.8 146.3 32.7 1997 ......... 1,594.0 567.6 373.0 328.1 6.4 38.9 194.5 166.6 10.9 17.5 1,025.9 834.9 155.8 36.1 1998 ......... 1,624.4 561.2 365.3 319.8 5.5 40.1 195.9 164.8 11.5 19.8 1,063.0 866.4 155.6 41.2 1999 ......... 1,686.9 573.7 372.2 324.6 5.2 42.5 201.5 168.1 11.1 22.3 1,113.2 900.3 167.0 45.9 2000 ......... 1,721.6 578.8 370.3 321.5 5.0 43.8 208.5 177.8 8.3 22.3 1,142.8 917.8 176.0 49.0 2001 ......... 1,780.3 601.4 384.9 334.1 4.4 46.4 216.5 185.8 8.0 22.7 1,179.0 941.2 186.0 51.7 2002 ......... 1,857.9 646.6 414.6 358.2 4.2 52.5 232.0 199.0 9.3 23.6 1,211.4 962.2 195.7 53.5 2003 ......... 1,909.4 689.6 451.8 390.3 4.8 56.8 237.6 204.0 9.4 24.1 1,219.8 969.0 196.1 54.8 2004 p ...... 1,946.7 721.9 485.1 415.4 4.7 65.9 236.4 201.5 8.8 26.5 1,224.7 973.8 195.1 56.2
2000: I ...... 1,707.3 568.2 362.6 313.8 4.5 44.3 205.6 174.8 9.3 21.5 1,139.2 912.4 179.1 47.7 II .... 1,730.5 591.2 377.1 328.1 5.2 43.8 214.0 181.5 8.6 24.0 1,139.3 916.3 174.2 48.8 III .... 1,721.5 578.6 369.9 320.7 5.4 43.9 208.7 178.2 8.1 22.4 1,142.9 918.7 174.9 49.3 IV .... 1,727.1 577.2 371.5 323.4 4.7 43.4 205.6 176.8 7.3 21.5 1,149.9 923.7 175.9 50.2
2001: I ...... 1,749.6 588.5 377.9 329.8 4.7 43.3 210.6 180.6 7.8 22.3 1,161.1 929.6 181.1 50.4 II .... 1,783.0 601.4 381.9 331.3 4.6 46.1 219.5 187.1 7.7 24.8 1,181.6 935.6 194.6 51.5 III ... 1,776.1 601.5 384.1 332.1 4.1 48.1 217.3 187.3 8.1 21.9 1,174.6 945.2 177.4 52.1 IV .... 1,812.7 614.2 395.6 343.1 4.4 48.2 218.6 188.2 8.4 21.9 1,198.5 954.5 191.1 52.9
2002: I ...... 1,833.5 626.4 401.3 348.6 4.0 48.6 225.2 193.0 9.2 22.9 1,207.2 957.0 197.1 53.1 II .... 1,853.4 645.5 412.3 355.7 4.2 52.8 233.2 198.5 9.2 25.6 1,208.0 960.9 193.8 53.3 III ... 1,863.1 650.1 415.8 356.5 4.2 55.5 234.3 201.4 9.3 23.5 1,213.1 963.7 195.6 53.9 IV .... 1,881.6 664.5 429.2 371.9 4.3 53.0 235.3 203.2 9.6 22.3 1,217.3 967.3 196.5 53.5
2003: I ...... 1,882.5 665.0 426.2 367.8 4.5 54.1 238.8 206.6 9.3 22.7 1,217.7 967.7 196.1 54.0 II .... 1,915.3 699.0 462.3 401.0 4.5 56.7 236.5 200.9 9.8 25.9 1,216.3 968.6 193.4 54.4 III ... 1,916.0 693.1 453.1 391.1 5.2 57.0 239.9 206.7 9.7 23.3 1,222.9 968.8 199.0 55.3 IV ... 1,923.7 701.2 465.7 401.4 5.1 59.5 235.2 202.0 8.8 24.4 1,222.5 970.9 196.1 55.7
2004: I ...... 1,935.8 713.3 477.6 408.5 5.3 64.7 235.4 201.8 8.7 24.9 1,222.4 971.5 195.8 55.3 II .... 1,946.5 718.1 479.9 412.5 4.3 63.7 237.9 201.5 8.9 28.0 1,228.3 971.5 201.2 55.8 III ... 1,949.9 726.6 491.5 422.1 4.8 65.2 234.7 200.2 9.0 25.8 1,223.2 974.6 192.7 56.3 IV p 1,954.5 729.5 491.5 418.3 4.4 70.1 237.6 202.4 8.4 27.2 1,224.9 977.6 190.5 57.4
Note.—See Table B-2 for data for total government consumption expenditures and gross investment for 1959-89.
Source: Department of Commerce, Bureau of Economic Analysis.
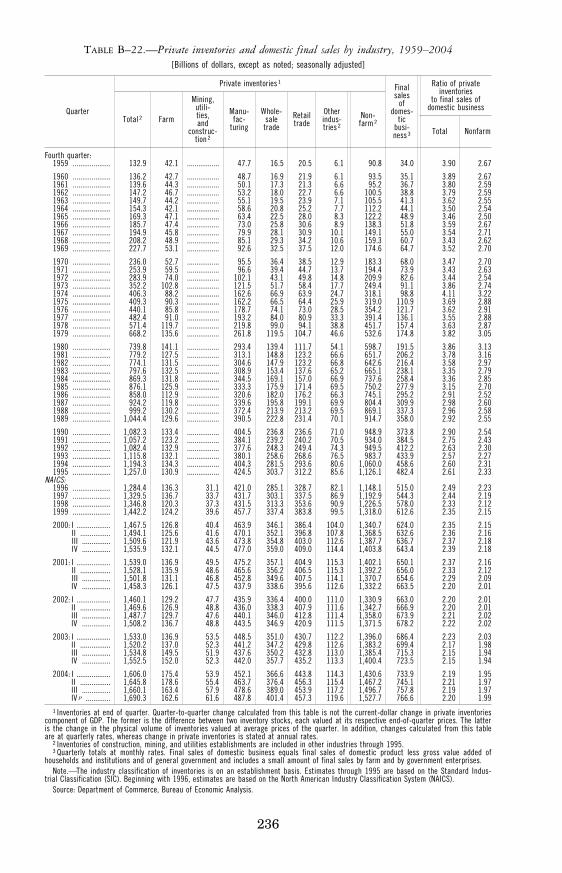
236
TABLE B–22.—Private inventories and domestic final sales by industry, 1959–2004 [Billions of dollars, except as noted; seasonally adjusted]
Quarter
Private inventories 1 Final sales
of domes-
tic busi- ness 3
Ratio of private inventories
to final sales of domestic business
Total 2 Farm
Mining, utili- ties, and
construc- tion 2
Manu- fac-
turing
Whole- sale trade
Retail trade
Other indus- tries 2
Non- farm 2
Total Nonfarm
Fourth quarter: 1959 .................... 132.9 42.1 ................. 47.7 16.5 20.5 6.1 90.8 34.0 3.90 2.67
1960 .................... 136.2 42.7 ................. 48.7 16.9 21.9 6.1 93.5 35.1 3.89 2.67 1961 .................... 139.6 44.3 ................. 50.1 17.3 21.3 6.6 95.2 36.7 3.80 2.59 1962 .................... 147.2 46.7 ................. 53.2 18.0 22.7 6.6 100.5 38.8 3.79 2.59 1963 .................... 149.7 44.2 ................. 55.1 19.5 23.9 7.1 105.5 41.3 3.62 2.55 1964 .................... 154.3 42.1 ................. 58.6 20.8 25.2 7.7 112.2 44.1 3.50 2.54 1965 .................... 169.3 47.1 ................. 63.4 22.5 28.0 8.3 122.2 48.9 3.46 2.50 1966 .................... 185.7 47.4 ................. 73.0 25.8 30.6 8.9 138.3 51.8 3.59 2.67 1967 .................... 194.9 45.8 ................. 79.9 28.1 30.9 10.1 149.1 55.0 3.54 2.71 1968 .................... 208.2 48.9 ................. 85.1 29.3 34.2 10.6 159.3 60.7 3.43 2.62 1969 .................... 227.7 53.1 ................. 92.6 32.5 37.5 12.0 174.6 64.7 3.52 2.70
1970 .................... 236.0 52.7 ................. 95.5 36.4 38.5 12.9 183.3 68.0 3.47 2.70 1971 .................... 253.9 59.5 ................. 96.6 39.4 44.7 13.7 194.4 73.9 3.43 2.63 1972 .................... 283.9 74.0 ................. 102.1 43.1 49.8 14.8 209.9 82.6 3.44 2.54 1973 .................... 352.2 102.8 ................. 121.5 51.7 58.4 17.7 249.4 91.1 3.86 2.74 1974 .................... 406.3 88.2 ................. 162.6 66.9 63.9 24.7 318.1 98.8 4.11 3.22 1975 .................... 409.3 90.3 ................. 162.2 66.5 64.4 25.9 319.0 110.9 3.69 2.88 1976 .................... 440.1 85.8 ................. 178.7 74.1 73.0 28.5 354.2 121.7 3.62 2.91 1977 .................... 482.4 91.0 ................. 193.2 84.0 80.9 33.3 391.4 136.1 3.55 2.88 1978 .................... 571.4 119.7 ................. 219.8 99.0 94.1 38.8 451.7 157.4 3.63 2.87 1979 .................... 668.2 135.6 ................. 261.8 119.5 104.7 46.6 532.6 174.8 3.82 3.05
1980 .................... 739.8 141.1 ................. 293.4 139.4 111.7 54.1 598.7 191.5 3.86 3.13 1981 .................... 779.2 127.5 ................. 313.1 148.8 123.2 66.6 651.7 206.2 3.78 3.16 1982 .................... 774.1 131.5 ................. 304.6 147.9 123.2 66.8 642.6 216.4 3.58 2.97 1983 .................... 797.6 132.5 ................. 308.9 153.4 137.6 65.2 665.1 238.1 3.35 2.79 1984 .................... 869.3 131.8 ................. 344.5 169.1 157.0 66.9 737.6 258.4 3.36 2.85 1985 .................... 876.1 125.9 ................. 333.3 175.9 171.4 69.5 750.2 277.9 3.15 2.70 1986 .................... 858.0 112.9 ................. 320.6 182.0 176.2 66.3 745.1 295.2 2.91 2.52 1987 .................... 924.2 119.8 ................. 339.6 195.8 199.1 69.9 804.4 309.9 2.98 2.60 1988 .................... 999.2 130.2 ................. 372.4 213.9 213.2 69.5 869.1 337.3 2.96 2.58 1989 .................... 1,044.4 129.6 ................. 390.5 222.8 231.4 70.1 914.7 358.0 2.92 2.55
1990 .................... 1,082.3 133.4 ................. 404.5 236.8 236.6 71.0 948.9 373.8 2.90 2.54 1991 .................... 1,057.2 123.2 ................. 384.1 239.2 240.2 70.5 934.0 384.5 2.75 2.43 1992 .................... 1,082.4 132.9 ................. 377.6 248.3 249.4 74.3 949.5 412.2 2.63 2.30 1993 .................... 1,115.8 132.1 ................. 380.1 258.6 268.6 76.5 983.7 433.9 2.57 2.27 1994 .................... 1,194.3 134.3 ................. 404.3 281.5 293.6 80.6 1,060.0 458.6 2.60 2.31 1995 .................... 1,257.0 130.9 ................. 424.5 303.7 312.2 85.6 1,126.1 482.4 2.61 2.33
NAICS: 1996 .................... 1,284.4 136.3 31.1 421.0 285.1 328.7 82.1 1,148.1 515.0 2.49 2.23 1997 .................... 1,329.5 136.7 33.7 431.7 303.1 337.5 86.9 1,192.9 544.3 2.44 2.19 1998 .................... 1,346.8 120.3 37.3 431.5 313.3 353.6 90.9 1,226.5 578.0 2.33 2.12 1999 .................... 1,442.2 124.2 39.6 457.7 337.4 383.8 99.5 1,318.0 612.6 2.35 2.15
2000: I .................. 1,467.5 126.8 40.4 463.9 346.1 386.4 104.0 1,340.7 624.0 2.35 2.15 II ................ 1,494.1 125.6 41.6 470.1 352.1 396.8 107.8 1,368.5 632.6 2.36 2.16 III ............... 1,509.6 121.9 43.6 473.8 354.8 403.0 112.6 1,387.7 636.7 2.37 2.18 IV ............... 1,535.9 132.1 44.5 477.0 359.0 409.0 114.4 1,403.8 643.4 2.39 2.18
2001: I .................. 1,539.0 136.9 49.5 475.2 357.1 404.9 115.3 1,402.1 650.1 2.37 2.16 II ................ 1,528.1 135.9 48.6 465.6 356.2 406.5 115.3 1,392.2 656.0 2.33 2.12 III ............... 1,501.8 131.1 46.8 452.8 349.6 407.5 114.1 1,370.7 654.6 2.29 2.09 IV ............... 1,458.3 126.1 47.5 437.9 338.6 395.6 112.6 1,332.2 663.5 2.20 2.01
2002: I .................. 1,460.1 129.2 47.7 435.9 336.4 400.0 111.0 1,330.9 663.0 2.20 2.01 II ................ 1,469.6 126.9 48.8 436.0 338.3 407.9 111.6 1,342.7 666.9 2.20 2.01 III ............... 1,487.7 129.7 47.6 440.1 346.0 412.8 111.4 1,358.0 673.9 2.21 2.02 IV ............... 1,508.2 136.7 48.8 443.5 346.9 420.9 111.5 1,371.5 678.2 2.22 2.02
2003: I .................. 1,533.0 136.9 53.5 448.5 351.0 430.7 112.2 1,396.0 686.4 2.23 2.03 II ................ 1,520.2 137.0 52.3 441.2 347.2 429.8 112.6 1,383.2 699.4 2.17 1.98 III ............... 1,534.8 149.5 51.9 437.6 350.2 432.8 113.0 1,385.4 715.3 2.15 1.94 IV ............... 1,552.5 152.0 52.3 442.0 357.7 435.2 113.3 1,400.4 723.5 2.15 1.94
2004: I .................. 1,606.0 175.4 53.9 452.1 366.6 443.8 114.3 1,430.6 733.9 2.19 1.95 II ................ 1,645.8 178.6 55.4 463.7 376.4 456.3 115.4 1,467.2 745.1 2.21 1.97 III ............... 1,660.1 163.4 57.9 478.6 389.0 453.9 117.2 1,496.7 757.8 2.19 1.97 IV p ............. 1,690.3 162.6 61.6 487.8 401.4 457.3 119.6 1,527.7 766.6 2.20 1.99
1 Inventories at end of quarter. Quarter-to-quarter change calculated from this table is not the current-dollar change in private inventories component of GDP. The former is the difference between two inventory stocks, each valued at its respective end-of-quarter prices. The latter is the change in the physical volume of inventories valued at average prices of the quarter. In addition, changes calculated from this table are at quarterly rates, whereas change in private inventories is stated at annual rates.
2 Inventories of construction, mining, and utilities establishments are included in other industries through 1995. 3 Quarterly totals at monthly rates. Final sales of domestic business equals final sales of domestic product less gross value added of
households and institutions and of general government and includes a small amount of final sales by farm and by government enterprises. Note.—The industry classification of inventories is on an establishment basis. Estimates through 1995 are based on the Standard Indus-
trial Classification (SIC). Beginning with 1996, estimates are based on the North American Industry Classification System (NAICS). Source: Department of Commerce, Bureau of Economic Analysis.
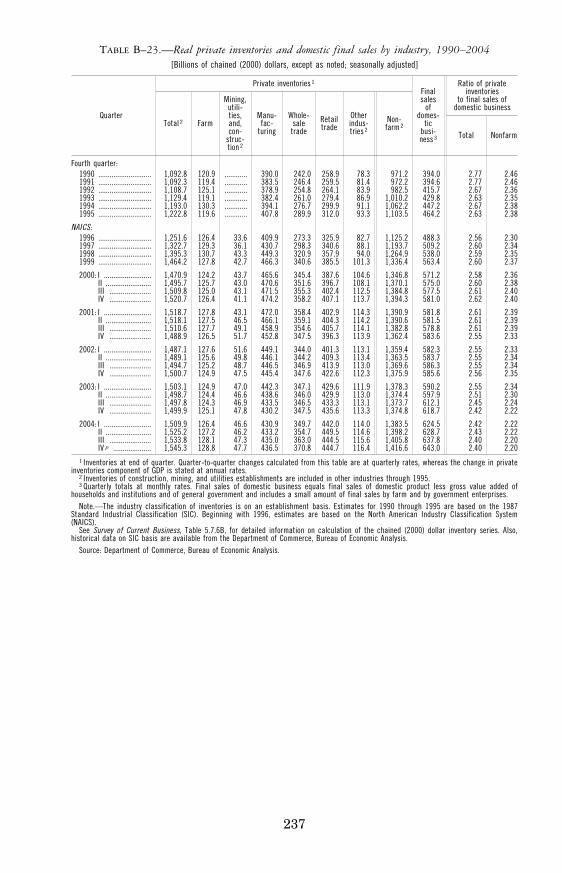
237
TABLE B–23.—Real private inventories and domestic final sales by industry, 1990–2004 [Billions of chained (2000) dollars, except as noted; seasonally adjusted]
Quarter
Private inventories 1 Final sales
of domes-
tic busi- ness 3
Ratio of private inventories
to final sales of domestic business
Total 2 Farm
Mining, utili- ties, and, con-
struc- tion 2
Manu- fac-
turing
Whole- sale trade
Retail trade
Other indus- tries 2
Non- farm 2
Total Nonfarm
Fourth quarter: 1990 ............................ 1,092.8 120.9 ............ 390.0 242.0 258.9 78.3 971.2 394.0 2.77 2.46 1991 ............................ 1,092.3 119.4 ............ 383.5 246.4 259.5 81.4 972.2 394.6 2.77 2.46 1992 ............................ 1,108.7 125.1 ............ 378.9 254.8 264.1 83.9 982.5 415.7 2.67 2.36 1993 ............................ 1,129.4 119.1 ............ 382.4 261.0 279.4 86.9 1,010.2 429.8 2.63 2.35 1994 ............................ 1,193.0 130.3 ............ 394.1 276.7 299.9 91.1 1,062.2 447.2 2.67 2.38 1995 ............................ 1,222.8 119.6 ............ 407.8 289.9 312.0 93.3 1,103.5 464.2 2.63 2.38
NAICS: 1996 ............................ 1,251.6 126.4 33.6 409.9 273.3 325.9 82.7 1,125.2 488.3 2.56 2.30 1997 ............................ 1,322.7 129.3 36.1 430.7 298.3 340.6 88.1 1,193.7 509.2 2.60 2.34 1998 ............................ 1,395.3 130.7 43.3 449.3 320.9 357.9 94.0 1,264.9 538.0 2.59 2.35 1999 ............................ 1,464.2 127.8 42.7 466.3 340.6 385.5 101.3 1,336.4 563.4 2.60 2.37
2000: I ......................... 1,470.9 124.2 43.7 465.6 345.4 387.6 104.6 1,346.8 571.2 2.58 2.36 II ........................ 1,495.7 125.7 43.0 470.6 351.6 396.7 108.1 1,370.1 575.0 2.60 2.38 III ...................... 1,509.8 125.0 43.1 471.5 355.3 402.4 112.5 1,384.8 577.5 2.61 2.40 IV ...................... 1,520.7 126.4 41.1 474.2 358.2 407.1 113.7 1,394.3 581.0 2.62 2.40
2001: I ......................... 1,518.7 127.8 43.1 472.0 358.4 402.9 114.3 1,390.9 581.8 2.61 2.39 II ........................ 1,518.1 127.5 46.5 466.1 359.1 404.3 114.2 1,390.6 581.5 2.61 2.39 III ...................... 1,510.6 127.7 49.1 458.9 354.6 405.7 114.1 1,382.8 578.8 2.61 2.39 IV ...................... 1,488.9 126.5 51.7 452.8 347.5 396.3 113.9 1,362.4 583.6 2.55 2.33
2002: I ......................... 1,487.1 127.6 51.6 449.1 344.0 401.3 113.1 1,359.4 582.3 2.55 2.33 II ........................ 1,489.1 125.6 49.8 446.1 344.2 409.3 113.4 1,363.5 583.7 2.55 2.34 III ...................... 1,494.7 125.2 48.7 446.5 346.9 413.9 113.0 1,369.6 586.3 2.55 2.34 IV ...................... 1,500.7 124.9 47.5 445.4 347.6 422.6 112.3 1,375.9 585.6 2.56 2.35
2003: I ......................... 1,503.1 124.9 47.0 442.3 347.1 429.6 111.9 1,378.3 590.2 2.55 2.34 II ........................ 1,498.7 124.4 46.6 438.6 346.0 429.9 113.0 1,374.4 597.9 2.51 2.30 III ...................... 1,497.8 124.3 46.9 433.5 346.5 433.3 113.1 1,373.7 612.1 2.45 2.24 IV ...................... 1,499.9 125.1 47.8 430.2 347.5 435.6 113.3 1,374.8 618.7 2.42 2.22
2004: I ......................... 1,509.9 126.4 46.6 430.9 349.7 442.0 114.0 1,383.5 624.5 2.42 2.22 II ........................ 1,525.2 127.2 46.2 433.2 354.7 449.5 114.6 1,398.2 628.7 2.43 2.22 III ...................... 1,533.8 128.1 47.3 435.0 363.0 444.5 115.6 1,405.8 637.8 2.40 2.20 IV p .................... 1,545.3 128.8 47.7 436.5 370.8 444.7 116.4 1,416.6 643.0 2.40 2.20
1 Inventories at end of quarter. Quarter-to-quarter changes calculated from this table are at quarterly rates, whereas the change in private inventories component of GDP is stated at annual rates.
2 Inventories of construction, mining, and utilities establishments are included in other industries through 1995. 3 Quarterly totals at monthly rates. Final sales of domestic business equals final sales of domestic product less gross value added of
households and institutions and of general government and includes a small amount of final sales by farm and by government enterprises. Note.—The industry classification of inventories is on an establishment basis. Estimates for 1990 through 1995 are based on the 1987
Standard Industrial Classification (SIC). Beginning with 1996, estimates are based on the North American Industry Classification System (NAICS).
See Survey of Current Business, Table 5.7.6B, for detailed information on calculation of the chained (2000) dollar inventory series. Also, historical data on SIC basis are available from the Department of Commerce, Bureau of Economic Analysis.
Source: Department of Commerce, Bureau of Economic Analysis.
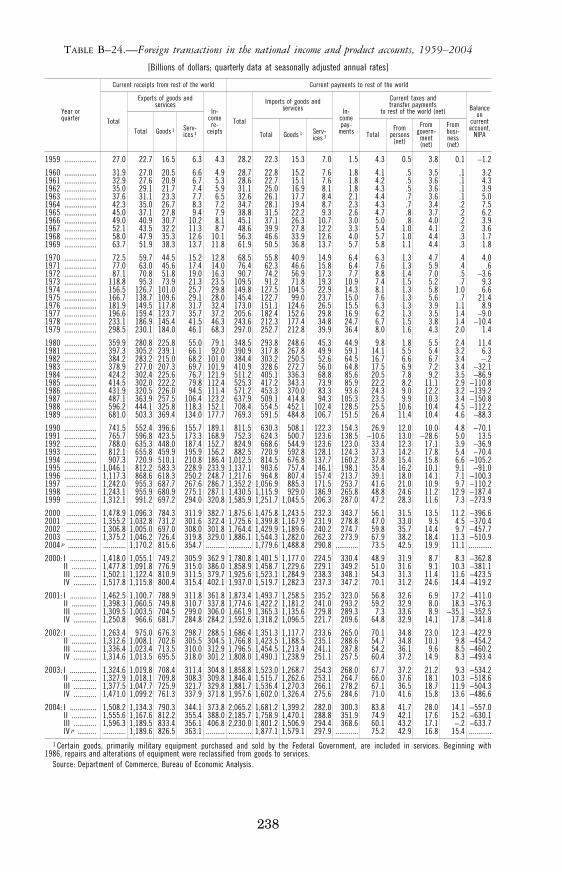
238
TABLE B–24.—Foreign transactions in the national income and product accounts, 1959–2004
[Billions of dollars; quarterly data at seasonally adjusted annual rates]
Year or quarter
Current receipts from rest of the world Current payments to rest of the world
Total
Exports of goods and services
In- come re-
ceipts Total
Imports of goods and services In-
come pay-
ments
Current taxes and transfer payments
to rest of the world (net) Balance on
current account,
NIPA Total Goods 1 Serv- ices 1 Total Goods 1 Serv-
ices 1 Total From
persons (net)
From govern-
ment (net)
From busi- ness (net)
1959 ................. 27.0 22.7 16.5 6.3 4.3 28.2 22.3 15.3 7.0 1.5 4.3 0.5 3.8 0.1 −1.2
1960 ................. 31.9 27.0 20.5 6.6 4.9 28.7 22.8 15.2 7.6 1.8 4.1 .5 3.5 .1 3.2 1961 ................. 32.9 27.6 20.9 6.7 5.3 28.6 22.7 15.1 7.6 1.8 4.2 .5 3.6 .1 4.3 1962 ................. 35.0 29.1 21.7 7.4 5.9 31.1 25.0 16.9 8.1 1.8 4.3 .5 3.6 .1 3.9 1963 ................. 37.6 31.1 23.3 7.7 6.5 32.6 26.1 17.7 8.4 2.1 4.4 .7 3.6 .1 5.0 1964 ................. 42.3 35.0 26.7 8.3 7.2 34.7 28.1 19.4 8.7 2.3 4.3 .7 3.4 .2 7.5 1965 ................. 45.0 37.1 27.8 9.4 7.9 38.8 31.5 22.2 9.3 2.6 4.7 .8 3.7 .2 6.2 1966 ................. 49.0 40.9 30.7 10.2 8.1 45.1 37.1 26.3 10.7 3.0 5.0 .8 4.0 .2 3.9 1967 ................. 52.1 43.5 32.2 11.3 8.7 48.6 39.9 27.8 12.2 3.3 5.4 1.0 4.1 .2 3.6 1968 ................. 58.0 47.9 35.3 12.6 10.1 56.3 46.6 33.9 12.6 4.0 5.7 1.0 4.4 .3 1.7 1969 ................. 63.7 51.9 38.3 13.7 11.8 61.9 50.5 36.8 13.7 5.7 5.8 1.1 4.4 .3 1.8
1970 ................. 72.5 59.7 44.5 15.2 12.8 68.5 55.8 40.9 14.9 6.4 6.3 1.3 4.7 .4 4.0 1971 ................. 77.0 63.0 45.6 17.4 14.0 76.4 62.3 46.6 15.8 6.4 7.6 1.3 5.9 .4 .6 1972 ................. 87.1 70.8 51.8 19.0 16.3 90.7 74.2 56.9 17.3 7.7 8.8 1.4 7.0 .5 −3.6 1973 ................. 118.8 95.3 73.9 21.3 23.5 109.5 91.2 71.8 19.3 10.9 7.4 1.5 5.2 .7 9.3 1974 ................. 156.5 126.7 101.0 25.7 29.8 149.8 127.5 104.5 22.9 14.3 8.1 1.3 5.8 1.0 6.6 1975 ................. 166.7 138.7 109.6 29.1 28.0 145.4 122.7 99.0 23.7 15.0 7.6 1.3 5.6 .7 21.4 1976 ................. 181.9 149.5 117.8 31.7 32.4 173.0 151.1 124.6 26.5 15.5 6.3 1.3 3.9 1.1 8.9 1977 ................. 196.6 159.4 123.7 35.7 37.2 205.6 182.4 152.6 29.8 16.9 6.2 1.3 3.5 1.4 −9.0 1978 ................. 233.1 186.9 145.4 41.5 46.3 243.6 212.3 177.4 34.8 24.7 6.7 1.5 3.8 1.4 −10.4 1979 ................. 298.5 230.1 184.0 46.1 68.3 297.0 252.7 212.8 39.9 36.4 8.0 1.6 4.3 2.0 1.4
1980 ................. 359.9 280.8 225.8 55.0 79.1 348.5 293.8 248.6 45.3 44.9 9.8 1.8 5.5 2.4 11.4 1981 ................. 397.3 305.2 239.1 66.1 92.0 390.9 317.8 267.8 49.9 59.1 14.1 5.5 5.4 3.2 6.3 1982 ................. 384.2 283.2 215.0 68.2 101.0 384.4 303.2 250.5 52.6 64.5 16.7 6.6 6.7 3.4 −.2 1983 ................. 378.9 277.0 207.3 69.7 101.9 410.9 328.6 272.7 56.0 64.8 17.5 6.9 7.2 3.4 −32.1 1984 ................. 424.2 302.4 225.6 76.7 121.9 511.2 405.1 336.3 68.8 85.6 20.5 7.8 9.2 3.5 −86.9 1985 ................. 414.5 302.0 222.2 79.8 112.4 525.3 417.2 343.3 73.9 85.9 22.2 8.2 11.1 2.9 −110.8 1986 ................. 431.9 320.5 226.0 94.5 111.4 571.2 453.3 370.0 83.3 93.6 24.3 9.0 12.2 3.2 −139.2 1987 ................. 487.1 363.9 257.5 106.4 123.2 637.9 509.1 414.8 94.3 105.3 23.5 9.9 10.3 3.4 −150.8 1988 ................. 596.2 444.1 325.8 118.3 152.1 708.4 554.5 452.1 102.4 128.5 25.5 10.6 10.4 4.5 −112.2 1989 ................. 681.0 503.3 369.4 134.0 177.7 769.3 591.5 484.8 106.7 151.5 26.4 11.4 10.4 4.6 −88.3
1990 ................. 741.5 552.4 396.6 155.7 189.1 811.5 630.3 508.1 122.3 154.3 26.9 12.0 10.0 4.8 −70.1 1991 ................. 765.7 596.8 423.5 173.3 168.9 752.3 624.3 500.7 123.6 138.5 −10.6 13.0 −28.6 5.0 13.5 1992 ................. 788.0 635.3 448.0 187.4 152.7 824.9 668.6 544.9 123.6 123.0 33.4 12.3 17.1 3.9 −36.9 1993 ................. 812.1 655.8 459.9 195.9 156.2 882.5 720.9 592.8 128.1 124.3 37.3 14.2 17.8 5.4 −70.4 1994 ................. 907.3 720.9 510.1 210.8 186.4 1,012.5 814.5 676.8 137.7 160.2 37.8 15.4 15.8 6.6 −105.2 1995 ................. 1,046.1 812.2 583.3 228.9 233.9 1,137.1 903.6 757.4 146.1 198.1 35.4 16.2 10.1 9.1 −91.0 1996 ................. 1,117.3 868.6 618.3 250.2 248.7 1,217.6 964.8 807.4 157.4 213.7 39.1 18.0 14.1 7.1 −100.3 1997 ................ 1,242.0 955.3 687.7 267.6 286.7 1,352.2 1,056.9 885.3 171.5 253.7 41.6 21.0 10.9 9.7 −110.2 1998 ................ 1,243.1 955.9 680.9 275.1 287.1 1,430.5 1,115.9 929.0 186.9 265.8 48.8 24.6 11.2 12.9 −187.4 1999 ................ 1,312.1 991.2 697.2 294.0 320.8 1,585.9 1,251.7 1,045.5 206.3 287.0 47.2 28.3 11.6 7.3 −273.9
2000 ................ 1,478.9 1,096.3 784.3 311.9 382.7 1,875.6 1,475.8 1,243.5 232.3 343.7 56.1 31.5 13.5 11.2 −396.6 2001 ................ 1,355.2 1,032.8 731.2 301.6 322.4 1,725.6 1,399.8 1,167.9 231.9 278.8 47.0 33.0 9.5 4.5 −370.4 2002 ................ 1,306.8 1,005.0 697.0 308.0 301.8 1,764.4 1,429.9 1,189.6 240.2 274.7 59.8 35.7 14.4 9.7 −457.7 2003 ................ 1,375.2 1,046.2 726.4 319.8 329.0 1,886.1 1,544.3 1,282.0 262.3 273.9 67.9 38.2 18.4 11.3 −510.9 2004 p ............... ............ 1,170.2 815.6 354.7 .......... ............ 1,779.6 1,488.8 290.8 ............ 73.5 42.5 19.9 11.1 ............
2000: I .............. 1,418.0 1,055.1 749.2 305.9 362.9 1,780.8 1,401.5 1,177.0 224.5 330.4 48.9 31.9 8.7 8.3 −362.8 II ............. 1,477.8 1,091.8 776.9 315.0 386.0 1,858.9 1,458.7 1,229.6 229.1 349.2 51.0 31.6 9.1 10.3 −381.1 III ............ 1,502.1 1,122.4 810.9 311.5 379.7 1,925.6 1,523.1 1,284.9 238.3 348.1 54.3 31.3 11.4 11.6 −423.5 IV ............ 1,517.8 1,115.8 800.4 315.4 402.1 1,937.0 1,519.7 1,282.3 237.3 347.2 70.1 31.2 24.6 14.4 −419.2
2001: I .............. 1,462.5 1,100.7 788.9 311.8 361.8 1,873.4 1,493.7 1,258.5 235.2 323.0 56.8 32.6 6.9 17.2 −411.0 II ............. 1,398.3 1,060.5 749.8 310.7 337.8 1,774.6 1,422.2 1,181.2 241.0 293.2 59.2 32.9 8.0 18.3 −376.3 III ............ 1,309.5 1,003.5 704.5 299.0 306.0 1,661.9 1,365.3 1,135.6 229.8 289.3 7.3 33.6 8.9 −35.1 −352.5 IV ............ 1,250.8 966.6 681.7 284.8 284.2 1,592.6 1,318.2 1,096.5 221.7 209.6 64.8 32.9 14.1 17.8 −341.8
2002: I .............. 1,263.4 975.0 676.3 298.7 288.5 1,686.4 1,351.3 1,117.7 233.6 265.0 70.1 34.8 23.0 12.3 −422.9 II ............. 1,312.6 1,008.1 702.6 305.5 304.5 1,766.8 1,423.5 1,188.5 235.1 288.6 54.7 34.8 10.1 9.8 −454.2 III ............ 1,336.4 1,023.4 713.5 310.0 312.9 1,796.5 1,454.5 1,213.4 241.1 287.8 54.2 36.1 9.6 8.5 −460.2 IV ............ 1,314.6 1,013.5 695.5 318.0 301.2 1,808.0 1,490.1 1,238.9 251.1 257.5 60.4 37.2 14.9 8.3 −493.4
2003: I .............. 1,324.6 1,019.8 708.4 311.4 304.8 1,858.8 1,523.0 1,268.7 254.3 268.0 67.7 37.2 21.2 9.3 −534.2 II ............. 1,327.9 1,018.1 709.8 308.3 309.8 1,846.4 1,515.7 1,262.6 253.1 264.7 66.0 37.6 18.1 10.3 −518.6 III ............ 1,377.5 1,047.7 725.9 321.7 329.8 1,881.7 1,536.4 1,270.3 266.1 278.2 67.1 36.5 18.7 11.9 −504.3 IV ............ 1,471.0 1,099.2 761.3 337.9 371.8 1,957.6 1,602.0 1,326.4 275.6 284.6 71.0 41.6 15.8 13.6 −486.6
2004: I .............. 1,508.2 1,134.3 790.3 344.1 373.8 2,065.2 1,681.2 1,399.2 282.0 300.3 83.8 41.7 28.0 14.1 −557.0 II ............. 1,555.6 1,167.6 812.2 355.4 388.0 2,185.7 1,758.9 1,470.1 288.8 351.9 74.9 42.1 17.6 15.2 −630.1 III ............ 1,596.3 1,189.5 833.4 356.1 406.8 2,230.0 1,801.2 1,506.9 294.4 368.6 60.1 43.2 17.1 −.2 −633.7 IV p .......... ............ 1,189.6 826.5 363.1 .......... ............ 1,877.1 1,579.1 297.9 ............ 75.2 42.9 16.8 15.4 ............
1 Certain goods, primarily military equipment purchased and sold by the Federal Government, are included in services. Beginning with 1986, repairs and alterations of equipment were reclassified from goods to services.
Source: Department of Commerce, Bureau of Economic Analysis.
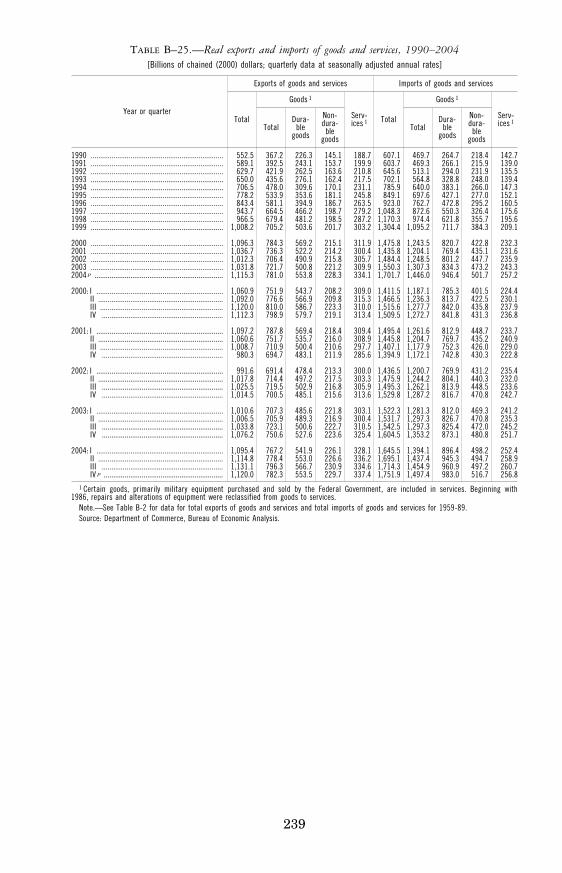
239
TABLE B–25.—Real exports and imports of goods and services, 1990–2004 [Billions of chained (2000) dollars; quarterly data at seasonally adjusted annual rates]
Year or quarter
Exports of goods and services Imports of goods and services
Total
Goods 1
Serv- ices 1 Total
Goods 1
Serv- ices 1 Total
Dura- ble
goods
Non- dura-
ble goods
Total Dura-
ble goods
Non- dura-
ble goods
1990 ...................................................................... 552.5 367.2 226.3 145.1 188.7 607.1 469.7 264.7 218.4 142.7 1991 ...................................................................... 589.1 392.5 243.1 153.7 199.9 603.7 469.3 266.1 215.9 139.0 1992 ...................................................................... 629.7 421.9 262.5 163.6 210.8 645.6 513.1 294.0 231.9 135.5 1993 ...................................................................... 650.0 435.6 276.1 162.4 217.5 702.1 564.8 328.8 248.0 139.4 1994 ...................................................................... 706.5 478.0 309.6 170.1 231.1 785.9 640.0 383.1 266.0 147.3 1995 ...................................................................... 778.2 533.9 353.6 181.1 245.8 849.1 697.6 427.1 277.0 152.1 1996 ...................................................................... 843.4 581.1 394.9 186.7 263.5 923.0 762.7 472.8 295.2 160.5 1997 ...................................................................... 943.7 664.5 466.2 198.7 279.2 1,048.3 872.6 550.3 326.4 175.6 1998 ...................................................................... 966.5 679.4 481.2 198.5 287.2 1,170.3 974.4 621.8 355.7 195.6 1999 ...................................................................... 1,008.2 705.2 503.6 201.7 303.2 1,304.4 1,095.2 711.7 384.3 209.1
2000 ...................................................................... 1,096.3 784.3 569.2 215.1 311.9 1,475.8 1,243.5 820.7 422.8 232.3 2001 ...................................................................... 1,036.7 736.3 522.2 214.2 300.4 1,435.8 1,204.1 769.4 435.1 231.6 2002 ...................................................................... 1,012.3 706.4 490.9 215.8 305.7 1,484.4 1,248.5 801.2 447.7 235.9 2003 ...................................................................... 1,031.8 721.7 500.8 221.2 309.9 1,550.3 1,307.3 834.3 473.2 243.3 2004 p .................................................................... 1,115.3 781.0 553.8 228.3 334.1 1,701.7 1,446.0 946.4 501.7 257.2
2000: I ................................................................... 1,060.9 751.9 543.7 208.2 309.0 1,411.5 1,187.1 785.3 401.5 224.4 II .................................................................. 1,092.0 776.6 566.9 209.8 315.3 1,466.5 1,236.3 813.7 422.5 230.1 III ................................................................. 1,120.0 810.0 586.7 223.3 310.0 1,515.6 1,277.7 842.0 435.8 237.9 IV ................................................................ 1,112.3 798.9 579.7 219.1 313.4 1,509.5 1,272.7 841.8 431.3 236.8
2001: I ................................................................... 1,097.2 787.8 569.4 218.4 309.4 1,495.4 1,261.6 812.9 448.7 233.7 II .................................................................. 1,060.6 751.7 535.7 216.0 308.9 1,445.8 1,204.7 769.7 435.2 240.9 III ................................................................. 1,008.7 710.9 500.4 210.6 297.7 1,407.1 1,177.9 752.3 426.0 229.0 IV ................................................................ 980.3 694.7 483.1 211.9 285.6 1,394.9 1,172.1 742.8 430.3 222.8
2002: I ................................................................... 991.6 691.4 478.4 213.3 300.0 1,436.5 1,200.7 769.9 431.2 235.4 II .................................................................. 1,017.8 714.4 497.2 217.5 303.3 1,475.9 1,244.2 804.1 440.3 232.0 III ................................................................ 1,025.5 719.5 502.9 216.8 305.9 1,495.3 1,262.1 813.9 448.5 233.6 IV ................................................................ 1,014.5 700.5 485.1 215.6 313.6 1,529.8 1,287.2 816.7 470.8 242.7
2003: I ................................................................... 1,010.6 707.3 485.6 221.8 303.1 1,522.3 1,281.3 812.0 469.3 241.2 II .................................................................. 1,006.5 705.9 489.3 216.9 300.4 1,531.7 1,297.3 826.7 470.8 235.3 III ................................................................ 1,033.8 723.1 500.6 222.7 310.5 1,542.5 1,297.3 825.4 472.0 245.2 IV ................................................................ 1,076.2 750.6 527.6 223.6 325.4 1,604.5 1,353.2 873.1 480.8 251.7
2004: I ................................................................... 1,095.4 767.2 541.9 226.1 328.1 1,645.5 1,394.1 896.4 498.2 252.4 II .................................................................. 1,114.8 778.4 553.0 226.6 336.2 1,695.1 1,437.4 945.3 494.7 258.9 III ................................................................ 1,131.1 796.3 566.7 230.9 334.6 1,714.3 1,454.9 960.9 497.2 260.7 IV p ............................................................... 1,120.0 782.3 553.5 229.7 337.4 1,751.9 1,497.4 983.0 516.7 256.8
1 Certain goods, primarily military equipment purchased and sold by the Federal Government, are included in services. Beginning with 1986, repairs and alterations of equipment were reclassified from goods to services.
Note.—See Table B-2 for data for total exports of goods and services and total imports of goods and services for 1959-89. Source: Department of Commerce, Bureau of Economic Analysis.
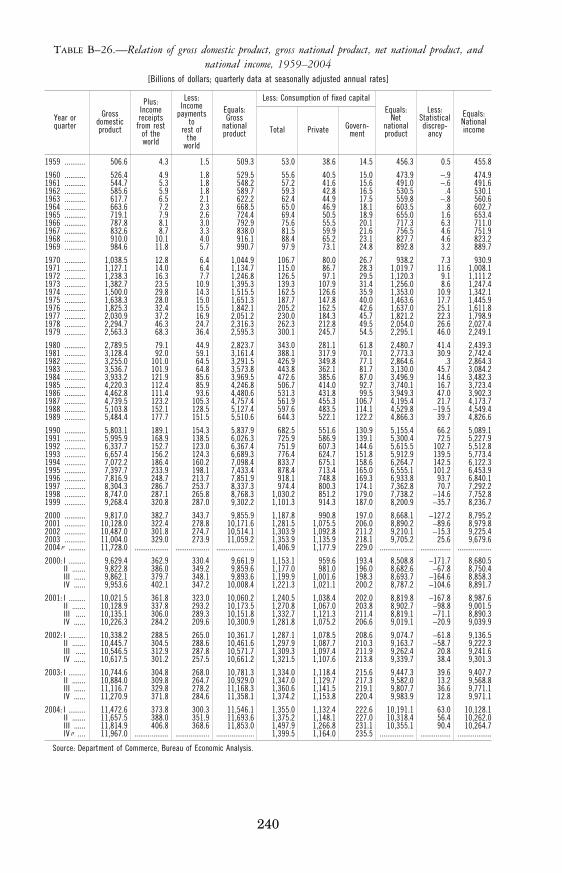
240
TABLE B–26.—Relation of gross domestic product, gross national product, net national product, and national income, 1959–2004
[Billions of dollars; quarterly data at seasonally adjusted annual rates]
Year or quarter
Gross domestic product
Plus: Income receipts
from rest of the world
Less: Income
payments to
rest of the
world
Equals: Gross
national product
Less: Consumption of fixed capital Equals:
Net national product
Less: Statistical discrep-
ancy
Equals: National income Total Private Govern-
ment
1959 ........... 506.6 4.3 1.5 509.3 53.0 38.6 14.5 456.3 0.5 455.8
1960 ........... 526.4 4.9 1.8 529.5 55.6 40.5 15.0 473.9 −.9 474.9 1961 ........... 544.7 5.3 1.8 548.2 57.2 41.6 15.6 491.0 −.6 491.6 1962 ........... 585.6 5.9 1.8 589.7 59.3 42.8 16.5 530.5 .4 530.1 1963 ........... 617.7 6.5 2.1 622.2 62.4 44.9 17.5 559.8 −.8 560.6 1964 ........... 663.6 7.2 2.3 668.5 65.0 46.9 18.1 603.5 .8 602.7 1965 ........... 719.1 7.9 2.6 724.4 69.4 50.5 18.9 655.0 1.6 653.4 1966 ........... 787.8 8.1 3.0 792.9 75.6 55.5 20.1 717.3 6.3 711.0 1967 ........... 832.6 8.7 3.3 838.0 81.5 59.9 21.6 756.5 4.6 751.9 1968 ........... 910.0 10.1 4.0 916.1 88.4 65.2 23.1 827.7 4.6 823.2 1969 ........... 984.6 11.8 5.7 990.7 97.9 73.1 24.8 892.8 3.2 889.7
1970 ........... 1,038.5 12.8 6.4 1,044.9 106.7 80.0 26.7 938.2 7.3 930.9 1971 ........... 1,127.1 14.0 6.4 1,134.7 115.0 86.7 28.3 1,019.7 11.6 1,008.1 1972 ........... 1,238.3 16.3 7.7 1,246.8 126.5 97.1 29.5 1,120.3 9.1 1,111.2 1973 ........... 1,382.7 23.5 10.9 1,395.3 139.3 107.9 31.4 1,256.0 8.6 1,247.4 1974 ........... 1,500.0 29.8 14.3 1,515.5 162.5 126.6 35.9 1,353.0 10.9 1,342.1 1975 ........... 1,638.3 28.0 15.0 1,651.3 187.7 147.8 40.0 1,463.6 17.7 1,445.9 1976 ........... 1,825.3 32.4 15.5 1,842.1 205.2 162.5 42.6 1,637.0 25.1 1,611.8 1977 ........... 2,030.9 37.2 16.9 2,051.2 230.0 184.3 45.7 1,821.2 22.3 1,798.9 1978 ........... 2,294.7 46.3 24.7 2,316.3 262.3 212.8 49.5 2,054.0 26.6 2,027.4 1979 ........... 2,563.3 68.3 36.4 2,595.3 300.1 245.7 54.5 2,295.1 46.0 2,249.1
1980 ........... 2,789.5 79.1 44.9 2,823.7 343.0 281.1 61.8 2,480.7 41.4 2,439.3 1981 ........... 3,128.4 92.0 59.1 3,161.4 388.1 317.9 70.1 2,773.3 30.9 2,742.4 1982 ........... 3,255.0 101.0 64.5 3,291.5 426.9 349.8 77.1 2,864.6 .3 2,864.3 1983 ........... 3,536.7 101.9 64.8 3,573.8 443.8 362.1 81.7 3,130.0 45.7 3,084.2 1984 ........... 3,933.2 121.9 85.6 3,969.5 472.6 385.6 87.0 3,496.9 14.6 3,482.3 1985 ........... 4,220.3 112.4 85.9 4,246.8 506.7 414.0 92.7 3,740.1 16.7 3,723.4 1986 ........... 4,462.8 111.4 93.6 4,480.6 531.3 431.8 99.5 3,949.3 47.0 3,902.3 1987 ........... 4,739.5 123.2 105.3 4,757.4 561.9 455.3 106.7 4,195.4 21.7 4,173.7 1988 ........... 5,103.8 152.1 128.5 5,127.4 597.6 483.5 114.1 4,529.8 −19.5 4,549.4 1989 ........... 5,484.4 177.7 151.5 5,510.6 644.3 522.1 122.2 4,866.3 39.7 4,826.6
1990 ........... 5,803.1 189.1 154.3 5,837.9 682.5 551.6 130.9 5,155.4 66.2 5,089.1 1991 ........... 5,995.9 168.9 138.5 6,026.3 725.9 586.9 139.1 5,300.4 72.5 5,227.9 1992 ........... 6,337.7 152.7 123.0 6,367.4 751.9 607.3 144.6 5,615.5 102.7 5,512.8 1993 ........... 6,657.4 156.2 124.3 6,689.3 776.4 624.7 151.8 5,912.9 139.5 5,773.4 1994 ........... 7,072.2 186.4 160.2 7,098.4 833.7 675.1 158.6 6,264.7 142.5 6,122.3 1995 ........... 7,397.7 233.9 198.1 7,433.4 878.4 713.4 165.0 6,555.1 101.2 6,453.9 1996 ........... 7,816.9 248.7 213.7 7,851.9 918.1 748.8 169.3 6,933.8 93.7 6,840.1 1997 ........... 8,304.3 286.7 253.7 8,337.3 974.4 800.3 174.1 7,362.8 70.7 7,292.2 1998 ........... 8,747.0 287.1 265.8 8,768.3 1,030.2 851.2 179.0 7,738.2 −14.6 7,752.8 1999 ........... 9,268.4 320.8 287.0 9,302.2 1,101.3 914.3 187.0 8,200.9 −35.7 8,236.7
2000 ........... 9,817.0 382.7 343.7 9,855.9 1,187.8 990.8 197.0 8,668.1 −127.2 8,795.2 2001 ........... 10,128.0 322.4 278.8 10,171.6 1,281.5 1,075.5 206.0 8,890.2 −89.6 8,979.8 2002 ........... 10,487.0 301.8 274.7 10,514.1 1,303.9 1,092.8 211.2 9,210.1 −15.3 9,225.4 2003 ........... 11,004.0 329.0 273.9 11,059.2 1,353.9 1,135.9 218.1 9,705.2 25.6 9,679.6 2004 p ......... 11,728.0 .................. .................. .................... 1,406.9 1,177.9 229.0 .................. ................ ..................
2000: I ......... 9,629.4 362.9 330.4 9,661.9 1,153.1 959.6 193.4 8,508.8 −171.7 8,680.5 II ....... 9,822.8 386.0 349.2 9,859.6 1,177.0 981.0 196.0 8,682.6 −67.8 8,750.4 III ...... 9,862.1 379.7 348.1 9,893.6 1,199.9 1,001.6 198.3 8,693.7 −164.6 8,858.3 IV ...... 9,953.6 402.1 347.2 10,008.4 1,221.3 1,021.1 200.2 8,787.2 −104.6 8,891.7
2001: I ......... 10,021.5 361.8 323.0 10,060.2 1,240.5 1,038.4 202.0 8,819.8 −167.8 8,987.6 II ....... 10,128.9 337.8 293.2 10,173.5 1,270.8 1,067.0 203.8 8,902.7 −98.8 9,001.5 III ..... 10,135.1 306.0 289.3 10,151.8 1,332.7 1,121.3 211.4 8,819.1 −71.1 8,890.3 IV ...... 10,226.3 284.2 209.6 10,300.9 1,281.8 1,075.2 206.6 9,019.1 −20.9 9,039.9
2002: I ......... 10,338.2 288.5 265.0 10,361.7 1,287.1 1,078.5 208.6 9,074.7 −61.8 9,136.5 II ....... 10,445.7 304.5 288.6 10,461.6 1,297.9 1,087.7 210.3 9,163.7 −58.7 9,222.3 III ..... 10,546.5 312.9 287.8 10,571.7 1,309.3 1,097.4 211.9 9,262.4 20.8 9,241.6 IV ...... 10,617.5 301.2 257.5 10,661.2 1,321.5 1,107.6 213.8 9,339.7 38.4 9,301.3
2003: I ......... 10,744.6 304.8 268.0 10,781.3 1,334.0 1,118.4 215.6 9,447.3 39.6 9,407.7 II ....... 10,884.0 309.8 264.7 10,929.0 1,347.0 1,129.7 217.3 9,582.0 13.2 9,568.8 III ...... 11,116.7 329.8 278.2 11,168.3 1,360.6 1,141.5 219.1 9,807.7 36.6 9,771.1 IV ...... 11,270.9 371.8 284.6 11,358.1 1,374.2 1,153.8 220.4 9,983.9 12.8 9,971.1
2004: I ......... 11,472.6 373.8 300.3 11,546.1 1,355.0 1,132.4 222.6 10,191.1 63.0 10,128.1 II ....... 11,657.5 388.0 351.9 11,693.6 1,375.2 1,148.1 227.0 10,318.4 56.4 10,262.0 III ...... 11,814.9 406.8 368.6 11,853.0 1,497.9 1,266.8 231.1 10,355.1 90.4 10,264.7 IV p .... 11,967.0 .................. .................. .................... 1,399.5 1,164.0 235.5 .................. ................ ..................
Source: Department of Commerce, Bureau of Economic Analysis.
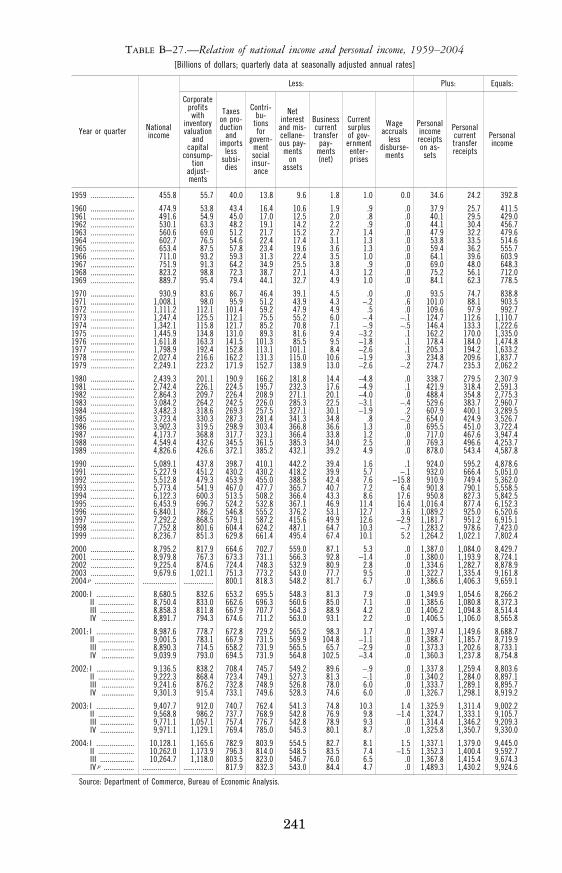
241
TABLE B–27.—Relation of national income and personal income, 1959–2004 [Billions of dollars; quarterly data at seasonally adjusted annual rates]
Year or quarter National income
Less: Plus: Equals:
Corporate profits with
inventory valuation
and capital
consump- tion
adjust- ments
Taxes on pro-duction
and imports
less subsi- dies
Contri- bu-
tions for
govern-ment social insur- ance
Net interest
and mis-cellane-ous pay-
ments on
assets
Business current transfer
pay-ments (net)
Current surplus of gov-ernment enter-prises
Wage accruals
less disburse-
ments
Personal income receipts on as-sets
Personal current transfer receipts
Personal income
1959 ....................... 455.8 55.7 40.0 13.8 9.6 1.8 1.0 0.0 34.6 24.2 392.8
1960 ....................... 474.9 53.8 43.4 16.4 10.6 1.9 .9 .0 37.9 25.7 411.5 1961 ....................... 491.6 54.9 45.0 17.0 12.5 2.0 .8 .0 40.1 29.5 429.0 1962 ....................... 530.1 63.3 48.2 19.1 14.2 2.2 .9 .0 44.1 30.4 456.7 1963 ....................... 560.6 69.0 51.2 21.7 15.2 2.7 1.4 .0 47.9 32.2 479.6 1964 ....................... 602.7 76.5 54.6 22.4 17.4 3.1 1.3 .0 53.8 33.5 514.6 1965 ....................... 653.4 87.5 57.8 23.4 19.6 3.6 1.3 .0 59.4 36.2 555.7 1966 ....................... 711.0 93.2 59.3 31.3 22.4 3.5 1.0 .0 64.1 39.6 603.9 1967 ....................... 751.9 91.3 64.2 34.9 25.5 3.8 .9 .0 69.0 48.0 648.3 1968 ....................... 823.2 98.8 72.3 38.7 27.1 4.3 1.2 .0 75.2 56.1 712.0 1969 ....................... 889.7 95.4 79.4 44.1 32.7 4.9 1.0 .0 84.1 62.3 778.5
1970 ....................... 930.9 83.6 86.7 46.4 39.1 4.5 .0 .0 93.5 74.7 838.8 1971 ....................... 1,008.1 98.0 95.9 51.2 43.9 4.3 −.2 .6 101.0 88.1 903.5 1972 ....................... 1,111.2 112.1 101.4 59.2 47.9 4.9 .5 .0 109.6 97.9 992.7 1973 ....................... 1,247.4 125.5 112.1 75.5 55.2 6.0 −.4 −.1 124.7 112.6 1,110.7 1974 ....................... 1,342.1 115.8 121.7 85.2 70.8 7.1 −.9 −.5 146.4 133.3 1,222.6 1975 ....................... 1,445.9 134.8 131.0 89.3 81.6 9.4 −3.2 .1 162.2 170.0 1,335.0 1976 ....................... 1,611.8 163.3 141.5 101.3 85.5 9.5 −1.8 .1 178.4 184.0 1,474.8 1977 ....................... 1,798.9 192.4 152.8 113.1 101.1 8.4 −2.6 .1 205.3 194.2 1,633.2 1978 ....................... 2,027.4 216.6 162.2 131.3 115.0 10.6 −1.9 .3 234.8 209.6 1,837.7 1979 ....................... 2,249.1 223.2 171.9 152.7 138.9 13.0 −2.6 −.2 274.7 235.3 2,062.2
1980 ....................... 2,439.3 201.1 190.9 166.2 181.8 14.4 −4.8 .0 338.7 279.5 2,307.9 1981 ....................... 2,742.4 226.1 224.5 195.7 232.3 17.6 −4.9 .1 421.9 318.4 2,591.3 1982 ....................... 2,864.3 209.7 226.4 208.9 271.1 20.1 −4.0 .0 488.4 354.8 2,775.3 1983 ....................... 3,084.2 264.2 242.5 226.0 285.3 22.5 −3.1 −.4 529.6 383.7 2,960.7 1984 ....................... 3,482.3 318.6 269.3 257.5 327.1 30.1 −1.9 .2 607.9 400.1 3,289.5 1985 ....................... 3,723.4 330.3 287.3 281.4 341.3 34.8 .8 −.2 654.0 424.9 3,526.7 1986 ....................... 3,902.3 319.5 298.9 303.4 366.8 36.6 1.3 .0 695.5 451.0 3,722.4 1987 ....................... 4,173.7 368.8 317.7 323.1 366.4 33.8 1.2 .0 717.0 467.6 3,947.4 1988 ....................... 4,549.4 432.6 345.5 361.5 385.3 34.0 2.5 .0 769.3 496.6 4,253.7 1989 ....................... 4,826.6 426.6 372.1 385.2 432.1 39.2 4.9 .0 878.0 543.4 4,587.8
1990 ....................... 5,089.1 437.8 398.7 410.1 442.2 39.4 1.6 .1 924.0 595.2 4,878.6 1991 ....................... 5,227.9 451.2 430.2 430.2 418.2 39.9 5.7 −.1 932.0 666.4 5,051.0 1992 ....................... 5,512.8 479.3 453.9 455.0 388.5 42.4 7.6 −15.8 910.9 749.4 5,362.0 1993 ....................... 5,773.4 541.9 467.0 477.7 365.7 40.7 7.2 6.4 901.8 790.1 5,558.5 1994 ....................... 6,122.3 600.3 513.5 508.2 366.4 43.3 8.6 17.6 950.8 827.3 5,842.5 1995 ....................... 6,453.9 696.7 524.2 532.8 367.1 46.9 11.4 16.4 1,016.4 877.4 6,152.3 1996 ....................... 6,840.1 786.2 546.8 555.2 376.2 53.1 12.7 3.6 1,089.2 925.0 6,520.6 1997 ....................... 7,292.2 868.5 579.1 587.2 415.6 49.9 12.6 −2.9 1,181.7 951.2 6,915.1 1998 ....................... 7,752.8 801.6 604.4 624.2 487.1 64.7 10.3 −.7 1,283.2 978.6 7,423.0 1999 ....................... 8,236.7 851.3 629.8 661.4 495.4 67.4 10.1 5.2 1,264.2 1,022.1 7,802.4
2000 ....................... 8,795.2 817.9 664.6 702.7 559.0 87.1 5.3 .0 1,387.0 1,084.0 8,429.7 2001 ....................... 8,979.8 767.3 673.3 731.1 566.3 92.8 −1.4 .0 1,380.0 1,193.9 8,724.1 2002 ....................... 9,225.4 874.6 724.4 748.3 532.9 80.9 2.8 .0 1,334.6 1,282.7 8,878.9 2003 ....................... 9,679.6 1,021.1 751.3 773.2 543.0 77.7 9.5 .0 1,322.7 1,335.4 9,161.8 2004 p ..................... .................. ................ 800.1 818.3 548.2 81.7 6.7 .0 1,386.6 1,406.3 9,659.1
2000: I .................... 8,680.5 832.6 653.2 695.5 548.3 81.3 7.9 .0 1,349.9 1,054.6 8,266.2 II ................... 8,750.4 833.0 662.6 696.3 560.6 85.0 7.1 .0 1,385.6 1,080.8 8,372.3 III .................. 8,858.3 811.8 667.9 707.7 564.3 88.9 4.2 .0 1,406.2 1,094.8 8,514.4 IV ................. 8,891.7 794.3 674.6 711.2 563.0 93.1 2.2 .0 1,406.5 1,106.0 8,565.8
2001: I .................... 8,987.6 778.7 672.8 729.2 565.2 98.3 1.7 .0 1,397.4 1,149.6 8,688.7 II ................... 9,001.5 783.1 667.9 731.5 569.9 104.8 −1.1 .0 1,388.7 1,185.7 8,719.9 III ................. 8,890.3 714.5 658.2 731.9 565.5 65.7 −2.9 .0 1,373.3 1,202.6 8,733.1 IV ................. 9,039.9 793.0 694.5 731.9 564.8 102.5 −3.4 .0 1,360.3 1,237.8 8,754.8
2002: I .................... 9,136.5 838.2 708.4 745.7 549.2 89.6 −.9 .0 1,337.8 1,259.4 8,803.6 II ................... 9,222.3 868.4 723.4 749.1 527.3 81.3 −.1 .0 1,340.2 1,284.0 8,897.1 III ................. 9,241.6 876.2 732.8 748.9 526.8 78.0 6.0 .0 1,333.7 1,289.1 8,895.7 IV ................. 9,301.3 915.4 733.1 749.6 528.3 74.6 6.0 .0 1,326.7 1,298.1 8,919.2
2003: I .................... 9,407.7 912.0 740.7 762.4 541.3 74.8 10.3 1.4 1,325.9 1,311.4 9,002.2 II ................... 9,568.8 986.2 737.7 768.9 542.8 76.9 9.8 −1.4 1,324.7 1,333.1 9,105.7 III .................. 9,771.1 1,057.1 757.4 776.7 542.8 78.9 9.3 .0 1,314.4 1,346.2 9,209.3 IV .................. 9,971.1 1,129.1 769.4 785.0 545.3 80.1 8.7 .0 1,325.8 1,350.7 9,330.0
2004: I .................... 10,128.1 1,165.6 782.9 803.9 554.5 82.7 8.1 1.5 1,337.1 1,379.0 9,445.0 II ................... 10,262.0 1,173.9 796.3 814.0 548.5 83.5 7.4 −1.5 1,352.3 1,400.4 9,592.7 III .................. 10,264.7 1,118.0 803.5 823.0 546.7 76.0 6.5 .0 1,367.8 1,415.4 9,674.3 IV p ................ .................. ................ 817.9 832.3 543.0 84.4 4.7 .0 1,489.3 1,430.2 9,924.6
Source: Department of Commerce, Bureau of Economic Analysis.
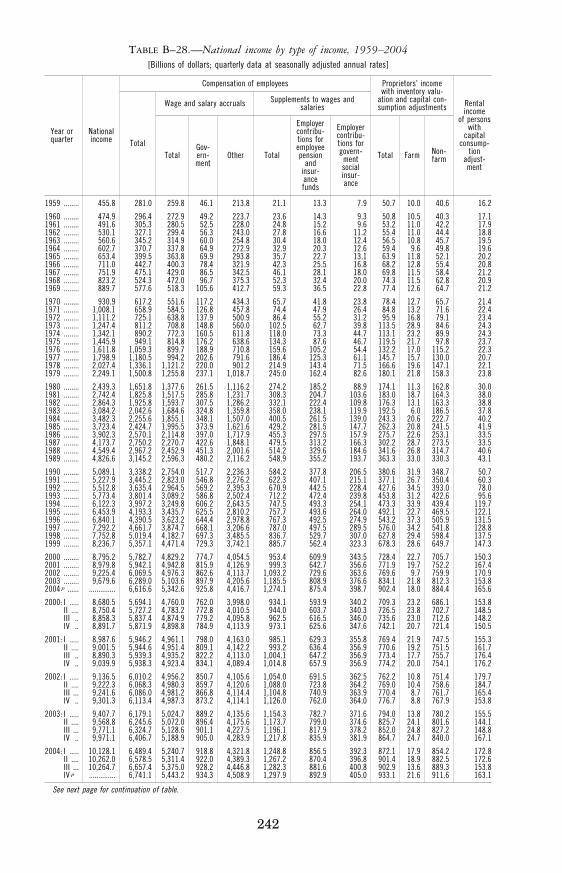
242
TABLE B–28.—National income by type of income, 1959–2004 [Billions of dollars; quarterly data at seasonally adjusted annual rates]
Year or quarter
National income
Compensation of employees Proprietors’ income with inventory valu-
ation and capital con-sumption adjustments Rental
income of persons
with capital
consump- tion
adjust- ment
Total
Wage and salary accruals Supplements to wages and salaries
Total Farm Non-farm Total
Gov- ern- ment
Other Total
Employer contribu- tions for employee pension
and insur- ance funds
Employer contribu- tions for govern-
ment social insur- ance
1959 ........ 455.8 281.0 259.8 46.1 213.8 21.1 13.3 7.9 50.7 10.0 40.6 16.2
1960 ........ 474.9 296.4 272.9 49.2 223.7 23.6 14.3 9.3 50.8 10.5 40.3 17.1 1961 ........ 491.6 305.3 280.5 52.5 228.0 24.8 15.2 9.6 53.2 11.0 42.2 17.9 1962 ........ 530.1 327.1 299.4 56.3 243.0 27.8 16.6 11.2 55.4 11.0 44.4 18.8 1963 ........ 560.6 345.2 314.9 60.0 254.8 30.4 18.0 12.4 56.5 10.8 45.7 19.5 1964 ........ 602.7 370.7 337.8 64.9 272.9 32.9 20.3 12.6 59.4 9.6 49.8 19.6 1965 ........ 653.4 399.5 363.8 69.9 293.8 35.7 22.7 13.1 63.9 11.8 52.1 20.2 1966 ........ 711.0 442.7 400.3 78.4 321.9 42.3 25.5 16.8 68.2 12.8 55.4 20.8 1967 ........ 751.9 475.1 429.0 86.5 342.5 46.1 28.1 18.0 69.8 11.5 58.4 21.2 1968 ........ 823.2 524.3 472.0 96.7 375.3 52.3 32.4 20.0 74.3 11.5 62.8 20.9 1969 ........ 889.7 577.6 518.3 105.6 412.7 59.3 36.5 22.8 77.4 12.6 64.7 21.2
1970 ........ 930.9 617.2 551.6 117.2 434.3 65.7 41.8 23.8 78.4 12.7 65.7 21.4 1971 ........ 1,008.1 658.9 584.5 126.8 457.8 74.4 47.9 26.4 84.8 13.2 71.6 22.4 1972 ........ 1,111.2 725.1 638.8 137.9 500.9 86.4 55.2 31.2 95.9 16.8 79.1 23.4 1973 ........ 1,247.4 811.2 708.8 148.8 560.0 102.5 62.7 39.8 113.5 28.9 84.6 24.3 1974 ........ 1,342.1 890.2 772.3 160.5 611.8 118.0 73.3 44.7 113.1 23.2 89.9 24.3 1975 ........ 1,445.9 949.1 814.8 176.2 638.6 134.3 87.6 46.7 119.5 21.7 97.8 23.7 1976 ........ 1,611.8 1,059.3 899.7 188.9 710.8 159.6 105.2 54.4 132.2 17.0 115.2 22.3 1977 ........ 1,798.9 1,180.5 994.2 202.6 791.6 186.4 125.3 61.1 145.7 15.7 130.0 20.7 1978 ........ 2,027.4 1,336.1 1,121.2 220.0 901.2 214.9 143.4 71.5 166.6 19.6 147.1 22.1 1979 ........ 2,249.1 1,500.8 1,255.8 237.1 1,018.7 245.0 162.4 82.6 180.1 21.8 158.3 23.8
1980 ........ 2,439.3 1,651.8 1,377.6 261.5 1,116.2 274.2 185.2 88.9 174.1 11.3 162.8 30.0 1981 ........ 2,742.4 1,825.8 1,517.5 285.8 1,231.7 308.3 204.7 103.6 183.0 18.7 164.3 38.0 1982 ........ 2,864.3 1,925.8 1,593.7 307.5 1,286.2 332.1 222.4 109.8 176.3 13.1 163.3 38.8 1983 ........ 3,084.2 2,042.6 1,684.6 324.8 1,359.8 358.0 238.1 119.9 192.5 6.0 186.5 37.8 1984 ........ 3,482.3 2,255.6 1,855.1 348.1 1,507.0 400.5 261.5 139.0 243.3 20.6 222.7 40.2 1985 ........ 3,723.4 2,424.7 1,995.5 373.9 1,621.6 429.2 281.5 147.7 262.3 20.8 241.5 41.9 1986 ........ 3,902.3 2,570.1 2,114.8 397.0 1,717.9 455.3 297.5 157.9 275.7 22.6 253.1 33.5 1987 ........ 4,173.7 2,750.2 2,270.7 422.6 1,848.1 479.5 313.2 166.3 302.2 28.7 273.5 33.5 1988 ........ 4,549.4 2,967.2 2,452.9 451.3 2,001.6 514.2 329.6 184.6 341.6 26.8 314.7 40.6 1989 ........ 4,826.6 3,145.2 2,596.3 480.2 2,116.2 548.9 355.2 193.7 363.3 33.0 330.3 43.1
1990 ........ 5,089.1 3,338.2 2,754.0 517.7 2,236.3 584.2 377.8 206.5 380.6 31.9 348.7 50.7 1991 ........ 5,227.9 3,445.2 2,823.0 546.8 2,276.2 622.3 407.1 215.1 377.1 26.7 350.4 60.3 1992 ........ 5,512.8 3,635.4 2,964.5 569.2 2,395.3 670.9 442.5 228.4 427.6 34.5 393.0 78.0 1993 ........ 5,773.4 3,801.4 3,089.2 586.8 2,502.4 712.2 472.4 239.8 453.8 31.2 422.6 95.6 1994 ........ 6,122.3 3,997.2 3,249.8 606.2 2,643.5 747.5 493.3 254.1 473.3 33.9 439.4 119.7 1995 ........ 6,453.9 4,193.3 3,435.7 625.5 2,810.2 757.7 493.6 264.0 492.1 22.7 469.5 122.1 1996 ........ 6,840.1 4,390.5 3,623.2 644.4 2,978.8 767.3 492.5 274.9 543.2 37.3 505.9 131.5 1997 ........ 7,292.2 4,661.7 3,874.7 668.1 3,206.6 787.0 497.5 289.5 576.0 34.2 541.8 128.8 1998 ........ 7,752.8 5,019.4 4,182.7 697.3 3,485.5 836.7 529.7 307.0 627.8 29.4 598.4 137.5 1999 ........ 8,236.7 5,357.1 4,471.4 729.3 3,742.1 885.7 562.4 323.3 678.3 28.6 649.7 147.3
2000 ........ 8,795.2 5,782.7 4,829.2 774.7 4,054.5 953.4 609.9 343.5 728.4 22.7 705.7 150.3 2001 ........ 8,979.8 5,942.1 4,942.8 815.9 4,126.9 999.3 642.7 356.6 771.9 19.7 752.2 167.4 2002 ........ 9,225.4 6,069.5 4,976.3 862.6 4,113.7 1,093.2 729.6 363.6 769.6 9.7 759.9 170.9 2003 ........ 9,679.6 6,289.0 5,103.6 897.9 4,205.6 1,185.5 808.9 376.6 834.1 21.8 812.3 153.8 2004 p ...... .............. 6,616.6 5,342.6 925.8 4,416.7 1,274.1 875.4 398.7 902.4 18.0 884.4 165.6
2000: I ..... 8,680.5 5,694.1 4,760.0 762.0 3,998.0 934.1 593.9 340.2 709.3 23.2 686.1 153.8 II .... 8,750.4 5,727.2 4,783.2 772.8 4,010.5 944.0 603.7 340.3 726.5 23.8 702.7 148.5 III .. 8,858.3 5,837.4 4,874.9 779.2 4,095.8 962.5 616.5 346.0 735.6 23.0 712.6 148.2 IV .. 8,891.7 5,871.9 4,898.8 784.9 4,113.9 973.1 625.6 347.6 742.1 20.7 721.4 150.5
2001: I ..... 8,987.6 5,946.2 4,961.1 798.0 4,163.0 985.1 629.3 355.8 769.4 21.9 747.5 155.3 II .... 9,001.5 5,944.6 4,951.4 809.1 4,142.2 993.2 636.4 356.9 770.6 19.2 751.5 161.7 III .. 8,890.3 5,939.3 4,935.2 822.2 4,113.0 1,004.1 647.2 356.9 773.4 17.7 755.7 176.4 IV .. 9,039.9 5,938.3 4,923.4 834.1 4,089.4 1,014.8 657.9 356.9 774.2 20.0 754.1 176.2
2002: I ..... 9,136.5 6,010.2 4,956.2 850.7 4,105.6 1,054.0 691.5 362.5 762.2 10.8 751.4 179.7 II .... 9,222.3 6,068.3 4,980.3 859.7 4,120.6 1,088.0 723.8 364.2 769.0 10.4 758.6 184.7 III ... 9,241.6 6,086.0 4,981.2 866.8 4,114.4 1,104.8 740.9 363.9 770.4 8.7 761.7 165.4 IV .. 9,301.3 6,113.4 4,987.3 873.2 4,114.1 1,126.0 762.0 364.0 776.7 8.8 767.9 153.8
2003: I ..... 9,407.7 6,179.1 5,024.7 889.2 4,135.6 1,154.3 782.7 371.6 794.0 13.8 780.2 155.5 II .... 9,568.8 6,245.6 5,072.0 896.4 4,175.6 1,173.7 799.0 374.6 825.7 24.1 801.6 144.1 III ... 9,771.1 6,324.7 5,128.6 901.1 4,227.5 1,196.1 817.9 378.2 852.0 24.8 827.2 148.8 IV .. 9,971.1 6,406.7 5,188.9 905.0 4,283.9 1,217.8 835.9 381.9 864.7 24.7 840.0 167.1
2004: I ..... 10,128.1 6,489.4 5,240.7 918.8 4,321.8 1,248.8 856.5 392.3 872.1 17.9 854.2 172.8 II .... 10,262.0 6,578.5 5,311.4 922.0 4,389.3 1,267.2 870.4 396.8 901.4 18.9 882.5 172.6 III ... 10,264.7 6,657.4 5,375.0 928.2 4,446.8 1,282.3 881.6 400.8 902.9 13.6 889.3 153.8 IV p .............. 6,741.1 5,443.2 934.3 4,508.9 1,297.9 892.9 405.0 933.1 21.6 911.6 163.1
See next page for continuation of table.
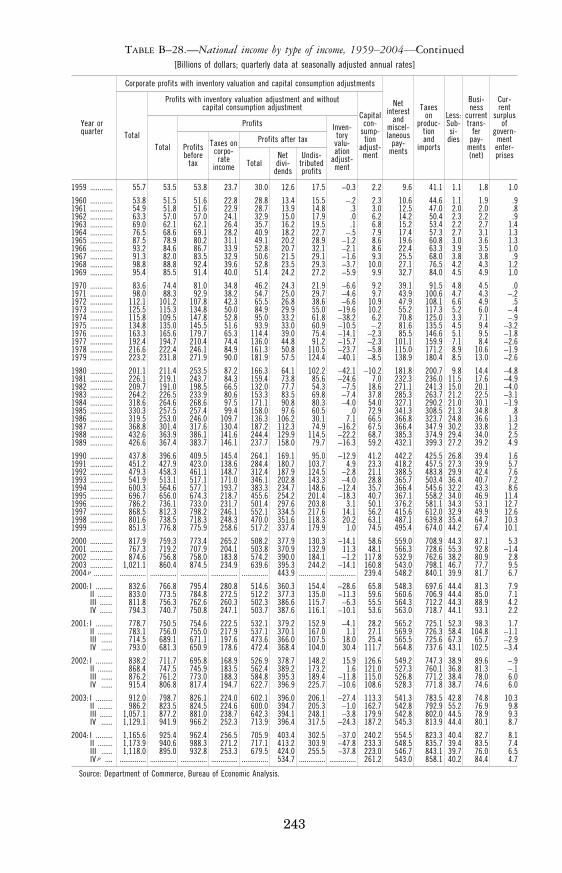
243
TABLE B–28.—National income by type of income, 1959–2004—Continued [Billions of dollars; quarterly data at seasonally adjusted annual rates]
Year or quarter
Corporate profits with inventory valuation and capital consumption adjustments
Net interest
and miscel- laneous
pay-ments
Taxes on
produc- tion and
imports
Less: Sub- si-
dies
Busi- ness
current trans-
fer pay-
ments (net)
Cur- rent
surplus of
govern- ment enter- prises
Total
Profits with inventory valuation adjustment and without capital consumption adjustment
Capital con-
sump- tion
adjust- ment
Total
Profits Inven- tory
valu- ation
adjust- ment
Profits before
tax
Taxes on corpo- rate
income
Profits after tax
Total Net divi-
dends
Undis- tributed profits
1959 ............ 55.7 53.5 53.8 23.7 30.0 12.6 17.5 −0.3 2.2 9.6 41.1 1.1 1.8 1.0
1960 ............ 53.8 51.5 51.6 22.8 28.8 13.4 15.5 −.2 2.3 10.6 44.6 1.1 1.9 .9 1961 ............ 54.9 51.8 51.6 22.9 28.7 13.9 14.8 .3 3.0 12.5 47.0 2.0 2.0 .8 1962 ............ 63.3 57.0 57.0 24.1 32.9 15.0 17.9 .0 6.2 14.2 50.4 2.3 2.2 .9 1963 ............ 69.0 62.1 62.1 26.4 35.7 16.2 19.5 .1 6.8 15.2 53.4 2.2 2.7 1.4 1964 ............ 76.5 68.6 69.1 28.2 40.9 18.2 22.7 −.5 7.9 17.4 57.3 2.7 3.1 1.3 1965 ............ 87.5 78.9 80.2 31.1 49.1 20.2 28.9 −1.2 8.6 19.6 60.8 3.0 3.6 1.3 1966 ............ 93.2 84.6 86.7 33.9 52.8 20.7 32.1 −2.1 8.6 22.4 63.3 3.9 3.5 1.0 1967 ............ 91.3 82.0 83.5 32.9 50.6 21.5 29.1 −1.6 9.3 25.5 68.0 3.8 3.8 .9 1968 ............ 98.8 88.8 92.4 39.6 52.8 23.5 29.3 −3.7 10.0 27.1 76.5 4.2 4.3 1.2 1969 ............ 95.4 85.5 91.4 40.0 51.4 24.2 27.2 −5.9 9.9 32.7 84.0 4.5 4.9 1.0
1970 ............ 83.6 74.4 81.0 34.8 46.2 24.3 21.9 −6.6 9.2 39.1 91.5 4.8 4.5 .0 1971 ............ 98.0 88.3 92.9 38.2 54.7 25.0 29.7 −4.6 9.7 43.9 100.6 4.7 4.3 −.2 1972 ............ 112.1 101.2 107.8 42.3 65.5 26.8 38.6 −6.6 10.9 47.9 108.1 6.6 4.9 .5 1973 ............ 125.5 115.3 134.8 50.0 84.9 29.9 55.0 −19.6 10.2 55.2 117.3 5.2 6.0 −.4 1974 ............ 115.8 109.5 147.8 52.8 95.0 33.2 61.8 −38.2 6.2 70.8 125.0 3.3 7.1 −.9 1975 ............ 134.8 135.0 145.5 51.6 93.9 33.0 60.9 −10.5 −.2 81.6 135.5 4.5 9.4 −3.2 1976 ............ 163.3 165.6 179.7 65.3 114.4 39.0 75.4 −14.1 −2.3 85.5 146.6 5.1 9.5 −1.8 1977 ............ 192.4 194.7 210.4 74.4 136.0 44.8 91.2 −15.7 −2.3 101.1 159.9 7.1 8.4 −2.6 1978 ............ 216.6 222.4 246.1 84.9 161.3 50.8 110.5 −23.7 −5.8 115.0 171.2 8.9 10.6 −1.9 1979 ............ 223.2 231.8 271.9 90.0 181.9 57.5 124.4 −40.1 −8.5 138.9 180.4 8.5 13.0 −2.6
1980 ............ 201.1 211.4 253.5 87.2 166.3 64.1 102.2 −42.1 −10.2 181.8 200.7 9.8 14.4 −4.8 1981 ............ 226.1 219.1 243.7 84.3 159.4 73.8 85.6 −24.6 7.0 232.3 236.0 11.5 17.6 −4.9 1982 ............ 209.7 191.0 198.5 66.5 132.0 77.7 54.3 −7.5 18.6 271.1 241.3 15.0 20.1 −4.0 1983 ............ 264.2 226.5 233.9 80.6 153.3 83.5 69.8 −7.4 37.8 285.3 263.7 21.2 22.5 −3.1 1984 ............ 318.6 264.6 268.6 97.5 171.1 90.8 80.3 −4.0 54.0 327.1 290.2 21.0 30.1 −1.9 1985 ............ 330.3 257.5 257.4 99.4 158.0 97.6 60.5 .0 72.9 341.3 308.5 21.3 34.8 .8 1986 ............ 319.5 253.0 246.0 109.7 136.3 106.2 30.1 7.1 66.5 366.8 323.7 24.8 36.6 1.3 1987 ............ 368.8 301.4 317.6 130.4 187.2 112.3 74.9 −16.2 67.5 366.4 347.9 30.2 33.8 1.2 1988 ............ 432.6 363.9 386.1 141.6 244.4 129.9 114.5 −22.2 68.7 385.3 374.9 29.4 34.0 2.5 1989 ............ 426.6 367.4 383.7 146.1 237.7 158.0 79.7 −16.3 59.2 432.1 399.3 27.2 39.2 4.9
1990 ............ 437.8 396.6 409.5 145.4 264.1 169.1 95.0 −12.9 41.2 442.2 425.5 26.8 39.4 1.6 1991 ............ 451.2 427.9 423.0 138.6 284.4 180.7 103.7 4.9 23.3 418.2 457.5 27.3 39.9 5.7 1992 ............ 479.3 458.3 461.1 148.7 312.4 187.9 124.5 −2.8 21.1 388.5 483.8 29.9 42.4 7.6 1993 ............ 541.9 513.1 517.1 171.0 346.1 202.8 143.3 −4.0 28.8 365.7 503.4 36.4 40.7 7.2 1994 ............ 600.3 564.6 577.1 193.7 383.3 234.7 148.6 −12.4 35.7 366.4 545.6 32.2 43.3 8.6 1995 ............ 696.7 656.0 674.3 218.7 455.6 254.2 201.4 −18.3 40.7 367.1 558.2 34.0 46.9 11.4 1996 ............ 786.2 736.1 733.0 231.7 501.4 297.6 203.8 3.1 50.1 376.2 581.1 34.3 53.1 12.7 1997 ............ 868.5 812.3 798.2 246.1 552.1 334.5 217.6 14.1 56.2 415.6 612.0 32.9 49.9 12.6 1998 ............ 801.6 738.5 718.3 248.3 470.0 351.6 118.3 20.2 63.1 487.1 639.8 35.4 64.7 10.3 1999 ............ 851.3 776.8 775.9 258.6 517.2 337.4 179.9 1.0 74.5 495.4 674.0 44.2 67.4 10.1
2000 ............ 817.9 759.3 773.4 265.2 508.2 377.9 130.3 −14.1 58.6 559.0 708.9 44.3 87.1 5.3 2001 ............ 767.3 719.2 707.9 204.1 503.8 370.9 132.9 11.3 48.1 566.3 728.6 55.3 92.8 −1.4 2002 ............ 874.6 756.8 758.0 183.8 574.2 390.0 184.1 −1.2 117.8 532.9 762.6 38.2 80.9 2.8 2003 ............ 1,021.1 860.4 874.5 234.9 639.6 395.3 244.2 −14.1 160.8 543.0 798.1 46.7 77.7 9.5 2004 p .......... .............. .............. .............. .............. .............. 443.9 .............. .............. 239.4 548.2 840.1 39.9 81.7 6.7
2000: I ......... 832.6 766.8 795.4 280.8 514.6 360.3 154.4 −28.6 65.8 548.3 697.6 44.4 81.3 7.9 II ........ 833.0 773.5 784.8 272.5 512.2 377.3 135.0 −11.3 59.6 560.6 706.9 44.4 85.0 7.1 III ....... 811.8 756.3 762.6 260.3 502.3 386.6 115.7 −6.3 55.5 564.3 712.2 44.3 88.9 4.2 IV ....... 794.3 740.7 750.8 247.1 503.7 387.6 116.1 −10.1 53.6 563.0 718.7 44.1 93.1 2.2
2001: I ......... 778.7 750.5 754.6 222.5 532.1 379.2 152.9 −4.1 28.2 565.2 725.1 52.3 98.3 1.7 II ........ 783.1 756.0 755.0 217.9 537.1 370.1 167.0 1.1 27.1 569.9 726.3 58.4 104.8 −1.1 III ...... 714.5 689.1 671.1 197.6 473.6 366.0 107.5 18.0 25.4 565.5 725.6 67.3 65.7 −2.9 IV ...... 793.0 681.3 650.9 178.6 472.4 368.4 104.0 30.4 111.7 564.8 737.6 43.1 102.5 −3.4
2002: I ......... 838.2 711.7 695.8 168.9 526.9 378.7 148.2 15.9 126.6 549.2 747.3 38.9 89.6 −.9 II ........ 868.4 747.5 745.9 183.5 562.4 389.2 173.2 1.6 121.0 527.3 760.1 36.8 81.3 −.1 III ...... 876.2 761.2 773.0 188.3 584.8 395.3 189.4 −11.8 115.0 526.8 771.2 38.4 78.0 6.0 IV ...... 915.4 806.8 817.4 194.7 622.7 396.9 225.7 −10.6 108.6 528.3 771.8 38.7 74.6 6.0
2003: I ......... 912.0 798.7 826.1 224.0 602.1 396.0 206.1 −27.4 113.3 541.3 783.5 42.8 74.8 10.3 II ........ 986.2 823.5 824.5 224.6 600.0 394.7 205.3 −1.0 162.7 542.8 792.9 55.2 76.9 9.8 III ....... 1,057.1 877.2 881.0 238.7 642.3 394.1 248.1 −3.8 179.9 542.8 802.0 44.5 78.9 9.3 IV ...... 1,129.1 941.9 966.2 252.3 713.9 396.4 317.5 −24.3 187.2 545.3 813.9 44.4 80.1 8.7
2004: I ......... 1,165.6 925.4 962.4 256.5 705.9 403.4 302.5 −37.0 240.2 554.5 823.3 40.4 82.7 8.1 II ........ 1,173.9 940.6 988.3 271.2 717.1 413.2 303.9 −47.8 233.3 548.5 835.7 39.4 83.5 7.4 III ...... 1,118.0 895.0 932.8 253.3 679.5 424.0 255.5 −37.8 223.0 546.7 843.1 39.7 76.0 6.5 IV p .... .............. .............. .............. .............. .............. 534.7 .............. .............. 261.2 543.0 858.1 40.2 84.4 4.7
Source: Department of Commerce, Bureau of Economic Analysis.
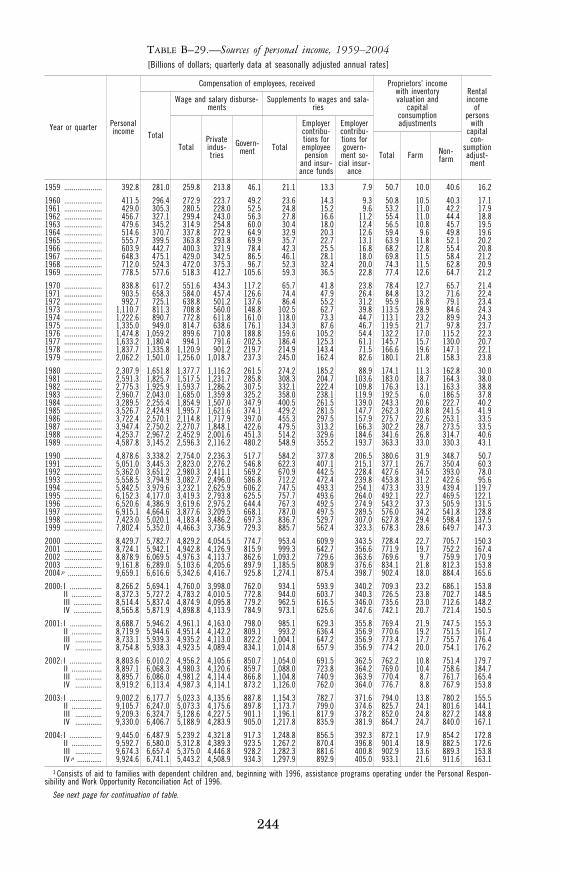
244
TABLE B–29.—Sources of personal income, 1959–2004 [Billions of dollars; quarterly data at seasonally adjusted annual rates]
Year or quarter Personal income
Compensation of employees, received Proprietors’ income with inventory valuation and
capital consumption adjustments
Rental income
of persons
with capital con-
sumption adjust- ment
Total
Wage and salary disburse-ments
Supplements to wages and sala-ries
Total Farm Non- farm
Total Private indus-tries
Govern-ment Total
Employer contribu-tions for employee pension
and insur-ance funds
Employer contribu-tions for govern-
ment so-cial insur-
ance
1959 .................... 392.8 281.0 259.8 213.8 46.1 21.1 13.3 7.9 50.7 10.0 40.6 16.2
1960 .................... 411.5 296.4 272.9 223.7 49.2 23.6 14.3 9.3 50.8 10.5 40.3 17.1 1961 .................... 429.0 305.3 280.5 228.0 52.5 24.8 15.2 9.6 53.2 11.0 42.2 17.9 1962 .................... 456.7 327.1 299.4 243.0 56.3 27.8 16.6 11.2 55.4 11.0 44.4 18.8 1963 .................... 479.6 345.2 314.9 254.8 60.0 30.4 18.0 12.4 56.5 10.8 45.7 19.5 1964 .................... 514.6 370.7 337.8 272.9 64.9 32.9 20.3 12.6 59.4 9.6 49.8 19.6 1965 .................... 555.7 399.5 363.8 293.8 69.9 35.7 22.7 13.1 63.9 11.8 52.1 20.2 1966 .................... 603.9 442.7 400.3 321.9 78.4 42.3 25.5 16.8 68.2 12.8 55.4 20.8 1967 .................... 648.3 475.1 429.0 342.5 86.5 46.1 28.1 18.0 69.8 11.5 58.4 21.2 1968 .................... 712.0 524.3 472.0 375.3 96.7 52.3 32.4 20.0 74.3 11.5 62.8 20.9 1969 .................... 778.5 577.6 518.3 412.7 105.6 59.3 36.5 22.8 77.4 12.6 64.7 21.2
1970 .................... 838.8 617.2 551.6 434.3 117.2 65.7 41.8 23.8 78.4 12.7 65.7 21.4 1971 .................... 903.5 658.3 584.0 457.4 126.6 74.4 47.9 26.4 84.8 13.2 71.6 22.4 1972 .................... 992.7 725.1 638.8 501.2 137.6 86.4 55.2 31.2 95.9 16.8 79.1 23.4 1973 .................... 1,110.7 811.3 708.8 560.0 148.8 102.5 62.7 39.8 113.5 28.9 84.6 24.3 1974 .................... 1,222.6 890.7 772.8 611.8 161.0 118.0 73.3 44.7 113.1 23.2 89.9 24.3 1975 .................... 1,335.0 949.0 814.7 638.6 176.1 134.3 87.6 46.7 119.5 21.7 97.8 23.7 1976 .................... 1,474.8 1,059.2 899.6 710.8 188.8 159.6 105.2 54.4 132.2 17.0 115.2 22.3 1977 .................... 1,633.2 1,180.4 994.1 791.6 202.5 186.4 125.3 61.1 145.7 15.7 130.0 20.7 1978 .................... 1,837.7 1,335.8 1,120.9 901.2 219.7 214.9 143.4 71.5 166.6 19.6 147.1 22.1 1979 .................... 2,062.2 1,501.0 1,256.0 1,018.7 237.3 245.0 162.4 82.6 180.1 21.8 158.3 23.8
1980 .................... 2,307.9 1,651.8 1,377.7 1,116.2 261.5 274.2 185.2 88.9 174.1 11.3 162.8 30.0 1981 .................... 2,591.3 1,825.7 1,517.5 1,231.7 285.8 308.3 204.7 103.6 183.0 18.7 164.3 38.0 1982 .................... 2,775.3 1,925.9 1,593.7 1,286.2 307.5 332.1 222.4 109.8 176.3 13.1 163.3 38.8 1983 .................... 2,960.7 2,043.0 1,685.0 1,359.8 325.2 358.0 238.1 119.9 192.5 6.0 186.5 37.8 1984 .................... 3,289.5 2,255.4 1,854.9 1,507.0 347.9 400.5 261.5 139.0 243.3 20.6 222.7 40.2 1985 .................... 3,526.7 2,424.9 1,995.7 1,621.6 374.1 429.2 281.5 147.7 262.3 20.8 241.5 41.9 1986 .................... 3,722.4 2,570.1 2,114.8 1,717.9 397.0 455.3 297.5 157.9 275.7 22.6 253.1 33.5 1987 .................... 3,947.4 2,750.2 2,270.7 1,848.1 422.6 479.5 313.2 166.3 302.2 28.7 273.5 33.5 1988 .................... 4,253.7 2,967.2 2,452.9 2,001.6 451.3 514.2 329.6 184.6 341.6 26.8 314.7 40.6 1989 .................... 4,587.8 3,145.2 2,596.3 2,116.2 480.2 548.9 355.2 193.7 363.3 33.0 330.3 43.1
1990 .................... 4,878.6 3,338.2 2,754.0 2,236.3 517.7 584.2 377.8 206.5 380.6 31.9 348.7 50.7 1991 .................... 5,051.0 3,445.3 2,823.0 2,276.2 546.8 622.3 407.1 215.1 377.1 26.7 350.4 60.3 1992 .................... 5,362.0 3,651.2 2,980.3 2,411.1 569.2 670.9 442.5 228.4 427.6 34.5 393.0 78.0 1993 .................... 5,558.5 3,794.9 3,082.7 2,496.0 586.8 712.2 472.4 239.8 453.8 31.2 422.6 95.6 1994 .................... 5,842.5 3,979.6 3,232.1 2,625.9 606.2 747.5 493.3 254.1 473.3 33.9 439.4 119.7 1995 .................... 6,152.3 4,177.0 3,419.3 2,793.8 625.5 757.7 493.6 264.0 492.1 22.7 469.5 122.1 1996 .................... 6,520.6 4,386.9 3,619.6 2,975.2 644.4 767.3 492.5 274.9 543.2 37.3 505.9 131.5 1997 .................... 6,915.1 4,664.6 3,877.6 3,209.5 668.1 787.0 497.5 289.5 576.0 34.2 541.8 128.8 1998 .................... 7,423.0 5,020.1 4,183.4 3,486.2 697.3 836.7 529.7 307.0 627.8 29.4 598.4 137.5 1999 .................... 7,802.4 5,352.0 4,466.3 3,736.9 729.3 885.7 562.4 323.3 678.3 28.6 649.7 147.3
2000 .................... 8,429.7 5,782.7 4,829.2 4,054.5 774.7 953.4 609.9 343.5 728.4 22.7 705.7 150.3 2001 .................... 8,724.1 5,942.1 4,942.8 4,126.9 815.9 999.3 642.7 356.6 771.9 19.7 752.2 167.4 2002 .................... 8,878.9 6,069.5 4,976.3 4,113.7 862.6 1,093.2 729.6 363.6 769.6 9.7 759.9 170.9 2003 .................... 9,161.8 6,289.0 5,103.6 4,205.6 897.9 1,185.5 808.9 376.6 834.1 21.8 812.3 153.8 2004 p .................. 9,659.1 6,616.6 5,342.6 4,416.7 925.8 1,274.1 875.4 398.7 902.4 18.0 884.4 165.6
2000: I ................. 8,266.2 5,694.1 4,760.0 3,998.0 762.0 934.1 593.9 340.2 709.3 23.2 686.1 153.8 II ................ 8,372.3 5,727.2 4,783.2 4,010.5 772.8 944.0 603.7 340.3 726.5 23.8 702.7 148.5 III ............... 8,514.4 5,837.4 4,874.9 4,095.8 779.2 962.5 616.5 346.0 735.6 23.0 712.6 148.2 IV ............... 8,565.8 5,871.9 4,898.8 4,113.9 784.9 973.1 625.6 347.6 742.1 20.7 721.4 150.5
2001: I ................. 8,688.7 5,946.2 4,961.1 4,163.0 798.0 985.1 629.3 355.8 769.4 21.9 747.5 155.3 II ................ 8,719.9 5,944.6 4,951.4 4,142.2 809.1 993.2 636.4 356.9 770.6 19.2 751.5 161.7 III .............. 8,733.1 5,939.3 4,935.2 4,113.0 822.2 1,004.1 647.2 356.9 773.4 17.7 755.7 176.4 IV .............. 8,754.8 5,938.3 4,923.5 4,089.4 834.1 1,014.8 657.9 356.9 774.2 20.0 754.1 176.2
2002: I ................. 8,803.6 6,010.2 4,956.2 4,105.6 850.7 1,054.0 691.5 362.5 762.2 10.8 751.4 179.7 II ................ 8,897.1 6,068.3 4,980.3 4,120.6 859.7 1,088.0 723.8 364.2 769.0 10.4 758.6 184.7 III .............. 8,895.7 6,086.0 4,981.2 4,114.4 866.8 1,104.8 740.9 363.9 770.4 8.7 761.7 165.4 IV .............. 8,919.2 6,113.4 4,987.3 4,114.1 873.2 1,126.0 762.0 364.0 776.7 8.8 767.9 153.8
2003: I ................. 9,002.2 6,177.7 5,023.3 4,135.6 887.8 1,154.3 782.7 371.6 794.0 13.8 780.2 155.5 II ................ 9,105.7 6,247.0 5,073.3 4,175.6 897.8 1,173.7 799.0 374.6 825.7 24.1 801.6 144.1 III .............. 9,209.3 6,324.7 5,128.6 4,227.5 901.1 1,196.1 817.9 378.2 852.0 24.8 827.2 148.8 IV .............. 9,330.0 6,406.7 5,188.9 4,283.9 905.0 1,217.8 835.9 381.9 864.7 24.7 840.0 167.1
2004: I ................. 9,445.0 6,487.9 5,239.2 4,321.8 917.3 1,248.8 856.5 392.3 872.1 17.9 854.2 172.8 II ................ 9,592.7 6,580.0 5,312.8 4,389.3 923.5 1,267.2 870.4 396.8 901.4 18.9 882.5 172.6 III .............. 9,674.3 6,657.4 5,375.0 4,446.8 928.2 1,282.3 881.6 400.8 902.9 13.6 889.3 153.8 IV p ............. 9,924.6 6,741.1 5,443.2 4,508.9 934.3 1,297.9 892.9 405.0 933.1 21.6 911.6 163.1
1 Consists of aid to families with dependent children and, beginning with 1996, assistance programs operating under the Personal Respon-sibility and Work Opportunity Reconciliation Act of 1996.
See next page for continuation of table.
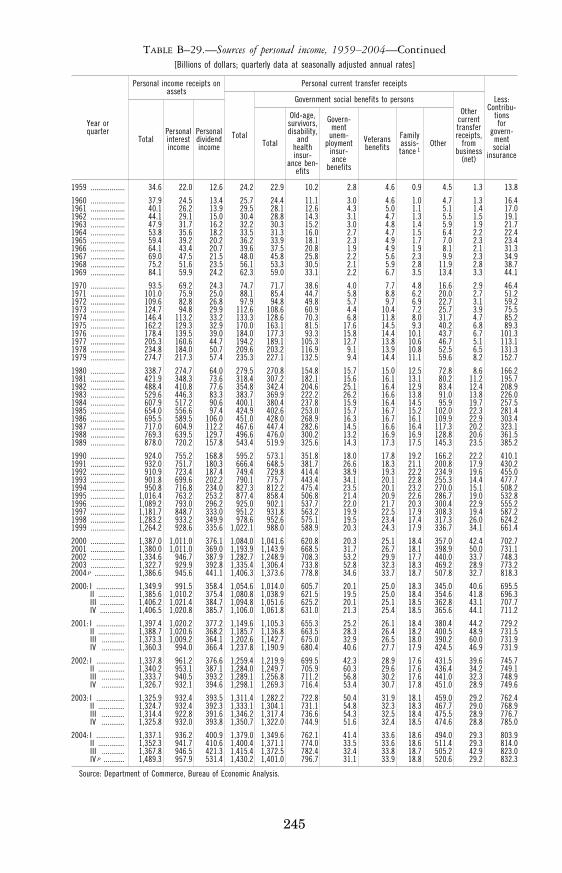
245
TABLE B–29.—Sources of personal income, 1959–2004—Continued [Billions of dollars; quarterly data at seasonally adjusted annual rates]
Year or quarter
Personal income receipts on assets
Personal current transfer receipts
Less: Contribu-
tions for
govern- ment social
insurance
Total Personal interest income
Personal dividend income
Total
Government social benefits to persons Other
current transfer receipts,
from business
(net)
Total
Old-age, survivors, disability,
and health insur-
ance ben-efits
Govern- ment
unem- ployment
insur- ance
benefits
Veterans benefits
Family assis- tance 1
Other
1959 .................. 34.6 22.0 12.6 24.2 22.9 10.2 2.8 4.6 0.9 4.5 1.3 13.8
1960 .................. 37.9 24.5 13.4 25.7 24.4 11.1 3.0 4.6 1.0 4.7 1.3 16.4 1961 .................. 40.1 26.2 13.9 29.5 28.1 12.6 4.3 5.0 1.1 5.1 1.4 17.0 1962 .................. 44.1 29.1 15.0 30.4 28.8 14.3 3.1 4.7 1.3 5.5 1.5 19.1 1963 .................. 47.9 31.7 16.2 32.2 30.3 15.2 3.0 4.8 1.4 5.9 1.9 21.7 1964 .................. 53.8 35.6 18.2 33.5 31.3 16.0 2.7 4.7 1.5 6.4 2.2 22.4 1965 .................. 59.4 39.2 20.2 36.2 33.9 18.1 2.3 4.9 1.7 7.0 2.3 23.4 1966 .................. 64.1 43.4 20.7 39.6 37.5 20.8 1.9 4.9 1.9 8.1 2.1 31.3 1967 .................. 69.0 47.5 21.5 48.0 45.8 25.8 2.2 5.6 2.3 9.9 2.3 34.9 1968 .................. 75.2 51.6 23.5 56.1 53.3 30.5 2.1 5.9 2.8 11.9 2.8 38.7 1969 .................. 84.1 59.9 24.2 62.3 59.0 33.1 2.2 6.7 3.5 13.4 3.3 44.1
1970 .................. 93.5 69.2 24.3 74.7 71.7 38.6 4.0 7.7 4.8 16.6 2.9 46.4 1971 .................. 101.0 75.9 25.0 88.1 85.4 44.7 5.8 8.8 6.2 20.0 2.7 51.2 1972 .................. 109.6 82.8 26.8 97.9 94.8 49.8 5.7 9.7 6.9 22.7 3.1 59.2 1973 .................. 124.7 94.8 29.9 112.6 108.6 60.9 4.4 10.4 7.2 25.7 3.9 75.5 1974 .................. 146.4 113.2 33.2 133.3 128.6 70.3 6.8 11.8 8.0 31.7 4.7 85.2 1975 .................. 162.2 129.3 32.9 170.0 163.1 81.5 17.6 14.5 9.3 40.2 6.8 89.3 1976 .................. 178.4 139.5 39.0 184.0 177.3 93.3 15.8 14.4 10.1 43.7 6.7 101.3 1977 .................. 205.3 160.6 44.7 194.2 189.1 105.3 12.7 13.8 10.6 46.7 5.1 113.1 1978 .................. 234.8 184.0 50.7 209.6 203.2 116.9 9.1 13.9 10.8 52.5 6.5 131.3 1979 .................. 274.7 217.3 57.4 235.3 227.1 132.5 9.4 14.4 11.1 59.6 8.2 152.7
1980 .................. 338.7 274.7 64.0 279.5 270.8 154.8 15.7 15.0 12.5 72.8 8.6 166.2 1981 .................. 421.9 348.3 73.6 318.4 307.2 182.1 15.6 16.1 13.1 80.2 11.2 195.7 1982 .................. 488.4 410.8 77.6 354.8 342.4 204.6 25.1 16.4 12.9 83.4 12.4 208.9 1983 .................. 529.6 446.3 83.3 383.7 369.9 222.2 26.2 16.6 13.8 91.0 13.8 226.0 1984 .................. 607.9 517.2 90.6 400.1 380.4 237.8 15.9 16.4 14.5 95.9 19.7 257.5 1985 .................. 654.0 556.6 97.4 424.9 402.6 253.0 15.7 16.7 15.2 102.0 22.3 281.4 1986 .................. 695.5 589.5 106.0 451.0 428.0 268.9 16.3 16.7 16.1 109.9 22.9 303.4 1987 .................. 717.0 604.9 112.2 467.6 447.4 282.6 14.5 16.6 16.4 117.3 20.2 323.1 1988 .................. 769.3 639.5 129.7 496.6 476.0 300.2 13.2 16.9 16.9 128.8 20.6 361.5 1989 .................. 878.0 720.2 157.8 543.4 519.9 325.6 14.3 17.3 17.5 145.3 23.5 385.2
1990 .................. 924.0 755.2 168.8 595.2 573.1 351.8 18.0 17.8 19.2 166.2 22.2 410.1 1991 .................. 932.0 751.7 180.3 666.4 648.5 381.7 26.6 18.3 21.1 200.8 17.9 430.2 1992 .................. 910.9 723.4 187.4 749.4 729.8 414.4 38.9 19.3 22.2 234.9 19.6 455.0 1993 .................. 901.8 699.6 202.2 790.1 775.7 443.4 34.1 20.1 22.8 255.3 14.4 477.7 1994 .................. 950.8 716.8 234.0 827.3 812.2 475.4 23.5 20.1 23.2 270.0 15.1 508.2 1995 .................. 1,016.4 763.2 253.2 877.4 858.4 506.8 21.4 20.9 22.6 286.7 19.0 532.8 1996 .................. 1,089.2 793.0 296.2 925.0 902.1 537.7 22.0 21.7 20.3 300.4 22.9 555.2 1997 .................. 1,181.7 848.7 333.0 951.2 931.8 563.2 19.9 22.5 17.9 308.3 19.4 587.2 1998 .................. 1,283.2 933.2 349.9 978.6 952.6 575.1 19.5 23.4 17.4 317.3 26.0 624.2 1999 .................. 1,264.2 928.6 335.6 1,022.1 988.0 588.9 20.3 24.3 17.9 336.7 34.1 661.4
2000 .................. 1,387.0 1,011.0 376.1 1,084.0 1,041.6 620.8 20.3 25.1 18.4 357.0 42.4 702.7 2001 .................. 1,380.0 1,011.0 369.0 1,193.9 1,143.9 668.5 31.7 26.7 18.1 398.9 50.0 731.1 2002 .................. 1,334.6 946.7 387.9 1,282.7 1,248.9 708.3 53.2 29.9 17.7 440.0 33.7 748.3 2003 .................. 1,322.7 929.9 392.8 1,335.4 1,306.4 733.8 52.8 32.3 18.3 469.2 28.9 773.2 2004 p ................ 1,386.6 945.6 441.1 1,406.3 1,373.6 778.8 34.6 33.7 18.7 507.8 32.7 818.3
2000: I ............... 1,349.9 991.5 358.4 1,054.6 1,014.0 605.7 20.1 25.0 18.3 345.0 40.6 695.5 II .............. 1,385.6 1,010.2 375.4 1,080.8 1,038.9 621.5 19.5 25.0 18.4 354.6 41.8 696.3 III ............. 1,406.2 1,021.4 384.7 1,094.8 1,051.6 625.2 20.1 25.1 18.5 362.8 43.1 707.7 IV ............. 1,406.5 1,020.8 385.7 1,106.0 1,061.8 631.0 21.3 25.4 18.5 365.6 44.1 711.2
2001: I ............... 1,397.4 1,020.2 377.2 1,149.6 1,105.3 655.3 25.2 26.1 18.4 380.4 44.2 729.2 II .............. 1,388.7 1,020.6 368.2 1,185.7 1,136.8 663.5 28.3 26.4 18.2 400.5 48.9 731.5 III ............ 1,373.3 1,009.2 364.1 1,202.6 1,142.7 675.0 32.9 26.5 18.0 390.2 60.0 731.9 IV ............ 1,360.3 994.0 366.4 1,237.8 1,190.9 680.4 40.6 27.7 17.9 424.5 46.9 731.9
2002: I ............... 1,337.8 961.2 376.6 1,259.4 1,219.9 699.5 42.3 28.9 17.6 431.5 39.6 745.7 II .............. 1,340.2 953.1 387.1 1,284.0 1,249.7 705.9 60.3 29.6 17.6 436.4 34.2 749.1 III ............ 1,333.7 940.5 393.2 1,289.1 1,256.8 711.2 56.8 30.2 17.6 441.0 32.3 748.9 IV ............ 1,326.7 932.1 394.6 1,298.1 1,269.3 716.4 53.4 30.7 17.8 451.0 28.9 749.6
2003: I ............... 1,325.9 932.4 393.5 1,311.4 1,282.2 722.8 50.4 31.9 18.1 459.0 29.2 762.4 II .............. 1,324.7 932.4 392.3 1,333.1 1,304.1 731.1 54.8 32.3 18.3 467.7 29.0 768.9 III ............ 1,314.4 922.8 391.6 1,346.2 1,317.4 736.6 54.3 32.5 18.4 475.5 28.9 776.7 IV ............ 1,325.8 932.0 393.8 1,350.7 1,322.0 744.9 51.6 32.4 18.5 474.6 28.8 785.0
2004: I ............... 1,337.1 936.2 400.9 1,379.0 1,349.6 762.1 41.4 33.6 18.6 494.0 29.3 803.9 II .............. 1,352.3 941.7 410.6 1,400.4 1,371.1 774.0 33.5 33.6 18.6 511.4 29.3 814.0 III ............ 1,367.8 946.5 421.3 1,415.4 1,372.5 782.4 32.4 33.8 18.7 505.2 42.9 823.0 IV p ........... 1,489.3 957.9 531.4 1,430.2 1,401.0 796.7 31.1 33.9 18.8 520.6 29.2 832.3
Source: Department of Commerce, Bureau of Economic Analysis.
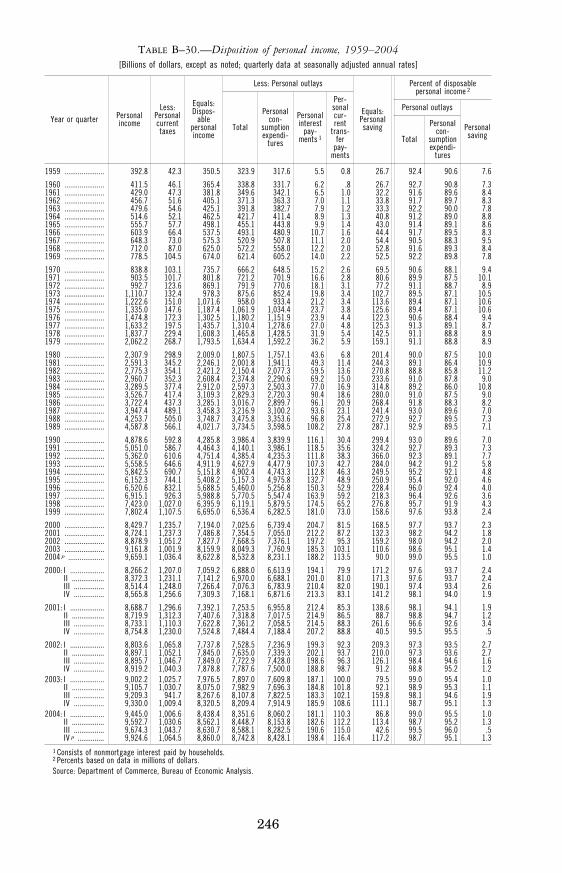
246
TABLE B–30.—Disposition of personal income, 1959–2004 [Billions of dollars, except as noted; quarterly data at seasonally adjusted annual rates]
Year or quarter Personal income
Less: Personal current taxes
Equals: Dispos-
able personal income
Less: Personal outlays
Equals: Personal saving
Percent of disposable personal income 2
Total
Personal con-
sumption expendi-
tures
Personal interest
pay-ments 1
Per- sonal cur-rent
trans-fer
pay-ments
Personal outlays
Personal saving Total
Personal con-
sumption expendi-
tures
1959 ..................... 392.8 42.3 350.5 323.9 317.6 5.5 0.8 26.7 92.4 90.6 7.6
1960 ..................... 411.5 46.1 365.4 338.8 331.7 6.2 .8 26.7 92.7 90.8 7.3 1961 ..................... 429.0 47.3 381.8 349.6 342.1 6.5 1.0 32.2 91.6 89.6 8.4 1962 ..................... 456.7 51.6 405.1 371.3 363.3 7.0 1.1 33.8 91.7 89.7 8.3 1963 ..................... 479.6 54.6 425.1 391.8 382.7 7.9 1.2 33.3 92.2 90.0 7.8 1964 ..................... 514.6 52.1 462.5 421.7 411.4 8.9 1.3 40.8 91.2 89.0 8.8 1965 ..................... 555.7 57.7 498.1 455.1 443.8 9.9 1.4 43.0 91.4 89.1 8.6 1966 ..................... 603.9 66.4 537.5 493.1 480.9 10.7 1.6 44.4 91.7 89.5 8.3 1967 ..................... 648.3 73.0 575.3 520.9 507.8 11.1 2.0 54.4 90.5 88.3 9.5 1968 ..................... 712.0 87.0 625.0 572.2 558.0 12.2 2.0 52.8 91.6 89.3 8.4 1969 ..................... 778.5 104.5 674.0 621.4 605.2 14.0 2.2 52.5 92.2 89.8 7.8
1970 ..................... 838.8 103.1 735.7 666.2 648.5 15.2 2.6 69.5 90.6 88.1 9.4 1971 ..................... 903.5 101.7 801.8 721.2 701.9 16.6 2.8 80.6 89.9 87.5 10.1 1972 ..................... 992.7 123.6 869.1 791.9 770.6 18.1 3.1 77.2 91.1 88.7 8.9 1973 ..................... 1,110.7 132.4 978.3 875.6 852.4 19.8 3.4 102.7 89.5 87.1 10.5 1974 ..................... 1,222.6 151.0 1,071.6 958.0 933.4 21.2 3.4 113.6 89.4 87.1 10.6 1975 ..................... 1,335.0 147.6 1,187.4 1,061.9 1,034.4 23.7 3.8 125.6 89.4 87.1 10.6 1976 ..................... 1,474.8 172.3 1,302.5 1,180.2 1,151.9 23.9 4.4 122.3 90.6 88.4 9.4 1977 ..................... 1,633.2 197.5 1,435.7 1,310.4 1,278.6 27.0 4.8 125.3 91.3 89.1 8.7 1978 ..................... 1,837.7 229.4 1,608.3 1,465.8 1,428.5 31.9 5.4 142.5 91.1 88.8 8.9 1979 ..................... 2,062.2 268.7 1,793.5 1,634.4 1,592.2 36.2 5.9 159.1 91.1 88.8 8.9
1980 ..................... 2,307.9 298.9 2,009.0 1,807.5 1,757.1 43.6 6.8 201.4 90.0 87.5 10.0 1981 ..................... 2,591.3 345.2 2,246.1 2,001.8 1,941.1 49.3 11.4 244.3 89.1 86.4 10.9 1982 ..................... 2,775.3 354.1 2,421.2 2,150.4 2,077.3 59.5 13.6 270.8 88.8 85.8 11.2 1983 ..................... 2,960.7 352.3 2,608.4 2,374.8 2,290.6 69.2 15.0 233.6 91.0 87.8 9.0 1984 ..................... 3,289.5 377.4 2,912.0 2,597.3 2,503.3 77.0 16.9 314.8 89.2 86.0 10.8 1985 ..................... 3,526.7 417.4 3,109.3 2,829.3 2,720.3 90.4 18.6 280.0 91.0 87.5 9.0 1986 ..................... 3,722.4 437.3 3,285.1 3,016.7 2,899.7 96.1 20.9 268.4 91.8 88.3 8.2 1987 ..................... 3,947.4 489.1 3,458.3 3,216.9 3,100.2 93.6 23.1 241.4 93.0 89.6 7.0 1988 ..................... 4,253.7 505.0 3,748.7 3,475.8 3,353.6 96.8 25.4 272.9 92.7 89.5 7.3 1989 ..................... 4,587.8 566.1 4,021.7 3,734.5 3,598.5 108.2 27.8 287.1 92.9 89.5 7.1
1990 ..................... 4,878.6 592.8 4,285.8 3,986.4 3,839.9 116.1 30.4 299.4 93.0 89.6 7.0 1991 ..................... 5,051.0 586.7 4,464.3 4,140.1 3,986.1 118.5 35.6 324.2 92.7 89.3 7.3 1992 ..................... 5,362.0 610.6 4,751.4 4,385.4 4,235.3 111.8 38.3 366.0 92.3 89.1 7.7 1993 ..................... 5,558.5 646.6 4,911.9 4,627.9 4,477.9 107.3 42.7 284.0 94.2 91.2 5.8 1994 ..................... 5,842.5 690.7 5,151.8 4,902.4 4,743.3 112.8 46.3 249.5 95.2 92.1 4.8 1995 ..................... 6,152.3 744.1 5,408.2 5,157.3 4,975.8 132.7 48.9 250.9 95.4 92.0 4.6 1996 ..................... 6,520.6 832.1 5,688.5 5,460.0 5,256.8 150.3 52.9 228.4 96.0 92.4 4.0 1997 ..................... 6,915.1 926.3 5,988.8 5,770.5 5,547.4 163.9 59.2 218.3 96.4 92.6 3.6 1998 ..................... 7,423.0 1,027.0 6,395.9 6,119.1 5,879.5 174.5 65.2 276.8 95.7 91.9 4.3 1999 ..................... 7,802.4 1,107.5 6,695.0 6,536.4 6,282.5 181.0 73.0 158.6 97.6 93.8 2.4
2000 ..................... 8,429.7 1,235.7 7,194.0 7,025.6 6,739.4 204.7 81.5 168.5 97.7 93.7 2.3 2001 ..................... 8,724.1 1,237.3 7,486.8 7,354.5 7,055.0 212.2 87.2 132.3 98.2 94.2 1.8 2002 ..................... 8,878.9 1,051.2 7,827.7 7,668.5 7,376.1 197.2 95.3 159.2 98.0 94.2 2.0 2003 ..................... 9,161.8 1,001.9 8,159.9 8,049.3 7,760.9 185.3 103.1 110.6 98.6 95.1 1.4 2004 p ................... 9,659.1 1,036.4 8,622.8 8,532.8 8,231.1 188.2 113.5 90.0 99.0 95.5 1.0
2000: I .................. 8,266.2 1,207.0 7,059.2 6,888.0 6,613.9 194.1 79.9 171.2 97.6 93.7 2.4 II ................. 8,372.3 1,231.1 7,141.2 6,970.0 6,688.1 201.0 81.0 171.3 97.6 93.7 2.4 III ................ 8,514.4 1,248.0 7,266.4 7,076.3 6,783.9 210.4 82.0 190.1 97.4 93.4 2.6 IV ................ 8,565.8 1,256.6 7,309.3 7,168.1 6,871.6 213.3 83.1 141.2 98.1 94.0 1.9
2001: I .................. 8,688.7 1,296.6 7,392.1 7,253.5 6,955.8 212.4 85.3 138.6 98.1 94.1 1.9 II ................. 8,719.9 1,312.3 7,407.6 7,318.8 7,017.5 214.9 86.5 88.7 98.8 94.7 1.2 III ................ 8,733.1 1,110.3 7,622.8 7,361.2 7,058.5 214.5 88.3 261.6 96.6 92.6 3.4 IV ................ 8,754.8 1,230.0 7,524.8 7,484.4 7,188.4 207.2 88.8 40.5 99.5 95.5 .5
2002: I .................. 8,803.6 1,065.8 7,737.8 7,528.5 7,236.9 199.3 92.3 209.3 97.3 93.5 2.7 II ................. 8,897.1 1,052.1 7,845.0 7,635.0 7,339.3 202.1 93.7 210.0 97.3 93.6 2.7 III ................ 8,895.7 1,046.7 7,849.0 7,722.9 7,428.0 198.6 96.3 126.1 98.4 94.6 1.6 IV ................ 8,919.2 1,040.3 7,878.8 7,787.6 7,500.0 188.8 98.7 91.2 98.8 95.2 1.2
2003: I .................. 9,002.2 1,025.7 7,976.5 7,897.0 7,609.8 187.1 100.0 79.5 99.0 95.4 1.0 II ................. 9,105.7 1,030.7 8,075.0 7,982.9 7,696.3 184.8 101.8 92.1 98.9 95.3 1.1 III ................ 9,209.3 941.7 8,267.6 8,107.8 7,822.5 183.3 102.1 159.8 98.1 94.6 1.9 IV ................ 9,330.0 1,009.4 8,320.5 8,209.4 7,914.9 185.9 108.6 111.1 98.7 95.1 1.3
2004: I .................. 9,445.0 1,006.6 8,438.4 8,351.6 8,060.2 181.1 110.3 86.8 99.0 95.5 1.0 II ................. 9,592.7 1,030.6 8,562.1 8,448.7 8,153.8 182.6 112.2 113.4 98.7 95.2 1.3 III ................ 9,674.3 1,043.7 8,630.7 8,588.1 8,282.5 190.6 115.0 42.6 99.5 96.0 .5 IV p .............. 9,924.6 1,064.5 8,860.0 8,742.8 8,428.1 198.4 116.4 117.2 98.7 95.1 1.3
1 Consists of nonmortgage interest paid by households. 2 Percents based on data in millions of dollars. Source: Department of Commerce, Bureau of Economic Analysis.
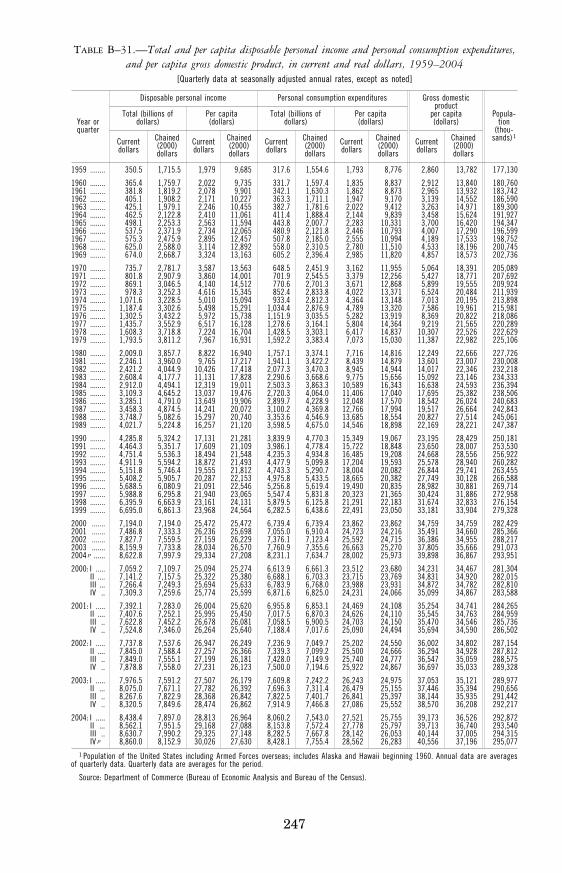
247
TABLE B–31.—Total and per capita disposable personal income and personal consumption expenditures, and per capita gross domestic product, in current and real dollars, 1959–2004
[Quarterly data at seasonally adjusted annual rates, except as noted]
Year or quarter
Disposable personal income Personal consumption expenditures Gross domestic product
per capita (dollars)
Popula- tion
(thou- sands) 1
Total (billions of dollars)
Per capita (dollars)
Total (billions of dollars)
Per capita (dollars)
Current dollars
Chained (2000) dollars
Current dollars
Chained (2000) dollars
Current dollars
Chained (2000) dollars
Current dollars
Chained (2000) dollars
Current dollars
Chained (2000) dollars
1959 ........ 350.5 1,715.5 1,979 9,685 317.6 1,554.6 1,793 8,776 2,860 13,782 177,130
1960 ........ 365.4 1,759.7 2,022 9,735 331.7 1,597.4 1,835 8,837 2,912 13,840 180,760 1961 ........ 381.8 1,819.2 2,078 9,901 342.1 1,630.3 1,862 8,873 2,965 13,932 183,742 1962 ........ 405.1 1,908.2 2,171 10,227 363.3 1,711.1 1,947 9,170 3,139 14,552 186,590 1963 ........ 425.1 1,979.1 2,246 10,455 382.7 1,781.6 2,022 9,412 3,263 14,971 189,300 1964 ........ 462.5 2,122.8 2,410 11,061 411.4 1,888.4 2,144 9,839 3,458 15,624 191,927 1965 ........ 498.1 2,253.3 2,563 11,594 443.8 2,007.7 2,283 10,331 3,700 16,420 194,347 1966 ........ 537.5 2,371.9 2,734 12,065 480.9 2,121.8 2,446 10,793 4,007 17,290 196,599 1967 ........ 575.3 2,475.9 2,895 12,457 507.8 2,185.0 2,555 10,994 4,189 17,533 198,752 1968 ........ 625.0 2,588.0 3,114 12,892 558.0 2,310.5 2,780 11,510 4,533 18,196 200,745 1969 ........ 674.0 2,668.7 3,324 13,163 605.2 2,396.4 2,985 11,820 4,857 18,573 202,736
1970 ........ 735.7 2,781.7 3,587 13,563 648.5 2,451.9 3,162 11,955 5,064 18,391 205,089 1971 ........ 801.8 2,907.9 3,860 14,001 701.9 2,545.5 3,379 12,256 5,427 18,771 207,692 1972 ........ 869.1 3,046.5 4,140 14,512 770.6 2,701.3 3,671 12,868 5,899 19,555 209,924 1973 ........ 978.3 3,252.3 4,616 15,345 852.4 2,833.8 4,022 13,371 6,524 20,484 211,939 1974 ........ 1,071.6 3,228.5 5,010 15,094 933.4 2,812.3 4,364 13,148 7,013 20,195 213,898 1975 ........ 1,187.4 3,302.6 5,498 15,291 1,034.4 2,876.9 4,789 13,320 7,586 19,961 215,981 1976 ........ 1,302.5 3,432.2 5,972 15,738 1,151.9 3,035.5 5,282 13,919 8,369 20,822 218,086 1977 ........ 1,435.7 3,552.9 6,517 16,128 1,278.6 3,164.1 5,804 14,364 9,219 21,565 220,289 1978 ........ 1,608.3 3,718.8 7,224 16,704 1,428.5 3,303.1 6,417 14,837 10,307 22,526 222,629 1979 ........ 1,793.5 3,811.2 7,967 16,931 1,592.2 3,383.4 7,073 15,030 11,387 22,982 225,106
1980 ........ 2,009.0 3,857.7 8,822 16,940 1,757.1 3,374.1 7,716 14,816 12,249 22,666 227,726 1981 ........ 2,246.1 3,960.0 9,765 17,217 1,941.1 3,422.2 8,439 14,879 13,601 23,007 230,008 1982 ........ 2,421.2 4,044.9 10,426 17,418 2,077.3 3,470.3 8,945 14,944 14,017 22,346 232,218 1983 ........ 2,608.4 4,177.7 11,131 17,828 2,290.6 3,668.6 9,775 15,656 15,092 23,146 234,333 1984 ........ 2,912.0 4,494.1 12,319 19,011 2,503.3 3,863.3 10,589 16,343 16,638 24,593 236,394 1985 ........ 3,109.3 4,645.2 13,037 19,476 2,720.3 4,064.0 11,406 17,040 17,695 25,382 238,506 1986 ........ 3,285.1 4,791.0 13,649 19,906 2,899.7 4,228.9 12,048 17,570 18,542 26,024 240,683 1987 ........ 3,458.3 4,874.5 14,241 20,072 3,100.2 4,369.8 12,766 17,994 19,517 26,664 242,843 1988 ........ 3,748.7 5,082.6 15,297 20,740 3,353.6 4,546.9 13,685 18,554 20,827 27,514 245,061 1989 ........ 4,021.7 5,224.8 16,257 21,120 3,598.5 4,675.0 14,546 18,898 22,169 28,221 247,387
1990 ........ 4,285.8 5,324.2 17,131 21,281 3,839.9 4,770.3 15,349 19,067 23,195 28,429 250,181 1991 ........ 4,464.3 5,351.7 17,609 21,109 3,986.1 4,778.4 15,722 18,848 23,650 28,007 253,530 1992 ........ 4,751.4 5,536.3 18,494 21,548 4,235.3 4,934.8 16,485 19,208 24,668 28,556 256,922 1993 ........ 4,911.9 5,594.2 18,872 21,493 4,477.9 5,099.8 17,204 19,593 25,578 28,940 260,282 1994 ........ 5,151.8 5,746.4 19,555 21,812 4,743.3 5,290.7 18,004 20,082 26,844 29,741 263,455 1995 ........ 5,408.2 5,905.7 20,287 22,153 4,975.8 5,433.5 18,665 20,382 27,749 30,128 266,588 1996 ........ 5,688.5 6,080.9 21,091 22,546 5,256.8 5,619.4 19,490 20,835 28,982 30,881 269,714 1997 ........ 5,988.8 6,295.8 21,940 23,065 5,547.4 5,831.8 20,323 21,365 30,424 31,886 272,958 1998 ........ 6,395.9 6,663.9 23,161 24,131 5,879.5 6,125.8 21,291 22,183 31,674 32,833 276,154 1999 ........ 6,695.0 6,861.3 23,968 24,564 6,282.5 6,438.6 22,491 23,050 33,181 33,904 279,328
2000 ....... 7,194.0 7,194.0 25,472 25,472 6,739.4 6,739.4 23,862 23,862 34,759 34,759 282,429 2001 ....... 7,486.8 7,333.3 26,236 25,698 7,055.0 6,910.4 24,723 24,216 35,491 34,660 285,366 2002 ....... 7,827.7 7,559.5 27,159 26,229 7,376.1 7,123.4 25,592 24,715 36,386 34,955 288,217 2003 ....... 8,159.9 7,733.8 28,034 26,570 7,760.9 7,355.6 26,663 25,270 37,805 35,666 291,073 2004 p ...... 8,622.8 7,997.9 29,334 27,208 8,231.1 7,634.7 28,002 25,973 39,898 36,867 293,951
2000: I ..... 7,059.2 7,109.7 25,094 25,274 6,613.9 6,661.3 23,512 23,680 34,231 34,467 281,304 II .... 7,141.2 7,157.5 25,322 25,380 6,688.1 6,703.3 23,715 23,769 34,831 34,920 282,015 III ... 7,266.4 7,249.3 25,694 25,633 6,783.9 6,768.0 23,988 23,931 34,872 34,782 282,810 IV .. 7,309.3 7,259.6 25,774 25,599 6,871.6 6,825.0 24,231 24,066 35,099 34,867 283,588
2001: I ..... 7,392.1 7,283.0 26,004 25,620 6,955.8 6,853.1 24,469 24,108 35,254 34,741 284,265 II .... 7,407.6 7,252.1 25,995 25,450 7,017.5 6,870.3 24,626 24,110 35,545 34,763 284,959 III .. 7,622.8 7,452.2 26,678 26,081 7,058.5 6,900.5 24,703 24,150 35,470 34,546 285,736 IV .. 7,524.8 7,346.0 26,264 25,640 7,188.4 7,017.6 25,090 24,494 35,694 34,590 286,502
2002: I ..... 7,737.8 7,537.6 26,947 26,249 7,236.9 7,049.7 25,202 24,550 36,002 34,802 287,154 II .... 7,845.0 7,588.4 27,257 26,366 7,339.3 7,099.2 25,500 24,666 36,294 34,928 287,812 III .. 7,849.0 7,555.1 27,199 26,181 7,428.0 7,149.9 25,740 24,777 36,547 35,059 288,575 IV .. 7,878.8 7,558.0 27,231 26,123 7,500.0 7,194.6 25,922 24,867 36,697 35,033 289,328
2003: I ..... 7,976.5 7,591.2 27,507 26,179 7,609.8 7,242.2 26,243 24,975 37,053 35,121 289,977 II ... 8,075.0 7,671.1 27,782 26,392 7,696.3 7,311.4 26,479 25,155 37,446 35,394 290,656 III .. 8,267.6 7,822.9 28,368 26,842 7,822.5 7,401.7 26,841 25,397 38,144 35,935 291,442 IV .. 8,320.5 7,849.6 28,474 26,862 7,914.9 7,466.8 27,086 25,552 38,570 36,208 292,217
2004: I ..... 8,438.4 7,897.0 28,813 26,964 8,060.2 7,543.0 27,521 25,755 39,173 36,526 292,872 II ... 8,562.1 7,951.5 29,168 27,088 8,153.8 7,572.4 27,778 25,797 39,713 36,740 293,540 III .. 8,630.7 7,990.2 29,325 27,148 8,282.5 7,667.8 28,142 26,053 40,144 37,005 294,315 IV p 8,860.0 8,152.9 30,026 27,630 8,428.1 7,755.4 28,562 26,283 40,556 37,196 295,077
1 Population of the United States including Armed Forces overseas; includes Alaska and Hawaii beginning 1960. Annual data are averages of quarterly data. Quarterly data are averages for the period.
Source: Department of Commerce (Bureau of Economic Analysis and Bureau of the Census).
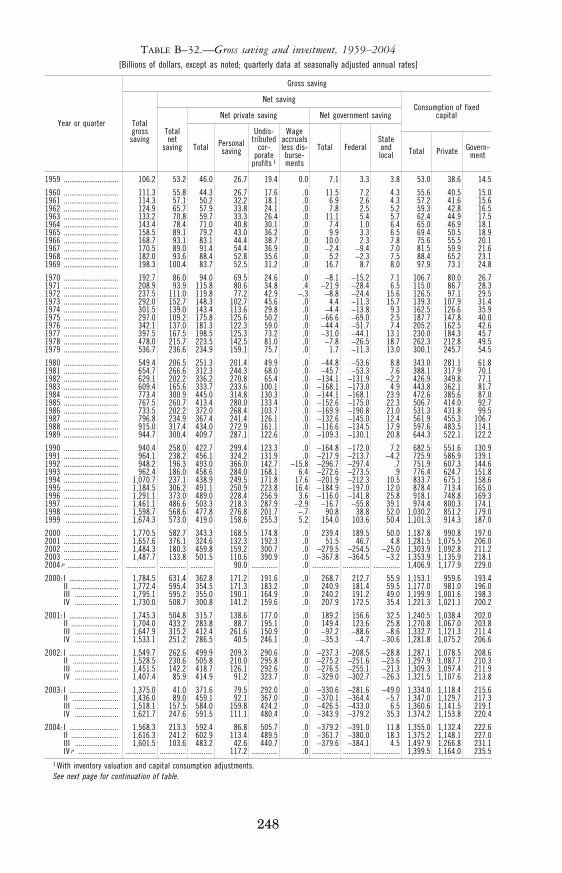
248
TABLE B–32.—Gross saving and investment, 1959–2004 [Billions of dollars, except as noted; quarterly data at seasonally adjusted annual rates]
Year or quarter
Gross saving
Total gross saving
Net saving Consumption of fixed
capital
Total net
saving
Net private saving Net government saving
Total Private Govern-ment
Total Personal saving
Undis-tributed
cor-porate
profits 1
Wage accruals less dis-burse-ments
Total Federal State and local
1959 ............................. 106.2 53.2 46.0 26.7 19.4 0.0 7.1 3.3 3.8 53.0 38.6 14.5
1960 ............................. 111.3 55.8 44.3 26.7 17.6 .0 11.5 7.2 4.3 55.6 40.5 15.0 1961 ............................. 114.3 57.1 50.2 32.2 18.1 .0 6.9 2.6 4.3 57.2 41.6 15.6 1962 ............................. 124.9 65.7 57.9 33.8 24.1 .0 7.8 2.5 5.2 59.3 42.8 16.5 1963 ............................. 133.2 70.8 59.7 33.3 26.4 .0 11.1 5.4 5.7 62.4 44.9 17.5 1964 ............................. 143.4 78.4 71.0 40.8 30.1 .0 7.4 1.0 6.4 65.0 46.9 18.1 1965 ............................. 158.5 89.1 79.2 43.0 36.2 .0 9.9 3.3 6.5 69.4 50.5 18.9 1966 ............................. 168.7 93.1 83.1 44.4 38.7 .0 10.0 2.3 7.8 75.6 55.5 20.1 1967 ............................. 170.5 89.0 91.4 54.4 36.9 .0 −2.4 −9.4 7.0 81.5 59.9 21.6 1968 ............................. 182.0 93.6 88.4 52.8 35.6 .0 5.2 −2.3 7.5 88.4 65.2 23.1 1969 ............................. 198.3 100.4 83.7 52.5 31.2 .0 16.7 8.7 8.0 97.9 73.1 24.8
1970 ............................. 192.7 86.0 94.0 69.5 24.6 .0 −8.1 −15.2 7.1 106.7 80.0 26.7 1971 ............................. 208.9 93.9 115.8 80.6 34.8 .4 −21.9 −28.4 6.5 115.0 86.7 28.3 1972 ............................. 237.5 111.0 119.8 77.2 42.9 −.3 −8.8 −24.4 15.6 126.5 97.1 29.5 1973 ............................. 292.0 152.7 148.3 102.7 45.6 .0 4.4 −11.3 15.7 139.3 107.9 31.4 1974 ............................. 301.5 139.0 143.4 113.6 29.8 .0 −4.4 −13.8 9.3 162.5 126.6 35.9 1975 ............................. 297.0 109.2 175.8 125.6 50.2 .0 −66.6 −69.0 2.5 187.7 147.8 40.0 1976 ............................. 342.1 137.0 181.3 122.3 59.0 .0 −44.4 −51.7 7.4 205.2 162.5 42.6 1977 ............................. 397.5 167.5 198.5 125.3 73.2 .0 −31.0 −44.1 13.1 230.0 184.3 45.7 1978 ............................. 478.0 215.7 223.5 142.5 81.0 .0 −7.8 −26.5 18.7 262.3 212.8 49.5 1979 ............................. 536.7 236.6 234.9 159.1 75.7 .0 1.7 −11.3 13.0 300.1 245.7 54.5
1980 ............................. 549.4 206.5 251.3 201.4 49.9 .0 −44.8 −53.6 8.8 343.0 281.1 61.8 1981 ............................. 654.7 266.6 312.3 244.3 68.0 .0 −45.7 −53.3 7.6 388.1 317.9 70.1 1982 ............................. 629.1 202.2 336.2 270.8 65.4 .0 −134.1 −131.9 −2.2 426.9 349.8 77.1 1983 ............................. 609.4 165.6 333.7 233.6 100.1 .0 −168.1 −173.0 4.9 443.8 362.1 81.7 1984 ............................. 773.4 300.9 445.0 314.8 130.3 .0 −144.1 −168.1 23.9 472.6 385.6 87.0 1985 ............................. 767.5 260.7 413.4 280.0 133.4 .0 −152.6 −175.0 22.3 506.7 414.0 92.7 1986 ............................. 733.5 202.2 372.0 268.4 103.7 .0 −169.9 −190.8 21.0 531.3 431.8 99.5 1987 ............................. 796.8 234.9 367.4 241.4 126.1 .0 −132.6 −145.0 12.4 561.9 455.3 106.7 1988 ............................. 915.0 317.4 434.0 272.9 161.1 .0 −116.6 −134.5 17.9 597.6 483.5 114.1 1989 ............................. 944.7 300.4 409.7 287.1 122.6 .0 −109.3 −130.1 20.8 644.3 522.1 122.2
1990 ............................. 940.4 258.0 422.7 299.4 123.3 .0 −164.8 −172.0 7.2 682.5 551.6 130.9 1991 ............................. 964.1 238.2 456.1 324.2 131.9 .0 −217.9 −213.7 −4.2 725.9 586.9 139.1 1992 ............................. 948.2 196.3 493.0 366.0 142.7 −15.8 −296.7 −297.4 .7 751.9 607.3 144.6 1993 ............................. 962.4 186.0 458.6 284.0 168.1 6.4 −272.6 −273.5 .9 776.4 624.7 151.8 1994 ............................. 1,070.7 237.1 438.9 249.5 171.8 17.6 −201.9 −212.3 10.5 833.7 675.1 158.6 1995 ............................. 1,184.5 306.2 491.1 250.9 223.8 16.4 −184.9 −197.0 12.0 878.4 713.4 165.0 1996 ............................. 1,291.1 373.0 489.0 228.4 256.9 3.6 −116.0 −141.8 25.8 918.1 748.8 169.3 1997 ............................. 1,461.1 486.6 503.3 218.3 287.9 −2.9 −16.7 −55.8 39.1 974.4 800.3 174.1 1998 ............................. 1,598.7 568.6 477.8 276.8 201.7 −.7 90.8 38.8 52.0 1,030.2 851.2 179.0 1999 ............................ 1,674.3 573.0 419.0 158.6 255.3 5.2 154.0 103.6 50.4 1,101.3 914.3 187.0
2000 ............................ 1,770.5 582.7 343.3 168.5 174.8 .0 239.4 189.5 50.0 1,187.8 990.8 197.0 2001 ............................. 1,657.6 376.1 324.6 132.3 192.3 .0 51.5 46.7 4.8 1,281.5 1,075.5 206.0 2002 ............................. 1,484.3 180.3 459.8 159.2 300.7 .0 −279.5 −254.5 −25.0 1,303.9 1,092.8 211.2 2003 ............................. 1,487.7 133.8 501.5 110.6 390.9 .0 −367.8 −364.5 −3.2 1,353.9 1,135.9 218.1 2004 p ........................... ................ .............. ............ 90.0 .............. .0 .............. .............. .............. 1,406.9 1,177.9 229.0
2000: I .......................... 1,784.5 631.4 362.8 171.2 191.6 .0 268.7 212.7 55.9 1,153.1 959.6 193.4 II ......................... 1,772.4 595.4 354.5 171.3 183.2 .0 240.9 181.4 59.5 1,177.0 981.0 196.0 III ....................... 1,795.1 595.2 355.0 190.1 164.9 .0 240.2 191.2 49.0 1,199.9 1,001.6 198.3 IV ....................... 1,730.0 508.7 300.8 141.2 159.6 .0 207.9 172.5 35.4 1,221.3 1,021.1 200.2
2001: I .......................... 1,745.3 504.8 315.7 138.6 177.0 .0 189.2 156.6 32.5 1,240.5 1,038.4 202.0 II ......................... 1,704.0 433.2 283.8 88.7 195.1 .0 149.4 123.6 25.8 1,270.8 1,067.0 203.8 III ....................... 1,647.9 315.2 412.4 261.6 150.9 .0 −97.2 −88.6 −8.6 1,332.7 1,121.3 211.4 IV ....................... 1,533.1 251.2 286.5 40.5 246.1 .0 −35.3 −4.7 −30.6 1,281.8 1,075.2 206.6
2002: I .......................... 1,549.7 262.6 499.9 209.3 290.6 .0 −237.3 −208.5 −28.8 1,287.1 1,078.5 208.6 II ........................ 1,528.5 230.6 505.8 210.0 295.8 .0 −275.2 −251.6 −23.6 1,297.9 1,087.7 210.3 III ....................... 1,451.5 142.2 418.7 126.1 292.6 .0 −276.5 −255.1 −21.3 1,309.3 1,097.4 211.9 IV ....................... 1,407.4 85.9 414.9 91.2 323.7 .0 −329.0 −302.7 −26.3 1,321.5 1,107.6 213.8
2003: I .......................... 1,375.0 41.0 371.6 79.5 292.0 .0 −330.6 −281.6 −49.0 1,334.0 1,118.4 215.6 II ........................ 1,436.0 89.0 459.1 92.1 367.0 .0 −370.1 −364.4 −5.7 1,347.0 1,129.7 217.3 III ....................... 1,518.1 157.5 584.0 159.8 424.2 .0 −426.5 −433.0 6.5 1,360.6 1,141.5 219.1 IV ....................... 1,621.7 247.6 591.5 111.1 480.4 .0 −343.9 −379.2 35.3 1,374.2 1,153.8 220.4
2004: I .......................... 1,568.3 213.3 592.4 86.8 505.7 .0 −379.2 −391.0 11.8 1,355.0 1,132.4 222.6 II ......................... 1,616.3 241.2 602.9 113.4 489.5 .0 −361.7 −380.0 18.3 1,375.2 1,148.1 227.0 III ....................... 1,601.5 103.6 483.2 42.6 440.7 .0 −379.6 −384.1 4.5 1,497.9 1,266.8 231.1 IV p ..................... ................ .............. ............ 117.2 .............. .0 .............. .............. .............. 1,399.5 1,164.0 235.5
1 With inventory valuation and capital consumption adjustments. See next page for continuation of table.
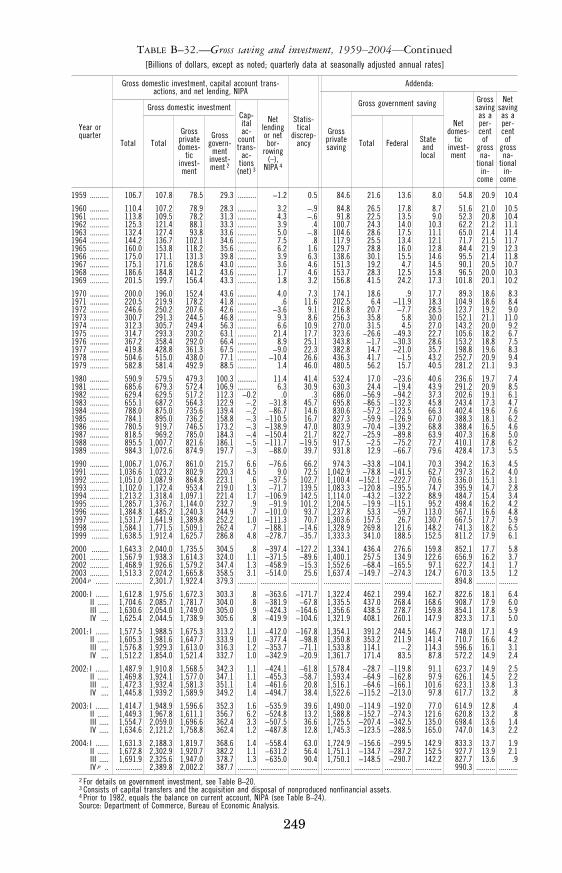
249
TABLE B–32.—Gross saving and investment, 1959–2004—Continued [Billions of dollars, except as noted; quarterly data at seasonally adjusted annual rates]
Year or quarter
Gross domestic investment, capital account trans-actions, and net lending, NIPA
Statis-tical
discrep-ancy
Addenda:
Total
Gross domestic investment Cap-ital ac-
count trans-
ac-tions
(net) 3
Net lending or net bor-
rowing (–),
NIPA 4
Gross private saving
Gross government saving
Net domes-
tic invest-ment
Gross saving as a per-cent of
gross na-
tional in-
come
Net saving as a per-cent of
gross na-
tional in-
come
Total Gross
private domes-
tic invest- ment
Gross govern-
ment invest- ment 2
Total Federal State and local
1959 .......... 106.7 107.8 78.5 29.3 .......... −1.2 0.5 84.6 21.6 13.6 8.0 54.8 20.9 10.4
1960 .......... 110.4 107.2 78.9 28.3 .......... 3.2 −.9 84.8 26.5 17.8 8.7 51.6 21.0 10.5 1961 .......... 113.8 109.5 78.2 31.3 .......... 4.3 −.6 91.8 22.5 13.5 9.0 52.3 20.8 10.4 1962 .......... 125.3 121.4 88.1 33.3 .......... 3.9 .4 100.7 24.3 14.0 10.3 62.2 21.2 11.1 1963 .......... 132.4 127.4 93.8 33.6 .......... 5.0 −.8 104.6 28.6 17.5 11.1 65.0 21.4 11.4 1964 .......... 144.2 136.7 102.1 34.6 .......... 7.5 .8 117.9 25.5 13.4 12.1 71.7 21.5 11.7 1965 .......... 160.0 153.8 118.2 35.6 .......... 6.2 1.6 129.7 28.8 16.0 12.8 84.4 21.9 12.3 1966 .......... 175.0 171.1 131.3 39.8 .......... 3.9 6.3 138.6 30.1 15.5 14.6 95.5 21.4 11.8 1967 .......... 175.1 171.6 128.6 43.0 .......... 3.6 4.6 151.3 19.2 4.7 14.5 90.1 20.5 10.7 1968 .......... 186.6 184.8 141.2 43.6 .......... 1.7 4.6 153.7 28.3 12.5 15.8 96.5 20.0 10.3 1969 .......... 201.5 199.7 156.4 43.3 .......... 1.8 3.2 156.8 41.5 24.2 17.3 101.8 20.1 10.2
1970 .......... 200.0 196.0 152.4 43.6 .......... 4.0 7.3 174.1 18.6 .9 17.7 89.3 18.6 8.3 1971 .......... 220.5 219.9 178.2 41.8 .......... .6 11.6 202.5 6.4 −11.9 18.3 104.9 18.6 8.4 1972 .......... 246.6 250.2 207.6 42.6 .......... −3.6 9.1 216.8 20.7 −7.7 28.5 123.7 19.2 9.0 1973 .......... 300.7 291.3 244.5 46.8 .......... 9.3 8.6 256.3 35.8 5.8 30.0 152.1 21.1 11.0 1974 .......... 312.3 305.7 249.4 56.3 .......... 6.6 10.9 270.0 31.5 4.5 27.0 143.2 20.0 9.2 1975 .......... 314.7 293.3 230.2 63.1 .......... 21.4 17.7 323.6 −26.6 −49.3 22.7 105.6 18.2 6.7 1976 .......... 367.2 358.4 292.0 66.4 .......... 8.9 25.1 343.8 −1.7 −30.3 28.6 153.2 18.8 7.5 1977 .......... 419.8 428.8 361.3 67.5 .......... −9.0 22.3 382.8 14.7 −21.0 35.7 198.8 19.6 8.3 1978 .......... 504.6 515.0 438.0 77.1 .......... −10.4 26.6 436.3 41.7 −1.5 43.2 252.7 20.9 9.4 1979 .......... 582.8 581.4 492.9 88.5 .......... 1.4 46.0 480.5 56.2 15.7 40.5 281.2 21.1 9.3
1980 .......... 590.9 579.5 479.3 100.3 .......... 11.4 41.4 532.4 17.0 −23.6 40.6 236.6 19.7 7.4 1981 .......... 685.6 679.3 572.4 106.9 .......... 6.3 30.9 630.3 24.4 −19.4 43.9 291.2 20.9 8.5 1982 .......... 629.4 629.5 517.2 112.3 −0.2 .0 .3 686.0 −56.9 −94.2 37.3 202.6 19.1 6.1 1983 .......... 655.1 687.2 564.3 122.9 −.2 −31.8 45.7 695.8 −86.5 −132.3 45.8 243.4 17.3 4.7 1984 .......... 788.0 875.0 735.6 139.4 −.2 −86.7 14.6 830.6 −57.2 −123.5 66.3 402.4 19.6 7.6 1985 .......... 784.1 895.0 736.2 158.8 −.3 −110.5 16.7 827.3 −59.9 −126.9 67.0 388.3 18.1 6.2 1986 .......... 780.5 919.7 746.5 173.2 −.3 −138.9 47.0 803.9 −70.4 −139.2 68.8 388.4 16.5 4.6 1987 .......... 818.5 969.2 785.0 184.3 −.4 −150.4 21.7 822.7 −25.9 −89.8 63.9 407.3 16.8 5.0 1988 .......... 895.5 1,007.7 821.6 186.1 −.5 −111.7 −19.5 917.5 −2.5 −75.2 72.7 410.1 17.8 6.2 1989 .......... 984.3 1,072.6 874.9 197.7 −.3 −88.0 39.7 931.8 12.9 −66.7 79.6 428.4 17.3 5.5
1990 .......... 1,006.7 1,076.7 861.0 215.7 6.6 −76.6 66.2 974.3 −33.8 −104.1 70.3 394.2 16.3 4.5 1991 .......... 1,036.6 1,023.2 802.9 220.3 4.5 9.0 72.5 1,042.9 −78.8 −141.5 62.7 297.3 16.2 4.0 1992 .......... 1,051.0 1,087.9 864.8 223.1 .6 −37.5 102.7 1,100.4 −152.1 −222.7 70.6 336.0 15.1 3.1 1993 .......... 1,102.0 1,172.4 953.4 219.0 1.3 −71.7 139.5 1,083.3 −120.8 −195.5 74.7 395.9 14.7 2.8 1994 .......... 1,213.2 1,318.4 1,097.1 221.4 1.7 −106.9 142.5 1,114.0 −43.2 −132.2 88.9 484.7 15.4 3.4 1995 .......... 1,285.7 1,376.7 1,144.0 232.7 .9 −91.9 101.2 1,204.5 −19.9 −115.1 95.2 498.4 16.2 4.2 1996 .......... 1,384.8 1,485.2 1,240.3 244.9 .7 −101.0 93.7 1,237.8 53.3 −59.7 113.0 567.1 16.6 4.8 1997 .......... 1,531.7 1,641.9 1,389.8 252.2 1.0 −111.3 70.7 1,303.6 157.5 26.7 130.7 667.5 17.7 5.9 1998 .......... 1,584.1 1,771.5 1,509.1 262.4 .7 −188.1 −14.6 1,328.9 269.8 121.6 148.2 741.3 18.2 6.5 1999 ......... 1,638.5 1,912.4 1,625.7 286.8 4.8 −278.7 −35.7 1,333.3 341.0 188.5 152.5 811.2 17.9 6.1
2000 ......... 1,643.3 2,040.0 1,735.5 304.5 .8 −397.4 −127.2 1,334.1 436.4 276.6 159.8 852.1 17.7 5.8 2001 .......... 1,567.9 1,938.3 1,614.3 324.0 1.1 −371.5 −89.6 1,400.1 257.5 134.9 122.6 656.9 16.2 3.7 2002 .......... 1,468.9 1,926.6 1,579.2 347.4 1.3 −458.9 −15.3 1,552.6 −68.4 −165.5 97.1 622.7 14.1 1.7 2003 .......... 1,513.3 2,024.2 1,665.8 358.5 3.1 −514.0 25.6 1,637.4 −149.7 −274.3 124.7 670.3 13.5 1.2 2004 p ....... .............. 2,301.7 1,922.4 379.3 .......... .............. .............. .............. .............. .............. .............. 894.8 .......... ..........
2000: I ....... 1,612.8 1,975.6 1,672.3 303.3 .8 −363.6 −171.7 1,322.4 462.1 299.4 162.7 822.6 18.1 6.4 II ...... 1,704.6 2,085.7 1,781.7 304.0 .8 −381.9 −67.8 1,335.5 437.0 268.4 168.6 908.7 17.9 6.0 III ..... 1,630.6 2,054.0 1,749.0 305.0 .9 −424.3 −164.6 1,356.6 438.5 278.7 159.8 854.1 17.8 5.9 IV .... 1,625.4 2,044.5 1,738.9 305.6 .8 −419.9 −104.6 1,321.9 408.1 260.1 147.9 823.3 17.1 5.0
2001: I ....... 1,577.5 1,988.5 1,675.3 313.2 1.1 −412.0 −167.8 1,354.1 391.2 244.5 146.7 748.0 17.1 4.9 II ...... 1,605.3 1,981.6 1,647.7 333.9 1.0 −377.4 −98.8 1,350.8 353.2 211.9 141.4 710.7 16.6 4.2 III .... 1,576.8 1,929.3 1,613.0 316.3 1.2 −353.7 −71.1 1,533.8 114.1 −.2 114.3 596.6 16.1 3.1 IV .... 1,512.2 1,854.0 1,521.4 332.7 1.0 −342.9 −20.9 1,361.7 171.4 83.5 87.8 572.2 14.9 2.4
2002: I ....... 1,487.9 1,910.8 1,568.5 342.3 1.1 −424.1 −61.8 1,578.4 −28.7 −119.8 91.1 623.7 14.9 2.5 II ...... 1,469.8 1,924.1 1,577.0 347.1 1.1 −455.3 −58.7 1,593.4 −64.9 −162.8 97.9 626.1 14.5 2.2 III .... 1,472.3 1,932.4 1,581.3 351.1 1.4 −461.6 20.8 1,516.1 −64.6 −166.1 101.6 623.1 13.8 1.3 IV .... 1,445.8 1,939.2 1,589.9 349.2 1.4 −494.7 38.4 1,522.6 −115.2 −213.0 97.8 617.7 13.2 .8
2003: I ....... 1,414.7 1,948.9 1,596.6 352.3 1.6 −535.9 39.6 1,490.0 −114.9 −192.0 77.0 614.9 12.8 .4 II ...... 1,449.3 1,967.8 1,611.1 356.7 6.2 −524.8 13.2 1,588.8 −152.7 −274.3 121.6 620.8 13.2 .8 III ..... 1,554.7 2,059.0 1,696.6 362.4 3.3 −507.5 36.6 1,725.5 −207.4 −342.5 135.0 698.4 13.6 1.4 IV ..... 1,634.6 2,121.2 1,758.8 362.4 1.2 −487.8 12.8 1,745.3 −123.5 −288.5 165.0 747.0 14.3 2.2
2004: I ....... 1,631.3 2,188.3 1,819.7 368.6 1.4 −558.4 63.0 1,724.9 −156.6 −299.5 142.9 833.3 13.7 1.9 II ...... 1,672.8 2,302.9 1,920.7 382.2 1.1 −631.2 56.4 1,751.1 −134.7 −287.2 152.5 927.7 13.9 2.1 III ..... 1,691.9 2,325.6 1,947.0 378.7 1.3 −635.0 90.4 1,750.1 −148.5 −290.7 142.2 827.7 13.6 .9 IV p .. .............. 2,389.8 2,002.2 387.7 .......... .............. .............. .............. .............. .............. .............. 990.3 .......... ..........
2 For details on government investment, see Table B–20. 3 Consists of capital transfers and the acquisition and disposal of nonproduced nonfinancial assets. 4 Prior to 1982, equals the balance on current account, NIPA (see Table B–24). Source: Department of Commerce, Bureau of Economic Analysis.
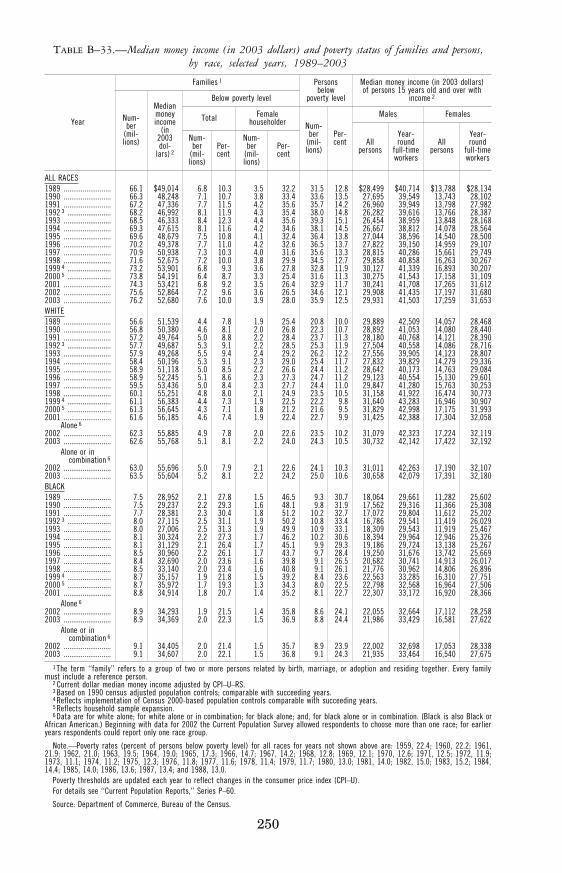
250
TABLE B–33.—Median money income (in 2003 dollars) and poverty status of families and persons, by race, selected years, 1989–2003
Year
Families 1 Persons below
poverty level
Median money income (in 2003 dollars) of persons 15 years old and over with
income 2
Num- ber
(mil- lions)
Median money income
(in 2003 dol-
lars) 2
Below poverty level
Num- ber
(mil- lions)
Per- cent
Males Females Total Female householder
All persons
Year- round
full-time workers
All persons
Year- round
full-time workers
Num- ber
(mil- lions)
Per- cent
Num- ber
(mil- lions)
Per- cent
ALL RACES 1989 ......................... 66.1 $49,014 6.8 10.3 3.5 32.2 31.5 12.8 $28,499 $40,714 $13,788 $28,134 1990 ......................... 66.3 48,248 7.1 10.7 3.8 33.4 33.6 13.5 27,695 39,549 13,743 28,102 1991 ......................... 67.2 47,336 7.7 11.5 4.2 35.6 35.7 14.2 26,960 39,949 13,798 27,982 1992 3 ....................... 68.2 46,992 8.1 11.9 4.3 35.4 38.0 14.8 26,282 39,616 13,766 28,387 1993 ......................... 68.5 46,333 8.4 12.3 4.4 35.6 39.3 15.1 26,454 38,959 13,848 28,168 1994 ......................... 69.3 47,615 8.1 11.6 4.2 34.6 38.1 14.5 26,667 38,812 14,078 28,564 1995 ......................... 69.6 48,679 7.5 10.8 4.1 32.4 36.4 13.8 27,044 38,596 14,540 28,500 1996 ......................... 70.2 49,378 7.7 11.0 4.2 32.6 36.5 13.7 27,822 39,150 14,959 29,107 1997 ......................... 70.9 50,938 7.3 10.3 4.0 31.6 35.6 13.3 28,815 40,286 15,661 29,749 1998 ......................... 71.6 52,675 7.2 10.0 3.8 29.9 34.5 12.7 29,858 40,858 16,263 30,267 1999 4 ....................... 73.2 53,901 6.8 9.3 3.6 27.8 32.8 11.9 30,127 41,339 16,893 30,207 2000 5 ....................... 73.8 54,191 6.4 8.7 3.3 25.4 31.6 11.3 30,275 41,543 17,158 31,109 2001 ......................... 74.3 53,421 6.8 9.2 3.5 26.4 32.9 11.7 30,241 41,708 17,265 31,612 2002 ......................... 75.6 52,864 7.2 9.6 3.6 26.5 34.6 12.1 29,908 41,435 17,197 31,680 2003 ......................... 76.2 52,680 7.6 10.0 3.9 28.0 35.9 12.5 29,931 41,503 17,259 31,653 WHITE 1989 ......................... 56.6 51,539 4.4 7.8 1.9 25.4 20.8 10.0 29,889 42,509 14,057 28,468 1990 ......................... 56.8 50,380 4.6 8.1 2.0 26.8 22.3 10.7 28,892 41,053 14,080 28,440 1991 ......................... 57.2 49,764 5.0 8.8 2.2 28.4 23.7 11.3 28,180 40,768 14,121 28,390 1992 3 ....................... 57.7 49,687 5.3 9.1 2.2 28.5 25.3 11.9 27,504 40,558 14,086 28,716 1993 ......................... 57.9 49,268 5.5 9.4 2.4 29.2 26.2 12.2 27,556 39,905 14,123 28,807 1994 ......................... 58.4 50,196 5.3 9.1 2.3 29.0 25.4 11.7 27,832 39,829 14,279 29,336 1995 ......................... 58.9 51,118 5.0 8.5 2.2 26.6 24.4 11.2 28,642 40,173 14,763 29,084 1996 ......................... 58.9 52,245 5.1 8.6 2.3 27.3 24.7 11.2 29,123 40,554 15,130 29,601 1997 ......................... 59.5 53,436 5.0 8.4 2.3 27.7 24.4 11.0 29,847 41,280 15,763 30,253 1998 ......................... 60.1 55,251 4.8 8.0 2.1 24.9 23.5 10.5 31,158 41,922 16,474 30,773 1999 4 ....................... 61.1 56,383 4.4 7.3 1.9 22.5 22.2 9.8 31,640 43,283 16,946 30,907 2000 5 ....................... 61.3 56,645 4.3 7.1 1.8 21.2 21.6 9.5 31,829 42,998 17,175 31,993 2001 ......................... 61.6 56,185 4.6 7.4 1.9 22.4 22.7 9.9 31,425 42,388 17,304 32,058
Alone 6 2002 ......................... 62.3 55,885 4.9 7.8 2.0 22.6 23.5 10.2 31,079 42,323 17,224 32,119 2003 ......................... 62.6 55,768 5.1 8.1 2.2 24.0 24.3 10.5 30,732 42,142 17,422 32,192
Alone or in combination 6
2002 ......................... 63.0 55,696 5.0 7.9 2.1 22.6 24.1 10.3 31,011 42,263 17,190 32,107 2003 ......................... 63.5 55,604 5.2 8.1 2.2 24.2 25.0 10.6 30,658 42,079 17,391 32,180 BLACK 1989 ......................... 7.5 28,952 2.1 27.8 1.5 46.5 9.3 30.7 18,064 29,661 11,282 25,602 1990 ......................... 7.5 29,237 2.2 29.3 1.6 48.1 9.8 31.9 17,562 29,316 11,366 25,308 1991 ......................... 7.7 28,381 2.3 30.4 1.8 51.2 10.2 32.7 17,072 29,804 11,612 25,202 1992 3 ....................... 8.0 27,115 2.5 31.1 1.9 50.2 10.8 33.4 16,786 29,541 11,419 26,029 1993 ......................... 8.0 27,006 2.5 31.3 1.9 49.9 10.9 33.1 18,309 29,543 11,919 25,467 1994 ......................... 8.1 30,324 2.2 27.3 1.7 46.2 10.2 30.6 18,394 29,964 12,946 25,326 1995 ......................... 8.1 31,129 2.1 26.4 1.7 45.1 9.9 29.3 19,186 29,724 13,138 25,267 1996 ......................... 8.5 30,960 2.2 26.1 1.7 43.7 9.7 28.4 19,250 31,676 13,742 25,669 1997 ......................... 8.4 32,690 2.0 23.6 1.6 39.8 9.1 26.5 20,682 30,741 14,913 26,017 1998 ......................... 8.5 33,140 2.0 23.4 1.6 40.8 9.1 26.1 21,776 30,962 14,806 26,896 1999 4 ....................... 8.7 35,157 1.9 21.8 1.5 39.2 8.4 23.6 22,563 33,285 16,310 27,751 2000 5 ....................... 8.7 35,972 1.7 19.3 1.3 34.3 8.0 22.5 22,798 32,568 16,964 27,506 2001 ......................... 8.8 34,914 1.8 20.7 1.4 35.2 8.1 22.7 22,307 33,172 16,920 28,366
Alone 6 2002 ......................... 8.9 34,293 1.9 21.5 1.4 35.8 8.6 24.1 22,055 32,664 17,112 28,258 2003 ......................... 8.9 34,369 2.0 22.3 1.5 36.9 8.8 24.4 21,986 33,429 16,581 27,622
Alone or in combination 6
2002 ......................... 9.1 34,405 2.0 21.4 1.5 35.7 8.9 23.9 22,002 32,698 17,053 28,338 2003 ......................... 9.1 34,607 2.0 22.1 1.5 36.8 9.1 24.3 21,935 33,464 16,540 27,675
1 The term ‘‘family’’ refers to a group of two or more persons related by birth, marriage, or adoption and residing together. Every family must include a reference person.
2 Current dollar median money income adjusted by CPI–U–RS. 3 Based on 1990 census adjusted population controls; comparable with succeeding years. 4 Reflects implementation of Census 2000-based population controls comparable with succeeding years. 5 Reflects household sample expansion. 6 Data are for white alone; for white alone or in combination; for black alone; and, for black alone or in combination. (Black is also Black or
African American.) Beginning with data for 2002 the Current Population Survey allowed respondents to choose more than one race; for earlier years respondents could report only one race group.
Note.—Poverty rates (percent of persons below poverty level) for all races for years not shown above are: 1959, 22.4; 1960, 22.2; 1961, 21.9; 1962, 21.0; 1963, 19.5; 1964, 19.0; 1965, 17.3; 1966, 14.7; 1967, 14.2; 1968, 12.8; 1969, 12.1; 1970, 12.6; 1971, 12.5; 1972, 11.9; 1973, 11.1; 1974, 11.2; 1975, 12.3; 1976, 11.8; 1977, 11.6; 1978, 11.4; 1979, 11.7; 1980, 13.0; 1981, 14.0; 1982, 15.0; 1983, 15.2; 1984, 14.4; 1985, 14.0; 1986, 13.6; 1987, 13.4; and 1988, 13.0.
Poverty thresholds are updated each year to reflect changes in the consumer price index (CPI–U). For details see ‘‘Current Population Reports,’’ Series P–60.
Source: Department of Commerce, Bureau of the Census.
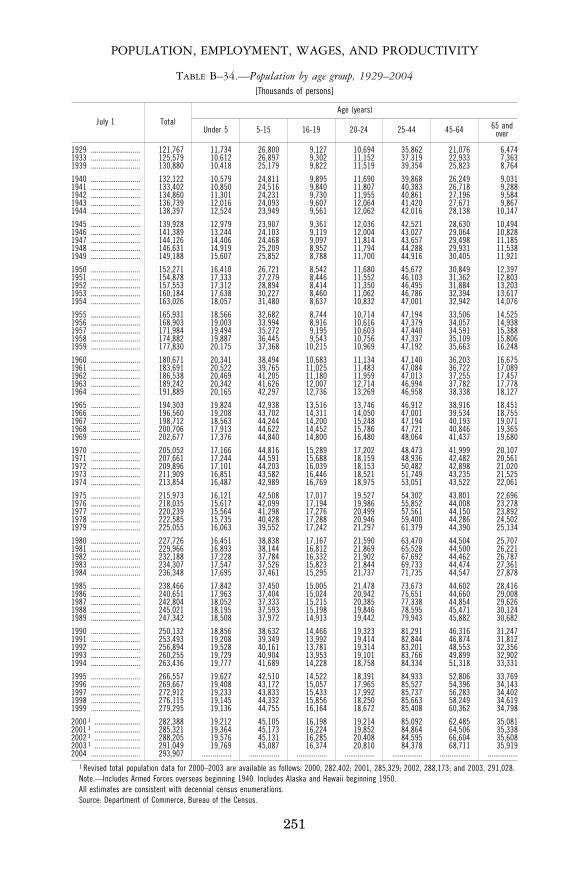
251
POPULATION, EMPLOYMENT, WAGES, AND PRODUCTIVITY
TABLE B–34.—Population by age group, 1929–2004 [Thousands of persons]
July 1 Total Age (years)
Under 5 5-15 16-19 20-24 25-44 45-64 65 and over
1929 .......................... 121,767 11,734 26,800 9,127 10,694 35,862 21,076 6,474 1933 .......................... 125,579 10,612 26,897 9,302 11,152 37,319 22,933 7,363 1939 .......................... 130,880 10,418 25,179 9,822 11,519 39,354 25,823 8,764
1940 .......................... 132,122 10,579 24,811 9,895 11,690 39,868 26,249 9,031 1941 .......................... 133,402 10,850 24,516 9,840 11,807 40,383 26,718 9,288 1942 .......................... 134,860 11,301 24,231 9,730 11,955 40,861 27,196 9,584 1943 .......................... 136,739 12,016 24,093 9,607 12,064 41,420 27,671 9,867 1944 .......................... 138,397 12,524 23,949 9,561 12,062 42,016 28,138 10,147
1945 .......................... 139,928 12,979 23,907 9,361 12,036 42,521 28,630 10,494 1946 .......................... 141,389 13,244 24,103 9,119 12,004 43,027 29,064 10,828 1947 .......................... 144,126 14,406 24,468 9,097 11,814 43,657 29,498 11,185 1948 .......................... 146,631 14,919 25,209 8,952 11,794 44,288 29,931 11,538 1949 .......................... 149,188 15,607 25,852 8,788 11,700 44,916 30,405 11,921
1950 .......................... 152,271 16,410 26,721 8,542 11,680 45,672 30,849 12,397 1951 .......................... 154,878 17,333 27,279 8,446 11,552 46,103 31,362 12,803 1952 .......................... 157,553 17,312 28,894 8,414 11,350 46,495 31,884 13,203 1953 .......................... 160,184 17,638 30,227 8,460 11,062 46,786 32,394 13,617 1954 .......................... 163,026 18,057 31,480 8,637 10,832 47,001 32,942 14,076
1955 .......................... 165,931 18,566 32,682 8,744 10,714 47,194 33,506 14,525 1956 .......................... 168,903 19,003 33,994 8,916 10,616 47,379 34,057 14,938 1957 .......................... 171,984 19,494 35,272 9,195 10,603 47,440 34,591 15,388 1958 .......................... 174,882 19,887 36,445 9,543 10,756 47,337 35,109 15,806 1959 .......................... 177,830 20,175 37,368 10,215 10,969 47,192 35,663 16,248
1960 .......................... 180,671 20,341 38,494 10,683 11,134 47,140 36,203 16,675 1961 .......................... 183,691 20,522 39,765 11,025 11,483 47,084 36,722 17,089 1962 .......................... 186,538 20,469 41,205 11,180 11,959 47,013 37,255 17,457 1963 .......................... 189,242 20,342 41,626 12,007 12,714 46,994 37,782 17,778 1964 .......................... 191,889 20,165 42,297 12,736 13,269 46,958 38,338 18,127
1965 .......................... 194,303 19,824 42,938 13,516 13,746 46,912 38,916 18,451 1966 .......................... 196,560 19,208 43,702 14,311 14,050 47,001 39,534 18,755 1967 .......................... 198,712 18,563 44,244 14,200 15,248 47,194 40,193 19,071 1968 .......................... 200,706 17,913 44,622 14,452 15,786 47,721 40,846 19,365 1969 .......................... 202,677 17,376 44,840 14,800 16,480 48,064 41,437 19,680
1970 .......................... 205,052 17,166 44,816 15,289 17,202 48,473 41,999 20,107 1971 .......................... 207,661 17,244 44,591 15,688 18,159 48,936 42,482 20,561 1972 .......................... 209,896 17,101 44,203 16,039 18,153 50,482 42,898 21,020 1973 .......................... 211,909 16,851 43,582 16,446 18,521 51,749 43,235 21,525 1974 .......................... 213,854 16,487 42,989 16,769 18,975 53,051 43,522 22,061
1975 .......................... 215,973 16,121 42,508 17,017 19,527 54,302 43,801 22,696 1976 .......................... 218,035 15,617 42,099 17,194 19,986 55,852 44,008 23,278 1977 .......................... 220,239 15,564 41,298 17,276 20,499 57,561 44,150 23,892 1978 .......................... 222,585 15,735 40,428 17,288 20,946 59,400 44,286 24,502 1979 .......................... 225,055 16,063 39,552 17,242 21,297 61,379 44,390 25,134
1980 .......................... 227,726 16,451 38,838 17,167 21,590 63,470 44,504 25,707 1981 .......................... 229,966 16,893 38,144 16,812 21,869 65,528 44,500 26,221 1982 .......................... 232,188 17,228 37,784 16,332 21,902 67,692 44,462 26,787 1983 .......................... 234,307 17,547 37,526 15,823 21,844 69,733 44,474 27,361 1984 .......................... 236,348 17,695 37,461 15,295 21,737 71,735 44,547 27,878
1985 .......................... 238,466 17,842 37,450 15,005 21,478 73,673 44,602 28,416 1986 .......................... 240,651 17,963 37,404 15,024 20,942 75,651 44,660 29,008 1987 .......................... 242,804 18,052 37,333 15,215 20,385 77,338 44,854 29,626 1988 .......................... 245,021 18,195 37,593 15,198 19,846 78,595 45,471 30,124 1989 .......................... 247,342 18,508 37,972 14,913 19,442 79,943 45,882 30,682
1990 .......................... 250,132 18,856 38,632 14,466 19,323 81,291 46,316 31,247 1991 .......................... 253,493 19,208 39,349 13,992 19,414 82,844 46,874 31,812 1992 .......................... 256,894 19,528 40,161 13,781 19,314 83,201 48,553 32,356 1993 .......................... 260,255 19,729 40,904 13,953 19,101 83,766 49,899 32,902 1994 .......................... 263,436 19,777 41,689 14,228 18,758 84,334 51,318 33,331
1995 .......................... 266,557 19,627 42,510 14,522 18,391 84,933 52,806 33,769 1996 .......................... 269,667 19,408 43,172 15,057 17,965 85,527 54,396 34,143 1997 .......................... 272,912 19,233 43,833 15,433 17,992 85,737 56,283 34,402 1998 .......................... 276,115 19,145 44,332 15,856 18,250 85,663 58,249 34,619 1999 .......................... 279,295 19,136 44,755 16,164 18,672 85,408 60,362 34,798
2000 1 ........................ 282,388 19,212 45,105 16,198 19,214 85,092 62,485 35,081 2001 1 ........................ 285,321 19,364 45,173 16,224 19,852 84,864 64,506 35,338 2002 1 ........................ 288,205 19,576 45,131 16,285 20,408 84,595 66,604 35,608 2003 1 ........................ 291,049 19,769 45,087 16,374 20,810 84,378 68,711 35,919 2004 .......................... 293,907 ................ ................ ................ ................ ................ ................ ................
1 Revised total population data for 2000–2003 are available as follows: 2000, 282,402; 2001, 285,329; 2002, 288,173; and 2003, 291,028. Note.—Includes Armed Forces overseas beginning 1940. Includes Alaska and Hawaii beginning 1950. All estimates are consistent with decennial census enumerations. Source: Department of Commerce, Bureau of the Census.
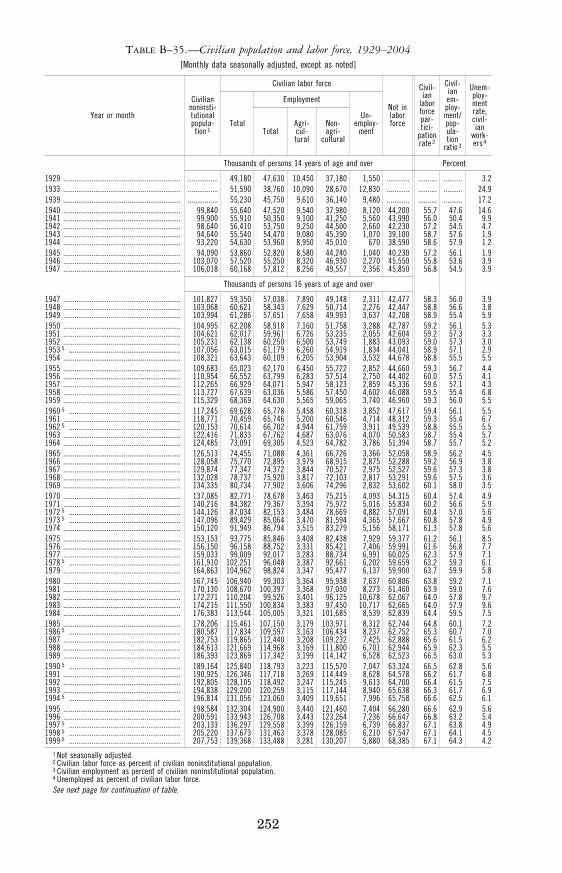
252
TABLE B–35.—Civilian population and labor force, 1929–2004 [Monthly data seasonally adjusted, except as noted]
Year or month
Civilian noninsti- tutional popula-
tion 1
Civilian labor force
Not in labor force
Civil- ian
labor force par- tici-
pation rate 2
Civil- ian em- ploy- ment/ pop- ula- tion
ratio 3
Unem- ploy- ment rate, civil- ian
work- ers 4
Total
Employment
Un- employ-
ment Total Agri- cul- tural
Non- agri-
cultural
Thousands of persons 14 years of age and over Percent
1929 .............................................................. ................ 49,180 47,630 10,450 37,180 1,550 ............ .......... .......... 3.2 1933 .............................................................. ................ 51,590 38,760 10,090 28,670 12,830 ............ .......... .......... 24.9 1939 .............................................................. ................ 55,230 45,750 9,610 36,140 9,480 ............ .......... .......... 17.2 1940 .............................................................. 99,840 55,640 47,520 9,540 37,980 8,120 44,200 55.7 47.6 14.6 1941 .............................................................. 99,900 55,910 50,350 9,100 41,250 5,560 43,990 56.0 50.4 9.9 1942 .............................................................. 98,640 56,410 53,750 9,250 44,500 2,660 42,230 57.2 54.5 4.7 1943 .............................................................. 94,640 55,540 54,470 9,080 45,390 1,070 39,100 58.7 57.6 1.9 1944 .............................................................. 93,220 54,630 53,960 8,950 45,010 670 38,590 58.6 57.9 1.2 1945 .............................................................. 94,090 53,860 52,820 8,580 44,240 1,040 40,230 57.2 56.1 1.9 1946 .............................................................. 103,070 57,520 55,250 8,320 46,930 2,270 45,550 55.8 53.6 3.9 1947 .............................................................. 106,018 60,168 57,812 8,256 49,557 2,356 45,850 56.8 54.5 3.9
Thousands of persons 16 years of age and over
1947 .............................................................. 101,827 59,350 57,038 7,890 49,148 2,311 42,477 58.3 56.0 3.9 1948 .............................................................. 103,068 60,621 58,343 7,629 50,714 2,276 42,447 58.8 56.6 3.8 1949 .............................................................. 103,994 61,286 57,651 7,658 49,993 3,637 42,708 58.9 55.4 5.9 1950 .............................................................. 104,995 62,208 58,918 7,160 51,758 3,288 42,787 59.2 56.1 5.3 1951 .............................................................. 104,621 62,017 59,961 6,726 53,235 2,055 42,604 59.2 57.3 3.3 1952 .............................................................. 105,231 62,138 60,250 6,500 53,749 1,883 43,093 59.0 57.3 3.0 1953 5 ........................................................... 107,056 63,015 61,179 6,260 54,919 1,834 44,041 58.9 57.1 2.9 1954 .............................................................. 108,321 63,643 60,109 6,205 53,904 3,532 44,678 58.8 55.5 5.5 1955 .............................................................. 109,683 65,023 62,170 6,450 55,722 2,852 44,660 59.3 56.7 4.4 1956 .............................................................. 110,954 66,552 63,799 6,283 57,514 2,750 44,402 60.0 57.5 4.1 1957 .............................................................. 112,265 66,929 64,071 5,947 58,123 2,859 45,336 59.6 57.1 4.3 1958 .............................................................. 113,727 67,639 63,036 5,586 57,450 4,602 46,088 59.5 55.4 6.8 1959 .............................................................. 115,329 68,369 64,630 5,565 59,065 3,740 46,960 59.3 56.0 5.5 1960 5 ........................................................... 117,245 69,628 65,778 5,458 60,318 3,852 47,617 59.4 56.1 5.5 1961 .............................................................. 118,771 70,459 65,746 5,200 60,546 4,714 48,312 59.3 55.4 6.7 1962 5 ........................................................... 120,153 70,614 66,702 4,944 61,759 3,911 49,539 58.8 55.5 5.5 1963 .............................................................. 122,416 71,833 67,762 4,687 63,076 4,070 50,583 58.7 55.4 5.7 1964 .............................................................. 124,485 73,091 69,305 4,523 64,782 3,786 51,394 58.7 55.7 5.2 1965 .............................................................. 126,513 74,455 71,088 4,361 66,726 3,366 52,058 58.9 56.2 4.5 1966 .............................................................. 128,058 75,770 72,895 3,979 68,915 2,875 52,288 59.2 56.9 3.8 1967 .............................................................. 129,874 77,347 74,372 3,844 70,527 2,975 52,527 59.6 57.3 3.8 1968 .............................................................. 132,028 78,737 75,920 3,817 72,103 2,817 53,291 59.6 57.5 3.6 1969 .............................................................. 134,335 80,734 77,902 3,606 74,296 2,832 53,602 60.1 58.0 3.5 1970 .............................................................. 137,085 82,771 78,678 3,463 75,215 4,093 54,315 60.4 57.4 4.9 1971 .............................................................. 140,216 84,382 79,367 3,394 75,972 5,016 55,834 60.2 56.6 5.9 1972 5 ........................................................... 144,126 87,034 82,153 3,484 78,669 4,882 57,091 60.4 57.0 5.6 1973 5 ........................................................... 147,096 89,429 85,064 3,470 81,594 4,365 57,667 60.8 57.8 4.9 1974 .............................................................. 150,120 91,949 86,794 3,515 83,279 5,156 58,171 61.3 57.8 5.6 1975 .............................................................. 153,153 93,775 85,846 3,408 82,438 7,929 59,377 61.2 56.1 8.5 1976 .............................................................. 156,150 96,158 88,752 3,331 85,421 7,406 59,991 61.6 56.8 7.7 1977 .............................................................. 159,033 99,009 92,017 3,283 88,734 6,991 60,025 62.3 57.9 7.1 1978 5 ........................................................... 161,910 102,251 96,048 3,387 92,661 6,202 59,659 63.2 59.3 6.1 1979 .............................................................. 164,863 104,962 98,824 3,347 95,477 6,137 59,900 63.7 59.9 5.8 1980 .............................................................. 167,745 106,940 99,303 3,364 95,938 7,637 60,806 63.8 59.2 7.1 1981 .............................................................. 170,130 108,670 100,397 3,368 97,030 8,273 61,460 63.9 59.0 7.6 1982 .............................................................. 172,271 110,204 99,526 3,401 96,125 10,678 62,067 64.0 57.8 9.7 1983 .............................................................. 174,215 111,550 100,834 3,383 97,450 10,717 62,665 64.0 57.9 9.6 1984 .............................................................. 176,383 113,544 105,005 3,321 101,685 8,539 62,839 64.4 59.5 7.5 1985 .............................................................. 178,206 115,461 107,150 3,179 103,971 8,312 62,744 64.8 60.1 7.2 1986 5 ........................................................... 180,587 117,834 109,597 3,163 106,434 8,237 62,752 65.3 60.7 7.0 1987 .............................................................. 182,753 119,865 112,440 3,208 109,232 7,425 62,888 65.6 61.5 6.2 1988 .............................................................. 184,613 121,669 114,968 3,169 111,800 6,701 62,944 65.9 62.3 5.5 1989 .............................................................. 186,393 123,869 117,342 3,199 114,142 6,528 62,523 66.5 63.0 5.3 1990 5 ........................................................... 189,164 125,840 118,793 3,223 115,570 7,047 63,324 66.5 62.8 5.6 1991 .............................................................. 190,925 126,346 117,718 3,269 114,449 8,628 64,578 66.2 61.7 6.8 1992 .............................................................. 192,805 128,105 118,492 3,247 115,245 9,613 64,700 66.4 61.5 7.5 1993 .............................................................. 194,838 129,200 120,259 3,115 117,144 8,940 65,638 66.3 61.7 6.9 1994 5 ........................................................... 196,814 131,056 123,060 3,409 119,651 7,996 65,758 66.6 62.5 6.1 1995 .............................................................. 198,584 132,304 124,900 3,440 121,460 7,404 66,280 66.6 62.9 5.6 1996 .............................................................. 200,591 133,943 126,708 3,443 123,264 7,236 66,647 66.8 63.2 5.4 1997 5 ........................................................... 203,133 136,297 129,558 3,399 126,159 6,739 66,837 67.1 63.8 4.9 1998 5 ........................................................... 205,220 137,673 131,463 3,378 128,085 6,210 67,547 67.1 64.1 4.5 1999 5 ........................................................... 207,753 139,368 133,488 3,281 130,207 5,880 68,385 67.1 64.3 4.2
1 Not seasonally adjusted. 2 Civilian labor force as percent of civilian noninstitutional population. 3 Civilian employment as percent of civilian noninstitutional population. 4 Unemployed as percent of civilian labor force. See next page for continuation of table.
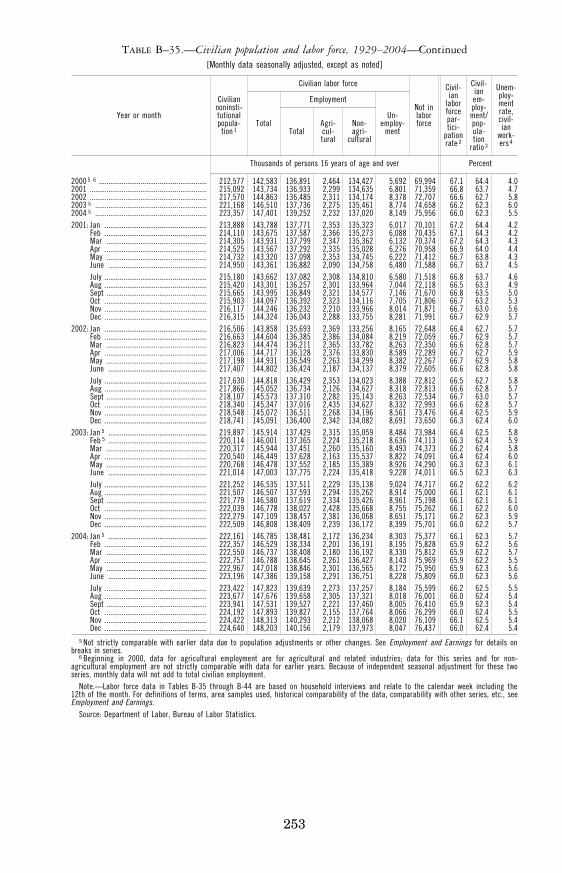
253
TABLE B–35.—Civilian population and labor force, 1929–2004—Continued [Monthly data seasonally adjusted, except as noted]
Year or month
Civilian noninsti- tutional popula-
tion 1
Civilian labor force
Not in labor force
Civil- ian
labor force par- tici-
pation rate 2
Civil- ian em- ploy- ment/ pop- ula- tion
ratio 3
Unem- ploy- ment rate, civil- ian
work- ers 4
Total
Employment
Un- employ-
ment Total Agri- cul- tural
Non- agri-
cultural
Thousands of persons 16 years of age and over Percent
2000 5 6 ......................................................... 212,577 142,583 136,891 2,464 134,427 5,692 69,994 67.1 64.4 4.0 2001 .............................................................. 215,092 143,734 136,933 2,299 134,635 6,801 71,359 66.8 63.7 4.7 2002 .............................................................. 217,570 144,863 136,485 2,311 134,174 8,378 72,707 66.6 62.7 5.8 2003 5 ........................................................... 221,168 146,510 137,736 2,275 135,461 8,774 74,658 66.2 62.3 6.0 2004 5 ........................................................... 223,357 147,401 139,252 2,232 137,020 8,149 75,956 66.0 62.3 5.5 2001: Jan ...................................................... 213,888 143,788 137,771 2,353 135,323 6,017 70,101 67.2 64.4 4.2
Feb ...................................................... 214,110 143,675 137,587 2,366 135,273 6,088 70,435 67.1 64.3 4.2 Mar ..................................................... 214,305 143,931 137,799 2,347 135,362 6,132 70,374 67.2 64.3 4.3 Apr ...................................................... 214,525 143,567 137,292 2,335 135,028 6,276 70,958 66.9 64.0 4.4 May ..................................................... 214,732 143,320 137,098 2,353 134,745 6,222 71,412 66.7 63.8 4.3 June .................................................... 214,950 143,361 136,882 2,090 134,758 6,480 71,588 66.7 63.7 4.5 July ...................................................... 215,180 143,662 137,082 2,308 134,810 6,580 71,518 66.8 63.7 4.6 Aug ...................................................... 215,420 143,301 136,257 2,301 133,964 7,044 72,118 66.5 63.3 4.9 Sept ..................................................... 215,665 143,995 136,849 2,321 134,577 7,146 71,670 66.8 63.5 5.0 Oct ...................................................... 215,903 144,097 136,392 2,323 134,116 7,705 71,806 66.7 63.2 5.3 Nov ...................................................... 216,117 144,246 136,232 2,210 133,966 8,014 71,871 66.7 63.0 5.6 Dec ...................................................... 216,315 144,324 136,043 2,288 133,755 8,281 71,991 66.7 62.9 5.7
2002: Jan ...................................................... 216,506 143,858 135,693 2,369 133,256 8,165 72,648 66.4 62.7 5.7 Feb ...................................................... 216,663 144,604 136,385 2,386 134,084 8,219 72,059 66.7 62.9 5.7 Mar ..................................................... 216,823 144,474 136,211 2,365 133,782 8,263 72,350 66.6 62.8 5.7 Apr ...................................................... 217,006 144,717 136,128 2,376 133,830 8,589 72,289 66.7 62.7 5.9 May ..................................................... 217,198 144,931 136,549 2,263 134,299 8,382 72,267 66.7 62.9 5.8 June .................................................... 217,407 144,802 136,424 2,187 134,137 8,379 72,605 66.6 62.8 5.8 July ...................................................... 217,630 144,818 136,429 2,353 134,023 8,388 72,812 66.5 62.7 5.8 Aug ...................................................... 217,866 145,052 136,734 2,126 134,627 8,318 72,813 66.6 62.8 5.7 Sept ..................................................... 218,107 145,573 137,310 2,282 135,143 8,263 72,534 66.7 63.0 5.7 Oct ...................................................... 218,340 145,347 137,016 2,435 134,627 8,332 72,993 66.6 62.8 5.7 Nov ...................................................... 218,548 145,072 136,511 2,268 134,196 8,561 73,476 66.4 62.5 5.9 Dec ...................................................... 218,741 145,091 136,400 2,342 134,082 8,691 73,650 66.3 62.4 6.0
2003: Jan 5 .................................................... 219,897 145,914 137,429 2,315 135,059 8,484 73,984 66.4 62.5 5.8 Feb 5 .................................................... 220,114 146,001 137,365 2,224 135,218 8,636 74,113 66.3 62.4 5.9 Mar ..................................................... 220,317 145,944 137,451 2,260 135,160 8,493 74,373 66.2 62.4 5.8 Apr ...................................................... 220,540 146,449 137,628 2,163 135,537 8,822 74,091 66.4 62.4 6.0 May ..................................................... 220,768 146,478 137,552 2,185 135,389 8,926 74,290 66.3 62.3 6.1 June .................................................... 221,014 147,003 137,775 2,224 135,418 9,228 74,011 66.5 62.3 6.3 July ...................................................... 221,252 146,535 137,511 2,229 135,138 9,024 74,717 66.2 62.2 6.2 Aug ...................................................... 221,507 146,507 137,593 2,294 135,262 8,914 75,000 66.1 62.1 6.1 Sept ..................................................... 221,779 146,580 137,619 2,334 135,426 8,961 75,198 66.1 62.1 6.1 Oct ...................................................... 222,039 146,778 138,022 2,428 135,668 8,755 75,262 66.1 62.2 6.0 Nov ...................................................... 222,279 147,109 138,457 2,381 136,068 8,651 75,171 66.2 62.3 5.9 Dec ...................................................... 222,509 146,808 138,409 2,239 136,172 8,399 75,701 66.0 62.2 5.7
2004: Jan 5 .................................................... 222,161 146,785 138,481 2,172 136,234 8,303 75,377 66.1 62.3 5.7 Feb ...................................................... 222,357 146,529 138,334 2,201 136,191 8,195 75,828 65.9 62.2 5.6 Mar ..................................................... 222,550 146,737 138,408 2,180 136,192 8,330 75,812 65.9 62.2 5.7 Apr ...................................................... 222,757 146,788 138,645 2,261 136,427 8,143 75,969 65.9 62.2 5.5 May ..................................................... 222,967 147,018 138,846 2,301 136,565 8,172 75,950 65.9 62.3 5.6 June .................................................... 223,196 147,386 139,158 2,291 136,751 8,228 75,809 66.0 62.3 5.6 July ...................................................... 223,422 147,823 139,639 2,273 137,257 8,184 75,599 66.2 62.5 5.5 Aug ...................................................... 223,677 147,676 139,658 2,305 137,321 8,018 76,001 66.0 62.4 5.4 Sept ..................................................... 223,941 147,531 139,527 2,221 137,460 8,005 76,410 65.9 62.3 5.4 Oct ...................................................... 224,192 147,893 139,827 2,155 137,764 8,066 76,299 66.0 62.4 5.5 Nov ...................................................... 224,422 148,313 140,293 2,212 138,068 8,020 76,109 66.1 62.5 5.4 Dec ...................................................... 224,640 148,203 140,156 2,179 137,973 8,047 76,437 66.0 62.4 5.4
5 Not strictly comparable with earlier data due to population adjustments or other changes. See Employment and Earnings for details on breaks in series.
6 Beginning in 2000, data for agricultural employment are for agricultural and related industries; data for this series and for non-agricultural employment are not strictly comparable with data for earlier years. Because of independent seasonal adjustment for these two series, monthly data will not add to total civilian employment.
Note.—Labor force data in Tables B-35 through B-44 are based on household interviews and relate to the calendar week including the 12th of the month. For definitions of terms, area samples used, historical comparability of the data, comparability with other series, etc., see Employment and Earnings.
Source: Department of Labor, Bureau of Labor Statistics.
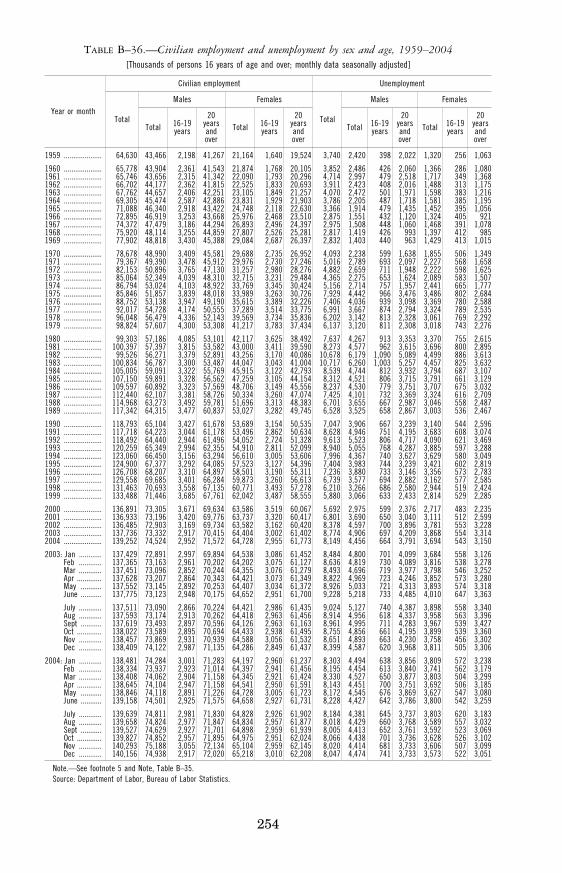
254
TABLE B–36.—Civilian employment and unemployment by sex and age, 1959–2004 [Thousands of persons 16 years of age and over; monthly data seasonally adjusted]
Year or month
Civilian employment Unemployment
Total
Males Females
Total
Males Females
Total 16-19 years
20 years and over
Total 16-19 years
20 years and over
Total 16-19 years
20 years and over
Total 16-19 years
20 years and over
1959 .................... 64,630 43,466 2,198 41,267 21,164 1,640 19,524 3,740 2,420 398 2,022 1,320 256 1,063
1960 .................... 65,778 43,904 2,361 41,543 21,874 1,768 20,105 3,852 2,486 426 2,060 1,366 286 1,080 1961 .................... 65,746 43,656 2,315 41,342 22,090 1,793 20,296 4,714 2,997 479 2,518 1,717 349 1,368 1962 .................... 66,702 44,177 2,362 41,815 22,525 1,833 20,693 3,911 2,423 408 2,016 1,488 313 1,175 1963 .................... 67,762 44,657 2,406 42,251 23,105 1,849 21,257 4,070 2,472 501 1,971 1,598 383 1,216 1964 .................... 69,305 45,474 2,587 42,886 23,831 1,929 21,903 3,786 2,205 487 1,718 1,581 385 1,195 1965 .................... 71,088 46,340 2,918 43,422 24,748 2,118 22,630 3,366 1,914 479 1,435 1,452 395 1,056 1966 .................... 72,895 46,919 3,253 43,668 25,976 2,468 23,510 2,875 1,551 432 1,120 1,324 405 921 1967 .................... 74,372 47,479 3,186 44,294 26,893 2,496 24,397 2,975 1,508 448 1,060 1,468 391 1,078 1968 .................... 75,920 48,114 3,255 44,859 27,807 2,526 25,281 2,817 1,419 426 993 1,397 412 985 1969 .................... 77,902 48,818 3,430 45,388 29,084 2,687 26,397 2,832 1,403 440 963 1,429 413 1,015
1970 .................... 78,678 48,990 3,409 45,581 29,688 2,735 26,952 4,093 2,238 599 1,638 1,855 506 1,349 1971 .................... 79,367 49,390 3,478 45,912 29,976 2,730 27,246 5,016 2,789 693 2,097 2,227 568 1,658 1972 .................... 82,153 50,896 3,765 47,130 31,257 2,980 28,276 4,882 2,659 711 1,948 2,222 598 1,625 1973 .................... 85,064 52,349 4,039 48,310 32,715 3,231 29,484 4,365 2,275 653 1,624 2,089 583 1,507 1974 .................... 86,794 53,024 4,103 48,922 33,769 3,345 30,424 5,156 2,714 757 1,957 2,441 665 1,777 1975 .................... 85,846 51,857 3,839 48,018 33,989 3,263 30,726 7,929 4,442 966 3,476 3,486 802 2,684 1976 .................... 88,752 53,138 3,947 49,190 35,615 3,389 32,226 7,406 4,036 939 3,098 3,369 780 2,588 1977 .................... 92,017 54,728 4,174 50,555 37,289 3,514 33,775 6,991 3,667 874 2,794 3,324 789 2,535 1978 .................... 96,048 56,479 4,336 52,143 39,569 3,734 35,836 6,202 3,142 813 2,328 3,061 769 2,292 1979 .................... 98,824 57,607 4,300 53,308 41,217 3,783 37,434 6,137 3,120 811 2,308 3,018 743 2,276
1980 .................... 99,303 57,186 4,085 53,101 42,117 3,625 38,492 7,637 4,267 913 3,353 3,370 755 2,615 1981 .................... 100,397 57,397 3,815 53,582 43,000 3,411 39,590 8,273 4,577 962 3,615 3,696 800 2,895 1982 .................... 99,526 56,271 3,379 52,891 43,256 3,170 40,086 10,678 6,179 1,090 5,089 4,499 886 3,613 1983 .................... 100,834 56,787 3,300 53,487 44,047 3,043 41,004 10,717 6,260 1,003 5,257 4,457 825 3,632 1984 .................... 105,005 59,091 3,322 55,769 45,915 3,122 42,793 8,539 4,744 812 3,932 3,794 687 3,107 1985 .................... 107,150 59,891 3,328 56,562 47,259 3,105 44,154 8,312 4,521 806 3,715 3,791 661 3,129 1986 .................... 109,597 60,892 3,323 57,569 48,706 3,149 45,556 8,237 4,530 779 3,751 3,707 675 3,032 1987 .................... 112,440 62,107 3,381 58,726 50,334 3,260 47,074 7,425 4,101 732 3,369 3,324 616 2,709 1988 .................... 114,968 63,273 3,492 59,781 51,696 3,313 48,383 6,701 3,655 667 2,987 3,046 558 2,487 1989 .................... 117,342 64,315 3,477 60,837 53,027 3,282 49,745 6,528 3,525 658 2,867 3,003 536 2,467
1990 .................... 118,793 65,104 3,427 61,678 53,689 3,154 50,535 7,047 3,906 667 3,239 3,140 544 2,596 1991 .................... 117,718 64,223 3,044 61,178 53,496 2,862 50,634 8,628 4,946 751 4,195 3,683 608 3,074 1992 .................... 118,492 64,440 2,944 61,496 54,052 2,724 51,328 9,613 5,523 806 4,717 4,090 621 3,469 1993 .................... 120,259 65,349 2,994 62,355 54,910 2,811 52,099 8,940 5,055 768 4,287 3,885 597 3,288 1994 .................... 123,060 66,450 3,156 63,294 56,610 3,005 53,606 7,996 4,367 740 3,627 3,629 580 3,049 1995 .................... 124,900 67,377 3,292 64,085 57,523 3,127 54,396 7,404 3,983 744 3,239 3,421 602 2,819 1996 .................... 126,708 68,207 3,310 64,897 58,501 3,190 55,311 7,236 3,880 733 3,146 3,356 573 2,783 1997 .................... 129,558 69,685 3,401 66,284 59,873 3,260 56,613 6,739 3,577 694 2,882 3,162 577 2,585 1998 .................... 131,463 70,693 3,558 67,135 60,771 3,493 57,278 6,210 3,266 686 2,580 2,944 519 2,424 1999 .................... 133,488 71,446 3,685 67,761 62,042 3,487 58,555 5,880 3,066 633 2,433 2,814 529 2,285
2000 .................... 136,891 73,305 3,671 69,634 63,586 3,519 60,067 5,692 2,975 599 2,376 2,717 483 2,235 2001 .................... 136,933 73,196 3,420 69,776 63,737 3,320 60,417 6,801 3,690 650 3,040 3,111 512 2,599 2002 .................... 136,485 72,903 3,169 69,734 63,582 3,162 60,420 8,378 4,597 700 3,896 3,781 553 3,228 2003 .................... 137,736 73,332 2,917 70,415 64,404 3,002 61,402 8,774 4,906 697 4,209 3,868 554 3,314 2004 .................... 139,252 74,524 2,952 71,572 64,728 2,955 61,773 8,149 4,456 664 3,791 3,694 543 3,150
2003: Jan ............ 137,429 72,891 2,997 69,894 64,538 3,086 61,452 8,484 4,800 701 4,099 3,684 558 3,126 Feb ............ 137,365 73,163 2,961 70,202 64,202 3,075 61,127 8,636 4,819 730 4,089 3,816 538 3,278 Mar ............ 137,451 73,096 2,852 70,244 64,355 3,076 61,279 8,493 4,696 719 3,977 3,798 546 3,252 Apr ............. 137,628 73,207 2,864 70,343 64,421 3,073 61,349 8,822 4,969 723 4,246 3,852 573 3,280 May ........... 137,552 73,145 2,892 70,253 64,407 3,034 61,372 8,926 5,033 721 4,313 3,893 574 3,318 June ........... 137,775 73,123 2,948 70,175 64,652 2,951 61,700 9,228 5,218 733 4,485 4,010 647 3,363
July ............ 137,511 73,090 2,866 70,224 64,421 2,986 61,435 9,024 5,127 740 4,387 3,898 558 3,340 Aug ............ 137,593 73,174 2,913 70,262 64,418 2,963 61,456 8,914 4,956 618 4,337 3,958 563 3,396 Sept ........... 137,619 73,493 2,897 70,596 64,126 2,963 61,163 8,961 4,995 711 4,283 3,967 539 3,427 Oct ............. 138,022 73,589 2,895 70,694 64,433 2,938 61,495 8,755 4,856 661 4,195 3,899 539 3,360 Nov ............ 138,457 73,869 2,931 70,939 64,588 3,056 61,532 8,651 4,893 663 4,230 3,758 456 3,302 Dec ............ 138,409 74,122 2,987 71,135 64,286 2,849 61,437 8,399 4,587 620 3,968 3,811 505 3,306
2004: Jan ............ 138,481 74,284 3,001 71,283 64,197 2,960 61,237 8,303 4,494 638 3,856 3,809 572 3,238 Feb ............ 138,334 73,937 2,923 71,014 64,397 2,941 61,456 8,195 4,454 613 3,840 3,741 562 3,179 Mar ............ 138,408 74,062 2,904 71,158 64,345 2,921 61,424 8,330 4,527 650 3,877 3,803 504 3,299 Apr ............. 138,645 74,104 2,947 71,158 64,541 2,950 61,591 8,143 4,451 700 3,751 3,692 506 3,185 May ........... 138,846 74,118 2,891 71,226 64,728 3,005 61,723 8,172 4,545 676 3,869 3,627 547 3,080 June ........... 139,158 74,501 2,925 71,575 64,658 2,927 61,731 8,228 4,427 642 3,786 3,800 542 3,259
July ............ 139,639 74,811 2,981 71,830 64,828 2,926 61,902 8,184 4,381 645 3,737 3,803 620 3,183 Aug ............ 139,658 74,824 2,977 71,847 64,834 2,957 61,877 8,018 4,429 660 3,768 3,589 557 3,032 Sept ........... 139,527 74,629 2,927 71,701 64,898 2,959 61,939 8,005 4,413 652 3,761 3,592 523 3,069 Oct ............. 139,827 74,852 2,957 71,895 64,975 2,951 62,024 8,066 4,438 701 3,736 3,628 526 3,102 Nov ............ 140,293 75,188 3,055 72,134 65,104 2,959 62,145 8,020 4,414 681 3,733 3,606 507 3,099 Dec ............ 140,156 74,938 2,917 72,020 65,218 3,010 62,208 8,047 4,474 741 3,733 3,573 522 3,051
Note.—See footnote 5 and Note, Table B–35. Source: Department of Labor, Bureau of Labor Statistics.
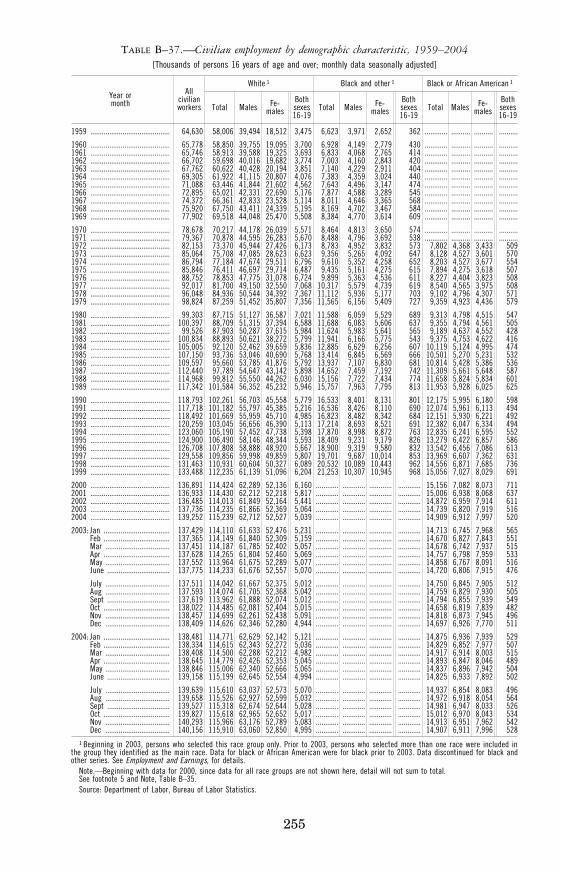
255
TABLE B–37.—Civilian employment by demographic characteristic, 1959–2004 [Thousands of persons 16 years of age and over; monthly data seasonally adjusted]
Year or month
All civilian workers
White 1 Black and other 1 Black or African American 1
Total Males Fe- males
Both sexes 16-19
Total Males Fe- males
Both sexes 16-19
Total Males Fe- males
Both sexes 16-19
1959 .......................................... 64,630 58,006 39,494 18,512 3,475 6,623 3,971 2,652 362 ............ .......... .......... ..........
1960 .......................................... 65,778 58,850 39,755 19,095 3,700 6,928 4,149 2,779 430 ............ .......... .......... ..........1961 .......................................... 65,746 58,913 39,588 19,325 3,693 6,833 4,068 2,765 414 ............ .......... .......... ..........1962 .......................................... 66,702 59,698 40,016 19,682 3,774 7,003 4,160 2,843 420 ............ .......... .......... ..........1963 .......................................... 67,762 60,622 40,428 20,194 3,851 7,140 4,229 2,911 404 ............ .......... .......... ..........1964 .......................................... 69,305 61,922 41,115 20,807 4,076 7,383 4,359 3,024 440 ............ .......... .......... ..........1965 .......................................... 71,088 63,446 41,844 21,602 4,562 7,643 4,496 3,147 474 ............ .......... .......... ..........1966 .......................................... 72,895 65,021 42,331 22,690 5,176 7,877 4,588 3,289 545 ............ .......... .......... ..........1967 .......................................... 74,372 66,361 42,833 23,528 5,114 8,011 4,646 3,365 568 ............ .......... .......... ..........1968 .......................................... 75,920 67,750 43,411 24,339 5,195 8,169 4,702 3,467 584 ............ .......... .......... ..........1969 .......................................... 77,902 69,518 44,048 25,470 5,508 8,384 4,770 3,614 609 ............ .......... .......... ..........
1970 .......................................... 78,678 70,217 44,178 26,039 5,571 8,464 4,813 3,650 574 ............ .......... .......... ..........1971 .......................................... 79,367 70,878 44,595 26,283 5,670 8,488 4,796 3,692 538 ............ .......... .......... ..........1972 .......................................... 82,153 73,370 45,944 27,426 6,173 8,783 4,952 3,832 573 7,802 4,368 3,433 509 1973 .......................................... 85,064 75,708 47,085 28,623 6,623 9,356 5,265 4,092 647 8,128 4,527 3,601 570 1974 .......................................... 86,794 77,184 47,674 29,511 6,796 9,610 5,352 4,258 652 8,203 4,527 3,677 554 1975 .......................................... 85,846 76,411 46,697 29,714 6,487 9,435 5,161 4,275 615 7,894 4,275 3,618 507 1976 .......................................... 88,752 78,853 47,775 31,078 6,724 9,899 5,363 4,536 611 8,227 4,404 3,823 508 1977 .......................................... 92,017 81,700 49,150 32,550 7,068 10,317 5,579 4,739 619 8,540 4,565 3,975 508 1978 .......................................... 96,048 84,936 50,544 34,392 7,367 11,112 5,936 5,177 703 9,102 4,796 4,307 571 1979 .......................................... 98,824 87,259 51,452 35,807 7,356 11,565 6,156 5,409 727 9,359 4,923 4,436 579
1980 .......................................... 99,303 87,715 51,127 36,587 7,021 11,588 6,059 5,529 689 9,313 4,798 4,515 547 1981 .......................................... 100,397 88,709 51,315 37,394 6,588 11,688 6,083 5,606 637 9,355 4,794 4,561 505 1982 .......................................... 99,526 87,903 50,287 37,615 5,984 11,624 5,983 5,641 565 9,189 4,637 4,552 428 1983 .......................................... 100,834 88,893 50,621 38,272 5,799 11,941 6,166 5,775 543 9,375 4,753 4,622 416 1984 .......................................... 105,005 92,120 52,462 39,659 5,836 12,885 6,629 6,256 607 10,119 5,124 4,995 474 1985 .......................................... 107,150 93,736 53,046 40,690 5,768 13,414 6,845 6,569 666 10,501 5,270 5,231 532 1986 .......................................... 109,597 95,660 53,785 41,876 5,792 13,937 7,107 6,830 681 10,814 5,428 5,386 536 1987 .......................................... 112,440 97,789 54,647 43,142 5,898 14,652 7,459 7,192 742 11,309 5,661 5,648 587 1988 .......................................... 114,968 99,812 55,550 44,262 6,030 15,156 7,722 7,434 774 11,658 5,824 5,834 601 1989 .......................................... 117,342 101,584 56,352 45,232 5,946 15,757 7,963 7,795 813 11,953 5,928 6,025 625
1990 .......................................... 118,793 102,261 56,703 45,558 5,779 16,533 8,401 8,131 801 12,175 5,995 6,180 598 1991 .......................................... 117,718 101,182 55,797 45,385 5,216 16,536 8,426 8,110 690 12,074 5,961 6,113 494 1992 .......................................... 118,492 101,669 55,959 45,710 4,985 16,823 8,482 8,342 684 12,151 5,930 6,221 492 1993 .......................................... 120,259 103,045 56,656 46,390 5,113 17,214 8,693 8,521 691 12,382 6,047 6,334 494 1994 .......................................... 123,060 105,190 57,452 47,738 5,398 17,870 8,998 8,872 763 12,835 6,241 6,595 552 1995 .......................................... 124,900 106,490 58,146 48,344 5,593 18,409 9,231 9,179 826 13,279 6,422 6,857 586 1996 .......................................... 126,708 107,808 58,888 48,920 5,667 18,900 9,319 9,580 832 13,542 6,456 7,086 613 1997 .......................................... 129,558 109,856 59,998 49,859 5,807 19,701 9,687 10,014 853 13,969 6,607 7,362 631 1998 .......................................... 131,463 110,931 60,604 50,327 6,089 20,532 10,089 10,443 962 14,556 6,871 7,685 736 1999 .......................................... 133,488 112,235 61,139 51,096 6,204 21,253 10,307 10,945 968 15,056 7,027 8,029 691
2000 .......................................... 136,891 114,424 62,289 52,136 6,160 ............ ............ ............ ............ 15,156 7,082 8,073 711 2001 .......................................... 136,933 114,430 62,212 52,218 5,817 ............ ............ ............ ............ 15,006 6,938 8,068 637 2002 .......................................... 136,485 114,013 61,849 52,164 5,441 ............ ............ ............ ............ 14,872 6,959 7,914 611 2003 .......................................... 137,736 114,235 61,866 52,369 5,064 ............ ............ ............ ............ 14,739 6,820 7,919 516 2004 .......................................... 139,252 115,239 62,712 52,527 5,039 ............ ............ ............ ............ 14,909 6,912 7,997 520
2003: Jan ................................... 137,429 114,110 61,633 52,476 5,231 ............ ............ ............ ............ 14,713 6,745 7,968 565 Feb ................................... 137,365 114,149 61,840 52,309 5,159 ............ ............ ............ ............ 14,670 6,827 7,843 551 Mar .................................. 137,451 114,187 61,785 52,402 5,057 ............ ............ ............ ............ 14,678 6,742 7,937 515 Apr ................................... 137,628 114,265 61,804 52,460 5,069 ............ ............ ............ ............ 14,757 6,798 7,959 533 May .................................. 137,552 113,964 61,675 52,289 5,077 ............ ............ ............ ............ 14,858 6,767 8,091 516 June ................................. 137,775 114,233 61,676 52,557 5,070 ............ ............ ............ ............ 14,720 6,806 7,915 476
July .................................. 137,511 114,042 61,667 52,375 5,012 ............ ............ ............ ............ 14,750 6,845 7,905 512 Aug .................................. 137,593 114,074 61,705 52,368 5,042 ............ ............ ............ ............ 14,759 6,829 7,930 505 Sept ................................. 137,619 113,962 61,888 52,074 5,012 ............ ............ ............ ............ 14,794 6,855 7,939 549 Oct ................................... 138,022 114,485 62,081 52,404 5,015 ............ ............ ............ ............ 14,658 6,819 7,839 482 Nov .................................. 138,457 114,699 62,261 52,438 5,091 ............ ............ ............ ............ 14,818 6,873 7,945 496 Dec .................................. 138,409 114,626 62,346 52,280 4,944 ............ ............ ............ ............ 14,697 6,926 7,770 511
2004: Jan ................................... 138,481 114,771 62,629 52,142 5,121 ............ ............ ............ ............ 14,875 6,936 7,939 529 Feb ................................... 138,334 114,615 62,343 52,272 5,036 ............ ............ ............ ............ 14,829 6,852 7,977 507 Mar .................................. 138,408 114,500 62,288 52,212 4,982 ............ ............ ............ ............ 14,917 6,914 8,003 515 Apr ................................... 138,645 114,779 62,426 52,353 5,045 ............ ............ ............ ............ 14,893 6,847 8,046 489 May .................................. 138,846 115,006 62,340 52,666 5,065 ............ ............ ............ ............ 14,837 6,896 7,942 504 June ................................. 139,158 115,199 62,645 52,554 4,994 ............ ............ ............ ............ 14,825 6,933 7,892 502
July .................................. 139,639 115,610 63,037 52,573 5,070 ............ ............ ............ ............ 14,937 6,854 8,083 496 Aug .................................. 139,658 115,526 62,927 52,599 5,032 ............ ............ ............ ............ 14,972 6,918 8,054 564 Sept ................................. 139,527 115,318 62,674 52,644 5,028 ............ ............ ............ ............ 14,981 6,947 8,033 526 Oct ................................... 139,827 115,618 62,965 52,652 5,017 ............ ............ ............ ............ 15,012 6,970 8,043 534 Nov .................................. 140,293 115,966 63,176 52,789 5,083 ............ ............ ............ ............ 14,913 6,951 7,962 542 Dec .................................. 140,156 115,910 63,060 52,850 4,995 ............ ............ ............ ............ 14,907 6,911 7,996 528
1 Beginning in 2003, persons who selected this race group only. Prior to 2003, persons who selected more than one race were included in the group they identified as the main race. Data for black or African American were for black prior to 2003. Data discontinued for black and other series. See Employment and Earnings, for details.
Note.—Beginning with data for 2000, since data for all race groups are not shown here, detail will not sum to total. See footnote 5 and Note, Table B–35. Source: Department of Labor, Bureau of Labor Statistics.
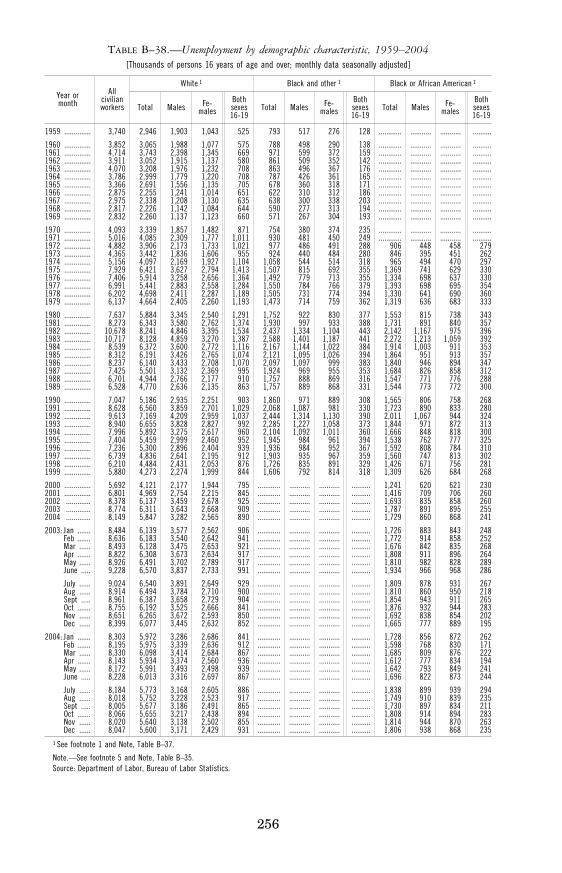
256
TABLE B–38.—Unemployment by demographic characteristic, 1959–2004 [Thousands of persons 16 years of age and over; monthly data seasonally adjusted]
Year or month
All civilian workers
White 1 Black and other 1 Black or African American 1
Total Males Fe- males
Both sexes 16-19
Total Males Fe- males
Both sexes 16-19
Total Males Fe- males
Both sexes 16-19
1959 .............. 3,740 2,946 1,903 1,043 525 793 517 276 128 ............ ........... ........... ..........
1960 .............. 3,852 3,065 1,988 1,077 575 788 498 290 138 ............ ........... ........... ..........1961 .............. 4,714 3,743 2,398 1,345 669 971 599 372 159 ............ ........... ........... ..........1962 .............. 3,911 3,052 1,915 1,137 580 861 509 352 142 ............ ........... ........... ..........1963 .............. 4,070 3,208 1,976 1,232 708 863 496 367 176 ............ ........... ........... ..........1964 .............. 3,786 2,999 1,779 1,220 708 787 426 361 165 ............ ........... ........... ..........1965 .............. 3,366 2,691 1,556 1,135 705 678 360 318 171 ............ ........... ........... ..........1966 .............. 2,875 2,255 1,241 1,014 651 622 310 312 186 ............ ........... ........... ..........1967 .............. 2,975 2,338 1,208 1,130 635 638 300 338 203 ............ ........... ........... ..........1968 .............. 2,817 2,226 1,142 1,084 644 590 277 313 194 ............ ........... ........... ..........1969 .............. 2,832 2,260 1,137 1,123 660 571 267 304 193 ............ ........... ........... ..........
1970 .............. 4,093 3,339 1,857 1,482 871 754 380 374 235 ............ ........... ........... ..........1971 .............. 5,016 4,085 2,309 1,777 1,011 930 481 450 249 ............ ........... ........... ..........1972 .............. 4,882 3,906 2,173 1,733 1,021 977 486 491 288 906 448 458 279 1973 .............. 4,365 3,442 1,836 1,606 955 924 440 484 280 846 395 451 262 1974 .............. 5,156 4,097 2,169 1,927 1,104 1,058 544 514 318 965 494 470 297 1975 .............. 7,929 6,421 3,627 2,794 1,413 1,507 815 692 355 1,369 741 629 330 1976 .............. 7,406 5,914 3,258 2,656 1,364 1,492 779 713 355 1,334 698 637 330 1977 .............. 6,991 5,441 2,883 2,558 1,284 1,550 784 766 379 1,393 698 695 354 1978 .............. 6,202 4,698 2,411 2,287 1,189 1,505 731 774 394 1,330 641 690 360 1979 .............. 6,137 4,664 2,405 2,260 1,193 1,473 714 759 362 1,319 636 683 333
1980 .............. 7,637 5,884 3,345 2,540 1,291 1,752 922 830 377 1,553 815 738 343 1981 .............. 8,273 6,343 3,580 2,762 1,374 1,930 997 933 388 1,731 891 840 357 1982 .............. 10,678 8,241 4,846 3,395 1,534 2,437 1,334 1,104 443 2,142 1,167 975 396 1983 .............. 10,717 8,128 4,859 3,270 1,387 2,588 1,401 1,187 441 2,272 1,213 1,059 392 1984 .............. 8,539 6,372 3,600 2,772 1,116 2,167 1,144 1,022 384 1,914 1,003 911 353 1985 .............. 8,312 6,191 3,426 2,765 1,074 2,121 1,095 1,026 394 1,864 951 913 357 1986 .............. 8,237 6,140 3,433 2,708 1,070 2,097 1,097 999 383 1,840 946 894 347 1987 .............. 7,425 5,501 3,132 2,369 995 1,924 969 955 353 1,684 826 858 312 1988 .............. 6,701 4,944 2,766 2,177 910 1,757 888 869 316 1,547 771 776 288 1989 .............. 6,528 4,770 2,636 2,135 863 1,757 889 868 331 1,544 773 772 300
1990 .............. 7,047 5,186 2,935 2,251 903 1,860 971 889 308 1,565 806 758 268 1991 .............. 8,628 6,560 3,859 2,701 1,029 2,068 1,087 981 330 1,723 890 833 280 1992 .............. 9,613 7,169 4,209 2,959 1,037 2,444 1,314 1,130 390 2,011 1,067 944 324 1993 .............. 8,940 6,655 3,828 2,827 992 2,285 1,227 1,058 373 1,844 971 872 313 1994 .............. 7,996 5,892 3,275 2,617 960 2,104 1,092 1,011 360 1,666 848 818 300 1995 .............. 7,404 5,459 2,999 2,460 952 1,945 984 961 394 1,538 762 777 325 1996 .............. 7,236 5,300 2,896 2,404 939 1,936 984 952 367 1,592 808 784 310 1997 .............. 6,739 4,836 2,641 2,195 912 1,903 935 967 359 1,560 747 813 302 1998 .............. 6,210 4,484 2,431 2,053 876 1,726 835 891 329 1,426 671 756 281 1999 .............. 5,880 4,273 2,274 1,999 844 1,606 792 814 318 1,309 626 684 268
2000 .............. 5,692 4,121 2,177 1,944 795 ............ ........... ........... .......... 1,241 620 621 230 2001 .............. 6,801 4,969 2,754 2,215 845 ............ ........... ........... .......... 1,416 709 706 260 2002 ............. 8,378 6,137 3,459 2,678 925 ............ ........... ........... .......... 1,693 835 858 260 2003 ............. 8,774 6,311 3,643 2,668 909 ............ ........... ........... .......... 1,787 891 895 255 2004 ............. 8,149 5,847 3,282 2,565 890 ............ ........... ........... .......... 1,729 860 868 241
2003: Jan ....... 8,484 6,139 3,577 2,562 906 ............ ........... ........... .......... 1,726 883 843 248 Feb ....... 8,636 6,183 3,540 2,642 941 ............ ........... ........... .......... 1,772 914 858 252 Mar ...... 8,493 6,128 3,475 2,653 921 ............ ........... ........... .......... 1,676 842 835 268 Apr ....... 8,822 6,308 3,673 2,634 917 ............ ........... ........... .......... 1,808 911 896 264 May ...... 8,926 6,491 3,702 2,789 917 ............ ........... ........... .......... 1,810 982 828 289 June ..... 9,228 6,570 3,837 2,733 991 ............ ........... ........... .......... 1,934 966 968 286
July ...... 9,024 6,540 3,891 2,649 929 ............ ........... ........... .......... 1,809 878 931 267 Aug ...... 8,914 6,494 3,784 2,710 900 ............ ........... ........... .......... 1,810 860 950 218 Sept ..... 8,961 6,387 3,658 2,729 904 ............ ........... ........... .......... 1,854 943 911 265 Oct ....... 8,755 6,192 3,525 2,666 841 ............ ........... ........... .......... 1,876 932 944 283 Nov ...... 8,651 6,265 3,672 2,593 850 ............ ........... ........... .......... 1,692 838 854 202 Dec ...... 8,399 6,077 3,445 2,632 852 ............ ........... ........... .......... 1,665 777 889 195
2004: Jan ....... 8,303 5,972 3,286 2,686 841 ............ ........... ........... .......... 1,728 856 872 262 Feb ....... 8,195 5,975 3,339 2,636 912 ............ ........... ........... .......... 1,598 768 830 171 Mar ...... 8,330 6,098 3,414 2,684 867 ............ ........... ........... .......... 1,685 809 876 222 Apr ....... 8,143 5,934 3,374 2,560 936 ............ ........... ........... .......... 1,612 777 834 194 May ...... 8,172 5,991 3,493 2,498 939 ............ ........... ........... .......... 1,642 793 849 241 June ..... 8,228 6,013 3,316 2,697 867 ............ ........... ........... .......... 1,696 822 873 244
July ...... 8,184 5,773 3,168 2,605 886 ............ ........... ........... .......... 1,838 899 939 294 Aug ...... 8,018 5,752 3,228 2,523 917 ............ ........... ........... .......... 1,749 910 839 235 Sept ..... 8,005 5,677 3,186 2,491 865 ............ ........... ........... .......... 1,730 897 834 211 Oct ....... 8,066 5,655 3,217 2,438 894 ............ ........... ........... .......... 1,808 914 894 283 Nov ...... 8,020 5,640 3,138 2,502 855 ............ ........... ........... .......... 1,814 944 870 263 Dec ...... 8,047 5,600 3,171 2,429 931 ............ ........... ........... .......... 1,806 938 868 235
1 See footnote 1 and Note, Table B–37.
Note.—See footnote 5 and Note, Table B–35. Source: Department of Labor, Bureau of Labor Statistics.
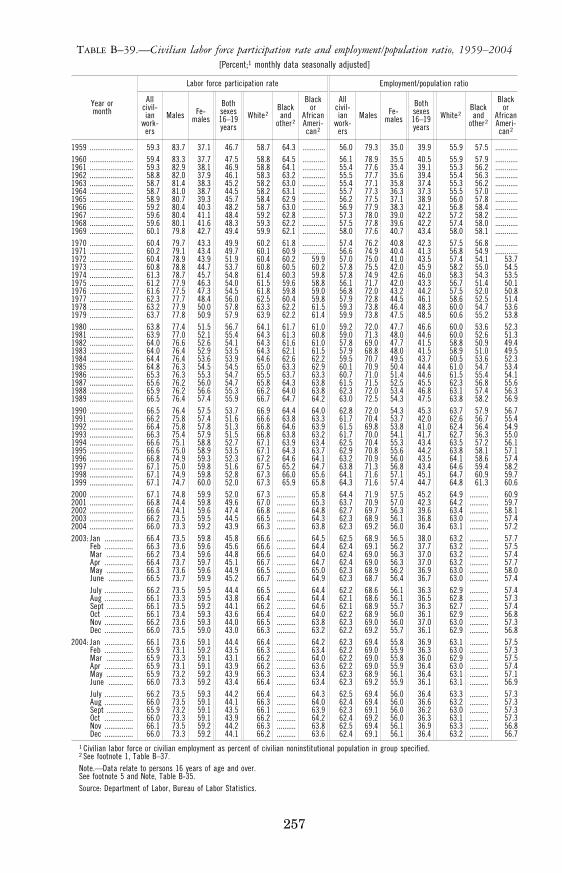
257
TABLE B–39.—Civilian labor force participation rate and employment/population ratio, 1959–2004 [Percent;1 monthly data seasonally adjusted]
Year or month
Labor force participation rate Employment/population ratio
All civil-ian
work- ers
Males Fe- males
Both sexes 16–19 years
White2 Black and
other2
Black or
African Ameri- can2
All civil-ian
work- ers
Males Fe- males
Both sexes 16–19 years
White2 Black and
other2
Black or
African Ameri- can2
1959 ....................... 59.3 83.7 37.1 46.7 58.7 64.3 ............ 56.0 79.3 35.0 39.9 55.9 57.5 ............1960 ....................... 59.4 83.3 37.7 47.5 58.8 64.5 ............ 56.1 78.9 35.5 40.5 55.9 57.9 ............1961 ....................... 59.3 82.9 38.1 46.9 58.8 64.1 ............ 55.4 77.6 35.4 39.1 55.3 56.2 ............1962 ....................... 58.8 82.0 37.9 46.1 58.3 63.2 ............ 55.5 77.7 35.6 39.4 55.4 56.3 ............1963 ....................... 58.7 81.4 38.3 45.2 58.2 63.0 ............ 55.4 77.1 35.8 37.4 55.3 56.2 ............1964 ....................... 58.7 81.0 38.7 44.5 58.2 63.1 ............ 55.7 77.3 36.3 37.3 55.5 57.0 ............1965 ....................... 58.9 80.7 39.3 45.7 58.4 62.9 ............ 56.2 77.5 37.1 38.9 56.0 57.8 ............1966 ....................... 59.2 80.4 40.3 48.2 58.7 63.0 ............ 56.9 77.9 38.3 42.1 56.8 58.4 ............1967 ....................... 59.6 80.4 41.1 48.4 59.2 62.8 ............ 57.3 78.0 39.0 42.2 57.2 58.2 ............1968 ....................... 59.6 80.1 41.6 48.3 59.3 62.2 ............ 57.5 77.8 39.6 42.2 57.4 58.0 ............1969 ....................... 60.1 79.8 42.7 49.4 59.9 62.1 ............ 58.0 77.6 40.7 43.4 58.0 58.1 ............1970 ....................... 60.4 79.7 43.3 49.9 60.2 61.8 ............ 57.4 76.2 40.8 42.3 57.5 56.8 ............1971 ....................... 60.2 79.1 43.4 49.7 60.1 60.9 ............ 56.6 74.9 40.4 41.3 56.8 54.9 ............1972 ....................... 60.4 78.9 43.9 51.9 60.4 60.2 59.9 57.0 75.0 41.0 43.5 57.4 54.1 53.7 1973 ....................... 60.8 78.8 44.7 53.7 60.8 60.5 60.2 57.8 75.5 42.0 45.9 58.2 55.0 54.5 1974 ....................... 61.3 78.7 45.7 54.8 61.4 60.3 59.8 57.8 74.9 42.6 46.0 58.3 54.3 53.5 1975 ....................... 61.2 77.9 46.3 54.0 61.5 59.6 58.8 56.1 71.7 42.0 43.3 56.7 51.4 50.1 1976 ....................... 61.6 77.5 47.3 54.5 61.8 59.8 59.0 56.8 72.0 43.2 44.2 57.5 52.0 50.8 1977 ....................... 62.3 77.7 48.4 56.0 62.5 60.4 59.8 57.9 72.8 44.5 46.1 58.6 52.5 51.4 1978 ....................... 63.2 77.9 50.0 57.8 63.3 62.2 61.5 59.3 73.8 46.4 48.3 60.0 54.7 53.6 1979 ....................... 63.7 77.8 50.9 57.9 63.9 62.2 61.4 59.9 73.8 47.5 48.5 60.6 55.2 53.8 1980 ....................... 63.8 77.4 51.5 56.7 64.1 61.7 61.0 59.2 72.0 47.7 46.6 60.0 53.6 52.3 1981 ....................... 63.9 77.0 52.1 55.4 64.3 61.3 60.8 59.0 71.3 48.0 44.6 60.0 52.6 51.3 1982 ....................... 64.0 76.6 52.6 54.1 64.3 61.6 61.0 57.8 69.0 47.7 41.5 58.8 50.9 49.4 1983 ....................... 64.0 76.4 52.9 53.5 64.3 62.1 61.5 57.9 68.8 48.0 41.5 58.9 51.0 49.5 1984 ....................... 64.4 76.4 53.6 53.9 64.6 62.6 62.2 59.5 70.7 49.5 43.7 60.5 53.6 52.3 1985 ....................... 64.8 76.3 54.5 54.5 65.0 63.3 62.9 60.1 70.9 50.4 44.4 61.0 54.7 53.4 1986 ....................... 65.3 76.3 55.3 54.7 65.5 63.7 63.3 60.7 71.0 51.4 44.6 61.5 55.4 54.1 1987 ....................... 65.6 76.2 56.0 54.7 65.8 64.3 63.8 61.5 71.5 52.5 45.5 62.3 56.8 55.6 1988 ....................... 65.9 76.2 56.6 55.3 66.2 64.0 63.8 62.3 72.0 53.4 46.8 63.1 57.4 56.3 1989 ....................... 66.5 76.4 57.4 55.9 66.7 64.7 64.2 63.0 72.5 54.3 47.5 63.8 58.2 56.9 1990 ....................... 66.5 76.4 57.5 53.7 66.9 64.4 64.0 62.8 72.0 54.3 45.3 63.7 57.9 56.7 1991 ....................... 66.2 75.8 57.4 51.6 66.6 63.8 63.3 61.7 70.4 53.7 42.0 62.6 56.7 55.4 1992 ....................... 66.4 75.8 57.8 51.3 66.8 64.6 63.9 61.5 69.8 53.8 41.0 62.4 56.4 54.9 1993 ....................... 66.3 75.4 57.9 51.5 66.8 63.8 63.2 61.7 70.0 54.1 41.7 62.7 56.3 55.0 1994 ....................... 66.6 75.1 58.8 52.7 67.1 63.9 63.4 62.5 70.4 55.3 43.4 63.5 57.2 56.1 1995 ....................... 66.6 75.0 58.9 53.5 67.1 64.3 63.7 62.9 70.8 55.6 44.2 63.8 58.1 57.1 1996 ....................... 66.8 74.9 59.3 52.3 67.2 64.6 64.1 63.2 70.9 56.0 43.5 64.1 58.6 57.4 1997 ....................... 67.1 75.0 59.8 51.6 67.5 65.2 64.7 63.8 71.3 56.8 43.4 64.6 59.4 58.2 1998 ....................... 67.1 74.9 59.8 52.8 67.3 66.0 65.6 64.1 71.6 57.1 45.1 64.7 60.9 59.7 1999 ....................... 67.1 74.7 60.0 52.0 67.3 65.9 65.8 64.3 71.6 57.4 44.7 64.8 61.3 60.6 2000 ....................... 67.1 74.8 59.9 52.0 67.3 .......... 65.8 64.4 71.9 57.5 45.2 64.9 .......... 60.9 2001 ....................... 66.8 74.4 59.8 49.6 67.0 .......... 65.3 63.7 70.9 57.0 42.3 64.2 .......... 59.7 2002 ....................... 66.6 74.1 59.6 47.4 66.8 .......... 64.8 62.7 69.7 56.3 39.6 63.4 .......... 58.1 2003 ....................... 66.2 73.5 59.5 44.5 66.5 .......... 64.3 62.3 68.9 56.1 36.8 63.0 .......... 57.4 2004 ....................... 66.0 73.3 59.2 43.9 66.3 .......... 63.8 62.3 69.2 56.0 36.4 63.1 .......... 57.2 2003: Jan ............... 66.4 73.5 59.8 45.8 66.6 .......... 64.5 62.5 68.9 56.5 38.0 63.2 .......... 57.7
Feb ............... 66.3 73.6 59.6 45.6 66.6 .......... 64.4 62.4 69.1 56.2 37.7 63.2 .......... 57.5 Mar .............. 66.2 73.4 59.6 44.8 66.6 .......... 64.0 62.4 69.0 56.3 37.0 63.2 .......... 57.4 Apr ............... 66.4 73.7 59.7 45.1 66.7 .......... 64.7 62.4 69.0 56.3 37.0 63.2 .......... 57.7 May .............. 66.3 73.6 59.6 44.9 66.5 .......... 65.0 62.3 68.9 56.2 36.9 63.0 .......... 58.0 June ............. 66.5 73.7 59.9 45.2 66.7 .......... 64.9 62.3 68.7 56.4 36.7 63.0 .......... 57.4 July ............... 66.2 73.5 59.5 44.4 66.5 .......... 64.4 62.2 68.6 56.1 36.3 62.9 .......... 57.4 Aug ............... 66.1 73.3 59.5 43.8 66.4 .......... 64.4 62.1 68.6 56.1 36.5 62.8 .......... 57.3 Sept .............. 66.1 73.5 59.2 44.1 66.2 .......... 64.6 62.1 68.9 55.7 36.3 62.7 .......... 57.4 Oct ............... 66.1 73.4 59.3 43.6 66.4 .......... 64.0 62.2 68.9 56.0 36.1 62.9 .......... 56.8 Nov ............... 66.2 73.6 59.3 44.0 66.5 .......... 63.8 62.3 69.0 56.0 37.0 63.0 .......... 57.3 Dec ............... 66.0 73.5 59.0 43.0 66.3 .......... 63.2 62.2 69.2 55.7 36.1 62.9 .......... 56.8
2004: Jan ............... 66.1 73.6 59.1 44.4 66.4 .......... 64.2 62.3 69.4 55.8 36.9 63.1 .......... 57.5 Feb ............... 65.9 73.1 59.2 43.5 66.3 .......... 63.4 62.2 69.0 55.9 36.3 63.0 .......... 57.3 Mar .............. 65.9 73.3 59.1 43.1 66.2 .......... 64.0 62.2 69.0 55.8 36.0 62.9 .......... 57.5 Apr ............... 65.9 73.1 59.1 43.9 66.2 .......... 63.6 62.2 69.0 55.9 36.4 63.0 .......... 57.4 May .............. 65.9 73.2 59.2 43.9 66.3 .......... 63.4 62.3 68.9 56.1 36.4 63.1 .......... 57.1 June ............. 66.0 73.3 59.2 43.4 66.4 .......... 63.4 62.3 69.2 55.9 36.1 63.1 .......... 56.9 July ............... 66.2 73.5 59.3 44.2 66.4 .......... 64.3 62.5 69.4 56.0 36.4 63.3 .......... 57.3 Aug ............... 66.0 73.5 59.1 44.1 66.3 .......... 64.0 62.4 69.4 56.0 36.6 63.2 .......... 57.3 Sept .............. 65.9 73.2 59.1 43.5 66.1 .......... 63.9 62.3 69.1 56.0 36.2 63.0 .......... 57.3 Oct ............... 66.0 73.3 59.1 43.9 66.2 .......... 64.2 62.4 69.2 56.0 36.3 63.1 .......... 57.3 Nov ............... 66.1 73.5 59.2 44.2 66.3 .......... 63.8 62.5 69.4 56.1 36.9 63.3 .......... 56.8 Dec ............... 66.0 73.3 59.2 44.1 66.2 .......... 63.6 62.4 69.1 56.1 36.4 63.2 .......... 56.7
1 Civilian labor force or civilian employment as percent of civilian noninstitutional population in group specified. 2 See footnote 1, Table B–37. Note.—Data relate to persons 16 years of age and over. See footnote 5 and Note, Table B-35. Source: Department of Labor, Bureau of Labor Statistics.
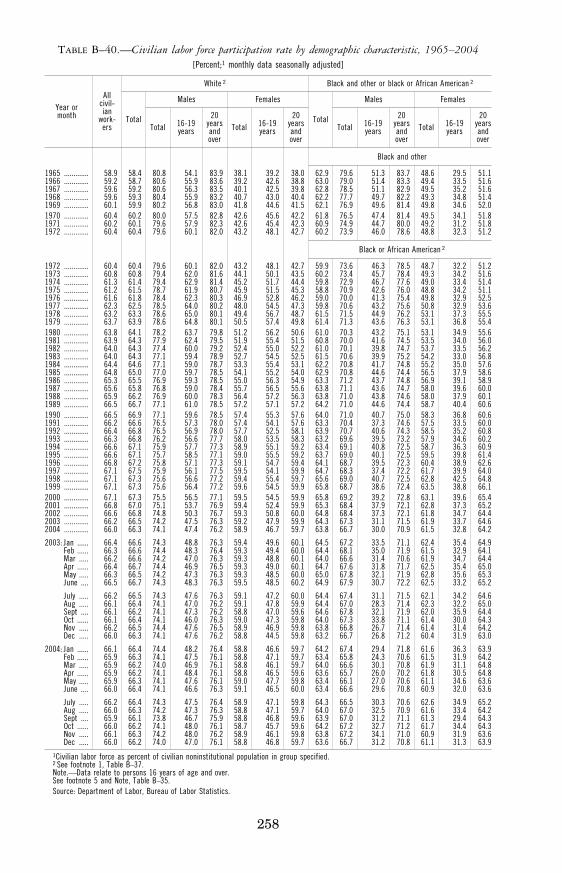
258
TABLE B–40.—Civilian labor force participation rate by demographic characteristic, 1965–2004 [Percent;1 monthly data seasonally adjusted]
Year or month
All civil- ian
work- ers
White 2 Black and other or black or African American 2
Total
Males Females
Total
Males Females
Total 16-19 years
20 years and over
Total 16-19 years
20 years and over
Total 16-19 years
20 years and over
Total 16-19 years
20 years and over
Black and other
1965 ............. 58.9 58.4 80.8 54.1 83.9 38.1 39.2 38.0 62.9 79.6 51.3 83.7 48.6 29.5 51.1 1966 ............. 59.2 58.7 80.6 55.9 83.6 39.2 42.6 38.8 63.0 79.0 51.4 83.3 49.4 33.5 51.6 1967 ............. 59.6 59.2 80.6 56.3 83.5 40.1 42.5 39.8 62.8 78.5 51.1 82.9 49.5 35.2 51.6 1968 ............. 59.6 59.3 80.4 55.9 83.2 40.7 43.0 40.4 62.2 77.7 49.7 82.2 49.3 34.8 51.4 1969 ............. 60.1 59.9 80.2 56.8 83.0 41.8 44.6 41.5 62.1 76.9 49.6 81.4 49.8 34.6 52.0 1970 ............. 60.4 60.2 80.0 57.5 82.8 42.6 45.6 42.2 61.8 76.5 47.4 81.4 49.5 34.1 51.8 1971 ............. 60.2 60.1 79.6 57.9 82.3 42.6 45.4 42.3 60.9 74.9 44.7 80.0 49.2 31.2 51.8 1972 ............. 60.4 60.4 79.6 60.1 82.0 43.2 48.1 42.7 60.2 73.9 46.0 78.6 48.8 32.3 51.2
Black or African American 2
1972 ............. 60.4 60.4 79.6 60.1 82.0 43.2 48.1 42.7 59.9 73.6 46.3 78.5 48.7 32.2 51.2 1973 ............. 60.8 60.8 79.4 62.0 81.6 44.1 50.1 43.5 60.2 73.4 45.7 78.4 49.3 34.2 51.6 1974 ............. 61.3 61.4 79.4 62.9 81.4 45.2 51.7 44.4 59.8 72.9 46.7 77.6 49.0 33.4 51.4 1975 ............. 61.2 61.5 78.7 61.9 80.7 45.9 51.5 45.3 58.8 70.9 42.6 76.0 48.8 34.2 51.1 1976 ............. 61.6 61.8 78.4 62.3 80.3 46.9 52.8 46.2 59.0 70.0 41.3 75.4 49.8 32.9 52.5 1977 ............. 62.3 62.5 78.5 64.0 80.2 48.0 54.5 47.3 59.8 70.6 43.2 75.6 50.8 32.9 53.6 1978 ............. 63.2 63.3 78.6 65.0 80.1 49.4 56.7 48.7 61.5 71.5 44.9 76.2 53.1 37.3 55.5 1979 ............. 63.7 63.9 78.6 64.8 80.1 50.5 57.4 49.8 61.4 71.3 43.6 76.3 53.1 36.8 55.4 1980 ............. 63.8 64.1 78.2 63.7 79.8 51.2 56.2 50.6 61.0 70.3 43.2 75.1 53.1 34.9 55.6 1981 ............. 63.9 64.3 77.9 62.4 79.5 51.9 55.4 51.5 60.8 70.0 41.6 74.5 53.5 34.0 56.0 1982 ............. 64.0 64.3 77.4 60.0 79.2 52.4 55.0 52.2 61.0 70.1 39.8 74.7 53.7 33.5 56.2 1983 ............. 64.0 64.3 77.1 59.4 78.9 52.7 54.5 52.5 61.5 70.6 39.9 75.2 54.2 33.0 56.8 1984 ............. 64.4 64.6 77.1 59.0 78.7 53.3 55.4 53.1 62.2 70.8 41.7 74.8 55.2 35.0 57.6 1985 ............. 64.8 65.0 77.0 59.7 78.5 54.1 55.2 54.0 62.9 70.8 44.6 74.4 56.5 37.9 58.6 1986 ............. 65.3 65.5 76.9 59.3 78.5 55.0 56.3 54.9 63.3 71.2 43.7 74.8 56.9 39.1 58.9 1987 ............. 65.6 65.8 76.8 59.0 78.4 55.7 56.5 55.6 63.8 71.1 43.6 74.7 58.0 39.6 60.0 1988 ............. 65.9 66.2 76.9 60.0 78.3 56.4 57.2 56.3 63.8 71.0 43.8 74.6 58.0 37.9 60.1 1989 ............. 66.5 66.7 77.1 61.0 78.5 57.2 57.1 57.2 64.2 71.0 44.6 74.4 58.7 40.4 60.6 1990 ............. 66.5 66.9 77.1 59.6 78.5 57.4 55.3 57.6 64.0 71.0 40.7 75.0 58.3 36.8 60.6 1991 ............. 66.2 66.6 76.5 57.3 78.0 57.4 54.1 57.6 63.3 70.4 37.3 74.6 57.5 33.5 60.0 1992 ............. 66.4 66.8 76.5 56.9 78.0 57.7 52.5 58.1 63.9 70.7 40.6 74.3 58.5 35.2 60.8 1993 ............. 66.3 66.8 76.2 56.6 77.7 58.0 53.5 58.3 63.2 69.6 39.5 73.2 57.9 34.6 60.2 1994 ............. 66.6 67.1 75.9 57.7 77.3 58.9 55.1 59.2 63.4 69.1 40.8 72.5 58.7 36.3 60.9 1995 ............. 66.6 67.1 75.7 58.5 77.1 59.0 55.5 59.2 63.7 69.0 40.1 72.5 59.5 39.8 61.4 1996 ............. 66.8 67.2 75.8 57.1 77.3 59.1 54.7 59.4 64.1 68.7 39.5 72.3 60.4 38.9 62.6 1997 ............. 67.1 67.5 75.9 56.1 77.5 59.5 54.1 59.9 64.7 68.3 37.4 72.2 61.7 39.9 64.0 1998 ............. 67.1 67.3 75.6 56.6 77.2 59.4 55.4 59.7 65.6 69.0 40.7 72.5 62.8 42.5 64.8 1999 ............. 67.1 67.3 75.6 56.4 77.2 59.6 54.5 59.9 65.8 68.7 38.6 72.4 63.5 38.8 66.1 2000 ............. 67.1 67.3 75.5 56.5 77.1 59.5 54.5 59.9 65.8 69.2 39.2 72.8 63.1 39.6 65.4 2001 ............. 66.8 67.0 75.1 53.7 76.9 59.4 52.4 59.9 65.3 68.4 37.9 72.1 62.8 37.3 65.2 2002 ............. 66.6 66.8 74.8 50.3 76.7 59.3 50.8 60.0 64.8 68.4 37.3 72.1 61.8 34.7 64.4 2003 ............. 66.2 66.5 74.2 47.5 76.3 59.2 47.9 59.9 64.3 67.3 31.1 71.5 61.9 33.7 64.6 2004 ............. 66.0 66.3 74.1 47.4 76.2 58.9 46.7 59.7 63.8 66.7 30.0 70.9 61.5 32.8 64.2
2003: Jan ...... 66.4 66.6 74.3 48.8 76.3 59.4 49.6 60.1 64.5 67.2 33.5 71.1 62.4 35.4 64.9 Feb ...... 66.3 66.6 74.4 48.3 76.4 59.3 49.4 60.0 64.4 68.1 35.0 71.9 61.5 32.9 64.1 Mar ..... 66.2 66.6 74.2 47.0 76.3 59.3 48.8 60.1 64.0 66.6 31.4 70.6 61.9 34.7 64.4 Apr ...... 66.4 66.7 74.4 46.9 76.5 59.3 49.0 60.1 64.7 67.6 31.8 71.7 62.5 35.4 65.0 May ..... 66.3 66.5 74.2 47.3 76.3 59.3 48.5 60.0 65.0 67.8 32.1 71.9 62.8 35.6 65.3 June .... 66.5 66.7 74.3 48.3 76.3 59.5 48.5 60.2 64.9 67.9 30.7 72.2 62.5 33.2 65.2
July ..... 66.2 66.5 74.3 47.6 76.3 59.1 47.2 60.0 64.4 67.4 31.1 71.5 62.1 34.2 64.6 Aug ..... 66.1 66.4 74.1 47.0 76.2 59.1 47.8 59.9 64.4 67.0 28.3 71.4 62.3 32.2 65.0 Sept .... 66.1 66.2 74.1 47.3 76.2 58.8 47.0 59.6 64.6 67.8 32.1 71.9 62.0 35.9 64.4 Oct ...... 66.1 66.4 74.1 46.0 76.3 59.0 47.3 59.8 64.0 67.3 33.8 71.1 61.4 30.0 64.3 Nov ..... 66.2 66.5 74.4 47.6 76.5 58.9 46.9 59.8 63.8 66.8 26.7 71.4 61.4 31.4 64.2 Dec ..... 66.0 66.3 74.1 47.6 76.2 58.8 44.5 59.8 63.2 66.7 26.8 71.2 60.4 31.9 63.0
2004: Jan ...... 66.1 66.4 74.4 48.2 76.4 58.8 46.6 59.7 64.2 67.4 29.4 71.8 61.6 36.3 63.9 Feb ...... 65.9 66.3 74.1 47.5 76.1 58.8 47.1 59.7 63.4 65.8 24.3 70.6 61.5 31.9 64.2 Mar ..... 65.9 66.2 74.0 46.9 76.1 58.8 46.1 59.7 64.0 66.6 30.1 70.8 61.9 31.1 64.8 Apr ...... 65.9 66.2 74.1 48.4 76.1 58.8 46.5 59.6 63.6 65.7 26.0 70.2 61.8 30.5 64.8 May ..... 65.9 66.3 74.1 47.6 76.1 59.0 47.7 59.8 63.4 66.1 27.0 70.6 61.1 34.6 63.6 June .... 66.0 66.4 74.1 46.6 76.3 59.1 46.5 60.0 63.4 66.6 29.6 70.8 60.9 32.0 63.6
July ..... 66.2 66.4 74.3 47.5 76.4 58.9 47.1 59.8 64.3 66.5 30.3 70.6 62.6 34.9 65.2 Aug ..... 66.0 66.3 74.2 47.3 76.3 58.8 47.1 59.7 64.0 67.0 32.5 70.9 61.6 33.4 64.2 Sept .... 65.9 66.1 73.8 46.7 75.9 58.8 46.8 59.6 63.9 67.0 31.2 71.1 61.3 29.4 64.3 Oct ...... 66.0 66.2 74.1 48.0 76.1 58.7 45.7 59.6 64.2 67.2 32.7 71.2 61.7 34.4 64.3 Nov ..... 66.1 66.3 74.2 48.0 76.2 58.9 46.1 59.8 63.8 67.2 34.1 71.0 60.9 31.9 63.6 Dec ..... 66.0 66.2 74.0 47.0 76.1 58.8 46.8 59.7 63.6 66.7 31.2 70.8 61.1 31.3 63.9
1Civilian labor force as percent of civilian noninstitutional population in group specified. 2 See footnote 1, Table B–37. Note.—Data relate to persons 16 years of age and over. See footnote 5 and Note, Table B–35. Source: Department of Labor, Bureau of Labor Statistics.
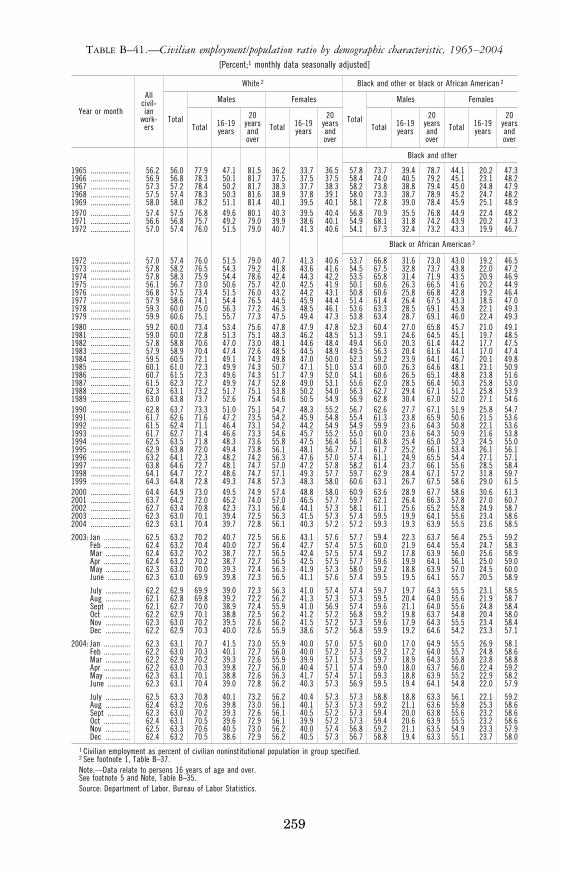
259
TABLE B–41.—Civilian employment/population ratio by demographic characteristic, 1965–2004 [Percent;1 monthly data seasonally adjusted]
Year or month
All civil- ian
work- ers
White 2 Black and other or black or African American 2
Total
Males Females
Total
Males Females
Total 16-19 years
20 years and over
Total 16-19 years
20 years and over
Total 16-19 years
20 years and over
Total 16-19 years
20 years and over
Black and other
1965 ..................... 56.2 56.0 77.9 47.1 81.5 36.2 33.7 36.5 57.8 73.7 39.4 78.7 44.1 20.2 47.3 1966 ..................... 56.9 56.8 78.3 50.1 81.7 37.5 37.5 37.5 58.4 74.0 40.5 79.2 45.1 23.1 48.2 1967 ..................... 57.3 57.2 78.4 50.2 81.7 38.3 37.7 38.3 58.2 73.8 38.8 79.4 45.0 24.8 47.9 1968 ..................... 57.5 57.4 78.3 50.3 81.6 38.9 37.8 39.1 58.0 73.3 38.7 78.9 45.2 24.7 48.2 1969 ..................... 58.0 58.0 78.2 51.1 81.4 40.1 39.5 40.1 58.1 72.8 39.0 78.4 45.9 25.1 48.9 1970 ..................... 57.4 57.5 76.8 49.6 80.1 40.3 39.5 40.4 56.8 70.9 35.5 76.8 44.9 22.4 48.2 1971 ..................... 56.6 56.8 75.7 49.2 79.0 39.9 38.6 40.1 54.9 68.1 31.8 74.2 43.9 20.2 47.3 1972 ..................... 57.0 57.4 76.0 51.5 79.0 40.7 41.3 40.6 54.1 67.3 32.4 73.2 43.3 19.9 46.7
Black or African American 2
1972 ..................... 57.0 57.4 76.0 51.5 79.0 40.7 41.3 40.6 53.7 66.8 31.6 73.0 43.0 19.2 46.5 1973 ..................... 57.8 58.2 76.5 54.3 79.2 41.8 43.6 41.6 54.5 67.5 32.8 73.7 43.8 22.0 47.2 1974 ..................... 57.8 58.3 75.9 54.4 78.6 42.4 44.3 42.2 53.5 65.8 31.4 71.9 43.5 20.9 46.9 1975 ..................... 56.1 56.7 73.0 50.6 75.7 42.0 42.5 41.9 50.1 60.6 26.3 66.5 41.6 20.2 44.9 1976 ..................... 56.8 57.5 73.4 51.5 76.0 43.2 44.2 43.1 50.8 60.6 25.8 66.8 42.8 19.2 46.4 1977 ..................... 57.9 58.6 74.1 54.4 76.5 44.5 45.9 44.4 51.4 61.4 26.4 67.5 43.3 18.5 47.0 1978 ..................... 59.3 60.0 75.0 56.3 77.2 46.3 48.5 46.1 53.6 63.3 28.5 69.1 45.8 22.1 49.3 1979 ..................... 59.9 60.6 75.1 55.7 77.3 47.5 49.4 47.3 53.8 63.4 28.7 69.1 46.0 22.4 49.3 1980 ..................... 59.2 60.0 73.4 53.4 75.6 47.8 47.9 47.8 52.3 60.4 27.0 65.8 45.7 21.0 49.1 1981 ..................... 59.0 60.0 72.8 51.3 75.1 48.3 46.2 48.5 51.3 59.1 24.6 64.5 45.1 19.7 48.5 1982 ..................... 57.8 58.8 70.6 47.0 73.0 48.1 44.6 48.4 49.4 56.0 20.3 61.4 44.2 17.7 47.5 1983 ..................... 57.9 58.9 70.4 47.4 72.6 48.5 44.5 48.9 49.5 56.3 20.4 61.6 44.1 17.0 47.4 1984 ..................... 59.5 60.5 72.1 49.1 74.3 49.8 47.0 50.0 52.3 59.2 23.9 64.1 46.7 20.1 49.8 1985 ..................... 60.1 61.0 72.3 49.9 74.3 50.7 47.1 51.0 53.4 60.0 26.3 64.6 48.1 23.1 50.9 1986 ..................... 60.7 61.5 72.3 49.6 74.3 51.7 47.9 52.0 54.1 60.6 26.5 65.1 48.8 23.8 51.6 1987 ..................... 61.5 62.3 72.7 49.9 74.7 52.8 49.0 53.1 55.6 62.0 28.5 66.4 50.3 25.8 53.0 1988 ..................... 62.3 63.1 73.2 51.7 75.1 53.8 50.2 54.0 56.3 62.7 29.4 67.1 51.2 25.8 53.9 1989 ..................... 63.0 63.8 73.7 52.6 75.4 54.6 50.5 54.9 56.9 62.8 30.4 67.0 52.0 27.1 54.6 1990 ..................... 62.8 63.7 73.3 51.0 75.1 54.7 48.3 55.2 56.7 62.6 27.7 67.1 51.9 25.8 54.7 1991 ..................... 61.7 62.6 71.6 47.2 73.5 54.2 45.9 54.8 55.4 61.3 23.8 65.9 50.6 21.5 53.6 1992 ..................... 61.5 62.4 71.1 46.4 73.1 54.2 44.2 54.9 54.9 59.9 23.6 64.3 50.8 22.1 53.6 1993 ..................... 61.7 62.7 71.4 46.6 73.3 54.6 45.7 55.2 55.0 60.0 23.6 64.3 50.9 21.6 53.8 1994 ..................... 62.5 63.5 71.8 48.3 73.6 55.8 47.5 56.4 56.1 60.8 25.4 65.0 52.3 24.5 55.0 1995 ..................... 62.9 63.8 72.0 49.4 73.8 56.1 48.1 56.7 57.1 61.7 25.2 66.1 53.4 26.1 56.1 1996 ..................... 63.2 64.1 72.3 48.2 74.2 56.3 47.6 57.0 57.4 61.1 24.9 65.5 54.4 27.1 57.1 1997 ..................... 63.8 64.6 72.7 48.1 74.7 57.0 47.2 57.8 58.2 61.4 23.7 66.1 55.6 28.5 58.4 1998 ..................... 64.1 64.7 72.7 48.6 74.7 57.1 49.3 57.7 59.7 62.9 28.4 67.1 57.2 31.8 59.7 1999 ..................... 64.3 64.8 72.8 49.3 74.8 57.3 48.3 58.0 60.6 63.1 26.7 67.5 58.6 29.0 61.5 2000 ..................... 64.4 64.9 73.0 49.5 74.9 57.4 48.8 58.0 60.9 63.6 28.9 67.7 58.6 30.6 61.3 2001 ..................... 63.7 64.2 72.0 46.2 74.0 57.0 46.5 57.7 59.7 62.1 26.4 66.3 57.8 27.0 60.7 2002 ..................... 62.7 63.4 70.8 42.3 73.1 56.4 44.1 57.3 58.1 61.1 25.6 65.2 55.8 24.9 58.7 2003 ..................... 62.3 63.0 70.1 39.4 72.5 56.3 41.5 57.3 57.4 59.5 19.9 64.1 55.6 23.4 58.6 2004 ..................... 62.3 63.1 70.4 39.7 72.8 56.1 40.3 57.2 57.2 59.3 19.3 63.9 55.5 23.6 58.5
2003: Jan .............. 62.5 63.2 70.2 40.7 72.5 56.6 43.1 57.6 57.7 59.4 22.3 63.7 56.4 25.5 59.2 Feb .............. 62.4 63.2 70.4 40.0 72.7 56.4 42.7 57.4 57.5 60.0 21.9 64.4 55.4 24.7 58.3 Mar ............. 62.4 63.2 70.2 38.7 72.7 56.5 42.4 57.5 57.4 59.2 17.8 63.9 56.0 25.6 58.9 Apr .............. 62.4 63.2 70.2 38.7 72.7 56.5 42.5 57.5 57.7 59.6 19.9 64.1 56.1 25.0 59.0 May ............. 62.3 63.0 70.0 39.3 72.4 56.3 41.9 57.3 58.0 59.2 18.8 63.9 57.0 24.5 60.0 June ............ 62.3 63.0 69.9 39.8 72.3 56.5 41.1 57.6 57.4 59.5 19.5 64.1 55.7 20.5 58.9
July ............. 62.2 62.9 69.9 39.0 72.3 56.3 41.0 57.4 57.4 59.7 19.7 64.3 55.5 23.1 58.5 Aug ............. 62.1 62.8 69.8 39.2 72.2 56.2 41.3 57.3 57.3 59.5 20.4 64.0 55.6 21.9 58.7 Sept ............ 62.1 62.7 70.0 38.9 72.4 55.9 41.0 56.9 57.4 59.6 21.1 64.0 55.6 24.8 58.4 Oct .............. 62.2 62.9 70.1 38.8 72.5 56.2 41.2 57.2 56.8 59.2 19.8 63.7 54.8 20.4 58.0 Nov ............. 62.3 63.0 70.2 39.5 72.6 56.2 41.5 57.2 57.3 59.6 17.9 64.3 55.5 23.4 58.4 Dec ............. 62.2 62.9 70.3 40.0 72.6 55.9 38.6 57.2 56.8 59.9 19.2 64.6 54.2 23.3 57.1
2004: Jan .............. 62.3 63.1 70.7 41.5 73.0 55.9 40.0 57.0 57.5 60.0 17.0 64.9 55.5 26.9 58.1 Feb .............. 62.2 63.0 70.3 40.1 72.7 56.0 40.0 57.2 57.3 59.2 17.2 64.0 55.7 24.8 58.6 Mar ............. 62.2 62.9 70.2 39.3 72.6 55.9 39.9 57.1 57.5 59.7 18.9 64.3 55.8 23.8 58.8 Apr .............. 62.2 63.0 70.3 39.8 72.7 56.0 40.4 57.1 57.4 59.0 18.0 63.7 56.0 22.4 59.2 May ............. 62.3 63.1 70.1 38.8 72.6 56.3 41.7 57.4 57.1 59.3 18.8 63.9 55.2 22.9 58.2 June ............ 62.3 63.1 70.4 39.0 72.8 56.2 40.3 57.3 56.9 59.5 19.4 64.1 54.8 22.0 57.9
July ............. 62.5 63.3 70.8 40.1 73.2 56.2 40.4 57.3 57.3 58.8 18.8 63.3 56.1 22.1 59.2 Aug ............. 62.4 63.2 70.6 39.8 73.0 56.1 40.1 57.3 57.3 59.2 21.1 63.6 55.8 25.3 58.6 Sept ............ 62.3 63.0 70.2 39.3 72.6 56.1 40.5 57.2 57.3 59.4 20.0 63.8 55.6 23.2 58.6 Oct .............. 62.4 63.1 70.5 39.6 72.9 56.1 39.9 57.2 57.3 59.4 20.6 63.9 55.5 23.2 58.6 Nov ............. 62.5 63.3 70.6 40.5 73.0 56.2 40.0 57.4 56.8 59.2 21.1 63.5 54.9 23.3 57.9 Dec ............. 62.4 63.2 70.5 38.6 72.9 56.2 40.5 57.3 56.7 58.8 19.4 63.3 55.1 23.7 58.0
1 Civilian employment as percent of civilian noninstitutional population in group specified. 2 See footnote 1, Table B–37. Note.—Data relate to persons 16 years of age and over. See footnote 5 and Note, Table B–35. Source: Department of Labor, Bureau of Labor Statistics.
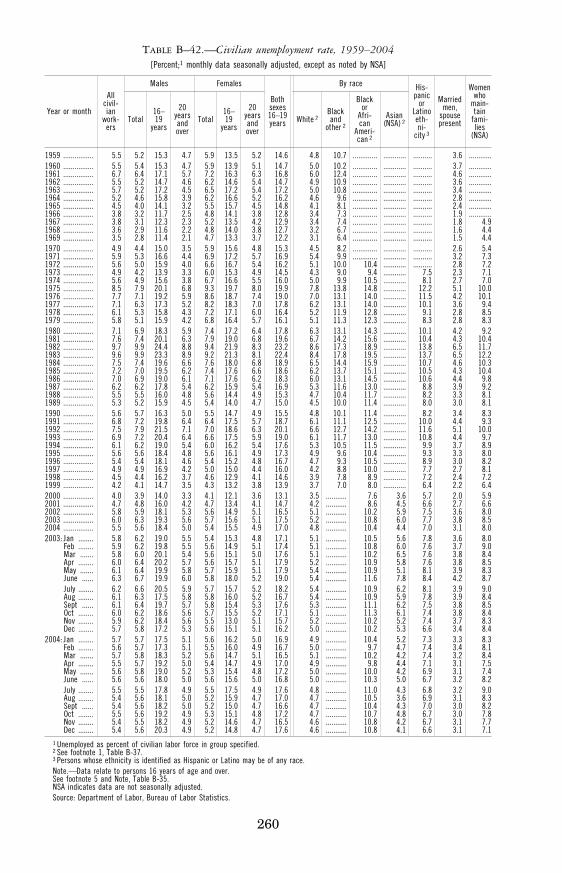
260
TABLE B–42.—Civilian unemployment rate, 1959–2004 [Percent;1 monthly data seasonally adjusted, except as noted by NSA]
Year or month
All civil-ian
work-ers
Males Females
Both sexes 16–19 years
By race His- panic
or Latino eth- ni-
city 3
Married men,
spouse present
Women who
main- tain
fami-lies
(NSA)
Total 16– 19
years
20 years and over
Total 16– 19
years
20 years and over
White 2 Black and
other 2
Black or
Afri- can
Ameri- can 2
Asian (NSA) 2
1959 ................ 5.5 5.2 15.3 4.7 5.9 13.5 5.2 14.6 4.8 10.7 ............. ............ .......... 3.6 ............1960 ................ 5.5 5.4 15.3 4.7 5.9 13.9 5.1 14.7 5.0 10.2 ............. ............ .......... 3.7 ............1961 ................ 6.7 6.4 17.1 5.7 7.2 16.3 6.3 16.8 6.0 12.4 ............. ............ .......... 4.6 ............1962 ................ 5.5 5.2 14.7 4.6 6.2 14.6 5.4 14.7 4.9 10.9 ............. ............ .......... 3.6 ............1963 ................ 5.7 5.2 17.2 4.5 6.5 17.2 5.4 17.2 5.0 10.8 ............. ............ .......... 3.4 ............1964 ................ 5.2 4.6 15.8 3.9 6.2 16.6 5.2 16.2 4.6 9.6 ............. ............ .......... 2.8 ............1965 ................ 4.5 4.0 14.1 3.2 5.5 15.7 4.5 14.8 4.1 8.1 ............. ............ .......... 2.4 ............1966 ................ 3.8 3.2 11.7 2.5 4.8 14.1 3.8 12.8 3.4 7.3 ............. ............ .......... 1.9 ............1967 ................ 3.8 3.1 12.3 2.3 5.2 13.5 4.2 12.9 3.4 7.4 ............. ............ .......... 1.8 4.9 1968 ................ 3.6 2.9 11.6 2.2 4.8 14.0 3.8 12.7 3.2 6.7 ............. ............ .......... 1.6 4.4 1969 ................ 3.5 2.8 11.4 2.1 4.7 13.3 3.7 12.2 3.1 6.4 ............. ............ .......... 1.5 4.4 1970 ................ 4.9 4.4 15.0 3.5 5.9 15.6 4.8 15.3 4.5 8.2 ............. ............ .......... 2.6 5.4 1971 ................ 5.9 5.3 16.6 4.4 6.9 17.2 5.7 16.9 5.4 9.9 ............. ............ .......... 3.2 7.3 1972 ................ 5.6 5.0 15.9 4.0 6.6 16.7 5.4 16.2 5.1 10.0 10.4 ............ .......... 2.8 7.2 1973 ................ 4.9 4.2 13.9 3.3 6.0 15.3 4.9 14.5 4.3 9.0 9.4 ............ 7.5 2.3 7.1 1974 ................ 5.6 4.9 15.6 3.8 6.7 16.6 5.5 16.0 5.0 9.9 10.5 ............ 8.1 2.7 7.0 1975 ................ 8.5 7.9 20.1 6.8 9.3 19.7 8.0 19.9 7.8 13.8 14.8 ............ 12.2 5.1 10.0 1976 ................ 7.7 7.1 19.2 5.9 8.6 18.7 7.4 19.0 7.0 13.1 14.0 ............ 11.5 4.2 10.1 1977 ................ 7.1 6.3 17.3 5.2 8.2 18.3 7.0 17.8 6.2 13.1 14.0 ............ 10.1 3.6 9.4 1978 ................ 6.1 5.3 15.8 4.3 7.2 17.1 6.0 16.4 5.2 11.9 12.8 ............ 9.1 2.8 8.5 1979 ................ 5.8 5.1 15.9 4.2 6.8 16.4 5.7 16.1 5.1 11.3 12.3 ............ 8.3 2.8 8.3 1980 ................ 7.1 6.9 18.3 5.9 7.4 17.2 6.4 17.8 6.3 13.1 14.3 ............ 10.1 4.2 9.2 1981 ................ 7.6 7.4 20.1 6.3 7.9 19.0 6.8 19.6 6.7 14.2 15.6 ............ 10.4 4.3 10.4 1982 ................ 9.7 9.9 24.4 8.8 9.4 21.9 8.3 23.2 8.6 17.3 18.9 ............ 13.8 6.5 11.7 1983 ................ 9.6 9.9 23.3 8.9 9.2 21.3 8.1 22.4 8.4 17.8 19.5 ............ 13.7 6.5 12.2 1984 ................ 7.5 7.4 19.6 6.6 7.6 18.0 6.8 18.9 6.5 14.4 15.9 ............ 10.7 4.6 10.3 1985 ................ 7.2 7.0 19.5 6.2 7.4 17.6 6.6 18.6 6.2 13.7 15.1 ............ 10.5 4.3 10.4 1986 ................ 7.0 6.9 19.0 6.1 7.1 17.6 6.2 18.3 6.0 13.1 14.5 ............ 10.6 4.4 9.8 1987 ................ 6.2 6.2 17.8 5.4 6.2 15.9 5.4 16.9 5.3 11.6 13.0 ............ 8.8 3.9 9.2 1988 ................ 5.5 5.5 16.0 4.8 5.6 14.4 4.9 15.3 4.7 10.4 11.7 ............ 8.2 3.3 8.1 1989 ................ 5.3 5.2 15.9 4.5 5.4 14.0 4.7 15.0 4.5 10.0 11.4 ............ 8.0 3.0 8.1 1990 ................ 5.6 5.7 16.3 5.0 5.5 14.7 4.9 15.5 4.8 10.1 11.4 ............ 8.2 3.4 8.3 1991 ................ 6.8 7.2 19.8 6.4 6.4 17.5 5.7 18.7 6.1 11.1 12.5 ............ 10.0 4.4 9.3 1992 ................ 7.5 7.9 21.5 7.1 7.0 18.6 6.3 20.1 6.6 12.7 14.2 ............ 11.6 5.1 10.0 1993 ................ 6.9 7.2 20.4 6.4 6.6 17.5 5.9 19.0 6.1 11.7 13.0 ............ 10.8 4.4 9.7 1994 ................ 6.1 6.2 19.0 5.4 6.0 16.2 5.4 17.6 5.3 10.5 11.5 ............ 9.9 3.7 8.9 1995 ................ 5.6 5.6 18.4 4.8 5.6 16.1 4.9 17.3 4.9 9.6 10.4 ............ 9.3 3.3 8.0 1996 ................ 5.4 5.4 18.1 4.6 5.4 15.2 4.8 16.7 4.7 9.3 10.5 ............ 8.9 3.0 8.2 1997 ................ 4.9 4.9 16.9 4.2 5.0 15.0 4.4 16.0 4.2 8.8 10.0 ............ 7.7 2.7 8.1 1998 ................ 4.5 4.4 16.2 3.7 4.6 12.9 4.1 14.6 3.9 7.8 8.9 ............ 7.2 2.4 7.2 1999 ................ 4.2 4.1 14.7 3.5 4.3 13.2 3.8 13.9 3.7 7.0 8.0 ............ 6.4 2.2 6.4 2000 ................ 4.0 3.9 14.0 3.3 4.1 12.1 3.6 13.1 3.5 ........... 7.6 3.6 5.7 2.0 5.9 2001 ................ 4.7 4.8 16.0 4.2 4.7 13.4 4.1 14.7 4.2 ........... 8.6 4.5 6.6 2.7 6.6 2002 ................ 5.8 5.9 18.1 5.3 5.6 14.9 5.1 16.5 5.1 ........... 10.2 5.9 7.5 3.6 8.0 2003 ................ 6.0 6.3 19.3 5.6 5.7 15.6 5.1 17.5 5.2 ........... 10.8 6.0 7.7 3.8 8.5 2004 ................ 5.5 5.6 18.4 5.0 5.4 15.5 4.9 17.0 4.8 ........... 10.4 4.4 7.0 3.1 8.0 2003: Jan ........ 5.8 6.2 19.0 5.5 5.4 15.3 4.8 17.1 5.1 ........... 10.5 5.6 7.8 3.6 8.0
Feb ........ 5.9 6.2 19.8 5.5 5.6 14.9 5.1 17.4 5.1 ........... 10.8 6.0 7.6 3.7 9.0 Mar ....... 5.8 6.0 20.1 5.4 5.6 15.1 5.0 17.6 5.1 ........... 10.2 6.5 7.6 3.8 8.4 Apr ........ 6.0 6.4 20.2 5.7 5.6 15.7 5.1 17.9 5.2 ........... 10.9 5.8 7.6 3.8 8.5 May ....... 6.1 6.4 19.9 5.8 5.7 15.9 5.1 17.9 5.4 ........... 10.9 5.1 8.1 3.9 8.3 June ...... 6.3 6.7 19.9 6.0 5.8 18.0 5.2 19.0 5.4 ........... 11.6 7.8 8.4 4.2 8.7 July ........ 6.2 6.6 20.5 5.9 5.7 15.7 5.2 18.2 5.4 ........... 10.9 6.2 8.1 3.9 9.0 Aug ........ 6.1 6.3 17.5 5.8 5.8 16.0 5.2 16.7 5.4 ........... 10.9 5.9 7.8 3.9 8.4 Sept ...... 6.1 6.4 19.7 5.7 5.8 15.4 5.3 17.6 5.3 ........... 11.1 6.2 7.5 3.8 8.5 Oct ........ 6.0 6.2 18.6 5.6 5.7 15.5 5.2 17.1 5.1 ........... 11.3 6.1 7.4 3.8 8.4 Nov ........ 5.9 6.2 18.4 5.6 5.5 13.0 5.1 15.7 5.2 ........... 10.2 5.2 7.4 3.7 8.3 Dec ........ 5.7 5.8 17.2 5.3 5.6 15.1 5.1 16.2 5.0 ........... 10.2 5.3 6.6 3.4 8.4
2004: Jan ........ 5.7 5.7 17.5 5.1 5.6 16.2 5.0 16.9 4.9 ........... 10.4 5.2 7.3 3.3 8.3 Feb ........ 5.6 5.7 17.3 5.1 5.5 16.0 4.9 16.7 5.0 ........... 9.7 4.7 7.4 3.4 8.1 Mar ....... 5.7 5.8 18.3 5.2 5.6 14.7 5.1 16.5 5.1 ........... 10.2 4.2 7.4 3.2 8.4 Apr ........ 5.5 5.7 19.2 5.0 5.4 14.7 4.9 17.0 4.9 ........... 9.8 4.4 7.1 3.1 7.5 May ....... 5.6 5.8 19.0 5.2 5.3 15.4 4.8 17.2 5.0 ........... 10.0 4.2 6.9 3.1 7.4 June ...... 5.6 5.6 18.0 5.0 5.6 15.6 5.0 16.8 5.0 ........... 10.3 5.0 6.7 3.2 8.2 July ........ 5.5 5.5 17.8 4.9 5.5 17.5 4.9 17.6 4.8 ........... 11.0 4.3 6.8 3.2 9.0 Aug ........ 5.4 5.6 18.1 5.0 5.2 15.9 4.7 17.0 4.7 ........... 10.5 3.6 6.9 3.1 8.3 Sept ...... 5.4 5.6 18.2 5.0 5.2 15.0 4.7 16.6 4.7 ........... 10.4 4.3 7.0 3.0 8.2 Oct ........ 5.5 5.6 19.2 4.9 5.3 15.1 4.8 17.2 4.7 ........... 10.7 4.8 6.7 3.0 7.8 Nov ........ 5.4 5.5 18.2 4.9 5.2 14.6 4.7 16.5 4.6 ........... 10.8 4.2 6.7 3.1 7.7 Dec ........ 5.4 5.6 20.3 4.9 5.2 14.8 4.7 17.6 4.6 ........... 10.8 4.1 6.6 3.1 7.1
1 Unemployed as percent of civilian labor force in group specified. 2 See footnote 1, Table B-37. 3 Persons whose ethnicity is identified as Hispanic or Latino may be of any race. Note.—Data relate to persons 16 years of age and over. See footnote 5 and Note, Table B-35. NSA indicates data are not seasonally adjusted. Source: Department of Labor, Bureau of Labor Statistics.
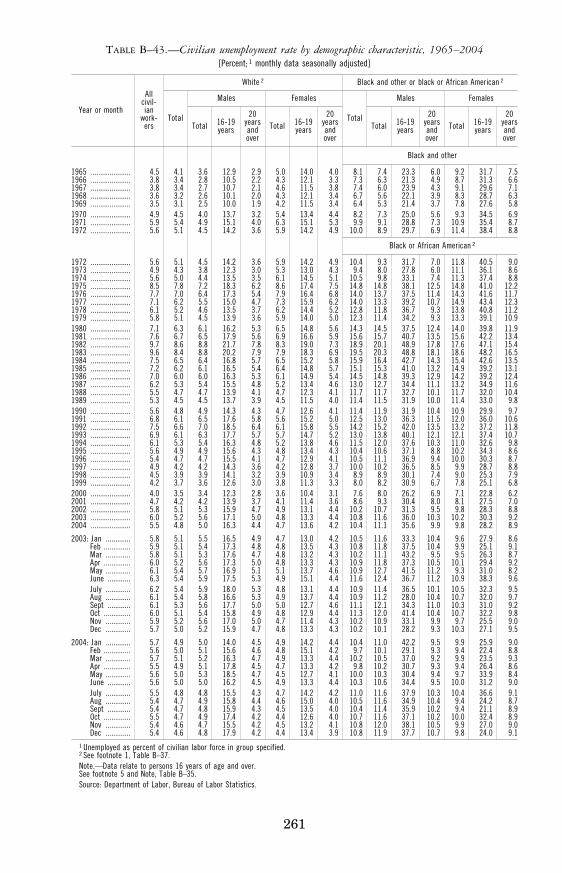
261
TABLE B–43.—Civilian unemployment rate by demographic characteristic, 1965–2004 [Percent; 1 monthly data seasonally adjusted]
Year or month
All civil- ian
work- ers
White 2 Black and other or black or African American 2
Total
Males Females
Total
Males Females
Total 16-19 years
20 years and over
Total 16-19 years
20 years and over
Total 16-19 years
20 years and over
Total 16-19 years
20 years and over
Black and other
1965 ..................... 4.5 4.1 3.6 12.9 2.9 5.0 14.0 4.0 8.1 7.4 23.3 6.0 9.2 31.7 7.5 1966 ..................... 3.8 3.4 2.8 10.5 2.2 4.3 12.1 3.3 7.3 6.3 21.3 4.9 8.7 31.3 6.6 1967 ..................... 3.8 3.4 2.7 10.7 2.1 4.6 11.5 3.8 7.4 6.0 23.9 4.3 9.1 29.6 7.1 1968 ..................... 3.6 3.2 2.6 10.1 2.0 4.3 12.1 3.4 6.7 5.6 22.1 3.9 8.3 28.7 6.3 1969 ..................... 3.5 3.1 2.5 10.0 1.9 4.2 11.5 3.4 6.4 5.3 21.4 3.7 7.8 27.6 5.8 1970 ..................... 4.9 4.5 4.0 13.7 3.2 5.4 13.4 4.4 8.2 7.3 25.0 5.6 9.3 34.5 6.9 1971 ..................... 5.9 5.4 4.9 15.1 4.0 6.3 15.1 5.3 9.9 9.1 28.8 7.3 10.9 35.4 8.7 1972 ..................... 5.6 5.1 4.5 14.2 3.6 5.9 14.2 4.9 10.0 8.9 29.7 6.9 11.4 38.4 8.8
Black or African American 2
1972 ..................... 5.6 5.1 4.5 14.2 3.6 5.9 14.2 4.9 10.4 9.3 31.7 7.0 11.8 40.5 9.0 1973 ..................... 4.9 4.3 3.8 12.3 3.0 5.3 13.0 4.3 9.4 8.0 27.8 6.0 11.1 36.1 8.6 1974 ..................... 5.6 5.0 4.4 13.5 3.5 6.1 14.5 5.1 10.5 9.8 33.1 7.4 11.3 37.4 8.8 1975 ..................... 8.5 7.8 7.2 18.3 6.2 8.6 17.4 7.5 14.8 14.8 38.1 12.5 14.8 41.0 12.2 1976 ..................... 7.7 7.0 6.4 17.3 5.4 7.9 16.4 6.8 14.0 13.7 37.5 11.4 14.3 41.6 11.7 1977 ..................... 7.1 6.2 5.5 15.0 4.7 7.3 15.9 6.2 14.0 13.3 39.2 10.7 14.9 43.4 12.3 1978 ..................... 6.1 5.2 4.6 13.5 3.7 6.2 14.4 5.2 12.8 11.8 36.7 9.3 13.8 40.8 11.2 1979 ..................... 5.8 5.1 4.5 13.9 3.6 5.9 14.0 5.0 12.3 11.4 34.2 9.3 13.3 39.1 10.9 1980 ..................... 7.1 6.3 6.1 16.2 5.3 6.5 14.8 5.6 14.3 14.5 37.5 12.4 14.0 39.8 11.9 1981 ..................... 7.6 6.7 6.5 17.9 5.6 6.9 16.6 5.9 15.6 15.7 40.7 13.5 15.6 42.2 13.4 1982 ..................... 9.7 8.6 8.8 21.7 7.8 8.3 19.0 7.3 18.9 20.1 48.9 17.8 17.6 47.1 15.4 1983 ..................... 9.6 8.4 8.8 20.2 7.9 7.9 18.3 6.9 19.5 20.3 48.8 18.1 18.6 48.2 16.5 1984 ..................... 7.5 6.5 6.4 16.8 5.7 6.5 15.2 5.8 15.9 16.4 42.7 14.3 15.4 42.6 13.5 1985 ..................... 7.2 6.2 6.1 16.5 5.4 6.4 14.8 5.7 15.1 15.3 41.0 13.2 14.9 39.2 13.1 1986 ..................... 7.0 6.0 6.0 16.3 5.3 6.1 14.9 5.4 14.5 14.8 39.3 12.9 14.2 39.2 12.4 1987 ..................... 6.2 5.3 5.4 15.5 4.8 5.2 13.4 4.6 13.0 12.7 34.4 11.1 13.2 34.9 11.6 1988 ..................... 5.5 4.7 4.7 13.9 4.1 4.7 12.3 4.1 11.7 11.7 32.7 10.1 11.7 32.0 10.4 1989 ..................... 5.3 4.5 4.5 13.7 3.9 4.5 11.5 4.0 11.4 11.5 31.9 10.0 11.4 33.0 9.8 1990 ..................... 5.6 4.8 4.9 14.3 4.3 4.7 12.6 4.1 11.4 11.9 31.9 10.4 10.9 29.9 9.7 1991 ..................... 6.8 6.1 6.5 17.6 5.8 5.6 15.2 5.0 12.5 13.0 36.3 11.5 12.0 36.0 10.6 1992 ..................... 7.5 6.6 7.0 18.5 6.4 6.1 15.8 5.5 14.2 15.2 42.0 13.5 13.2 37.2 11.8 1993 ..................... 6.9 6.1 6.3 17.7 5.7 5.7 14.7 5.2 13.0 13.8 40.1 12.1 12.1 37.4 10.7 1994 ..................... 6.1 5.3 5.4 16.3 4.8 5.2 13.8 4.6 11.5 12.0 37.6 10.3 11.0 32.6 9.8 1995 ..................... 5.6 4.9 4.9 15.6 4.3 4.8 13.4 4.3 10.4 10.6 37.1 8.8 10.2 34.3 8.6 1996 ..................... 5.4 4.7 4.7 15.5 4.1 4.7 12.9 4.1 10.5 11.1 36.9 9.4 10.0 30.3 8.7 1997 ..................... 4.9 4.2 4.2 14.3 3.6 4.2 12.8 3.7 10.0 10.2 36.5 8.5 9.9 28.7 8.8 1998 ..................... 4.5 3.9 3.9 14.1 3.2 3.9 10.9 3.4 8.9 8.9 30.1 7.4 9.0 25.3 7.9 1999 ..................... 4.2 3.7 3.6 12.6 3.0 3.8 11.3 3.3 8.0 8.2 30.9 6.7 7.8 25.1 6.8 2000 ..................... 4.0 3.5 3.4 12.3 2.8 3.6 10.4 3.1 7.6 8.0 26.2 6.9 7.1 22.8 6.2 2001 ..................... 4.7 4.2 4.2 13.9 3.7 4.1 11.4 3.6 8.6 9.3 30.4 8.0 8.1 27.5 7.0 2002 ..................... 5.8 5.1 5.3 15.9 4.7 4.9 13.1 4.4 10.2 10.7 31.3 9.5 9.8 28.3 8.8 2003 ..................... 6.0 5.2 5.6 17.1 5.0 4.8 13.3 4.4 10.8 11.6 36.0 10.3 10.2 30.3 9.2 2004 ..................... 5.5 4.8 5.0 16.3 4.4 4.7 13.6 4.2 10.4 11.1 35.6 9.9 9.8 28.2 8.9
2003: Jan ............. 5.8 5.1 5.5 16.5 4.9 4.7 13.0 4.2 10.5 11.6 33.3 10.4 9.6 27.9 8.6 Feb .............. 5.9 5.1 5.4 17.3 4.8 4.8 13.5 4.3 10.8 11.8 37.5 10.4 9.9 25.1 9.1 Mar ............. 5.8 5.1 5.3 17.6 4.7 4.8 13.2 4.3 10.2 11.1 43.2 9.5 9.5 26.3 8.7 Apr .............. 6.0 5.2 5.6 17.3 5.0 4.8 13.3 4.3 10.9 11.8 37.3 10.5 10.1 29.4 9.2 May ............. 6.1 5.4 5.7 16.9 5.1 5.1 13.7 4.6 10.9 12.7 41.5 11.2 9.3 31.0 8.2 June ............ 6.3 5.4 5.9 17.5 5.3 4.9 15.1 4.4 11.6 12.4 36.7 11.2 10.9 38.3 9.6 July ............. 6.2 5.4 5.9 18.0 5.3 4.8 13.1 4.4 10.9 11.4 36.5 10.1 10.5 32.3 9.5 Aug ............. 6.1 5.4 5.8 16.6 5.3 4.9 13.7 4.4 10.9 11.2 28.0 10.4 10.7 32.0 9.7 Sept ............ 6.1 5.3 5.6 17.7 5.0 5.0 12.7 4.6 11.1 12.1 34.3 11.0 10.3 31.0 9.2 Oct .............. 6.0 5.1 5.4 15.8 4.9 4.8 12.9 4.4 11.3 12.0 41.4 10.4 10.7 32.2 9.8 Nov ............. 5.9 5.2 5.6 17.0 5.0 4.7 11.4 4.3 10.2 10.9 33.1 9.9 9.7 25.5 9.0 Dec ............. 5.7 5.0 5.2 15.9 4.7 4.8 13.3 4.3 10.2 10.1 28.2 9.3 10.3 27.1 9.5
2004: Jan ............. 5.7 4.9 5.0 14.0 4.5 4.9 14.2 4.4 10.4 11.0 42.2 9.5 9.9 25.9 9.0 Feb .............. 5.6 5.0 5.1 15.6 4.6 4.8 15.1 4.2 9.7 10.1 29.1 9.3 9.4 22.4 8.8 Mar ............. 5.7 5.1 5.2 16.3 4.7 4.9 13.3 4.4 10.2 10.5 37.0 9.2 9.9 23.5 9.3 Apr .............. 5.5 4.9 5.1 17.8 4.5 4.7 13.3 4.2 9.8 10.2 30.7 9.3 9.4 26.4 8.6 May ............. 5.6 5.0 5.3 18.5 4.7 4.5 12.7 4.1 10.0 10.3 30.4 9.4 9.7 33.9 8.4 June ............ 5.6 5.0 5.0 16.2 4.5 4.9 13.3 4.4 10.3 10.6 34.4 9.5 10.0 31.2 9.0 July ............. 5.5 4.8 4.8 15.5 4.3 4.7 14.2 4.2 11.0 11.6 37.9 10.3 10.4 36.6 9.1 Aug ............. 5.4 4.7 4.9 15.8 4.4 4.6 15.0 4.0 10.5 11.6 34.9 10.4 9.4 24.2 8.7 Sept ............ 5.4 4.7 4.8 15.9 4.3 4.5 13.5 4.0 10.4 11.4 35.9 10.2 9.4 21.1 8.9 Oct .............. 5.5 4.7 4.9 17.4 4.2 4.4 12.6 4.0 10.7 11.6 37.1 10.2 10.0 32.4 8.9 Nov ............. 5.4 4.6 4.7 15.5 4.2 4.5 13.2 4.1 10.8 12.0 38.1 10.5 9.9 27.0 9.0 Dec ............. 5.4 4.6 4.8 17.9 4.2 4.4 13.4 3.9 10.8 11.9 37.7 10.7 9.8 24.0 9.1
1 Unemployed as percent of civilian labor force in group specified. 2 See footnote 1, Table B–37. Note.—Data relate to persons 16 years of age and over. See footnote 5 and Note, Table B–35. Source: Department of Labor, Bureau of Labor Statistics.
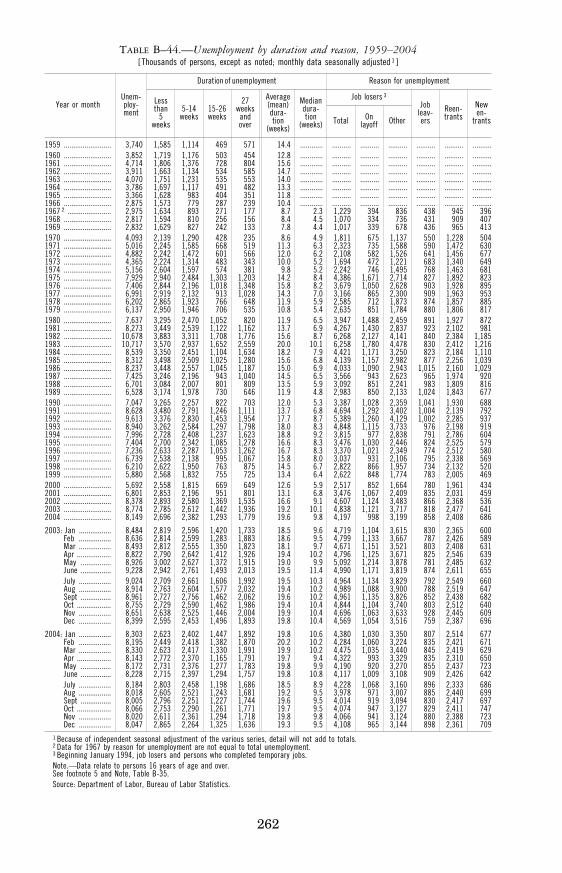
262
TABLE B–44.—Unemployment by duration and reason, 1959–2004 [ Thousands of persons, except as noted; monthly data seasonally adjusted 1 ]
Year or month Unem- ploy- ment
Duration of unemployment Reason for unemployment
Less than
5 weeks
5-14 weeks
15-26 weeks
27 weeks and over
Average (mean) dura- tion
(weeks)
Median dura- tion
(weeks)
Job losers 3 Job
leav- ers
Reen- trants
New en-
trants Total On layoff Other
1959 ......................... 3,740 1,585 1,114 469 571 14.4 ............ .......... .......... .......... .......... .......... ..........1960 ......................... 3,852 1,719 1,176 503 454 12.8 ............ .......... .......... .......... .......... .......... ..........1961 ......................... 4,714 1,806 1,376 728 804 15.6 ............ .......... .......... .......... .......... .......... ..........1962 ......................... 3,911 1,663 1,134 534 585 14.7 ............ .......... .......... .......... .......... .......... ..........1963 ......................... 4,070 1,751 1,231 535 553 14.0 ............ .......... .......... .......... .......... .......... ..........1964 ......................... 3,786 1,697 1,117 491 482 13.3 ............ .......... .......... .......... .......... .......... ..........1965 ......................... 3,366 1,628 983 404 351 11.8 ............ .......... .......... .......... .......... .......... ..........1966 ......................... 2,875 1,573 779 287 239 10.4 ............ .......... .......... .......... .......... .......... ..........1967 2 ....................... 2,975 1,634 893 271 177 8.7 2.3 1,229 394 836 438 945 396 1968 ......................... 2,817 1,594 810 256 156 8.4 4.5 1,070 334 736 431 909 407 1969 ......................... 2,832 1,629 827 242 133 7.8 4.4 1,017 339 678 436 965 413 1970 ......................... 4,093 2,139 1,290 428 235 8.6 4.9 1,811 675 1,137 550 1,228 504 1971 ......................... 5,016 2,245 1,585 668 519 11.3 6.3 2,323 735 1,588 590 1,472 630 1972 ......................... 4,882 2,242 1,472 601 566 12.0 6.2 2,108 582 1,526 641 1,456 677 1973 ......................... 4,365 2,224 1,314 483 343 10.0 5.2 1,694 472 1,221 683 1,340 649 1974 ......................... 5,156 2,604 1,597 574 381 9.8 5.2 2,242 746 1,495 768 1,463 681 1975 ......................... 7,929 2,940 2,484 1,303 1,203 14.2 8.4 4,386 1,671 2,714 827 1,892 823 1976 ......................... 7,406 2,844 2,196 1,018 1,348 15.8 8.2 3,679 1,050 2,628 903 1,928 895 1977 ......................... 6,991 2,919 2,132 913 1,028 14.3 7.0 3,166 865 2,300 909 1,963 953 1978 ......................... 6,202 2,865 1,923 766 648 11.9 5.9 2,585 712 1,873 874 1,857 885 1979 ......................... 6,137 2,950 1,946 706 535 10.8 5.4 2,635 851 1,784 880 1,806 817 1980 ......................... 7,637 3,295 2,470 1,052 820 11.9 6.5 3,947 1,488 2,459 891 1,927 872 1981 ......................... 8,273 3,449 2,539 1,122 1,162 13.7 6.9 4,267 1,430 2,837 923 2,102 981 1982 ......................... 10,678 3,883 3,311 1,708 1,776 15.6 8.7 6,268 2,127 4,141 840 2,384 1,185 1983 ......................... 10,717 3,570 2,937 1,652 2,559 20.0 10.1 6,258 1,780 4,478 830 2,412 1,216 1984 ......................... 8,539 3,350 2,451 1,104 1,634 18.2 7.9 4,421 1,171 3,250 823 2,184 1,110 1985 ......................... 8,312 3,498 2,509 1,025 1,280 15.6 6.8 4,139 1,157 2,982 877 2,256 1,039 1986 ......................... 8,237 3,448 2,557 1,045 1,187 15.0 6.9 4,033 1,090 2,943 1,015 2,160 1,029 1987 ......................... 7,425 3,246 2,196 943 1,040 14.5 6.5 3,566 943 2,623 965 1,974 920 1988 ......................... 6,701 3,084 2,007 801 809 13.5 5.9 3,092 851 2,241 983 1,809 816 1989 ......................... 6,528 3,174 1,978 730 646 11.9 4.8 2,983 850 2,133 1,024 1,843 677 1990 ......................... 7,047 3,265 2,257 822 703 12.0 5.3 3,387 1,028 2,359 1,041 1,930 688 1991 ......................... 8,628 3,480 2,791 1,246 1,111 13.7 6.8 4,694 1,292 3,402 1,004 2,139 792 1992 ......................... 9,613 3,376 2,830 1,453 1,954 17.7 8.7 5,389 1,260 4,129 1,002 2,285 937 1993 ......................... 8,940 3,262 2,584 1,297 1,798 18.0 8.3 4,848 1,115 3,733 976 2,198 919 1994 ......................... 7,996 2,728 2,408 1,237 1,623 18.8 9.2 3,815 977 2,838 791 2,786 604 1995 ......................... 7,404 2,700 2,342 1,085 1,278 16.6 8.3 3,476 1,030 2,446 824 2,525 579 1996 ......................... 7,236 2,633 2,287 1,053 1,262 16.7 8.3 3,370 1,021 2,349 774 2,512 580 1997 ......................... 6,739 2,538 2,138 995 1,067 15.8 8.0 3,037 931 2,106 795 2,338 569 1998 ......................... 6,210 2,622 1,950 763 875 14.5 6.7 2,822 866 1,957 734 2,132 520 1999 ......................... 5,880 2,568 1,832 755 725 13.4 6.4 2,622 848 1,774 783 2,005 469 2000 ......................... 5,692 2,558 1,815 669 649 12.6 5.9 2,517 852 1,664 780 1,961 434 2001 ......................... 6,801 2,853 2,196 951 801 13.1 6.8 3,476 1,067 2,409 835 2,031 459 2002 ......................... 8,378 2,893 2,580 1,369 1,535 16.6 9.1 4,607 1,124 3,483 866 2,368 536 2003 ......................... 8,774 2,785 2,612 1,442 1,936 19.2 10.1 4,838 1,121 3,717 818 2,477 641 2004 ......................... 8,149 2,696 2,382 1,293 1,779 19.6 9.8 4,197 998 3,199 858 2,408 686
2003: Jan ................. 8,484 2,819 2,596 1,420 1,733 18.5 9.6 4,719 1,104 3,615 830 2,365 600 Feb ................. 8,636 2,814 2,599 1,283 1,883 18.6 9.5 4,799 1,133 3,667 787 2,426 589 Mar ................. 8,493 2,812 2,555 1,350 1,823 18.1 9.7 4,671 1,151 3,521 803 2,408 631 Apr .................. 8,822 2,790 2,642 1,412 1,926 19.4 10.2 4,796 1,125 3,671 825 2,546 639 May ................ 8,926 3,002 2,627 1,372 1,915 19.0 9.9 5,092 1,214 3,878 781 2,485 632 June ................ 9,228 2,942 2,761 1,493 2,013 19.5 11.4 4,990 1,171 3,819 874 2,611 655 July ................. 9,024 2,709 2,661 1,606 1,992 19.5 10.3 4,964 1,134 3,829 792 2,549 660 Aug ................. 8,914 2,763 2,604 1,577 2,032 19.4 10.2 4,989 1,088 3,900 788 2,519 647 Sept ................ 8,961 2,727 2,756 1,462 2,062 19.6 10.2 4,961 1,135 3,826 852 2,438 682 Oct .................. 8,755 2,729 2,590 1,462 1,986 19.4 10.4 4,844 1,104 3,740 803 2,512 640 Nov ................. 8,651 2,638 2,525 1,446 2,004 19.9 10.4 4,696 1,063 3,633 928 2,445 609 Dec ................. 8,399 2,595 2,453 1,496 1,893 19.8 10.4 4,569 1,054 3,516 759 2,387 696
2004: Jan ................. 8,303 2,623 2,402 1,447 1,892 19.8 10.6 4,380 1,030 3,350 807 2,514 677 Feb ................. 8,195 2,449 2,418 1,382 1,870 20.2 10.2 4,284 1,060 3,224 835 2,421 671 Mar ................. 8,330 2,623 2,417 1,330 1,991 19.9 10.2 4,475 1,035 3,440 845 2,419 629 Apr .................. 8,143 2,772 2,370 1,165 1,791 19.7 9.4 4,322 993 3,329 835 2,310 650 May ................ 8,172 2,731 2,376 1,277 1,783 19.8 9.9 4,190 920 3,270 855 2,437 723 June ................ 8,228 2,715 2,397 1,294 1,757 19.8 10.8 4,117 1,009 3,108 909 2,426 642 July ................. 8,184 2,803 2,458 1,198 1,686 18.5 8.9 4,228 1,068 3,160 896 2,333 686 Aug ................. 8,018 2,605 2,521 1,243 1,681 19.2 9.5 3,978 971 3,007 885 2,440 699 Sept ................ 8,005 2,796 2,251 1,227 1,744 19.6 9.5 4,014 919 3,094 830 2,417 697 Oct .................. 8,066 2,753 2,290 1,261 1,771 19.7 9.5 4,074 947 3,127 829 2,411 747 Nov ................. 8,020 2,611 2,361 1,294 1,718 19.8 9.8 4,066 941 3,124 880 2,388 723 Dec ................. 8,047 2,865 2,264 1,325 1,636 19.3 9.5 4,108 965 3,144 898 2,361 709
1 Because of independent seasonal adjustment of the various series, detail will not add to totals. 2 Data for 1967 by reason for unemployment are not equal to total unemployment. 3 Beginning January 1994, job losers and persons who completed temporary jobs. Note.—Data relate to persons 16 years of age and over. See footnote 5 and Note, Table B-35. Source: Department of Labor, Bureau of Labor Statistics.
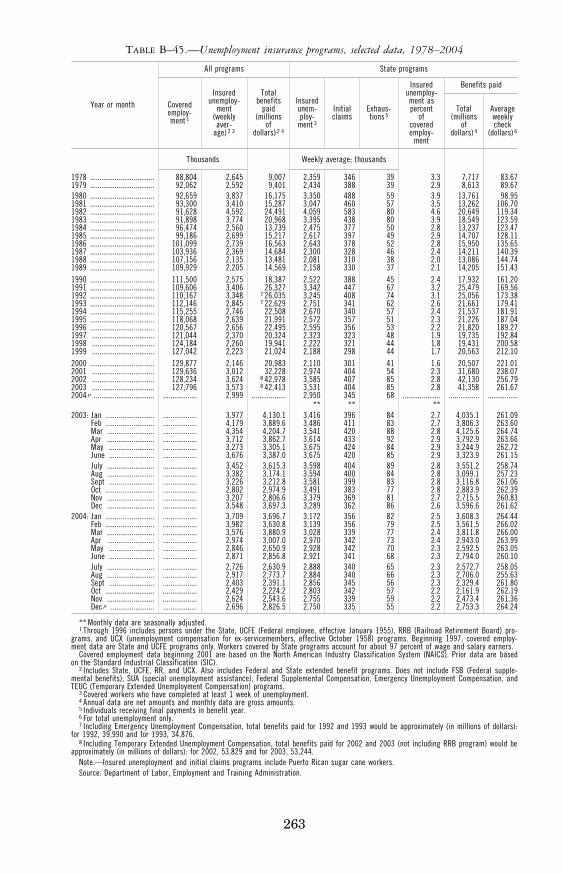
263
TABLE B–45.—Unemployment insurance programs, selected data, 1978–2004
Year or month
All programs State programs
Covered employ- ment 1
Insured unemploy-
ment (weekly aver-
age) 2 3
Total benefits
paid (millions
of dollars) 2 4
Insured unem- ploy-
ment 3
Initial claims
Exhaus- tions 5
Insured unemploy- ment as percent
of covered employ-
ment
Benefits paid
Total (millions
of dollars) 4
Average weekly check
(dollars) 6
Thousands Weekly average; thousands
1978 .................................. 88,804 2,645 9,007 2,359 346 39 3.3 7,717 83.67 1979 .................................. 92,062 2,592 9,401 2,434 388 39 2.9 8,613 89.67 1980 .................................. 92,659 3,837 16,175 3,350 488 59 3.9 13,761 98.95 1981 .................................. 93,300 3,410 15,287 3,047 460 57 3.5 13,262 106.70 1982 .................................. 91,628 4,592 24,491 4,059 583 80 4.6 20,649 119.34 1983 .................................. 91,898 3,774 20,968 3,395 438 80 3.9 18,549 123.59 1984 .................................. 96,474 2,560 13,739 2,475 377 50 2.8 13,237 123.47 1985 .................................. 99,186 2,699 15,217 2,617 397 49 2.9 14,707 128.11 1986 .................................. 101,099 2,739 16,563 2,643 378 52 2.8 15,950 135.65 1987 .................................. 103,936 2,369 14,684 2,300 328 46 2.4 14,211 140.39 1988 .................................. 107,156 2,135 13,481 2,081 310 38 2.0 13,086 144.74 1989 .................................. 109,929 2,205 14,569 2,158 330 37 2.1 14,205 151.43 1990 .................................. 111,500 2,575 18,387 2,522 388 45 2.4 17,932 161.20 1991 .................................. 109,606 3,406 26,327 3,342 447 67 3.2 25,479 169.56 1992 .................................. 110,167 3,348 7 26,035 3,245 408 74 3.1 25,056 173.38 1993 .................................. 112,146 2,845 7 22,629 2,751 341 62 2.6 21,661 179.41 1994 .................................. 115,255 2,746 22,508 2,670 340 57 2.4 21,537 181.91 1995 .................................. 118,068 2,639 21,991 2,572 357 51 2.3 21,226 187.04 1996 .................................. 120,567 2,656 22,495 2,595 356 53 2.2 21,820 189.27 1997 ................................. 121,044 2,370 20,324 2,323 323 48 1.9 19,735 192.84 1998 ................................. 124,184 2,260 19,941 2,222 321 44 1.8 19,431 200.58 1999 ................................. 127,042 2,223 21,024 2,188 298 44 1.7 20,563 212.10 2000 .................................. 129,877 2,146 20,983 2,110 301 41 1.6 20,507 221.01 2001 ................................. 129,636 3,012 32,228 2,974 404 54 2.3 31,680 238.07 2002 ................................. 128,234 3,624 8 42,978 3,585 407 85 2.8 42,130 256.79 2003 ................................. 127,796 3,573 8 42,413 3,531 404 85 2.8 41,358 261.67 2004 p ................................ .................. 2,999 .................. 2,950 345 68 .................... ................ ................
** ** ** 2003: Jan .......................... .................. 3,977 4,130.1 3,416 396 84 2.7 4,035.1 261.09
Feb .......................... .................. 4,179 3,889.6 3,486 411 83 2.7 3,806.3 263.60 Mar ......................... .................. 4,354 4,204.7 3,541 420 88 2.8 4,125.6 264.74 Apr ......................... .................. 3,712 3,862.7 3,614 433 92 2.9 3,792.9 263.66 May ........................ .................. 3,273 3,305.1 3,675 424 84 2.9 3,244.9 262.72 June ........................ .................. 3,676 3,387.0 3,675 420 85 2.9 3,323.9 261.15 July ......................... .................. 3,452 3,615.3 3,598 404 89 2.8 3,551.2 258.74 Aug ......................... .................. 3,382 3,174.1 3,594 400 84 2.8 3,099.1 257.23 Sept ........................ .................. 3,226 3,212.8 3,581 399 83 2.8 3,116.8 261.06 Oct .......................... .................. 2,802 2,974.9 3,491 383 77 2.8 2,883.9 262.39 Nov ......................... .................. 3,207 2,806.6 3,379 369 81 2.7 2,715.5 260.83 Dec ......................... .................. 3,548 3,697.3 3,289 362 86 2.6 3,596.6 261.62
2004: Jan .......................... .................. 3,709 3,696.7 3,172 356 82 2.5 3,608.3 264.44 Feb .......................... .................. 3,982 3,630.8 3,139 356 79 2.5 3,561.5 266.02 Mar ......................... .................. 3,576 3,880.9 3,028 339 77 2.4 3,811.8 266.00 Apr ......................... .................. 2,974 3,007.0 2,970 342 73 2.4 2,943.0 263.99 May ........................ .................. 2,846 2,650.9 2,928 342 70 2.3 2,592.5 263.05 June ........................ .................. 2,871 2,856.8 2,921 341 68 2.3 2,794.0 260.10 July ......................... .................. 2,726 2,630.9 2,888 340 65 2.3 2,572.7 258.05 Aug ......................... .................. 2,917 2,773.7 2,884 340 66 2.3 2,706.0 255.63 Sept ........................ .................. 2,403 2,391.1 2,856 345 56 2.3 2,329.4 261.80 Oct .......................... .................. 2,429 2,224.2 2,803 342 57 2.2 2,161.9 262.19 Nov ......................... .................. 2,624 2,543.6 2,755 339 59 2.2 2,473.4 261.36 Dec p ....................... .................. 2,696 2,826.5 2,750 335 55 2.2 2,753.3 264.24
** Monthly data are seasonally adjusted. 1 Through 1996 includes persons under the State, UCFE (Federal employee, effective January 1955), RRB (Railroad Retirement Board) pro-
grams, and UCX (unemployment compensation for ex-servicemembers, effective October 1958) programs. Beginning 1997, covered employ-ment data are State and UCFE programs only. Workers covered by State programs account for about 97 percent of wage and salary earners.
Covered employment data beginning 2001 are based on the North American Industry Classification System (NAICS). Prior data are based on the Standard Industrial Classification (SIC).
2 Includes State, UCFE, RR, and UCX. Also includes Federal and State extended benefit programs. Does not include FSB (Federal supple-mental benefits), SUA (special unemployment assistance), Federal Supplemental Compensation, Emergency Unemployment Compensation, and TEUC (Temporary Extended Unemployment Compensation) programs.
3 Covered workers who have completed at least 1 week of unemployment. 4 Annual data are net amounts and monthly data are gross amounts. 5 Individuals receiving final payments in benefit year. 6 For total unemployment only. 7 Including Emergency Unemployment Compensation, total benefits paid for 1992 and 1993 would be approximately (in millions of dollars):
for 1992, 39,990 and for 1993, 34,876. 8 Including Temporary Extended Unemployment Compensation, total benefits paid for 2002 and 2003 (not including RRB program) would be
approximately (in millions of dollars): for 2002, 53,829 and for 2003, 53,244. Note.—Insured unemployment and initial claims programs include Puerto Rican sugar cane workers. Source: Department of Labor, Employment and Training Administration.
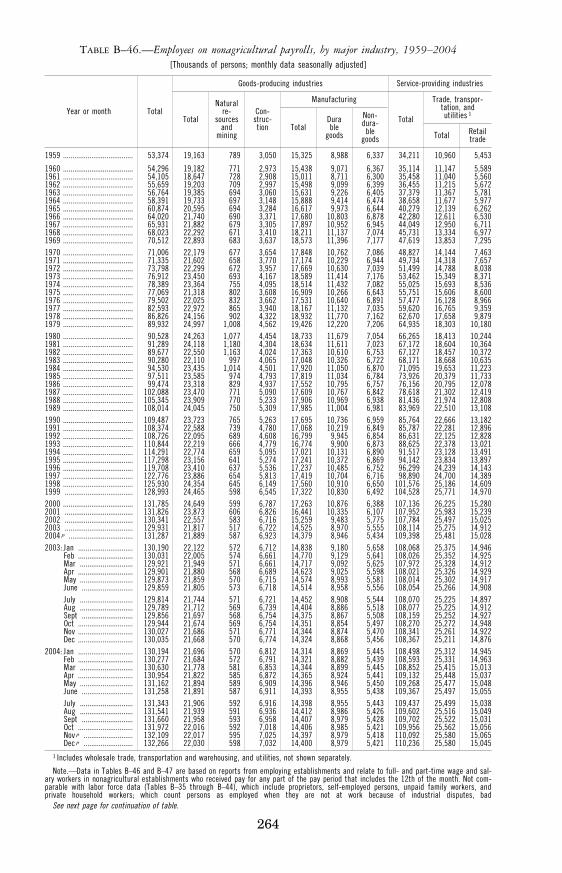
264
TABLE B–46.—Employees on nonagricultural payrolls, by major industry, 1959–2004 [Thousands of persons; monthly data seasonally adjusted]
Year or month Total
Goods-producing industries Service-providing industries
Total
Natural re-
sources and
mining
Con- struc- tion
Manufacturing
Total
Trade, transpor-tation, and utilities 1
Total Dura ble
goods
Non- dura-
ble goods Total Retail
trade
1959 ..................................... 53,374 19,163 789 3,050 15,325 8,988 6,337 34,211 10,960 5,453
1960 ..................................... 54,296 19,182 771 2,973 15,438 9,071 6,367 35,114 11,147 5,589 1961 ..................................... 54,105 18,647 728 2,908 15,011 8,711 6,300 35,458 11,040 5,560 1962 ..................................... 55,659 19,203 709 2,997 15,498 9,099 6,399 36,455 11,215 5,672 1963 ..................................... 56,764 19,385 694 3,060 15,631 9,226 6,405 37,379 11,367 5,781 1964 ..................................... 58,391 19,733 697 3,148 15,888 9,414 6,474 38,658 11,677 5,977 1965 ..................................... 60,874 20,595 694 3,284 16,617 9,973 6,644 40,279 12,139 6,262 1966 ..................................... 64,020 21,740 690 3,371 17,680 10,803 6,878 42,280 12,611 6,530 1967 ..................................... 65,931 21,882 679 3,305 17,897 10,952 6,945 44,049 12,950 6,711 1968 ..................................... 68,023 22,292 671 3,410 18,211 11,137 7,074 45,731 13,334 6,977 1969 ..................................... 70,512 22,893 683 3,637 18,573 11,396 7,177 47,619 13,853 7,295 1970 ..................................... 71,006 22,179 677 3,654 17,848 10,762 7,086 48,827 14,144 7,463 1971 ..................................... 71,335 21,602 658 3,770 17,174 10,229 6,944 49,734 14,318 7,657 1972 ..................................... 73,798 22,299 672 3,957 17,669 10,630 7,039 51,499 14,788 8,038 1973 ..................................... 76,912 23,450 693 4,167 18,589 11,414 7,176 53,462 15,349 8,371 1974 ..................................... 78,389 23,364 755 4,095 18,514 11,432 7,082 55,025 15,693 8,536 1975 ..................................... 77,069 21,318 802 3,608 16,909 10,266 6,643 55,751 15,606 8,600 1976 ..................................... 79,502 22,025 832 3,662 17,531 10,640 6,891 57,477 16,128 8,966 1977 ..................................... 82,593 22,972 865 3,940 18,167 11,132 7,035 59,620 16,765 9,359 1978 ..................................... 86,826 24,156 902 4,322 18,932 11,770 7,162 62,670 17,658 9,879 1979 ..................................... 89,932 24,997 1,008 4,562 19,426 12,220 7,206 64,935 18,303 10,180 1980 ..................................... 90,528 24,263 1,077 4,454 18,733 11,679 7,054 66,265 18,413 10,244 1981 ..................................... 91,289 24,118 1,180 4,304 18,634 11,611 7,023 67,172 18,604 10,364 1982 ..................................... 89,677 22,550 1,163 4,024 17,363 10,610 6,753 67,127 18,457 10,372 1983 ..................................... 90,280 22,110 997 4,065 17,048 10,326 6,722 68,171 18,668 10,635 1984 ..................................... 94,530 23,435 1,014 4,501 17,920 11,050 6,870 71,095 19,653 11,223 1985 ..................................... 97,511 23,585 974 4,793 17,819 11,034 6,784 73,926 20,379 11,733 1986 ..................................... 99,474 23,318 829 4,937 17,552 10,795 6,757 76,156 20,795 12,078 1987 ..................................... 102,088 23,470 771 5,090 17,609 10,767 6,842 78,618 21,302 12,419 1988 ..................................... 105,345 23,909 770 5,233 17,906 10,969 6,938 81,436 21,974 12,808 1989 ..................................... 108,014 24,045 750 5,309 17,985 11,004 6,981 83,969 22,510 13,108 1990 ..................................... 109,487 23,723 765 5,263 17,695 10,736 6,959 85,764 22,666 13,182 1991 ..................................... 108,374 22,588 739 4,780 17,068 10,219 6,849 85,787 22,281 12,896 1992 ..................................... 108,726 22,095 689 4,608 16,799 9,945 6,854 86,631 22,125 12,828 1993 ..................................... 110,844 22,219 666 4,779 16,774 9,900 6,873 88,625 22,378 13,021 1994 ..................................... 114,291 22,774 659 5,095 17,021 10,131 6,890 91,517 23,128 13,491 1995 ..................................... 117,298 23,156 641 5,274 17,241 10,372 6,869 94,142 23,834 13,897 1996 ..................................... 119,708 23,410 637 5,536 17,237 10,485 6,752 96,299 24,239 14,143 1997 ..................................... 122,776 23,886 654 5,813 17,419 10,704 6,716 98,890 24,700 14,389 1998 ..................................... 125,930 24,354 645 6,149 17,560 10,910 6,650 101,576 25,186 14,609 1999 .................................... 128,993 24,465 598 6,545 17,322 10,830 6,492 104,528 25,771 14,970 2000 ..................................... 131,785 24,649 599 6,787 17,263 10,876 6,388 107,136 26,225 15,280 2001 .................................... 131,826 23,873 606 6,826 16,441 10,335 6,107 107,952 25,983 15,239 2002 .................................... 130,341 22,557 583 6,716 15,259 9,483 5,775 107,784 25,497 15,025 2003 .................................... 129,931 21,817 517 6,722 14,525 8,970 5,555 108,114 25,275 14,912 2004 p .................................. 131,287 21,889 587 6,923 14,379 8,946 5,434 109,398 25,481 15,028 2003: Jan ............................. 130,190 22,122 572 6,712 14,838 9,180 5,658 108,068 25,375 14,946
Feb ............................. 130,031 22,005 574 6,661 14,770 9,129 5,641 108,026 25,352 14,925 Mar ............................ 129,921 21,949 571 6,661 14,717 9,092 5,625 107,972 25,328 14,912 Apr ............................. 129,901 21,880 568 6,689 14,623 9,025 5,598 108,021 25,326 14,929 May ............................ 129,873 21,859 570 6,715 14,574 8,993 5,581 108,014 25,302 14,917 June ........................... 129,859 21,805 573 6,718 14,514 8,958 5,556 108,054 25,266 14,908 July ............................ 129,814 21,744 571 6,721 14,452 8,908 5,544 108,070 25,225 14,897 Aug ............................ 129,789 21,712 569 6,739 14,404 8,886 5,518 108,077 25,225 14,912 Sept ........................... 129,856 21,697 568 6,754 14,375 8,867 5,508 108,159 25,252 14,927 Oct ............................. 129,944 21,674 569 6,754 14,351 8,854 5,497 108,270 25,272 14,948 Nov ............................. 130,027 21,686 571 6,771 14,344 8,874 5,470 108,341 25,261 14,922 Dec ............................. 130,035 21,668 570 6,774 14,324 8,868 5,456 108,367 25,211 14,876
2004: Jan ............................. 130,194 21,696 570 6,812 14,314 8,869 5,445 108,498 25,312 14,945 Feb ............................. 130,277 21,684 572 6,791 14,321 8,882 5,439 108,593 25,331 14,963 Mar ............................ 130,630 21,778 581 6,853 14,344 8,899 5,445 108,852 25,415 15,013 Apr ............................. 130,954 21,822 585 6,872 14,365 8,924 5,441 109,132 25,448 15,037 May ............................ 131,162 21,894 589 6,909 14,396 8,946 5,450 109,268 25,477 15,048 June ........................... 131,258 21,891 587 6,911 14,393 8,955 5,438 109,367 25,497 15,055 July ............................ 131,343 21,906 592 6,916 14,398 8,955 5,443 109,437 25,499 15,038 Aug ............................ 131,541 21,939 591 6,936 14,412 8,986 5,426 109,602 25,516 15,049 Sept ........................... 131,660 21,958 593 6,958 14,407 8,979 5,428 109,702 25,522 15,031 Oct ............................. 131,972 22,016 592 7,018 14,406 8,985 5,421 109,956 25,562 15,056 Nov p .......................... 132,109 22,017 595 7,025 14,397 8,979 5,418 110,092 25,580 15,065 Dec p .......................... 132,266 22,030 598 7,032 14,400 8,979 5,421 110,236 25,580 15,045
1 Includes wholesale trade, transportation and warehousing, and utilities, not shown separately.
Note.—Data in Tables B–46 and B–47 are based on reports from employing establishments and relate to full- and part-time wage and sal-ary workers in nonagricultural establishments who received pay for any part of the pay period that includes the 12th of the month. Not com-parable with labor force data (Tables B–35 through B–44), which include proprietors, self-employed persons, unpaid family workers, and private household workers; which count persons as employed when they are not at work because of industrial disputes, bad
See next page for continuation of table.
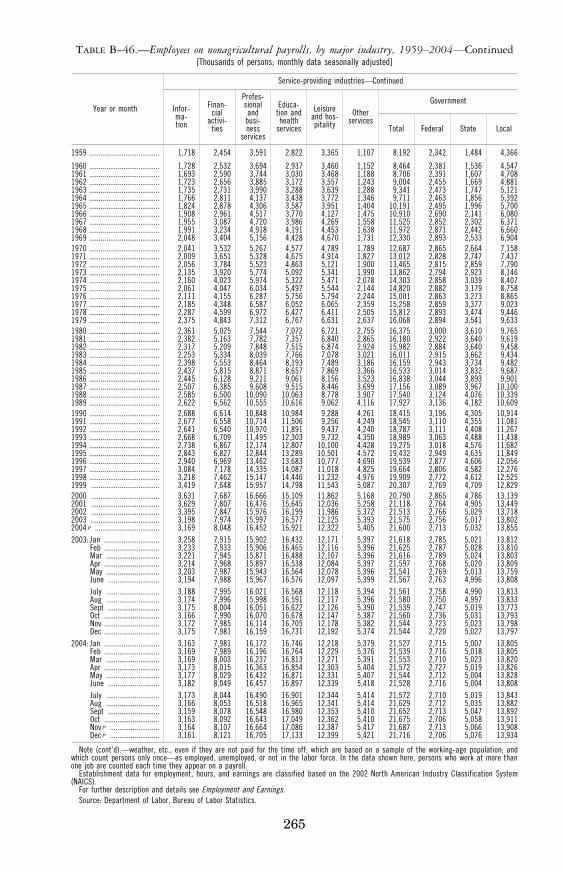
265
TABLE B–46.—Employees on nonagricultural payrolls, by major industry, 1959–2004—Continued [Thousands of persons; monthly data seasonally adjusted]
Year or month
Service-providing industries—Continued
Infor- ma- tion
Finan- cial
activi- ties
Profes- sional and
busi- ness
services
Educa- tion and health
services
Leisure and hos-pitality
Other services
Government
Total Federal State Local
1959 ..................................... 1,718 2,454 3,591 2,822 3,365 1,107 8,192 2,342 1,484 4,366
1960 ..................................... 1,728 2,532 3,694 2,937 3,460 1,152 8,464 2,381 1,536 4,547 1961 ..................................... 1,693 2,590 3,744 3,030 3,468 1,188 8,706 2,391 1,607 4,708 1962 ..................................... 1,723 2,656 3,885 3,172 3,557 1,243 9,004 2,455 1,669 4,881 1963 ..................................... 1,735 2,731 3,990 3,288 3,639 1,288 9,341 2,473 1,747 5,121 1964 ..................................... 1,766 2,811 4,137 3,438 3,772 1,346 9,711 2,463 1,856 5,392 1965 ..................................... 1,824 2,878 4,306 3,587 3,951 1,404 10,191 2,495 1,996 5,700 1966 ..................................... 1,908 2,961 4,517 3,770 4,127 1,475 10,910 2,690 2,141 6,080 1967 ..................................... 1,955 3,087 4,720 3,986 4,269 1,558 11,525 2,852 2,302 6,371 1968 ..................................... 1,991 3,234 4,918 4,191 4,453 1,638 11,972 2,871 2,442 6,660 1969 ..................................... 2,048 3,404 5,156 4,428 4,670 1,731 12,330 2,893 2,533 6,904 1970 ..................................... 2,041 3,532 5,267 4,577 4,789 1,789 12,687 2,865 2,664 7,158 1971 ..................................... 2,009 3,651 5,328 4,675 4,914 1,827 13,012 2,828 2,747 7,437 1972 ..................................... 2,056 3,784 5,523 4,863 5,121 1,900 13,465 2,815 2,859 7,790 1973 ..................................... 2,135 3,920 5,774 5,092 5,341 1,990 13,862 2,794 2,923 8,146 1974 ..................................... 2,160 4,023 5,974 5,322 5,471 2,078 14,303 2,858 3,039 8,407 1975 ..................................... 2,061 4,047 6,034 5,497 5,544 2,144 14,820 2,882 3,179 8,758 1976 ..................................... 2,111 4,155 6,287 5,756 5,794 2,244 15,001 2,863 3,273 8,865 1977 ..................................... 2,185 4,348 6,587 6,052 6,065 2,359 15,258 2,859 3,377 9,023 1978 ..................................... 2,287 4,599 6,972 6,427 6,411 2,505 15,812 2,893 3,474 9,446 1979 ..................................... 2,375 4,843 7,312 6,767 6,631 2,637 16,068 2,894 3,541 9,633 1980 ..................................... 2,361 5,025 7,544 7,072 6,721 2,755 16,375 3,000 3,610 9,765 1981 ..................................... 2,382 5,163 7,782 7,357 6,840 2,865 16,180 2,922 3,640 9,619 1982 ..................................... 2,317 5,209 7,848 7,515 6,874 2,924 15,982 2,884 3,640 9,458 1983 ..................................... 2,253 5,334 8,039 7,766 7,078 3,021 16,011 2,915 3,662 9,434 1984 ..................................... 2,398 5,553 8,464 8,193 7,489 3,186 16,159 2,943 3,734 9,482 1985 ..................................... 2,437 5,815 8,871 8,657 7,869 3,366 16,533 3,014 3,832 9,687 1986 ..................................... 2,445 6,128 9,211 9,061 8,156 3,523 16,838 3,044 3,893 9,901 1987 ..................................... 2,507 6,385 9,608 9,515 8,446 3,699 17,156 3,089 3,967 10,100 1988 ..................................... 2,585 6,500 10,090 10,063 8,778 3,907 17,540 3,124 4,076 10,339 1989 ..................................... 2,622 6,562 10,555 10,616 9,062 4,116 17,927 3,136 4,182 10,609 1990 ..................................... 2,688 6,614 10,848 10,984 9,288 4,261 18,415 3,196 4,305 10,914 1991 ..................................... 2,677 6,558 10,714 11,506 9,256 4,249 18,545 3,110 4,355 11,081 1992 ..................................... 2,641 6,540 10,970 11,891 9,437 4,240 18,787 3,111 4,408 11,267 1993 ..................................... 2,668 6,709 11,495 12,303 9,732 4,350 18,989 3,063 4,488 11,438 1994 ..................................... 2,738 6,867 12,174 12,807 10,100 4,428 19,275 3,018 4,576 11,682 1995 ..................................... 2,843 6,827 12,844 13,289 10,501 4,572 19,432 2,949 4,635 11,849 1996 ..................................... 2,940 6,969 13,462 13,683 10,777 4,690 19,539 2,877 4,606 12,056 1997 ..................................... 3,084 7,178 14,335 14,087 11,018 4,825 19,664 2,806 4,582 12,276 1998 ..................................... 3,218 7,462 15,147 14,446 11,232 4,976 19,909 2,772 4,612 12,525 1999 .................................... 3,419 7,648 15,957 14,798 11,543 5,087 20,307 2,769 4,709 12,829 2000 .................................... 3,631 7,687 16,666 15,109 11,862 5,168 20,790 2,865 4,786 13,139 2001 .................................... 3,629 7,807 16,476 15,645 12,036 5,258 21,118 2,764 4,905 13,449 2002 .................................... 3,395 7,847 15,976 16,199 11,986 5,372 21,513 2,766 5,029 13,718 2003 .................................... 3,198 7,974 15,997 16,577 12,125 5,393 21,575 2,756 5,017 13,802 2004 p .................................. 3,169 8,048 16,452 16,921 12,322 5,405 21,600 2,713 5,032 13,855 2003: Jan ............................. 3,258 7,915 15,902 16,432 12,171 5,397 21,618 2,785 5,021 13,812
Feb ............................. 3,233 7,933 15,906 16,465 12,116 5,396 21,625 2,787 5,028 13,810 Mar ............................ 3,221 7,945 15,871 16,488 12,107 5,396 21,616 2,789 5,024 13,803 Apr ............................. 3,214 7,968 15,897 16,538 12,084 5,397 21,597 2,768 5,020 13,809 May ............................ 3,203 7,987 15,943 16,564 12,078 5,396 21,541 2,769 5,013 13,759 June ........................... 3,194 7,988 15,967 16,576 12,097 5,399 21,567 2,763 4,996 13,808 July ............................ 3,188 7,995 16,021 16,568 12,118 5,394 21,561 2,758 4,990 13,813 Aug ............................ 3,174 7,996 15,998 16,591 12,117 5,396 21,580 2,750 4,997 13,833 Sept ........................... 3,175 8,004 16,051 16,622 12,126 5,390 21,539 2,747 5,019 13,773 Oct ............................. 3,166 7,990 16,070 16,678 12,147 5,387 21,560 2,736 5,031 13,793 Nov ............................. 3,172 7,985 16,114 16,705 12,178 5,382 21,544 2,723 5,023 13,798 Dec ............................. 3,175 7,981 16,159 16,731 12,192 5,374 21,544 2,720 5,027 13,797
2004: Jan ............................. 3,163 7,981 16,172 16,746 12,218 5,379 21,527 2,715 5,007 13,805 Feb ............................. 3,169 7,989 16,196 16,764 12,229 5,376 21,539 2,716 5,018 13,805 Mar ............................ 3,169 8,003 16,237 16,813 12,271 5,391 21,553 2,710 5,023 13,820 Apr ............................. 3,173 8,015 16,363 16,854 12,303 5,404 21,572 2,727 5,019 13,826 May ............................ 3,177 8,029 16,432 16,871 12,331 5,407 21,544 2,712 5,004 13,828 June ........................... 3,182 8,049 16,457 16,897 12,339 5,418 21,528 2,716 5,004 13,808 July ............................ 3,173 8,044 16,490 16,901 12,344 5,414 21,572 2,710 5,019 13,843 Aug ............................ 3,166 8,053 16,518 16,965 12,341 5,414 21,629 2,712 5,035 13,882 Sept ........................... 3,159 8,078 16,548 16,980 12,353 5,410 21,652 2,713 5,047 13,892 Oct ............................. 3,163 8,092 16,643 17,049 12,362 5,410 21,675 2,706 5,058 13,911 Nov p .......................... 3,164 8,107 16,664 17,086 12,387 5,417 21,687 2,713 5,066 13,908 Dec p .......................... 3,161 8,121 16,705 17,133 12,399 5,421 21,716 2,706 5,076 13,934
Note (cont’d).—weather, etc., even if they are not paid for the time off; which are based on a sample of the working-age population; and which count persons only once—as employed, unemployed, or not in the labor force. In the data shown here, persons who work at more than one job are counted each time they appear on a payroll.
Establishment data for employment, hours, and earnings are classified based on the 2002 North American Industry Classification System (NAICS).
For further description and details see Employment and Earnings. Source: Department of Labor, Bureau of Labor Statistics.

266
TABLE B–47.—Hours and earnings in private nonagricultural industries, 1959–2004 1 [Monthly data seasonally adjusted]
Year or month
Average weekly hours Average hourly earnings Average weekly earnings, total private
Total private
Manufacturing
Total private
Manu- fac-
turing (current dollars)
Level Percent change
from year earlier
Total Over- time
Current dollars
1982 dollars 2
Current dollars
1982 dollars 2
Current dollars
1982 dollars 2
1959 .................................................. ............ 40.3 2.7 ............ ............. $2.08 .............. .............. ............ .............1960 .................................................. ............ 39.8 2.5 ............ ............. 2.15 .............. .............. ............ .............1961 .................................................. ............ 39.9 2.4 ............ ............. 2.20 .............. .............. ............ .............1962 .................................................. ............ 40.5 2.8 ............ ............. 2.27 .............. .............. ............ .............1963 .................................................. ............ 40.6 2.8 ............ ............. 2.34 .............. .............. ............ .............1964 .................................................. 38.5 40.8 3.1 $2.53 $7.86 2.41 $97.41 $302.52 ............ .............1965 .................................................. 38.6 41.2 3.6 2.63 8.04 2.49 101.52 310.46 4.2 2.6 1966 .................................................. 38.5 41.4 3.9 2.73 8.13 2.60 105.11 312.83 3.5 .8 1967 .................................................. 37.9 40.6 3.3 2.85 8.21 2.71 108.02 311.30 2.8 −.5 1968 .................................................. 37.7 40.7 3.5 3.02 8.37 2.89 113.85 315.37 5.4 1.3 1969 .................................................. 37.5 40.6 3.6 3.22 8.45 3.07 120.75 316.93 6.1 .5 1970 .................................................. 37.0 39.8 2.9 3.40 8.46 3.23 125.80 312.94 4.2 −1.3 1971 .................................................. 36.8 39.9 2.9 3.63 8.64 3.45 133.58 318.05 6.2 1.6 1972 .................................................. 36.9 40.6 3.4 3.90 8.99 3.70 143.91 331.59 7.7 4.3 1973 .................................................. 36.9 40.7 3.8 4.14 8.98 3.97 152.77 331.39 6.2 −.1 1974 .................................................. 36.4 40.0 3.2 4.43 8.65 4.31 161.25 314.94 5.6 −5.0 1975 .................................................. 36.0 39.5 2.6 4.73 8.48 4.71 170.28 305.16 5.6 −3.1 1976 .................................................. 36.1 40.1 3.1 5.06 8.58 5.09 182.67 309.61 7.3 1.5 1977 .................................................. 35.9 40.3 3.4 5.44 8.66 5.55 195.30 310.99 6.9 .4 1978 .................................................. 35.8 40.4 3.6 5.87 8.67 6.05 210.15 310.41 7.6 −.2 1979 .................................................. 35.6 40.2 3.3 6.33 8.40 6.57 225.35 298.87 7.2 −3.7 1980 .................................................. 35.2 39.7 2.8 6.84 7.99 7.15 240.77 281.27 6.8 −5.9 1981 .................................................. 35.2 39.8 2.8 7.43 7.88 7.86 261.54 277.35 8.6 −1.4 1982 .................................................. 34.7 38.9 2.3 7.86 7.86 8.36 272.74 272.74 4.3 −1.7 1983 .................................................. 34.9 40.1 2.9 8.19 7.95 8.70 285.83 277.50 4.8 1.7 1984 .................................................. 35.1 40.7 3.4 8.48 7.95 9.05 297.65 279.22 4.1 .6 1985 .................................................. 34.9 40.5 3.3 8.73 7.91 9.40 304.68 276.23 2.4 −1.1 1986 .................................................. 34.7 40.7 3.4 8.92 7.96 9.59 309.52 276.11 1.6 −.0 1987 .................................................. 34.7 40.9 3.7 9.13 7.86 9.77 316.81 272.88 2.4 −1.2 1988 .................................................. 34.6 41.0 3.8 9.43 7.81 10.05 326.28 270.32 3.0 −.9 1989 .................................................. 34.5 40.9 3.8 9.80 7.75 10.35 338.10 267.27 3.6 −1.1 1990 .................................................. 34.3 40.5 3.8 10.19 7.66 10.78 349.29 262.43 3.3 −1.8 1991 .................................................. 34.1 40.4 3.8 10.50 7.58 11.13 358.06 258.34 2.5 −1.6 1992 .................................................. 34.2 40.7 4.0 10.76 7.55 11.40 367.83 257.95 2.7 −.2 1993 .................................................. 34.3 41.1 4.4 11.03 7.52 11.70 378.40 258.12 2.9 .1 1994 .................................................. 34.5 41.7 5.0 11.32 7.53 12.04 390.73 259.97 3.3 .7 1995 .................................................. 34.3 41.3 4.7 11.64 7.53 12.34 399.53 258.43 2.3 −.6 1996 .................................................. 34.3 41.3 4.8 12.03 7.57 12.75 412.74 259.58 3.3 .4 1997 .................................................. 34.5 41.7 5.1 12.49 7.68 13.14 431.25 265.22 4.5 2.2 1998 .................................................. 34.5 41.4 4.8 13.00 7.89 13.45 448.04 271.87 3.9 2.5 1999 ................................................. 34.3 41.4 4.8 13.47 8.00 13.85 462.49 274.64 3.2 1.0 2000 ................................................. 34.3 41.3 4.7 14.00 8.03 14.32 480.41 275.62 3.9 .4 2001 ................................................. 34.0 40.3 4.0 14.53 8.11 14.76 493.20 275.38 2.7 −.1 2002 ................................................. 33.9 40.5 4.2 14.95 8.24 15.29 506.07 278.83 2.6 1.3 2003 ................................................. 33.7 40.4 4.2 15.35 8.27 15.74 517.36 278.75 2.2 −.0 2004 p ................................................ 33.7 40.8 4.6 15.68 8.24 16.15 528.97 277.82 2.2 −.3 2003: Jan ........................................... 33.8 40.3 4.3 15.18 8.25 15.58 513.08 279.00 3.1 .4
Feb ........................................... 33.7 40.4 4.3 15.27 8.25 15.62 514.60 278.16 3.1 −.0 Mar .......................................... 33.8 40.4 4.1 15.27 8.21 15.63 516.13 277.49 3.2 −.1 Apr ........................................... 33.6 40.1 4.0 15.25 8.23 15.64 512.40 276.67 2.1 −.3 May .......................................... 33.7 40.2 4.1 15.31 8.28 15.68 515.95 279.19 2.7 .7 June ......................................... 33.7 40.3 4.1 15.34 8.29 15.72 516.96 279.29 1.8 −.3 July .......................................... 33.6 40.1 4.1 15.40 8.31 15.73 517.44 279.24 2.3 .3 Aug .......................................... 33.6 40.2 4.1 15.41 8.28 15.79 517.78 278.08 1.8 −.4 Sept ......................................... 33.6 40.4 4.2 15.41 8.25 15.84 517.78 277.33 1.5 −.7 Oct ........................................... 33.7 40.5 4.3 15.43 8.28 15.83 519.99 278.96 1.9 .0 Nov .......................................... 33.8 40.8 4.5 15.46 8.32 15.89 522.55 281.09 2.2 .6 Dec .......................................... 33.6 40.6 4.5 15.45 8.30 15.93 519.12 278.80 1.2 −.5
2004: Jan ........................................... 33.8 41.0 4.5 15.49 8.27 15.94 523.56 279.68 2.0 .2 Feb ........................................... 33.8 41.0 4.6 15.52 8.27 15.99 524.58 279.48 1.9 .5 Mar .......................................... 33.8 40.9 4.6 15.55 8.24 16.01 525.59 278.53 1.8 .4 Apr ........................................... 33.7 40.7 4.5 15.59 8.25 16.08 525.38 277.98 2.5 .5 May .......................................... 33.8 41.1 4.6 15.63 8.21 16.08 528.29 277.61 2.4 −.6 June ......................................... 33.6 40.8 4.6 15.66 8.20 16.13 526.18 275.63 1.8 −1.3 July .......................................... 33.8 40.8 4.6 15.71 8.23 16.16 531.00 278.30 2.6 −.3 Aug .......................................... 33.7 40.9 4.6 15.76 8.26 16.23 531.11 278.21 2.6 .0 Sept ......................................... 33.8 40.8 4.6 15.78 8.25 16.29 533.36 278.95 3.0 .6 Oct .......................................... 33.8 40.6 4.5 15.82 8.22 16.29 534.72 277.78 2.8 −.4 Nov p ........................................ 33.7 40.5 4.5 15.84 8.22 16.30 533.81 276.87 2.2 −1.5 Dec p ........................................ 33.8 40.5 4.5 15.86 8.23 16.36 536.07 278.33 3.3 −.2
1 For production or nonsupervisory workers; total includes private industry groups shown in Table B-46. 2 Current dollars divided by the consumer price index for urban wage earners and clerical workers on a 1982=100 base. Note.—See Note, Table B-46. Source: Department of Labor, Bureau of Labor Statistics.
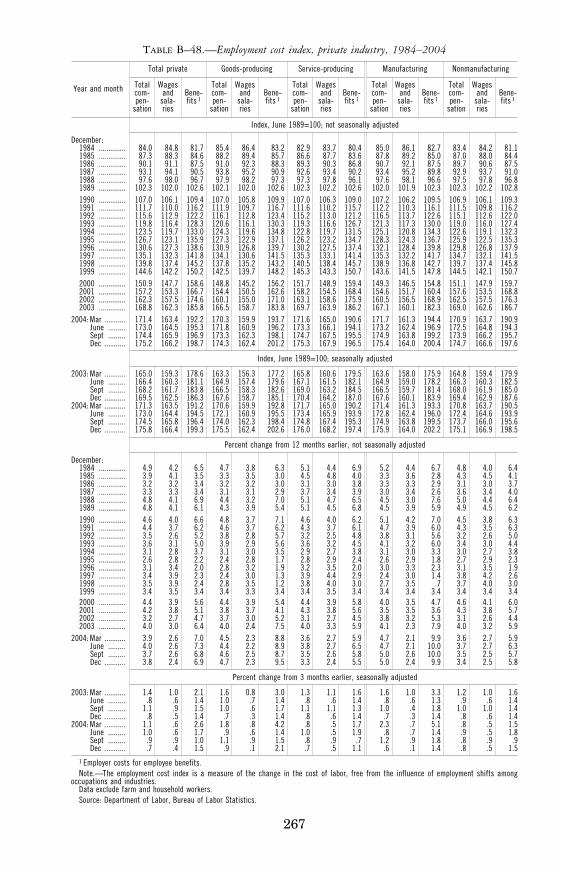
267
TABLE B–48.—Employment cost index, private industry, 1984–2004
Year and month
Total private Goods-producing Service-producing Manufacturing Nonmanufacturing
Total com- pen-
sation
Wages and
sala- ries
Bene- fits 1
Total com- pen-
sation
Wages and
sala- ries
Bene- fits 1
Total com- pen-
sation
Wages and
sala- ries
Bene- fits 1
Total com- pen-
sation
Wages and
sala- ries
Bene- fits 1
Total com- pen-
sation
Wages and
sala- ries
Bene- fits 1
Index, June 1989=100; not seasonally adjusted
December: 1984 .............. 84.0 84.8 81.7 85.4 86.4 83.2 82.9 83.7 80.4 85.0 86.1 82.7 83.4 84.2 81.1 1985 .............. 87.3 88.3 84.6 88.2 89.4 85.7 86.6 87.7 83.6 87.8 89.2 85.0 87.0 88.0 84.4 1986 .............. 90.1 91.1 87.5 91.0 92.3 88.3 89.3 90.3 86.8 90.7 92.1 87.5 89.7 90.6 87.5 1987 .............. 93.1 94.1 90.5 93.8 95.2 90.9 92.6 93.4 90.2 93.4 95.2 89.8 92.9 93.7 91.0 1988 .............. 97.6 98.0 96.7 97.9 98.2 97.3 97.3 97.8 96.1 97.6 98.1 96.6 97.5 97.8 96.8 1989 .............. 102.3 102.0 102.6 102.1 102.0 102.6 102.3 102.2 102.6 102.0 101.9 102.3 102.3 102.2 102.8 1990 .............. 107.0 106.1 109.4 107.0 105.8 109.9 107.0 106.3 109.0 107.2 106.2 109.5 106.9 106.1 109.3 1991 .............. 111.7 110.0 116.2 111.9 109.7 116.7 111.6 110.2 115.7 112.2 110.3 116.1 111.5 109.8 116.2 1992 .............. 115.6 112.9 122.2 116.1 112.8 123.4 115.2 113.0 121.2 116.5 113.7 122.6 115.1 112.6 122.0 1993 .............. 119.8 116.4 128.3 120.6 116.1 130.3 119.3 116.6 126.7 121.3 117.3 130.0 119.0 116.0 127.4 1994 .............. 123.5 119.7 133.0 124.3 119.6 134.8 122.8 119.7 131.5 125.1 120.8 134.3 122.6 119.1 132.3 1995 .............. 126.7 123.1 135.9 127.3 122.9 137.1 126.2 123.2 134.7 128.3 124.3 136.7 125.9 122.5 135.3 1996 .............. 130.6 127.3 138.6 130.9 126.8 139.7 130.2 127.5 137.4 132.1 128.4 139.8 129.8 126.8 137.9 1997 .............. 135.1 132.3 141.8 134.1 130.6 141.5 135.3 133.1 141.4 135.3 132.2 141.7 134.7 132.1 141.5 1998 .............. 139.8 137.4 145.2 137.8 135.2 143.2 140.5 138.4 145.7 138.9 136.8 142.7 139.7 137.4 145.8 1999 .............. 144.6 142.2 150.2 142.5 139.7 148.2 145.3 143.3 150.7 143.6 141.5 147.8 144.5 142.1 150.7 2000 .............. 150.9 147.7 158.6 148.8 145.2 156.2 151.7 148.9 159.4 149.3 146.5 154.8 151.1 147.9 159.7 2001 .............. 157.2 153.3 166.7 154.4 150.5 162.6 158.2 154.5 168.4 154.6 151.7 160.4 157.6 153.5 168.8 2002 .............. 162.3 157.5 174.6 160.1 155.0 171.0 163.1 158.6 175.9 160.5 156.5 168.9 162.5 157.5 176.3 2003 .............. 168.8 162.3 185.8 166.5 158.7 183.8 169.7 163.9 186.2 167.1 160.1 182.3 169.0 162.6 186.7
2004: Mar ........... 171.4 163.4 192.2 170.3 159.9 193.7 171.6 165.0 190.6 171.7 161.3 194.4 170.9 163.7 190.9 June ......... 173.0 164.5 195.3 171.8 160.9 196.2 173.3 166.1 194.1 173.2 162.4 196.9 172.5 164.8 194.3 Sept ......... 174.4 165.9 196.9 173.3 162.3 198.1 174.7 167.5 195.5 174.9 163.8 199.2 173.9 166.2 195.7 Dec ........... 175.2 166.2 198.7 174.3 162.4 201.2 175.3 167.9 196.5 175.4 164.0 200.4 174.7 166.6 197.6
Index, June 1989=100; seasonally adjusted
2003: Mar ........... 165.0 159.3 178.6 163.3 156.3 177.2 165.8 160.6 179.5 163.6 158.0 175.9 164.8 159.4 179.9 June ......... 166.4 160.3 181.1 164.9 157.4 179.6 167.1 161.5 182.1 164.9 159.0 178.2 166.3 160.3 182.5 Sept ......... 168.2 161.7 183.8 166.5 158.3 182.6 169.0 163.2 184.5 166.5 159.7 181.4 168.0 161.9 185.0 Dec ........... 169.5 162.5 186.3 167.6 158.7 185.1 170.4 164.2 187.0 167.6 160.1 183.9 169.4 162.9 187.6
2004: Mar ........... 171.3 163.5 191.2 170.6 159.9 192.8 171.7 165.0 190.2 171.4 161.3 193.3 170.8 163.7 190.5 June ......... 173.0 164.4 194.5 172.1 160.9 195.5 173.4 165.9 193.9 172.8 162.4 196.0 172.4 164.6 193.9 Sept ......... 174.5 165.8 196.4 174.0 162.3 198.4 174.8 167.4 195.3 174.9 163.8 199.5 173.7 166.0 195.6 Dec ........... 175.8 166.4 199.3 175.5 162.4 202.6 176.0 168.2 197.4 175.9 164.0 202.2 175.1 166.9 198.5
Percent change from 12 months earlier, not seasonally adjusted
December: 1984 .............. 4.9 4.2 6.5 4.7 3.8 6.3 5.1 4.4 6.9 5.2 4.4 6.7 4.8 4.0 6.4 1985 .............. 3.9 4.1 3.5 3.3 3.5 3.0 4.5 4.8 4.0 3.3 3.6 2.8 4.3 4.5 4.1 1986 .............. 3.2 3.2 3.4 3.2 3.2 3.0 3.1 3.0 3.8 3.3 3.3 2.9 3.1 3.0 3.7 1987 .............. 3.3 3.3 3.4 3.1 3.1 2.9 3.7 3.4 3.9 3.0 3.4 2.6 3.6 3.4 4.0 1988 .............. 4.8 4.1 6.9 4.4 3.2 7.0 5.1 4.7 6.5 4.5 3.0 7.6 5.0 4.4 6.4 1989 .............. 4.8 4.1 6.1 4.3 3.9 5.4 5.1 4.5 6.8 4.5 3.9 5.9 4.9 4.5 6.2 1990 .............. 4.6 4.0 6.6 4.8 3.7 7.1 4.6 4.0 6.2 5.1 4.2 7.0 4.5 3.8 6.3 1991 .............. 4.4 3.7 6.2 4.6 3.7 6.2 4.3 3.7 6.1 4.7 3.9 6.0 4.3 3.5 6.3 1992 .............. 3.5 2.6 5.2 3.8 2.8 5.7 3.2 2.5 4.8 3.8 3.1 5.6 3.2 2.6 5.0 1993 .............. 3.6 3.1 5.0 3.9 2.9 5.6 3.6 3.2 4.5 4.1 3.2 6.0 3.4 3.0 4.4 1994 .............. 3.1 2.8 3.7 3.1 3.0 3.5 2.9 2.7 3.8 3.1 3.0 3.3 3.0 2.7 3.8 1995 .............. 2.6 2.8 2.2 2.4 2.8 1.7 2.8 2.9 2.4 2.6 2.9 1.8 2.7 2.9 2.3 1996 .............. 3.1 3.4 2.0 2.8 3.2 1.9 3.2 3.5 2.0 3.0 3.3 2.3 3.1 3.5 1.9 1997 .............. 3.4 3.9 2.3 2.4 3.0 1.3 3.9 4.4 2.9 2.4 3.0 1.4 3.8 4.2 2.6 1998 .............. 3.5 3.9 2.4 2.8 3.5 1.2 3.8 4.0 3.0 2.7 3.5 .7 3.7 4.0 3.0 1999 .............. 3.4 3.5 3.4 3.4 3.3 3.4 3.4 3.5 3.4 3.4 3.4 3.4 3.4 3.4 3.4 2000 .............. 4.4 3.9 5.6 4.4 3.9 5.4 4.4 3.9 5.8 4.0 3.5 4.7 4.6 4.1 6.0 2001 .............. 4.2 3.8 5.1 3.8 3.7 4.1 4.3 3.8 5.6 3.5 3.5 3.6 4.3 3.8 5.7 2002 .............. 3.2 2.7 4.7 3.7 3.0 5.2 3.1 2.7 4.5 3.8 3.2 5.3 3.1 2.6 4.4 2003 .............. 4.0 3.0 6.4 4.0 2.4 7.5 4.0 3.3 5.9 4.1 2.3 7.9 4.0 3.2 5.9
2004: Mar ........... 3.9 2.6 7.0 4.5 2.3 8.8 3.6 2.7 5.9 4.7 2.1 9.9 3.6 2.7 5.9 June ......... 4.0 2.6 7.3 4.4 2.2 8.9 3.8 2.7 6.5 4.7 2.1 10.0 3.7 2.7 6.3 Sept ......... 3.7 2.6 6.8 4.6 2.5 8.7 3.5 2.6 5.8 5.0 2.6 10.0 3.5 2.5 5.7 Dec ........... 3.8 2.4 6.9 4.7 2.3 9.5 3.3 2.4 5.5 5.0 2.4 9.9 3.4 2.5 5.8
Percent change from 3 months earlier, seasonally adjusted
2003: Mar ........... 1.4 1.0 2.1 1.6 0.8 3.0 1.3 1.1 1.6 1.6 1.0 3.3 1.2 1.0 1.6 June ......... .8 .6 1.4 1.0 .7 1.4 .8 .6 1.4 .8 .6 1.3 .9 .6 1.4 Sept ......... 1.1 .9 1.5 1.0 .6 1.7 1.1 1.1 1.3 1.0 .4 1.8 1.0 1.0 1.4 Dec ........... .8 .5 1.4 .7 .3 1.4 .8 .6 1.4 .7 .3 1.4 .8 .6 1.4
2004: Mar ........... 1.1 .6 2.6 1.8 .8 4.2 .8 .5 1.7 2.3 .7 5.1 .8 .5 1.5 June ......... 1.0 .6 1.7 .9 .6 1.4 1.0 .5 1.9 .8 .7 1.4 .9 .5 1.8 Sept ......... .9 .9 1.0 1.1 .9 1.5 .8 .9 .7 1.2 .9 1.8 .8 .9 .9 Dec ........... .7 .4 1.5 .9 .1 2.1 .7 .5 1.1 .6 .1 1.4 .8 .5 1.5
1 Employer costs for employee benefits. Note.—The employment cost index is a measure of the change in the cost of labor, free from the influence of employment shifts among
occupations and industries. Data exclude farm and household workers. Source: Department of Labor, Bureau of Labor Statistics.
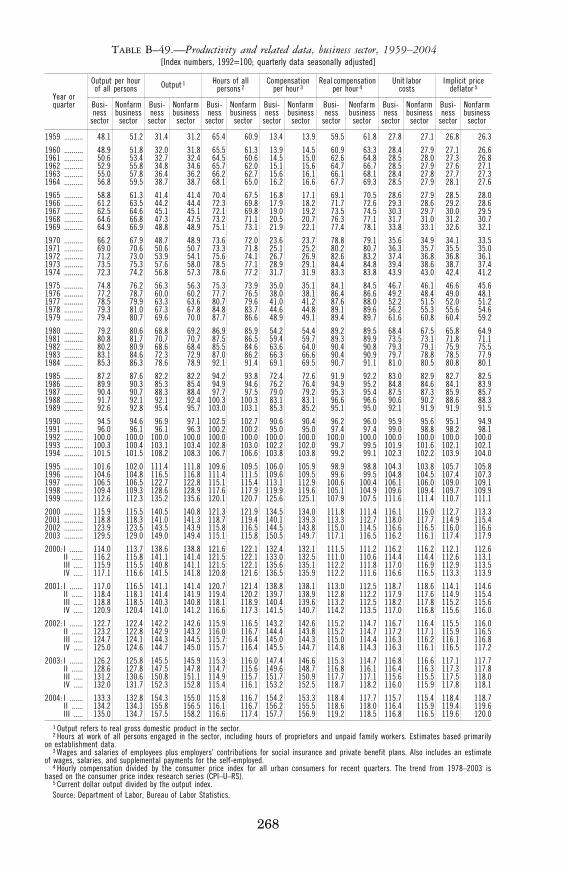
268
TABLE B–49.—Productivity and related data, business sector, 1959–2004 [Index numbers, 1992=100; quarterly data seasonally adjusted]
Year or quarter
Output per hour of all persons Output 1 Hours of all
persons 2 Compensation
per hour 3 Real compensation
per hour 4 Unit labor
costs Implicit price
deflator 5
Busi- ness
sector
Nonfarm business
sector
Busi- ness
sector
Nonfarm business
sector
Busi- ness
sector
Nonfarm business
sector
Busi- ness
sector
Nonfarm business
sector
Busi- ness
sector
Nonfarm business
sector
Busi- ness
sector
Nonfarm business
sector
Busi- ness
sector
Nonfarm business
sector
1959 .......... 48.1 51.2 31.4 31.2 65.4 60.9 13.4 13.9 59.5 61.8 27.8 27.1 26.8 26.3
1960 .......... 48.9 51.8 32.0 31.8 65.5 61.3 13.9 14.5 60.9 63.3 28.4 27.9 27.1 26.6 1961 .......... 50.6 53.4 32.7 32.4 64.5 60.6 14.5 15.0 62.6 64.8 28.5 28.0 27.3 26.8 1962 .......... 52.9 55.8 34.8 34.6 65.7 62.0 15.1 15.6 64.7 66.7 28.5 27.9 27.6 27.1 1963 .......... 55.0 57.8 36.4 36.2 66.2 62.7 15.6 16.1 66.1 68.1 28.4 27.8 27.7 27.3 1964 .......... 56.8 59.5 38.7 38.7 68.1 65.0 16.2 16.6 67.7 69.3 28.5 27.9 28.1 27.6
1965 .......... 58.8 61.3 41.4 41.4 70.4 67.5 16.8 17.1 69.1 70.5 28.6 27.9 28.5 28.0 1966 .......... 61.2 63.5 44.2 44.4 72.3 69.8 17.9 18.2 71.7 72.6 29.3 28.6 29.2 28.6 1967 .......... 62.5 64.6 45.1 45.1 72.1 69.8 19.0 19.2 73.5 74.5 30.3 29.7 30.0 29.5 1968 .......... 64.6 66.8 47.3 47.5 73.2 71.1 20.5 20.7 76.3 77.1 31.7 31.0 31.2 30.7 1969 .......... 64.9 66.9 48.8 48.9 75.1 73.1 21.9 22.1 77.4 78.1 33.8 33.1 32.6 32.1
1970 .......... 66.2 67.9 48.7 48.9 73.6 72.0 23.6 23.7 78.8 79.1 35.6 34.9 34.1 33.5 1971 .......... 69.0 70.6 50.6 50.7 73.3 71.8 25.1 25.2 80.2 80.7 36.3 35.7 35.5 35.0 1972 .......... 71.2 73.0 53.9 54.1 75.6 74.1 26.7 26.9 82.6 83.2 37.4 36.8 36.8 36.1 1973 .......... 73.5 75.3 57.6 58.0 78.5 77.1 28.9 29.1 84.4 84.8 39.4 38.6 38.7 37.4 1974 .......... 72.3 74.2 56.8 57.3 78.6 77.2 31.7 31.9 83.3 83.8 43.9 43.0 42.4 41.2
1975 .......... 74.8 76.2 56.3 56.3 75.3 73.9 35.0 35.1 84.1 84.5 46.7 46.1 46.6 45.6 1976 .......... 77.2 78.7 60.0 60.2 77.7 76.5 38.0 38.1 86.4 86.6 49.2 48.4 49.0 48.1 1977 .......... 78.5 79.9 63.3 63.6 80.7 79.6 41.0 41.2 87.6 88.0 52.2 51.5 52.0 51.2 1978 .......... 79.3 81.0 67.3 67.8 84.8 83.7 44.6 44.8 89.1 89.6 56.2 55.3 55.6 54.6 1979 .......... 79.4 80.7 69.6 70.0 87.7 86.6 48.9 49.1 89.4 89.7 61.6 60.8 60.4 59.2
1980 .......... 79.2 80.6 68.8 69.2 86.9 85.9 54.2 54.4 89.2 89.5 68.4 67.5 65.8 64.9 1981 .......... 80.8 81.7 70.7 70.7 87.5 86.5 59.4 59.7 89.3 89.9 73.5 73.1 71.8 71.1 1982 .......... 80.2 80.9 68.6 68.4 85.5 84.6 63.6 64.0 90.4 90.8 79.3 79.1 75.9 75.5 1983 .......... 83.1 84.6 72.3 72.9 87.0 86.2 66.3 66.6 90.4 90.9 79.7 78.8 78.5 77.9 1984 .......... 85.3 86.3 78.6 78.9 92.1 91.4 69.1 69.5 90.7 91.1 81.0 80.5 80.8 80.1
1985 .......... 87.2 87.6 82.2 82.2 94.2 93.8 72.4 72.6 91.9 92.2 83.0 82.9 82.7 82.5 1986 .......... 89.9 90.3 85.3 85.4 94.9 94.6 76.2 76.4 94.9 95.2 84.8 84.6 84.1 83.9 1987 .......... 90.4 90.7 88.3 88.4 97.7 97.5 79.0 79.2 95.3 95.4 87.5 87.3 85.9 85.7 1988 .......... 91.7 92.1 92.1 92.4 100.3 100.3 83.1 83.1 96.6 96.6 90.6 90.2 88.6 88.3 1989 .......... 92.6 92.8 95.4 95.7 103.0 103.1 85.3 85.2 95.1 95.0 92.1 91.9 91.9 91.5
1990 .......... 94.5 94.6 96.9 97.1 102.5 102.7 90.6 90.4 96.2 96.0 95.9 95.6 95.1 94.9 1991 .......... 96.0 96.1 96.1 96.3 100.2 100.2 95.0 95.0 97.4 97.4 99.0 98.8 98.2 98.1 1992 .......... 100.0 100.0 100.0 100.0 100.0 100.0 100.0 100.0 100.0 100.0 100.0 100.0 100.0 100.0 1993 .......... 100.3 100.4 103.1 103.4 102.8 103.0 102.2 102.0 99.7 99.5 101.9 101.6 102.1 102.1 1994 .......... 101.5 101.5 108.2 108.3 106.7 106.6 103.8 103.8 99.2 99.1 102.3 102.2 103.9 104.0
1995 .......... 101.6 102.0 111.4 111.8 109.6 109.5 106.0 105.9 98.9 98.8 104.3 103.8 105.7 105.8 1996 .......... 104.6 104.8 116.5 116.8 111.4 111.5 109.6 109.5 99.6 99.5 104.8 104.5 107.4 107.3 1997 .......... 106.5 106.5 122.7 122.8 115.1 115.4 113.1 112.9 100.6 100.4 106.1 106.0 109.0 109.1 1998 .......... 109.4 109.3 128.6 128.9 117.6 117.9 119.9 119.6 105.1 104.9 109.6 109.4 109.7 109.9 1999 .......... 112.6 112.3 135.2 135.6 120.1 120.7 125.6 125.1 107.9 107.5 111.6 111.4 110.7 111.1
2000 .......... 115.9 115.5 140.5 140.8 121.3 121.9 134.5 134.0 111.8 111.4 116.1 116.0 112.7 113.3 2001 .......... 118.8 118.3 141.0 141.3 118.7 119.4 140.1 139.3 113.3 112.7 118.0 117.7 114.9 115.4 2002 .......... 123.9 123.5 143.5 143.9 115.8 116.5 144.5 143.8 115.0 114.5 116.6 116.5 116.0 116.6 2003 .......... 129.5 129.0 149.0 149.4 115.1 115.8 150.5 149.7 117.1 116.5 116.2 116.1 117.4 117.9
2000: I ....... 114.0 113.7 138.6 138.8 121.6 122.1 132.4 132.1 111.5 111.2 116.2 116.2 112.1 112.6 II ...... 116.2 115.8 141.1 141.4 121.5 122.1 133.0 132.5 111.0 110.6 114.4 114.4 112.6 113.1 III ..... 115.9 115.5 140.8 141.1 121.5 122.1 135.6 135.1 112.2 111.8 117.0 116.9 112.9 113.5 IV ..... 117.1 116.6 141.5 141.8 120.8 121.6 136.5 135.9 112.2 111.6 116.6 116.5 113.3 113.9
2001: I ....... 117.0 116.5 141.1 141.4 120.7 121.4 138.8 138.1 113.0 112.5 118.7 118.6 114.1 114.6 II ...... 118.4 118.1 141.4 141.9 119.4 120.2 139.7 138.9 112.8 112.2 117.9 117.6 114.9 115.4 III ..... 118.8 118.5 140.3 140.8 118.1 118.9 140.4 139.6 113.2 112.5 118.2 117.8 115.2 115.6 IV ..... 120.9 120.4 141.0 141.2 116.6 117.3 141.5 140.7 114.2 113.5 117.0 116.8 115.6 116.0
2002: I ....... 122.7 122.4 142.2 142.6 115.9 116.5 143.2 142.6 115.2 114.7 116.7 116.4 115.5 116.0 II ...... 123.2 122.8 142.9 143.2 116.0 116.7 144.4 143.8 115.2 114.7 117.2 117.1 115.9 116.5 III ..... 124.7 124.1 144.3 144.5 115.7 116.4 145.0 144.3 115.0 114.4 116.3 116.2 116.1 116.8 IV ..... 125.0 124.6 144.7 145.0 115.7 116.4 145.5 144.7 114.8 114.3 116.3 116.1 116.5 117.2
2003: I ....... 126.2 125.8 145.5 145.9 115.3 116.0 147.4 146.6 115.3 114.7 116.8 116.6 117.1 117.7 II ...... 128.6 127.8 147.5 147.8 114.7 115.6 149.6 148.7 116.8 116.1 116.4 116.3 117.3 117.8 III ..... 131.2 130.6 150.8 151.1 114.9 115.7 151.7 150.9 117.7 117.1 115.6 115.5 117.5 118.0 IV ..... 132.0 131.7 152.3 152.8 115.4 116.1 153.2 152.5 118.7 118.2 116.0 115.9 117.8 118.1
2004: I ....... 133.3 132.8 154.3 155.0 115.8 116.7 154.2 153.3 118.4 117.7 115.7 115.4 118.4 118.7 II ...... 134.2 134.1 155.8 156.5 116.1 116.7 156.2 155.5 118.6 118.0 116.4 115.9 119.4 119.6 III ..... 135.0 134.7 157.5 158.2 116.6 117.4 157.7 156.9 119.2 118.5 116.8 116.5 119.6 120.0
1 Output refers to real gross domestic product in the sector. 2 Hours at work of all persons engaged in the sector, including hours of proprietors and unpaid family workers. Estimates based primarily
on establishment data. 3 Wages and salaries of employees plus employers’ contributions for social insurance and private benefit plans. Also includes an estimate
of wages, salaries, and supplemental payments for the self-employed. 4 Hourly compensation divided by the consumer price index for all urban consumers for recent quarters. The trend from 1978–2003 is
based on the consumer price index research series (CPI–U–RS). 5 Current dollar output divided by the output index. Source: Department of Labor, Bureau of Labor Statistics.
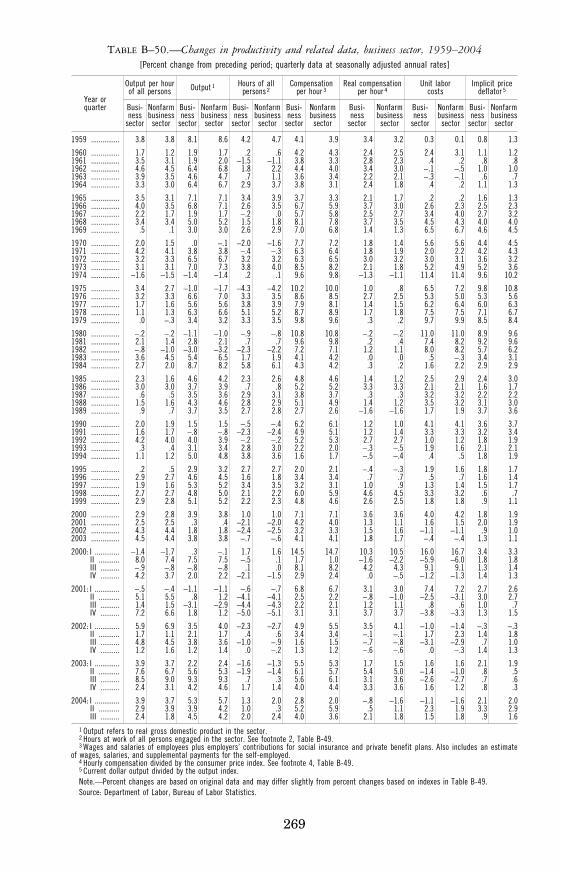
269
TABLE B–50.—Changes in productivity and related data, business sector, 1959–2004 [Percent change from preceding period; quarterly data at seasonally adjusted annual rates]
Year or quarter
Output per hour of all persons Output 1 Hours of all
persons 2 Compensation
per hour 3 Real compensation
per hour 4 Unit labor
costs Implicit price
deflator 5
Busi- ness
sector
Nonfarm business
sector
Busi- ness
sector
Nonfarm business
sector
Busi- ness
sector
Nonfarm business
sector
Busi- ness
sector
Nonfarm business
sector
Busi- ness
sector
Nonfarm business
sector
Busi- ness
sector
Nonfarm business
sector
Busi- ness
sector
Nonfarm business
sector
1959 ............... 3 .8 3.8 8 .1 8.6 4 .2 4.7 4 .1 3.9 3.4 3.2 0.3 0.1 0 .8 1.3
1960 ............... 1 .7 1.2 1 .9 1.7 .2 .6 4 .2 4.3 2.4 2.5 2.4 3.1 1 .1 1.2 1961 ............... 3 .5 3.1 1 .9 2.0 −1 .5 −1.1 3 .8 3.3 2.8 2.3 .4 .2 .8 .8 1962 ............... 4 .6 4.5 6 .4 6.8 1 .8 2.2 4 .4 4.0 3.4 3.0 −.1 −.5 1 .0 1.0 1963 ............... 3 .9 3.5 4 .6 4.7 .7 1.1 3 .6 3.4 2.2 2.1 −.3 −.1 .6 .7 1964 ............... 3 .3 3.0 6 .4 6.7 2 .9 3.7 3 .8 3.1 2.4 1.8 .4 .2 1 .1 1.3
1965 ............... 3 .5 3.1 7 .1 7.1 3 .4 3.9 3 .7 3.3 2.1 1.7 .2 .2 1 .6 1.3 1966 ............... 4 .0 3.5 6 .8 7.1 2 .6 3.5 6 .7 5.9 3.7 3.0 2.6 2.3 2 .5 2.3 1967 ............... 2 .2 1.7 1 .9 1.7 − .2 .0 5 .7 5.8 2.5 2.7 3.4 4.0 2 .7 3.2 1968 ............... 3 .4 3.4 5 .0 5.2 1 .5 1.8 8 .1 7.8 3.7 3.5 4.5 4.3 4 .0 4.0 1969 ............... .5 .1 3 .0 3.0 2 .6 2.9 7 .0 6.8 1.4 1.3 6.5 6.7 4 .6 4.5
1970 ............... 2 .0 1.5 .0 −.1 −2 .0 −1.6 7 .7 7.2 1.8 1.4 5.6 5.6 4 .4 4.5 1971 ............... 4 .2 4.1 3 .8 3.8 − .4 −.3 6 .3 6.4 1.8 1.9 2.0 2.2 4 .2 4.3 1972 ............... 3 .2 3.3 6 .5 6.7 3 .2 3.2 6 .3 6.5 3.0 3.2 3.0 3.1 3 .6 3.2 1973 ............... 3 .1 3.1 7 .0 7.3 3 .8 4.0 8 .5 8.2 2.1 1.8 5.2 4.9 5 .2 3.6 1974 ............... −1 .6 −1.5 −1 .4 −1.4 .2 .1 9 .6 9.8 −1.3 −1.1 11.4 11.4 9 .6 10.2
1975 ............... 3 .4 2.7 −1 .0 −1.7 −4 .3 −4.2 10 .2 10.0 1.0 .8 6.5 7.2 9 .8 10.8 1976 ............... 3 .2 3.3 6 .6 7.0 3 .3 3.5 8 .6 8.5 2.7 2.5 5.3 5.0 5 .3 5.6 1977 ............... 1 .7 1.6 5 .6 5.6 3 .8 3.9 7 .9 8.1 1.4 1.5 6.2 6.4 6 .0 6.3 1978 ............... 1 .1 1.3 6 .3 6.6 5 .1 5.2 8 .7 8.9 1.7 1.8 7.5 7.5 7 .1 6.7 1979 ............... .0 −.3 3 .4 3.2 3 .3 3.5 9 .8 9.6 .3 .2 9.7 9.9 8 .5 8.4
1980 ............... − .2 −.2 −1 .1 −1.0 − .9 −.8 10 .8 10.8 −.2 −.2 11.0 11.0 8 .9 9.6 1981 ............... 2 .1 1.4 2 .8 2.1 .7 .7 9 .6 9.8 .2 .4 7.4 8.2 9 .2 9.6 1982 ............... − .8 −1.0 −3 .0 −3.2 −2 .3 −2.2 7 .2 7.1 1.2 1.1 8.0 8.2 5 .7 6.2 1983 ............... 3 .6 4.5 5 .4 6.5 1 .7 1.9 4 .1 4.2 .0 .0 .5 −.3 3 .4 3.1 1984 ............... 2 .7 2.0 8 .7 8.2 5 .8 6.1 4 .3 4.2 .3 .2 1.6 2.2 2 .9 2.9
1985 ............... 2 .3 1.6 4 .6 4.2 2 .3 2.6 4 .8 4.6 1.4 1.2 2.5 2.9 2 .4 3.0 1986 ............... 3 .0 3.0 3 .7 3.9 .7 .8 5 .2 5.2 3.3 3.3 2.1 2.1 1 .6 1.7 1987 ............... .6 .5 3 .5 3.6 2 .9 3.1 3 .8 3.7 .3 .3 3.2 3.2 2 .2 2.2 1988 ............... 1 .5 1.6 4 .3 4.6 2 .8 2.9 5 .1 4.9 1.4 1.2 3.5 3.2 3 .1 3.0 1989 ............... .9 .7 3 .7 3.5 2 .7 2.8 2 .7 2.6 −1.6 −1.6 1.7 1.9 3 .7 3.6
1990 ............... 2 .0 1.9 1 .5 1.5 − .5 −.4 6 .2 6.1 1.2 1.0 4.1 4.1 3 .6 3.7 1991 ............... 1 .6 1.7 − .8 −.8 −2 .3 −2.4 4 .9 5.1 1.2 1.4 3.3 3.3 3 .2 3.4 1992 ............... 4 .2 4.0 4 .0 3.9 − .2 −.2 5 .2 5.3 2.7 2.7 1.0 1.2 1 .8 1.9 1993 ............... .3 .4 3 .1 3.4 2 .8 3.0 2 .2 2.0 −.3 −.5 1.9 1.6 2 .1 2.1 1994 ............... 1 .1 1.2 5 .0 4.8 3 .8 3.6 1 .6 1.7 −.5 −.4 .4 .5 1 .8 1.9
1995 ............... .2 .5 2 .9 3.2 2 .7 2.7 2 .0 2.1 −.4 −.3 1.9 1.6 1 .8 1.7 1996 ............... 2 .9 2.7 4 .6 4.5 1 .6 1.8 3 .4 3.4 .7 .7 .5 .7 1 .6 1.4 1997 ............... 1 .9 1.6 5 .3 5.2 3 .4 3.5 3 .2 3.1 1.0 .9 1.3 1.4 1 .5 1.7 1998 ............... 2 .7 2.7 4 .8 5.0 2 .1 2.2 6 .0 5.9 4.6 4.5 3.3 3.2 .6 .7 1999 ............... 2 .9 2.8 5 .1 5.2 2 .2 2.3 4 .8 4.6 2.6 2.5 1.8 1.8 .9 1.1
2000 ............... 2 .9 2.8 3 .9 3.8 1 .0 1.0 7 .1 7.1 3.6 3.6 4.0 4.2 1 .8 1.9 2001 ............... 2 .5 2.5 .3 .4 −2 .1 −2.0 4 .2 4.0 1.3 1.1 1.6 1.5 2 .0 1.9 2002 ............... 4 .3 4.4 1 .8 1.8 −2 .4 −2.5 3 .2 3.3 1.5 1.6 −1.1 −1.1 .9 1.0 2003 ............... 4 .5 4.4 3 .8 3.8 − .7 −.6 4 .1 4.1 1.8 1.7 −.4 −.4 1 .3 1.1
2000: I ............. −1 .4 −1.7 .3 −.1 1 .7 1.6 14 .5 14.7 10.3 10.5 16.0 16.7 3 .4 3.3 II ........... 8 .0 7.4 7 .5 7.5 − .5 .1 1 .7 1.0 −1.6 −2.2 −5.9 −6.0 1 .8 1.8 III .......... − .9 −.8 − .8 −.8 .1 .0 8 .1 8.2 4.2 4.3 9.1 9.1 1 .3 1.4 IV .......... 4 .2 3.7 2 .0 2.2 −2 .1 −1.5 2 .9 2.4 .0 −.5 −1.2 −1.3 1 .4 1.3
2001: I ............. − .5 −.4 −1 .1 −1.1 − .6 −.7 6 .8 6.7 3.1 3.0 7.4 7.2 2 .7 2.6 II ........... 5 .1 5.5 .8 1.2 −4 .1 −4.1 2 .5 2.2 −.8 −1.0 −2.5 −3.1 3 .0 2.7 III .......... 1 .4 1.5 −3 .1 −2.9 −4 .4 −4.3 2 .2 2.1 1.2 1.1 .8 .6 1 .0 .7 IV .......... 7 .2 6.6 1 .8 1.2 −5 .0 −5.1 3 .1 3.1 3.7 3.7 −3.8 −3.3 1 .3 1.5
2002: I ............. 5 .9 6.9 3 .5 4.0 −2 .3 −2.7 4 .9 5.5 3.5 4.1 −1.0 −1.4 − .3 −.3 II ........... 1 .7 1.1 2 .1 1.7 .4 .6 3 .4 3.4 −.1 −.1 1.7 2.3 1 .4 1.8 III .......... 4 .8 4.5 3 .8 3.6 −1 .0 −.9 1 .6 1.5 −.7 −.8 −3.1 −2.9 .7 1.0 IV .......... 1 .2 1.6 1 .2 1.4 .0 −.2 1 .3 1.2 −.6 −.6 .0 −.3 1 .4 1.3
2003: I ............. 3 .9 3.7 2 .2 2.4 −1 .6 −1.3 5 .5 5.3 1.7 1.5 1.6 1.6 2 .1 1.9 II ........... 7 .6 6.7 5 .6 5.3 −1 .9 −1.4 6 .1 5.7 5.4 5.0 −1.4 −1.0 .8 .5 III .......... 8 .5 9.0 9 .3 9.3 .7 .3 5 .6 6.1 3.1 3.6 −2.6 −2.7 .7 .6 IV .......... 2 .4 3.1 4 .2 4.6 1 .7 1.4 4 .0 4.4 3.3 3.6 1.6 1.2 .8 .3
2004: I ............. 3 .9 3.7 5 .3 5.7 1 .3 2.0 2 .8 2.0 −.8 −1.6 −1.1 −1.6 2 .1 2.0 II ........... 2 .9 3.9 3 .9 4.2 1 .0 .3 5 .2 5.9 .5 1.1 2.3 1.9 3 .3 2.9 III .......... 2 .4 1.8 4 .5 4.2 2 .0 2.4 4 .0 3.6 2.1 1.8 1.5 1.8 .9 1.6
1 Output refers to real gross domestic product in the sector. 2 Hours at work of all persons engaged in the sector. See footnote 2, Table B-49. 3 Wages and salaries of employees plus employers’ contributions for social insurance and private benefit plans. Also includes an estimate
of wages, salaries, and supplemental payments for the self-employed. 4 Hourly compensation divided by the consumer price index. See footnote 4, Table B-49. 5 Current dollar output divided by the output index. Note.—Percent changes are based on original data and may differ slightly from percent changes based on indexes in Table B-49. Source: Department of Labor, Bureau of Labor Statistics.
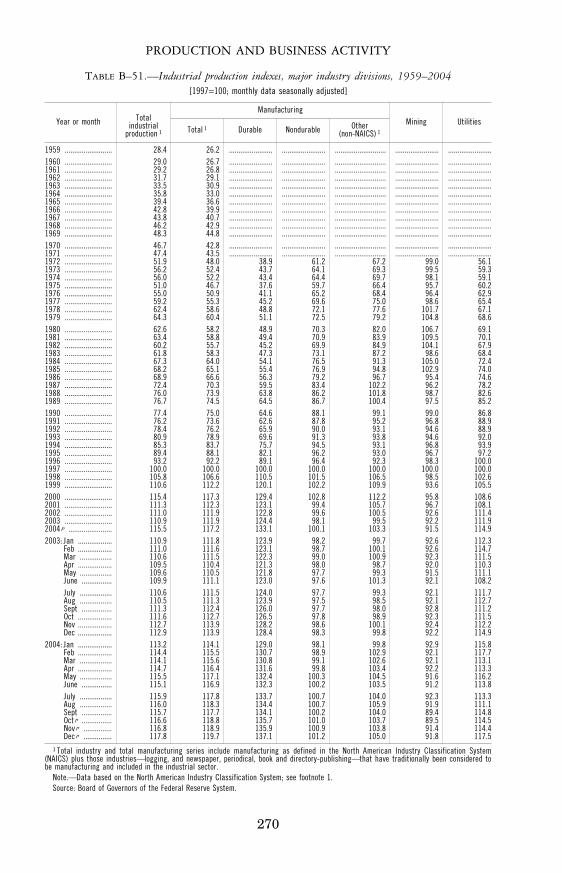
270
PRODUCTION AND BUSINESS ACTIVITY
TABLE B–51.—Industrial production indexes, major industry divisions, 1959–2004 [1997=100; monthly data seasonally adjusted]
Year or month Total industrial
production 1
Manufacturing Mining Utilities
Total 1 Durable Nondurable Other (non-NAICS) 1
1959 ......................... 28.4 26.2 ....................... ....................... ........................... ....................... .......................1960 ......................... 29.0 26.7 ....................... ....................... ........................... ....................... .......................1961 ......................... 29.2 26.8 ....................... ....................... ........................... ....................... .......................1962 ......................... 31.7 29.1 ....................... ....................... ........................... ....................... .......................1963 ......................... 33.5 30.9 ....................... ....................... ........................... ....................... .......................1964 ......................... 35.8 33.0 ....................... ....................... ........................... ....................... .......................1965 ......................... 39.4 36.6 ....................... ....................... ........................... ....................... .......................1966 ......................... 42.8 39.9 ....................... ....................... ........................... ....................... .......................1967 ......................... 43.8 40.7 ....................... ....................... ........................... ....................... .......................1968 ......................... 46.2 42.9 ....................... ....................... ........................... ....................... .......................1969 ......................... 48.3 44.8 ....................... ....................... ........................... ....................... .......................1970 ......................... 46.7 42.8 ....................... ....................... ........................... ....................... .......................1971 ......................... 47.4 43.5 ....................... ....................... ........................... ....................... .......................1972 ......................... 51.9 48.0 38.9 61.2 67.2 99.0 56.1 1973 ......................... 56.2 52.4 43.7 64.1 69.3 99.5 59.3 1974 ......................... 56.0 52.2 43.4 64.4 69.7 98.1 59.1 1975 ......................... 51.0 46.7 37.6 59.7 66.4 95.7 60.2 1976 ......................... 55.0 50.9 41.1 65.2 68.4 96.4 62.9 1977 ......................... 59.2 55.3 45.2 69.6 75.0 98.6 65.4 1978 ......................... 62.4 58.6 48.8 72.1 77.6 101.7 67.1 1979 ......................... 64.3 60.4 51.1 72.5 79.2 104.8 68.6 1980 ......................... 62.6 58.2 48.9 70.3 82.0 106.7 69.1 1981 ......................... 63.4 58.8 49.4 70.9 83.9 109.5 70.1 1982 ......................... 60.2 55.7 45.2 69.9 84.9 104.1 67.9 1983 ......................... 61.8 58.3 47.3 73.1 87.2 98.6 68.4 1984 ......................... 67.3 64.0 54.1 76.5 91.3 105.0 72.4 1985 ......................... 68.2 65.1 55.4 76.9 94.8 102.9 74.0 1986 ......................... 68.9 66.6 56.3 79.2 96.7 95.4 74.6 1987 ......................... 72.4 70.3 59.5 83.4 102.2 96.2 78.2 1988 ......................... 76.0 73.9 63.8 86.2 101.8 98.7 82.6 1989 ......................... 76.7 74.5 64.5 86.7 100.4 97.5 85.2 1990 ......................... 77.4 75.0 64.6 88.1 99.1 99.0 86.8 1991 ......................... 76.2 73.6 62.6 87.8 95.2 96.8 88.9 1992 ......................... 78.4 76.2 65.9 90.0 93.1 94.6 88.9 1993 ......................... 80.9 78.9 69.6 91.3 93.8 94.6 92.0 1994 ......................... 85.3 83.7 75.7 94.5 93.1 96.8 93.9 1995 ......................... 89.4 88.1 82.1 96.2 93.0 96.7 97.2 1996 ......................... 93.2 92.2 89.1 96.4 92.3 98.3 100.0 1997 ......................... 100.0 100.0 100.0 100.0 100.0 100.0 100.0 1998 ......................... 105.8 106.6 110.5 101.5 106.5 98.5 102.6 1999 ......................... 110.6 112.2 120.1 102.2 109.9 93.6 105.5 2000 ......................... 115.4 117.3 129.4 102.8 112.2 95.8 108.6 2001 ......................... 111.3 112.3 123.1 99.4 105.7 96.7 108.1 2002 ......................... 111.0 111.9 122.8 99.6 100.5 92.6 111.4 2003 ......................... 110.9 111.9 124.4 98.1 99.5 92.2 111.9 2004 p ....................... 115.5 117.2 133.1 100.1 103.3 91.5 114.9 2003: Jan .................. 110.9 111.8 123.9 98.2 99.7 92.6 112.3
Feb .................. 111.0 111.6 123.1 98.7 100.1 92.6 114.7 Mar ................. 110.6 111.5 122.3 99.0 100.9 92.3 111.5 Apr .................. 109.5 110.4 121.3 98.0 98.7 92.0 110.3 May ................. 109.6 110.5 121.8 97.7 99.3 91.5 111.1 June ................ 109.9 111.1 123.0 97.6 101.3 92.1 108.2 July ................. 110.6 111.5 124.0 97.7 99.3 92.1 111.7 Aug ................. 110.5 111.3 123.9 97.5 98.5 92.1 112.7 Sept ................ 111.3 112.4 126.0 97.7 98.0 92.8 111.2 Oct .................. 111.6 112.7 126.5 97.8 98.9 92.3 111.5 Nov .................. 112.7 113.9 128.2 98.6 100.1 92.4 112.2 Dec .................. 112.9 113.9 128.4 98.3 99.8 92.2 114.9
2004: Jan .................. 113.2 114.1 129.0 98.1 99.8 92.9 115.8 Feb .................. 114.4 115.5 130.7 98.9 102.9 92.1 117.7 Mar ................. 114.1 115.6 130.8 99.1 102.6 92.1 113.1 Apr .................. 114.7 116.4 131.6 99.8 103.4 92.2 113.3 May ................. 115.5 117.1 132.4 100.3 104.5 91.6 116.2 June ................ 115.1 116.9 132.3 100.2 103.5 91.2 113.8 July ................. 115.9 117.8 133.7 100.7 104.0 92.3 113.3 Aug ................. 116.0 118.3 134.4 100.7 105.9 91.9 111.1 Sept ................ 115.7 117.7 134.1 100.2 104.0 89.4 114.8 Oct p ................ 116.6 118.8 135.7 101.0 103.7 89.5 114.5 Nov p ............... 116.8 118.9 135.9 100.9 103.8 91.4 114.4 Dec p ............... 117.8 119.7 137.1 101.2 105.0 91.8 117.5
1 Total industry and total manufacturing series include manufacturing as defined in the North American Industry Classification System (NAICS) plus those industries—logging, and newspaper, periodical, book and directory-publishing—that have traditionally been considered to be manufacturing and included in the industrial sector.
Note.—Data based on the North American Industry Classification System; see footnote 1. Source: Board of Governors of the Federal Reserve System.
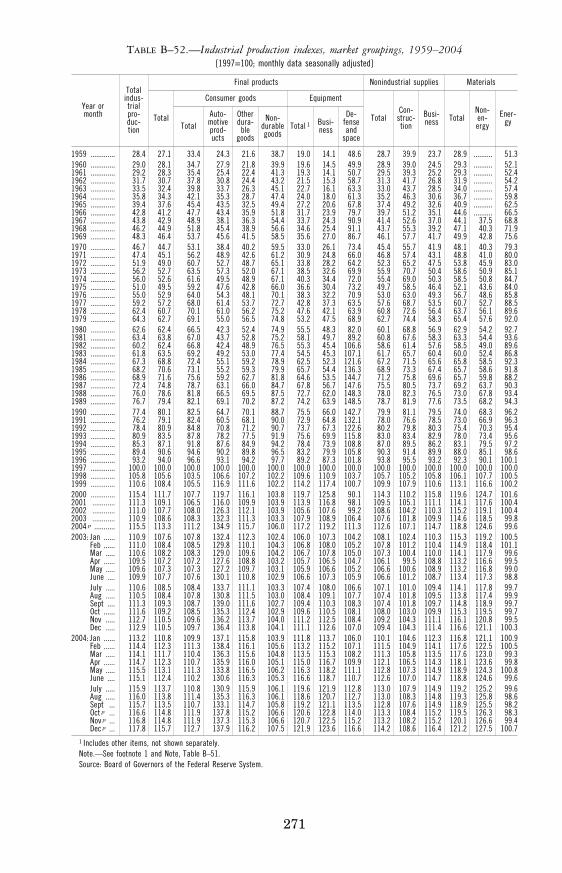
271
TABLE B–52.—Industrial production indexes, market groupings, 1959–2004 [1997=100; monthly data seasonally adjusted]
Year or month
Total indus- trial pro- duc- tion
Final products Nonindustrial supplies Materials
Total
Consumer goods Equipment
Total Con-
struc- tion
Busi- ness Total
Non- en-ergy
Ener- gy Total
Auto- motive prod- ucts
Other dura-
ble goods
Non- durable goods
Total 1 Busi- ness
De- fense and
space
1959 ............. 28.4 27.1 33.4 24.3 21.6 38.7 19.0 14.1 48.6 28.7 39.9 23.7 28.9 .......... 51.3 1960 ............. 29.0 28.1 34.7 27.9 21.8 39.9 19.6 14.5 49.9 28.9 39.0 24.5 29.3 .......... 52.1 1961 ............. 29.2 28.3 35.4 25.4 22.4 41.3 19.3 14.1 50.7 29.5 39.3 25.2 29.3 .......... 52.4 1962 ............. 31.7 30.7 37.8 30.8 24.4 43.2 21.5 15.3 58.7 31.3 41.7 26.8 31.9 .......... 54.2 1963 ............. 33.5 32.4 39.8 33.7 26.3 45.1 22.7 16.1 63.3 33.0 43.7 28.5 34.0 .......... 57.4 1964 ............. 35.8 34.3 42.1 35.3 28.7 47.4 24.0 18.0 61.3 35.2 46.3 30.6 36.7 .......... 59.8 1965 ............. 39.4 37.6 45.4 43.5 32.5 49.4 27.2 20.6 67.8 37.4 49.2 32.6 40.9 .......... 62.5 1966 ............. 42.8 41.2 47.7 43.4 35.9 51.8 31.7 23.9 79.7 39.7 51.2 35.1 44.6 .......... 66.5 1967 ............. 43.8 42.9 48.9 38.1 36.3 54.4 33.7 24.3 90.9 41.4 52.6 37.0 44.1 37.5 68.8 1968 ............. 46.2 44.9 51.8 45.4 38.9 56.6 34.6 25.4 91.1 43.7 55.3 39.2 47.1 40.3 71.9 1969 ............. 48.3 46.4 53.7 45.6 41.5 58.5 35.6 27.0 86.7 46.1 57.7 41.7 49.9 42.8 75.6 1970 ............. 46.7 44.7 53.1 38.4 40.2 59.5 33.0 26.1 73.4 45.4 55.7 41.9 48.1 40.3 79.3 1971 ............. 47.4 45.1 56.2 48.9 42.6 61.2 30.9 24.8 66.0 46.8 57.4 43.1 48.8 41.0 80.0 1972 ............. 51.9 49.0 60.7 52.7 48.7 65.1 33.8 28.2 64.2 52.3 65.2 47.5 53.8 45.9 83.0 1973 ............. 56.2 52.7 63.5 57.3 52.0 67.1 38.5 32.6 69.9 55.9 70.7 50.4 58.6 50.9 85.1 1974 ............. 56.0 52.6 61.6 49.5 48.9 67.1 40.3 34.4 72.0 55.4 69.0 50.3 58.5 50.8 84.7 1975 ............. 51.0 49.5 59.2 47.6 42.8 66.0 36.6 30.4 73.2 49.7 58.5 46.4 52.1 43.6 84.0 1976 ............. 55.0 52.9 64.0 54.3 48.1 70.1 38.3 32.2 70.9 53.0 63.0 49.3 56.7 48.6 85.8 1977 ............. 59.2 57.2 68.0 61.4 53.7 72.7 42.8 37.3 63.5 57.6 68.7 53.5 60.7 52.7 88.5 1978 ............. 62.4 60.7 70.1 61.0 56.2 75.2 47.6 42.1 63.9 60.8 72.6 56.4 63.7 56.1 89.6 1979 ............. 64.3 62.7 69.1 55.0 56.5 74.8 53.2 47.5 68.9 62.7 74.4 58.3 65.4 57.6 92.0 1980 ............. 62.6 62.4 66.5 42.3 52.4 74.9 55.5 48.3 82.0 60.1 68.8 56.9 62.9 54.2 92.7 1981 ............. 63.4 63.8 67.0 43.7 52.8 75.2 58.1 49.7 89.2 60.8 67.6 58.3 63.3 54.4 93.6 1982 ............. 60.2 62.4 66.8 42.4 48.9 76.5 55.3 45.4 106.6 58.6 61.4 57.6 58.5 49.0 89.6 1983 ............. 61.8 63.5 69.2 49.2 53.0 77.4 54.5 45.3 107.1 61.7 65.7 60.4 60.0 52.4 86.8 1984 ............. 67.3 68.8 72.4 55.1 59.2 78.9 62.5 52.3 121.6 67.2 71.5 65.6 65.8 58.5 92.3 1985 ............. 68.2 70.6 73.1 55.2 59.3 79.9 65.7 54.4 136.3 68.9 73.3 67.4 65.7 58.6 91.8 1986 ............. 68.9 71.6 75.6 59.2 62.7 81.8 64.6 53.5 144.7 71.2 75.8 69.6 65.7 59.8 88.2 1987 ............. 72.4 74.8 78.7 63.1 66.0 84.7 67.8 56.7 147.6 75.5 80.5 73.7 69.2 63.7 90.3 1988 ............. 76.0 78.6 81.8 66.5 69.5 87.5 72.7 62.0 148.3 78.0 82.3 76.5 73.0 67.8 93.4 1989 ............. 76.7 79.4 82.1 69.1 70.2 87.2 74.2 63.9 148.5 78.7 81.9 77.6 73.5 68.2 94.3 1990 ............. 77.4 80.1 82.5 64.7 70.1 88.7 75.5 66.0 142.7 79.9 81.1 79.5 74.0 68.3 96.2 1991 ............. 76.2 79.1 82.4 60.5 68.1 90.0 72.9 64.8 132.1 78.0 76.6 78.5 73.0 66.9 96.3 1992 ............. 78.4 80.9 84.8 70.8 71.2 90.7 73.7 67.3 122.6 80.2 79.8 80.3 75.4 70.3 95.4 1993 ............. 80.9 83.5 87.8 78.2 77.5 91.9 75.6 69.9 115.8 83.0 83.4 82.9 78.0 73.4 95.6 1994 ............. 85.3 87.1 91.8 87.6 84.9 94.2 78.4 73.9 108.8 87.0 89.5 86.2 83.1 79.5 97.2 1995 ............. 89.4 90.6 94.6 90.2 89.8 96.5 83.2 79.9 105.8 90.3 91.4 89.9 88.0 85.1 98.6 1996 ............. 93.2 94.0 96.6 93.1 94.2 97.7 89.2 87.3 101.8 93.8 95.5 93.2 92.3 90.1 100.1 1997 ............. 100.0 100.0 100.0 100.0 100.0 100.0 100.0 100.0 100.0 100.0 100.0 100.0 100.0 100.0 100.0 1998 ............. 105.8 105.6 103.5 106.6 107.2 102.2 109.6 110.9 103.7 105.7 105.2 105.8 106.1 107.7 100.5 1999 ............. 110.6 108.4 105.5 116.9 111.6 102.2 114.2 117.4 100.7 109.9 107.9 110.6 113.1 116.6 100.2 2000 ............. 115.4 111.7 107.7 119.7 116.1 103.8 119.7 125.8 90.1 114.3 110.2 115.8 119.6 124.7 101.6 2001 ............ 111.3 109.1 106.5 116.0 109.9 103.9 113.9 116.8 98.1 109.5 105.1 111.1 114.1 117.6 100.4 2002 ............ 111.0 107.7 108.0 126.3 112.1 103.9 105.6 107.6 99.2 108.6 104.2 110.3 115.2 119.1 100.4 2003 ............ 110.9 108.6 108.3 132.3 111.3 103.3 107.9 108.9 106.4 107.6 101.8 109.9 114.6 118.5 99.8 2004 p ........... 115.5 113.3 111.2 134.9 115.7 106.0 117.2 119.2 111.3 112.6 107.1 114.7 118.8 124.6 99.6 2003: Jan ...... 110.9 107.6 107.8 132.4 112.3 102.4 106.0 107.3 104.2 108.1 102.4 110.3 115.3 119.2 100.5
Feb ...... 111.0 108.4 108.5 129.8 110.1 104.3 106.8 108.0 105.2 107.8 101.2 110.4 114.9 118.4 101.1 Mar ..... 110.6 108.2 108.3 129.0 109.6 104.2 106.7 107.8 105.0 107.3 100.4 110.0 114.1 117.9 99.6 Apr ...... 109.5 107.2 107.2 127.6 108.8 103.2 105.7 106.5 104.7 106.1 99.5 108.8 113.2 116.6 99.5 May ..... 109.6 107.3 107.3 127.2 109.7 103.1 105.9 106.6 105.2 106.6 100.6 108.9 113.2 116.8 99.0 June .... 109.9 107.7 107.6 130.1 110.8 102.9 106.6 107.3 105.9 106.6 101.2 108.7 113.4 117.3 98.8 July ..... 110.6 108.5 108.4 133.7 111.1 103.3 107.4 108.0 106.6 107.1 101.0 109.4 114.1 117.8 99.7 Aug ..... 110.5 108.4 107.8 130.8 111.5 103.0 108.4 109.1 107.7 107.4 101.8 109.5 113.8 117.4 99.9 Sept .... 111.3 109.3 108.7 139.0 111.6 102.7 109.4 110.3 108.3 107.4 101.8 109.7 114.8 118.9 99.7 Oct ...... 111.6 109.2 108.5 135.3 112.4 102.9 109.6 110.5 108.1 108.0 103.0 109.9 115.3 119.5 99.7 Nov ..... 112.7 110.5 109.6 136.2 113.7 104.0 111.2 112.5 108.4 109.2 104.3 111.1 116.1 120.8 99.5 Dec ..... 112.9 110.5 109.7 136.4 113.8 104.1 111.1 112.6 107.0 109.4 104.3 111.4 116.6 121.1 100.3
2004: Jan ...... 113.2 110.8 109.9 137.1 115.8 103.9 111.8 113.7 106.0 110.1 104.6 112.3 116.8 121.1 100.9 Feb ...... 114.4 112.3 111.3 138.4 116.1 105.6 113.2 115.2 107.1 111.5 104.9 114.1 117.6 122.5 100.5 Mar ..... 114.1 111.7 110.4 136.3 115.6 104.8 113.5 115.3 108.2 111.3 105.8 113.5 117.6 123.0 99.3 Apr ...... 114.7 112.3 110.7 135.9 116.0 105.1 115.0 116.7 109.9 112.1 106.5 114.3 118.1 123.6 99.8 May ..... 115.5 113.1 111.3 133.8 116.5 106.2 116.3 118.2 111.1 112.8 107.3 114.9 118.9 124.3 100.8 June .... 115.1 112.4 110.2 130.6 116.3 105.3 116.6 118.7 110.7 112.6 107.0 114.7 118.8 124.6 99.6 July ..... 115.9 113.7 110.8 130.9 115.9 106.1 119.6 121.9 112.8 113.0 107.9 114.9 119.2 125.2 99.6 Aug ..... 116.0 113.8 111.4 135.3 116.3 106.1 118.6 120.7 112.7 113.0 108.3 114.8 119.3 125.8 98.6 Sept ... 115.7 113.5 110.7 133.1 114.7 105.8 119.2 121.1 113.5 112.8 107.6 114.9 118.9 125.5 98.2 Oct p ... 116.6 114.8 111.9 137.8 115.2 106.6 120.6 122.8 114.0 113.3 108.4 115.2 119.5 126.3 98.3 Nov p ... 116.8 114.8 111.9 137.3 115.3 106.6 120.7 122.5 115.2 113.2 108.2 115.2 120.1 126.6 99.4 Dec p ... 117.8 115.7 112.7 137.9 116.2 107.5 121.9 123.6 116.6 114.2 108.6 116.4 121.2 127.5 100.7
1 Includes other items, not shown separately. Note.—See footnote 1 and Note, Table B–51. Source: Board of Governors of the Federal Reserve System.
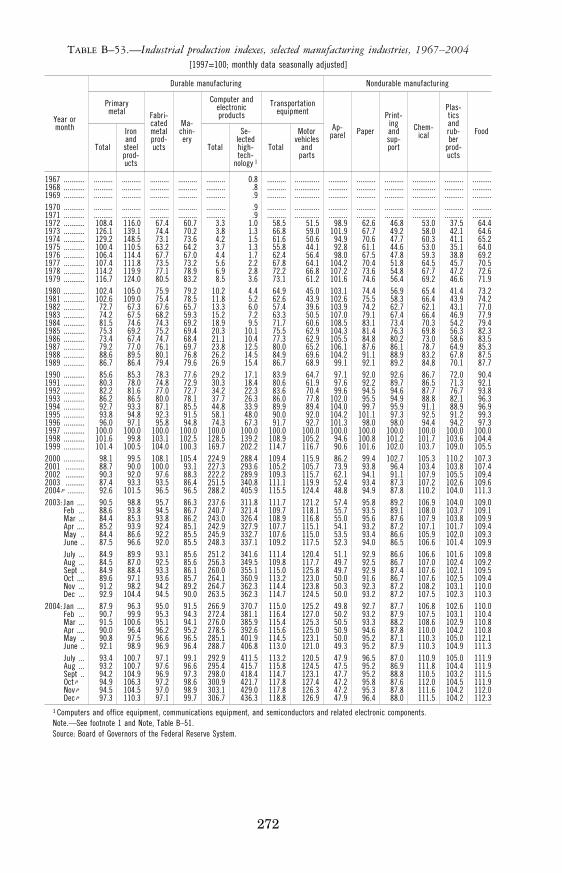
272
TABLE B–53.—Industrial production indexes, selected manufacturing industries, 1967–2004 [1997=100; monthly data seasonally adjusted]
Year or month
Durable manufacturing Nondurable manufacturing
Primary metal Fabri-
cated metal prod- ucts
Ma-chin-ery
Computer and electronic products
Transportation equipment
Ap-parel Paper
Print- ing and sup- port
Chem- ical
Plas- tics and rub- ber
prod- ucts
Food
Total
Iron and steel prod- ucts
Total
Se-lected high- tech-
nology 1
Total
Motor vehicles
and parts
1967 ........... .......... .......... .......... .......... .......... 0.8 .......... ............. .......... .......... .......... ............ .......... ..........1968 ........... .......... .......... .......... .......... .......... .8 .......... ............. .......... .......... .......... ............ .......... ..........1969 ........... .......... .......... .......... .......... .......... .9 .......... ............. .......... .......... .......... ............ .......... ..........1970 ........... .......... .......... .......... .......... .......... .9 .......... ............. .......... .......... .......... ............ .......... ..........1971 ........... .......... .......... .......... .......... .......... .9 .......... ............. .......... .......... .......... ............ .......... ..........1972 ........... 108.4 116.0 67.4 60.7 3.3 1.0 58.5 51.5 98.9 62.6 46.8 53.0 37.5 64.4 1973 ........... 126.1 139.1 74.4 70.2 3.8 1.3 66.8 59.0 101.9 67.7 49.2 58.0 42.1 64.6 1974 ........... 129.2 148.5 73.1 73.6 4.2 1.5 61.6 50.6 94.9 70.6 47.7 60.3 41.1 65.2 1975 ........... 100.4 110.5 63.2 64.2 3.7 1.3 55.8 44.1 92.8 61.1 44.6 53.0 35.1 64.0 1976 ........... 106.4 114.4 67.7 67.0 4.4 1.7 62.4 56.4 98.0 67.5 47.8 59.3 38.8 69.2 1977 ........... 107.4 111.8 73.5 73.2 5.6 2.2 67.8 64.1 104.2 70.4 51.8 64.5 45.7 70.5 1978 ........... 114.2 119.9 77.1 78.9 6.9 2.8 72.2 66.8 107.2 73.6 54.8 67.7 47.2 72.6 1979 ........... 116.7 124.0 80.5 83.2 8.5 3.6 73.1 61.2 101.6 74.6 56.4 69.2 46.6 71.9 1980 ........... 102.4 105.0 75.9 79.2 10.2 4.4 64.9 45.0 103.1 74.4 56.9 65.4 41.4 73.2 1981 ........... 102.6 109.0 75.4 78.5 11.8 5.2 62.6 43.9 102.6 75.5 58.3 66.4 43.9 74.2 1982 ........... 72.7 67.3 67.6 65.7 13.3 6.0 57.4 39.6 103.9 74.2 62.7 62.1 43.1 77.0 1983 ........... 74.2 67.5 68.2 59.3 15.2 7.2 63.3 50.5 107.0 79.1 67.4 66.4 46.9 77.9 1984 ........... 81.5 74.6 74.3 69.2 18.9 9.5 71.7 60.6 108.5 83.1 73.4 70.3 54.2 79.4 1985 ........... 75.3 69.2 75.2 69.4 20.3 10.1 75.5 62.9 104.3 81.4 76.3 69.8 56.3 82.3 1986 ........... 73.4 67.4 74.7 68.4 21.1 10.4 77.3 62.9 105.5 84.8 80.2 73.0 58.6 83.5 1987 ........... 79.2 77.0 76.1 69.7 23.8 12.5 80.0 65.2 106.1 87.6 86.1 78.7 64.9 85.3 1988 ........... 88.6 89.5 80.1 76.8 26.2 14.5 84.9 69.6 104.2 91.1 88.9 83.2 67.8 87.5 1989 ........... 86.7 86.4 79.4 79.6 26.9 15.4 86.7 68.9 99.1 92.1 89.2 84.8 70.1 87.7 1990 ........... 85.6 85.3 78.3 77.6 29.2 17.1 83.9 64.7 97.1 92.0 92.6 86.7 72.0 90.4 1991 ........... 80.3 78.0 74.8 72.9 30.3 18.4 80.6 61.9 97.6 92.2 89.7 86.5 71.3 92.1 1992 ........... 82.2 81.6 77.0 72.7 34.2 22.3 83.6 70.4 99.6 94.5 94.6 87.7 76.7 93.8 1993 ........... 86.2 86.5 80.0 78.1 37.7 26.3 86.0 77.8 102.0 95.5 94.9 88.8 82.1 96.3 1994 ........... 92.7 93.3 87.1 85.5 44.8 33.9 89.9 89.4 104.0 99.7 95.9 91.1 88.9 96.9 1995 ........... 93.8 94.8 92.3 91.5 58.1 48.0 90.0 92.0 104.2 101.1 97.3 92.5 91.2 99.3 1996 ........... 96.0 97.1 95.8 94.8 74.3 67.3 91.7 92.7 101.3 98.0 98.0 94.4 94.2 97.3 1997 ........... 100.0 100.0 100.0 100.0 100.0 100.0 100.0 100.0 100.0 100.0 100.0 100.0 100.0 100.0 1998 ........... 101.6 99.8 103.1 102.5 128.5 139.2 108.9 105.2 94.6 100.8 101.2 101.7 103.6 104.4 1999 ........... 101.4 100.5 104.0 100.3 169.7 202.2 114.7 116.7 90.6 101.6 102.0 103.7 109.0 105.5 2000 ........... 98.1 99.5 108.1 105.4 224.9 288.4 109.4 115.9 86.2 99.4 102.7 105.3 110.2 107.3 2001 .......... 88.7 90.0 100.0 93.1 227.3 293.6 105.2 105.7 73.9 93.8 96.4 103.4 103.8 107.4 2002 .......... 90.3 92.0 97.6 88.3 222.2 289.9 109.3 115.7 62.1 94.1 91.1 107.9 105.5 109.4 2003 .......... 87.4 93.3 93.5 86.4 251.5 340.8 111.1 119.9 52.4 93.4 87.3 107.2 102.6 109.6 2004 p ......... 92.6 101.5 96.5 96.5 288.2 405.9 115.5 124.4 48.8 94.9 87.8 110.2 104.0 111.3 2003: Jan .... 90.5 98.8 95.7 86.3 237.6 311.8 111.7 121.2 57.4 95.8 89.2 106.9 104.0 109.0
Feb ... 88.6 93.8 94.5 86.7 240.7 321.4 109.7 118.1 55.7 93.5 89.1 108.0 103.7 109.1 Mar ... 84.4 85.3 93.8 86.2 243.0 326.4 108.9 116.8 55.0 95.6 87.6 107.9 103.8 109.9 Apr .... 85.2 93.9 92.4 85.1 242.9 327.9 107.7 115.1 54.1 93.2 87.2 107.1 101.7 109.4 May .. 84.4 86.6 92.2 85.5 245.9 332.7 107.6 115.0 53.5 93.4 86.6 105.9 102.0 109.3 June .. 87.5 96.6 92.0 85.5 248.3 337.1 109.2 117.5 52.3 94.0 86.5 106.6 101.4 109.9 July ... 84.9 89.9 93.1 85.6 251.2 341.6 111.4 120.4 51.1 92.9 86.6 106.6 101.6 109.8 Aug ... 84.5 87.0 92.5 85.6 256.3 349.5 109.8 117.7 49.7 92.5 86.7 107.0 102.4 109.2 Sept .. 84.9 88.4 93.3 86.1 260.0 355.1 115.0 125.8 49.7 92.9 87.4 107.6 102.1 109.5 Oct .... 89.6 97.1 93.6 85.7 264.1 360.9 113.2 123.0 50.0 91.6 86.7 107.6 102.5 109.4 Nov ... 91.2 98.2 94.2 89.2 264.7 362.3 114.4 123.8 50.3 92.3 87.2 108.2 103.1 110.0 Dec ... 92.9 104.4 94.5 90.0 263.5 362.3 114.7 124.5 50.0 93.2 87.2 107.5 102.3 110.3
2004: Jan .... 87.9 96.3 95.0 91.5 266.9 370.7 115.0 125.2 49.8 92.7 87.7 106.8 102.6 110.0 Feb ... 90.7 99.9 95.3 94.3 272.4 381.1 116.4 127.0 50.2 93.2 87.9 107.5 103.1 110.4 Mar ... 91.5 100.6 95.1 94.1 276.0 385.9 115.4 125.3 50.5 93.3 88.2 108.6 102.9 110.8 Apr .... 90.0 96.4 96.2 95.2 278.5 392.6 115.6 125.0 50.9 94.6 87.8 110.0 104.2 110.8 May .. 90.8 97.5 96.6 96.5 285.1 401.9 114.5 123.1 50.0 95.2 87.1 110.3 105.0 112.1 June .. 92.1 98.9 96.9 96.4 288.7 406.8 113.0 121.0 49.3 95.2 87.9 110.3 104.9 111.3 July ... 93.4 100.7 97.1 99.1 292.9 411.5 113.2 120.5 47.9 96.5 87.0 110.9 105.0 111.9 Aug ... 93.2 100.7 97.6 96.6 295.4 415.7 115.8 124.5 47.5 95.2 86.9 111.8 104.4 111.9 Sept .. 94.2 104.9 96.9 97.3 298.0 418.4 114.7 123.1 47.7 95.2 88.8 110.5 103.2 111.5 Oct p 94.9 106.3 97.2 98.6 300.9 421.7 117.8 127.4 47.2 95.8 87.6 112.0 104.5 111.9 Nov p 94.5 104.5 97.0 98.9 303.1 429.0 117.8 126.3 47.2 95.3 87.8 111.6 104.2 112.0 Dec p 97.3 110.3 97.1 99.7 306.7 436.3 118.8 126.9 47.9 96.4 88.0 111.5 104.2 112.3
1 Computers and office equipment, communications equipment, and semiconductors and related electronic components. Note.—See footnote 1 and Note, Table B–51. Source: Board of Governors of the Federal Reserve System.
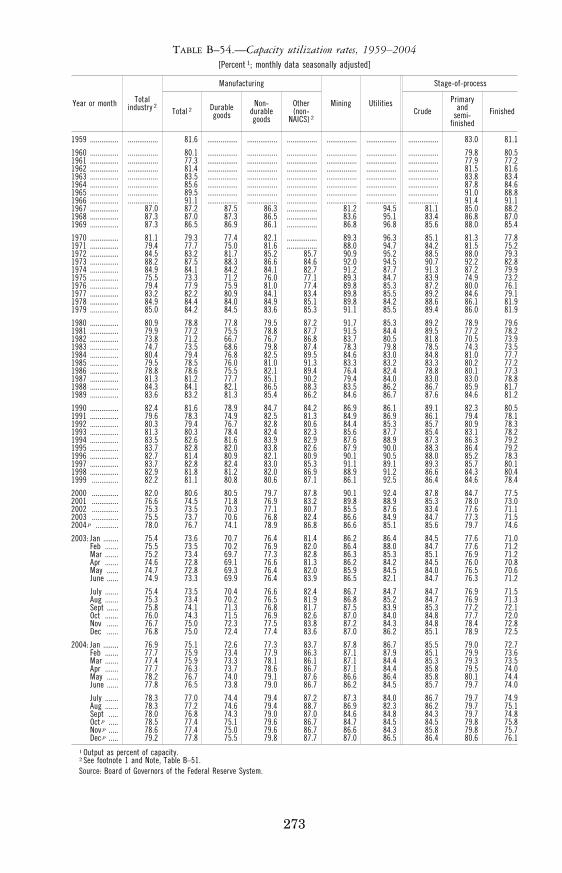
273
TABLE B–54.—Capacity utilization rates, 1959–2004 [Percent 1; monthly data seasonally adjusted]
Year or month Total industry 2
Manufacturing
Mining Utilities
Stage-of-process
Total 2 Durable goods
Non- durable goods
Other (non-
NAICS) 2 Crude
Primary and
semi- finished
Finished
1959 ............... ................ 81.6 ................ ................ ................ ................ ................ ................ 83.0 81.1
1960 ............... ................ 80.1 ................ ................ ................ ................ ................ ................ 79.8 80.5 1961 ............... ................ 77.3 ................ ................ ................ ................ ................ ................ 77.9 77.2 1962 ............... ................ 81.4 ................ ................ ................ ................ ................ ................ 81.5 81.6 1963 ............... ................ 83.5 ................ ................ ................ ................ ................ ................ 83.8 83.4 1964 ............... ................ 85.6 ................ ................ ................ ................ ................ ................ 87.8 84.6 1965 ............... ................ 89.5 ................ ................ ................ ................ ................ ................ 91.0 88.8 1966 ............... ................ 91.1 ................ ................ ................ ................ ................ ................ 91.4 91.1 1967 ............... 87.0 87.2 87.5 86.3 ................ 81.2 94.5 81.1 85.0 88.2 1968 ............... 87.3 87.0 87.3 86.5 ................ 83.6 95.1 83.4 86.8 87.0 1969 ............... 87.3 86.5 86.9 86.1 ................ 86.8 96.8 85.6 88.0 85.4
1970 ............... 81.1 79.3 77.4 82.1 ................ 89.3 96.3 85.1 81.3 77.8 1971 ............... 79.4 77.7 75.0 81.6 ................ 88.0 94.7 84.2 81.5 75.2 1972 ............... 84.5 83.2 81.7 85.2 85.7 90.9 95.2 88.5 88.0 79.3 1973 ............... 88.2 87.5 88.3 86.6 84.6 92.0 94.5 90.7 92.2 82.8 1974 ............... 84.9 84.1 84.2 84.1 82.7 91.2 87.7 91.3 87.2 79.9 1975 ............... 75.5 73.3 71.2 76.0 77.1 89.3 84.7 83.9 74.9 73.2 1976 ............... 79.4 77.9 75.9 81.0 77.4 89.8 85.3 87.2 80.0 76.1 1977 ............... 83.2 82.2 80.9 84.1 83.4 89.8 85.5 89.2 84.6 79.1 1978 ............... 84.9 84.4 84.0 84.9 85.1 89.8 84.2 88.6 86.1 81.9 1979 ............... 85.0 84.2 84.5 83.6 85.3 91.1 85.5 89.4 86.0 81.9
1980 ............... 80.9 78.8 77.8 79.5 87.2 91.7 85.3 89.2 78.9 79.6 1981 ............... 79.9 77.2 75.5 78.8 87.7 91.5 84.4 89.5 77.2 78.2 1982 ............... 73.8 71.2 66.7 76.7 86.8 83.7 80.5 81.8 70.5 73.9 1983 ............... 74.7 73.5 68.6 79.8 87.4 78.3 79.8 78.5 74.3 73.5 1984 ............... 80.4 79.4 76.8 82.5 89.5 84.6 83.0 84.8 81.0 77.7 1985 ............... 79.5 78.5 76.0 81.0 91.3 83.3 83.2 83.3 80.2 77.2 1986 ............... 78.8 78.6 75.5 82.1 89.4 76.4 82.4 78.8 80.1 77.3 1987 ............... 81.3 81.2 77.7 85.1 90.2 79.4 84.0 83.0 83.0 78.8 1988 ............... 84.3 84.1 82.1 86.5 88.3 83.5 86.2 86.7 85.9 81.7 1989 ............... 83.6 83.2 81.3 85.4 86.2 84.6 86.7 87.6 84.6 81.2
1990 ............... 82.4 81.6 78.9 84.7 84.2 86.9 86.1 89.1 82.3 80.5 1991 ............... 79.6 78.3 74.9 82.5 81.3 84.9 86.9 86.1 79.4 78.1 1992 ............... 80.3 79.4 76.7 82.8 80.6 84.4 85.3 85.7 80.9 78.3 1993 ............... 81.3 80.3 78.4 82.4 82.3 85.6 87.7 85.4 83.1 78.2 1994 ............... 83.5 82.6 81.6 83.9 82.9 87.6 88.9 87.3 86.3 79.2 1995 ............... 83.7 82.8 82.0 83.8 82.6 87.9 90.0 88.3 86.4 79.2 1996 ............... 82.7 81.4 80.9 82.1 80.9 90.1 90.5 88.0 85.2 78.3 1997 ............... 83.7 82.8 82.4 83.0 85.3 91.1 89.1 89.3 85.7 80.1 1998 ............... 82.9 81.8 81.2 82.0 86.9 88.9 91.2 86.6 84.3 80.4 1999 .............. 82.2 81.1 80.8 80.6 87.1 86.1 92.5 86.4 84.6 78.4
2000 .............. 82.0 80.6 80.5 79.7 87.8 90.1 92.4 87.8 84.7 77.5 2001 .............. 76.6 74.5 71.8 76.9 83.2 89.8 88.9 85.3 78.0 73.0 2002 .............. 75.3 73.5 70.3 77.1 80.7 85.5 87.6 83.4 77.6 71.1 2003 .............. 75.5 73.7 70.6 76.8 82.4 86.6 84.9 84.7 77.3 71.5 2004 p ............ 78.0 76.7 74.1 78.9 86.8 86.6 85.1 85.6 79.7 74.6
2003: Jan ........ 75.4 73.6 70.7 76.4 81.4 86.2 86.4 84.5 77.6 71.0 Feb ....... 75.5 73.5 70.2 76.9 82.0 86.4 88.0 84.7 77.6 71.2 Mar ....... 75.2 73.4 69.7 77.3 82.8 86.3 85.3 85.1 76.9 71.2 Apr ....... 74.6 72.8 69.1 76.6 81.3 86.2 84.2 84.5 76.0 70.8 May ...... 74.7 72.8 69.3 76.4 82.0 85.9 84.5 84.0 76.5 70.6 June ...... 74.9 73.3 69.9 76.4 83.9 86.5 82.1 84.7 76.3 71.2
July ....... 75.4 73.5 70.4 76.6 82.4 86.7 84.7 84.7 76.9 71.5 Aug ....... 75.3 73.4 70.2 76.5 81.9 86.8 85.2 84.7 76.9 71.3 Sept ...... 75.8 74.1 71.3 76.8 81.7 87.5 83.9 85.3 77.2 72.1 Oct ....... 76.0 74.3 71.5 76.9 82.6 87.0 84.0 84.8 77.7 72.0 Nov ...... 76.7 75.0 72.3 77.5 83.8 87.2 84.3 84.8 78.4 72.8 Dec ...... 76.8 75.0 72.4 77.4 83.6 87.0 86.2 85.1 78.9 72.5
2004: Jan ........ 76.9 75.1 72.6 77.3 83.7 87.8 86.7 85.5 79.0 72.7 Feb ....... 77.7 75.9 73.4 77.9 86.3 87.1 87.9 85.1 79.9 73.6 Mar ....... 77.4 75.9 73.3 78.1 86.1 87.1 84.4 85.3 79.3 73.5 Apr ....... 77.7 76.3 73.7 78.6 86.7 87.1 84.4 85.8 79.5 74.0 May ...... 78.2 76.7 74.0 79.1 87.6 86.6 86.4 85.8 80.1 74.4 June ...... 77.8 76.5 73.8 79.0 86.7 86.2 84.5 85.7 79.7 74.0
July ....... 78.3 77.0 74.4 79.4 87.2 87.3 84.0 86.7 79.7 74.9 Aug ....... 78.3 77.2 74.6 79.4 88.7 86.9 82.3 86.2 79.7 75.1 Sept ..... 78.0 76.8 74.3 79.0 87.0 84.6 84.8 84.3 79.7 74.8 Oct p ..... 78.5 77.4 75.1 79.6 86.7 84.7 84.5 84.5 79.8 75.8 Nov p ..... 78.6 77.4 75.0 79.6 86.7 86.6 84.3 85.8 79.8 75.7 Dec p ..... 79.2 77.8 75.5 79.8 87.7 87.0 86.5 86.4 80.6 76.1
1 Output as percent of capacity. 2 See footnote 1 and Note, Table B–51. Source: Board of Governors of the Federal Reserve System.
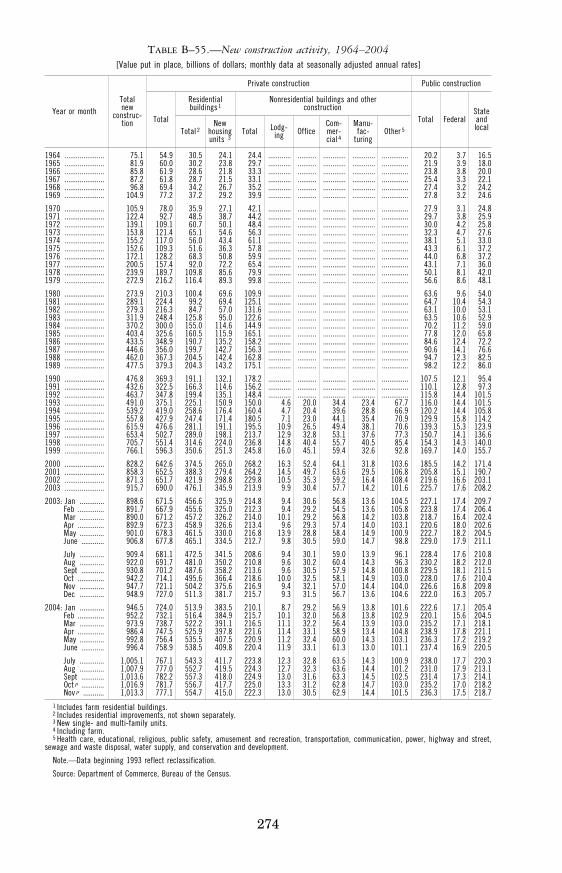
274
TABLE B–55.—New construction activity, 1964–2004 [Value put in place, billions of dollars; monthly data at seasonally adjusted annual rates]
Year or month Total new
construc- tion
Private construction Public construction
Total
Residential buildings 1
Nonresidential buildings and other construction
Total Federal State and local Total 2
New housing units 3
Total Lodg-ing Office
Com- mer- cial 4
Manu- fac-
turing Other 5
1964 ..................... 75.1 54.9 30.5 24.1 24.4 ............ .......... ............ ............ .............. 20.2 3.7 16.5 1965 ..................... 81.9 60.0 30.2 23.8 29.7 ............ .......... ............ ............ .............. 21.9 3.9 18.0 1966 ..................... 85.8 61.9 28.6 21.8 33.3 ............ .......... ............ ............ .............. 23.8 3.8 20.0 1967 ..................... 87.2 61.8 28.7 21.5 33.1 ............ .......... ............ ............ .............. 25.4 3.3 22.1 1968 ..................... 96.8 69.4 34.2 26.7 35.2 ............ .......... ............ ............ .............. 27.4 3.2 24.2 1969 ..................... 104.9 77.2 37.2 29.2 39.9 ............ .......... ............ ............ .............. 27.8 3.2 24.6
1970 ..................... 105.9 78.0 35.9 27.1 42.1 ............ .......... ............ ............ .............. 27.9 3.1 24.8 1971 ..................... 122.4 92.7 48.5 38.7 44.2 ............ .......... ............ ............ .............. 29.7 3.8 25.9 1972 ..................... 139.1 109.1 60.7 50.1 48.4 ............ .......... ............ ............ .............. 30.0 4.2 25.8 1973 ..................... 153.8 121.4 65.1 54.6 56.3 ............ .......... ............ ............ .............. 32.3 4.7 27.6 1974 ..................... 155.2 117.0 56.0 43.4 61.1 ............ .......... ............ ............ .............. 38.1 5.1 33.0 1975 ..................... 152.6 109.3 51.6 36.3 57.8 ............ .......... ............ ............ .............. 43.3 6.1 37.2 1976 ..................... 172.1 128.2 68.3 50.8 59.9 ............ .......... ............ ............ .............. 44.0 6.8 37.2 1977 ..................... 200.5 157.4 92.0 72.2 65.4 ............ .......... ............ ............ .............. 43.1 7.1 36.0 1978 ..................... 239.9 189.7 109.8 85.6 79.9 ............ .......... ............ ............ .............. 50.1 8.1 42.0 1979 ..................... 272.9 216.2 116.4 89.3 99.8 ............ .......... ............ ............ .............. 56.6 8.6 48.1
1980 ..................... 273.9 210.3 100.4 69.6 109.9 ............ .......... ............ ............ .............. 63.6 9.6 54.0 1981 ..................... 289.1 224.4 99.2 69.4 125.1 ............ .......... ............ ............ .............. 64.7 10.4 54.3 1982 ..................... 279.3 216.3 84.7 57.0 131.6 ............ .......... ............ ............ .............. 63.1 10.0 53.1 1983 ..................... 311.9 248.4 125.8 95.0 122.6 ............ .......... ............ ............ .............. 63.5 10.6 52.9 1984 ..................... 370.2 300.0 155.0 114.6 144.9 ............ .......... ............ ............ .............. 70.2 11.2 59.0 1985 ..................... 403.4 325.6 160.5 115.9 165.1 ............ .......... ............ ............ .............. 77.8 12.0 65.8 1986 ..................... 433.5 348.9 190.7 135.2 158.2 ............ .......... ............ ............ .............. 84.6 12.4 72.2 1987 ..................... 446.6 356.0 199.7 142.7 156.3 ............ .......... ............ ............ .............. 90.6 14.1 76.6 1988 ..................... 462.0 367.3 204.5 142.4 162.8 ............ .......... ............ ............ .............. 94.7 12.3 82.5 1989 ..................... 477.5 379.3 204.3 143.2 175.1 ............ .......... ............ ............ .............. 98.2 12.2 86.0
1990 ..................... 476.8 369.3 191.1 132.1 178.2 ............ .......... ............ ............ .............. 107.5 12.1 95.4 1991 ..................... 432.6 322.5 166.3 114.6 156.2 ............ .......... ............ ............ .............. 110.1 12.8 97.3 1992 ..................... 463.7 347.8 199.4 135.1 148.4 ............ .......... ............ ............ .............. 115.8 14.4 101.5 1993 ..................... 491.0 375.1 225.1 150.9 150.0 4.6 20.0 34.4 23.4 67.7 116.0 14.4 101.5 1994 ..................... 539.2 419.0 258.6 176.4 160.4 4.7 20.4 39.6 28.8 66.9 120.2 14.4 105.8 1995 ..................... 557.8 427.9 247.4 171.4 180.5 7.1 23.0 44.1 35.4 70.9 129.9 15.8 114.2 1996 ..................... 615.9 476.6 281.1 191.1 195.5 10.9 26.5 49.4 38.1 70.6 139.3 15.3 123.9 1997 ..................... 653.4 502.7 289.0 198.1 213.7 12.9 32.8 53.1 37.6 77.3 150.7 14.1 136.6 1998 ..................... 705.7 551.4 314.6 224.0 236.8 14.8 40.4 55.7 40.5 85.4 154.3 14.3 140.0 1999 ..................... 766.1 596.3 350.6 251.3 245.8 16.0 45.1 59.4 32.6 92.8 169.7 14.0 155.7
2000 ..................... 828.2 642.6 374.5 265.0 268.2 16.3 52.4 64.1 31.8 103.6 185.5 14.2 171.4 2001 ..................... 858.3 652.5 388.3 279.4 264.2 14.5 49.7 63.6 29.5 106.8 205.8 15.1 190.7 2002 ..................... 871.3 651.7 421.9 298.8 229.8 10.5 35.3 59.2 16.4 108.4 219.6 16.6 203.1 2003 ..................... 915.7 690.0 476.1 345.9 213.9 9.9 30.4 57.7 14.2 101.6 225.7 17.6 208.2
2003: Jan ............. 898.6 671.5 456.6 325.9 214.8 9.4 30.6 56.8 13.6 104.5 227.1 17.4 209.7 Feb .............. 891.7 667.9 455.6 325.0 212.3 9.4 29.2 54.5 13.6 105.8 223.8 17.4 206.4 Mar ............. 890.0 671.2 457.2 326.2 214.0 10.1 29.2 56.8 14.2 103.8 218.7 16.4 202.4 Apr .............. 892.9 672.3 458.9 326.6 213.4 9.6 29.3 57.4 14.0 103.1 220.6 18.0 202.6 May ............. 901.0 678.3 461.5 330.0 216.8 13.9 28.8 58.4 14.9 100.9 222.7 18.2 204.5 June ............ 906.8 677.8 465.1 334.5 212.7 9.8 30.5 59.0 14.7 98.8 229.0 17.9 211.1
July ............. 909.4 681.1 472.5 341.5 208.6 9.4 30.1 59.0 13.9 96.1 228.4 17.6 210.8 Aug ............. 922.0 691.7 481.0 350.2 210.8 9.6 30.2 60.4 14.3 96.3 230.2 18.2 212.0 Sept ............ 930.8 701.2 487.6 358.2 213.6 9.6 30.5 57.9 14.8 100.8 229.5 18.1 211.5 Oct .............. 942.2 714.1 495.6 366.4 218.6 10.0 32.5 58.1 14.9 103.0 228.0 17.6 210.4 Nov ............. 947.7 721.1 504.2 375.6 216.9 9.4 32.1 57.0 14.4 104.0 226.6 16.8 209.8 Dec ............. 948.9 727.0 511.3 381.7 215.7 9.3 31.5 56.7 13.6 104.6 222.0 16.3 205.7
2004: Jan ............. 946.5 724.0 513.9 383.5 210.1 8.7 29.2 56.9 13.8 101.6 222.6 17.1 205.4 Feb .............. 952.2 732.1 516.4 384.9 215.7 10.1 32.0 56.8 13.8 102.9 220.1 15.6 204.5 Mar ............. 973.9 738.7 522.2 391.1 216.5 11.1 32.2 56.4 13.9 103.0 235.2 17.1 218.1 Apr .............. 986.4 747.5 525.9 397.8 221.6 11.4 33.1 58.9 13.4 104.8 238.9 17.8 221.1 May ............. 992.8 756.4 535.5 407.5 220.9 11.2 32.4 60.0 14.3 103.1 236.3 17.2 219.2 June ............ 996.4 758.9 538.5 409.8 220.4 11.9 33.1 61.3 13.0 101.1 237.4 16.9 220.5
July ............. 1,005.1 767.1 543.3 411.7 223.8 12.3 32.8 63.5 14.3 100.9 238.0 17.7 220.3 Aug ............. 1,007.9 777.0 552.7 419.5 224.3 12.7 32.3 63.6 14.4 101.2 231.0 17.9 213.1 Sept ............ 1,013.6 782.2 557.3 418.0 224.9 13.0 31.6 63.3 14.5 102.5 231.4 17.3 214.1 Oct p ............ 1,016.9 781.7 556.7 417.7 225.0 13.3 31.2 62.8 14.7 103.0 235.2 17.0 218.2 Nov p ........... 1,013.3 777.1 554.7 415.0 222.3 13.0 30.5 62.9 14.4 101.5 236.3 17.5 218.7
1 Includes farm residential buildings. 2 Includes residential improvements, not shown separately. 3 New single- and multi-family units. 4 Including farm. 5 Health care, educational, religious, public safety, amusement and recreation, transportation, communication, power, highway and street,
sewage and waste disposal, water supply, and conservation and development.
Note.—Data beginning 1993 reflect reclassification.
Source: Department of Commerce, Bureau of the Census.
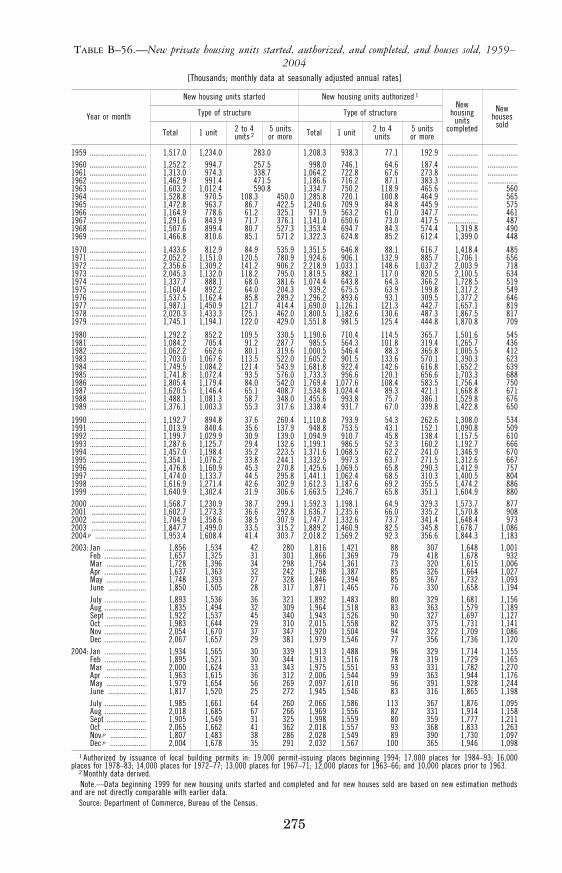
275
TABLE B–56.—New private housing units started, authorized, and completed, and houses sold, 1959– 2004
[Thousands; monthly data at seasonally adjusted annual rates]
Year or month
New housing units started New housing units authorized 1 New
housing units
completed
New houses
sold Type of structure Type of structure
Total 1 unit 2 to 4 units 2
5 units or more Total 1 unit 2 to 4
units 5 units or more
1959 .............................. 1,517.0 1,234.0 283.0 1,208.3 938.3 77.1 192.9 ................ ................1960 .............................. 1,252.2 994.7 257.5 998.0 746.1 64.6 187.4 ................ ................1961 .............................. 1,313.0 974.3 338.7 1,064.2 722.8 67.6 273.8 ................ ................1962 .............................. 1,462.9 991.4 471.5 1,186.6 716.2 87.1 383.3 ................ ................1963 .............................. 1,603.2 1,012.4 590.8 1,334.7 750.2 118.9 465.6 ................ 560 1964 .............................. 1,528.8 970.5 108.3 450.0 1,285.8 720.1 100.8 464.9 ................ 565 1965 .............................. 1,472.8 963.7 86.7 422.5 1,240.6 709.9 84.8 445.9 ................ 575 1966 .............................. 1,164.9 778.6 61.2 325.1 971.9 563.2 61.0 347.7 ................ 461 1967 .............................. 1,291.6 843.9 71.7 376.1 1,141.0 650.6 73.0 417.5 ................ 487 1968 .............................. 1,507.6 899.4 80.7 527.3 1,353.4 694.7 84.3 574.4 1,319.8 490 1969 .............................. 1,466.8 810.6 85.1 571.2 1,322.3 624.8 85.2 612.4 1,399.0 448
1970 .............................. 1,433.6 812.9 84.9 535.9 1,351.5 646.8 88.1 616.7 1,418.4 485 1971 .............................. 2,052.2 1,151.0 120.5 780.9 1,924.6 906.1 132.9 885.7 1,706.1 656 1972 .............................. 2,356.6 1,309.2 141.2 906.2 2,218.9 1,033.1 148.6 1,037.2 2,003.9 718 1973 .............................. 2,045.3 1,132.0 118.2 795.0 1,819.5 882.1 117.0 820.5 2,100.5 634 1974 .............................. 1,337.7 888.1 68.0 381.6 1,074.4 643.8 64.3 366.2 1,728.5 519 1975 .............................. 1,160.4 892.2 64.0 204.3 939.2 675.5 63.9 199.8 1,317.2 549 1976 .............................. 1,537.5 1,162.4 85.8 289.2 1,296.2 893.6 93.1 309.5 1,377.2 646 1977 .............................. 1,987.1 1,450.9 121.7 414.4 1,690.0 1,126.1 121.3 442.7 1,657.1 819 1978 .............................. 2,020.3 1,433.3 125.1 462.0 1,800.5 1,182.6 130.6 487.3 1,867.5 817 1979 .............................. 1,745.1 1,194.1 122.0 429.0 1,551.8 981.5 125.4 444.8 1,870.8 709
1980 .............................. 1,292.2 852.2 109.5 330.5 1,190.6 710.4 114.5 365.7 1,501.6 545 1981 .............................. 1,084.2 705.4 91.2 287.7 985.5 564.3 101.8 319.4 1,265.7 436 1982 .............................. 1,062.2 662.6 80.1 319.6 1,000.5 546.4 88.3 365.8 1,005.5 412 1983 .............................. 1,703.0 1,067.6 113.5 522.0 1,605.2 901.5 133.6 570.1 1,390.3 623 1984 .............................. 1,749.5 1,084.2 121.4 543.9 1,681.8 922.4 142.6 616.8 1,652.2 639 1985 .............................. 1,741.8 1,072.4 93.5 576.0 1,733.3 956.6 120.1 656.6 1,703.3 688 1986 .............................. 1,805.4 1,179.4 84.0 542.0 1,769.4 1,077.6 108.4 583.5 1,756.4 750 1987 .............................. 1,620.5 1,146.4 65.1 408.7 1,534.8 1,024.4 89.3 421.1 1,668.8 671 1988 .............................. 1,488.1 1,081.3 58.7 348.0 1,455.6 993.8 75.7 386.1 1,529.8 676 1989 .............................. 1,376.1 1,003.3 55.3 317.6 1,338.4 931.7 67.0 339.8 1,422.8 650
1990 .............................. 1,192.7 894.8 37.6 260.4 1,110.8 793.9 54.3 262.6 1,308.0 534 1991 .............................. 1,013.9 840.4 35.6 137.9 948.8 753.5 43.1 152.1 1,090.8 509 1992 .............................. 1,199.7 1,029.9 30.9 139.0 1,094.9 910.7 45.8 138.4 1,157.5 610 1993 .............................. 1,287.6 1,125.7 29.4 132.6 1,199.1 986.5 52.3 160.2 1,192.7 666 1994 .............................. 1,457.0 1,198.4 35.2 223.5 1,371.6 1,068.5 62.2 241.0 1,346.9 670 1995 .............................. 1,354.1 1,076.2 33.8 244.1 1,332.5 997.3 63.7 271.5 1,312.6 667 1996 .............................. 1,476.8 1,160.9 45.3 270.8 1,425.6 1,069.5 65.8 290.3 1,412.9 757 1997 .............................. 1,474.0 1,133.7 44.5 295.8 1,441.1 1,062.4 68.5 310.3 1,400.5 804 1998 .............................. 1,616.9 1,271.4 42.6 302.9 1,612.3 1,187.6 69.2 355.5 1,474.2 886 1999 .............................. 1,640.9 1,302.4 31.9 306.6 1,663.5 1,246.7 65.8 351.1 1,604.9 880 2000 .............................. 1,568.7 1,230.9 38.7 299.1 1,592.3 1,198.1 64.9 329.3 1,573.7 877 2001 ............................. 1,602.7 1,273.3 36.6 292.8 1,636.7 1,235.6 66.0 335.2 1,570.8 908 2002 ............................. 1,704.9 1,358.6 38.5 307.9 1,747.7 1,332.6 73.7 341.4 1,648.4 973 2003 ............................. 1,847.7 1,499.0 33.5 315.2 1,889.2 1,460.9 82.5 345.8 1,678.7 1,086 2004 p ........................... 1,953.4 1,608.4 41.4 303.7 2,018.2 1,569.2 92.3 356.6 1,844.3 1,183 2003: Jan ...................... 1,856 1,534 42 280 1,816 1,421 88 307 1,648 1,001
Feb ...................... 1,657 1,325 31 301 1,866 1,369 79 418 1,678 932 Mar ..................... 1,728 1,396 34 298 1,754 1,361 73 320 1,615 1,006 Apr ...................... 1,637 1,363 32 242 1,798 1,387 85 326 1,664 1,027 May ..................... 1,748 1,393 27 328 1,846 1,394 85 367 1,732 1,093 June .................... 1,850 1,505 28 317 1,871 1,465 76 330 1,658 1,194 July ...................... 1,893 1,536 36 321 1,892 1,483 80 329 1,681 1,156 Aug ...................... 1,835 1,494 32 309 1,964 1,518 83 363 1,579 1,189 Sept ..................... 1,922 1,537 45 340 1,943 1,526 90 327 1,697 1,127 Oct ...................... 1,983 1,644 29 310 2,015 1,558 82 375 1,731 1,141 Nov ...................... 2,054 1,670 37 347 1,920 1,504 94 322 1,709 1,086 Dec ...................... 2,067 1,657 29 381 1,979 1,546 77 356 1,736 1,120
2004: Jan ...................... 1,934 1,565 30 339 1,913 1,488 96 329 1,714 1,155 Feb ...................... 1,895 1,521 30 344 1,913 1,516 78 319 1,729 1,165 Mar ..................... 2,000 1,624 33 343 1,975 1,551 93 331 1,782 1,270 Apr ...................... 1,963 1,615 36 312 2,006 1,544 99 363 1,944 1,176 May ..................... 1,979 1,654 56 269 2,097 1,610 96 391 1,928 1,244 June .................... 1,817 1,520 25 272 1,945 1,546 83 316 1,865 1,198 July ...................... 1,985 1,661 64 260 2,066 1,586 113 367 1,876 1,095 Aug ...................... 2,018 1,685 67 266 1,969 1,556 82 331 1,914 1,158 Sept ..................... 1,905 1,549 31 325 1,998 1,559 80 359 1,777 1,211 Oct ...................... 2,065 1,662 41 362 2,018 1,557 93 368 1,833 1,263 Nov p ................... 1,807 1,483 38 286 2,028 1,549 89 390 1,730 1,097 Dec p ................... 2,004 1,678 35 291 2,032 1,567 100 365 1,946 1,098
1 Authorized by issuance of local building permits in: 19,000 permit-issuing places beginning 1994; 17,000 places for 1984–93; 16,000 places for 1978–83; 14,000 places for 1972–77; 13,000 places for 1967–71; 12,000 places for 1963–66; and 10,000 places prior to 1963.
2 Monthly data derived. Note.—Data beginning 1999 for new housing units started and completed and for new houses sold are based on new estimation methods
and are not directly comparable with earlier data. Source: Department of Commerce, Bureau of the Census.
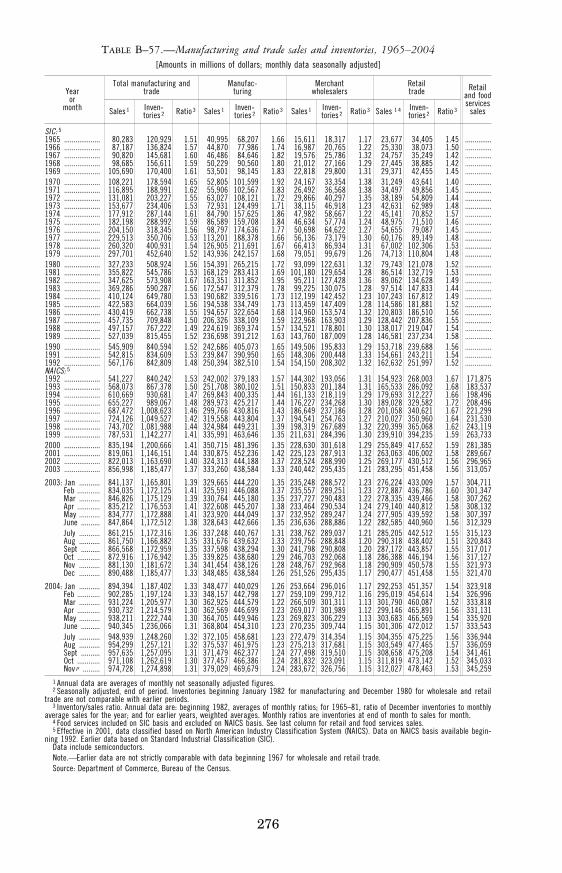
276
TABLE B–57.—Manufacturing and trade sales and inventories, 1965–2004 [Amounts in millions of dollars; monthly data seasonally adjusted]
Year or
month
Total manufacturing and trade
Manufac- turing
Merchant wholesalers
Retail trade Retail
and food services
sales Sales 1 Inven- tories 2 Ratio 3 Sales 1 Inven-
tories 2 Ratio 3 Sales 1 Inven- tories 2 Ratio 3 Sales 1 4 Inven-
tories 2 Ratio 3
SIC: 5 1965 ................... 80,283 120,929 1.51 40,995 68,207 1.66 15,611 18,317 1.17 23,677 34,405 1.45 ..............1966 ................... 87,187 136,824 1.57 44,870 77,986 1.74 16,987 20,765 1.22 25,330 38,073 1.50 ..............1967 ................... 90,820 145,681 1.60 46,486 84,646 1.82 19,576 25,786 1.32 24,757 35,249 1.42 ..............1968 ................... 98,685 156,611 1.59 50,229 90,560 1.80 21,012 27,166 1.29 27,445 38,885 1.42 ..............1969 ................... 105,690 170,400 1.61 53,501 98,145 1.83 22,818 29,800 1.31 29,371 42,455 1.45 ..............1970 ................... 108,221 178,594 1.65 52,805 101,599 1.92 24,167 33,354 1.38 31,249 43,641 1.40 ..............1971 ................... 116,895 188,991 1.62 55,906 102,567 1.83 26,492 36,568 1.38 34,497 49,856 1.45 ..............1972 ................... 131,081 203,227 1.55 63,027 108,121 1.72 29,866 40,297 1.35 38,189 54,809 1.44 ..............1973 ................... 153,677 234,406 1.53 72,931 124,499 1.71 38,115 46,918 1.23 42,631 62,989 1.48 ..............1974 ................... 177,912 287,144 1.61 84,790 157,625 1.86 47,982 58,667 1.22 45,141 70,852 1.57 ..............1975 ................... 182,198 288,992 1.59 86,589 159,708 1.84 46,634 57,774 1.24 48,975 71,510 1.46 ..............1976 ................... 204,150 318,345 1.56 98,797 174,636 1.77 50,698 64,622 1.27 54,655 79,087 1.45 ..............1977 ................... 229,513 350,706 1.53 113,201 188,378 1.66 56,136 73,179 1.30 60,176 89,149 1.48 ..............1978 ................... 260,320 400,931 1.54 126,905 211,691 1.67 66,413 86,934 1.31 67,002 102,306 1.53 ..............1979 ................... 297,701 452,640 1.52 143,936 242,157 1.68 79,051 99,679 1.26 74,713 110,804 1.48 ..............1980 ................... 327,233 508,924 1.56 154,391 265,215 1.72 93,099 122,631 1.32 79,743 121,078 1.52 ..............1981 ................... 355,822 545,786 1.53 168,129 283,413 1.69 101,180 129,654 1.28 86,514 132,719 1.53 ..............1982 ................... 347,625 573,908 1.67 163,351 311,852 1.95 95,211 127,428 1.36 89,062 134,628 1.49 ..............1983 ................... 369,286 590,287 1.56 172,547 312,379 1.78 99,225 130,075 1.28 97,514 147,833 1.44 ..............1984 ................... 410,124 649,780 1.53 190,682 339,516 1.73 112,199 142,452 1.23 107,243 167,812 1.49 ..............1985 ................... 422,583 664,039 1.56 194,538 334,749 1.73 113,459 147,409 1.28 114,586 181,881 1.52 ..............1986 ................... 430,419 662,738 1.55 194,657 322,654 1.68 114,960 153,574 1.32 120,803 186,510 1.56 ..............1987 ................... 457,735 709,848 1.50 206,326 338,109 1.59 122,968 163,903 1.29 128,442 207,836 1.55 ..............1988 ................... 497,157 767,222 1.49 224,619 369,374 1.57 134,521 178,801 1.30 138,017 219,047 1.54 ..............1989 ................... 527,039 815,455 1.52 236,698 391,212 1.63 143,760 187,009 1.28 146,581 237,234 1.58 ..............1990 ................... 545,909 840,594 1.52 242,686 405,073 1.65 149,506 195,833 1.29 153,718 239,688 1.56 ..............1991 ................... 542,815 834,609 1.53 239,847 390,950 1.65 148,306 200,448 1.33 154,661 243,211 1.54 ..............1992 ................... 567,176 842,809 1.48 250,394 382,510 1.54 154,150 208,302 1.32 162,632 251,997 1.52 ..............NAICS: 5 1992 ................... 541,227 840,242 1.53 242,002 379,183 1.57 144,302 193,056 1.31 154,923 268,003 1.67 171,875 1993 ................... 568,073 867,378 1.50 251,708 380,102 1.51 150,833 201,184 1.31 165,533 286,092 1.68 183,537 1994 ................... 610,669 930,681 1.47 269,843 400,335 1.44 161,133 218,119 1.29 179,693 312,227 1.66 198,496 1995 ................... 655,227 989,067 1.48 289,973 425,217 1.44 176,227 234,268 1.30 189,028 329,582 1.72 208,496 1996 ................... 687,472 1,008,623 1.46 299,766 430,816 1.43 186,649 237,186 1.28 201,058 340,621 1.67 221,299 1997 ................... 724,126 1,049,527 1.42 319,558 443,804 1.37 194,541 254,763 1.27 210,027 350,960 1.64 231,530 1998 ................... 743,702 1,081,988 1.44 324,984 449,231 1.39 198,319 267,689 1.32 220,399 365,068 1.62 243,119 1999 ................... 787,531 1,142,277 1.41 335,991 463,646 1.35 211,631 284,396 1.30 239,910 394,235 1.59 263,733 2000 ................... 835,194 1,200,666 1.41 350,715 481,396 1.35 228,630 301,618 1.29 255,849 417,652 1.59 281,385 2001 ................... 819,061 1,146,151 1.44 330,875 452,236 1.42 225,123 287,913 1.32 263,063 406,002 1.58 289,667 2002 ................... 822,013 1,163,690 1.40 324,313 444,188 1.37 228,524 288,990 1.25 269,177 430,512 1.56 296,965 2003 ................... 856,998 1,185,477 1.37 333,260 438,584 1.33 240,442 295,435 1.21 283,295 451,458 1.56 313,057
2003: Jan ........... 841,137 1,165,801 1.39 329,665 444,220 1.35 235,248 288,572 1.23 276,224 433,009 1.57 304,711 Feb ............ 834,035 1,172,125 1.41 325,591 446,088 1.37 235,557 289,251 1.23 272,887 436,786 1.60 301,347 Mar ........... 846,826 1,175,129 1.39 330,764 445,180 1.35 237,727 290,483 1.22 278,335 439,466 1.58 307,262 Apr ............ 835,212 1,176,553 1.41 322,608 445,207 1.38 233,464 290,534 1.24 279,140 440,812 1.58 308,132 May ........... 834,777 1,172,888 1.41 323,920 444,049 1.37 232,952 289,247 1.24 277,905 439,592 1.58 307,397 June .......... 847,864 1,172,512 1.38 328,643 442,666 1.35 236,636 288,886 1.22 282,585 440,960 1.56 312,329 July ........... 861,215 1,172,316 1.36 337,248 440,767 1.31 238,762 289,037 1.21 285,205 442,512 1.55 315,123 Aug ........... 861,750 1,166,882 1.35 331,676 439,632 1.33 239,756 288,848 1.20 290,318 438,402 1.51 320,843 Sept .......... 866,568 1,172,959 1.35 337,598 438,294 1.30 241,798 290,808 1.20 287,172 443,857 1.55 317,017 Oct ............ 872,916 1,176,942 1.35 339,825 438,680 1.29 246,703 292,068 1.18 286,388 446,194 1.56 317,127 Nov ........... 881,130 1,181,672 1.34 341,454 438,126 1.28 248,767 292,968 1.18 290,909 450,578 1.55 321,973 Dec ........... 890,488 1,185,477 1.33 348,485 438,584 1.26 251,526 295,435 1.17 290,477 451,458 1.55 321,470
2004: Jan ........... 894,394 1,187,402 1.33 348,477 440,029 1.26 253,664 296,016 1.17 292,253 451,357 1.54 323,918 Feb ............ 902,285 1,197,124 1.33 348,157 442,798 1.27 259,109 299,712 1.16 295,019 454,614 1.54 326,996 Mar ........... 931,224 1,205,977 1.30 362,925 444,579 1.22 266,509 301,311 1.13 301,790 460,087 1.52 333,818 Apr ............ 930,732 1,214,579 1.30 362,569 446,699 1.23 269,017 301,989 1.12 299,146 465,891 1.56 331,131 May ........... 938,211 1,222,744 1.30 364,705 449,946 1.23 269,823 306,229 1.13 303,683 466,569 1.54 335,920 June .......... 940,345 1,236,066 1.31 368,804 454,310 1.23 270,235 309,744 1.15 301,306 472,012 1.57 333,543 July ........... 948,939 1,248,260 1.32 372,105 458,681 1.23 272,479 314,354 1.15 304,355 475,225 1.56 336,944 Aug ........... 954,299 1,257,121 1.32 375,537 461,975 1.23 275,213 317,681 1.15 303,549 477,465 1.57 336,059 Sept .......... 957,635 1,257,095 1.31 371,479 462,377 1.24 277,498 319,510 1.15 308,658 475,208 1.54 341,461 Oct ............ 971,108 1,262,619 1.30 377,457 466,386 1.24 281,832 323,091 1.15 311,819 473,142 1.52 345,033 Nov p ......... 974,728 1,274,898 1.31 379,029 469,679 1.24 283,672 326,756 1.15 312,027 478,463 1.53 345,259
1 Annual data are averages of monthly not seasonally adjusted figures. 2 Seasonally adjusted, end of period. Inventories beginning January 1982 for manufacturing and December 1980 for wholesale and retail
trade are not comparable with earlier periods. 3 Inventory/sales ratio. Annual data are: beginning 1982, averages of monthly ratios; for 1965–81, ratio of December inventories to monthly
average sales for the year; and for earlier years, weighted averages. Monthly ratios are inventories at end of month to sales for month. 4 Food services included on SIC basis and excluded on NAICS basis. See last column for retail and food services sales. 5 Effective in 2001, data classified based on North American Industry Classification System (NAICS). Data on NAICS basis available begin-
ning 1992. Earlier data based on Standard Industrial Classification (SIC). Data include semiconductors. Note.—Earlier data are not strictly comparable with data beginning 1967 for wholesale and retail trade. Source: Department of Commerce, Bureau of the Census.
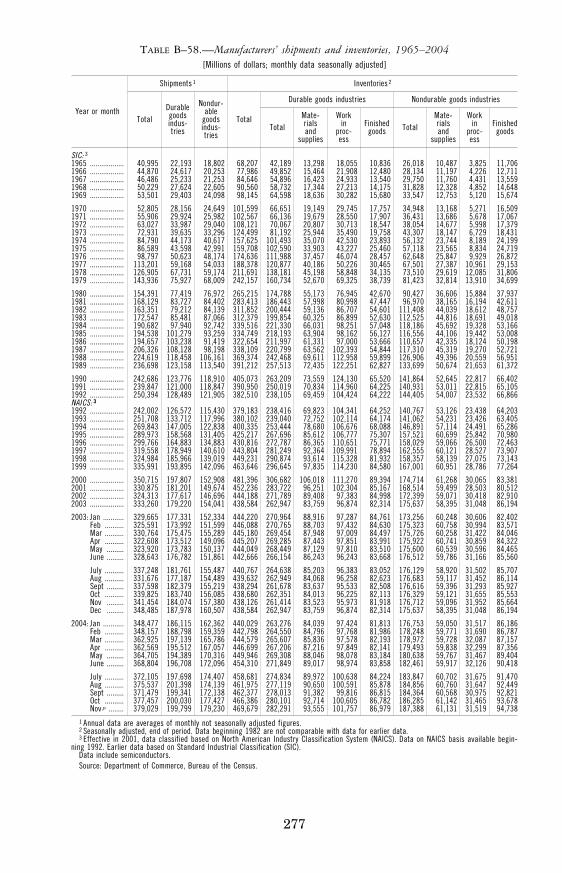
277
TABLE B–58.—Manufacturers’ shipments and inventories, 1965–2004 [Millions of dollars; monthly data seasonally adjusted]
Year or month
Shipments 1 Inventories 2
Total Durable goods indus- tries
Nondur- able
goods indus- tries
Total
Durable goods industries Nondurable goods industries
Total Mate- rials and
supplies
Work in
proc- ess
Finished goods Total
Mate- rials and
supplies
Work in
proc- ess
Finished goods
SIC: 3 1965 .................. 40,995 22,193 18,802 68,207 42,189 13,298 18,055 10,836 26,018 10,487 3,825 11,706 1966 .................. 44,870 24,617 20,253 77,986 49,852 15,464 21,908 12,480 28,134 11,197 4,226 12,711 1967 .................. 46,486 25,233 21,253 84,646 54,896 16,423 24,933 13,540 29,750 11,760 4,431 13,559 1968 .................. 50,229 27,624 22,605 90,560 58,732 17,344 27,213 14,175 31,828 12,328 4,852 14,648 1969 .................. 53,501 29,403 24,098 98,145 64,598 18,636 30,282 15,680 33,547 12,753 5,120 15,674
1970 .................. 52,805 28,156 24,649 101,599 66,651 19,149 29,745 17,757 34,948 13,168 5,271 16,509 1971 .................. 55,906 29,924 25,982 102,567 66,136 19,679 28,550 17,907 36,431 13,686 5,678 17,067 1972 .................. 63,027 33,987 29,040 108,121 70,067 20,807 30,713 18,547 38,054 14,677 5,998 17,379 1973 .................. 72,931 39,635 33,296 124,499 81,192 25,944 35,490 19,758 43,307 18,147 6,729 18,431 1974 .................. 84,790 44,173 40,617 157,625 101,493 35,070 42,530 23,893 56,132 23,744 8,189 24,199 1975 .................. 86,589 43,598 42,991 159,708 102,590 33,903 43,227 25,460 57,118 23,565 8,834 24,719 1976 .................. 98,797 50,623 48,174 174,636 111,988 37,457 46,074 28,457 62,648 25,847 9,929 26,872 1977 .................. 113,201 59,168 54,033 188,378 120,877 40,186 50,226 30,465 67,501 27,387 10,961 29,153 1978 .................. 126,905 67,731 59,174 211,691 138,181 45,198 58,848 34,135 73,510 29,619 12,085 31,806 1979 .................. 143,936 75,927 68,009 242,157 160,734 52,670 69,325 38,739 81,423 32,814 13,910 34,699
1980 .................. 154,391 77,419 76,972 265,215 174,788 55,173 76,945 42,670 90,427 36,606 15,884 37,937 1981 .................. 168,129 83,727 84,402 283,413 186,443 57,998 80,998 47,447 96,970 38,165 16,194 42,611 1982 .................. 163,351 79,212 84,139 311,852 200,444 59,136 86,707 54,601 111,408 44,039 18,612 48,757 1983 .................. 172,547 85,481 87,066 312,379 199,854 60,325 86,899 52,630 112,525 44,816 18,691 49,018 1984 .................. 190,682 97,940 92,742 339,516 221,330 66,031 98,251 57,048 118,186 45,692 19,328 53,166 1985 .................. 194,538 101,279 93,259 334,749 218,193 63,904 98,162 56,127 116,556 44,106 19,442 53,008 1986 .................. 194,657 103,238 91,419 322,654 211,997 61,331 97,000 53,666 110,657 42,335 18,124 50,198 1987 .................. 206,326 108,128 98,198 338,109 220,799 63,562 102,393 54,844 117,310 45,319 19,270 52,721 1988 .................. 224,619 118,458 106,161 369,374 242,468 69,611 112,958 59,899 126,906 49,396 20,559 56,951 1989 .................. 236,698 123,158 113,540 391,212 257,513 72,435 122,251 62,827 133,699 50,674 21,653 61,372
1990 .................. 242,686 123,776 118,910 405,073 263,209 73,559 124,130 65,520 141,864 52,645 22,817 66,402 1991 .................. 239,847 121,000 118,847 390,950 250,019 70,834 114,960 64,225 140,931 53,011 22,815 65,105 1992 .................. 250,394 128,489 121,905 382,510 238,105 69,459 104,424 64,222 144,405 54,007 23,532 66,866 NAICS: 3 1992 .................. 242,002 126,572 115,430 379,183 238,416 69,823 104,341 64,252 140,767 53,126 23,438 64,203 1993 .................. 251,708 133,712 117,996 380,102 239,040 72,752 102,114 64,174 141,062 54,231 23,426 63,405 1994 .................. 269,843 147,005 122,838 400,335 253,444 78,680 106,676 68,088 146,891 57,114 24,491 65,286 1995 .................. 289,973 158,568 131,405 425,217 267,696 85,612 106,777 75,307 157,521 60,699 25,842 70,980 1996 .................. 299,766 164,883 134,883 430,816 272,787 86,365 110,651 75,771 158,029 59,066 26,500 72,463 1997 .................. 319,558 178,949 140,610 443,804 281,249 92,364 109,991 78,894 162,555 60,121 28,527 73,907 1998 .................. 324,984 185,966 139,019 449,231 290,874 93,614 115,328 81,932 158,357 58,139 27,075 73,143 1999 .................. 335,991 193,895 142,096 463,646 296,645 97,835 114,230 84,580 167,001 60,951 28,786 77,264
2000 .................. 350,715 197,807 152,908 481,396 306,682 106,018 111,270 89,394 174,714 61,268 30,065 83,381 2001 .................. 330,875 181,201 149,674 452,236 283,722 96,251 102,304 85,167 168,514 59,499 28,503 80,512 2002 .................. 324,313 177,617 146,696 444,188 271,789 89,408 97,383 84,998 172,399 59,071 30,418 82,910 2003 .................. 333,260 179,220 154,041 438,584 262,947 83,759 96,874 82,314 175,637 58,395 31,048 86,194
2003: Jan ........... 329,665 177,331 152,334 444,220 270,964 88,916 97,287 84,761 173,256 60,248 30,606 82,402 Feb .......... 325,591 173,992 151,599 446,088 270,765 88,703 97,432 84,630 175,323 60,758 30,994 83,571 Mar .......... 330,764 175,475 155,289 445,180 269,454 87,948 97,009 84,497 175,726 60,258 31,422 84,046 Apr .......... 322,608 173,512 149,096 445,207 269,285 87,443 97,851 83,991 175,922 60,741 30,859 84,322 May ......... 323,920 173,783 150,137 444,049 268,449 87,129 97,810 83,510 175,600 60,539 30,596 84,465 June ......... 328,643 176,782 151,861 442,666 266,154 86,243 96,243 83,668 176,512 59,786 31,166 85,560
July .......... 337,248 181,761 155,487 440,767 264,638 85,203 96,383 83,052 176,129 58,920 31,502 85,707 Aug .......... 331,676 177,187 154,489 439,632 262,949 84,068 96,258 82,623 176,683 59,117 31,452 86,114 Sept ......... 337,598 182,379 155,219 438,294 261,678 83,637 95,533 82,508 176,616 59,396 31,293 85,927 Oct .......... 339,825 183,740 156,085 438,680 262,351 84,013 96,225 82,113 176,329 59,121 31,655 85,553 Nov ......... 341,454 184,074 157,380 438,126 261,414 83,523 95,973 81,918 176,712 59,096 31,952 85,664 Dec ......... 348,485 187,978 160,507 438,584 262,947 83,759 96,874 82,314 175,637 58,395 31,048 86,194
2004: Jan ........... 348,477 186,115 162,362 440,029 263,276 84,039 97,424 81,813 176,753 59,050 31,517 86,186 Feb .......... 348,157 188,798 159,359 442,798 264,550 84,796 97,768 81,986 178,248 59,771 31,690 86,787 Mar .......... 362,925 197,139 165,786 444,579 265,607 85,836 97,578 82,193 178,972 59,728 32,087 87,157 Apr .......... 362,569 195,512 167,057 446,699 267,206 87,216 97,849 82,141 179,493 59,838 32,299 87,356 May ......... 364,705 194,389 170,316 449,946 269,308 88,046 98,078 83,184 180,638 59,767 31,467 89,404 June ......... 368,804 196,708 172,096 454,310 271,849 89,017 98,974 83,858 182,461 59,917 32,126 90,418
July .......... 372,105 197,698 174,407 458,681 274,834 89,972 100,638 84,224 183,847 60,702 31,675 91,470 Aug .......... 375,537 201,398 174,139 461,975 277,119 90,650 100,591 85,878 184,856 60,760 31,647 92,449 Sept ......... 371,479 199,341 172,138 462,377 278,013 91,382 99,816 86,815 184,364 60,568 30,975 92,821 Oct .......... 377,457 200,030 177,427 466,386 280,101 92,714 100,605 86,782 186,285 61,142 31,465 93,678 Nov p ........ 379,029 199,799 179,230 469,679 282,291 93,555 101,757 86,979 187,388 61,131 31,519 94,738
1 Annual data are averages of monthly not seasonally adjusted figures. 2 Seasonally adjusted, end of period. Data beginning 1982 are not comparable with data for earlier data. 3 Effective in 2001, data classified based on North American Industry Classification System (NAICS). Data on NAICS basis available begin-
ning 1992. Earlier data based on Standard Industrial Classification (SIC). Data include semiconductors. Source: Department of Commerce, Bureau of the Census.
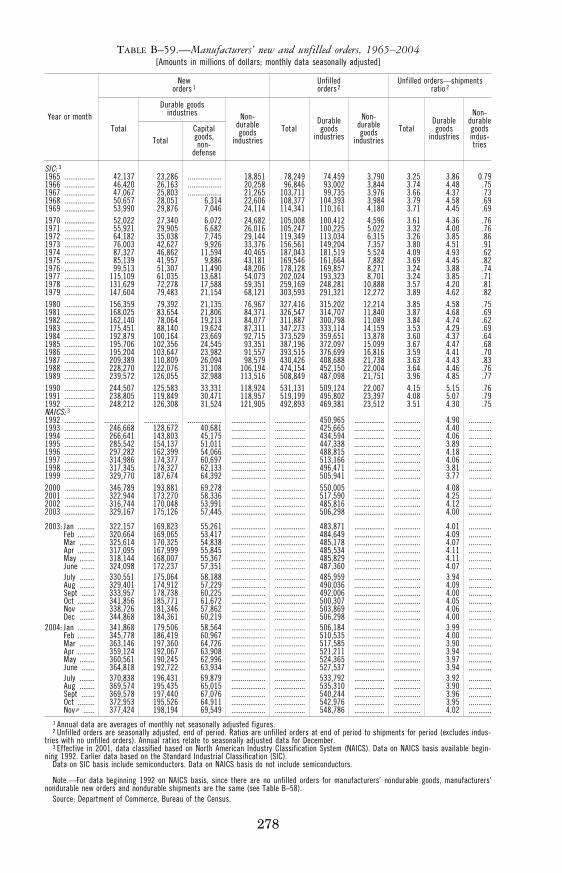
278
TABLE B–59.—Manufacturers’ new and unfilled orders, 1965–2004 [Amounts in millions of dollars; monthly data seasonally adjusted]
Year or month
New orders 1
Unfilled orders 2
Unfilled orders—shipments ratio 2
Total
Durable goods industries Non-
durable goods
industries Total
Durable goods
industries
Non- durable goods
industries Total
Durable goods
industries
Non- durable goods indus- tries Total
Capital goods, non-
defense
SIC: 3 1965 ................ 42,137 23,286 .................. 18,851 78,249 74,459 3,790 3.25 3.86 0.79 1966 ................ 46,420 26,163 .................. 20,258 96,846 93,002 3,844 3.74 4.48 .75 1967 ................ 47,067 25,803 .................. 21,265 103,711 99,735 3,976 3.66 4.37 .73 1968 ................ 50,657 28,051 6,314 22,606 108,377 104,393 3,984 3.79 4.58 .69 1969 ................ 53,990 29,876 7,046 24,114 114,341 110,161 4,180 3.71 4.45 .69 1970 ................ 52,022 27,340 6,072 24,682 105,008 100,412 4,596 3.61 4.36 .76 1971 ................ 55,921 29,905 6,682 26,016 105,247 100,225 5,022 3.32 4.00 .76 1972 ................ 64,182 35,038 7,745 29,144 119,349 113,034 6,315 3.26 3.85 .86 1973 ................ 76,003 42,627 9,926 33,376 156,561 149,204 7,357 3.80 4.51 .91 1974 ................ 87,327 46,862 11,594 40,465 187,043 181,519 5,524 4.09 4.93 .62 1975 ................ 85,139 41,957 9,886 43,181 169,546 161,664 7,882 3.69 4.45 .82 1976 ................ 99,513 51,307 11,490 48,206 178,128 169,857 8,271 3.24 3.88 .74 1977 ................ 115,109 61,035 13,681 54,073 202,024 193,323 8,701 3.24 3.85 .71 1978 ................ 131,629 72,278 17,588 59,351 259,169 248,281 10,888 3.57 4.20 .81 1979 ................ 147,604 79,483 21,154 68,121 303,593 291,321 12,272 3.89 4.62 .82 1980 ................ 156,359 79,392 21,135 76,967 327,416 315,202 12,214 3.85 4.58 .75 1981 ................ 168,025 83,654 21,806 84,371 326,547 314,707 11,840 3.87 4.68 .69 1982 ................ 162,140 78,064 19,213 84,077 311,887 300,798 11,089 3.84 4.74 .62 1983 ................ 175,451 88,140 19,624 87,311 347,273 333,114 14,159 3.53 4.29 .69 1984 ................ 192,879 100,164 23,669 92,715 373,529 359,651 13,878 3.60 4.37 .64 1985 ................ 195,706 102,356 24,545 93,351 387,196 372,097 15,099 3.67 4.47 .68 1986 ................ 195,204 103,647 23,982 91,557 393,515 376,699 16,816 3.59 4.41 .70 1987 ................ 209,389 110,809 26,094 98,579 430,426 408,688 21,738 3.63 4.43 .83 1988 ................ 228,270 122,076 31,108 106,194 474,154 452,150 22,004 3.64 4.46 .76 1989 ................ 239,572 126,055 32,988 113,516 508,849 487,098 21,751 3.96 4.85 .77 1990 ................ 244,507 125,583 33,331 118,924 531,131 509,124 22,007 4.15 5.15 .76 1991 ................ 238,805 119,849 30,471 118,957 519,199 495,802 23,397 4.08 5.07 .79 1992 ................ 248,212 126,308 31,524 121,905 492,893 469,381 23,512 3.51 4.30 .75 NAICS: 3 1992 ................ ................ .................. .................. .................. ................ 450,965 ................ .............. 4.90 ............1993 ................ 246,668 128,672 40,681 .................. ................ 425,665 ................ .............. 4.40 ............1994 ................ 266,641 143,803 45,175 .................. ................ 434,594 ................ .............. 4.06 ............1995 ................ 285,542 154,137 51,011 .................. ................ 447,338 ................ .............. 3.89 ............1996 ................ 297,282 162,399 54,066 .................. ................ 488,815 ................ .............. 4.18 ............1997 ................ 314,986 174,377 60,697 .................. ................ 513,166 ................ .............. 4.06 ............1998 ................ 317,345 178,327 62,133 .................. ................ 496,471 ................ .............. 3.81 ............1999 ................ 329,770 187,674 64,392 .................. ................ 505,941 ................ .............. 3.77 ............2000 ................ 346,789 193,881 69,278 .................. ................ 550,005 ................ .............. 4.08 ............2001 ................ 322,944 173,270 58,336 .................. ................ 517,590 ................ .............. 4.25 ............2002 ................ 316,744 170,048 53,991 .................. ................ 485,816 ................ .............. 4.12 ............2003 ................ 329,167 175,126 57,445 .................. ................ 506,298 ................ .............. 4.00 ............
2003: Jan ......... 322,157 169,823 55,261 .................. ................ 483,871 ................ .............. 4.01 ............Feb ......... 320,664 169,065 53,417 .................. ................ 484,649 ................ .............. 4.09 ............Mar ........ 325,614 170,325 54,838 .................. ................ 485,178 ................ .............. 4.07 ............Apr ......... 317,095 167,999 55,845 .................. ................ 485,534 ................ .............. 4.11 ............May ........ 318,144 168,007 55,367 .................. ................ 485,829 ................ .............. 4.11 ............June ....... 324,098 172,237 57,351 .................. ................ 487,360 ................ .............. 4.07 ............July ........ 330,551 175,064 58,188 .................. ................ 485,959 ................ .............. 3.94 ............Aug ........ 329,401 174,912 57,229 .................. ................ 490,036 ................ .............. 4.09 ............Sept ....... 333,957 178,738 60,225 .................. ................ 492,006 ................ .............. 4.00 ............Oct ......... 341,856 185,771 61,672 .................. ................ 500,307 ................ .............. 4.05 ............Nov ........ 338,726 181,346 57,862 .................. ................ 503,869 ................ .............. 4.06 ............Dec ........ 344,868 184,361 60,219 .................. ................ 506,298 ................ .............. 4.00 ............
2004: Jan ......... 341,868 179,506 58,564 .................. ................ 506,184 ................ .............. 3.99 ............Feb ......... 345,778 186,419 60,967 .................. ................ 510,535 ................ .............. 4.00 ............Mar ........ 363,146 197,360 64,726 .................. ................ 517,585 ................ .............. 3.90 ............Apr ......... 359,124 192,067 63,908 .................. ................ 521,211 ................ .............. 3.94 ............May ........ 360,561 190,245 62,996 .................. ................ 524,365 ................ .............. 3.97 ............June ....... 364,818 192,722 63,934 .................. ................ 527,537 ................ .............. 3.94 ............July ........ 370,838 196,431 69,879 .................. ................ 533,792 ................ .............. 3.92 ............Aug ........ 369,574 195,435 65,015 .................. ................ 535,310 ................ .............. 3.90 ............Sept ....... 369,578 197,440 67,076 .................. ................ 540,244 ................ .............. 3.96 ............Oct ......... 372,953 195,526 64,911 .................. ................ 542,976 ................ .............. 3.95 ............Nov p ...... 377,424 198,194 69,549 .................. ................ 548,786 ................ .............. 4.02 ............
1 Annual data are averages of monthly not seasonally adjusted figures. 2 Unfilled orders are seasonally adjusted, end of period. Ratios are unfilled orders at end of period to shipments for period (excludes indus-
tries with no unfilled orders). Annual ratios relate to seasonally adjusted data for December. 3 Effective in 2001, data classified based on North American Industry Classification System (NAICS). Data on NAICS basis available begin-
ning 1992. Earlier data based on the Standard Industrial Classification (SIC). Data on SIC basis include semiconductors. Data on NAICS basis do not include semiconductors.
Note.—For data beginning 1992 on NAICS basis, since there are no unfilled orders for manufacturers’ nondurable goods, manufacturers’ nondurable new orders and nondurable shipments are the same (see Table B–58).
Source: Department of Commerce, Bureau of the Census.
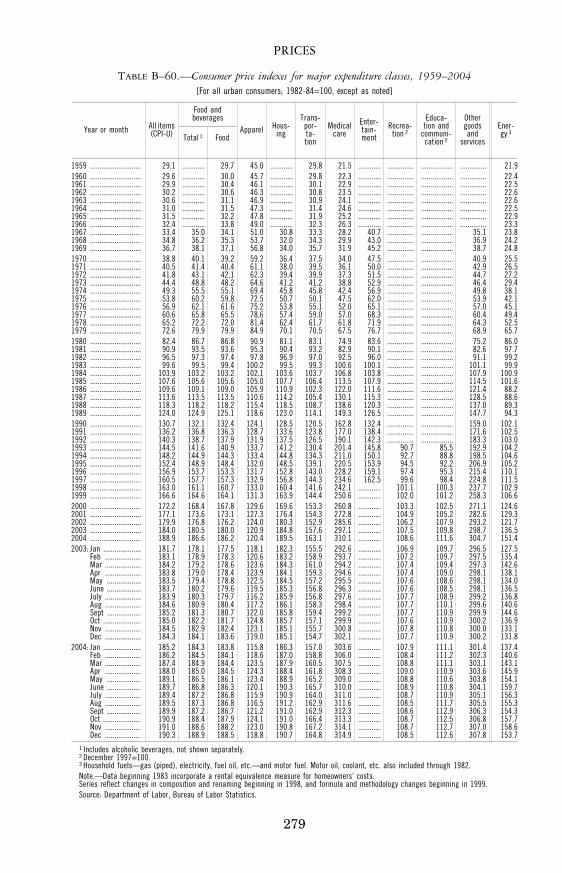
279
PRICES
TABLE B–60.—Consumer price indexes for major expenditure classes, 1959–2004 [For all urban consumers; 1982-84=100, except as noted]
Year or month All items (CPI-U)
Food and beverages
Apparel Hous-ing
Trans- por- ta- tion
Medical care
Enter- tain- ment
Recrea- tion 2
Educa- tion and
communi- cation 2
Other goods and
services
Ener- gy 3 Total 1 Food
1959 ........................... 29.1 ............ 29.7 45.0 ............ 29.8 21.5 ............ .............. ................. .............. 21.9 1960 ........................... 29.6 ............ 30.0 45.7 ............ 29.8 22.3 ............ .............. ................. .............. 22.4 1961 ........................... 29.9 ............ 30.4 46.1 ............ 30.1 22.9 ............ .............. ................. .............. 22.5 1962 ........................... 30.2 ............ 30.6 46.3 ............ 30.8 23.5 ............ .............. ................. .............. 22.6 1963 ........................... 30.6 ............ 31.1 46.9 ............ 30.9 24.1 ............ .............. ................. .............. 22.6 1964 ........................... 31.0 ............ 31.5 47.3 ............ 31.4 24.6 ............ .............. ................. .............. 22.5 1965 ........................... 31.5 ............ 32.2 47.8 ............ 31.9 25.2 ............ .............. ................. .............. 22.9 1966 ........................... 32.4 ............ 33.8 49.0 ............ 32.3 26.3 ............ .............. ................. .............. 23.3 1967 ........................... 33.4 35.0 34.1 51.0 30.8 33.3 28.2 40.7 .............. ................. 35.1 23.8 1968 ........................... 34.8 36.2 35.3 53.7 32.0 34.3 29.9 43.0 .............. ................. 36.9 24.2 1969 ........................... 36.7 38.1 37.1 56.8 34.0 35.7 31.9 45.2 .............. ................. 38.7 24.8 1970 ........................... 38.8 40.1 39.2 59.2 36.4 37.5 34.0 47.5 .............. ................. 40.9 25.5 1971 ........................... 40.5 41.4 40.4 61.1 38.0 39.5 36.1 50.0 .............. ................. 42.9 26.5 1972 ........................... 41.8 43.1 42.1 62.3 39.4 39.9 37.3 51.5 .............. ................. 44.7 27.2 1973 ........................... 44.4 48.8 48.2 64.6 41.2 41.2 38.8 52.9 .............. ................. 46.4 29.4 1974 ........................... 49.3 55.5 55.1 69.4 45.8 45.8 42.4 56.9 .............. ................. 49.8 38.1 1975 ........................... 53.8 60.2 59.8 72.5 50.7 50.1 47.5 62.0 .............. ................. 53.9 42.1 1976 ........................... 56.9 62.1 61.6 75.2 53.8 55.1 52.0 65.1 .............. ................. 57.0 45.1 1977 ........................... 60.6 65.8 65.5 78.6 57.4 59.0 57.0 68.3 .............. ................. 60.4 49.4 1978 ........................... 65.2 72.2 72.0 81.4 62.4 61.7 61.8 71.9 .............. ................. 64.3 52.5 1979 ........................... 72.6 79.9 79.9 84.9 70.1 70.5 67.5 76.7 .............. ................. 68.9 65.7 1980 ........................... 82.4 86.7 86.8 90.9 81.1 83.1 74.9 83.6 .............. ................. 75.2 86.0 1981 ........................... 90.9 93.5 93.6 95.3 90.4 93.2 82.9 90.1 .............. ................. 82.6 97.7 1982 ........................... 96.5 97.3 97.4 97.8 96.9 97.0 92.5 96.0 .............. ................. 91.1 99.2 1983 ........................... 99.6 99.5 99.4 100.2 99.5 99.3 100.6 100.1 .............. ................. 101.1 99.9 1984 ........................... 103.9 103.2 103.2 102.1 103.6 103.7 106.8 103.8 .............. ................. 107.9 100.9 1985 ........................... 107.6 105.6 105.6 105.0 107.7 106.4 113.5 107.9 .............. ................. 114.5 101.6 1986 ........................... 109.6 109.1 109.0 105.9 110.9 102.3 122.0 111.6 .............. ................. 121.4 88.2 1987 ........................... 113.6 113.5 113.5 110.6 114.2 105.4 130.1 115.3 .............. ................. 128.5 88.6 1988 ........................... 118.3 118.2 118.2 115.4 118.5 108.7 138.6 120.3 .............. ................. 137.0 89.3 1989 ........................... 124.0 124.9 125.1 118.6 123.0 114.1 149.3 126.5 .............. ................. 147.7 94.3 1990 ........................... 130.7 132.1 132.4 124.1 128.5 120.5 162.8 132.4 .............. ................. 159.0 102.1 1991 ........................... 136.2 136.8 136.3 128.7 133.6 123.8 177.0 138.4 .............. ................. 171.6 102.5 1992 ........................... 140.3 138.7 137.9 131.9 137.5 126.5 190.1 142.3 .............. ................. 183.3 103.0 1993 ........................... 144.5 141.6 140.9 133.7 141.2 130.4 201.4 145.8 90.7 85.5 192.9 104.2 1994 ........................... 148.2 144.9 144.3 133.4 144.8 134.3 211.0 150.1 92.7 88.8 198.5 104.6 1995 ........................... 152.4 148.9 148.4 132.0 148.5 139.1 220.5 153.9 94.5 92.2 206.9 105.2 1996 ........................... 156.9 153.7 153.3 131.7 152.8 143.0 228.2 159.1 97.4 95.3 215.4 110.1 1997 ........................... 160.5 157.7 157.3 132.9 156.8 144.3 234.6 162.5 99.6 98.4 224.8 111.5 1998 ........................... 163.0 161.1 160.7 133.0 160.4 141.6 242.1 ............ 101.1 100.3 237.7 102.9 1999 ........................... 166.6 164.6 164.1 131.3 163.9 144.4 250.6 ............ 102.0 101.2 258.3 106.6 2000 ........................... 172.2 168.4 167.8 129.6 169.6 153.3 260.8 ............ 103.3 102.5 271.1 124.6 2001 ........................... 177.1 173.6 173.1 127.3 176.4 154.3 272.8 ............ 104.9 105.2 282.6 129.3 2002 ........................... 179.9 176.8 176.2 124.0 180.3 152.9 285.6 ............ 106.2 107.9 293.2 121.7 2003 ........................... 184.0 180.5 180.0 120.9 184.8 157.6 297.1 ............ 107.5 109.8 298.7 136.5 2004 ........................... 188.9 186.6 186.2 120.4 189.5 163.1 310.1 ............ 108.6 111.6 304.7 151.4 2003: Jan .................... 181.7 178.1 177.5 118.1 182.3 155.5 292.6 ............ 106.9 109.7 296.5 127.5
Feb ................... 183.1 178.9 178.3 120.6 183.2 158.9 293.7 ............ 107.2 109.7 297.5 135.4 Mar ................... 184.2 179.2 178.6 123.6 184.3 161.0 294.2 ............ 107.4 109.4 297.3 142.6 Apr ................... 183.8 179.0 178.4 123.9 184.1 159.3 294.6 ............ 107.4 109.0 298.1 138.1 May .................. 183.5 179.4 178.8 122.5 184.5 157.2 295.5 ............ 107.6 108.6 298.1 134.0 June .................. 183.7 180.2 179.6 119.5 185.3 156.8 296.3 ............ 107.6 108.5 298.1 136.5 July ................... 183.9 180.3 179.7 116.2 185.9 156.8 297.6 ............ 107.7 108.9 299.2 136.8 Aug ................... 184.6 180.9 180.4 117.2 186.1 158.3 298.4 ............ 107.7 110.1 299.6 140.6 Sept .................. 185.2 181.3 180.7 122.0 185.8 159.4 299.2 ............ 107.7 110.9 299.9 144.6 Oct .................... 185.0 182.2 181.7 124.8 185.7 157.1 299.9 ............ 107.6 110.9 300.2 136.9 Nov ................... 184.5 182.9 182.4 123.1 185.1 155.7 300.8 ............ 107.8 110.8 300.0 133.1 Dec ................... 184.3 184.1 183.6 119.0 185.1 154.7 302.1 ............ 107.7 110.9 300.2 131.8
2004: Jan .................... 185.2 184.3 183.8 115.8 186.3 157.0 303.6 ............ 107.9 111.1 301.4 137.4 Feb ................... 186.2 184.5 184.1 118.6 187.0 158.8 306.0 ............ 108.4 111.2 302.3 140.6 Mar ................... 187.4 184.9 184.4 123.5 187.9 160.5 307.5 ............ 108.8 111.1 303.1 143.1 Apr ................... 188.0 185.0 184.5 124.3 188.4 161.8 308.3 ............ 109.0 110.9 303.6 145.9 May .................. 189.1 186.5 186.1 123.4 188.9 165.2 309.0 ............ 108.8 110.6 303.8 154.1 June .................. 189.7 186.8 186.3 120.1 190.3 165.7 310.0 ............ 108.9 110.8 304.1 159.7 July ................... 189.4 187.2 186.8 115.9 190.9 164.0 311.0 ............ 108.7 110.9 305.1 156.3 Aug ................... 189.5 187.3 186.8 116.5 191.2 162.9 311.6 ............ 108.5 111.7 305.5 155.3 Sept .................. 189.9 187.2 186.7 121.2 191.0 162.9 312.3 ............ 108.6 112.9 306.3 154.3 Oct .................... 190.9 188.4 187.9 124.1 191.0 166.4 313.3 ............ 108.7 112.5 306.8 157.7 Nov ................... 191.0 188.6 188.2 123.0 190.8 167.2 314.1 ............ 108.7 112.7 307.0 158.6 Dec ................... 190.3 188.9 188.5 118.8 190.7 164.8 314.9 ............ 108.5 112.6 307.8 153.7
1 Includes alcoholic beverages, not shown separately. 2 December 1997=100. 3 Household fuels—gas (piped), electricity, fuel oil, etc.—and motor fuel. Motor oil, coolant, etc. also included through 1982. Note.—Data beginning 1983 incorporate a rental equivalence measure for homeowners’ costs. Series reflect changes in composition and renaming beginning in 1998, and formula and methodology changes beginning in 1999. Source: Department of Labor, Bureau of Labor Statistics.
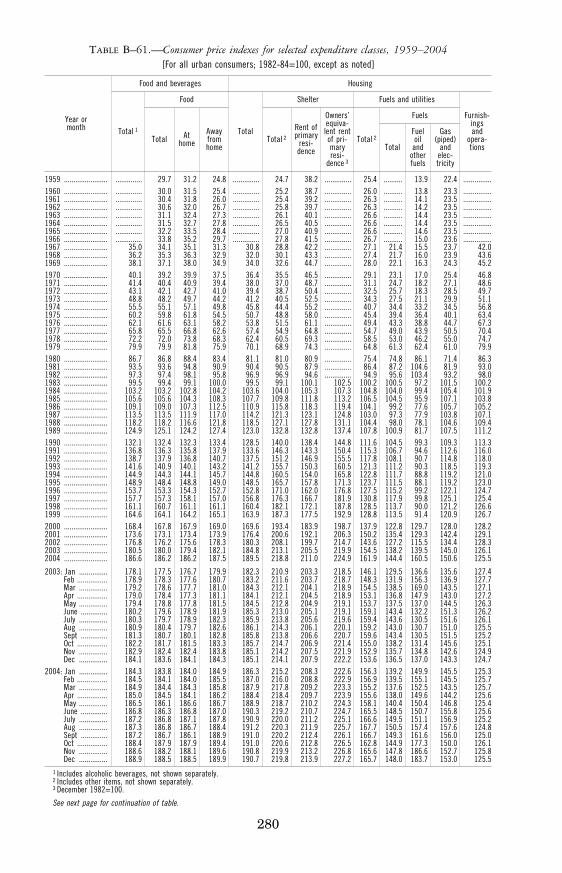
280
TABLE B–61.—Consumer price indexes for selected expenditure classes, 1959–2004 [For all urban consumers; 1982-84=100, except as noted]
Year or month
Food and beverages Housing
Total 1
Food
Total
Shelter Fuels and utilities
Furnish- ings and
opera- tions
Total At home
Away from home
Total 2 Rent of primary
resi- dence
Owners’ equiva-
lent rent of pri-mary resi-
dence 3
Total 2
Fuels
Total
Fuel oil
and other fuels
Gas (piped)
and elec- tricity
1959 ....................... .............. 29.7 31.2 24.8 .............. 24.7 38.2 .............. 25.4 .......... 13.9 22.4 ...............1960 ....................... .............. 30.0 31.5 25.4 .............. 25.2 38.7 .............. 26.0 .......... 13.8 23.3 ...............1961 ....................... .............. 30.4 31.8 26.0 .............. 25.4 39.2 .............. 26.3 .......... 14.1 23.5 ...............1962 ....................... .............. 30.6 32.0 26.7 .............. 25.8 39.7 .............. 26.3 .......... 14.2 23.5 ...............1963 ....................... .............. 31.1 32.4 27.3 .............. 26.1 40.1 .............. 26.6 .......... 14.4 23.5 ...............1964 ....................... .............. 31.5 32.7 27.8 .............. 26.5 40.5 .............. 26.6 .......... 14.4 23.5 ...............1965 ....................... .............. 32.2 33.5 28.4 .............. 27.0 40.9 .............. 26.6 .......... 14.6 23.5 ...............1966 ....................... .............. 33.8 35.2 29.7 .............. 27.8 41.5 .............. 26.7 .......... 15.0 23.6 ...............1967 ....................... 35.0 34.1 35.1 31.3 30.8 28.8 42.2 .............. 27.1 21.4 15.5 23.7 42.0 1968 ....................... 36.2 35.3 36.3 32.9 32.0 30.1 43.3 .............. 27.4 21.7 16.0 23.9 43.6 1969 ....................... 38.1 37.1 38.0 34.9 34.0 32.6 44.7 .............. 28.0 22.1 16.3 24.3 45.2 1970 ....................... 40.1 39.2 39.9 37.5 36.4 35.5 46.5 .............. 29.1 23.1 17.0 25.4 46.8 1971 ....................... 41.4 40.4 40.9 39.4 38.0 37.0 48.7 .............. 31.1 24.7 18.2 27.1 48.6 1972 ....................... 43.1 42.1 42.7 41.0 39.4 38.7 50.4 .............. 32.5 25.7 18.3 28.5 49.7 1973 ....................... 48.8 48.2 49.7 44.2 41.2 40.5 52.5 .............. 34.3 27.5 21.1 29.9 51.1 1974 ....................... 55.5 55.1 57.1 49.8 45.8 44.4 55.2 .............. 40.7 34.4 33.2 34.5 56.8 1975 ....................... 60.2 59.8 61.8 54.5 50.7 48.8 58.0 .............. 45.4 39.4 36.4 40.1 63.4 1976 ....................... 62.1 61.6 63.1 58.2 53.8 51.5 61.1 .............. 49.4 43.3 38.8 44.7 67.3 1977 ....................... 65.8 65.5 66.8 62.6 57.4 54.9 64.8 .............. 54.7 49.0 43.9 50.5 70.4 1978 ....................... 72.2 72.0 73.8 68.3 62.4 60.5 69.3 .............. 58.5 53.0 46.2 55.0 74.7 1979 ....................... 79.9 79.9 81.8 75.9 70.1 68.9 74.3 .............. 64.8 61.3 62.4 61.0 79.9 1980 ....................... 86.7 86.8 88.4 83.4 81.1 81.0 80.9 .............. 75.4 74.8 86.1 71.4 86.3 1981 ....................... 93.5 93.6 94.8 90.9 90.4 90.5 87.9 .............. 86.4 87.2 104.6 81.9 93.0 1982 ....................... 97.3 97.4 98.1 95.8 96.9 96.9 94.6 .............. 94.9 95.6 103.4 93.2 98.0 1983 ....................... 99.5 99.4 99.1 100.0 99.5 99.1 100.1 102.5 100.2 100.5 97.2 101.5 100.2 1984 ....................... 103.2 103.2 102.8 104.2 103.6 104.0 105.3 107.3 104.8 104.0 99.4 105.4 101.9 1985 ....................... 105.6 105.6 104.3 108.3 107.7 109.8 111.8 113.2 106.5 104.5 95.9 107.1 103.8 1986 ....................... 109.1 109.0 107.3 112.5 110.9 115.8 118.3 119.4 104.1 99.2 77.6 105.7 105.2 1987 ....................... 113.5 113.5 111.9 117.0 114.2 121.3 123.1 124.8 103.0 97.3 77.9 103.8 107.1 1988 ....................... 118.2 118.2 116.6 121.8 118.5 127.1 127.8 131.1 104.4 98.0 78.1 104.6 109.4 1989 ....................... 124.9 125.1 124.2 127.4 123.0 132.8 132.8 137.4 107.8 100.9 81.7 107.5 111.2 1990 ....................... 132.1 132.4 132.3 133.4 128.5 140.0 138.4 144.8 111.6 104.5 99.3 109.3 113.3 1991 ....................... 136.8 136.3 135.8 137.9 133.6 146.3 143.3 150.4 115.3 106.7 94.6 112.6 116.0 1992 ....................... 138.7 137.9 136.8 140.7 137.5 151.2 146.9 155.5 117.8 108.1 90.7 114.8 118.0 1993 ....................... 141.6 140.9 140.1 143.2 141.2 155.7 150.3 160.5 121.3 111.2 90.3 118.5 119.3 1994 ....................... 144.9 144.3 144.1 145.7 144.8 160.5 154.0 165.8 122.8 111.7 88.8 119.2 121.0 1995 ....................... 148.9 148.4 148.8 149.0 148.5 165.7 157.8 171.3 123.7 111.5 88.1 119.2 123.0 1996 ....................... 153.7 153.3 154.3 152.7 152.8 171.0 162.0 176.8 127.5 115.2 99.2 122.1 124.7 1997 ....................... 157.7 157.3 158.1 157.0 156.8 176.3 166.7 181.9 130.8 117.9 99.8 125.1 125.4 1998 ....................... 161.1 160.7 161.1 161.1 160.4 182.1 172.1 187.8 128.5 113.7 90.0 121.2 126.6 1999 ....................... 164.6 164.1 164.2 165.1 163.9 187.3 177.5 192.9 128.8 113.5 91.4 120.9 126.7 2000 ....................... 168.4 167.8 167.9 169.0 169.6 193.4 183.9 198.7 137.9 122.8 129.7 128.0 128.2 2001 ....................... 173.6 173.1 173.4 173.9 176.4 200.6 192.1 206.3 150.2 135.4 129.3 142.4 129.1 2002 ....................... 176.8 176.2 175.6 178.3 180.3 208.1 199.7 214.7 143.6 127.2 115.5 134.4 128.3 2003 ....................... 180.5 180.0 179.4 182.1 184.8 213.1 205.5 219.9 154.5 138.2 139.5 145.0 126.1 2004 ....................... 186.6 186.2 186.2 187.5 189.5 218.8 211.0 224.9 161.9 144.4 160.5 150.6 125.5
2003: Jan ............... 178.1 177.5 176.7 179.9 182.3 210.9 203.3 218.5 146.1 129.5 136.6 135.6 127.4 Feb ................ 178.9 178.3 177.6 180.7 183.2 211.6 203.7 218.7 148.3 131.9 156.3 136.9 127.7 Mar ............... 179.2 178.6 177.7 181.0 184.3 212.1 204.1 218.9 154.5 138.5 169.0 143.5 127.1 Apr ................ 179.0 178.4 177.3 181.1 184.1 212.1 204.5 218.9 153.1 136.8 147.9 143.0 127.2 May ............... 179.4 178.8 177.8 181.5 184.5 212.8 204.9 219.1 153.7 137.5 137.0 144.5 126.3 June .............. 180.2 179.6 178.9 181.9 185.3 213.0 205.1 219.1 159.1 143.4 132.2 151.3 126.2 July ............... 180.3 179.7 178.9 182.3 185.9 213.8 205.6 219.6 159.4 143.6 130.5 151.6 126.1 Aug ............... 180.9 180.4 179.7 182.6 186.1 214.3 206.1 220.1 159.2 143.0 130.7 151.0 125.5 Sept .............. 181.3 180.7 180.1 182.8 185.8 213.8 206.6 220.7 159.6 143.4 130.5 151.5 125.2 Oct ................ 182.2 181.7 181.5 183.3 185.7 214.7 206.9 221.4 155.0 138.2 131.4 145.6 125.1 Nov ............... 182.9 182.4 182.4 183.8 185.1 214.2 207.5 221.9 152.9 135.7 134.8 142.6 124.9 Dec ............... 184.1 183.6 184.1 184.3 185.1 214.1 207.9 222.2 153.6 136.5 137.0 143.3 124.7
2004: Jan ............... 184.3 183.8 184.0 184.9 186.3 215.2 208.3 222.6 156.3 139.2 149.9 145.5 125.3 Feb ................ 184.5 184.1 184.0 185.5 187.0 216.0 208.8 222.9 156.9 139.5 155.1 145.5 125.7 Mar ............... 184.9 184.4 184.3 185.8 187.9 217.8 209.2 223.3 155.2 137.6 152.5 143.5 125.7 Apr ................ 185.0 184.5 184.1 186.2 188.4 218.4 209.7 223.9 155.6 138.0 149.6 144.2 125.6 May ............... 186.5 186.1 186.6 186.7 188.9 218.7 210.2 224.3 158.1 140.4 150.4 146.8 125.4 June .............. 186.8 186.3 186.8 187.0 190.3 219.2 210.7 224.7 165.5 148.5 150.7 155.8 125.6 July ............... 187.2 186.8 187.1 187.8 190.9 220.0 211.2 225.1 166.6 149.5 151.1 156.9 125.2 Aug ............... 187.3 186.8 186.7 188.4 191.2 220.3 211.9 225.7 167.7 150.5 157.4 157.6 124.8 Sept .............. 187.2 186.7 186.1 188.9 191.0 220.2 212.4 226.1 166.7 149.3 161.6 156.0 125.0 Oct ................ 188.4 187.9 187.9 189.4 191.0 220.6 212.8 226.5 162.8 144.9 177.3 150.0 126.1 Nov ............... 188.6 188.2 188.1 189.6 190.8 219.9 213.2 226.8 165.6 147.8 186.6 152.7 125.8 Dec ............... 188.9 188.5 188.5 189.9 190.7 219.8 213.9 227.2 165.7 148.0 183.7 153.0 125.5
1 Includes alcoholic beverages, not shown separately. 2 Includes other items, not shown separately. 3 December 1982=100.
See next page for continuation of table.
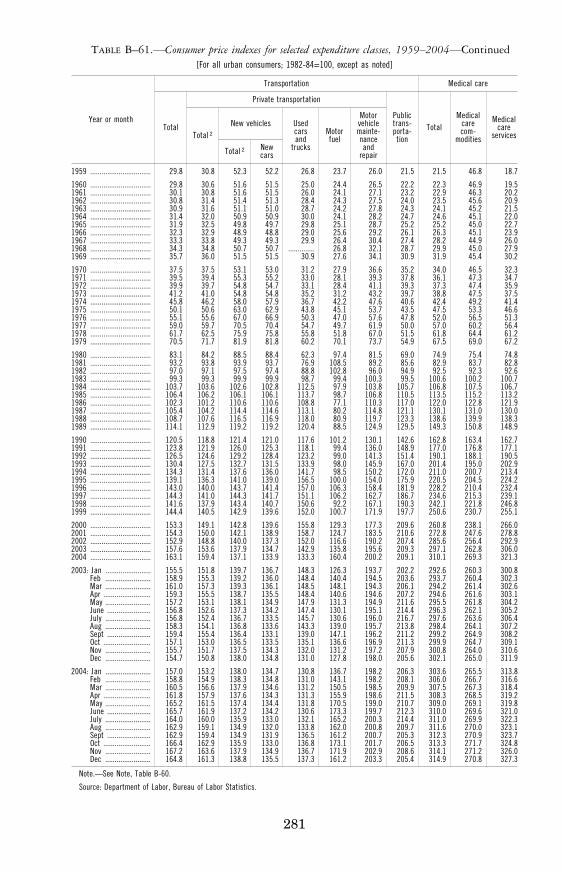
281
TABLE B–61.—Consumer price indexes for selected expenditure classes, 1959–2004—Continued [For all urban consumers; 1982-84=100, except as noted]
Year or month
Transportation Medical care
Total
Private transportation
Public trans- porta- tion
Total Medical
care com-
modities
Medical care
services Total 2 New vehicles Used
cars and
trucks
Motor fuel
Motor vehicle mainte- nance and
repair Total 2 New cars
1959 ................................ 29.8 30.8 52.3 52.2 26.8 23.7 26.0 21.5 21.5 46.8 18.7
1960 ................................ 29.8 30.6 51.6 51.5 25.0 24.4 26.5 22.2 22.3 46.9 19.5 1961 ................................ 30.1 30.8 51.6 51.5 26.0 24.1 27.1 23.2 22.9 46.3 20.2 1962 ................................ 30.8 31.4 51.4 51.3 28.4 24.3 27.5 24.0 23.5 45.6 20.9 1963 ................................ 30.9 31.6 51.1 51.0 28.7 24.2 27.8 24.3 24.1 45.2 21.5 1964 ................................ 31.4 32.0 50.9 50.9 30.0 24.1 28.2 24.7 24.6 45.1 22.0 1965 ................................ 31.9 32.5 49.8 49.7 29.8 25.1 28.7 25.2 25.2 45.0 22.7 1966 ................................ 32.3 32.9 48.9 48.8 29.0 25.6 29.2 26.1 26.3 45.1 23.9 1967 ................................ 33.3 33.8 49.3 49.3 29.9 26.4 30.4 27.4 28.2 44.9 26.0 1968 ................................ 34.3 34.8 50.7 50.7 .............. 26.8 32.1 28.7 29.9 45.0 27.9 1969 ................................ 35.7 36.0 51.5 51.5 30.9 27.6 34.1 30.9 31.9 45.4 30.2
1970 ................................ 37.5 37.5 53.1 53.0 31.2 27.9 36.6 35.2 34.0 46.5 32.3 1971 ................................ 39.5 39.4 55.3 55.2 33.0 28.1 39.3 37.8 36.1 47.3 34.7 1972 ................................ 39.9 39.7 54.8 54.7 33.1 28.4 41.1 39.3 37.3 47.4 35.9 1973 ................................ 41.2 41.0 54.8 54.8 35.2 31.2 43.2 39.7 38.8 47.5 37.5 1974 ................................ 45.8 46.2 58.0 57.9 36.7 42.2 47.6 40.6 42.4 49.2 41.4 1975 ................................ 50.1 50.6 63.0 62.9 43.8 45.1 53.7 43.5 47.5 53.3 46.6 1976 ................................ 55.1 55.6 67.0 66.9 50.3 47.0 57.6 47.8 52.0 56.5 51.3 1977 ................................ 59.0 59.7 70.5 70.4 54.7 49.7 61.9 50.0 57.0 60.2 56.4 1978 ................................ 61.7 62.5 75.9 75.8 55.8 51.8 67.0 51.5 61.8 64.4 61.2 1979 ................................ 70.5 71.7 81.9 81.8 60.2 70.1 73.7 54.9 67.5 69.0 67.2
1980 ................................ 83.1 84.2 88.5 88.4 62.3 97.4 81.5 69.0 74.9 75.4 74.8 1981 ................................ 93.2 93.8 93.9 93.7 76.9 108.5 89.2 85.6 82.9 83.7 82.8 1982 ................................ 97.0 97.1 97.5 97.4 88.8 102.8 96.0 94.9 92.5 92.3 92.6 1983 ................................ 99.3 99.3 99.9 99.9 98.7 99.4 100.3 99.5 100.6 100.2 100.7 1984 ................................ 103.7 103.6 102.6 102.8 112.5 97.9 103.8 105.7 106.8 107.5 106.7 1985 ................................ 106.4 106.2 106.1 106.1 113.7 98.7 106.8 110.5 113.5 115.2 113.2 1986 ................................ 102.3 101.2 110.6 110.6 108.8 77.1 110.3 117.0 122.0 122.8 121.9 1987 ................................ 105.4 104.2 114.4 114.6 113.1 80.2 114.8 121.1 130.1 131.0 130.0 1988 ................................ 108.7 107.6 116.5 116.9 118.0 80.9 119.7 123.3 138.6 139.9 138.3 1989 ................................ 114.1 112.9 119.2 119.2 120.4 88.5 124.9 129.5 149.3 150.8 148.9
1990 ................................ 120.5 118.8 121.4 121.0 117.6 101.2 130.1 142.6 162.8 163.4 162.7 1991 ................................ 123.8 121.9 126.0 125.3 118.1 99.4 136.0 148.9 177.0 176.8 177.1 1992 ................................ 126.5 124.6 129.2 128.4 123.2 99.0 141.3 151.4 190.1 188.1 190.5 1993 ................................ 130.4 127.5 132.7 131.5 133.9 98.0 145.9 167.0 201.4 195.0 202.9 1994 ................................ 134.3 131.4 137.6 136.0 141.7 98.5 150.2 172.0 211.0 200.7 213.4 1995 ................................ 139.1 136.3 141.0 139.0 156.5 100.0 154.0 175.9 220.5 204.5 224.2 1996 ................................ 143.0 140.0 143.7 141.4 157.0 106.3 158.4 181.9 228.2 210.4 232.4 1997 ................................ 144.3 141.0 144.3 141.7 151.1 106.2 162.7 186.7 234.6 215.3 239.1 1998 ................................ 141.6 137.9 143.4 140.7 150.6 92.2 167.1 190.3 242.1 221.8 246.8 1999 ................................ 144.4 140.5 142.9 139.6 152.0 100.7 171.9 197.7 250.6 230.7 255.1
2000 ................................ 153.3 149.1 142.8 139.6 155.8 129.3 177.3 209.6 260.8 238.1 266.0 2001 ................................ 154.3 150.0 142.1 138.9 158.7 124.7 183.5 210.6 272.8 247.6 278.8 2002 ................................ 152.9 148.8 140.0 137.3 152.0 116.6 190.2 207.4 285.6 256.4 292.9 2003 ................................ 157.6 153.6 137.9 134.7 142.9 135.8 195.6 209.3 297.1 262.8 306.0 2004 ................................ 163.1 159.4 137.1 133.9 133.3 160.4 200.2 209.1 310.1 269.3 321.3
2003: Jan ........................ 155.5 151.8 139.7 136.7 148.3 126.3 193.7 202.2 292.6 260.3 300.8 Feb ........................ 158.9 155.3 139.2 136.0 148.4 140.4 194.5 203.6 293.7 260.4 302.3 Mar ........................ 161.0 157.3 139.3 136.1 148.5 148.1 194.3 206.1 294.2 261.4 302.6 Apr ......................... 159.3 155.5 138.7 135.5 148.4 140.6 194.6 207.2 294.6 261.6 303.1 May ........................ 157.2 153.1 138.1 134.9 147.9 131.3 194.9 211.6 295.5 261.8 304.2 June ....................... 156.8 152.6 137.3 134.2 147.4 130.1 195.1 214.4 296.3 262.1 305.2 July ........................ 156.8 152.4 136.7 133.5 145.7 130.6 196.0 216.7 297.6 263.6 306.4 Aug ........................ 158.3 154.1 136.8 133.6 143.3 139.0 195.7 213.8 298.4 264.1 307.2 Sept ....................... 159.4 155.4 136.4 133.1 139.0 147.1 196.2 211.2 299.2 264.9 308.2 Oct ......................... 157.1 153.0 136.5 133.5 135.1 136.6 196.9 211.3 299.9 264.7 309.1 Nov ........................ 155.7 151.7 137.5 134.3 132.0 131.2 197.2 207.9 300.8 264.0 310.6 Dec ........................ 154.7 150.8 138.0 134.8 131.0 127.8 198.0 205.6 302.1 265.0 311.9
2004: Jan ........................ 157.0 153.2 138.0 134.7 130.8 136.7 198.2 206.3 303.6 265.5 313.8 Feb ........................ 158.8 154.9 138.3 134.8 131.0 143.1 198.2 208.1 306.0 266.7 316.6 Mar ........................ 160.5 156.6 137.9 134.6 131.2 150.5 198.5 209.9 307.5 267.3 318.4 Apr ......................... 161.8 157.9 137.6 134.3 131.3 155.9 198.6 211.5 308.3 268.5 319.2 May ........................ 165.2 161.5 137.4 134.4 131.8 170.5 199.0 210.7 309.0 269.1 319.8 June ....................... 165.7 161.9 137.2 134.2 130.6 173.3 199.7 212.3 310.0 269.6 321.0 July ........................ 164.0 160.0 135.9 133.0 132.1 165.2 200.3 214.4 311.0 269.9 322.3 Aug ........................ 162.9 159.1 134.9 132.0 133.8 162.0 200.8 209.7 311.6 270.0 323.1 Sept ....................... 162.9 159.4 134.9 131.9 136.5 161.2 200.7 205.3 312.3 270.9 323.7 Oct ......................... 166.4 162.9 135.9 133.0 136.8 173.1 201.7 206.5 313.3 271.7 324.8 Nov ........................ 167.2 163.6 137.9 134.9 136.7 171.9 202.9 208.6 314.1 271.2 326.0 Dec ........................ 164.8 161.3 138.8 135.5 137.3 161.2 203.3 205.4 314.9 270.8 327.3
Note.—See Note, Table B-60.
Source: Department of Labor, Bureau of Labor Statistics.
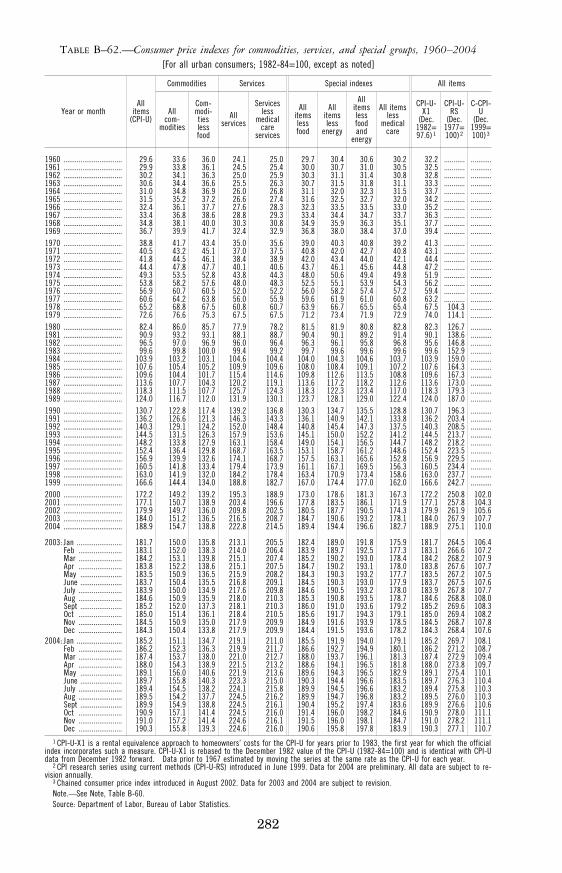
282
TABLE B–62.—Consumer price indexes for commodities, services, and special groups, 1960–2004 [For all urban consumers; 1982-84=100, except as noted]
Year or month All
items (CPI-U)
Commodities Services Special indexes All items
All com-
modities
Com- modi- ties less food
All services
Services less
medical care
services
All items less food
All items less
energy
All items less food and
energy
All items less
medical care
CPI-U- X1
(Dec. 1982= 97.6) 1
CPI-U- RS
(Dec. 1977= 100) 2
C-CPI- U
(Dec. 1999= 100) 3
1960 ............................... 29.6 33.6 36.0 24.1 25.0 29.7 30.4 30.6 30.2 32.2 ........... ...........1961 ............................... 29.9 33.8 36.1 24.5 25.4 30.0 30.7 31.0 30.5 32.5 ........... ...........1962 ............................... 30.2 34.1 36.3 25.0 25.9 30.3 31.1 31.4 30.8 32.8 ........... ...........1963 ............................... 30.6 34.4 36.6 25.5 26.3 30.7 31.5 31.8 31.1 33.3 ........... ...........1964 ............................... 31.0 34.8 36.9 26.0 26.8 31.1 32.0 32.3 31.5 33.7 ........... ...........1965 ............................... 31.5 35.2 37.2 26.6 27.4 31.6 32.5 32.7 32.0 34.2 ........... ...........1966 ............................... 32.4 36.1 37.7 27.6 28.3 32.3 33.5 33.5 33.0 35.2 ........... ...........1967 ............................... 33.4 36.8 38.6 28.8 29.3 33.4 34.4 34.7 33.7 36.3 ........... ...........1968 ............................... 34.8 38.1 40.0 30.3 30.8 34.9 35.9 36.3 35.1 37.7 ........... ...........1969 ............................... 36.7 39.9 41.7 32.4 32.9 36.8 38.0 38.4 37.0 39.4 ........... ...........1970 ............................... 38.8 41.7 43.4 35.0 35.6 39.0 40.3 40.8 39.2 41.3 ........... ...........1971 ............................... 40.5 43.2 45.1 37.0 37.5 40.8 42.0 42.7 40.8 43.1 ........... ...........1972 ............................... 41.8 44.5 46.1 38.4 38.9 42.0 43.4 44.0 42.1 44.4 ........... ...........1973 ............................... 44.4 47.8 47.7 40.1 40.6 43.7 46.1 45.6 44.8 47.2 ........... ...........1974 ............................... 49.3 53.5 52.8 43.8 44.3 48.0 50.6 49.4 49.8 51.9 ........... ...........1975 ............................... 53.8 58.2 57.6 48.0 48.3 52.5 55.1 53.9 54.3 56.2 ........... ...........1976 ............................... 56.9 60.7 60.5 52.0 52.2 56.0 58.2 57.4 57.2 59.4 ........... ...........1977 ............................... 60.6 64.2 63.8 56.0 55.9 59.6 61.9 61.0 60.8 63.2 ........... ...........1978 ............................... 65.2 68.8 67.5 60.8 60.7 63.9 66.7 65.5 65.4 67.5 104.3 ...........1979 ............................... 72.6 76.6 75.3 67.5 67.5 71.2 73.4 71.9 72.9 74.0 114.1 ...........1980 ............................... 82.4 86.0 85.7 77.9 78.2 81.5 81.9 80.8 82.8 82.3 126.7 ...........1981 ............................... 90.9 93.2 93.1 88.1 88.7 90.4 90.1 89.2 91.4 90.1 138.6 ...........1982 ............................... 96.5 97.0 96.9 96.0 96.4 96.3 96.1 95.8 96.8 95.6 146.8 ...........1983 ............................... 99.6 99.8 100.0 99.4 99.2 99.7 99.6 99.6 99.6 99.6 152.9 ...........1984 ............................... 103.9 103.2 103.1 104.6 104.4 104.0 104.3 104.6 103.7 103.9 159.0 ...........1985 ............................... 107.6 105.4 105.2 109.9 109.6 108.0 108.4 109.1 107.2 107.6 164.3 ...........1986 ............................... 109.6 104.4 101.7 115.4 114.6 109.8 112.6 113.5 108.8 109.6 167.3 ...........1987 ............................... 113.6 107.7 104.3 120.2 119.1 113.6 117.2 118.2 112.6 113.6 173.0 ...........1988 ............................... 118.3 111.5 107.7 125.7 124.3 118.3 122.3 123.4 117.0 118.3 179.3 ...........1989 ............................... 124.0 116.7 112.0 131.9 130.1 123.7 128.1 129.0 122.4 124.0 187.0 ...........1990 ............................... 130.7 122.8 117.4 139.2 136.8 130.3 134.7 135.5 128.8 130.7 196.3 ...........1991 ............................... 136.2 126.6 121.3 146.3 143.3 136.1 140.9 142.1 133.8 136.2 203.4 ...........1992 ............................... 140.3 129.1 124.2 152.0 148.4 140.8 145.4 147.3 137.5 140.3 208.5 ...........1993 ............................... 144.5 131.5 126.3 157.9 153.6 145.1 150.0 152.2 141.2 144.5 213.7 ...........1994 ............................... 148.2 133.8 127.9 163.1 158.4 149.0 154.1 156.5 144.7 148.2 218.2 ...........1995 ............................... 152.4 136.4 129.8 168.7 163.5 153.1 158.7 161.2 148.6 152.4 223.5 ...........1996 ............................... 156.9 139.9 132.6 174.1 168.7 157.5 163.1 165.6 152.8 156.9 229.5 ...........1997 ............................... 160.5 141.8 133.4 179.4 173.9 161.1 167.1 169.5 156.3 160.5 234.4 ...........1998 ............................... 163.0 141.9 132.0 184.2 178.4 163.4 170.9 173.4 158.6 163.0 237.7 ...........1999 ............................... 166.6 144.4 134.0 188.8 182.7 167.0 174.4 177.0 162.0 166.6 242.7 ...........2000 ............................... 172.2 149.2 139.2 195.3 188.9 173.0 178.6 181.3 167.3 172.2 250.8 102.0 2001 ............................... 177.1 150.7 138.9 203.4 196.6 177.8 183.5 186.1 171.9 177.1 257.8 104.3 2002 ............................... 179.9 149.7 136.0 209.8 202.5 180.5 187.7 190.5 174.3 179.9 261.9 105.6 2003 ............................... 184.0 151.2 136.5 216.5 208.7 184.7 190.6 193.2 178.1 184.0 267.9 107.7 2004 ............................... 188.9 154.7 138.8 222.8 214.5 189.4 194.4 196.6 182.7 188.9 275.1 110.0
2003: Jan ........................ 181.7 150.0 135.8 213.1 205.5 182.4 189.0 191.8 175.9 181.7 264.5 106.4 Feb ....................... 183.1 152.0 138.3 214.0 206.4 183.9 189.7 192.5 177.3 183.1 266.6 107.2 Mar ....................... 184.2 153.1 139.8 215.1 207.4 185.2 190.2 193.0 178.4 184.2 268.2 107.9 Apr ....................... 183.8 152.2 138.6 215.1 207.5 184.7 190.2 193.1 178.0 183.8 267.6 107.7 May ...................... 183.5 150.9 136.5 215.9 208.2 184.3 190.3 193.2 177.7 183.5 267.2 107.5 June ...................... 183.7 150.4 135.5 216.8 209.1 184.5 190.3 193.0 177.9 183.7 267.5 107.6 July ....................... 183.9 150.0 134.9 217.6 209.8 184.6 190.5 193.2 178.0 183.9 267.8 107.7 Aug ....................... 184.6 150.9 135.9 218.0 210.3 185.3 190.8 193.5 178.7 184.6 268.8 108.0 Sept ...................... 185.2 152.0 137.3 218.1 210.3 186.0 191.0 193.6 179.2 185.2 269.6 108.3 Oct ....................... 185.0 151.4 136.1 218.4 210.5 185.6 191.7 194.3 179.1 185.0 269.4 108.2 Nov ....................... 184.5 150.9 135.0 217.9 209.9 184.9 191.6 193.9 178.5 184.5 268.7 107.8 Dec ....................... 184.3 150.4 133.8 217.9 209.9 184.4 191.5 193.6 178.2 184.3 268.4 107.6
2004: Jan ........................ 185.2 151.1 134.7 219.1 211.0 185.5 191.9 194.0 179.1 185.2 269.7 108.1 Feb ....................... 186.2 152.3 136.3 219.9 211.7 186.6 192.7 194.9 180.1 186.2 271.2 108.7 Mar ....................... 187.4 153.7 138.0 221.0 212.7 188.0 193.7 196.1 181.3 187.4 272.9 109.4 Apr ....................... 188.0 154.3 138.9 221.5 213.2 188.6 194.1 196.5 181.8 188.0 273.8 109.7 May ...................... 189.1 156.0 140.6 221.9 213.6 189.6 194.3 196.5 182.9 189.1 275.4 110.1 June ...................... 189.7 155.8 140.3 223.3 215.0 190.3 194.4 196.6 183.5 189.7 276.3 110.4 July ....................... 189.4 154.5 138.2 224.1 215.8 189.9 194.5 196.6 183.2 189.4 275.8 110.3 Aug ....................... 189.5 154.2 137.7 224.5 216.2 189.9 194.7 196.8 183.2 189.5 276.0 110.3 Sept ...................... 189.9 154.9 138.8 224.5 216.1 190.4 195.2 197.4 183.6 189.9 276.6 110.6 Oct ....................... 190.9 157.1 141.4 224.5 216.0 191.4 196.0 198.2 184.6 190.9 278.0 111.1 Nov ....................... 191.0 157.2 141.4 224.6 216.1 191.5 196.0 198.1 184.7 191.0 278.2 111.1 Dec ....................... 190.3 155.8 139.3 224.6 216.0 190.6 195.8 197.8 183.9 190.3 277.1 110.7
1 CPI-U-X1 is a rental equivalence approach to homeowners’ costs for the CPI-U for years prior to 1983, the first year for which the official index incorporates such a measure. CPI-U-X1 is rebased to the December 1982 value of the CPI-U (1982-84=100) and is identical with CPI-U data from December 1982 forward. Data prior to 1967 estimated by moving the series at the same rate as the CPI-U for each year.
2 CPI research series using current methods (CPI-U-RS) introduced in June 1999. Data for 2004 are preliminary. All data are subject to re-vision annually.
3 Chained consumer price index introduced in August 2002. Data for 2003 and 2004 are subject to revision. Note.—See Note, Table B-60. Source: Department of Labor, Bureau of Labor Statistics.
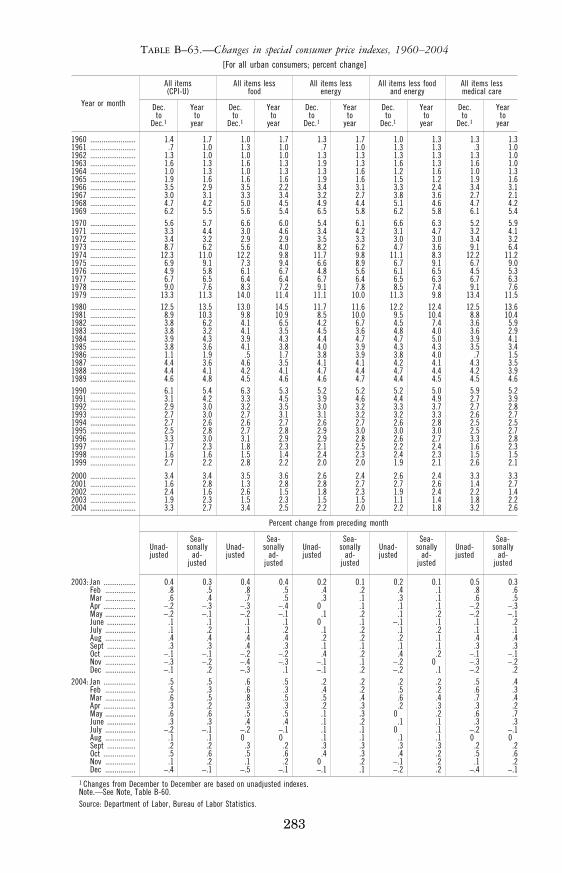
283
TABLE B–63.—Changes in special consumer price indexes, 1960–2004 [For all urban consumers; percent change]
Year or month
All items (CPI-U)
All items less food
All items less energy
All items less food and energy
All items less medical care
Dec. to
Dec.1
Year to
year
Dec. to
Dec.1
Year to
year
Dec. to
Dec.1
Year to
year
Dec. to
Dec.1
Year to
year
Dec. to
Dec.1
Year to
year
1960 ........................ 1 .4 1 .7 1 .0 1 .7 1 .3 1 .7 1 .0 1 .3 1 .3 1 .3 1961 ........................ .7 1 .0 1 .3 1 .0 .7 1 .0 1 .3 1 .3 .3 1 .0 1962 ........................ 1 .3 1 .0 1 .0 1 .0 1 .3 1 .3 1 .3 1 .3 1 .3 1 .0 1963 ........................ 1 .6 1 .3 1 .6 1 .3 1 .9 1 .3 1 .6 1 .3 1 .6 1 .0 1964 ........................ 1 .0 1 .3 1 .0 1 .3 1 .3 1 .6 1 .2 1 .6 1 .0 1 .3 1965 ........................ 1 .9 1 .6 1 .6 1 .6 1 .9 1 .6 1 .5 1 .2 1 .9 1 .6 1966 ........................ 3 .5 2 .9 3 .5 2 .2 3 .4 3 .1 3 .3 2 .4 3 .4 3 .1 1967 ........................ 3 .0 3 .1 3 .3 3 .4 3 .2 2 .7 3 .8 3 .6 2 .7 2 .1 1968 ........................ 4 .7 4 .2 5 .0 4 .5 4 .9 4 .4 5 .1 4 .6 4 .7 4 .2 1969 ........................ 6 .2 5 .5 5 .6 5 .4 6 .5 5 .8 6 .2 5 .8 6 .1 5 .4 1970 ........................ 5 .6 5 .7 6 .6 6 .0 5 .4 6 .1 6 .6 6 .3 5 .2 5 .9 1971 ........................ 3 .3 4 .4 3 .0 4 .6 3 .4 4 .2 3 .1 4 .7 3 .2 4 .1 1972 ........................ 3 .4 3 .2 2 .9 2 .9 3 .5 3 .3 3 .0 3 .0 3 .4 3 .2 1973 ........................ 8 .7 6 .2 5 .6 4 .0 8 .2 6 .2 4 .7 3 .6 9 .1 6 .4 1974 ........................ 12 .3 11 .0 12 .2 9 .8 11 .7 9 .8 11 .1 8 .3 12 .2 11 .2 1975 ........................ 6 .9 9 .1 7 .3 9 .4 6 .6 8 .9 6 .7 9 .1 6 .7 9 .0 1976 ........................ 4 .9 5 .8 6 .1 6 .7 4 .8 5 .6 6 .1 6 .5 4 .5 5 .3 1977 ........................ 6 .7 6 .5 6 .4 6 .4 6 .7 6 .4 6 .5 6 .3 6 .7 6 .3 1978 ........................ 9 .0 7 .6 8 .3 7 .2 9 .1 7 .8 8 .5 7 .4 9 .1 7 .6 1979 ........................ 13 .3 11 .3 14 .0 11 .4 11 .1 10 .0 11 .3 9 .8 13 .4 11 .5 1980 ........................ 12 .5 13 .5 13 .0 14 .5 11 .7 11 .6 12 .2 12 .4 12 .5 13 .6 1981 ........................ 8 .9 10 .3 9 .8 10 .9 8 .5 10 .0 9 .5 10 .4 8 .8 10 .4 1982 ........................ 3 .8 6 .2 4 .1 6 .5 4 .2 6 .7 4 .5 7 .4 3 .6 5 .9 1983 ........................ 3 .8 3 .2 4 .1 3 .5 4 .5 3 .6 4 .8 4 .0 3 .6 2 .9 1984 ........................ 3 .9 4 .3 3 .9 4 .3 4 .4 4 .7 4 .7 5 .0 3 .9 4 .1 1985 ........................ 3 .8 3 .6 4 .1 3 .8 4 .0 3 .9 4 .3 4 .3 3 .5 3 .4 1986 ........................ 1 .1 1 .9 .5 1 .7 3 .8 3 .9 3 .8 4 .0 .7 1 .5 1987 ........................ 4 .4 3 .6 4 .6 3 .5 4 .1 4 .1 4 .2 4 .1 4 .3 3 .5 1988 ........................ 4 .4 4 .1 4 .2 4 .1 4 .7 4 .4 4 .7 4 .4 4 .2 3 .9 1989 ........................ 4 .6 4 .8 4 .5 4 .6 4 .6 4 .7 4 .4 4 .5 4 .5 4 .6 1990 ........................ 6 .1 5 .4 6 .3 5 .3 5 .2 5 .2 5 .2 5 .0 5 .9 5 .2 1991 ........................ 3 .1 4 .2 3 .3 4 .5 3 .9 4 .6 4 .4 4 .9 2 .7 3 .9 1992 ........................ 2 .9 3 .0 3 .2 3 .5 3 .0 3 .2 3 .3 3 .7 2 .7 2 .8 1993 ........................ 2 .7 3 .0 2 .7 3 .1 3 .1 3 .2 3 .2 3 .3 2 .6 2 .7 1994 ........................ 2 .7 2 .6 2 .6 2 .7 2 .6 2 .7 2 .6 2 .8 2 .5 2 .5 1995 ........................ 2 .5 2 .8 2 .7 2 .8 2 .9 3 .0 3 .0 3 .0 2 .5 2 .7 1996 ........................ 3 .3 3 .0 3 .1 2 .9 2 .9 2 .8 2 .6 2 .7 3 .3 2 .8 1997 ........................ 1 .7 2 .3 1 .8 2 .3 2 .1 2 .5 2 .2 2 .4 1 .6 2 .3 1998 ........................ 1 .6 1 .6 1 .5 1 .4 2 .4 2 .3 2 .4 2 .3 1 .5 1 .5 1999 ........................ 2 .7 2 .2 2 .8 2 .2 2 .0 2 .0 1 .9 2 .1 2 .6 2 .1
2000 ........................ 3 .4 3 .4 3 .5 3 .6 2 .6 2 .4 2 .6 2 .4 3 .3 3 .3 2001 ........................ 1 .6 2 .8 1 .3 2 .8 2 .8 2 .7 2 .7 2 .6 1 .4 2 .7 2002 ........................ 2 .4 1 .6 2 .6 1 .5 1 .8 2 .3 1 .9 2 .4 2 .2 1 .4 2003 ........................ 1 .9 2 .3 1 .5 2 .3 1 .5 1 .5 1 .1 1 .4 1 .8 2 .2 2004 ........................ 3 .3 2 .7 3 .4 2 .5 2 .2 2 .0 2 .2 1 .8 3 .2 2 .6
Percent change from preceding month
Unad- justed
Sea- sonally
ad- justed
Unad- justed
Sea- sonally
ad- justed
Unad- justed
Sea- sonally
ad- justed
Unad- justed
Sea- sonally
ad- justed
Unad- justed
Sea- sonally
ad- justed
2003: Jan ................. 0 .4 0 .3 0 .4 0 .4 0 .2 0 .1 0 .2 0 .1 0 .5 0 .3 Feb ................ .8 .5 .8 .5 .4 .2 .4 .1 .8 .6 Mar ................ .6 .4 .7 .5 .3 .1 .3 .1 .6 .5 Apr ................. − .2 − .3 − .3 − .4 0 .1 .1 .1 − .2 − .3 May ................ − .2 − .1 − .2 − .1 .1 .2 .1 .2 − .2 − .1 June ............... .1 .1 .1 .1 0 .1 − .1 .1 .1 .2 July ................ .1 .2 .1 .2 .1 .2 .1 .2 .1 .1 Aug ................ .4 .4 .4 .4 .2 .2 .2 .1 .4 .4 Sept ............... .3 .3 .4 .3 .1 .1 .1 .1 .3 .3 Oct ................. − .1 − .1 − .2 − .2 .4 .2 .4 .2 − .1 − .1 Nov ................ − .3 − .2 − .4 − .3 − .1 .1 − .2 0 − .3 − .2 Dec ................ − .1 .2 − .3 .1 − .1 .2 − .2 .1 − .2 .2
2004: Jan ................. .5 .5 .6 .5 .2 .2 .2 .2 .5 .4 Feb ................ .5 .3 .6 .3 .4 .2 .5 .2 .6 .3 Mar ................ .6 .5 .8 .5 .5 .4 .6 .4 .7 .4 Apr ................. .3 .2 .3 .3 .2 .3 .2 .3 .3 .2 May ................ .6 .6 .5 .5 .1 .3 0 .2 .6 .7 June ............... .3 .3 .4 .4 .1 .2 .1 .1 .3 .3 July ................ − .2 − .1 − .2 − .1 .1 .1 0 .1 − .2 − .1 Aug ................ .1 .1 0 0 .1 .1 .1 .1 0 0 Sept ............... .2 .2 .3 .2 .3 .3 .3 .3 .2 .2 Oct ................. .5 .6 .5 .6 .4 .3 .4 .2 .5 .6 Nov ................ .1 .2 .1 .2 0 .2 − .1 .2 .1 .2 Dec ................ − .4 − .1 − .5 − .1 − .1 .1 − .2 .2 − .4 − .1
1 Changes from December to December are based on unadjusted indexes. Note.—See Note, Table B-60. Source: Department of Labor, Bureau of Labor Statistics.
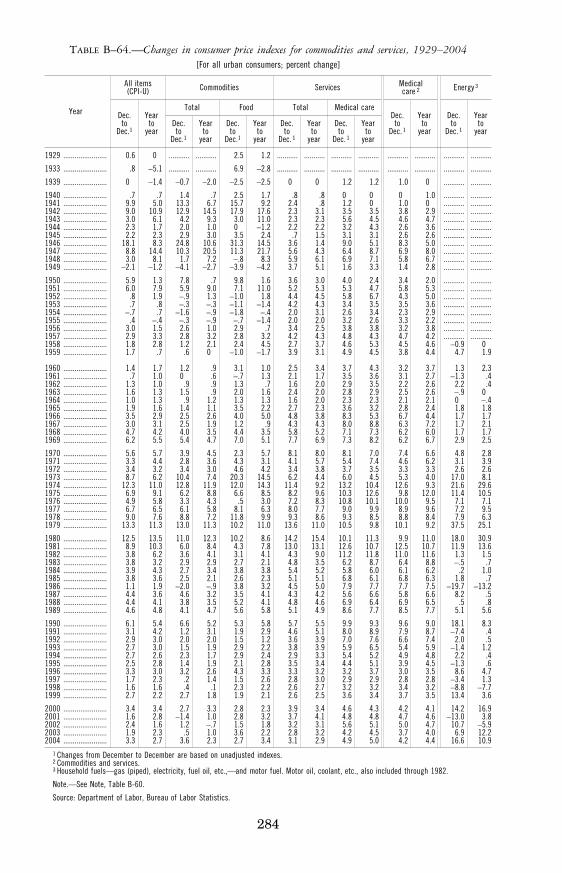
284
TABLE B–64.—Changes in consumer price indexes for commodities and services, 1929–2004 [For all urban consumers; percent change]
Year
All items (CPI-U) Commodities Services Medical
care 2 Energy 3
Dec. to
Dec.1
Year to
year
Total Food Total Medical care Dec. to
Dec. 1
Year to
year
Dec. to
Dec. 1
Year to
year Dec. to
Dec.1
Year to
year
Dec. to
Dec.1
Year to
year
Dec. to
Dec. 1
Year to
year
Dec. to
Dec. 1
Year to
year
1929 ....................... 0 .6 0 ........... ........... 2 .5 1 .2 ........... ........... ........... ........... ........... ........... ........... ...........
1933 ....................... .8 −5 .1 ........... ........... 6 .9 −2 .8 ........... ........... ........... ........... ........... ........... ........... ...........
1939 ....................... 0 −1 .4 −0 .7 −2 .0 −2 .5 −2 .5 0 0 1 .2 1 .2 1 .0 0 ........... ...........
1940 ....................... .7 .7 1 .4 .7 2 .5 1 .7 .8 .8 0 0 0 1 .0 ........... ...........1941 ....................... 9 .9 5 .0 13 .3 6 .7 15 .7 9 .2 2 .4 .8 1 .2 0 1 .0 0 ........... ...........1942 ....................... 9 .0 10 .9 12 .9 14 .5 17 .9 17 .6 2 .3 3 .1 3 .5 3 .5 3 .8 2 .9 ........... ...........1943 ....................... 3 .0 6 .1 4 .2 9 .3 3 .0 11 .0 2 .3 2 .3 5 .6 4 .5 4 .6 4 .7 ........... ...........1944 ....................... 2 .3 1 .7 2 .0 1 .0 0 −1 .2 2 .2 2 .2 3 .2 4 .3 2 .6 3 .6 ........... ...........1945 ....................... 2 .2 2 .3 2 .9 3 .0 3 .5 2 .4 .7 1 .5 3 .1 3 .1 2 .6 2 .6 ........... ...........1946 ....................... 18 .1 8 .3 24 .8 10 .6 31 .3 14 .5 3 .6 1 .4 9 .0 5 .1 8 .3 5 .0 ........... ...........1947 ....................... 8 .8 14 .4 10 .3 20 .5 11 .3 21 .7 5 .6 4 .3 6 .4 8 .7 6 .9 8 .0 ........... ...........1948 ....................... 3 .0 8 .1 1 .7 7 .2 − .8 8 .3 5 .9 6 .1 6 .9 7 .1 5 .8 6 .7 ........... ...........1949 ....................... −2 .1 −1 .2 −4 .1 −2 .7 −3 .9 −4 .2 3 .7 5 .1 1 .6 3 .3 1 .4 2 .8 ........... ...........
1950 ....................... 5 .9 1 .3 7 .8 .7 9 .8 1 .6 3 .6 3 .0 4 .0 2 .4 3 .4 2 .0 ........... ...........1951 ....................... 6 .0 7 .9 5 .9 9 .0 7 .1 11 .0 5 .2 5 .3 5 .3 4 .7 5 .8 5 .3 ........... ...........1952 ....................... .8 1 .9 − .9 1 .3 −1 .0 1 .8 4 .4 4 .5 5 .8 6 .7 4 .3 5 .0 ........... ...........1953 ....................... .7 .8 − .3 − .3 −1 .1 −1 .4 4 .2 4 .3 3 .4 3 .5 3 .5 3 .6 ........... ...........1954 ....................... − .7 .7 −1 .6 − .9 −1 .8 − .4 2 .0 3 .1 2 .6 3 .4 2 .3 2 .9 ........... ...........1955 ....................... .4 − .4 − .3 − .9 − .7 −1 .4 2 .0 2 .0 3 .2 2 .6 3 .3 2 .2 ........... ...........1956 ....................... 3 .0 1 .5 2 .6 1 .0 2 .9 .7 3 .4 2 .5 3 .8 3 .8 3 .2 3 .8 ........... ...........1957 ....................... 2 .9 3 .3 2 .8 3 .2 2 .8 3 .2 4 .2 4 .3 4 .8 4 .3 4 .7 4 .2 ........... ...........1958 ....................... 1 .8 2 .8 1 .2 2 .1 2 .4 4 .5 2 .7 3 .7 4 .6 5 .3 4 .5 4 .6 −0 .9 0 1959 ....................... 1 .7 .7 .6 0 −1 .0 −1 .7 3 .9 3 .1 4 .9 4 .5 3 .8 4 .4 4 .7 1 .9
1960 ....................... 1 .4 1 .7 1 .2 .9 3 .1 1 .0 2 .5 3 .4 3 .7 4 .3 3 .2 3 .7 1 .3 2 .3 1961 ....................... .7 1 .0 0 .6 − .7 1 .3 2 .1 1 .7 3 .5 3 .6 3 .1 2 .7 −1 .3 .4 1962 ....................... 1 .3 1 .0 .9 .9 1 .3 .7 1 .6 2 .0 2 .9 3 .5 2 .2 2 .6 2 .2 .4 1963 ....................... 1 .6 1 .3 1 .5 .9 2 .0 1 .6 2 .4 2 .0 2 .8 2 .9 2 .5 2 .6 − .9 0 1964 ....................... 1 .0 1 .3 .9 1 .2 1 .3 1 .3 1 .6 2 .0 2 .3 2 .3 2 .1 2 .1 0 − .4 1965 ....................... 1 .9 1 .6 1 .4 1 .1 3 .5 2 .2 2 .7 2 .3 3 .6 3 .2 2 .8 2 .4 1 .8 1 .8 1966 ....................... 3 .5 2 .9 2 .5 2 .6 4 .0 5 .0 4 .8 3 .8 8 .3 5 .3 6 .7 4 .4 1 .7 1 .7 1967 ....................... 3 .0 3 .1 2 .5 1 .9 1 .2 .9 4 .3 4 .3 8 .0 8 .8 6 .3 7 .2 1 .7 2 .1 1968 ....................... 4 .7 4 .2 4 .0 3 .5 4 .4 3 .5 5 .8 5 .2 7 .1 7 .3 6 .2 6 .0 1 .7 1 .7 1969 ....................... 6 .2 5 .5 5 .4 4 .7 7 .0 5 .1 7 .7 6 .9 7 .3 8 .2 6 .2 6 .7 2 .9 2 .5
1970 ....................... 5 .6 5 .7 3 .9 4 .5 2 .3 5 .7 8 .1 8 .0 8 .1 7 .0 7 .4 6 .6 4 .8 2 .8 1971 ....................... 3 .3 4 .4 2 .8 3 .6 4 .3 3 .1 4 .1 5 .7 5 .4 7 .4 4 .6 6 .2 3 .1 3 .9 1972 ....................... 3 .4 3 .2 3 .4 3 .0 4 .6 4 .2 3 .4 3 .8 3 .7 3 .5 3 .3 3 .3 2 .6 2 .6 1973 ....................... 8 .7 6 .2 10 .4 7 .4 20 .3 14 .5 6 .2 4 .4 6 .0 4 .5 5 .3 4 .0 17 .0 8 .1 1974 ....................... 12 .3 11 .0 12 .8 11 .9 12 .0 14 .3 11 .4 9 .2 13 .2 10 .4 12 .6 9 .3 21 .6 29 .6 1975 ....................... 6 .9 9 .1 6 .2 8 .8 6 .6 8 .5 8 .2 9 .6 10 .3 12 .6 9 .8 12 .0 11 .4 10 .5 1976 ....................... 4 .9 5 .8 3 .3 4 .3 .5 3 .0 7 .2 8 .3 10 .8 10 .1 10 .0 9 .5 7 .1 7 .1 1977 ....................... 6 .7 6 .5 6 .1 5 .8 8 .1 6 .3 8 .0 7 .7 9 .0 9 .9 8 .9 9 .6 7 .2 9 .5 1978 ....................... 9 .0 7 .6 8 .8 7 .2 11 .8 9 .9 9 .3 8 .6 9 .3 8 .5 8 .8 8 .4 7 .9 6 .3 1979 ....................... 13 .3 11 .3 13 .0 11 .3 10 .2 11 .0 13 .6 11 .0 10 .5 9 .8 10 .1 9 .2 37 .5 25 .1
1980 ....................... 12 .5 13 .5 11 .0 12 .3 10 .2 8 .6 14 .2 15 .4 10 .1 11 .3 9 .9 11 .0 18 .0 30 .9 1981 ....................... 8 .9 10 .3 6 .0 8 .4 4 .3 7 .8 13 .0 13 .1 12 .6 10 .7 12 .5 10 .7 11 .9 13 .6 1982 ....................... 3 .8 6 .2 3 .6 4 .1 3 .1 4 .1 4 .3 9 .0 11 .2 11 .8 11 .0 11 .6 1 .3 1 .5 1983 ....................... 3 .8 3 .2 2 .9 2 .9 2 .7 2 .1 4 .8 3 .5 6 .2 8 .7 6 .4 8 .8 − .5 .7 1984 ....................... 3 .9 4 .3 2 .7 3 .4 3 .8 3 .8 5 .4 5 .2 5 .8 6 .0 6 .1 6 .2 .2 1 .0 1985 ....................... 3 .8 3 .6 2 .5 2 .1 2 .6 2 .3 5 .1 5 .1 6 .8 6 .1 6 .8 6 .3 1 .8 .7 1986 ....................... 1 .1 1 .9 −2 .0 − .9 3 .8 3 .2 4 .5 5 .0 7 .9 7 .7 7 .7 7 .5 −19 .7 −13 .2 1987 ....................... 4 .4 3 .6 4 .6 3 .2 3 .5 4 .1 4 .3 4 .2 5 .6 6 .6 5 .8 6 .6 8 .2 .5 1988 ....................... 4 .4 4 .1 3 .8 3 .5 5 .2 4 .1 4 .8 4 .6 6 .9 6 .4 6 .9 6 .5 .5 .8 1989 ....................... 4 .6 4 .8 4 .1 4 .7 5 .6 5 .8 5 .1 4 .9 8 .6 7 .7 8 .5 7 .7 5 .1 5 .6
1990 ....................... 6 .1 5 .4 6 .6 5 .2 5 .3 5 .8 5 .7 5 .5 9 .9 9 .3 9 .6 9 .0 18 .1 8 .3 1991 ....................... 3 .1 4 .2 1 .2 3 .1 1 .9 2 .9 4 .6 5 .1 8 .0 8 .9 7 .9 8 .7 −7 .4 .4 1992 ....................... 2 .9 3 .0 2 .0 2 .0 1 .5 1 .2 3 .6 3 .9 7 .0 7 .6 6 .6 7 .4 2 .0 .5 1993 ....................... 2 .7 3 .0 1 .5 1 .9 2 .9 2 .2 3 .8 3 .9 5 .9 6 .5 5 .4 5 .9 −1 .4 1 .2 1994 ....................... 2 .7 2 .6 2 .3 1 .7 2 .9 2 .4 2 .9 3 .3 5 .4 5 .2 4 .9 4 .8 2 .2 .4 1995 ....................... 2 .5 2 .8 1 .4 1 .9 2 .1 2 .8 3 .5 3 .4 4 .4 5 .1 3 .9 4 .5 −1 .3 .6 1996 ....................... 3 .3 3 .0 3 .2 2 .6 4 .3 3 .3 3 .3 3 .2 3 .2 3 .7 3 .0 3 .5 8 .6 4 .7 1997 ....................... 1 .7 2 .3 .2 1 .4 1 .5 2 .6 2 .8 3 .0 2 .9 2 .9 2 .8 2 .8 −3 .4 1 .3 1998 ....................... 1 .6 1 .6 .4 .1 2 .3 2 .2 2 .6 2 .7 3 .2 3 .2 3 .4 3 .2 −8 .8 −7 .7 1999 ....................... 2 .7 2 .2 2 .7 1 .8 1 .9 2 .1 2 .6 2 .5 3 .6 3 .4 3 .7 3 .5 13 .4 3 .6
2000 ....................... 3 .4 3 .4 2 .7 3 .3 2 .8 2 .3 3 .9 3 .4 4 .6 4 .3 4 .2 4 .1 14 .2 16 .9 2001 ....................... 1 .6 2 .8 −1 .4 1 .0 2 .8 3 .2 3 .7 4 .1 4 .8 4 .8 4 .7 4 .6 −13 .0 3 .8 2002 ....................... 2 .4 1 .6 1 .2 − .7 1 .5 1 .8 3 .2 3 .1 5 .6 5 .1 5 .0 4 .7 10 .7 −5 .9 2003 ....................... 1 .9 2 .3 .5 1 .0 3 .6 2 .2 2 .8 3 .2 4 .2 4 .5 3 .7 4 .0 6 .9 12 .2 2004 ....................... 3 .3 2 .7 3 .6 2 .3 2 .7 3 .4 3 .1 2 .9 4 .9 5 .0 4 .2 4 .4 16 .6 10 .9
1 Changes from December to December are based on unadjusted indexes. 2 Commodities and services. 3 Household fuels—gas (piped), electricity, fuel oil, etc.,—and motor fuel. Motor oil, coolant, etc., also included through 1982.
Note.—See Note, Table B-60.
Source: Department of Labor, Bureau of Labor Statistics.
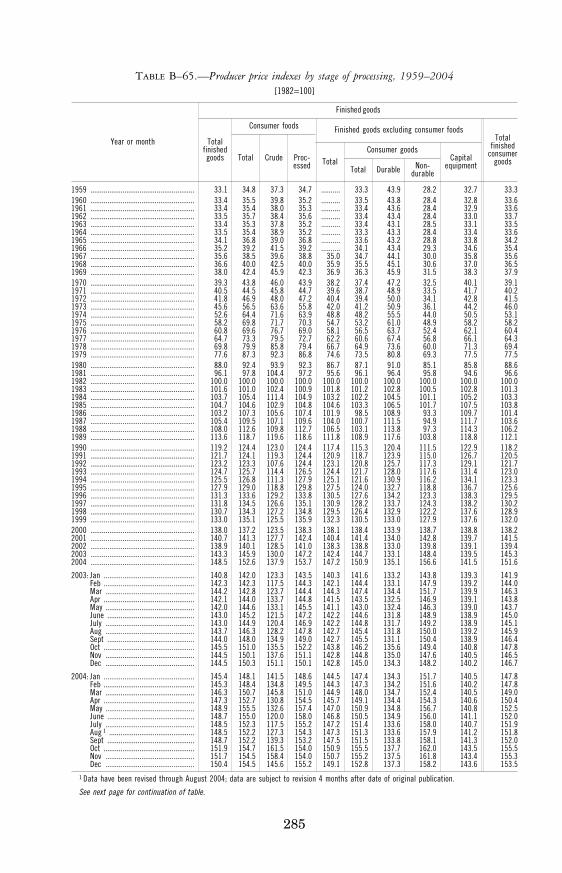
285
TABLE B–65.—Producer price indexes by stage of processing, 1959–2004 [1982=100]
Year or month
Finished goods
Total finished goods
Consumer foods Finished goods excluding consumer foods Total
finished consumer
goods Total Crude Proc-essed Total
Consumer goods Capital
equipment Total Durable Non- durable
1959 ....................................................... 33.1 34.8 37.3 34.7 .......... 33.3 43.9 28.2 32.7 33.3 1960 ....................................................... 33.4 35.5 39.8 35.2 .......... 33.5 43.8 28.4 32.8 33.6 1961 ....................................................... 33.4 35.4 38.0 35.3 .......... 33.4 43.6 28.4 32.9 33.6 1962 ....................................................... 33.5 35.7 38.4 35.6 .......... 33.4 43.4 28.4 33.0 33.7 1963 ....................................................... 33.4 35.3 37.8 35.2 .......... 33.4 43.1 28.5 33.1 33.5 1964 ....................................................... 33.5 35.4 38.9 35.2 .......... 33.3 43.3 28.4 33.4 33.6 1965 ....................................................... 34.1 36.8 39.0 36.8 .......... 33.6 43.2 28.8 33.8 34.2 1966 ....................................................... 35.2 39.2 41.5 39.2 .......... 34.1 43.4 29.3 34.6 35.4 1967 ....................................................... 35.6 38.5 39.6 38.8 35.0 34.7 44.1 30.0 35.8 35.6 1968 ....................................................... 36.6 40.0 42.5 40.0 35.9 35.5 45.1 30.6 37.0 36.5 1969 ....................................................... 38.0 42.4 45.9 42.3 36.9 36.3 45.9 31.5 38.3 37.9 1970 ....................................................... 39.3 43.8 46.0 43.9 38.2 37.4 47.2 32.5 40.1 39.1 1971 ....................................................... 40.5 44.5 45.8 44.7 39.6 38.7 48.9 33.5 41.7 40.2 1972 ....................................................... 41.8 46.9 48.0 47.2 40.4 39.4 50.0 34.1 42.8 41.5 1973 ....................................................... 45.6 56.5 63.6 55.8 42.0 41.2 50.9 36.1 44.2 46.0 1974 ....................................................... 52.6 64.4 71.6 63.9 48.8 48.2 55.5 44.0 50.5 53.1 1975 ....................................................... 58.2 69.8 71.7 70.3 54.7 53.2 61.0 48.9 58.2 58.2 1976 ....................................................... 60.8 69.6 76.7 69.0 58.1 56.5 63.7 52.4 62.1 60.4 1977 ....................................................... 64.7 73.3 79.5 72.7 62.2 60.6 67.4 56.8 66.1 64.3 1978 ....................................................... 69.8 79.9 85.8 79.4 66.7 64.9 73.6 60.0 71.3 69.4 1979 ....................................................... 77.6 87.3 92.3 86.8 74.6 73.5 80.8 69.3 77.5 77.5 1980 ....................................................... 88.0 92.4 93.9 92.3 86.7 87.1 91.0 85.1 85.8 88.6 1981 ....................................................... 96.1 97.8 104.4 97.2 95.6 96.1 96.4 95.8 94.6 96.6 1982 ....................................................... 100.0 100.0 100.0 100.0 100.0 100.0 100.0 100.0 100.0 100.0 1983 ....................................................... 101.6 101.0 102.4 100.9 101.8 101.2 102.8 100.5 102.8 101.3 1984 ....................................................... 103.7 105.4 111.4 104.9 103.2 102.2 104.5 101.1 105.2 103.3 1985 ....................................................... 104.7 104.6 102.9 104.8 104.6 103.3 106.5 101.7 107.5 103.8 1986 ....................................................... 103.2 107.3 105.6 107.4 101.9 98.5 108.9 93.3 109.7 101.4 1987 ....................................................... 105.4 109.5 107.1 109.6 104.0 100.7 111.5 94.9 111.7 103.6 1988 ....................................................... 108.0 112.6 109.8 112.7 106.5 103.1 113.8 97.3 114.3 106.2 1989 ....................................................... 113.6 118.7 119.6 118.6 111.8 108.9 117.6 103.8 118.8 112.1 1990 ....................................................... 119.2 124.4 123.0 124.4 117.4 115.3 120.4 111.5 122.9 118.2 1991 ....................................................... 121.7 124.1 119.3 124.4 120.9 118.7 123.9 115.0 126.7 120.5 1992 ....................................................... 123.2 123.3 107.6 124.4 123.1 120.8 125.7 117.3 129.1 121.7 1993 ....................................................... 124.7 125.7 114.4 126.5 124.4 121.7 128.0 117.6 131.4 123.0 1994 ....................................................... 125.5 126.8 111.3 127.9 125.1 121.6 130.9 116.2 134.1 123.3 1995 ....................................................... 127.9 129.0 118.8 129.8 127.5 124.0 132.7 118.8 136.7 125.6 1996 ....................................................... 131.3 133.6 129.2 133.8 130.5 127.6 134.2 123.3 138.3 129.5 1997 ....................................................... 131.8 134.5 126.6 135.1 130.9 128.2 133.7 124.3 138.2 130.2 1998 ....................................................... 130.7 134.3 127.2 134.8 129.5 126.4 132.9 122.2 137.6 128.9 1999 ....................................................... 133.0 135.1 125.5 135.9 132.3 130.5 133.0 127.9 137.6 132.0 2000 ....................................................... 138.0 137.2 123.5 138.3 138.1 138.4 133.9 138.7 138.8 138.2 2001 ....................................................... 140.7 141.3 127.7 142.4 140.4 141.4 134.0 142.8 139.7 141.5 2002 ....................................................... 138.9 140.1 128.5 141.0 138.3 138.8 133.0 139.8 139.1 139.4 2003 ....................................................... 143.3 145.9 130.0 147.2 142.4 144.7 133.1 148.4 139.5 145.3 2004 ....................................................... 148.5 152.6 137.9 153.7 147.2 150.9 135.1 156.6 141.5 151.6
2003: Jan ................................................ 140.8 142.0 123.3 143.5 140.3 141.6 133.2 143.8 139.3 141.9 Feb ................................................ 142.3 142.3 117.5 144.3 142.1 144.4 133.1 147.9 139.2 144.0 Mar ............................................... 144.2 142.8 123.7 144.4 144.3 147.4 134.4 151.7 139.9 146.3 Apr ................................................ 142.1 144.0 133.7 144.8 141.5 143.5 132.5 146.9 139.1 143.8 May ............................................... 142.0 144.6 133.1 145.5 141.1 143.0 132.4 146.3 139.0 143.7 June .............................................. 143.0 145.2 121.5 147.2 142.2 144.6 131.8 148.9 138.9 145.0 July ............................................... 143.0 144.9 120.4 146.9 142.2 144.8 131.7 149.2 138.9 145.1 Aug ............................................... 143.7 146.3 128.2 147.8 142.7 145.4 131.8 150.0 139.2 145.9 Sept .............................................. 144.0 148.0 134.9 149.0 142.7 145.5 131.1 150.4 138.9 146.4 Oct ................................................ 145.5 151.0 135.5 152.2 143.8 146.2 135.6 149.4 140.8 147.8 Nov ............................................... 144.5 150.1 137.6 151.1 142.8 144.8 135.0 147.6 140.5 146.5 Dec ............................................... 144.5 150.3 151.1 150.1 142.8 145.0 134.3 148.2 140.2 146.7
2004: Jan ................................................ 145.4 148.1 141.5 148.6 144.5 147.4 134.3 151.7 140.5 147.8 Feb ................................................ 145.3 148.4 134.8 149.5 144.3 147.3 134.2 151.6 140.2 147.8 Mar ............................................... 146.3 150.7 145.8 151.0 144.9 148.0 134.7 152.4 140.5 149.0 Apr ................................................ 147.3 152.7 130.8 154.5 145.7 149.1 134.4 154.3 140.6 150.4 May ............................................... 148.9 155.5 132.6 157.4 147.0 150.9 134.8 156.7 140.8 152.5 June .............................................. 148.7 155.0 120.0 158.0 146.8 150.5 134.9 156.0 141.1 152.0 July ............................................... 148.5 152.3 117.5 155.2 147.2 151.4 133.6 158.0 140.7 151.9 Aug 1 ............................................. 148.5 152.2 127.3 154.3 147.3 151.3 133.6 157.9 141.2 151.8 Sept .............................................. 148.7 152.2 139.3 153.2 147.5 151.5 133.8 158.1 141.3 152.0 Oct ................................................ 151.9 154.7 161.5 154.0 150.9 155.5 137.7 162.0 143.5 155.5 Nov ............................................... 151.7 154.5 158.4 154.0 150.7 155.2 137.5 161.8 143.4 155.3 Dec ............................................... 150.4 154.5 145.6 155.2 149.1 152.8 137.3 158.2 143.6 153.5
1 Data have been revised through August 2004; data are subject to revision 4 months after date of original publication.
See next page for continuation of table.
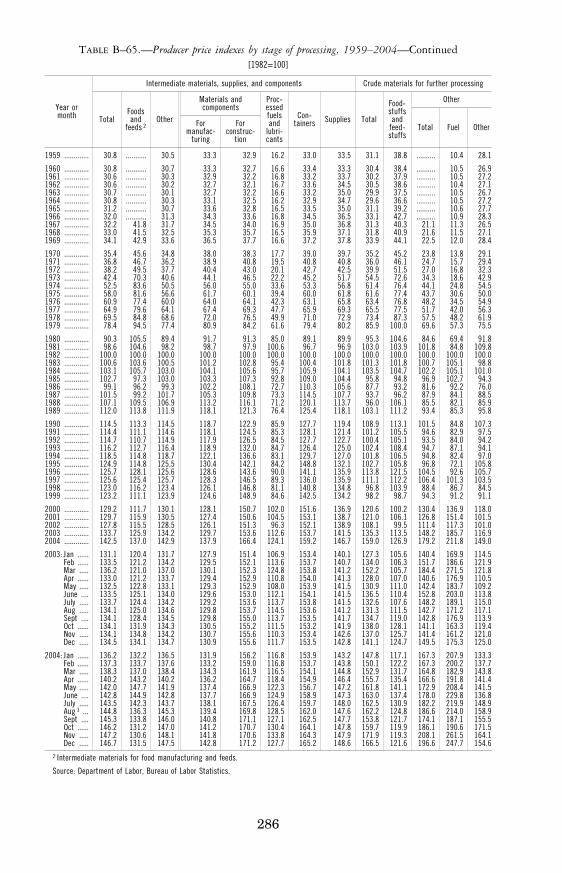
286
TABLE B–65.—Producer price indexes by stage of processing, 1959–2004—Continued [1982=100]
Year or month
Intermediate materials, supplies, and components Crude materials for further processing
Total Foods and
feeds 2 Other
Materials and components
Proc-essed fuels and
lubri-cants
Con-tainers Supplies Total
Food- stuffs and
feed- stuffs
Other
For manufac-
turing
For construc-
tion Total Fuel Other
1959 ............. 30.8 ........... 30.5 33.3 32.9 16.2 33.0 33.5 31.1 38.8 .......... 10.4 28.1
1960 ............. 30.8 ........... 30.7 33.3 32.7 16.6 33.4 33.3 30.4 38.4 .......... 10.5 26.9 1961 ............. 30.6 ........... 30.3 32.9 32.2 16.8 33.2 33.7 30.2 37.9 .......... 10.5 27.2 1962 ............. 30.6 ........... 30.2 32.7 32.1 16.7 33.6 34.5 30.5 38.6 .......... 10.4 27.1 1963 ............. 30.7 ........... 30.1 32.7 32.2 16.6 33.2 35.0 29.9 37.5 .......... 10.5 26.7 1964 ............. 30.8 ........... 30.3 33.1 32.5 16.2 32.9 34.7 29.6 36.6 .......... 10.5 27.2 1965 ............. 31.2 ........... 30.7 33.6 32.8 16.5 33.5 35.0 31.1 39.2 .......... 10.6 27.7 1966 ............. 32.0 ........... 31.3 34.3 33.6 16.8 34.5 36.5 33.1 42.7 .......... 10.9 28.3 1967 ............. 32.2 41.8 31.7 34.5 34.0 16.9 35.0 36.8 31.3 40.3 21.1 11.3 26.5 1968 ............. 33.0 41.5 32.5 35.3 35.7 16.5 35.9 37.1 31.8 40.9 21.6 11.5 27.1 1969 ............. 34.1 42.9 33.6 36.5 37.7 16.6 37.2 37.8 33.9 44.1 22.5 12.0 28.4
1970 ............. 35.4 45.6 34.8 38.0 38.3 17.7 39.0 39.7 35.2 45.2 23.8 13.8 29.1 1971 ............. 36.8 46.7 36.2 38.9 40.8 19.5 40.8 40.8 36.0 46.1 24.7 15.7 29.4 1972 ............. 38.2 49.5 37.7 40.4 43.0 20.1 42.7 42.5 39.9 51.5 27.0 16.8 32.3 1973 ............. 42.4 70.3 40.6 44.1 46.5 22.2 45.2 51.7 54.5 72.6 34.3 18.6 42.9 1974 ............. 52.5 83.6 50.5 56.0 55.0 33.6 53.3 56.8 61.4 76.4 44.1 24.8 54.5 1975 ............. 58.0 81.6 56.6 61.7 60.1 39.4 60.0 61.8 61.6 77.4 43.7 30.6 50.0 1976 ............. 60.9 77.4 60.0 64.0 64.1 42.3 63.1 65.8 63.4 76.8 48.2 34.5 54.9 1977 ............. 64.9 79.6 64.1 67.4 69.3 47.7 65.9 69.3 65.5 77.5 51.7 42.0 56.3 1978 ............. 69.5 84.8 68.6 72.0 76.5 49.9 71.0 72.9 73.4 87.3 57.5 48.2 61.9 1979 ............. 78.4 94.5 77.4 80.9 84.2 61.6 79.4 80.2 85.9 100.0 69.6 57.3 75.5
1980 ............. 90.3 105.5 89.4 91.7 91.3 85.0 89.1 89.9 95.3 104.6 84.6 69.4 91.8 1981 ............. 98.6 104.6 98.2 98.7 97.9 100.6 96.7 96.9 103.0 103.9 101.8 84.8 109.8 1982 ............. 100.0 100.0 100.0 100.0 100.0 100.0 100.0 100.0 100.0 100.0 100.0 100.0 100.0 1983 ............. 100.6 103.6 100.5 101.2 102.8 95.4 100.4 101.8 101.3 101.8 100.7 105.1 98.8 1984 ............. 103.1 105.7 103.0 104.1 105.6 95.7 105.9 104.1 103.5 104.7 102.2 105.1 101.0 1985 ............. 102.7 97.3 103.0 103.3 107.3 92.8 109.0 104.4 95.8 94.8 96.9 102.7 94.3 1986 ............. 99.1 96.2 99.3 102.2 108.1 72.7 110.3 105.6 87.7 93.2 81.6 92.2 76.0 1987 ............. 101.5 99.2 101.7 105.3 109.8 73.3 114.5 107.7 93.7 96.2 87.9 84.1 88.5 1988 ............. 107.1 109.5 106.9 113.2 116.1 71.2 120.1 113.7 96.0 106.1 85.5 82.1 85.9 1989 ............. 112.0 113.8 111.9 118.1 121.3 76.4 125.4 118.1 103.1 111.2 93.4 85.3 95.8
1990 ............. 114.5 113.3 114.5 118.7 122.9 85.9 127.7 119.4 108.9 113.1 101.5 84.8 107.3 1991 ............. 114.4 111.1 114.6 118.1 124.5 85.3 128.1 121.4 101.2 105.5 94.6 82.9 97.5 1992 ............. 114.7 110.7 114.9 117.9 126.5 84.5 127.7 122.7 100.4 105.1 93.5 84.0 94.2 1993 ............. 116.2 112.7 116.4 118.9 132.0 84.7 126.4 125.0 102.4 108.4 94.7 87.1 94.1 1994 ............. 118.5 114.8 118.7 122.1 136.6 83.1 129.7 127.0 101.8 106.5 94.8 82.4 97.0 1995 ............. 124.9 114.8 125.5 130.4 142.1 84.2 148.8 132.1 102.7 105.8 96.8 72.1 105.8 1996 ............. 125.7 128.1 125.6 128.6 143.6 90.0 141.1 135.9 113.8 121.5 104.5 92.6 105.7 1997 ............. 125.6 125.4 125.7 128.3 146.5 89.3 136.0 135.9 111.1 112.2 106.4 101.3 103.5 1998 ............. 123.0 116.2 123.4 126.1 146.8 81.1 140.8 134.8 96.8 103.9 88.4 86.7 84.5 1999 ............. 123.2 111.1 123.9 124.6 148.9 84.6 142.5 134.2 98.2 98.7 94.3 91.2 91.1
2000 ............. 129.2 111.7 130.1 128.1 150.7 102.0 151.6 136.9 120.6 100.2 130.4 136.9 118.0 2001 ............. 129.7 115.9 130.5 127.4 150.6 104.5 153.1 138.7 121.0 106.1 126.8 151.4 101.5 2002 ............. 127.8 115.5 128.5 126.1 151.3 96.3 152.1 138.9 108.1 99.5 111.4 117.3 101.0 2003 ............. 133.7 125.9 134.2 129.7 153.6 112.6 153.7 141.5 135.3 113.5 148.2 185.7 116.9 2004 ............. 142.5 137.0 142.9 137.9 166.4 124.1 159.2 146.7 159.0 126.9 179.2 211.8 149.0
2003: Jan ...... 131.1 120.4 131.7 127.9 151.4 106.9 153.4 140.1 127.3 105.6 140.4 169.9 114.5 Feb ...... 133.5 121.2 134.2 129.5 152.1 113.6 153.7 140.7 134.0 106.3 151.7 186.6 121.9 Mar ..... 136.2 121.0 137.0 130.1 152.3 124.8 153.8 141.2 152.2 105.7 184.4 271.5 121.8 Apr ...... 133.0 121.2 133.7 129.4 152.9 110.8 154.0 141.3 128.0 107.0 140.6 176.9 110.5 May ..... 132.5 122.8 133.1 129.3 152.9 108.0 153.9 141.5 130.9 111.0 142.4 183.7 109.2 June .... 133.5 125.1 134.0 129.6 153.0 112.1 154.1 141.5 136.5 110.4 152.8 203.0 113.8 July ..... 133.7 124.4 134.2 129.2 153.6 113.7 153.8 141.5 132.6 107.6 148.2 189.1 115.0 Aug ..... 134.1 125.0 134.6 129.8 153.7 114.5 153.6 141.2 131.3 111.5 142.7 171.2 117.1 Sept .... 134.1 128.4 134.5 129.8 155.0 113.7 153.5 141.7 134.7 119.0 142.8 176.9 113.9 Oct ...... 134.1 131.9 134.3 130.5 155.2 111.5 153.2 141.9 138.0 128.1 141.1 163.3 119.4 Nov ..... 134.1 134.8 134.2 130.7 155.6 110.3 153.4 142.6 137.0 125.7 141.4 161.2 121.0 Dec ..... 134.5 134.1 134.7 130.9 155.6 111.7 153.5 142.8 141.1 124.7 149.5 175.3 125.0
2004: Jan ...... 136.2 132.2 136.5 131.9 156.2 116.8 153.9 143.2 147.8 117.1 167.3 207.9 133.3 Feb ...... 137.3 133.7 137.6 133.2 159.0 116.8 153.7 143.8 150.1 122.2 167.3 200.2 137.7 Mar ..... 138.3 137.0 138.4 134.3 161.9 116.5 154.1 144.8 152.9 131.7 164.8 182.9 143.8 Apr ...... 140.2 143.2 140.2 136.2 164.7 118.4 154.9 146.4 155.7 135.4 166.6 191.8 141.4 May ..... 142.0 147.7 141.9 137.4 166.9 122.3 156.7 147.2 161.8 141.1 172.9 208.4 141.5 June .... 142.8 144.9 142.8 137.7 166.9 124.9 158.9 147.3 163.0 137.4 178.0 229.8 136.8 July ..... 143.5 142.3 143.7 138.1 167.5 126.4 159.7 148.0 162.5 130.9 182.2 219.9 148.9 Aug 1 ... 144.8 136.3 145.3 139.4 169.8 128.5 162.0 147.6 162.2 124.8 186.6 214.0 158.9 Sept .... 145.3 133.8 146.0 140.8 171.1 127.1 162.5 147.7 153.8 121.7 174.1 187.1 155.5 Oct ...... 146.2 131.2 147.0 141.2 170.7 130.4 164.1 147.8 159.7 119.9 186.1 190.6 171.5 Nov ..... 147.2 130.6 148.1 141.8 170.6 133.8 164.3 147.9 171.9 119.3 208.1 261.5 164.1 Dec ..... 146.7 131.5 147.5 142.8 171.2 127.7 165.2 148.6 166.5 121.6 196.6 247.7 154.6
2 Intermediate materials for food manufacturing and feeds.
Source: Department of Labor, Bureau of Labor Statistics.
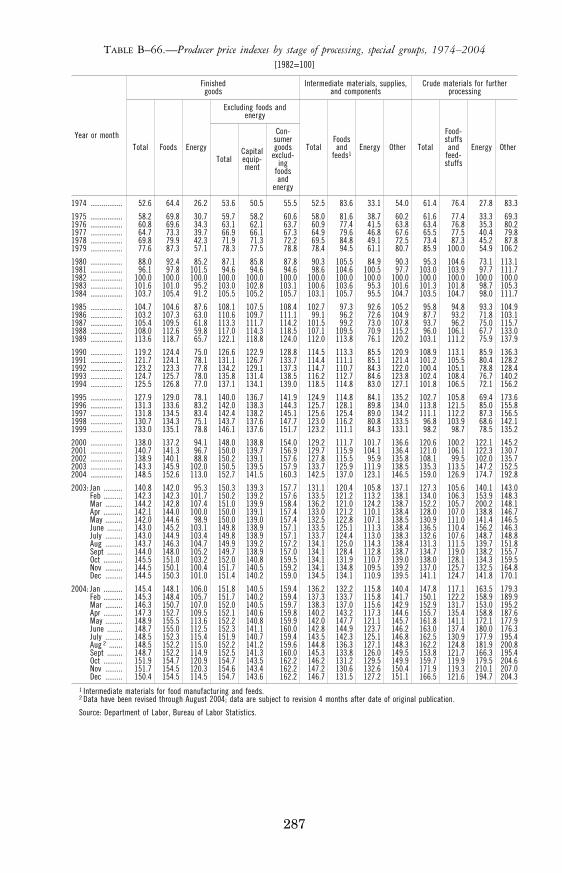
287
TABLE B–66.—Producer price indexes by stage of processing, special groups, 1974–2004 [1982=100]
Year or month
Finished goods
Intermediate materials, supplies, and components
Crude materials for further processing
Total Foods Energy
Excluding foods and energy
Total Foods and
feeds1 Energy Other Total
Food- stuffs and
feed- stuffs
Energy Other Total
Capital equip-ment
Con- sumer goods
exclud- ing
foods and
energy
1974 ................. 52.6 64.4 26.2 53.6 50.5 55.5 52.5 83.6 33.1 54.0 61.4 76.4 27.8 83.3
1975 ................. 58.2 69.8 30.7 59.7 58.2 60.6 58.0 81.6 38.7 60.2 61.6 77.4 33.3 69.3 1976 ................. 60.8 69.6 34.3 63.1 62.1 63.7 60.9 77.4 41.5 63.8 63.4 76.8 35.3 80.2 1977 ................. 64.7 73.3 39.7 66.9 66.1 67.3 64.9 79.6 46.8 67.6 65.5 77.5 40.4 79.8 1978 ................. 69.8 79.9 42.3 71.9 71.3 72.2 69.5 84.8 49.1 72.5 73.4 87.3 45.2 87.8 1979 ................. 77.6 87.3 57.1 78.3 77.5 78.8 78.4 94.5 61.1 80.7 85.9 100.0 54.9 106.2
1980 ................. 88.0 92.4 85.2 87.1 85.8 87.8 90.3 105.5 84.9 90.3 95.3 104.6 73.1 113.1 1981 ................. 96.1 97.8 101.5 94.6 94.6 94.6 98.6 104.6 100.5 97.7 103.0 103.9 97.7 111.7 1982 ................. 100.0 100.0 100.0 100.0 100.0 100.0 100.0 100.0 100.0 100.0 100.0 100.0 100.0 100.0 1983 ................. 101.6 101.0 95.2 103.0 102.8 103.1 100.6 103.6 95.3 101.6 101.3 101.8 98.7 105.3 1984 ................. 103.7 105.4 91.2 105.5 105.2 105.7 103.1 105.7 95.5 104.7 103.5 104.7 98.0 111.7
1985 ................. 104.7 104.6 87.6 108.1 107.5 108.4 102.7 97.3 92.6 105.2 95.8 94.8 93.3 104.9 1986 ................. 103.2 107.3 63.0 110.6 109.7 111.1 99.1 96.2 72.6 104.9 87.7 93.2 71.8 103.1 1987 ................. 105.4 109.5 61.8 113.3 111.7 114.2 101.5 99.2 73.0 107.8 93.7 96.2 75.0 115.7 1988 ................. 108.0 112.6 59.8 117.0 114.3 118.5 107.1 109.5 70.9 115.2 96.0 106.1 67.7 133.0 1989 ................. 113.6 118.7 65.7 122.1 118.8 124.0 112.0 113.8 76.1 120.2 103.1 111.2 75.9 137.9
1990 ................. 119.2 124.4 75.0 126.6 122.9 128.8 114.5 113.3 85.5 120.9 108.9 113.1 85.9 136.3 1991 ................. 121.7 124.1 78.1 131.1 126.7 133.7 114.4 111.1 85.1 121.4 101.2 105.5 80.4 128.2 1992 ................. 123.2 123.3 77.8 134.2 129.1 137.3 114.7 110.7 84.3 122.0 100.4 105.1 78.8 128.4 1993 ................. 124.7 125.7 78.0 135.8 131.4 138.5 116.2 112.7 84.6 123.8 102.4 108.4 76.7 140.2 1994 ................. 125.5 126.8 77.0 137.1 134.1 139.0 118.5 114.8 83.0 127.1 101.8 106.5 72.1 156.2
1995 ................. 127.9 129.0 78.1 140.0 136.7 141.9 124.9 114.8 84.1 135.2 102.7 105.8 69.4 173.6 1996 ................. 131.3 133.6 83.2 142.0 138.3 144.3 125.7 128.1 89.8 134.0 113.8 121.5 85.0 155.8 1997 ................. 131.8 134.5 83.4 142.4 138.2 145.1 125.6 125.4 89.0 134.2 111.1 112.2 87.3 156.5 1998 ................. 130.7 134.3 75.1 143.7 137.6 147.7 123.0 116.2 80.8 133.5 96.8 103.9 68.6 142.1 1999 ................. 133.0 135.1 78.8 146.1 137.6 151.7 123.2 111.1 84.3 133.1 98.2 98.7 78.5 135.2
2000 ................. 138.0 137.2 94.1 148.0 138.8 154.0 129.2 111.7 101.7 136.6 120.6 100.2 122.1 145.2 2001 ................. 140.7 141.3 96.7 150.0 139.7 156.9 129.7 115.9 104.1 136.4 121.0 106.1 122.3 130.7 2002 ................. 138.9 140.1 88.8 150.2 139.1 157.6 127.8 115.5 95.9 135.8 108.1 99.5 102.0 135.7 2003 ................. 143.3 145.9 102.0 150.5 139.5 157.9 133.7 125.9 111.9 138.5 135.3 113.5 147.2 152.5 2004 ................. 148.5 152.6 113.0 152.7 141.5 160.3 142.5 137.0 123.1 146.5 159.0 126.9 174.7 192.8
2003: Jan .......... 140.8 142.0 95.3 150.3 139.3 157.7 131.1 120.4 105.8 137.1 127.3 105.6 140.1 143.0 Feb .......... 142.3 142.3 101.7 150.2 139.2 157.6 133.5 121.2 113.2 138.1 134.0 106.3 153.9 148.3 Mar ......... 144.2 142.8 107.4 151.0 139.9 158.4 136.2 121.0 124.2 138.7 152.2 105.7 200.2 148.1 Apr .......... 142.1 144.0 100.0 150.0 139.1 157.4 133.0 121.2 110.1 138.4 128.0 107.0 138.8 146.7 May ......... 142.0 144.6 98.9 150.0 139.0 157.4 132.5 122.8 107.1 138.5 130.9 111.0 141.4 146.5 June ........ 143.0 145.2 103.1 149.8 138.9 157.1 133.5 125.1 111.3 138.4 136.5 110.4 156.2 146.3 July ......... 143.0 144.9 103.4 149.8 138.9 157.1 133.7 124.4 113.0 138.3 132.6 107.6 148.7 148.8 Aug ......... 143.7 146.3 104.7 149.9 139.2 157.2 134.1 125.0 114.3 138.4 131.3 111.5 139.7 151.8 Sept ........ 144.0 148.0 105.2 149.7 138.9 157.0 134.1 128.4 112.8 138.7 134.7 119.0 138.2 155.7 Oct .......... 145.5 151.0 103.2 152.0 140.8 159.5 134.1 131.9 110.7 139.0 138.0 128.1 134.3 159.5 Nov ......... 144.5 150.1 100.4 151.7 140.5 159.2 134.1 134.8 109.5 139.2 137.0 125.7 132.5 164.8 Dec ......... 144.5 150.3 101.0 151.4 140.2 159.0 134.5 134.1 110.9 139.5 141.1 124.7 141.8 170.1
2004: Jan .......... 145.4 148.1 106.0 151.8 140.5 159.4 136.2 132.2 115.8 140.4 147.8 117.1 163.5 179.3 Feb .......... 145.3 148.4 105.7 151.7 140.2 159.4 137.3 133.7 115.8 141.7 150.1 122.2 158.9 189.9 Mar ......... 146.3 150.7 107.0 152.0 140.5 159.7 138.3 137.0 115.6 142.9 152.9 131.7 153.0 195.2 Apr .......... 147.3 152.7 109.5 152.1 140.6 159.8 140.2 143.2 117.3 144.6 155.7 135.4 158.8 187.6 May ......... 148.9 155.5 113.6 152.2 140.8 159.9 142.0 147.7 121.1 145.7 161.8 141.1 172.1 177.9 June ........ 148.7 155.0 112.5 152.3 141.1 160.0 142.8 144.9 123.7 146.2 163.0 137.4 180.0 176.3 July ......... 148.5 152.3 115.4 151.9 140.7 159.4 143.5 142.3 125.1 146.8 162.5 130.9 177.9 195.4 Aug 2 ....... 148.5 152.2 115.0 152.2 141.2 159.6 144.8 136.3 127.1 148.3 162.2 124.8 181.9 200.8 Sept ........ 148.7 152.2 114.9 152.5 141.3 160.0 145.3 133.8 126.0 149.5 153.8 121.7 166.3 195.4 Oct .......... 151.9 154.7 120.9 154.7 143.5 162.2 146.2 131.2 129.5 149.9 159.7 119.9 179.5 204.6 Nov ......... 151.7 154.5 120.3 154.6 143.4 162.2 147.2 130.6 132.6 150.4 171.9 119.3 210.1 207.0 Dec ......... 150.4 154.5 114.5 154.7 143.6 162.2 146.7 131.5 127.2 151.1 166.5 121.6 194.7 204.3
1 Intermediate materials for food manufacturing and feeds. 2 Data have been revised through August 2004; data are subject to revision 4 months after date of original publication.
Source: Department of Labor, Bureau of Labor Statistics.
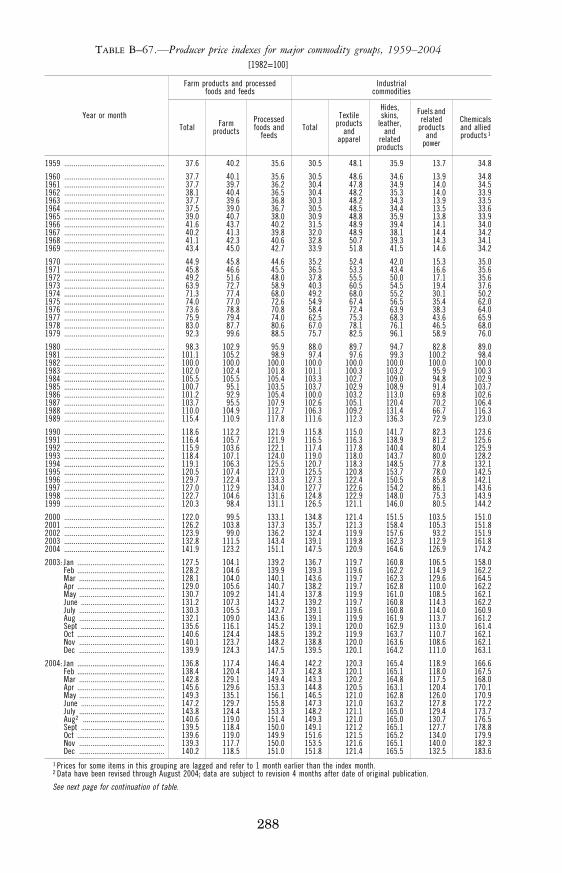
288
TABLE B–67.—Producer price indexes for major commodity groups, 1959–2004 [1982=100]
Year or month
Farm products and processed foods and feeds
Industrial commodities
Total Farm products
Processed foods and
feeds Total
Textile products
and apparel
Hides, skins,
leather, and
related products
Fuels and related
products and
power
Chemicals and allied products 1
1959 ..................................................... 37.6 40.2 35.6 30.5 48.1 35.9 13.7 34.8
1960 ..................................................... 37.7 40.1 35.6 30.5 48.6 34.6 13.9 34.8 1961 ..................................................... 37.7 39.7 36.2 30.4 47.8 34.9 14.0 34.5 1962 ..................................................... 38.1 40.4 36.5 30.4 48.2 35.3 14.0 33.9 1963 ..................................................... 37.7 39.6 36.8 30.3 48.2 34.3 13.9 33.5 1964 ..................................................... 37.5 39.0 36.7 30.5 48.5 34.4 13.5 33.6 1965 ..................................................... 39.0 40.7 38.0 30.9 48.8 35.9 13.8 33.9 1966 ..................................................... 41.6 43.7 40.2 31.5 48.9 39.4 14.1 34.0 1967 ..................................................... 40.2 41.3 39.8 32.0 48.9 38.1 14.4 34.2 1968 ..................................................... 41.1 42.3 40.6 32.8 50.7 39.3 14.3 34.1 1969 ..................................................... 43.4 45.0 42.7 33.9 51.8 41.5 14.6 34.2
1970 ..................................................... 44.9 45.8 44.6 35.2 52.4 42.0 15.3 35.0 1971 ..................................................... 45.8 46.6 45.5 36.5 53.3 43.4 16.6 35.6 1972 ..................................................... 49.2 51.6 48.0 37.8 55.5 50.0 17.1 35.6 1973 ..................................................... 63.9 72.7 58.9 40.3 60.5 54.5 19.4 37.6 1974 ..................................................... 71.3 77.4 68.0 49.2 68.0 55.2 30.1 50.2 1975 ..................................................... 74.0 77.0 72.6 54.9 67.4 56.5 35.4 62.0 1976 ..................................................... 73.6 78.8 70.8 58.4 72.4 63.9 38.3 64.0 1977 ..................................................... 75.9 79.4 74.0 62.5 75.3 68.3 43.6 65.9 1978 ..................................................... 83.0 87.7 80.6 67.0 78.1 76.1 46.5 68.0 1979 ..................................................... 92.3 99.6 88.5 75.7 82.5 96.1 58.9 76.0
1980 ..................................................... 98.3 102.9 95.9 88.0 89.7 94.7 82.8 89.0 1981 ..................................................... 101.1 105.2 98.9 97.4 97.6 99.3 100.2 98.4 1982 ..................................................... 100.0 100.0 100.0 100.0 100.0 100.0 100.0 100.0 1983 ..................................................... 102.0 102.4 101.8 101.1 100.3 103.2 95.9 100.3 1984 ..................................................... 105.5 105.5 105.4 103.3 102.7 109.0 94.8 102.9 1985 ..................................................... 100.7 95.1 103.5 103.7 102.9 108.9 91.4 103.7 1986 ..................................................... 101.2 92.9 105.4 100.0 103.2 113.0 69.8 102.6 1987 ..................................................... 103.7 95.5 107.9 102.6 105.1 120.4 70.2 106.4 1988 ..................................................... 110.0 104.9 112.7 106.3 109.2 131.4 66.7 116.3 1989 ..................................................... 115.4 110.9 117.8 111.6 112.3 136.3 72.9 123.0
1990 ..................................................... 118.6 112.2 121.9 115.8 115.0 141.7 82.3 123.6 1991 ..................................................... 116.4 105.7 121.9 116.5 116.3 138.9 81.2 125.6 1992 ..................................................... 115.9 103.6 122.1 117.4 117.8 140.4 80.4 125.9 1993 ..................................................... 118.4 107.1 124.0 119.0 118.0 143.7 80.0 128.2 1994 ..................................................... 119.1 106.3 125.5 120.7 118.3 148.5 77.8 132.1 1995 ..................................................... 120.5 107.4 127.0 125.5 120.8 153.7 78.0 142.5 1996 ..................................................... 129.7 122.4 133.3 127.3 122.4 150.5 85.8 142.1 1997 ..................................................... 127.0 112.9 134.0 127.7 122.6 154.2 86.1 143.6 1998 ..................................................... 122.7 104.6 131.6 124.8 122.9 148.0 75.3 143.9 1999 ..................................................... 120.3 98.4 131.1 126.5 121.1 146.0 80.5 144.2
2000 ..................................................... 122.0 99.5 133.1 134.8 121.4 151.5 103.5 151.0 2001 ..................................................... 126.2 103.8 137.3 135.7 121.3 158.4 105.3 151.8 2002 ..................................................... 123.9 99.0 136.2 132.4 119.9 157.6 93.2 151.9 2003 ..................................................... 132.8 111.5 143.4 139.1 119.8 162.3 112.9 161.8 2004 ..................................................... 141.9 123.2 151.1 147.5 120.9 164.6 126.9 174.2
2003: Jan .............................................. 127.5 104.1 139.2 136.7 119.7 160.8 106.5 158.0 Feb .............................................. 128.2 104.6 139.9 139.3 119.6 162.2 114.9 162.2 Mar ............................................. 128.1 104.0 140.1 143.6 119.7 162.3 129.6 164.5 Apr .............................................. 129.0 105.6 140.7 138.2 119.7 162.8 110.0 162.2 May ............................................. 130.7 109.2 141.4 137.8 119.9 161.0 108.5 162.1 June ............................................ 131.2 107.3 143.2 139.2 119.7 160.8 114.3 162.2 July ............................................. 130.3 105.5 142.7 139.1 119.6 160.8 114.0 160.9 Aug ............................................. 132.1 109.0 143.6 139.1 119.9 161.9 113.7 161.2 Sept ............................................ 135.6 116.1 145.2 139.1 120.0 162.9 113.0 161.4 Oct .............................................. 140.6 124.4 148.5 139.2 119.9 163.7 110.7 162.1 Nov ............................................. 140.1 123.7 148.2 138.8 120.0 163.6 108.6 162.1 Dec ............................................. 139.9 124.3 147.5 139.5 120.1 164.2 111.0 163.1
2004: Jan .............................................. 136.8 117.4 146.4 142.2 120.3 165.4 118.9 166.6 Feb .............................................. 138.4 120.4 147.3 142.8 120.1 165.1 118.0 167.5 Mar ............................................. 142.8 129.1 149.4 143.3 120.2 164.8 117.5 168.0 Apr .............................................. 145.6 129.6 153.3 144.8 120.5 163.1 120.4 170.1 May ............................................. 149.3 135.1 156.1 146.5 121.0 162.8 126.0 170.9 June ............................................ 147.2 129.7 155.8 147.3 121.0 163.2 127.8 172.2 July ............................................. 143.8 124.4 153.3 148.2 121.1 165.0 129.4 173.7 Aug2 ........................................... 140.6 119.0 151.4 149.3 121.0 165.0 130.7 176.5 Sept ............................................ 139.5 118.4 150.0 149.1 121.2 165.1 127.7 178.8 Oct .............................................. 139.6 119.0 149.9 151.6 121.5 165.2 134.0 179.9 Nov ............................................. 139.3 117.7 150.0 153.5 121.6 165.1 140.0 182.3 Dec ............................................. 140.2 118.5 151.0 151.8 121.4 165.5 132.5 183.6
1 Prices for some items in this grouping are lagged and refer to 1 month earlier than the index month. 2 Data have been revised through August 2004; data are subject to revision 4 months after date of original publication.
See next page for continuation of table.
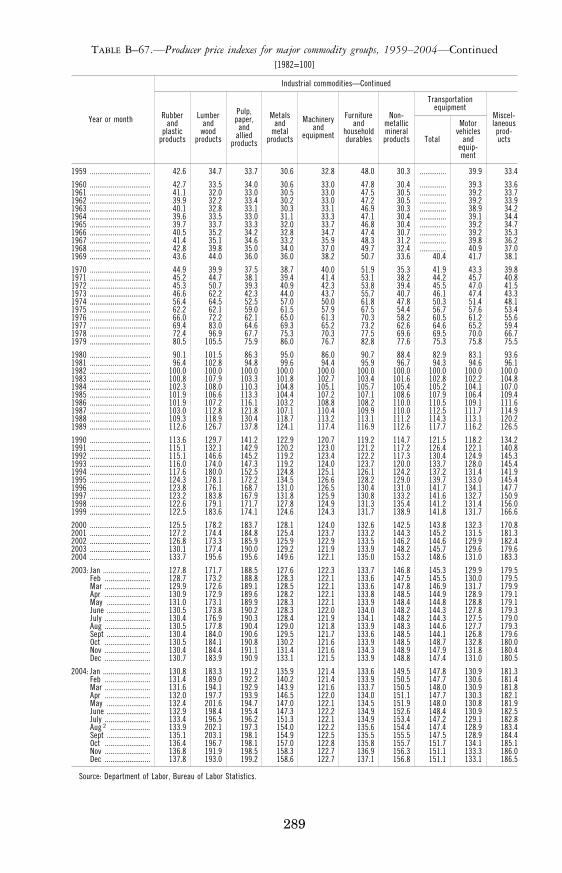
289
TABLE B–67.—Producer price indexes for major commodity groups, 1959–2004—Continued [1982=100]
Year or month
Industrial commodities—Continued
Rubber and
plastic products
Lumber and
wood products
Pulp, paper,
and allied
products
Metals and
metal products
Machinery and
equipment
Furniture and
household durables
Non-metallic mineral products
Transportation equipment
Miscel- laneous prod- ucts Total
Motor vehicles
and equip-ment
1959 ................................ 42.6 34.7 33.7 30.6 32.8 48.0 30.3 .............. 39.9 33.4
1960 ................................ 42.7 33.5 34.0 30.6 33.0 47.8 30.4 .............. 39.3 33.6 1961 ................................ 41.1 32.0 33.0 30.5 33.0 47.5 30.5 .............. 39.2 33.7 1962 ................................ 39.9 32.2 33.4 30.2 33.0 47.2 30.5 .............. 39.2 33.9 1963 ................................ 40.1 32.8 33.1 30.3 33.1 46.9 30.3 .............. 38.9 34.2 1964 ................................ 39.6 33.5 33.0 31.1 33.3 47.1 30.4 .............. 39.1 34.4 1965 ................................ 39.7 33.7 33.3 32.0 33.7 46.8 30.4 .............. 39.2 34.7 1966 ................................ 40.5 35.2 34.2 32.8 34.7 47.4 30.7 .............. 39.2 35.3 1967 ................................ 41.4 35.1 34.6 33.2 35.9 48.3 31.2 .............. 39.8 36.2 1968 ................................ 42.8 39.8 35.0 34.0 37.0 49.7 32.4 .............. 40.9 37.0 1969 ................................ 43.6 44.0 36.0 36.0 38.2 50.7 33.6 40.4 41.7 38.1
1970 ................................ 44.9 39.9 37.5 38.7 40.0 51.9 35.3 41.9 43.3 39.8 1971 ................................ 45.2 44.7 38.1 39.4 41.4 53.1 38.2 44.2 45.7 40.8 1972 ................................ 45.3 50.7 39.3 40.9 42.3 53.8 39.4 45.5 47.0 41.5 1973 ................................ 46.6 62.2 42.3 44.0 43.7 55.7 40.7 46.1 47.4 43.3 1974 ................................ 56.4 64.5 52.5 57.0 50.0 61.8 47.8 50.3 51.4 48.1 1975 ................................ 62.2 62.1 59.0 61.5 57.9 67.5 54.4 56.7 57.6 53.4 1976 ................................ 66.0 72.2 62.1 65.0 61.3 70.3 58.2 60.5 61.2 55.6 1977 ................................ 69.4 83.0 64.6 69.3 65.2 73.2 62.6 64.6 65.2 59.4 1978 ................................ 72.4 96.9 67.7 75.3 70.3 77.5 69.6 69.5 70.0 66.7 1979 ................................ 80.5 105.5 75.9 86.0 76.7 82.8 77.6 75.3 75.8 75.5
1980 ................................ 90.1 101.5 86.3 95.0 86.0 90.7 88.4 82.9 83.1 93.6 1981 ................................ 96.4 102.8 94.8 99.6 94.4 95.9 96.7 94.3 94.6 96.1 1982 ................................ 100.0 100.0 100.0 100.0 100.0 100.0 100.0 100.0 100.0 100.0 1983 ................................ 100.8 107.9 103.3 101.8 102.7 103.4 101.6 102.8 102.2 104.8 1984 ................................ 102.3 108.0 110.3 104.8 105.1 105.7 105.4 105.2 104.1 107.0 1985 ................................ 101.9 106.6 113.3 104.4 107.2 107.1 108.6 107.9 106.4 109.4 1986 ................................ 101.9 107.2 116.1 103.2 108.8 108.2 110.0 110.5 109.1 111.6 1987 ................................ 103.0 112.8 121.8 107.1 110.4 109.9 110.0 112.5 111.7 114.9 1988 ................................ 109.3 118.9 130.4 118.7 113.2 113.1 111.2 114.3 113.1 120.2 1989 ................................ 112.6 126.7 137.8 124.1 117.4 116.9 112.6 117.7 116.2 126.5
1990 ................................ 113.6 129.7 141.2 122.9 120.7 119.2 114.7 121.5 118.2 134.2 1991 ................................ 115.1 132.1 142.9 120.2 123.0 121.2 117.2 126.4 122.1 140.8 1992 ................................ 115.1 146.6 145.2 119.2 123.4 122.2 117.3 130.4 124.9 145.3 1993 ................................ 116.0 174.0 147.3 119.2 124.0 123.7 120.0 133.7 128.0 145.4 1994 ................................ 117.6 180.0 152.5 124.8 125.1 126.1 124.2 137.2 131.4 141.9 1995 ................................ 124.3 178.1 172.2 134.5 126.6 128.2 129.0 139.7 133.0 145.4 1996 ................................ 123.8 176.1 168.7 131.0 126.5 130.4 131.0 141.7 134.1 147.7 1997 ................................ 123.2 183.8 167.9 131.8 125.9 130.8 133.2 141.6 132.7 150.9 1998 ................................ 122.6 179.1 171.7 127.8 124.9 131.3 135.4 141.2 131.4 156.0 1999 ................................ 122.5 183.6 174.1 124.6 124.3 131.7 138.9 141.8 131.7 166.6
2000 ................................ 125.5 178.2 183.7 128.1 124.0 132.6 142.5 143.8 132.3 170.8 2001 ................................ 127.2 174.4 184.8 125.4 123.7 133.2 144.3 145.2 131.5 181.3 2002 ................................ 126.8 173.3 185.9 125.9 122.9 133.5 146.2 144.6 129.9 182.4 2003 ................................ 130.1 177.4 190.0 129.2 121.9 133.9 148.2 145.7 129.6 179.6 2004 ................................ 133.7 195.6 195.6 149.6 122.1 135.0 153.2 148.6 131.0 183.3
2003: Jan ......................... 127.8 171.7 188.5 127.6 122.3 133.7 146.8 145.3 129.9 179.5 Feb ........................ 128.7 173.2 188.8 128.3 122.1 133.6 147.5 145.5 130.0 179.5 Mar ........................ 129.9 172.6 189.1 128.5 122.1 133.6 147.8 146.9 131.7 179.9 Apr ........................ 130.9 172.9 189.6 128.2 122.1 133.8 148.5 144.9 128.9 179.1 May ....................... 131.0 173.1 189.9 128.3 122.1 133.9 148.4 144.8 128.8 179.1 June ....................... 130.5 173.8 190.2 128.3 122.0 134.0 148.2 144.3 127.8 179.3 July ........................ 130.4 176.9 190.3 128.4 121.9 134.1 148.2 144.3 127.5 179.0 Aug ........................ 130.5 177.8 190.4 129.0 121.8 133.9 148.3 144.6 127.7 179.3 Sept ....................... 130.4 184.0 190.6 129.5 121.7 133.6 148.5 144.1 126.8 179.6 Oct ........................ 130.5 184.1 190.8 130.2 121.6 133.9 148.5 148.7 132.8 180.0 Nov ........................ 130.4 184.4 191.1 131.4 121.6 134.3 148.9 147.9 131.8 180.4 Dec ........................ 130.7 183.9 190.9 133.1 121.5 133.9 148.8 147.4 131.0 180.5
2004: Jan ......................... 130.8 183.3 191.2 135.9 121.4 133.6 149.5 147.8 130.9 181.3 Feb ........................ 131.4 189.0 192.2 140.2 121.4 133.9 150.5 147.7 130.6 181.4 Mar ........................ 131.6 194.1 192.9 143.9 121.6 133.7 150.5 148.0 130.9 181.8 Apr ........................ 132.0 197.7 193.9 146.5 122.0 134.0 151.1 147.7 130.3 182.1 May ....................... 132.4 201.6 194.7 147.0 122.1 134.5 151.9 148.0 130.8 181.9 June ....................... 132.9 198.4 195.4 147.3 122.2 134.9 152.6 148.4 130.9 182.5 July ........................ 133.4 196.5 196.2 151.3 122.1 134.9 153.4 147.2 129.1 182.8 Aug 2 ..................... 133.9 202.1 197.3 154.0 122.2 135.6 154.4 147.4 128.9 183.4 Sept ....................... 135.1 203.1 198.1 154.9 122.5 135.5 155.5 147.5 128.9 184.4 Oct ........................ 136.4 196.7 198.1 157.0 122.8 135.8 155.7 151.7 134.1 185.1 Nov ........................ 136.8 191.9 198.5 158.3 122.7 136.9 156.3 151.1 133.3 186.0 Dec ........................ 137.8 193.0 199.2 158.6 122.7 137.1 156.8 151.1 133.1 186.5
Source: Department of Labor, Bureau of Labor Statistics.
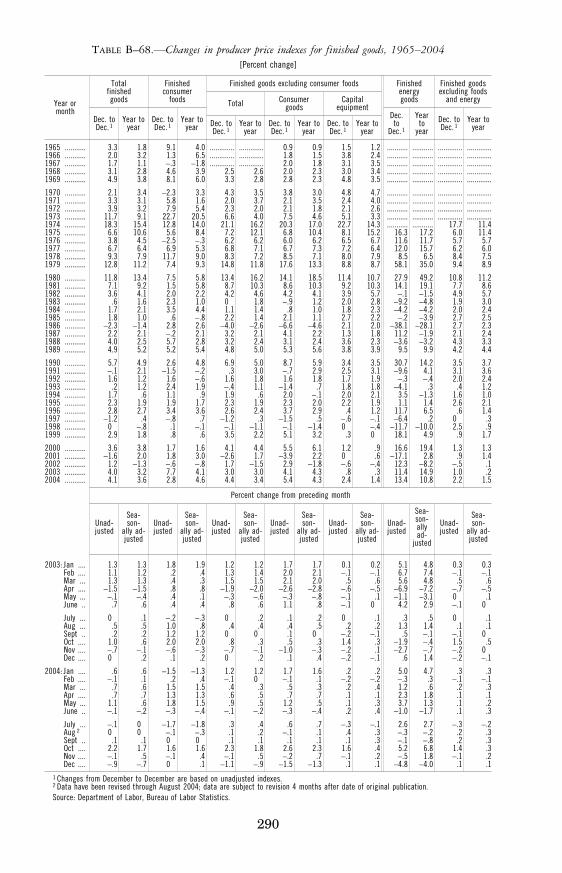
290
TABLE B–68.—Changes in producer price indexes for finished goods, 1965–2004 [Percent change]
Year or month
Total finished goods
Finished consumer
foods
Finished goods excluding consumer foods Finished energy goods
Finished goods excluding foods
and energy
Dec. to Dec. 1
Year to year
Dec. to Dec. 1
Year to year
Total Consumer goods
Capital equipment
Dec. to
Dec. 1
Year to
year Dec. to Dec. 1
Year to year Dec. to
Dec. 1 Year to
year Dec. to Dec. 1
Year to year
Dec. to Dec. 1
Year to year
1965 ........... 3 .3 1 .8 9 .1 4 .0 ............. ............. 0 .9 0 .9 1 .5 1 .2 ........... ........... ............. .............1966 ........... 2 .0 3 .2 1 .3 6 .5 ............. ............. 1 .8 1 .5 3 .8 2 .4 ........... ........... ............. .............1967 ........... 1 .7 1 .1 − .3 −1 .8 ............. ............. 2 .0 1 .8 3 .1 3 .5 ........... ........... ............. .............1968 ........... 3 .1 2 .8 4 .6 3 .9 2 .5 2 .6 2 .0 2 .3 3 .0 3 .4 ........... ........... ............. .............1969 ........... 4 .9 3 .8 8 .1 6 .0 3 .3 2 .8 2 .8 2 .3 4 .8 3 .5 ........... ........... ............. .............
1970 ........... 2 .1 3 .4 −2 .3 3 .3 4 .3 3 .5 3 .8 3 .0 4 .8 4 .7 ........... ........... ............. .............1971 ........... 3 .3 3 .1 5 .8 1 .6 2 .0 3 .7 2 .1 3 .5 2 .4 4 .0 ........... ........... ............. .............1972 ........... 3 .9 3 .2 7 .9 5 .4 2 .3 2 .0 2 .1 1 .8 2 .1 2 .6 ........... ........... ............. .............1973 ........... 11 .7 9 .1 22 .7 20 .5 6 .6 4 .0 7 .5 4 .6 5 .1 3 .3 ........... ........... ............. .............1974 ........... 18 .3 15 .4 12 .8 14 .0 21 .1 16 .2 20 .3 17 .0 22 .7 14 .3 ........... ........... 17 .7 11 .4 1975 ........... 6 .6 10 .6 5 .6 8 .4 7 .2 12 .1 6 .8 10 .4 8 .1 15 .2 16 .3 17 .2 6 .0 11 .4 1976 ........... 3 .8 4 .5 −2 .5 − .3 6 .2 6 .2 6 .0 6 .2 6 .5 6 .7 11 .6 11 .7 5 .7 5 .7 1977 ........... 6 .7 6 .4 6 .9 5 .3 6 .8 7 .1 6 .7 7 .3 7 .2 6 .4 12 .0 15 .7 6 .2 6 .0 1978 ........... 9 .3 7 .9 11 .7 9 .0 8 .3 7 .2 8 .5 7 .1 8 .0 7 .9 8 .5 6 .5 8 .4 7 .5 1979 ........... 12 .8 11 .2 7 .4 9 .3 14 .8 11 .8 17 .6 13 .3 8 .8 8 .7 58 .1 35 .0 9 .4 8 .9
1980 ........... 11 .8 13 .4 7 .5 5 .8 13 .4 16 .2 14 .1 18 .5 11 .4 10 .7 27 .9 49 .2 10 .8 11 .2 1981 ........... 7 .1 9 .2 1 .5 5 .8 8 .7 10 .3 8 .6 10 .3 9 .2 10 .3 14 .1 19 .1 7 .7 8 .6 1982 ........... 3 .6 4 .1 2 .0 2 .2 4 .2 4 .6 4 .2 4 .1 3 .9 5 .7 − .1 −1 .5 4 .9 5 .7 1983 ........... .6 1 .6 2 .3 1 .0 0 1 .8 − .9 1 .2 2 .0 2 .8 −9 .2 −4 .8 1 .9 3 .0 1984 ........... 1 .7 2 .1 3 .5 4 .4 1 .1 1 .4 .8 1 .0 1 .8 2 .3 −4 .2 −4 .2 2 .0 2 .4 1985 ........... 1 .8 1 .0 .6 − .8 2 .2 1 .4 2 .1 1 .1 2 .7 2 .2 − .2 −3 .9 2 .7 2 .5 1986 ........... −2 .3 −1 .4 2 .8 2 .6 −4 .0 −2 .6 −6 .6 −4 .6 2 .1 2 .0 −38 .1 −28 .1 2 .7 2 .3 1987 ........... 2 .2 2 .1 − .2 2 .1 3 .2 2 .1 4 .1 2 .2 1 .3 1 .8 11 .2 −1 .9 2 .1 2 .4 1988 ........... 4 .0 2 .5 5 .7 2 .8 3 .2 2 .4 3 .1 2 .4 3 .6 2 .3 −3 .6 −3 .2 4 .3 3 .3 1989 ........... 4 .9 5 .2 5 .2 5 .4 4 .8 5 .0 5 .3 5 .6 3 .8 3 .9 9 .5 9 .9 4 .2 4 .4
1990 ........... 5 .7 4 .9 2 .6 4 .8 6 .9 5 .0 8 .7 5 .9 3 .4 3 .5 30 .7 14 .2 3 .5 3 .7 1991 ........... − .1 2 .1 −1 .5 − .2 .3 3 .0 − .7 2 .9 2 .5 3 .1 −9 .6 4 .1 3 .1 3 .6 1992 ........... 1 .6 1 .2 1 .6 − .6 1 .6 1 .8 1 .6 1 .8 1 .7 1 .9 − .3 − .4 2 .0 2 .4 1993 ........... .2 1 .2 2 .4 1 .9 − .4 1 .1 −1 .4 .7 1 .8 1 .8 −4 .1 .3 .4 1 .2 1994 ........... 1 .7 .6 1 .1 .9 1 .9 .6 2 .0 − .1 2 .0 2 .1 3 .5 −1 .3 1 .6 1 .0 1995 ........... 2 .3 1 .9 1 .9 1 .7 2 .3 1 .9 2 .3 2 .0 2 .2 1 .9 1 .1 1 .4 2 .6 2 .1 1996 ........... 2 .8 2 .7 3 .4 3 .6 2 .6 2 .4 3 .7 2 .9 .4 1 .2 11 .7 6 .5 .6 1 .4 1997 ........... −1 .2 .4 − .8 .7 −1 .2 .3 −1 .5 .5 − .6 − .1 −6 .4 .2 0 .3 1998 ........... 0 − .8 .1 − .1 − .1 −1 .1 − .1 −1 .4 0 − .4 −11 .7 −10 .0 2 .5 .9 1999 ........... 2 .9 1 .8 .8 .6 3 .5 2 .2 5 .1 3 .2 .3 0 18 .1 4 .9 .9 1 .7
2000 ........... 3 .6 3 .8 1 .7 1 .6 4 .1 4 .4 5 .5 6 .1 1 .2 .9 16 .6 19 .4 1 .3 1 .3 2001 ........... −1 .6 2 .0 1 .8 3 .0 −2 .6 1 .7 −3 .9 2 .2 0 .6 −17 .1 2 .8 .9 1 .4 2002 ........... 1 .2 −1 .3 − .6 − .8 1 .7 −1 .5 2 .9 −1 .8 − .6 − .4 12 .3 −8 .2 − .5 .1 2003 ........... 4 .0 3 .2 7 .7 4 .1 3 .0 3 .0 4 .1 4 .3 .8 .3 11 .4 14 .9 1 .0 .2 2004 ........... 4 .1 3 .6 2 .8 4 .6 4 .4 3 .4 5 .4 4 .3 2 .4 1 .4 13 .4 10 .8 2 .2 1 .5
Percent change from preceding month
Unad- justed
Sea- son-
ally ad- justed
Unad- justed
Sea- son-
ally ad- justed
Unad- justed
Sea- son-
ally ad- justed
Unad- justed
Sea- son-
ally ad- justed
Unad- justed
Sea- son-
ally ad- justed
Unad- justed
Sea- son- ally ad-
justed
Unad- justed
Sea- son-
ally ad- justed
2003: Jan .... 1 .3 1 .3 1 .8 1 .9 1 .2 1 .2 1 .7 1 .7 0 .1 0 .2 5 .1 4 .8 0 .3 0 .3 Feb .... 1 .1 1 .2 .2 .4 1 .3 1 .4 2 .0 2 .1 − .1 − .1 6 .7 7 .4 − .1 − .1 Mar ... 1 .3 1 .3 .4 .3 1 .5 1 .5 2 .1 2 .0 .5 .6 5 .6 4 .8 .5 .6 Apr .... −1 .5 −1 .5 .8 .8 −1 .9 −2 .0 −2 .6 −2 .8 − .6 − .5 −6 .9 −7 .2 − .7 − .5 May ... − .1 − .4 .4 .1 − .3 − .6 − .3 − .8 − .1 .1 −1 .1 −3 .1 0 .1 June .. .7 .6 .4 .4 .8 .6 1 .1 .8 − .1 0 4 .2 2 .9 − .1 0
July ... 0 .1 − .2 − .3 0 .2 .1 .2 0 .1 .3 .5 0 .1 Aug ... .5 .5 1 .0 .8 .4 .4 .4 .5 .2 .2 1 .3 1 .4 .1 .1 Sept .. .2 .2 1 .2 1 .2 0 0 .1 0 − .2 − .1 .5 − .1 − .1 0 Oct .... 1 .0 .6 2 .0 2 .0 .8 .3 .5 .3 1 .4 .3 −1 .9 − .4 1 .5 .5 Nov .... − .7 − .1 − .6 − .3 − .7 − .1 −1 .0 − .3 − .2 .1 −2 .7 − .7 − .2 0 Dec .... 0 .2 .1 .2 0 .2 .1 .4 − .2 − .1 .6 1 .4 − .2 − .1
2004: Jan .... .6 .6 −1 .5 −1 .3 1 .2 1 .2 1 .7 1 .6 .2 .2 5 .0 4 .7 .3 .3 Feb .... − .1 .1 .2 .4 − .1 0 − .1 .1 − .2 − .2 − .3 .3 − .1 − .1 Mar ... .7 .6 1 .5 1 .5 .4 .3 .5 .3 .2 .4 1 .2 .6 .2 .3 Apr .... .7 .7 1 .3 1 .3 .6 .5 .7 .7 .1 .1 2 .3 1 .8 .1 .1 May ... 1 .1 .6 1 .8 1 .5 .9 .5 1 .2 .5 .1 .3 3 .7 1 .3 .1 .2 June .. − .1 − .2 − .3 − .4 − .1 − .2 − .3 − .4 .2 .4 −1 .0 −1 .7 .1 .3
July ... − .1 0 −1 .7 −1 .8 .3 .4 .6 .7 − .3 − .1 2 .6 2 .7 − .3 − .2 Aug 2 0 0 − .1 − .3 .1 .2 − .1 .1 .4 .3 − .3 − .2 .2 .3 Sept .. .1 .1 0 0 .1 .1 .1 .1 .1 .3 − .1 − .8 .2 .3 Oct .... 2 .2 1 .7 1 .6 1 .6 2 .3 1 .8 2 .6 2 .3 1 .6 .4 5 .2 6 .8 1 .4 .3 Nov .... − .1 .5 − .1 .4 − .1 .5 − .2 .7 − .1 .2 − .5 1 .8 − .1 .2 Dec .... − .9 − .7 0 .1 −1 .1 − .9 −1 .5 −1 .3 .1 .1 −4 .8 −4 .0 .1 .1
1 Changes from December to December are based on unadjusted indexes. 2 Data have been revised through August 2004; data are subject to revision 4 months after date of original publication. Source: Department of Labor, Bureau of Labor Statistics.
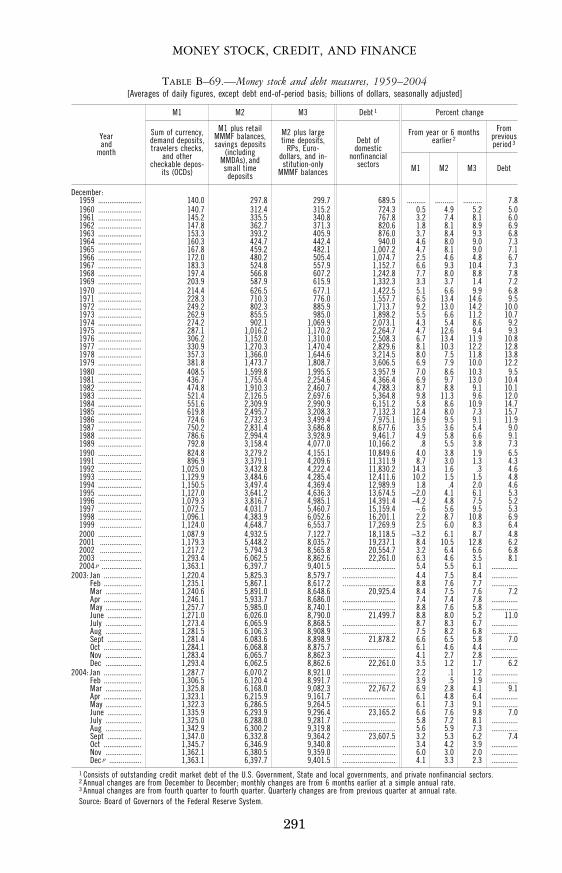
291
MONEY STOCK, CREDIT, AND FINANCE
TABLE B–69.—Money stock and debt measures, 1959–2004 [Averages of daily figures, except debt end-of-period basis; billions of dollars, seasonally adjusted]
Year and
month
M1 M2 M3 Debt 1 Percent change
Sum of currency, demand deposits, travelers checks,
and other checkable depos-
its (OCDs)
M1 plus retail MMMF balances, savings deposits
(including MMDAs), and small time deposits
M2 plus large time deposits,
RPs, Euro- dollars, and in-stitution-only
MMMF balances
Debt of domestic
nonfinancial sectors
From year or 6 months earlier 2
From previous period 3
M1 M2 M3 Debt
December: 1959 ....................... 140.0 297.8 299.7 689.5 .......... .......... .......... 7.8 1960 ....................... 140.7 312.4 315.2 724.3 0.5 4.9 5.2 5.0 1961 ....................... 145.2 335.5 340.8 767.8 3.2 7.4 8.1 6.0 1962 ....................... 147.8 362.7 371.3 820.6 1.8 8.1 8.9 6.9 1963 ....................... 153.3 393.2 405.9 876.0 3.7 8.4 9.3 6.8 1964 ....................... 160.3 424.7 442.4 940.0 4.6 8.0 9.0 7.3 1965 ....................... 167.8 459.2 482.1 1,007.2 4.7 8.1 9.0 7.1 1966 ....................... 172.0 480.2 505.4 1,074.7 2.5 4.6 4.8 6.7 1967 ....................... 183.3 524.8 557.9 1,152.7 6.6 9.3 10.4 7.3 1968 ....................... 197.4 566.8 607.2 1,242.8 7.7 8.0 8.8 7.8 1969 ....................... 203.9 587.9 615.9 1,332.3 3.3 3.7 1.4 7.2 1970 ....................... 214.4 626.5 677.1 1,422.5 5.1 6.6 9.9 6.8 1971 ....................... 228.3 710.3 776.0 1,557.7 6.5 13.4 14.6 9.5 1972 ....................... 249.2 802.3 885.9 1,713.7 9.2 13.0 14.2 10.0 1973 ....................... 262.9 855.5 985.0 1,898.2 5.5 6.6 11.2 10.7 1974 ....................... 274.2 902.1 1,069.9 2,073.1 4.3 5.4 8.6 9.2 1975 ....................... 287.1 1,016.2 1,170.2 2,264.7 4.7 12.6 9.4 9.3 1976 ....................... 306.2 1,152.0 1,310.0 2,508.3 6.7 13.4 11.9 10.8 1977 ....................... 330.9 1,270.3 1,470.4 2,829.6 8.1 10.3 12.2 12.8 1978 ....................... 357.3 1,366.0 1,644.6 3,214.5 8.0 7.5 11.8 13.8 1979 ....................... 381.8 1,473.7 1,808.7 3,606.5 6.9 7.9 10.0 12.2 1980 ....................... 408.5 1,599.8 1,995.5 3,957.9 7.0 8.6 10.3 9.5 1981 ....................... 436.7 1,755.4 2,254.6 4,366.4 6.9 9.7 13.0 10.4 1982 ....................... 474.8 1,910.3 2,460.7 4,788.3 8.7 8.8 9.1 10.1 1983 ....................... 521.4 2,126.5 2,697.6 5,364.8 9.8 11.3 9.6 12.0 1984 ....................... 551.6 2,309.9 2,990.9 6,151.2 5.8 8.6 10.9 14.7 1985 ....................... 619.8 2,495.7 3,208.3 7,132.3 12.4 8.0 7.3 15.7 1986 ....................... 724.6 2,732.3 3,499.4 7,975.1 16.9 9.5 9.1 11.9 1987 ....................... 750.2 2,831.4 3,686.8 8,677.6 3.5 3.6 5.4 9.0 1988 ....................... 786.6 2,994.4 3,928.9 9,461.7 4.9 5.8 6.6 9.1 1989 ....................... 792.8 3,158.4 4,077.0 10,166.2 .8 5.5 3.8 7.3 1990 ....................... 824.8 3,279.2 4,155.1 10,849.6 4.0 3.8 1.9 6.5 1991 ....................... 896.9 3,379.1 4,209.6 11,311.9 8.7 3.0 1.3 4.3 1992 ....................... 1,025.0 3,432.8 4,222.4 11,830.2 14.3 1.6 .3 4.6 1993 ....................... 1,129.9 3,484.6 4,285.4 12,411.6 10.2 1.5 1.5 4.8 1994 ....................... 1,150.5 3,497.4 4,369.4 12,989.9 1.8 .4 2.0 4.6 1995 ....................... 1,127.0 3,641.2 4,636.3 13,674.5 −2.0 4.1 6.1 5.3 1996 ....................... 1,079.3 3,816.7 4,985.1 14,391.4 −4.2 4.8 7.5 5.2 1997 ....................... 1,072.5 4,031.7 5,460.7 15,159.4 −.6 5.6 9.5 5.3 1998 ....................... 1,096.1 4,383.9 6,052.6 16,201.1 2.2 8.7 10.8 6.9 1999 ...................... 1,124.0 4,648.7 6,553.7 17,269.9 2.5 6.0 8.3 6.4 2000 ....................... 1,087.9 4,932.5 7,122.7 18,118.5 −3.2 6.1 8.7 4.8 2001 ...................... 1,179.3 5,448.2 8,035.7 19,237.1 8.4 10.5 12.8 6.2 2002 ...................... 1,217.2 5,794.3 8,565.8 20,554.7 3.2 6.4 6.6 6.8 2003 ...................... 1,293.4 6,062.5 8,862.6 22,261.0 6.3 4.6 3.5 8.1 2004 p ..................... 1,363.1 6,397.7 9,401.5 ............................ 5.4 5.5 6.1 ..............
2003: Jan .................... 1,220.4 5,825.3 8,579.7 ............................ 4.4 7.5 8.4 ..............Feb .................... 1,235.1 5,867.1 8,617.2 ............................ 8.8 7.6 7.7 ..............Mar ................... 1,240.6 5,891.0 8,648.6 20,925.4 8.4 7.5 7.6 7.2 Apr .................... 1,246.1 5,933.7 8,686.0 ............................ 7.4 7.4 7.8 ..............May ................... 1,257.7 5,985.0 8,740.1 ............................ 8.8 7.6 5.8 ..............June .................. 1,271.0 6,026.0 8,790.0 21,499.7 8.8 8.0 5.2 11.0 July ................... 1,273.4 6,065.9 8,868.5 ............................ 8.7 8.3 6.7 ..............Aug ................... 1,281.5 6,106.3 8,908.9 ............................ 7.5 8.2 6.8 ..............Sept .................. 1,281.4 6,083.6 8,898.9 21,878.2 6.6 6.5 5.8 7.0 Oct .................... 1,284.1 6,068.8 8,875.7 ............................ 6.1 4.6 4.4 ..............Nov ................... 1,283.4 6,065.7 8,862.3 ............................ 4.1 2.7 2.8 ..............Dec ................... 1,293.4 6,062.5 8,862.6 22,261.0 3.5 1.2 1.7 6.2
2004: Jan .................... 1,287.7 6,070.2 8,921.0 ............................ 2.2 .1 1.2 ..............Feb .................... 1,306.5 6,120.4 8,991.7 ............................ 3.9 .5 1.9 ..............Mar ................... 1,325.8 6,168.0 9,082.3 22,767.2 6.9 2.8 4.1 9.1 Apr .................... 1,323.1 6,215.9 9,161.7 ............................ 6.1 4.8 6.4 ..............May ................... 1,322.3 6,286.5 9,264.5 ............................ 6.1 7.3 9.1 ..............June .................. 1,335.9 6,293.9 9,296.4 23,165.2 6.6 7.6 9.8 7.0 July ................... 1,325.0 6,288.0 9,281.7 ............................ 5.8 7.2 8.1 ..............Aug ................... 1,342.9 6,300.2 9,319.8 ............................ 5.6 5.9 7.3 ..............Sept .................. 1,347.0 6,332.8 9,364.2 23,607.5 3.2 5.3 6.2 7.4 Oct .................... 1,345.7 6,346.9 9,340.8 ............................ 3.4 4.2 3.9 ..............Nov ................... 1,362.1 6,380.5 9,359.0 ............................ 6.0 3.0 2.0 ..............Dec p ................. 1,363.1 6,397.7 9,401.5 ............................ 4.1 3.3 2.3 ..............
1 Consists of outstanding credit market debt of the U.S. Government, State and local governments, and private nonfinancial sectors. 2 Annual changes are from December to December; monthly changes are from 6 months earlier at a simple annual rate. 3 Annual changes are from fourth quarter to fourth quarter. Quarterly changes are from previous quarter at annual rate. Source: Board of Governors of the Federal Reserve System.
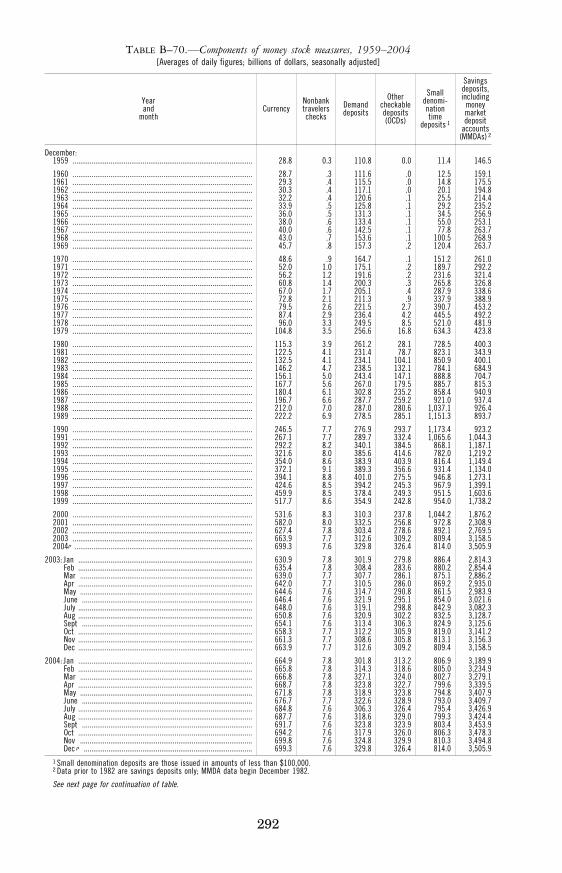
292
TABLE B–70.—Components of money stock measures, 1959–2004 [Averages of daily figures; billions of dollars, seasonally adjusted]
Year and
month Currency
Nonbank travelers checks
Demand deposits
Other checkable deposits (OCDs)
Small denomi- nation time
deposits 1
Savings deposits, including
money market deposit
accounts (MMDAs) 2
December: 1959 ............................................................................................... 28.8 0.3 110.8 0.0 11.4 146.5
1960 ............................................................................................... 28.7 .3 111.6 .0 12.5 159.1 1961 ............................................................................................... 29.3 .4 115.5 .0 14.8 175.5 1962 ............................................................................................... 30.3 .4 117.1 .0 20.1 194.8 1963 ............................................................................................... 32.2 .4 120.6 .1 25.5 214.4 1964 ............................................................................................... 33.9 .5 125.8 .1 29.2 235.2 1965 ............................................................................................... 36.0 .5 131.3 .1 34.5 256.9 1966 ............................................................................................... 38.0 .6 133.4 .1 55.0 253.1 1967 ............................................................................................... 40.0 .6 142.5 .1 77.8 263.7 1968 ............................................................................................... 43.0 .7 153.6 .1 100.5 268.9 1969 ............................................................................................... 45.7 .8 157.3 .2 120.4 263.7
1970 ............................................................................................... 48.6 .9 164.7 .1 151.2 261.0 1971 ............................................................................................... 52.0 1.0 175.1 .2 189.7 292.2 1972 ............................................................................................... 56.2 1.2 191.6 .2 231.6 321.4 1973 ............................................................................................... 60.8 1.4 200.3 .3 265.8 326.8 1974 ............................................................................................... 67.0 1.7 205.1 .4 287.9 338.6 1975 ............................................................................................... 72.8 2.1 211.3 .9 337.9 388.9 1976 ............................................................................................... 79.5 2.6 221.5 2.7 390.7 453.2 1977 ............................................................................................... 87.4 2.9 236.4 4.2 445.5 492.2 1978 ............................................................................................... 96.0 3.3 249.5 8.5 521.0 481.9 1979 ............................................................................................... 104.8 3.5 256.6 16.8 634.3 423.8
1980 ............................................................................................... 115.3 3.9 261.2 28.1 728.5 400.3 1981 ............................................................................................... 122.5 4.1 231.4 78.7 823.1 343.9 1982 ............................................................................................... 132.5 4.1 234.1 104.1 850.9 400.1 1983 ............................................................................................... 146.2 4.7 238.5 132.1 784.1 684.9 1984 ............................................................................................... 156.1 5.0 243.4 147.1 888.8 704.7 1985 ............................................................................................... 167.7 5.6 267.0 179.5 885.7 815.3 1986 ............................................................................................... 180.4 6.1 302.8 235.2 858.4 940.9 1987 ............................................................................................... 196.7 6.6 287.7 259.2 921.0 937.4 1988 ............................................................................................... 212.0 7.0 287.0 280.6 1,037.1 926.4 1989 ............................................................................................... 222.2 6.9 278.5 285.1 1,151.3 893.7
1990 ............................................................................................... 246.5 7.7 276.9 293.7 1,173.4 923.2 1991 ............................................................................................... 267.1 7.7 289.7 332.4 1,065.6 1,044.3 1992 ............................................................................................... 292.2 8.2 340.1 384.5 868.1 1,187.1 1993 ............................................................................................... 321.6 8.0 385.6 414.6 782.0 1,219.2 1994 ............................................................................................... 354.0 8.6 383.9 403.9 816.4 1,149.4 1995 ............................................................................................... 372.1 9.1 389.3 356.6 931.4 1,134.0 1996 ............................................................................................... 394.1 8.8 401.0 275.5 946.8 1,273.1 1997 ............................................................................................... 424.6 8.5 394.2 245.3 967.9 1,399.1 1998 ............................................................................................... 459.9 8.5 378.4 249.3 951.5 1,603.6 1999 ............................................................................................... 517.7 8.6 354.9 242.8 954.0 1,738.2
2000 ............................................................................................... 531.6 8.3 310.3 237.8 1,044.2 1,876.2 2001 ............................................................................................... 582.0 8.0 332.5 256.8 972.8 2,308.9 2002 ............................................................................................... 627.4 7.8 303.4 278.6 892.1 2,769.5 2003 ............................................................................................... 663.9 7.7 312.6 309.2 809.4 3,158.5 2004p .............................................................................................. 699.3 7.6 329.8 326.4 814.0 3,505.9
2003: Jan ............................................................................................ 630.9 7.8 301.9 279.8 886.4 2,814.3 Feb ............................................................................................ 635.4 7.8 308.4 283.6 880.2 2,854.4 Mar ........................................................................................... 639.0 7.7 307.7 286.1 875.1 2,886.2 Apr ............................................................................................ 642.0 7.7 310.5 286.0 869.2 2,935.0 May ........................................................................................... 644.6 7.6 314.7 290.8 861.5 2,983.9 June .......................................................................................... 646.4 7.6 321.9 295.1 854.0 3,021.6 July ............................................................................................ 648.0 7.6 319.1 298.8 842.9 3,082.3 Aug ............................................................................................ 650.8 7.6 320.9 302.2 832.5 3,128.7 Sept .......................................................................................... 654.1 7.6 313.4 306.3 824.9 3,125.6 Oct ............................................................................................ 658.3 7.7 312.2 305.9 819.0 3,141.2 Nov ............................................................................................ 661.3 7.7 308.6 305.8 813.1 3,156.3 Dec ............................................................................................ 663.9 7.7 312.6 309.2 809.4 3,158.5
2004: Jan ............................................................................................ 664.9 7.8 301.8 313.2 806.9 3,189.9 Feb ............................................................................................ 665.8 7.8 314.3 318.6 805.0 3,234.9 Mar ........................................................................................... 666.8 7.8 327.1 324.0 802.7 3,279.1 Apr ............................................................................................ 668.7 7.8 323.8 322.7 799.6 3,339.5 May ........................................................................................... 671.8 7.8 318.9 323.8 794.8 3,407.9 June .......................................................................................... 676.7 7.7 322.6 328.9 793.0 3,409.7 July ............................................................................................ 684.8 7.6 306.3 326.4 795.4 3,426.9 Aug ............................................................................................ 687.7 7.6 318.6 329.0 799.3 3,424.4 Sept .......................................................................................... 691.7 7.6 323.8 323.9 803.4 3,453.9 Oct ............................................................................................ 694.2 7.6 317.9 326.0 806.3 3,478.3 Nov ........................................................................................... 699.8 7.6 324.8 329.9 810.3 3,494.8 Dec p ......................................................................................... 699.3 7.6 329.8 326.4 814.0 3,505.9
1 Small denomination deposits are those issued in amounts of less than $100,000. 2 Data prior to 1982 are savings deposits only; MMDA data begin December 1982.
See next page for continuation of table.
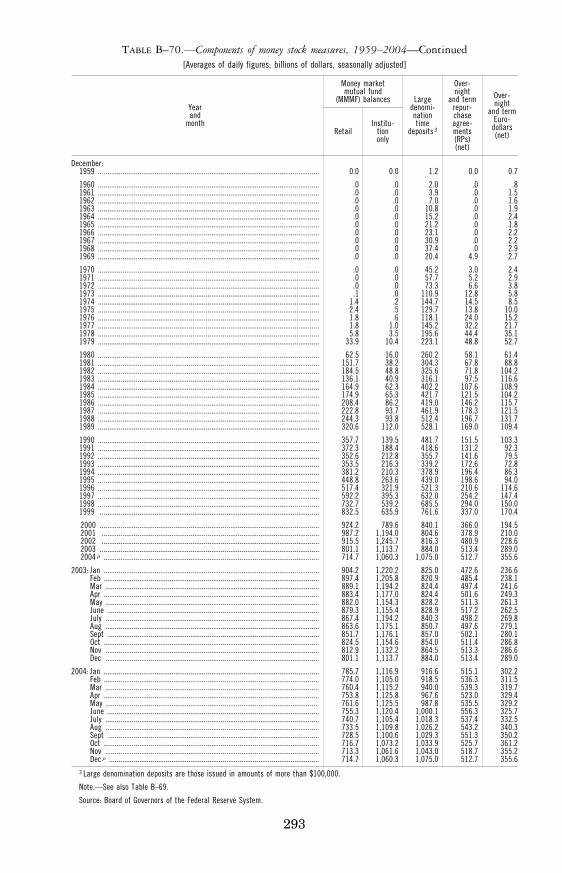
293
TABLE B–70.—Components of money stock measures, 1959–2004—Continued [Averages of daily figures; billions of dollars, seasonally adjusted]
Year and
month
Money market mutual fund
(MMMF) balances Large denomi- nation time
deposits 3
Over- night
and term repur- chase agree- ments (RPs) (net)
Over- night
and term Euro-
dollars (net) Retail
Institu- tion only
December: 1959 ..................................................................................................................... 0.0 0.0 1.2 0.0 0.7
1960 ..................................................................................................................... .0 .0 2.0 .0 .8 1961 ..................................................................................................................... .0 .0 3.9 .0 1.5 1962 ..................................................................................................................... .0 .0 7.0 .0 1.6 1963 ..................................................................................................................... .0 .0 10.8 .0 1.9 1964 ..................................................................................................................... .0 .0 15.2 .0 2.4 1965 ..................................................................................................................... .0 .0 21.2 .0 1.8 1966 ..................................................................................................................... .0 .0 23.1 .0 2.2 1967 ..................................................................................................................... .0 .0 30.9 .0 2.2 1968 ..................................................................................................................... .0 .0 37.4 .0 2.9 1969 ..................................................................................................................... .0 .0 20.4 4.9 2.7
1970 ..................................................................................................................... .0 .0 45.2 3.0 2.4 1971 ..................................................................................................................... .0 .0 57.7 5.2 2.9 1972 ..................................................................................................................... .0 .0 73.3 6.6 3.8 1973 ..................................................................................................................... .1 .0 110.9 12.8 5.8 1974 ..................................................................................................................... 1.4 .2 144.7 14.5 8.5 1975 ..................................................................................................................... 2.4 .5 129.7 13.8 10.0 1976 ..................................................................................................................... 1.8 .6 118.1 24.0 15.2 1977 ..................................................................................................................... 1.8 1.0 145.2 32.2 21.7 1978 ..................................................................................................................... 5.8 3.5 195.6 44.4 35.1 1979 ..................................................................................................................... 33.9 10.4 223.1 48.8 52.7
1980 ..................................................................................................................... 62.5 16.0 260.2 58.1 61.4 1981 ..................................................................................................................... 151.7 38.2 304.3 67.8 88.8 1982 ..................................................................................................................... 184.5 48.8 325.6 71.8 104.2 1983 ..................................................................................................................... 136.1 40.9 316.1 97.5 116.6 1984 ..................................................................................................................... 164.9 62.3 402.2 107.6 108.9 1985 ..................................................................................................................... 174.9 65.3 421.7 121.5 104.2 1986 ..................................................................................................................... 208.4 86.2 419.0 146.2 115.7 1987 ..................................................................................................................... 222.8 93.7 461.9 178.3 121.5 1988 ..................................................................................................................... 244.3 93.8 512.4 196.7 131.7 1989 ..................................................................................................................... 320.6 112.0 528.1 169.0 109.4
1990 ..................................................................................................................... 357.7 139.5 481.7 151.5 103.3 1991 ..................................................................................................................... 372.3 188.4 418.6 131.2 92.3 1992 ..................................................................................................................... 352.6 212.8 355.7 141.6 79.5 1993 ..................................................................................................................... 353.5 216.3 339.2 172.6 72.8 1994 ..................................................................................................................... 381.2 210.3 378.9 196.4 86.3 1995 ..................................................................................................................... 448.8 263.6 439.0 198.6 94.0 1996 ..................................................................................................................... 517.4 321.9 521.3 210.6 114.6 1997 ..................................................................................................................... 592.2 395.3 632.0 254.2 147.4 1998 ..................................................................................................................... 732.7 539.2 685.5 294.0 150.0 1999 .................................................................................................................... 832.5 635.9 761.6 337.0 170.4
2000 .................................................................................................................... 924.2 789.6 840.1 366.0 194.5 2001 ................................................................................................................... 987.2 1,194.0 804.6 378.9 210.0 2002 ................................................................................................................... 915.5 1,245.7 816.3 480.9 228.6 2003 .................................................................................................................... 801.1 1,113.7 884.0 513.4 289.0 2004 p .................................................................................................................. 714.7 1,060.3 1,075.0 512.7 355.6
2003: Jan .................................................................................................................. 904.2 1,220.2 825.0 472.6 236.6 Feb .................................................................................................................. 897.4 1,205.8 820.9 485.4 238.1 Mar ................................................................................................................. 889.1 1,194.2 824.4 497.4 241.6 Apr .................................................................................................................. 883.4 1,177.0 824.4 501.6 249.3 May ................................................................................................................. 882.0 1,154.3 828.2 511.3 261.3 June ................................................................................................................ 879.3 1,155.4 828.9 517.2 262.5 July ................................................................................................................. 867.4 1,194.2 840.3 498.2 269.8 Aug ................................................................................................................. 863.6 1,175.1 850.7 497.6 279.1 Sept ................................................................................................................ 851.7 1,176.1 857.0 502.1 280.1 Oct .................................................................................................................. 824.5 1,154.6 854.0 511.4 286.8 Nov ................................................................................................................. 812.9 1,132.2 864.5 513.3 286.6 Dec ................................................................................................................. 801.1 1,113.7 884.0 513.4 289.0
2004: Jan .................................................................................................................. 785.7 1,116.9 916.6 515.1 302.2 Feb .................................................................................................................. 774.0 1,105.0 918.5 536.3 311.5 Mar ................................................................................................................. 760.4 1,115.2 940.0 539.3 319.7 Apr .................................................................................................................. 753.8 1,125.8 967.6 523.0 329.4 May ................................................................................................................. 761.6 1,125.5 987.8 535.5 329.2 June ................................................................................................................ 755.3 1,120.4 1,000.1 556.3 325.7 July ................................................................................................................. 740.7 1,105.4 1,018.3 537.4 332.5 Aug ................................................................................................................. 733.5 1,109.8 1,026.2 543.2 340.3 Sept ................................................................................................................ 728.5 1,100.6 1,029.3 551.3 350.2 Oct .................................................................................................................. 716.7 1,073.2 1,033.9 525.7 361.2 Nov ................................................................................................................. 713.3 1,061.6 1,043.0 518.7 355.2 Dec p ............................................................................................................... 714.7 1,060.3 1,075.0 512.7 355.6
3 Large denomination deposits are those issued in amounts of more than $100,000.
Note.—See also Table B–69.
Source: Board of Governors of the Federal Reserve System.
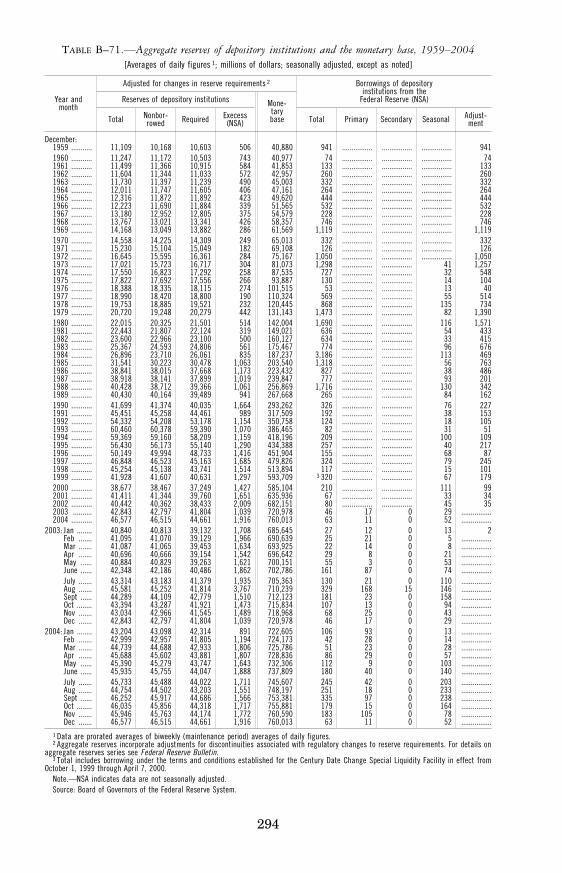
294
TABLE B–71.—Aggregate reserves of depository institutions and the monetary base, 1959–2004 [Averages of daily figures 1; millions of dollars; seasonally adjusted, except as noted]
Year and month
Adjusted for changes in reserve requirements 2 Borrowings of depository institutions from the
Federal Reserve (NSA) Reserves of depository institutions Mone- tary base Total Primary Secondary Seasonal Adjust-
ment Total Nonbor- rowed Required Execess
(NSA)
December: 1959 ........... 11,109 10,168 10,603 506 40,880 941 ................ ................ ................ 941 1960 ........... 11,247 11,172 10,503 743 40,977 74 ................ ................ ................ 74 1961 ........... 11,499 11,366 10,915 584 41,853 133 ................ ................ ................ 133 1962 ........... 11,604 11,344 11,033 572 42,957 260 ................ ................ ................ 260 1963 ........... 11,730 11,397 11,239 490 45,003 332 ................ ................ ................ 332 1964 ........... 12,011 11,747 11,605 406 47,161 264 ................ ................ ................ 264 1965 ........... 12,316 11,872 11,892 423 49,620 444 ................ ................ ................ 444 1966 ........... 12,223 11,690 11,884 339 51,565 532 ................ ................ ................ 532 1967 ........... 13,180 12,952 12,805 375 54,579 228 ................ ................ ................ 228 1968 ........... 13,767 13,021 13,341 426 58,357 746 ................ ................ ................ 746 1969 ........... 14,168 13,049 13,882 286 61,569 1,119 ................ ................ ................ 1,119 1970 ........... 14,558 14,225 14,309 249 65,013 332 ................ ................ ................ 332 1971 ........... 15,230 15,104 15,049 182 69,108 126 ................ ................ ................ 126 1972 ........... 16,645 15,595 16,361 284 75,167 1,050 ................ ................ ................ 1,050 1973 ........... 17,021 15,723 16,717 304 81,073 1,298 ................ ................ 41 1,257 1974 ........... 17,550 16,823 17,292 258 87,535 727 ................ ................ 32 548 1975 ........... 17,822 17,692 17,556 266 93,887 130 ................ ................ 14 104 1976 ........... 18,388 18,335 18,115 274 101,515 53 ................ ................ 13 40 1977 ........... 18,990 18,420 18,800 190 110,324 569 ................ ................ 55 514 1978 ........... 19,753 18,885 19,521 232 120,445 868 ................ ................ 135 734 1979 ........... 20,720 19,248 20,279 442 131,143 1,473 ................ ................ 82 1,390 1980 ........... 22,015 20,325 21,501 514 142,004 1,690 ................ ................ 116 1,571 1981 ........... 22,443 21,807 22,124 319 149,021 636 ................ ................ 54 433 1982 ........... 23,600 22,966 23,100 500 160,127 634 ................ ................ 33 415 1983 ........... 25,367 24,593 24,806 561 175,467 774 ................ ................ 96 676 1984 ........... 26,896 23,710 26,061 835 187,237 3,186 ................ ................ 113 469 1985 ........... 31,541 30,223 30,478 1,063 203,540 1,318 ................ ................ 56 763 1986 ........... 38,841 38,015 37,668 1,173 223,432 827 ................ ................ 38 486 1987 ........... 38,918 38,141 37,899 1,019 239,847 777 ................ ................ 93 201 1988 ........... 40,428 38,712 39,366 1,061 256,869 1,716 ................ ................ 130 342 1989 ........... 40,430 40,164 39,489 941 267,668 265 ................ ................ 84 162 1990 ........... 41,699 41,374 40,035 1,664 293,262 326 ................ ................ 76 227 1991 ........... 45,451 45,258 44,461 989 317,509 192 ................ ................ 38 153 1992 ........... 54,332 54,208 53,178 1,154 350,758 124 ................ ................ 18 105 1993 ........... 60,460 60,378 59,390 1,070 386,465 82 ................ ................ 31 51 1994 ........... 59,369 59,160 58,209 1,159 418,196 209 ................ ................ 100 109 1995 ........... 56,430 56,173 55,140 1,290 434,388 257 ................ ................ 40 217 1996 ........... 50,149 49,994 48,733 1,416 451,904 155 ................ ................ 68 87 1997 ........... 46,848 46,523 45,163 1,685 479,826 324 ................ ................ 79 245 1998 ........... 45,254 45,138 43,741 1,514 513,894 117 ................ ................ 15 101 1999 ........... 41,928 41,607 40,631 1,297 593,709 3 320 ................ ................ 67 179 2000 ........... 38,677 38,467 37,249 1,427 585,104 210 ................ ................ 111 99 2001 ........... 41,411 41,344 39,760 1,651 635,936 67 ................ ................ 33 34 2002 ........... 40,442 40,362 38,433 2,009 682,151 80 ................ ................ 45 35 2003 .......... 42,843 42,797 41,804 1,039 720,978 46 17 0 29 ................2004 ........... 46,577 46,515 44,661 1,916 760,013 63 11 0 52 ................
2003: Jan ........ 40,840 40,813 39,132 1,708 685,645 27 12 0 13 2 Feb ....... 41,095 41,070 39,129 1,966 690,639 25 21 0 5 ................Mar ....... 41,087 41,065 39,453 1,634 693,925 22 14 0 8 ................Apr ....... 40,696 40,666 39,154 1,542 696,642 29 8 0 21 ................May ...... 40,884 40,829 39,263 1,621 700,151 55 3 0 53 ................June ...... 42,348 42,186 40,486 1,862 702,786 161 87 0 74 ................July ....... 43,314 43,183 41,379 1,935 705,363 130 21 0 110 ................Aug ....... 45,581 45,252 41,814 3,767 710,239 329 168 15 146 ................Sept ...... 44,289 44,109 42,779 1,510 712,123 181 23 0 158 ................Oct ........ 43,394 43,287 41,921 1,473 715,834 107 13 0 94 ................Nov ....... 43,034 42,966 41,545 1,489 718,968 68 25 0 43 ................Dec ....... 42,843 42,797 41,804 1,039 720,978 46 17 0 29 ................
2004: Jan ........ 43,204 43,098 42,314 891 722,605 106 93 0 13 ................Feb ....... 42,999 42,957 41,805 1,194 724,173 42 28 0 14 ................Mar ....... 44,739 44,688 42,933 1,806 725,786 51 23 0 28 ................Apr ....... 45,688 45,602 43,881 1,807 728,836 86 29 0 57 ................May ...... 45,390 45,279 43,747 1,643 732,306 112 9 0 103 ................June ...... 45,935 45,755 44,047 1,888 737,809 180 40 0 140 ................July ....... 45,733 45,488 44,022 1,711 745,607 245 42 0 203 ................Aug ....... 44,754 44,502 43,203 1,551 748,197 251 18 0 233 ................Sept ...... 46,252 45,917 44,686 1,566 753,381 335 97 0 238 ................Oct ........ 46,035 45,856 44,318 1,717 755,881 179 15 0 164 ................Nov ....... 45,946 45,763 44,174 1,772 760,590 183 105 0 78 ................Dec ....... 46,577 46,515 44,661 1,916 760,013 63 11 0 52 ................
1 Data are prorated averages of biweekly (maintenance period) averages of daily figures. 2 Aggregate reserves incorporate adjustments for discontinuities associated with regulatory changes to reserve requirements. For details on
aggregate reserves series see Federal Reserve Bulletin. 3 Total includes borrowing under the terms and conditions established for the Century Date Change Special Liquidity Facility in effect from
October 1, 1999 through April 7, 2000. Note.—NSA indicates data are not seasonally adjusted. Source: Board of Governors of the Federal Reserve System.
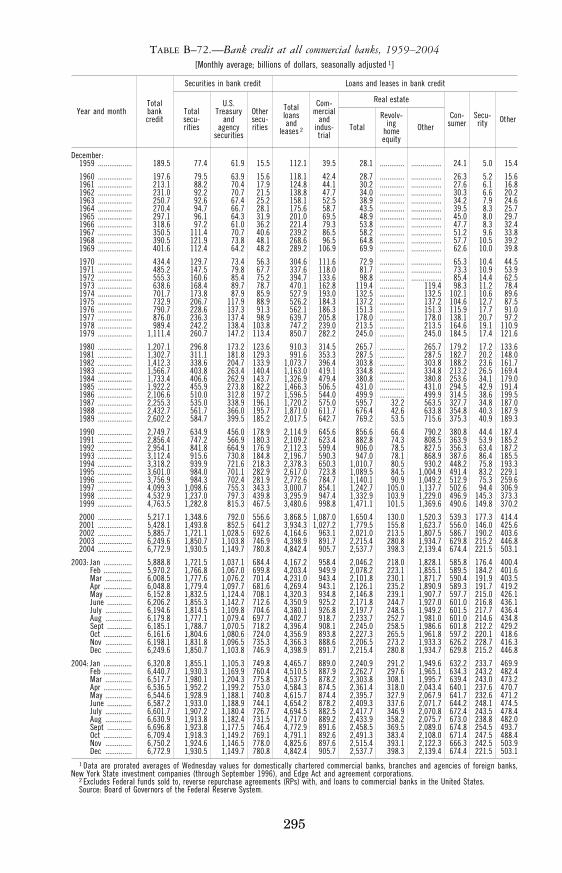
295
TABLE B–72.—Bank credit at all commercial banks, 1959–2004 [Monthly average; billions of dollars, seasonally adjusted 1]
Year and month Total bank credit
Securities in bank credit Loans and leases in bank credit
Total secu- rities
U.S. Treasury
and agency
securities
Other secu-rities
Total loans and
leases 2
Com-mercial
and indus-trial
Real estate
Con- sumer
Secu-rity Other
Total Revolv-
ing home equity
Other
December: 1959 .................. 189.5 77.4 61.9 15.5 112.1 39.5 28.1 ............. ................ 24.1 5.0 15.4
1960 .................. 197.6 79.5 63.9 15.6 118.1 42.4 28.7 ............. ................ 26.3 5.2 15.6 1961 .................. 213.1 88.2 70.4 17.9 124.8 44.1 30.2 ............. ................ 27.6 6.1 16.8 1962 .................. 231.0 92.2 70.7 21.5 138.8 47.7 34.0 ............. ................ 30.3 6.6 20.2 1963 .................. 250.7 92.6 67.4 25.2 158.1 52.5 38.9 ............. ................ 34.2 7.9 24.6 1964 .................. 270.4 94.7 66.7 28.1 175.6 58.7 43.5 ............. ................ 39.5 8.3 25.7 1965 .................. 297.1 96.1 64.3 31.9 201.0 69.5 48.9 ............. ................ 45.0 8.0 29.7 1966 .................. 318.6 97.2 61.0 36.2 221.4 79.3 53.8 ............. ................ 47.7 8.3 32.4 1967 .................. 350.5 111.4 70.7 40.6 239.2 86.5 58.2 ............. ................ 51.2 9.6 33.8 1968 .................. 390.5 121.9 73.8 48.1 268.6 96.5 64.8 ............. ................ 57.7 10.5 39.2 1969 .................. 401.6 112.4 64.2 48.2 289.2 106.9 69.9 ............. ................ 62.6 10.0 39.8
1970 .................. 434.4 129.7 73.4 56.3 304.6 111.6 72.9 ............. ................ 65.3 10.4 44.5 1971 .................. 485.2 147.5 79.8 67.7 337.6 118.0 81.7 ............. ................ 73.3 10.9 53.9 1972 .................. 555.3 160.6 85.4 75.2 394.7 133.6 98.8 ............. ................ 85.4 14.4 62.5 1973 .................. 638.6 168.4 89.7 78.7 470.1 162.8 119.4 ............. 119.4 98.3 11.2 78.4 1974 .................. 701.7 173.8 87.9 85.9 527.9 193.0 132.5 ............. 132.5 102.1 10.6 89.6 1975 .................. 732.9 206.7 117.9 88.9 526.2 184.3 137.2 ............. 137.2 104.6 12.7 87.5 1976 .................. 790.7 228.6 137.3 91.3 562.1 186.3 151.3 ............. 151.3 115.9 17.7 91.0 1977 .................. 876.0 236.3 137.4 98.9 639.7 205.8 178.0 ............. 178.0 138.1 20.7 97.2 1978 .................. 989.4 242.2 138.4 103.8 747.2 239.0 213.5 ............. 213.5 164.6 19.1 110.9 1979 .................. 1,111.4 260.7 147.2 113.4 850.7 282.2 245.0 ............. 245.0 184.5 17.4 121.6
1980 .................. 1,207.1 296.8 173.2 123.6 910.3 314.5 265.7 ............. 265.7 179.2 17.2 133.6 1981 .................. 1,302.7 311.1 181.8 129.3 991.6 353.3 287.5 ............. 287.5 182.7 20.2 148.0 1982 .................. 1,412.3 338.6 204.7 133.9 1,073.7 396.4 303.8 ............. 303.8 188.2 23.6 161.7 1983 .................. 1,566.7 403.8 263.4 140.4 1,163.0 419.1 334.8 ............. 334.8 213.2 26.5 169.4 1984 .................. 1,733.4 406.6 262.9 143.7 1,326.9 479.4 380.8 ............. 380.8 253.6 34.1 179.0 1985 .................. 1,922.2 455.9 273.8 182.2 1,466.3 506.5 431.0 ............. 431.0 294.5 42.9 191.4 1986 .................. 2,106.6 510.0 312.8 197.2 1,596.5 544.0 499.9 ............. 499.9 314.5 38.6 199.5 1987 .................. 2,255.3 535.0 338.9 196.1 1,720.2 575.0 595.7 32.2 563.5 327.7 34.8 187.0 1988 .................. 2,432.7 561.7 366.0 195.7 1,871.0 611.7 676.4 42.6 633.8 354.8 40.3 187.9 1989 .................. 2,602.2 584.7 399.5 185.2 2,017.5 642.7 769.2 53.5 715.6 375.3 40.9 189.3
1990 .................. 2,749.7 634.9 456.0 178.9 2,114.9 645.6 856.6 66.4 790.2 380.8 44.4 187.4 1991 .................. 2,856.4 747.2 566.9 180.3 2,109.2 623.4 882.8 74.3 808.5 363.9 53.9 185.2 1992 .................. 2,954.1 841.8 664.9 176.9 2,112.3 599.4 906.0 78.5 827.5 356.3 63.4 187.2 1993 .................. 3,112.4 915.6 730.8 184.8 2,196.7 590.3 947.0 78.1 868.9 387.6 86.4 185.5 1994 .................. 3,318.2 939.9 721.6 218.3 2,378.3 650.3 1,010.7 80.5 930.2 448.2 75.8 193.3 1995 .................. 3,601.0 984.0 701.1 282.9 2,617.0 723.8 1,089.5 84.5 1,004.9 491.4 83.2 229.1 1996 .................. 3,756.9 984.3 702.4 281.9 2,772.6 784.7 1,140.1 90.9 1,049.2 512.9 75.3 259.6 1997 .................. 4,099.3 1,098.6 755.3 343.3 3,000.7 854.1 1,242.7 105.0 1,137.7 502.6 94.4 306.9 1998 .................. 4,532.9 1,237.0 797.3 439.8 3,295.9 947.4 1,332.9 103.9 1,229.0 496.9 145.3 373.3 1999 .................. 4,763.5 1,282.8 815.3 467.5 3,480.6 998.8 1,471.1 101.5 1,369.6 490.6 149.8 370.2
2000 .................. 5,217.1 1,348.6 792.0 556.6 3,868.5 1,087.0 1,650.4 130.0 1,520.3 539.3 177.3 414.4 2001 .................. 5,428.1 1,493.8 852.5 641.2 3,934.3 1,027.2 1,779.5 155.8 1,623.7 556.0 146.0 425.6 2002 .................. 5,885.7 1,721.1 1,028.5 692.6 4,164.6 963.1 2,021.0 213.5 1,807.5 586.7 190.2 403.6 2003 .................. 6,249.6 1,850.7 1,103.8 746.9 4,398.9 891.7 2,215.4 280.8 1,934.7 629.8 215.2 446.8 2004 .................. 6,772.9 1,930.5 1,149.7 780.8 4,842.4 905.7 2,537.7 398.3 2,139.4 674.4 221.5 503.1
2003: Jan ............... 5,888.8 1,721.5 1,037.1 684.4 4,167.2 958.4 2,046.2 218.0 1,828.1 585.8 176.4 400.4 Feb ............... 5,970.2 1,766.8 1,067.0 699.8 4,203.4 949.9 2,078.2 223.1 1,855.1 589.5 184.2 401.6 Mar .............. 6,008.5 1,777.6 1,076.2 701.4 4,231.0 943.4 2,101.8 230.1 1,871.7 590.4 191.9 403.5 Apr ............... 6,048.8 1,779.4 1,097.7 681.6 4,269.4 943.1 2,126.1 235.2 1,890.9 589.3 191.7 419.2 May .............. 6,152.8 1,832.5 1,124.4 708.1 4,320.3 934.8 2,146.8 239.1 1,907.7 597.7 215.0 426.1 June ............. 6,206.2 1,855.3 1,142.7 712.6 4,350.9 925.2 2,171.8 244.7 1,927.0 601.0 216.8 436.1 July .............. 6,194.6 1,814.5 1,109.8 704.6 4,380.1 926.8 2,197.7 248.5 1,949.2 601.5 217.7 436.4 Aug .............. 6,179.8 1,777.1 1,079.4 697.7 4,402.7 918.7 2,233.7 252.7 1,981.0 601.0 214.6 434.8 Sept ............. 6,185.1 1,788.7 1,070.5 718.2 4,396.4 908.1 2,245.0 258.5 1,986.6 601.8 212.2 429.2 Oct ............... 6,161.6 1,804.6 1,080.6 724.0 4,356.9 893.8 2,227.3 265.5 1,961.8 597.2 220.1 418.6 Nov .............. 6,198.1 1,831.8 1,096.5 735.3 4,366.3 888.6 2,206.5 273.2 1,933.3 626.2 228.7 416.3 Dec .............. 6,249.6 1,850.7 1,103.8 746.9 4,398.9 891.7 2,215.4 280.8 1,934.7 629.8 215.2 446.8
2004: Jan ............... 6,320.8 1,855.1 1,105.3 749.8 4,465.7 889.0 2,240.9 291.2 1,949.6 632.2 233.7 469.9 Feb ............... 6,440.7 1,930.3 1,169.9 760.4 4,510.5 887.9 2,262.7 297.6 1,965.1 634.3 243.2 482.4 Mar .............. 6,517.7 1,980.1 1,204.3 775.8 4,537.5 878.2 2,303.8 308.1 1,995.7 639.4 243.0 473.2 Apr ............... 6,536.5 1,952.2 1,199.2 753.0 4,584.3 874.5 2,361.4 318.0 2,043.4 640.1 237.6 470.7 May .............. 6,544.6 1,928.9 1,188.1 740.8 4,615.7 874.4 2,395.7 327.9 2,067.9 641.7 232.6 471.2 June ............. 6,587.2 1,933.0 1,188.9 744.1 4,654.2 878.2 2,409.3 337.6 2,071.7 644.2 248.1 474.5 July .............. 6,601.7 1,907.2 1,180.4 726.7 4,694.5 882.5 2,417.7 346.9 2,070.8 672.4 243.5 478.4 Aug .............. 6,630.9 1,913.8 1,182.4 731.5 4,717.0 889.2 2,433.9 358.2 2,075.7 673.0 238.8 482.0 Sept ............. 6,696.8 1,923.8 1,177.5 746.4 4,772.9 891.6 2,458.5 369.5 2,089.0 674.8 254.5 493.7 Oct ............... 6,709.4 1,918.3 1,149.2 769.1 4,791.1 892.6 2,491.3 383.4 2,108.0 671.4 247.5 488.4 Nov .............. 6,750.2 1,924.6 1,146.5 778.0 4,825.6 897.6 2,515.4 393.1 2,122.3 666.3 242.5 503.9 Dec .............. 6,772.9 1,930.5 1,149.7 780.8 4,842.4 905.7 2,537.7 398.3 2,139.4 674.4 221.5 503.1
1 Data are prorated averages of Wednesday values for domestically chartered commercial banks, branches and agencies of foreign banks, New York State investment companies (through September 1996), and Edge Act and agreement corporations.
2 Excludes Federal funds sold to, reverse repurchase agreements (RPs) with, and loans to commercial banks in the United States. Source: Board of Governors of the Federal Reserve System.
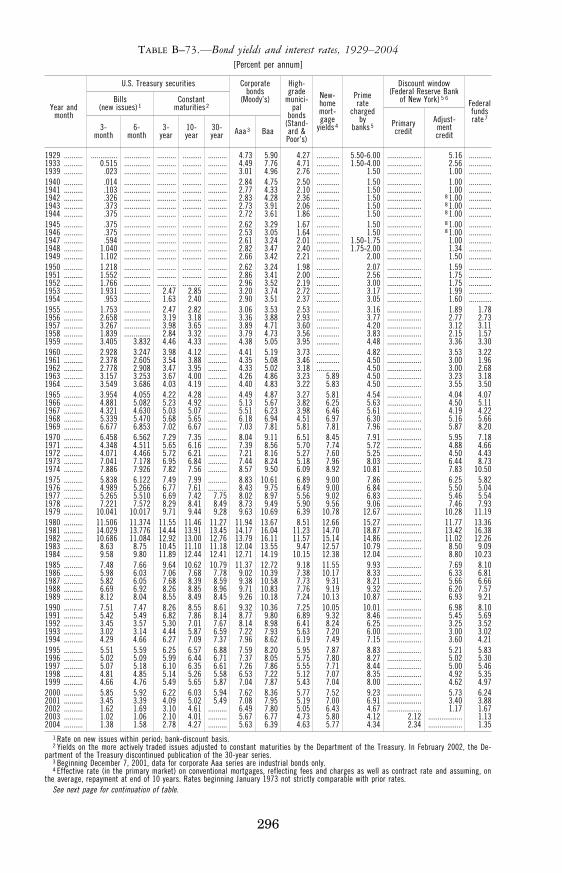
296
TABLE B–73.—Bond yields and interest rates, 1929–2004 [Percent per annum]
Year and month
U.S. Treasury securities Corporate bonds
(Moody’s)
High- grade
munici- pal
bonds (Stand- ard & Poor’s)
New- home mort- gage
yields 4
Prime rate
charged by
banks 5
Discount window (Federal Reserve Bank
of New York) 5 6 Federal funds rate 7
Bills (new issues) 1
Constant maturities 2
Aaa 3 Baa Primary credit
Adjust- ment credit
3- month
6- month
3- year
10- year
30- year
1929 .......... .............. .............. .......... .......... .......... 4.73 5.90 4.27 ............ 5.50-6.00 .................. 5.16 ............1933 .......... 0 .515 .............. .......... .......... .......... 4.49 7.76 4.71 ............ 1.50-4.00 .................. 2.56 ............1939 .......... .023 .............. .......... .......... .......... 3.01 4.96 2.76 ............ 1.50 .................. 1.00 ............1940 .......... .014 .............. .......... .......... .......... 2.84 4.75 2.50 ............ 1.50 .................. 1.00 ............1941 .......... .103 .............. .......... .......... .......... 2.77 4.33 2.10 ............ 1.50 .................. 1.00 ............1942 .......... .326 .............. .......... .......... .......... 2.83 4.28 2.36 ............ 1.50 .................. 8 1.00 ............1943 .......... .373 .............. .......... .......... .......... 2.73 3.91 2.06 ............ 1.50 .................. 8 1.00 ............1944 .......... .375 .............. .......... .......... .......... 2.72 3.61 1.86 ............ 1.50 .................. 8 1.00 ............1945 .......... .375 .............. .......... .......... .......... 2.62 3.29 1.67 ............ 1.50 .................. 8 1.00 ............1946 .......... .375 .............. .......... .......... .......... 2.53 3.05 1.64 ............ 1.50 .................. 8 1.00 ............1947 .......... .594 .............. .......... .......... .......... 2.61 3.24 2.01 ............ 1.50-1.75 .................. 1.00 ............1948 .......... 1 .040 .............. .......... .......... .......... 2.82 3.47 2.40 ............ 1.75-2.00 .................. 1.34 ............1949 .......... 1 .102 .............. .......... .......... .......... 2.66 3.42 2.21 ............ 2.00 .................. 1.50 ............1950 .......... 1 .218 .............. .......... .......... .......... 2.62 3.24 1.98 ............ 2.07 .................. 1.59 ............1951 .......... 1 .552 .............. .......... .......... .......... 2.86 3.41 2.00 ............ 2.56 .................. 1.75 ............1952 .......... 1 .766 .............. .......... .......... .......... 2.96 3.52 2.19 ............ 3.00 .................. 1.75 ............1953 .......... 1 .931 .............. 2.47 2.85 .......... 3.20 3.74 2.72 ............ 3.17 .................. 1.99 ............1954 .......... .953 .............. 1.63 2.40 .......... 2.90 3.51 2.37 ............ 3.05 .................. 1.60 ............1955 .......... 1 .753 .............. 2.47 2.82 .......... 3.06 3.53 2.53 ............ 3.16 .................. 1.89 1.78 1956 .......... 2 .658 .............. 3.19 3.18 .......... 3.36 3.88 2.93 ............ 3.77 .................. 2.77 2.73 1957 .......... 3 .267 .............. 3.98 3.65 .......... 3.89 4.71 3.60 ............ 4.20 .................. 3.12 3.11 1958 .......... 1 .839 .............. 2.84 3.32 .......... 3.79 4.73 3.56 ............ 3.83 .................. 2.15 1.57 1959 .......... 3 .405 3 .832 4.46 4.33 .......... 4.38 5.05 3.95 ............ 4.48 .................. 3.36 3.30 1960 .......... 2 .928 3 .247 3.98 4.12 .......... 4.41 5.19 3.73 ............ 4.82 .................. 3.53 3.22 1961 .......... 2 .378 2 .605 3.54 3.88 .......... 4.35 5.08 3.46 ............ 4.50 .................. 3.00 1.96 1962 .......... 2 .778 2 .908 3.47 3.95 .......... 4.33 5.02 3.18 ............ 4.50 .................. 3.00 2.68 1963 .......... 3 .157 3 .253 3.67 4.00 .......... 4.26 4.86 3.23 5.89 4.50 .................. 3.23 3.18 1964 .......... 3 .549 3 .686 4.03 4.19 .......... 4.40 4.83 3.22 5.83 4.50 .................. 3.55 3.50 1965 .......... 3 .954 4 .055 4.22 4.28 .......... 4.49 4.87 3.27 5.81 4.54 .................. 4.04 4.07 1966 .......... 4 .881 5 .082 5.23 4.92 .......... 5.13 5.67 3.82 6.25 5.63 .................. 4.50 5.11 1967 .......... 4 .321 4 .630 5.03 5.07 .......... 5.51 6.23 3.98 6.46 5.61 .................. 4.19 4.22 1968 .......... 5 .339 5 .470 5.68 5.65 .......... 6.18 6.94 4.51 6.97 6.30 .................. 5.16 5.66 1969 .......... 6 .677 6 .853 7.02 6.67 .......... 7.03 7.81 5.81 7.81 7.96 .................. 5.87 8.20 1970 .......... 6 .458 6 .562 7.29 7.35 .......... 8.04 9.11 6.51 8.45 7.91 .................. 5.95 7.18 1971 .......... 4 .348 4 .511 5.65 6.16 .......... 7.39 8.56 5.70 7.74 5.72 .................. 4.88 4.66 1972 .......... 4 .071 4 .466 5.72 6.21 .......... 7.21 8.16 5.27 7.60 5.25 .................. 4.50 4.43 1973 .......... 7 .041 7 .178 6.95 6.84 .......... 7.44 8.24 5.18 7.96 8.03 .................. 6.44 8.73 1974 .......... 7 .886 7 .926 7.82 7.56 .......... 8.57 9.50 6.09 8.92 10.81 .................. 7.83 10.50 1975 .......... 5 .838 6 .122 7.49 7.99 .......... 8.83 10.61 6.89 9.00 7.86 .................. 6.25 5.82 1976 .......... 4 .989 5 .266 6.77 7.61 .......... 8.43 9.75 6.49 9.00 6.84 .................. 5.50 5.04 1977 .......... 5 .265 5 .510 6.69 7.42 7.75 8.02 8.97 5.56 9.02 6.83 .................. 5.46 5.54 1978 .......... 7 .221 7 .572 8.29 8.41 8.49 8.73 9.49 5.90 9.56 9.06 .................. 7.46 7.93 1979 .......... 10 .041 10 .017 9.71 9.44 9.28 9.63 10.69 6.39 10.78 12.67 .................. 10.28 11.19 1980 .......... 11 .506 11 .374 11.55 11.46 11.27 11.94 13.67 8.51 12.66 15.27 .................. 11.77 13.36 1981 .......... 14 .029 13 .776 14.44 13.91 13.45 14.17 16.04 11.23 14.70 18.87 .................. 13.42 16.38 1982 .......... 10 .686 11 .084 12.92 13.00 12.76 13.79 16.11 11.57 15.14 14.86 .................. 11.02 12.26 1983 .......... 8 .63 8 .75 10.45 11.10 11.18 12.04 13.55 9.47 12.57 10.79 .................. 8.50 9.09 1984 .......... 9 .58 9 .80 11.89 12.44 12.41 12.71 14.19 10.15 12.38 12.04 .................. 8.80 10.23 1985 .......... 7 .48 7 .66 9.64 10.62 10.79 11.37 12.72 9.18 11.55 9.93 .................. 7.69 8.10 1986 .......... 5 .98 6 .03 7.06 7.68 7.78 9.02 10.39 7.38 10.17 8.33 .................. 6.33 6.81 1987 .......... 5 .82 6 .05 7.68 8.39 8.59 9.38 10.58 7.73 9.31 8.21 .................. 5.66 6.66 1988 .......... 6 .69 6 .92 8.26 8.85 8.96 9.71 10.83 7.76 9.19 9.32 .................. 6.20 7.57 1989 .......... 8 .12 8 .04 8.55 8.49 8.45 9.26 10.18 7.24 10.13 10.87 .................. 6.93 9.21 1990 .......... 7 .51 7 .47 8.26 8.55 8.61 9.32 10.36 7.25 10.05 10.01 .................. 6.98 8.10 1991 .......... 5 .42 5 .49 6.82 7.86 8.14 8.77 9.80 6.89 9.32 8.46 .................. 5.45 5.69 1992 .......... 3 .45 3 .57 5.30 7.01 7.67 8.14 8.98 6.41 8.24 6.25 .................. 3.25 3.52 1993 .......... 3 .02 3 .14 4.44 5.87 6.59 7.22 7.93 5.63 7.20 6.00 .................. 3.00 3.02 1994 .......... 4 .29 4 .66 6.27 7.09 7.37 7.96 8.62 6.19 7.49 7.15 .................. 3.60 4.21 1995 .......... 5 .51 5 .59 6.25 6.57 6.88 7.59 8.20 5.95 7.87 8.83 .................. 5.21 5.83 1996 .......... 5 .02 5 .09 5.99 6.44 6.71 7.37 8.05 5.75 7.80 8.27 .................. 5.02 5.30 1997 .......... 5 .07 5 .18 6.10 6.35 6.61 7.26 7.86 5.55 7.71 8.44 .................. 5.00 5.46 1998 .......... 4 .81 4 .85 5.14 5.26 5.58 6.53 7.22 5.12 7.07 8.35 .................. 4.92 5.35 1999 .......... 4 .66 4 .76 5.49 5.65 5.87 7.04 7.87 5.43 7.04 8.00 .................. 4.62 4.97 2000 .......... 5 .85 5 .92 6.22 6.03 5.94 7.62 8.36 5.77 7.52 9.23 .................. 5.73 6.24 2001 .......... 3 .45 3 .39 4.09 5.02 5.49 7.08 7.95 5.19 7.00 6.91 .................. 3.40 3.88 2002 .......... 1 .62 1 .69 3.10 4.61 .......... 6.49 7.80 5.05 6.43 4.67 .................. 1.17 1.67 2003 .......... 1 .02 1 .06 2.10 4.01 .......... 5.67 6.77 4.73 5.80 4.12 2.12 .................. 1.13 2004 .......... 1 .38 1 .58 2.78 4.27 .......... 5.63 6.39 4.63 5.77 4.34 2.34 .................. 1.35
1 Rate on new issues within period; bank-discount basis. 2 Yields on the more actively traded issues adjusted to constant maturities by the Department of the Treasury. In February 2002, the De-
partment of the Treasury discontinued publication of the 30-year series. 3 Beginning December 7, 2001, data for corporate Aaa series are industrial bonds only. 4 Effective rate (in the primary market) on conventional mortgages, reflecting fees and charges as well as contract rate and assuming, on
the average, repayment at end of 10 years. Rates beginning January 1973 not strictly comparable with prior rates. See next page for continuation of table.
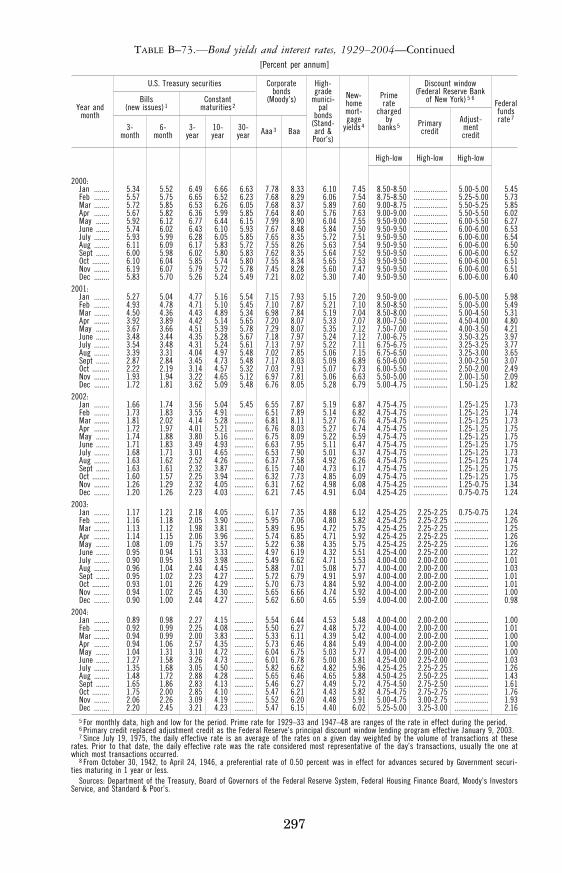
297
TABLE B–73.—Bond yields and interest rates, 1929–2004—Continued [Percent per annum]
Year and month
U.S. Treasury securities Corporate bonds
(Moody’s)
High- grade
munici- pal
bonds (Stand- ard & Poor’s)
New- home mort- gage
yields 4
Prime rate
charged by
banks 5
Discount window (Federal Reserve Bank
of New York) 5 6 Federal funds rate 7
Bills (new issues) 1
Constant maturities 2
Aaa 3 Baa Primary credit
Adjust- ment credit
3- month
6- month
3- year
10- year
30- year
High-low High-low High-low
2000: Jan ........ 5 .34 5 .52 6.49 6.66 6.63 7.78 8.33 6.10 7.45 8.50-8.50 .................. 5.00-5.00 5.45 Feb ........ 5 .57 5 .75 6.65 6.52 6.23 7.68 8.29 6.06 7.54 8.75-8.50 .................. 5.25-5.00 5.73 Mar ........ 5 .72 5 .85 6.53 6.26 6.05 7.68 8.37 5.89 7.60 9.00-8.75 .................. 5.50-5.25 5.85 Apr ........ 5 .67 5 .82 6.36 5.99 5.85 7.64 8.40 5.76 7.63 9.00-9.00 .................. 5.50-5.50 6.02 May ....... 5 .92 6 .12 6.77 6.44 6.15 7.99 8.90 6.04 7.55 9.50-9.00 .................. 6.00-5.50 6.27 June ....... 5 .74 6 .02 6.43 6.10 5.93 7.67 8.48 5.84 7.50 9.50-9.50 .................. 6.00-6.00 6.53 July ........ 5 .93 5 .99 6.28 6.05 5.85 7.65 8.35 5.72 7.51 9.50-9.50 .................. 6.00-6.00 6.54 Aug ........ 6 .11 6 .09 6.17 5.83 5.72 7.55 8.26 5.63 7.54 9.50-9.50 .................. 6.00-6.00 6.50 Sept ....... 6 .00 5 .98 6.02 5.80 5.83 7.62 8.35 5.64 7.52 9.50-9.50 .................. 6.00-6.00 6.52 Oct ......... 6 .10 6 .04 5.85 5.74 5.80 7.55 8.34 5.65 7.53 9.50-9.50 .................. 6.00-6.00 6.51 Nov ........ 6 .19 6 .07 5.79 5.72 5.78 7.45 8.28 5.60 7.47 9.50-9.50 .................. 6.00-6.00 6.51 Dec ........ 5 .83 5 .70 5.26 5.24 5.49 7.21 8.02 5.30 7.40 9.50-9.50 .................. 6.00-6.00 6.40
2001: Jan ........ 5 .27 5 .04 4.77 5.16 5.54 7.15 7.93 5.15 7.20 9.50-9.00 .................. 6.00-5.00 5.98 Feb ........ 4 .93 4 .78 4.71 5.10 5.45 7.10 7.87 5.21 7.10 8.50-8.50 .................. 5.00-5.00 5.49 Mar ........ 4 .50 4 .36 4.43 4.89 5.34 6.98 7.84 5.19 7.04 8.50-8.00 .................. 5.00-4.50 5.31 Apr ........ 3 .92 3 .89 4.42 5.14 5.65 7.20 8.07 5.33 7.07 8.00-7.50 .................. 4.50-4.00 4.80 May ....... 3 .67 3 .66 4.51 5.39 5.78 7.29 8.07 5.35 7.12 7.50-7.00 .................. 4.00-3.50 4.21 June ....... 3 .48 3 .44 4.35 5.28 5.67 7.18 7.97 5.24 7.12 7.00-6.75 .................. 3.50-3.25 3.97 July ........ 3 .54 3 .48 4.31 5.24 5.61 7.13 7.97 5.22 7.11 6.75-6.75 .................. 3.25-3.25 3.77 Aug ........ 3 .39 3 .31 4.04 4.97 5.48 7.02 7.85 5.06 7.15 6.75-6.50 .................. 3.25-3.00 3.65 Sept ....... 2 .87 2 .84 3.45 4.73 5.48 7.17 8.03 5.09 6.89 6.50-6.00 .................. 3.00-2.50 3.07 Oct ......... 2 .22 2 .19 3.14 4.57 5.32 7.03 7.91 5.07 6.73 6.00-5.50 .................. 2.50-2.00 2.49 Nov ........ 1 .93 1 .94 3.22 4.65 5.12 6.97 7.81 5.06 6.63 5.50-5.00 .................. 2.00-1.50 2.09 Dec ........ 1 .72 1 .81 3.62 5.09 5.48 6.76 8.05 5.28 6.79 5.00-4.75 .................. 1.50-1.25 1.82
2002: Jan ........ 1 .66 1 .74 3.56 5.04 5.45 6.55 7.87 5.19 6.87 4.75-4.75 .................. 1.25-1.25 1.73 Feb ........ 1 .73 1 .83 3.55 4.91 .......... 6.51 7.89 5.14 6.82 4.75-4.75 .................. 1.25-1.25 1.74 Mar ........ 1 .81 2 .02 4.14 5.28 .......... 6.81 8.11 5.27 6.76 4.75-4.75 .................. 1.25-1.25 1.73 Apr ........ 1 .72 1 .97 4.01 5.21 .......... 6.76 8.03 5.27 6.74 4.75-4.75 .................. 1.25-1.25 1.75 May ....... 1 .74 1 .88 3.80 5.16 .......... 6.75 8.09 5.22 6.59 4.75-4.75 .................. 1.25-1.25 1.75 June ....... 1 .71 1 .83 3.49 4.93 .......... 6.63 7.95 5.11 6.47 4.75-4.75 .................. 1.25-1.25 1.75 July ........ 1 .68 1 .71 3.01 4.65 .......... 6.53 7.90 5.01 6.37 4.75-4.75 .................. 1.25-1.25 1.73 Aug ........ 1 .63 1 .62 2.52 4.26 .......... 6.37 7.58 4.92 6.26 4.75-4.75 .................. 1.25-1.25 1.74 Sept ....... 1 .63 1 .61 2.32 3.87 .......... 6.15 7.40 4.73 6.17 4.75-4.75 .................. 1.25-1.25 1.75 Oct ......... 1 .60 1 .57 2.25 3.94 .......... 6.32 7.73 4.85 6.09 4.75-4.75 .................. 1.25-1.25 1.75 Nov ........ 1 .26 1 .29 2.32 4.05 .......... 6.31 7.62 4.98 6.08 4.75-4.25 .................. 1.25-0.75 1.34 Dec ........ 1 .20 1 .26 2.23 4.03 .......... 6.21 7.45 4.91 6.04 4.25-4.25 .................. 0.75-0.75 1.24
2003: Jan ........ 1 .17 1 .21 2.18 4.05 .......... 6.17 7.35 4.88 6.12 4.25-4.25 2.25-2.25 0.75-0.75 1.24 Feb ........ 1 .16 1 .18 2.05 3.90 .......... 5.95 7.06 4.80 5.82 4.25-4.25 2.25-2.25 .................. 1.26 Mar ........ 1 .13 1 .12 1.98 3.81 .......... 5.89 6.95 4.72 5.75 4.25-4.25 2.25-2.25 .................. 1.25 Apr ........ 1 .14 1 .15 2.06 3.96 .......... 5.74 6.85 4.71 5.92 4.25-4.25 2.25-2.25 .................. 1.26 May ....... 1 .08 1 .09 1.75 3.57 .......... 5.22 6.38 4.35 5.75 4.25-4.25 2.25-2.25 .................. 1.26 June ....... 0 .95 0 .94 1.51 3.33 .......... 4.97 6.19 4.32 5.51 4.25-4.00 2.25-2.00 .................. 1.22 July ........ 0 .90 0 .95 1.93 3.98 .......... 5.49 6.62 4.71 5.53 4.00-4.00 2.00-2.00 .................. 1.01 Aug ........ 0 .96 1 .04 2.44 4.45 .......... 5.88 7.01 5.08 5.77 4.00-4.00 2.00-2.00 .................. 1.03 Sept ....... 0 .95 1 .02 2.23 4.27 .......... 5.72 6.79 4.91 5.97 4.00-4.00 2.00-2.00 .................. 1.01 Oct ......... 0 .93 1 .01 2.26 4.29 .......... 5.70 6.73 4.84 5.92 4.00-4.00 2.00-2.00 .................. 1.01 Nov ........ 0 .94 1 .02 2.45 4.30 .......... 5.65 6.66 4.74 5.92 4.00-4.00 2.00-2.00 .................. 1.00 Dec ........ 0 .90 1 .00 2.44 4.27 .......... 5.62 6.60 4.65 5.59 4.00-4.00 2.00-2.00 .................. 0.98
2004: Jan ........ 0 .89 0 .98 2.27 4.15 .......... 5.54 6.44 4.53 5.48 4.00-4.00 2.00-2.00 .................. 1.00 Feb ........ 0 .92 0 .99 2.25 4.08 .......... 5.50 6.27 4.48 5.72 4.00-4.00 2.00-2.00 .................. 1.01 Mar ........ 0 .94 0 .99 2.00 3.83 .......... 5.33 6.11 4.39 5.42 4.00-4.00 2.00-2.00 .................. 1.00 Apr ........ 0 .94 1 .06 2.57 4.35 .......... 5.73 6.46 4.84 5.49 4.00-4.00 2.00-2.00 .................. 1.00 May ....... 1 .04 1 .31 3.10 4.72 .......... 6.04 6.75 5.03 5.77 4.00-4.00 2.00-2.00 .................. 1.00 June ....... 1 .27 1 .58 3.26 4.73 .......... 6.01 6.78 5.00 5.81 4.25-4.00 2.25-2.00 .................. 1.03 July ........ 1 .35 1 .68 3.05 4.50 .......... 5.82 6.62 4.82 5.96 4.25-4.25 2.25-2.25 .................. 1.26 Aug ........ 1 .48 1 .72 2.88 4.28 .......... 5.65 6.46 4.65 5.88 4.50-4.25 2.50-2.25 .................. 1.43 Sept ....... 1 .65 1 .86 2.83 4.13 .......... 5.46 6.27 4.49 5.72 4.75-4.50 2.75-2.50 .................. 1.61 Oct ......... 1 .75 2 .00 2.85 4.10 .......... 5.47 6.21 4.43 5.82 4.75-4.75 2.75-2.75 .................. 1.76 Nov ........ 2 .06 2 .26 3.09 4.19 .......... 5.52 6.20 4.48 5.91 5.00-4.75 3.00-2.75 .................. 1.93 Dec ........ 2 .20 2 .45 3.21 4.23 .......... 5.47 6.15 4.40 6.02 5.25-5.00 3.25-3.00 .................. 2.16 5 For monthly data, high and low for the period. Prime rate for 1929–33 and 1947–48 are ranges of the rate in effect during the period. 6 Primary credit replaced adjustment credit as the Federal Reserve’s principal discount window lending program effective January 9, 2003. 7 Since July 19, 1975, the daily effective rate is an average of the rates on a given day weighted by the volume of transactions at these
rates. Prior to that date, the daily effective rate was the rate considered most representative of the day’s transactions, usually the one at which most transactions occurred.
8 From October 30, 1942, to April 24, 1946, a preferential rate of 0.50 percent was in effect for advances secured by Government securi-ties maturing in 1 year or less.
Sources: Department of the Treasury, Board of Governors of the Federal Reserve System, Federal Housing Finance Board, Moody’s Investors Service, and Standard & Poor’s.
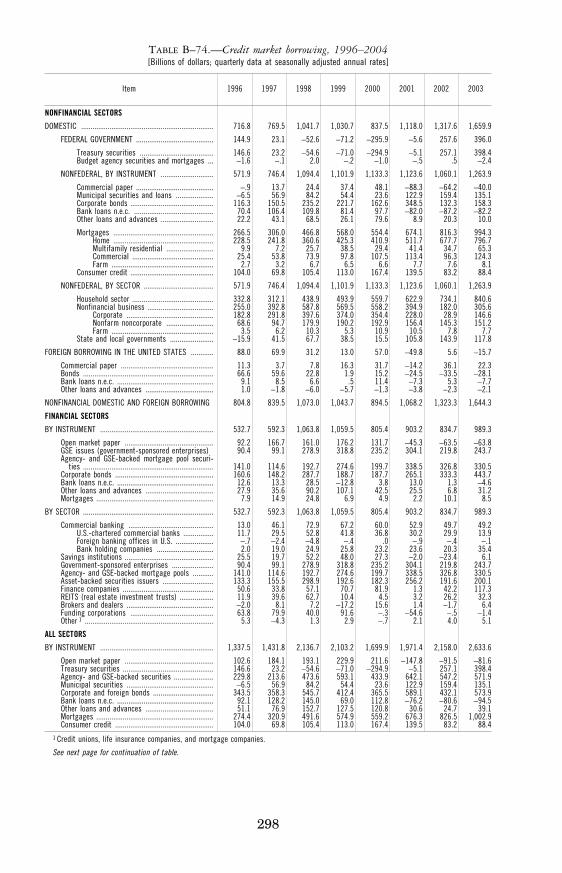
298
TABLE B–74.—Credit market borrowing, 1996–2004 [Billions of dollars; quarterly data at seasonally adjusted annual rates]
Item 1996 1997 1998 1999 2000 2001 2002 2003
NONFINANCIAL SECTORS
DOMESTIC ...................................................................... 716 .8 769 .5 1,041 .7 1,030 .7 837 .5 1,118 .0 1,317 .6 1,659 .9
FEDERAL GOVERNMENT ......................................... 144 .9 23 .1 −52 .6 −71 .2 −295 .9 −5 .6 257 .6 396 .0
Treasury securities ....................................... 146 .6 23 .2 −54 .6 −71 .0 −294 .9 −5 .1 257 .1 398 .4 Budget agency securities and mortgages ... −1 .6 − .1 2 .0 − .2 −1 .0 − .5 .5 −2 .4
NONFEDERAL, BY INSTRUMENT ............................ 571 .9 746 .4 1,094 .4 1,101 .9 1,133 .3 1,123 .6 1,060 .1 1,263 .9
Commercial paper ......................................... − .9 13 .7 24 .4 37 .4 48 .1 −88 .3 −64 .2 −40 .0 Municipal securities and loans .................... −6 .5 56 .9 84 .2 54 .4 23 .6 122 .9 159 .4 135 .1 Corporate bonds ............................................ 116 .3 150 .5 235 .2 221 .7 162 .6 348 .5 132 .3 158 .3 Bank loans n.e.c. .......................................... 70 .4 106 .4 109 .8 81 .4 97 .7 −82 .0 −87 .2 −82 .2 Other loans and advances ............................ 22 .2 43 .1 68 .5 26 .1 79 .6 8 .9 20 .3 10 .0
Mortgages ..................................................... 266 .5 306 .0 466 .8 568 .0 554 .4 674 .1 816 .3 994 .3 Home ..................................................... 228 .5 241 .8 360 .6 425 .3 410 .9 511 .7 677 .7 796 .7 Multifamily residential ......................... 9 .9 7 .2 25 .7 38 .5 29 .4 41 .4 34 .7 65 .3 Commercial ........................................... 25 .4 53 .8 73 .9 97 .8 107 .5 113 .4 96 .3 124 .3 Farm ...................................................... 2 .7 3 .2 6 .7 6 .5 6 .6 7 .7 7 .6 8 .1
Consumer credit ............................................ 104 .0 69 .8 105 .4 113 .0 167 .4 139 .5 83 .2 88 .4
NONFEDERAL, BY SECTOR ..................................... 571 .9 746 .4 1,094 .4 1,101 .9 1,133 .3 1,123 .6 1,060 .1 1,263 .9
Household sector ........................................... 332 .8 312 .1 438 .9 493 .9 559 .7 622 .9 734 .1 840 .6 Nonfinancial business ................................... 255 .0 392 .8 587 .8 569 .5 558 .2 394 .9 182 .0 305 .6
Corporate .............................................. 182 .8 291 .8 397 .6 374 .0 354 .4 228 .0 28 .9 146 .6 Nonfarm noncorporate ......................... 68 .6 94 .7 179 .9 190 .2 192 .9 156 .4 145 .3 151 .2 Farm ...................................................... 3 .5 6 .2 10 .3 5 .3 10 .9 10 .5 7 .8 7 .7
State and local governments ....................... −15 .9 41 .5 67 .7 38 .5 15 .5 105 .8 143 .9 117 .8
FOREIGN BORROWING IN THE UNITED STATES ............ 88 .0 69 .9 31 .2 13 .0 57 .0 −49 .8 5 .6 −15 .7
Commercial paper ................................................. 11 .3 3 .7 7 .8 16 .3 31 .7 −14 .2 36 .1 22 .3 Bonds ..................................................................... 66 .6 59 .6 22 .8 1 .9 15 .2 −24 .5 −33 .5 −28 .1 Bank loans n.e.c. ................................................... 9 .1 8 .5 6 .6 .5 11 .4 −7 .3 5 .3 −7 .7 Other loans and advances .................................... 1 .0 −1 .8 −6 .0 −5 .7 −1 .3 −3 .8 −2 .3 −2 .1
NONFINANCIAL DOMESTIC AND FOREIGN BORROWING 804 .8 839 .5 1,073 .0 1,043 .7 894 .5 1,068 .2 1,323 .3 1,644 .3
FINANCIAL SECTORS
BY INSTRUMENT ............................................................ 532 .7 592 .3 1,063 .8 1,059 .5 805 .4 903 .2 834 .7 989 .3
Open market paper ............................................... 92 .2 166 .7 161 .0 176 .2 131 .7 −45 .3 −63 .5 −63 .8 GSE issues (government-sponsored enterprises) 90 .4 99 .1 278 .9 318 .8 235 .2 304 .1 219 .8 243 .7 Agency- and GSE-backed mortgage pool securi-
ties ..................................................................... 141 .0 114 .6 192 .7 274 .6 199 .7 338 .5 326 .8 330 .5 Corporate bonds .................................................... 160 .6 148 .2 287 .7 188 .7 187 .7 265 .1 333 .3 443 .7 Bank loans n.e.c. ................................................... 12 .6 13 .3 28 .5 −12 .8 3 .8 13 .0 1 .3 −4 .6 Other loans and advances .................................... 27 .9 35 .6 90 .2 107 .1 42 .5 25 .5 6 .8 31 .2 Mortgages .............................................................. 7 .9 14 .9 24 .8 6 .9 4 .9 2 .2 10 .1 8 .5
BY SECTOR ..................................................................... 532 .7 592 .3 1,063 .8 1,059 .5 805 .4 903 .2 834 .7 989 .3
Commercial banking ............................................. 13 .0 46 .1 72 .9 67 .2 60 .0 52 .9 49 .7 49 .2 U.S.-chartered commercial banks ................ 11 .7 29 .5 52 .8 41 .8 36 .8 30 .2 29 .9 13 .9 Foreign banking offices in U.S. .................... − .7 −2 .4 −4 .8 − .4 .0 − .9 − .4 − .1 Bank holding companies .............................. 2 .0 19 .0 24 .9 25 .8 23 .2 23 .6 20 .3 35 .4
Savings institutions ............................................... 25 .5 19 .7 52 .2 48 .0 27 .3 −2 .0 −23 .4 6 .1 Government-sponsored enterprises ...................... 90 .4 99 .1 278 .9 318 .8 235 .2 304 .1 219 .8 243 .7 Agency- and GSE-backed mortgage pools ........... 141 .0 114 .6 192 .7 274 .6 199 .7 338 .5 326 .8 330 .5 Asset-backed securities issuers ........................... 133 .3 155 .5 298 .9 192 .6 182 .3 256 .2 191 .6 200 .1 Finance companies ................................................ 50 .6 33 .8 57 .1 70 .7 81 .9 1 .3 42 .2 117 .3 REITS (real estate investment trusts) .................. 11 .9 39 .6 62 .7 10 .4 4 .5 3 .2 26 .2 32 .3 Brokers and dealers .............................................. −2 .0 8 .1 7 .2 −17 .2 15 .6 1 .4 −1 .7 6 .4 Funding corporations ............................................ 63 .8 79 .9 40 .0 91 .6 − .3 −54 .6 − .5 −1 .4 Other 1 .................................................................... 5 .3 −4 .3 1 .3 2 .9 − .7 2 .1 4 .0 5 .1
ALL SECTORS
BY INSTRUMENT ............................................................ 1,337 .5 1,431 .8 2,136 .7 2,103 .2 1,699 .9 1,971 .4 2,158 .0 2,633 .6
Open market paper ............................................... 102 .6 184 .1 193 .1 229 .9 211 .6 −147 .8 −91 .5 −81 .6 Treasury securities ................................................ 146 .6 23 .2 −54 .6 −71 .0 −294 .9 −5 .1 257 .1 398 .4 Agency- and GSE-backed securities ..................... 229 .8 213 .6 473 .6 593 .1 433 .9 642 .1 547 .2 571 .9 Municipal securities .............................................. −6 .5 56 .9 84 .2 54 .4 23 .6 122 .9 159 .4 135 .1 Corporate and foreign bonds ................................ 343 .5 358 .3 545 .7 412 .4 365 .5 589 .1 432 .1 573 .9 Bank loans n.e.c. ................................................... 92 .1 128 .2 145 .0 69 .0 112 .8 −76 .2 −80 .6 −94 .5 Other loans and advances .................................... 51 .1 76 .9 152 .7 127 .5 120 .8 30 .6 24 .7 39 .1 Mortgages .............................................................. 274 .4 320 .9 491 .6 574 .9 559 .2 676 .3 826 .5 1,002 .9 Consumer credit .................................................... 104 .0 69 .8 105 .4 113 .0 167 .4 139 .5 83 .2 88 .4
1 Credit unions, life insurance companies, and mortgage companies.
See next page for continuation of table.
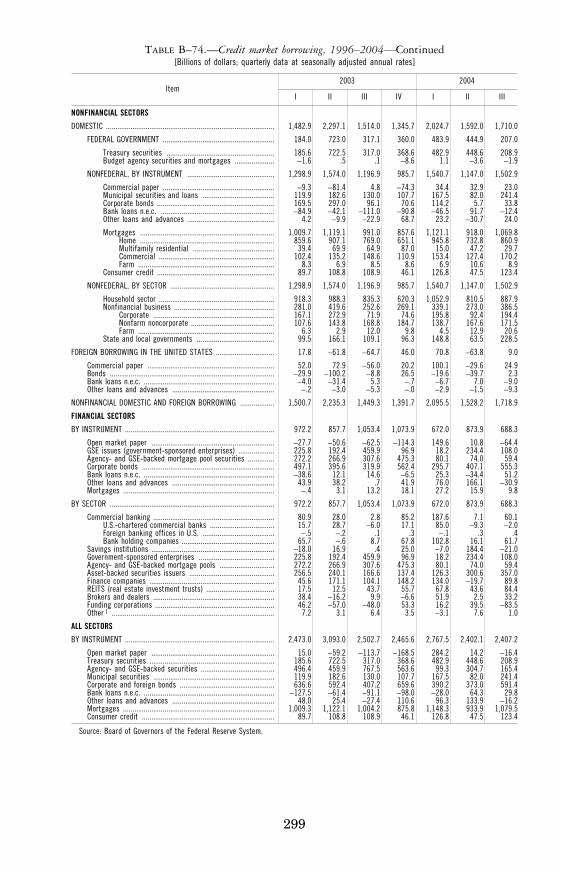
299
TABLE B–74.—Credit market borrowing, 1996–2004—Continued [Billions of dollars; quarterly data at seasonally adjusted annual rates]
Item 2003 2004
I II III IV I II III
NONFINANCIAL SECTORS
DOMESTIC ......................................................................................... 1,482 .9 2,297 .1 1,514 .0 1,345 .7 2,024 .7 1,592 .0 1,710 .0
FEDERAL GOVERNMENT ........................................................... 184 .0 723 .0 317 .1 360 .0 483 .9 444 .9 207 .0
Treasury securities ......................................................... 185 .6 722 .5 317 .0 368 .6 482 .9 448 .6 208 .9 Budget agency securities and mortgages ..................... −1 .6 .5 .1 −8 .6 1 .1 −3 .6 −1 .9
NONFEDERAL, BY INSTRUMENT .............................................. 1,298 .9 1,574 .0 1,196 .9 985 .7 1,540 .7 1,147 .0 1,502 .9
Commercial paper ........................................................... −9 .3 −81 .4 4 .8 −74 .3 34 .4 32 .9 23 .0 Municipal securities and loans ...................................... 119 .9 182 .6 130 .0 107 .7 167 .5 82 .0 241 .4 Corporate bonds .............................................................. 169 .5 297 .0 96 .1 70 .6 114 .2 5 .7 33 .8 Bank loans n.e.c. ............................................................ −84 .9 −42 .1 −111 .0 −90 .8 −46 .5 91 .7 −12 .4 Other loans and advances .............................................. 4 .2 −9 .9 −22 .9 68 .7 23 .2 −30 .7 24 .0
Mortgages ....................................................................... 1,009 .7 1,119 .1 991 .0 857 .6 1,121 .1 918 .0 1,069 .8 Home ....................................................................... 859 .6 907 .1 769 .0 651 .1 945 .8 732 .8 860 .9 Multifamily residential ........................................... 39 .4 69 .9 64 .9 87 .0 15 .0 47 .2 29 .7 Commercial ............................................................. 102 .4 135 .2 148 .6 110 .9 153 .4 127 .4 170 .2 Farm ........................................................................ 8 .3 6 .9 8 .5 8 .6 6 .9 10 .6 8 .9
Consumer credit .............................................................. 89 .7 108 .8 108 .9 46 .1 126 .8 47 .5 123 .4
NONFEDERAL, BY SECTOR ....................................................... 1,298 .9 1,574 .0 1,196 .9 985 .7 1,540 .7 1,147 .0 1,502 .9
Household sector ............................................................. 918 .3 988 .3 835 .3 620 .3 1,052 .9 810 .5 887 .9 Nonfinancial business ..................................................... 281 .0 419 .6 252 .6 269 .1 339 .1 273 .0 386 .5
Corporate ................................................................ 167 .1 272 .9 71 .9 74 .6 195 .8 92 .4 194 .4 Nonfarm noncorporate ............................................ 107 .6 143 .8 168 .8 184 .7 138 .7 167 .6 171 .5 Farm ........................................................................ 6 .3 2 .9 12 .0 9 .8 4 .5 12 .9 20 .6
State and local governments ......................................... 99 .5 166 .1 109 .1 96 .3 148 .8 63 .5 228 .5
FOREIGN BORROWING IN THE UNITED STATES ............................... 17 .8 −61 .8 −64 .7 46 .0 70 .8 −63 .8 9 .0
Commercial paper ................................................................... 52 .0 72 .9 −56 .0 20 .2 100 .1 −29 .6 24 .9 Bonds ....................................................................................... −29 .9 −100 .2 −8 .8 26 .5 −19 .6 −39 .7 2 .3 Bank loans n.e.c. ..................................................................... −4 .0 −31 .4 5 .3 − .7 −6 .7 7 .0 −9 .0 Other loans and advances ...................................................... − .2 −3 .0 −5 .3 − .0 −2 .9 −1 .5 −9 .3
NONFINANCIAL DOMESTIC AND FOREIGN BORROWING .................. 1,500 .7 2,235 .3 1,449 .3 1,391 .7 2,095 .5 1,528 .2 1,718 .9
FINANCIAL SECTORS
BY INSTRUMENT ............................................................................... 972 .2 857 .7 1,053 .4 1,073 .9 672 .0 873 .9 688 .3
Open market paper ................................................................. −27 .7 −50 .6 −62 .5 −114 .3 149 .6 10 .8 −64 .4 GSE issues (government-sponsored enterprises) ................... 225 .8 192 .4 459 .9 96 .9 18 .2 234 .4 108 .0 Agency- and GSE-backed mortgage pool securities .............. 272 .2 266 .9 307 .6 475 .3 80 .1 74 .0 59 .4 Corporate bonds ...................................................................... 497 .1 395 .6 319 .9 562 .4 295 .7 407 .1 555 .3 Bank loans n.e.c. ..................................................................... −38 .6 12 .1 14 .6 −6 .5 25 .3 −34 .4 51 .2 Other loans and advances ...................................................... 43 .9 38 .2 .7 41 .9 76 .0 166 .1 −30 .9 Mortgages ................................................................................ − .4 3 .1 13 .2 18 .1 27 .2 15 .9 9 .8
BY SECTOR ....................................................................................... 972 .2 857 .7 1,053 .4 1,073 .9 672 .0 873 .9 688 .3
Commercial banking ................................................................ 80 .9 28 .0 2 .8 85 .2 187 .6 7 .1 60 .1 U.S.-chartered commercial banks .................................. 15 .7 28 .7 −6 .0 17 .1 85 .0 −9 .3 −2 .0 Foreign banking offices in U.S. ...................................... − .5 − .2 .1 .3 − .1 .3 .4 Bank holding companies ................................................. 65 .7 − .6 8 .7 67 .8 102 .8 16 .1 61 .7
Savings institutions ................................................................. −18 .0 16 .9 .4 25 .0 −7 .0 184 .4 −21 .0 Government-sponsored enterprises ........................................ 225 .8 192 .4 459 .9 96 .9 18 .2 234 .4 108 .0 Agency- and GSE-backed mortgage pools ............................. 272 .2 266 .9 307 .6 475 .3 80 .1 74 .0 59 .4 Asset-backed securities issuers ............................................. 256 .5 240 .1 166 .6 137 .4 126 .3 300 .6 357 .0 Finance companies .................................................................. 45 .6 171 .1 104 .1 148 .2 134 .0 −19 .7 89 .8 REITS (real estate investment trusts) .................................... 17 .5 12 .5 43 .7 55 .7 67 .8 43 .6 84 .4 Brokers and dealers ................................................................ 38 .4 −16 .2 9 .9 −6 .6 51 .9 2 .5 33 .2 Funding corporations ............................................................... 46 .2 −57 .0 −48 .0 53 .3 16 .2 39 .5 −83 .5 Other 1 ...................................................................................... 7 .2 3 .1 6 .4 3 .5 −3 .1 7 .6 1 .0
ALL SECTORS
BY INSTRUMENT ............................................................................... 2,473 .0 3,093 .0 2,502 .7 2,465 .6 2,767 .5 2,402 .1 2,407 .2
Open market paper ................................................................. 15 .0 −59 .2 −113 .7 −168 .5 284 .2 14 .2 −16 .4 Treasury securities .................................................................. 185 .6 722 .5 317 .0 368 .6 482 .9 448 .6 208 .9 Agency- and GSE-backed securities ....................................... 496 .4 459 .9 767 .5 563 .6 99 .3 304 .7 165 .4 Municipal securities ................................................................ 119 .9 182 .6 130 .0 107 .7 167 .5 82 .0 241 .4 Corporate and foreign bonds .................................................. 636 .6 592 .4 407 .2 659 .6 390 .2 373 .0 591 .4 Bank loans n.e.c. ..................................................................... −127 .5 −61 .4 −91 .1 −98 .0 −28 .0 64 .3 29 .8 Other loans and advances ...................................................... 48 .0 25 .4 −27 .4 110 .6 96 .3 133 .9 −16 .2 Mortgages ................................................................................ 1,009 .3 1,122 .1 1,004 .2 875 .8 1,148 .3 933 .9 1,079 .5 Consumer credit ...................................................................... 89 .7 108 .8 108 .9 46 .1 126 .8 47 .5 123 .4
Source: Board of Governors of the Federal Reserve System.
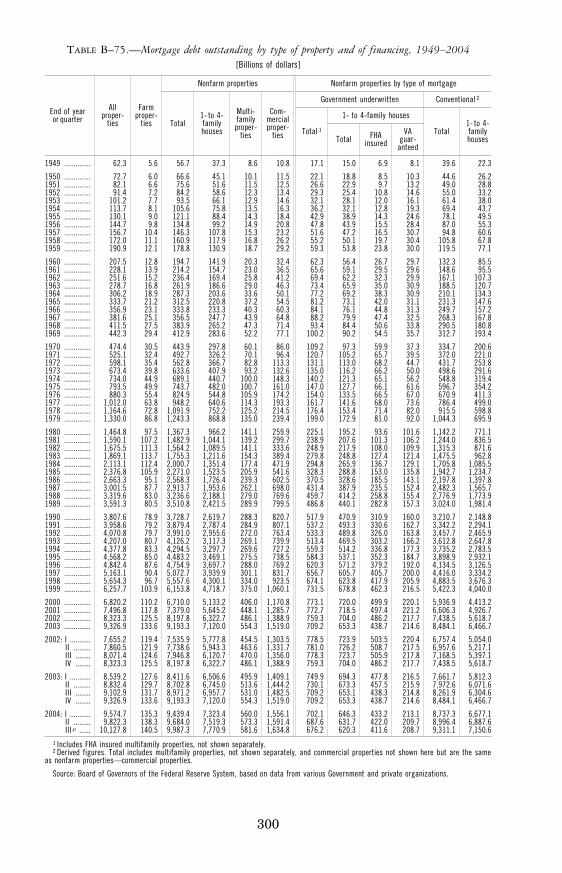
300
TABLE B–75.—Mortgage debt outstanding by type of property and of financing, 1949–2004 [Billions of dollars]
End of year or quarter
All proper-
ties
Farm proper-
ties
Nonfarm properties Nonfarm properties by type of mortgage
Total 1- to 4- family houses
Multi- family proper-
ties
Com-mercial proper-
ties
Government underwritten Conventional 2
Total 1
1- to 4-family houses
Total 1- to 4- family houses Total FHA
insured VA
guar-anteed
1949 .............. 62.3 5.6 56.7 37.3 8.6 10.8 17.1 15.0 6.9 8.1 39.6 22.3
1950 .............. 72.7 6.0 66.6 45.1 10.1 11.5 22.1 18.8 8.5 10.3 44.6 26.2 1951 .............. 82.1 6.6 75.6 51.6 11.5 12.5 26.6 22.9 9.7 13.2 49.0 28.8 1952 .............. 91.4 7.2 84.2 58.6 12.3 13.4 29.3 25.4 10.8 14.6 55.0 33.2 1953 .............. 101.2 7.7 93.5 66.1 12.9 14.6 32.1 28.1 12.0 16.1 61.4 38.0 1954 .............. 113.7 8.1 105.6 75.8 13.5 16.3 36.2 32.1 12.8 19.3 69.4 43.7 1955 .............. 130.1 9.0 121.1 88.4 14.3 18.4 42.9 38.9 14.3 24.6 78.1 49.5 1956 .............. 144.7 9.8 134.8 99.2 14.9 20.8 47.8 43.9 15.5 28.4 87.0 55.3 1957 .............. 156.7 10.4 146.3 107.8 15.3 23.2 51.6 47.2 16.5 30.7 94.8 60.6 1958 .............. 172.0 11.1 160.9 117.9 16.8 26.2 55.2 50.1 19.7 30.4 105.8 67.8 1959 .............. 190.9 12.1 178.8 130.9 18.7 29.2 59.3 53.8 23.8 30.0 119.5 77.1
1960 .............. 207.5 12.8 194.7 141.9 20.3 32.4 62.3 56.4 26.7 29.7 132.3 85.5 1961 .............. 228.1 13.9 214.2 154.7 23.0 36.5 65.6 59.1 29.5 29.6 148.6 95.5 1962 .............. 251.6 15.2 236.4 169.4 25.8 41.2 69.4 62.2 32.3 29.9 167.1 107.3 1963 .............. 278.7 16.8 261.9 186.6 29.0 46.3 73.4 65.9 35.0 30.9 188.5 120.7 1964 .............. 306.2 18.9 287.3 203.6 33.6 50.1 77.2 69.2 38.3 30.9 210.1 134.3 1965 .............. 333.7 21.2 312.5 220.8 37.2 54.5 81.2 73.1 42.0 31.1 231.3 147.6 1966 .............. 356.9 23.1 333.8 233.3 40.3 60.3 84.1 76.1 44.8 31.3 249.7 157.2 1967 .............. 381.6 25.1 356.5 247.7 43.9 64.8 88.2 79.9 47.4 32.5 268.3 167.8 1968 .............. 411.5 27.5 383.9 265.2 47.3 71.4 93.4 84.4 50.6 33.8 290.5 180.8 1969 .............. 442.3 29.4 412.9 283.6 52.2 77.1 100.2 90.2 54.5 35.7 312.7 193.4
1970 .............. 474.4 30.5 443.9 297.8 60.1 86.0 109.2 97.3 59.9 37.3 334.7 200.6 1971 .............. 525.1 32.4 492.7 326.2 70.1 96.4 120.7 105.2 65.7 39.5 372.0 221.0 1972 .............. 598.1 35.4 562.8 366.7 82.8 113.3 131.1 113.0 68.2 44.7 431.7 253.8 1973 .............. 673.4 39.8 633.6 407.9 93.2 132.6 135.0 116.2 66.2 50.0 498.6 291.6 1974 .............. 734.0 44.9 689.1 440.7 100.0 148.3 140.2 121.3 65.1 56.2 548.8 319.4 1975 .............. 793.5 49.9 743.7 482.0 100.7 161.0 147.0 127.7 66.1 61.6 596.7 354.2 1976 .............. 880.3 55.4 824.9 544.8 105.9 174.2 154.0 133.5 66.5 67.0 670.9 411.3 1977 .............. 1,012.0 63.8 948.2 640.6 114.3 193.3 161.7 141.6 68.0 73.6 786.4 499.0 1978 .............. 1,164.6 72.8 1,091.9 752.2 125.2 214.5 176.4 153.4 71.4 82.0 915.5 598.8 1979 .............. 1,330.0 86.8 1,243.3 868.8 135.0 239.4 199.0 172.9 81.0 92.0 1,044.3 695.9
1980 .............. 1,464.8 97.5 1,367.3 966.2 141.1 259.9 225.1 195.2 93.6 101.6 1,142.2 771.1 1981 .............. 1,590.1 107.2 1,482.9 1,044.1 139.2 299.7 238.9 207.6 101.3 106.2 1,244.0 836.5 1982 .............. 1,675.5 111.3 1,564.2 1,089.5 141.1 333.6 248.9 217.9 108.0 109.9 1,315.3 871.6 1983 .............. 1,869.1 113.7 1,755.3 1,211.6 154.3 389.4 279.8 248.8 127.4 121.4 1,475.5 962.8 1984 .............. 2,113.1 112.4 2,000.7 1,351.4 177.4 471.9 294.8 265.9 136.7 129.1 1,705.8 1,085.5 1985 .............. 2,376.8 105.9 2,271.0 1,523.5 205.9 541.6 328.3 288.8 153.0 135.8 1,942.7 1,234.7 1986 .............. 2,663.3 95.1 2,568.3 1,726.4 239.3 602.5 370.5 328.6 185.5 143.1 2,197.8 1,397.8 1987 .............. 3,001.5 87.7 2,913.7 1,953.6 262.1 698.0 431.4 387.9 235.5 152.4 2,482.3 1,565.7 1988 .............. 3,319.6 83.0 3,236.6 2,188.1 279.0 769.6 459.7 414.2 258.8 155.4 2,776.9 1,773.9 1989 .............. 3,591.3 80.5 3,510.8 2,421.5 289.9 799.5 486.8 440.1 282.8 157.3 3,024.0 1,981.4
1990 .............. 3,807.6 78.9 3,728.7 2,619.7 288.3 820.7 517.9 470.9 310.9 160.0 3,210.7 2,148.8 1991 .............. 3,958.6 79.2 3,879.4 2,787.4 284.9 807.1 537.2 493.3 330.6 162.7 3,342.2 2,294.1 1992 .............. 4,070.8 79.7 3,991.0 2,955.6 272.0 763.4 533.3 489.8 326.0 163.8 3,457.7 2,465.9 1993 .............. 4,207.0 80.7 4,126.2 3,117.3 269.1 739.9 513.4 469.5 303.2 166.2 3,612.8 2,647.8 1994 .............. 4,377.8 83.3 4,294.5 3,297.7 269.6 727.2 559.3 514.2 336.8 177.3 3,735.2 2,783.5 1995 .............. 4,568.2 85.0 4,483.2 3,469.1 275.5 738.5 584.3 537.1 352.3 184.7 3,898.9 2,932.1 1996 .............. 4,842.4 87.6 4,754.9 3,697.7 288.0 769.2 620.3 571.2 379.2 192.0 4,134.5 3,126.5 1997 .............. 5,163.1 90.4 5,072.7 3,939.9 301.1 831.7 656.7 605.7 405.7 200.0 4,416.0 3,334.2 1998 .............. 5,654.3 96.7 5,557.6 4,300.1 334.0 923.5 674.1 623.8 417.9 205.9 4,883.5 3,676.3 1999 .............. 6,257.7 103.9 6,153.8 4,718.7 375.0 1,060.1 731.5 678.8 462.3 216.5 5,422.3 4,040.0
2000 .............. 6,820.2 110.2 6,710.0 5,133.2 406.0 1,170.8 773.1 720.0 499.9 220.1 5,936.9 4,413.2 2001 .............. 7,496.8 117.8 7,379.0 5,645.2 448.1 1,285.7 772.7 718.5 497.4 221.2 6,606.3 4,926.7 2002 .............. 8,323.3 125.5 8,197.8 6,322.7 486.1 1,388.9 759.3 704.0 486.2 217.7 7,438.5 5,618.7 2003 .............. 9,326.9 133.6 9,193.3 7,120.0 554.3 1,519.0 709.2 653.3 438.7 214.6 8,484.1 6,466.7
2002: I ........... 7,655.2 119.4 7,535.9 5,777.8 454.5 1,303.5 778.5 723.9 503.5 220.4 6,757.4 5,054.0 II ......... 7,860.5 121.9 7,738.6 5,943.3 463.6 1,331.7 781.0 726.2 508.7 217.5 6,957.6 5,217.1 III ........ 8,071.4 124.6 7,946.8 6,120.7 470.0 1,356.0 778.3 723.7 505.9 217.8 7,168.5 5,397.1 IV ........ 8,323.3 125.5 8,197.8 6,322.7 486.1 1,388.9 759.3 704.0 486.2 217.7 7,438.5 5,618.7
2003: I ........... 8,539.2 127.6 8,411.6 6,506.6 495.9 1,409.1 749.9 694.3 477.8 216.5 7,661.7 5,812.3 II ......... 8,832.4 129.7 8,702.8 6,745.0 513.6 1,444.2 730.1 673.3 457.5 215.9 7,972.6 6,071.6 III ........ 9,102.9 131.7 8,971.2 6,957.7 531.0 1,482.5 709.2 653.1 438.3 214.8 8,261.9 6,304.6 IV ........ 9,326.9 133.6 9,193.3 7,120.0 554.3 1,519.0 709.2 653.3 438.7 214.6 8,484.1 6,466.7
2004: I ........... 9,574.7 135.3 9,439.4 7,323.4 560.0 1,556.1 702.1 646.3 433.2 213.1 8,737.3 6,677.1 II ......... 9,822.3 138.3 9,684.0 7,519.3 573.3 1,591.4 687.6 631.7 422.0 209.7 8,996.4 6,887.6 III p ...... 10,127.8 140.5 9,987.3 7,770.9 581.6 1,634.8 676.2 620.3 411.6 208.7 9,311.1 7,150.6
1 Includes FHA insured multifamily properties, not shown separately. 2 Derived figures. Total includes multifamily properties, not shown separately, and commercial properties not shown here but are the same
as nonfarm properties—commercial properties.
Source: Board of Governors of the Federal Reserve System, based on data from various Government and private organizations.
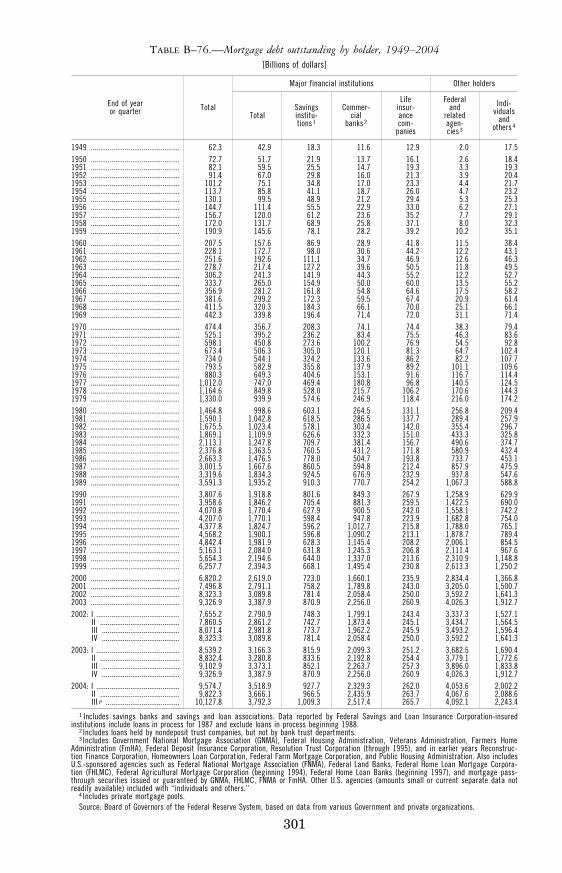
301
TABLE B–76.—Mortgage debt outstanding by holder, 1949–2004 [Billions of dollars]
End of year or quarter Total
Major financial institutions Other holders
Total Savings institu- tions 1
Commer-cial
banks 2
Life insur-ance com-
panies
Federal and
related agen- cies 3
Indi- viduals
and others 4
1949 ............................................... 62.3 42.9 18.3 11.6 12.9 2.0 17.5 1950 ............................................... 72.7 51.7 21.9 13.7 16.1 2.6 18.4 1951 ............................................... 82.1 59.5 25.5 14.7 19.3 3.3 19.3 1952 ............................................... 91.4 67.0 29.8 16.0 21.3 3.9 20.4 1953 ............................................... 101.2 75.1 34.8 17.0 23.3 4.4 21.7 1954 ............................................... 113.7 85.8 41.1 18.7 26.0 4.7 23.2 1955 ............................................... 130.1 99.5 48.9 21.2 29.4 5.3 25.3 1956 ............................................... 144.7 111.4 55.5 22.9 33.0 6.2 27.1 1957 ............................................... 156.7 120.0 61.2 23.6 35.2 7.7 29.1 1958 ............................................... 172.0 131.7 68.9 25.8 37.1 8.0 32.3 1959 ............................................... 190.9 145.6 78.1 28.2 39.2 10.2 35.1 1960 ............................................... 207.5 157.6 86.9 28.9 41.8 11.5 38.4 1961 ............................................... 228.1 172.7 98.0 30.6 44.2 12.2 43.1 1962 ............................................... 251.6 192.6 111.1 34.7 46.9 12.6 46.3 1963 ............................................... 278.7 217.4 127.2 39.6 50.5 11.8 49.5 1964 ............................................... 306.2 241.3 141.9 44.3 55.2 12.2 52.7 1965 ............................................... 333.7 265.0 154.9 50.0 60.0 13.5 55.2 1966 ............................................... 356.9 281.2 161.8 54.8 64.6 17.5 58.2 1967 ............................................... 381.6 299.2 172.3 59.5 67.4 20.9 61.4 1968 ............................................... 411.5 320.3 184.3 66.1 70.0 25.1 66.1 1969 ............................................... 442.3 339.8 196.4 71.4 72.0 31.1 71.4 1970 ............................................... 474.4 356.7 208.3 74.1 74.4 38.3 79.4 1971 ............................................... 525.1 395.2 236.2 83.4 75.5 46.3 83.6 1972 ............................................... 598.1 450.8 273.6 100.2 76.9 54.5 92.8 1973 ............................................... 673.4 506.3 305.0 120.1 81.3 64.7 102.4 1974 ............................................... 734.0 544.1 324.2 133.6 86.2 82.2 107.7 1975 ............................................... 793.5 582.9 355.8 137.9 89.2 101.1 109.6 1976 ............................................... 880.3 649.3 404.6 153.1 91.6 116.7 114.4 1977 ............................................... 1,012.0 747.0 469.4 180.8 96.8 140.5 124.5 1978 ............................................... 1,164.6 849.8 528.0 215.7 106.2 170.6 144.3 1979 ............................................... 1,330.0 939.9 574.6 246.9 118.4 216.0 174.2 1980 ............................................... 1,464.8 998.6 603.1 264.5 131.1 256.8 209.4 1981 ............................................... 1,590.1 1,042.8 618.5 286.5 137.7 289.4 257.9 1982 ............................................... 1,675.5 1,023.4 578.1 303.4 142.0 355.4 296.7 1983 ............................................... 1,869.1 1,109.9 626.6 332.3 151.0 433.3 325.8 1984 ............................................... 2,113.1 1,247.8 709.7 381.4 156.7 490.6 374.7 1985 ............................................... 2,376.8 1,363.5 760.5 431.2 171.8 580.9 432.4 1986 ............................................... 2,663.3 1,476.5 778.0 504.7 193.8 733.7 453.1 1987 ............................................... 3,001.5 1,667.6 860.5 594.8 212.4 857.9 475.9 1988 ............................................... 3,319.6 1,834.3 924.5 676.9 232.9 937.8 547.6 1989 ............................................... 3,591.3 1,935.2 910.3 770.7 254.2 1,067.3 588.8 1990 ............................................... 3,807.6 1,918.8 801.6 849.3 267.9 1,258.9 629.9 1991 ............................................... 3,958.6 1,846.2 705.4 881.3 259.5 1,422.5 690.0 1992 ............................................... 4,070.8 1,770.4 627.9 900.5 242.0 1,558.1 742.2 1993 ............................................... 4,207.0 1,770.1 598.4 947.8 223.9 1,682.8 754.0 1994 ............................................... 4,377.8 1,824.7 596.2 1,012.7 215.8 1,788.0 765.1 1995 ............................................... 4,568.2 1,900.1 596.8 1,090.2 213.1 1,878.7 789.4 1996 ............................................... 4,842.4 1,981.9 628.3 1,145.4 208.2 2,006.1 854.5 1997 ............................................... 5,163.1 2,084.0 631.8 1,245.3 206.8 2,111.4 967.6 1998 ............................................... 5,654.3 2,194.6 644.0 1,337.0 213.6 2,310.9 1,148.8 1999 ............................................... 6,257.7 2,394.3 668.1 1,495.4 230.8 2,613.3 1,250.2 2000 ............................................... 6,820.2 2,619.0 723.0 1,660.1 235.9 2,834.4 1,366.8 2001 ............................................... 7,496.8 2,791.1 758.2 1,789.8 243.0 3,205.0 1,500.7 2002 ............................................... 8,323.3 3,089.8 781.4 2,058.4 250.0 3,592.2 1,641.3 2003 ............................................... 9,326.9 3,387.9 870.9 2,256.0 260.9 4,026.3 1,912.7 2002: I ............................................ 7,655.2 2,790.9 748.3 1,799.1 243.4 3,337.3 1,527.1
II .......................................... 7,860.5 2,861.2 742.7 1,873.4 245.1 3,434.7 1,564.5 III ......................................... 8,071.4 2,981.8 773.7 1,962.2 245.9 3,493.2 1,596.4 IV ......................................... 8,323.3 3,089.8 781.4 2,058.4 250.0 3,592.2 1,641.3
2003: I ............................................ 8,539.2 3,166.3 815.9 2,099.3 251.2 3,682.5 1,690.4 II .......................................... 8,832.4 3,280.8 833.6 2,192.8 254.4 3,779.1 1,772.6 III ......................................... 9,102.9 3,373.1 852.1 2,263.7 257.3 3,896.0 1,833.8 IV ......................................... 9,326.9 3,387.9 870.9 2,256.0 260.9 4,026.3 1,912.7
2004: I ............................................ 9,574.7 3,518.9 927.7 2,329.3 262.0 4,053.6 2,002.2 II .......................................... 9,822.3 3,666.1 966.5 2,435.9 263.7 4,067.6 2,088.6 III p ....................................... 10,127.8 3,792.3 1,009.3 2,517.4 265.7 4,092.1 2,243.4
1 Includes savings banks and savings and loan associations. Data reported by Federal Savings and Loan Insurance Corporation-insured institutions include loans in process for 1987 and exclude loans in process beginning 1988.
2 Includes loans held by nondeposit trust companies, but not by bank trust departments. 3 Includes Government National Mortgage Association (GNMA), Federal Housing Administration, Veterans Administration, Farmers Home
Administration (FmHA), Federal Deposit Insurance Corporation, Resolution Trust Corporation (through 1995), and in earlier years Reconstruc-tion Finance Corporation, Homeowners Loan Corporation, Federal Farm Mortgage Corporation, and Public Housing Administration. Also includes U.S.-sponsored agencies such as Federal National Mortgage Association (FNMA), Federal Land Banks, Federal Home Loan Mortgage Corpora-tion (FHLMC), Federal Agricultural Mortgage Corporation (beginning 1994), Federal Home Loan Banks (beginning 1997), and mortgage pass- through securities issued or guaranteed by GNMA, FHLMC, FNMA or FmHA. Other U.S. agencies (amounts small or current separate data not readily available) included with ‘‘individuals and others.’’
4 Includes private mortgage pools. Source: Board of Governors of the Federal Reserve System, based on data from various Government and private organizations.
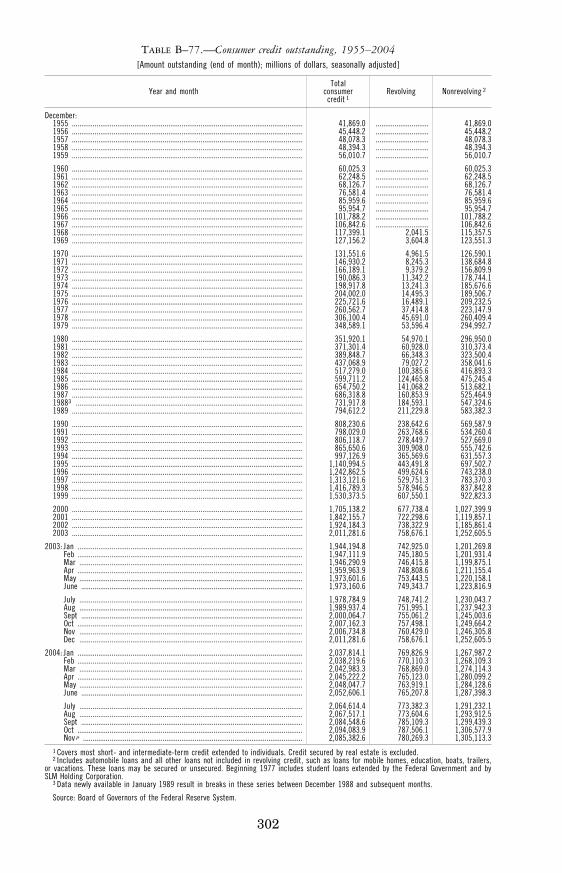
302
TABLE B–77.—Consumer credit outstanding, 1955–2004 [Amount outstanding (end of month); millions of dollars, seasonally adjusted]
Year and month Total
consumer credit 1
Revolving Nonrevolving 2
December: 1955 .......................................................................................................................... 41,869.0 ............................ 41,869.0 1956 .......................................................................................................................... 45,448.2 ............................ 45,448.2 1957 .......................................................................................................................... 48,078.3 ............................ 48,078.3 1958 .......................................................................................................................... 48,394.3 ............................ 48,394.3 1959 .......................................................................................................................... 56,010.7 ............................ 56,010.7
1960 .......................................................................................................................... 60,025.3 ............................ 60,025.3 1961 .......................................................................................................................... 62,248.5 ............................ 62,248.5 1962 .......................................................................................................................... 68,126.7 ............................ 68,126.7 1963 .......................................................................................................................... 76,581.4 ............................ 76,581.4 1964 .......................................................................................................................... 85,959.6 ............................ 85,959.6 1965 .......................................................................................................................... 95,954.7 ............................ 95,954.7 1966 .......................................................................................................................... 101,788.2 ............................ 101,788.2 1967 .......................................................................................................................... 106,842.6 ............................ 106,842.6 1968 .......................................................................................................................... 117,399.1 2,041.5 115,357.5 1969 .......................................................................................................................... 127,156.2 3,604.8 123,551.3
1970 .......................................................................................................................... 131,551.6 4,961.5 126,590.1 1971 .......................................................................................................................... 146,930.2 8,245.3 138,684.8 1972 .......................................................................................................................... 166,189.1 9,379.2 156,809.9 1973 .......................................................................................................................... 190,086.3 11,342.2 178,744.1 1974 .......................................................................................................................... 198,917.8 13,241.3 185,676.6 1975 .......................................................................................................................... 204,002.0 14,495.3 189,506.7 1976 .......................................................................................................................... 225,721.6 16,489.1 209,232.5 1977 .......................................................................................................................... 260,562.7 37,414.8 223,147.9 1978 .......................................................................................................................... 306,100.4 45,691.0 260,409.4 1979 .......................................................................................................................... 348,589.1 53,596.4 294,992.7
1980 .......................................................................................................................... 351,920.1 54,970.1 296,950.0 1981 .......................................................................................................................... 371,301.4 60,928.0 310,373.4 1982 .......................................................................................................................... 389,848.7 66,348.3 323,500.4 1983 .......................................................................................................................... 437,068.9 79,027.2 358,041.6 1984 .......................................................................................................................... 517,279.0 100,385.6 416,893.3 1985 .......................................................................................................................... 599,711.2 124,465.8 475,245.4 1986 .......................................................................................................................... 654,750.2 141,068.2 513,682.1 1987 .......................................................................................................................... 686,318.8 160,853.9 525,464.9 19883 ........................................................................................................................ 731,917.8 184,593.1 547,324.6 1989 .......................................................................................................................... 794,612.2 211,229.8 583,382.3
1990 .......................................................................................................................... 808,230.6 238,642.6 569,587.9 1991 .......................................................................................................................... 798,029.0 263,768.6 534,260.4 1992 .......................................................................................................................... 806,118.7 278,449.7 527,669.0 1993 .......................................................................................................................... 865,650.6 309,908.0 555,742.6 1994 .......................................................................................................................... 997,126.9 365,569.6 631,557.3 1995 .......................................................................................................................... 1,140,994.5 443,491.8 697,502.7 1996 .......................................................................................................................... 1,242,862.5 499,624.6 743,238.0 1997 .......................................................................................................................... 1,313,121.6 529,751.3 783,370.3 1998 .......................................................................................................................... 1,416,789.3 578,946.5 837,842.8 1999 .......................................................................................................................... 1,530,373.5 607,550.1 922,823.3
2000 .......................................................................................................................... 1,705,138.2 677,738.4 1,027,399.9 2001 .......................................................................................................................... 1,842,155.7 722,298.6 1,119,857.1 2002 .......................................................................................................................... 1,924,184.3 738,322.9 1,185,861.4 2003 .......................................................................................................................... 2,011,281.6 758,676.1 1,252,605.5
2003: Jan ....................................................................................................................... 1,944,194.8 742,925.0 1,201,269.8 Feb ....................................................................................................................... 1,947,111.9 745,180.5 1,201,931.4 Mar ...................................................................................................................... 1,946,290.9 746,415.8 1,199,875.1 Apr ....................................................................................................................... 1,959,963.9 748,808.6 1,211,155.4 May ...................................................................................................................... 1,973,601.6 753,443.5 1,220,158.1 June ..................................................................................................................... 1,973,160.6 749,343.7 1,223,816.9
July ...................................................................................................................... 1,978,784.9 748,741.2 1,230,043.7 Aug ...................................................................................................................... 1,989,937.4 751,995.1 1,237,942.3 Sept ..................................................................................................................... 2,000,064.7 755,061.2 1,245,003.6 Oct ....................................................................................................................... 2,007,162.3 757,498.1 1,249,664.2 Nov ...................................................................................................................... 2,006,734.8 760,429.0 1,246,305.8 Dec ...................................................................................................................... 2,011,281.6 758,676.1 1,252,605.5
2004: Jan ....................................................................................................................... 2,037,814.1 769,826.9 1,267,987.2 Feb ....................................................................................................................... 2,038,219.6 770,110.3 1,268,109.3 Mar ...................................................................................................................... 2,042,983.3 768,869.0 1,274,114.3 Apr ....................................................................................................................... 2,045,222.2 765,123.0 1,280,099.2 May ...................................................................................................................... 2,048,047.7 763,919.1 1,284,128.6 June ..................................................................................................................... 2,052,606.1 765,207.8 1,287,398.3
July ...................................................................................................................... 2,064,614.4 773,382.3 1,291,232.1 Aug ...................................................................................................................... 2,067,517.1 773,604.6 1,293,912.5 Sept ..................................................................................................................... 2,084,548.6 785,109.3 1,299,439.3 Oct ....................................................................................................................... 2,094,083.9 787,506.1 1,306,577.9 Nov p .................................................................................................................... 2,085,382.6 780,269.3 1,305,113.3
1 Covers most short- and intermediate-term credit extended to individuals. Credit secured by real estate is excluded. 2 Includes automobile loans and all other loans not included in revolving credit, such as loans for mobile homes, education, boats, trailers,
or vacations. These loans may be secured or unsecured. Beginning 1977 includes student loans extended by the Federal Government and by SLM Holding Corporation.
3 Data newly available in January 1989 result in breaks in these series between December 1988 and subsequent months.
Source: Board of Governors of the Federal Reserve System.
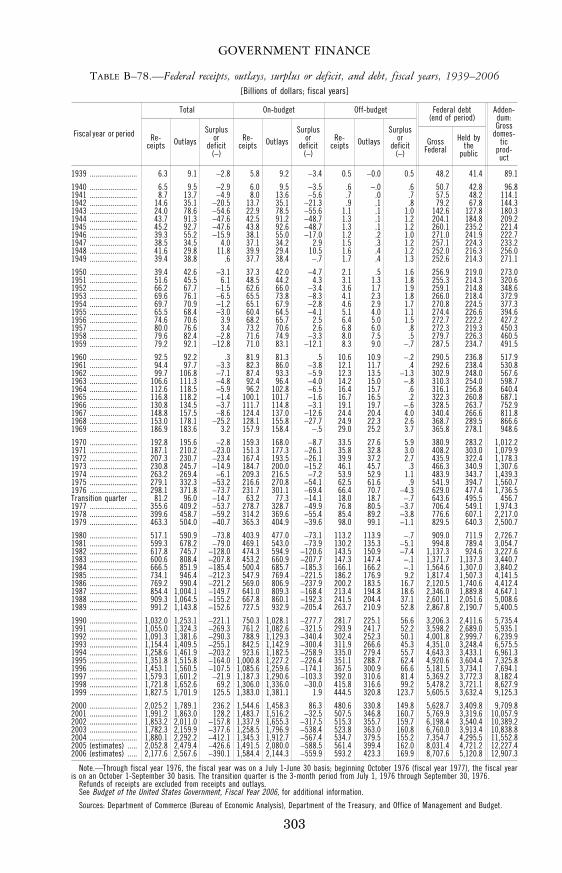
303
GOVERNMENT FINANCE
TABLE B–78.—Federal receipts, outlays, surplus or deficit, and debt, fiscal years, 1939–2006 [Billions of dollars; fiscal years]
Fiscal year or period
Total On-budget Off-budget Federal debt (end of period)
Adden- dum: Gross
domes- tic
prod- uct
Re-ceipts Outlays
Surplus or
deficit (−)
Re-ceipts Outlays
Surplus or
deficit (−)
Re-ceipts Outlays
Surplus or
deficit (−)
Gross Federal
Held by the
public
1939 ......................... 6.3 9.1 −2.8 5.8 9.2 −3.4 0.5 −0.0 0.5 48.2 41.4 89.1
1940 ......................... 6.5 9.5 −2.9 6.0 9.5 −3.5 .6 −.0 .6 50.7 42.8 96.8 1941 ......................... 8.7 13.7 −4.9 8.0 13.6 −5.6 .7 .0 .7 57.5 48.2 114.1 1942 ......................... 14.6 35.1 −20.5 13.7 35.1 −21.3 .9 .1 .8 79.2 67.8 144.3 1943 ......................... 24.0 78.6 −54.6 22.9 78.5 −55.6 1.1 .1 1.0 142.6 127.8 180.3 1944 ......................... 43.7 91.3 −47.6 42.5 91.2 −48.7 1.3 .1 1.2 204.1 184.8 209.2 1945 ......................... 45.2 92.7 −47.6 43.8 92.6 −48.7 1.3 .1 1.2 260.1 235.2 221.4 1946 ......................... 39.3 55.2 −15.9 38.1 55.0 −17.0 1.2 .2 1.0 271.0 241.9 222.7 1947 ......................... 38.5 34.5 4.0 37.1 34.2 2.9 1.5 .3 1.2 257.1 224.3 233.2 1948 ......................... 41.6 29.8 11.8 39.9 29.4 10.5 1.6 .4 1.2 252.0 216.3 256.0 1949 ......................... 39.4 38.8 .6 37.7 38.4 −.7 1.7 .4 1.3 252.6 214.3 271.1
1950 ......................... 39.4 42.6 −3.1 37.3 42.0 −4.7 2.1 .5 1.6 256.9 219.0 273.0 1951 ......................... 51.6 45.5 6.1 48.5 44.2 4.3 3.1 1.3 1.8 255.3 214.3 320.6 1952 ......................... 66.2 67.7 −1.5 62.6 66.0 −3.4 3.6 1.7 1.9 259.1 214.8 348.6 1953 ......................... 69.6 76.1 −6.5 65.5 73.8 −8.3 4.1 2.3 1.8 266.0 218.4 372.9 1954 ......................... 69.7 70.9 −1.2 65.1 67.9 −2.8 4.6 2.9 1.7 270.8 224.5 377.3 1955 ......................... 65.5 68.4 −3.0 60.4 64.5 −4.1 5.1 4.0 1.1 274.4 226.6 394.6 1956 ......................... 74.6 70.6 3.9 68.2 65.7 2.5 6.4 5.0 1.5 272.7 222.2 427.2 1957 ......................... 80.0 76.6 3.4 73.2 70.6 2.6 6.8 6.0 .8 272.3 219.3 450.3 1958 ......................... 79.6 82.4 −2.8 71.6 74.9 −3.3 8.0 7.5 .5 279.7 226.3 460.5 1959 ......................... 79.2 92.1 −12.8 71.0 83.1 −12.1 8.3 9.0 −.7 287.5 234.7 491.5
1960 ......................... 92.5 92.2 .3 81.9 81.3 .5 10.6 10.9 −.2 290.5 236.8 517.9 1961 ......................... 94.4 97.7 −3.3 82.3 86.0 −3.8 12.1 11.7 .4 292.6 238.4 530.8 1962 ......................... 99.7 106.8 −7.1 87.4 93.3 −5.9 12.3 13.5 −1.3 302.9 248.0 567.6 1963 ......................... 106.6 111.3 −4.8 92.4 96.4 −4.0 14.2 15.0 −.8 310.3 254.0 598.7 1964 ......................... 112.6 118.5 −5.9 96.2 102.8 −6.5 16.4 15.7 .6 316.1 256.8 640.4 1965 ......................... 116.8 118.2 −1.4 100.1 101.7 −1.6 16.7 16.5 .2 322.3 260.8 687.1 1966 ......................... 130.8 134.5 −3.7 111.7 114.8 −3.1 19.1 19.7 −.6 328.5 263.7 752.9 1967 ......................... 148.8 157.5 −8.6 124.4 137.0 −12.6 24.4 20.4 4.0 340.4 266.6 811.8 1968 ......................... 153.0 178.1 −25.2 128.1 155.8 −27.7 24.9 22.3 2.6 368.7 289.5 866.6 1969 ......................... 186.9 183.6 3.2 157.9 158.4 −.5 29.0 25.2 3.7 365.8 278.1 948.6
1970 ......................... 192.8 195.6 −2.8 159.3 168.0 −8.7 33.5 27.6 5.9 380.9 283.2 1,012.2 1971 ......................... 187.1 210.2 −23.0 151.3 177.3 −26.1 35.8 32.8 3.0 408.2 303.0 1,079.9 1972 ......................... 207.3 230.7 −23.4 167.4 193.5 −26.1 39.9 37.2 2.7 435.9 322.4 1,178.3 1973 ......................... 230.8 245.7 −14.9 184.7 200.0 −15.2 46.1 45.7 .3 466.3 340.9 1,307.6 1974 ......................... 263.2 269.4 −6.1 209.3 216.5 −7.2 53.9 52.9 1.1 483.9 343.7 1,439.3 1975 ......................... 279.1 332.3 −53.2 216.6 270.8 −54.1 62.5 61.6 .9 541.9 394.7 1,560.7 1976 ......................... 298.1 371.8 −73.7 231.7 301.1 −69.4 66.4 70.7 −4.3 629.0 477.4 1,736.5 Transition quarter ... 81.2 96.0 −14.7 63.2 77.3 −14.1 18.0 18.7 −.7 643.6 495.5 456.7 1977 ......................... 355.6 409.2 −53.7 278.7 328.7 −49.9 76.8 80.5 −3.7 706.4 549.1 1,974.3 1978 ......................... 399.6 458.7 −59.2 314.2 369.6 −55.4 85.4 89.2 −3.8 776.6 607.1 2,217.0 1979 ......................... 463.3 504.0 −40.7 365.3 404.9 −39.6 98.0 99.1 −1.1 829.5 640.3 2,500.7
1980 ......................... 517.1 590.9 −73.8 403.9 477.0 −73.1 113.2 113.9 −.7 909.0 711.9 2,726.7 1981 ......................... 599.3 678.2 −79.0 469.1 543.0 −73.9 130.2 135.3 −5.1 994.8 789.4 3,054.7 1982 ......................... 617.8 745.7 −128.0 474.3 594.9 −120.6 143.5 150.9 −7.4 1,137.3 924.6 3,227.6 1983 ......................... 600.6 808.4 −207.8 453.2 660.9 −207.7 147.3 147.4 −.1 1,371.7 1,137.3 3,440.7 1984 ......................... 666.5 851.9 −185.4 500.4 685.7 −185.3 166.1 166.2 −.1 1,564.6 1,307.0 3,840.2 1985 ......................... 734.1 946.4 −212.3 547.9 769.4 −221.5 186.2 176.9 9.2 1,817.4 1,507.3 4,141.5 1986 ......................... 769.2 990.4 −221.2 569.0 806.9 −237.9 200.2 183.5 16.7 2,120.5 1,740.6 4,412.4 1987 ......................... 854.4 1,004.1 −149.7 641.0 809.3 −168.4 213.4 194.8 18.6 2,346.0 1,889.8 4,647.1 1988 ......................... 909.3 1,064.5 −155.2 667.8 860.1 −192.3 241.5 204.4 37.1 2,601.1 2,051.6 5,008.6 1989 ......................... 991.2 1,143.8 −152.6 727.5 932.9 −205.4 263.7 210.9 52.8 2,867.8 2,190.7 5,400.5
1990 ......................... 1,032.0 1,253.1 −221.1 750.3 1,028.1 −277.7 281.7 225.1 56.6 3,206.3 2,411.6 5,735.4 1991 ......................... 1,055.0 1,324.3 −269.3 761.2 1,082.6 −321.5 293.9 241.7 52.2 3,598.2 2,689.0 5,935.1 1992 ......................... 1,091.3 1,381.6 −290.3 788.9 1,129.3 −340.4 302.4 252.3 50.1 4,001.8 2,999.7 6,239.9 1993 ......................... 1,154.4 1,409.5 −255.1 842.5 1,142.9 −300.4 311.9 266.6 45.3 4,351.0 3,248.4 6,575.5 1994 ......................... 1,258.6 1,461.9 −203.2 923.6 1,182.5 −258.9 335.0 279.4 55.7 4,643.3 3,433.1 6,961.3 1995 ......................... 1,351.8 1,515.8 −164.0 1,000.8 1,227.2 −226.4 351.1 288.7 62.4 4,920.6 3,604.4 7,325.8 1996 ......................... 1,453.1 1,560.5 −107.5 1,085.6 1,259.6 −174.1 367.5 300.9 66.6 5,181.5 3,734.1 7,694.1 1997 ......................... 1,579.3 1,601.2 −21.9 1,187.3 1,290.6 −103.3 392.0 310.6 81.4 5,369.2 3,772.3 8,182.4 1998 ......................... 1,721.8 1,652.6 69.2 1,306.0 1,336.0 −30.0 415.8 316.6 99.2 5,478.2 3,721.1 8,627.9 1999 ......................... 1,827.5 1,701.9 125.5 1,383.0 1,381.1 1.9 444.5 320.8 123.7 5,605.5 3,632.4 9,125.3
2000 ......................... 2,025.2 1,789.1 236.2 1,544.6 1,458.3 86.3 480.6 330.8 149.8 5,628.7 3,409.8 9,709.8 2001 ......................... 1,991.2 1,863.0 128.2 1,483.7 1,516.2 −32.5 507.5 346.8 160.7 5,769.9 3,319.6 10,057.9 2002 ......................... 1,853.2 2,011.0 −157.8 1,337.9 1,655.3 −317.5 515.3 355.7 159.7 6,198.4 3,540.4 10,389.2 2003 ......................... 1,782.3 2,159.9 −377.6 1,258.5 1,796.9 −538.4 523.8 363.0 160.8 6,760.0 3,913.4 10,838.8 2004 ......................... 1,880.1 2,292.2 −412.1 1,345.3 1,912.7 −567.4 534.7 379.5 155.2 7,354.7 4,295.5 11,552.8 2005 (estimates) ..... 2,052.8 2,479.4 −426.6 1,491.5 2,080.0 −588.5 561.4 399.4 162.0 8,031.4 4,721.2 12,227.4 2006 (estimates) ..... 2,177.6 2,567.6 −390.1 1,584.4 2,144.3 −559.9 593.2 423.3 169.9 8,707.6 5,120.8 12,907.3
Note.—Through fiscal year 1976, the fiscal year was on a July 1-June 30 basis; beginning October 1976 (fiscal year 1977), the fiscal year is on an October 1-September 30 basis. The transition quarter is the 3-month period from July 1, 1976 through September 30, 1976.
Refunds of receipts are excluded from receipts and outlays. See Budget of the United States Government, Fiscal Year 2006, for additional information.
Sources: Department of Commerce (Bureau of Economic Analysis), Department of the Treasury, and Office of Management and Budget.
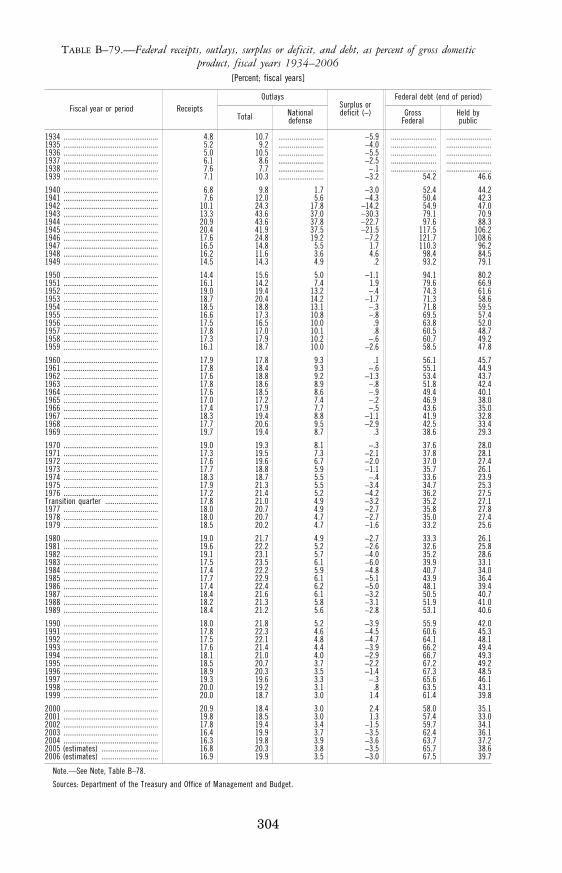
304
TABLE B–79.—Federal receipts, outlays, surplus or deficit, and debt, as percent of gross domestic product, fiscal years 1934–2006
[Percent; fiscal years]
Fiscal year or period Receipts Outlays
Surplus or deficit (−)
Federal debt (end of period)
Total National defense
Gross Federal
Held by public
1934 .................................................. 4.8 10.7 ........................ −5.9 ........................ ........................1935 .................................................. 5.2 9.2 ........................ −4.0 ........................ ........................1936 .................................................. 5.0 10.5 ........................ −5.5 ........................ ........................1937 .................................................. 6.1 8.6 ........................ −2.5 ........................ ........................1938 .................................................. 7.6 7.7 ........................ −.1 ........................ ........................1939 .................................................. 7.1 10.3 ........................ −3.2 54.2 46.6
1940 .................................................. 6.8 9.8 1.7 −3.0 52.4 44.2 1941 .................................................. 7.6 12.0 5.6 −4.3 50.4 42.3 1942 .................................................. 10.1 24.3 17.8 −14.2 54.9 47.0 1943 .................................................. 13.3 43.6 37.0 −30.3 79.1 70.9 1944 .................................................. 20.9 43.6 37.8 −22.7 97.6 88.3 1945 .................................................. 20.4 41.9 37.5 −21.5 117.5 106.2 1946 .................................................. 17.6 24.8 19.2 −7.2 121.7 108.6 1947 .................................................. 16.5 14.8 5.5 1.7 110.3 96.2 1948 .................................................. 16.2 11.6 3.6 4.6 98.4 84.5 1949 .................................................. 14.5 14.3 4.9 .2 93.2 79.1
1950 .................................................. 14.4 15.6 5.0 −1.1 94.1 80.2 1951 .................................................. 16.1 14.2 7.4 1.9 79.6 66.9 1952 .................................................. 19.0 19.4 13.2 −.4 74.3 61.6 1953 .................................................. 18.7 20.4 14.2 −1.7 71.3 58.6 1954 .................................................. 18.5 18.8 13.1 −.3 71.8 59.5 1955 .................................................. 16.6 17.3 10.8 −.8 69.5 57.4 1956 .................................................. 17.5 16.5 10.0 .9 63.8 52.0 1957 .................................................. 17.8 17.0 10.1 .8 60.5 48.7 1958 .................................................. 17.3 17.9 10.2 −.6 60.7 49.2 1959 .................................................. 16.1 18.7 10.0 −2.6 58.5 47.8
1960 .................................................. 17.9 17.8 9.3 .1 56.1 45.7 1961 .................................................. 17.8 18.4 9.3 −.6 55.1 44.9 1962 .................................................. 17.6 18.8 9.2 −1.3 53.4 43.7 1963 .................................................. 17.8 18.6 8.9 −.8 51.8 42.4 1964 .................................................. 17.6 18.5 8.6 −.9 49.4 40.1 1965 .................................................. 17.0 17.2 7.4 −.2 46.9 38.0 1966 .................................................. 17.4 17.9 7.7 −.5 43.6 35.0 1967 .................................................. 18.3 19.4 8.8 −1.1 41.9 32.8 1968 .................................................. 17.7 20.6 9.5 −2.9 42.5 33.4 1969 .................................................. 19.7 19.4 8.7 .3 38.6 29.3
1970 .................................................. 19.0 19.3 8.1 −.3 37.6 28.0 1971 .................................................. 17.3 19.5 7.3 −2.1 37.8 28.1 1972 .................................................. 17.6 19.6 6.7 −2.0 37.0 27.4 1973 .................................................. 17.7 18.8 5.9 −1.1 35.7 26.1 1974 .................................................. 18.3 18.7 5.5 −.4 33.6 23.9 1975 .................................................. 17.9 21.3 5.5 −3.4 34.7 25.3 1976 .................................................. 17.2 21.4 5.2 −4.2 36.2 27.5 Transition quarter ............................ 17.8 21.0 4.9 −3.2 35.2 27.1 1977 .................................................. 18.0 20.7 4.9 −2.7 35.8 27.8 1978 .................................................. 18.0 20.7 4.7 −2.7 35.0 27.4 1979 .................................................. 18.5 20.2 4.7 −1.6 33.2 25.6
1980 .................................................. 19.0 21.7 4.9 −2.7 33.3 26.1 1981 .................................................. 19.6 22.2 5.2 −2.6 32.6 25.8 1982 .................................................. 19.1 23.1 5.7 −4.0 35.2 28.6 1983 .................................................. 17.5 23.5 6.1 −6.0 39.9 33.1 1984 .................................................. 17.4 22.2 5.9 −4.8 40.7 34.0 1985 .................................................. 17.7 22.9 6.1 −5.1 43.9 36.4 1986 .................................................. 17.4 22.4 6.2 −5.0 48.1 39.4 1987 .................................................. 18.4 21.6 6.1 −3.2 50.5 40.7 1988 .................................................. 18.2 21.3 5.8 −3.1 51.9 41.0 1989 .................................................. 18.4 21.2 5.6 −2.8 53.1 40.6
1990 .................................................. 18.0 21.8 5.2 −3.9 55.9 42.0 1991 .................................................. 17.8 22.3 4.6 −4.5 60.6 45.3 1992 .................................................. 17.5 22.1 4.8 −4.7 64.1 48.1 1993 .................................................. 17.6 21.4 4.4 −3.9 66.2 49.4 1994 .................................................. 18.1 21.0 4.0 −2.9 66.7 49.3 1995 .................................................. 18.5 20.7 3.7 −2.2 67.2 49.2 1996 .................................................. 18.9 20.3 3.5 −1.4 67.3 48.5 1997 .................................................. 19.3 19.6 3.3 −.3 65.6 46.1 1998 .................................................. 20.0 19.2 3.1 .8 63.5 43.1 1999 .................................................. 20.0 18.7 3.0 1.4 61.4 39.8
2000 .................................................. 20.9 18.4 3.0 2.4 58.0 35.1 2001 .................................................. 19.8 18.5 3.0 1.3 57.4 33.0 2002 .................................................. 17.8 19.4 3.4 −1.5 59.7 34.1 2003 .................................................. 16.4 19.9 3.7 −3.5 62.4 36.1 2004 .................................................. 16.3 19.8 3.9 −3.6 63.7 37.2 2005 (estimates) .............................. 16.8 20.3 3.8 −3.5 65.7 38.6 2006 (estimates) .............................. 16.9 19.9 3.5 −3.0 67.5 39.7
Note.—See Note, Table B–78.
Sources: Department of the Treasury and Office of Management and Budget.
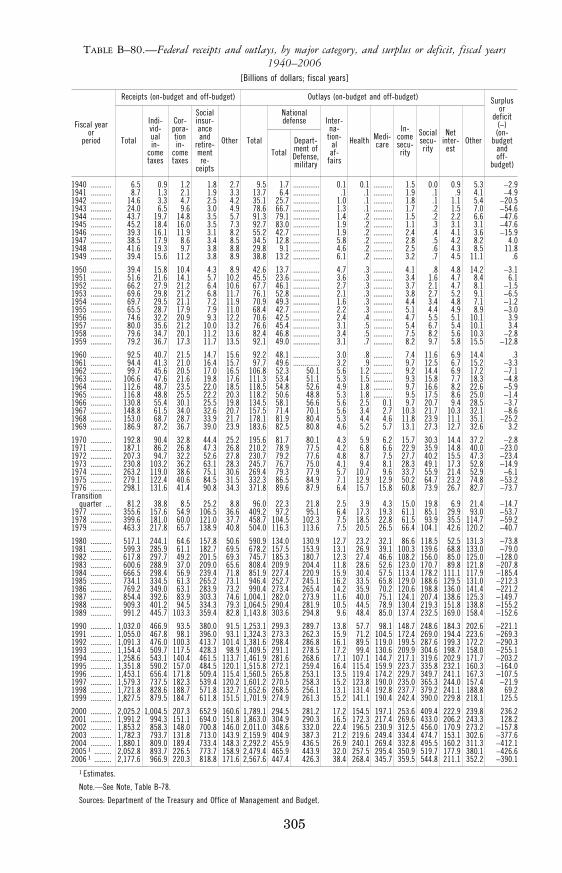
305
TABLE B–80.—Federal receipts and outlays, by major category, and surplus or deficit, fiscal years 1940–2006
[Billions of dollars; fiscal years]
Fiscal year or
period
Receipts (on-budget and off-budget) Outlays (on-budget and off-budget) Surplus or
deficit (−) (on-
budget and off-
budget)
Total
Indi- vid- ual in-
come taxes
Cor- pora- tion in-
come taxes
Social insur- ance and
retire- ment re-
ceipts
Other Total
National defense Inter-
na- tion-
al af-
fairs
Health Medi-care
In-come secu-rity
Social secu-rity
Net inter-
est Other
Total Depart-ment of Defense, military
1940 ........... 6.5 0.9 1.2 1.8 2.7 9.5 1.7 .............. 0.1 0.1 .......... 1.5 0.0 0.9 5.3 −2.9 1941 ........... 8.7 1.3 2.1 1.9 3.3 13.7 6.4 .............. .1 .1 .......... 1.9 .1 .9 4.1 −4.9 1942 ........... 14.6 3.3 4.7 2.5 4.2 35.1 25.7 .............. 1.0 .1 .......... 1.8 .1 1.1 5.4 −20.5 1943 ........... 24.0 6.5 9.6 3.0 4.9 78.6 66.7 .............. 1.3 .1 .......... 1.7 .2 1.5 7.0 −54.6 1944 ........... 43.7 19.7 14.8 3.5 5.7 91.3 79.1 .............. 1.4 .2 .......... 1.5 .2 2.2 6.6 −47.6 1945 ........... 45.2 18.4 16.0 3.5 7.3 92.7 83.0 .............. 1.9 .2 .......... 1.1 .3 3.1 3.1 −47.6 1946 ........... 39.3 16.1 11.9 3.1 8.2 55.2 42.7 .............. 1.9 .2 .......... 2.4 .4 4.1 3.6 −15.9 1947 ........... 38.5 17.9 8.6 3.4 8.5 34.5 12.8 .............. 5.8 .2 .......... 2.8 .5 4.2 8.2 4.0 1948 ........... 41.6 19.3 9.7 3.8 8.8 29.8 9.1 .............. 4.6 .2 .......... 2.5 .6 4.3 8.5 11.8 1949 ........... 39.4 15.6 11.2 3.8 8.9 38.8 13.2 .............. 6.1 .2 .......... 3.2 .7 4.5 11.1 .6
1950 ........... 39.4 15.8 10.4 4.3 8.9 42.6 13.7 .............. 4.7 .3 .......... 4.1 .8 4.8 14.2 −3.1 1951 ........... 51.6 21.6 14.1 5.7 10.2 45.5 23.6 .............. 3.6 .3 .......... 3.4 1.6 4.7 8.4 6.1 1952 ........... 66.2 27.9 21.2 6.4 10.6 67.7 46.1 .............. 2.7 .3 .......... 3.7 2.1 4.7 8.1 −1.5 1953 ........... 69.6 29.8 21.2 6.8 11.7 76.1 52.8 .............. 2.1 .3 .......... 3.8 2.7 5.2 9.1 −6.5 1954 ........... 69.7 29.5 21.1 7.2 11.9 70.9 49.3 .............. 1.6 .3 .......... 4.4 3.4 4.8 7.1 −1.2 1955 ........... 65.5 28.7 17.9 7.9 11.0 68.4 42.7 .............. 2.2 .3 .......... 5.1 4.4 4.9 8.9 −3.0 1956 ........... 74.6 32.2 20.9 9.3 12.2 70.6 42.5 .............. 2.4 .4 .......... 4.7 5.5 5.1 10.1 3.9 1957 ........... 80.0 35.6 21.2 10.0 13.2 76.6 45.4 .............. 3.1 .5 .......... 5.4 6.7 5.4 10.1 3.4 1958 ........... 79.6 34.7 20.1 11.2 13.6 82.4 46.8 .............. 3.4 .5 .......... 7.5 8.2 5.6 10.3 −2.8 1959 ........... 79.2 36.7 17.3 11.7 13.5 92.1 49.0 .............. 3.1 .7 .......... 8.2 9.7 5.8 15.5 −12.8
1960 ........... 92.5 40.7 21.5 14.7 15.6 92.2 48.1 .............. 3.0 .8 .......... 7.4 11.6 6.9 14.4 .3 1961 ........... 94.4 41.3 21.0 16.4 15.7 97.7 49.6 .............. 3.2 .9 .......... 9.7 12.5 6.7 15.2 −3.3 1962 ........... 99.7 45.6 20.5 17.0 16.5 106.8 52.3 50.1 5.6 1.2 .......... 9.2 14.4 6.9 17.2 −7.1 1963 ........... 106.6 47.6 21.6 19.8 17.6 111.3 53.4 51.1 5.3 1.5 .......... 9.3 15.8 7.7 18.3 −4.8 1964 ........... 112.6 48.7 23.5 22.0 18.5 118.5 54.8 52.6 4.9 1.8 .......... 9.7 16.6 8.2 22.6 −5.9 1965 ........... 116.8 48.8 25.5 22.2 20.3 118.2 50.6 48.8 5.3 1.8 .......... 9.5 17.5 8.6 25.0 −1.4 1966 ........... 130.8 55.4 30.1 25.5 19.8 134.5 58.1 56.6 5.6 2.5 0.1 9.7 20.7 9.4 28.5 −3.7 1967 ........... 148.8 61.5 34.0 32.6 20.7 157.5 71.4 70.1 5.6 3.4 2.7 10.3 21.7 10.3 32.1 −8.6 1968 ........... 153.0 68.7 28.7 33.9 21.7 178.1 81.9 80.4 5.3 4.4 4.6 11.8 23.9 11.1 35.1 −25.2 1969 ........... 186.9 87.2 36.7 39.0 23.9 183.6 82.5 80.8 4.6 5.2 5.7 13.1 27.3 12.7 32.6 3.2
1970 ........... 192.8 90.4 32.8 44.4 25.2 195.6 81.7 80.1 4.3 5.9 6.2 15.7 30.3 14.4 37.2 −2.8 1971 ........... 187.1 86.2 26.8 47.3 26.8 210.2 78.9 77.5 4.2 6.8 6.6 22.9 35.9 14.8 40.0 −23.0 1972 ........... 207.3 94.7 32.2 52.6 27.8 230.7 79.2 77.6 4.8 8.7 7.5 27.7 40.2 15.5 47.3 −23.4 1973 ........... 230.8 103.2 36.2 63.1 28.3 245.7 76.7 75.0 4.1 9.4 8.1 28.3 49.1 17.3 52.8 −14.9 1974 ........... 263.2 119.0 38.6 75.1 30.6 269.4 79.3 77.9 5.7 10.7 9.6 33.7 55.9 21.4 52.9 −6.1 1975 ........... 279.1 122.4 40.6 84.5 31.5 332.3 86.5 84.9 7.1 12.9 12.9 50.2 64.7 23.2 74.8 −53.2 1976 ........... 298.1 131.6 41.4 90.8 34.3 371.8 89.6 87.9 6.4 15.7 15.8 60.8 73.9 26.7 82.7 −73.7 Transition
quarter ... 81.2 38.8 8.5 25.2 8.8 96.0 22.3 21.8 2.5 3.9 4.3 15.0 19.8 6.9 21.4 −14.7 1977 ........... 355.6 157.6 54.9 106.5 36.6 409.2 97.2 95.1 6.4 17.3 19.3 61.1 85.1 29.9 93.0 −53.7 1978 ........... 399.6 181.0 60.0 121.0 37.7 458.7 104.5 102.3 7.5 18.5 22.8 61.5 93.9 35.5 114.7 −59.2 1979 ........... 463.3 217.8 65.7 138.9 40.8 504.0 116.3 113.6 7.5 20.5 26.5 66.4 104.1 42.6 120.2 −40.7
1980 ........... 517.1 244.1 64.6 157.8 50.6 590.9 134.0 130.9 12.7 23.2 32.1 86.6 118.5 52.5 131.3 −73.8 1981 ........... 599.3 285.9 61.1 182.7 69.5 678.2 157.5 153.9 13.1 26.9 39.1 100.3 139.6 68.8 133.0 −79.0 1982 ........... 617.8 297.7 49.2 201.5 69.3 745.7 185.3 180.7 12.3 27.4 46.6 108.2 156.0 85.0 125.0 −128.0 1983 ........... 600.6 288.9 37.0 209.0 65.6 808.4 209.9 204.4 11.8 28.6 52.6 123.0 170.7 89.8 121.8 −207.8 1984 ........... 666.5 298.4 56.9 239.4 71.8 851.9 227.4 220.9 15.9 30.4 57.5 113.4 178.2 111.1 117.9 −185.4 1985 ........... 734.1 334.5 61.3 265.2 73.1 946.4 252.7 245.1 16.2 33.5 65.8 129.0 188.6 129.5 131.0 −212.3 1986 ........... 769.2 349.0 63.1 283.9 73.2 990.4 273.4 265.4 14.2 35.9 70.2 120.6 198.8 136.0 141.4 −221.2 1987 ........... 854.4 392.6 83.9 303.3 74.6 1,004.1 282.0 273.9 11.6 40.0 75.1 124.1 207.4 138.6 125.3 −149.7 1988 ........... 909.3 401.2 94.5 334.3 79.3 1,064.5 290.4 281.9 10.5 44.5 78.9 130.4 219.3 151.8 138.8 −155.2 1989 ........... 991.2 445.7 103.3 359.4 82.8 1,143.8 303.6 294.8 9.6 48.4 85.0 137.4 232.5 169.0 158.4 −152.6
1990 ........... 1,032.0 466.9 93.5 380.0 91.5 1,253.1 299.3 289.7 13.8 57.7 98.1 148.7 248.6 184.3 202.6 −221.1 1991 ........... 1,055.0 467.8 98.1 396.0 93.1 1,324.3 273.3 262.3 15.9 71.2 104.5 172.4 269.0 194.4 223.6 −269.3 1992 ........... 1,091.3 476.0 100.3 413.7 101.4 1,381.6 298.4 286.8 16.1 89.5 119.0 199.5 287.6 199.3 172.2 −290.3 1993 ........... 1,154.4 509.7 117.5 428.3 98.9 1,409.5 291.1 278.5 17.2 99.4 130.6 209.9 304.6 198.7 158.0 −255.1 1994 ........... 1,258.6 543.1 140.4 461.5 113.7 1,461.9 281.6 268.6 17.1 107.1 144.7 217.1 319.6 202.9 171.7 −203.2 1995 ........... 1,351.8 590.2 157.0 484.5 120.1 1,515.8 272.1 259.4 16.4 115.4 159.9 223.7 335.8 232.1 160.3 −164.0 1996 ........... 1,453.1 656.4 171.8 509.4 115.4 1,560.5 265.8 253.1 13.5 119.4 174.2 229.7 349.7 241.1 167.3 −107.5 1997 ........... 1,579.3 737.5 182.3 539.4 120.2 1,601.2 270.5 258.3 15.2 123.8 190.0 235.0 365.3 244.0 157.4 −21.9 1998 ........... 1,721.8 828.6 188.7 571.8 132.7 1,652.6 268.5 256.1 13.1 131.4 192.8 237.7 379.2 241.1 188.8 69.2 1999 ........... 1,827.5 879.5 184.7 611.8 151.5 1,701.9 274.9 261.3 15.2 141.1 190.4 242.4 390.0 229.8 218.1 125.5
2000 ........... 2,025.2 1,004.5 207.3 652.9 160.6 1,789.1 294.5 281.2 17.2 154.5 197.1 253.6 409.4 222.9 239.8 236.2 2001 ........... 1,991.2 994.3 151.1 694.0 151.8 1,863.0 304.9 290.3 16.5 172.3 217.4 269.6 433.0 206.2 243.3 128.2 2002 ........... 1,853.2 858.3 148.0 700.8 146.0 2,011.0 348.6 332.0 22.4 196.5 230.9 312.5 456.0 170.9 273.2 −157.8 2003 ........... 1,782.3 793.7 131.8 713.0 143.9 2,159.9 404.9 387.3 21.2 219.6 249.4 334.4 474.7 153.1 302.6 −377.6 2004 ........... 1,880.1 809.0 189.4 733.4 148.3 2,292.2 455.9 436.5 26.9 240.1 269.4 332.8 495.5 160.2 311.3 −412.1 2005 1 ......... 2,052.8 893.7 226.5 773.7 158.9 2,479.4 465.9 443.9 32.0 257.5 295.4 350.9 519.7 177.9 380.1 −426.6 2006 1 ......... 2,177.6 966.9 220.3 818.8 171.6 2,567.6 447.4 426.3 38.4 268.4 345.7 359.5 544.8 211.1 352.2 −390.1
1 Estimates.
Note.—See Note, Table B-78.
Sources: Department of the Treasury and Office of Management and Budget.
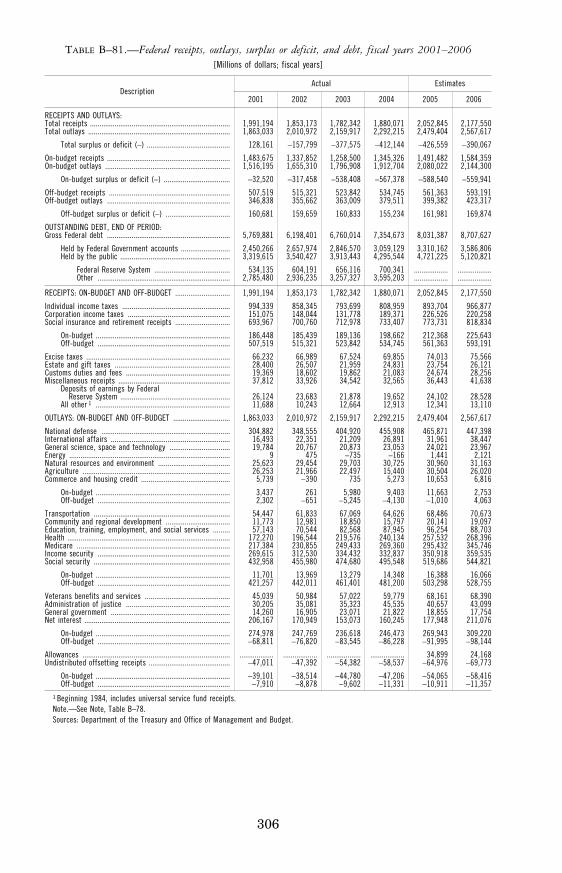
306
TABLE B–81.—Federal receipts, outlays, surplus or deficit, and debt, fiscal years 2001–2006 [Millions of dollars; fiscal years]
Description Actual Estimates
2001 2002 2003 2004 2005 2006
RECEIPTS AND OUTLAYS: Total receipts .......................................................................... 1,991,194 1,853,173 1,782,342 1,880,071 2,052,845 2,177,550 Total outlays ........................................................................... 1,863,033 2,010,972 2,159,917 2,292,215 2,479,404 2,567,617
Total surplus or deficit (−) ............................................ 128,161 −157,799 −377,575 −412,144 −426,559 −390,067
On-budget receipts ................................................................. 1,483,675 1,337,852 1,258,500 1,345,326 1,491,482 1,584,359 On-budget outlays .................................................................. 1,516,195 1,655,310 1,796,908 1,912,704 2,080,022 2,144,300
On-budget surplus or deficit (−) ................................... −32,520 −317,458 −538,408 −567,378 −588,540 −559,941
Off-budget receipts ................................................................ 507,519 515,321 523,842 534,745 561,363 593,191 Off-budget outlays ................................................................. 346,838 355,662 363,009 379,511 399,382 423,317
Off-budget surplus or deficit (−) .................................. 160,681 159,659 160,833 155,234 161,981 169,874
OUTSTANDING DEBT, END OF PERIOD: Gross Federal debt ................................................................. 5,769,881 6,198,401 6,760,014 7,354,673 8,031,387 8,707,627
Held by Federal Government accounts .......................... 2,450,266 2,657,974 2,846,570 3,059,129 3,310,162 3,586,806 Held by the public .......................................................... 3,319,615 3,540,427 3,913,443 4,295,544 4,721,225 5,120,821
Federal Reserve System ........................................ 534,135 604,191 656,116 700,341 .................. ..................Other ...................................................................... 2,785,480 2,936,235 3,257,327 3,595,203 .................. ..................
RECEIPTS: ON-BUDGET AND OFF-BUDGET ............................. 1,991,194 1,853,173 1,782,342 1,880,071 2,052,845 2,177,550
Individual income taxes ......................................................... 994,339 858,345 793,699 808,959 893,704 966,877 Corporation income taxes ...................................................... 151,075 148,044 131,778 189,371 226,526 220,258 Social insurance and retirement receipts ............................. 693,967 700,760 712,978 733,407 773,731 818,834
On-budget ....................................................................... 186,448 185,439 189,136 198,662 212,368 225,643 Off-budget ...................................................................... 507,519 515,321 523,842 534,745 561,363 593,191
Excise taxes ............................................................................ 66,232 66,989 67,524 69,855 74,013 75,566 Estate and gift taxes ............................................................. 28,400 26,507 21,959 24,831 23,754 26,121 Customs duties and fees ....................................................... 19,369 18,602 19,862 21,083 24,674 28,256 Miscellaneous receipts ........................................................... 37,812 33,926 34,542 32,565 36,443 41,638
Deposits of earnings by Federal Reserve System .......................................................... 26,124 23,683 21,878 19,652 24,102 28,528
All other 1 ....................................................................... 11,688 10,243 12,664 12,913 12,341 13,110
OUTLAYS: ON-BUDGET AND OFF-BUDGET .............................. 1,863,033 2,010,972 2,159,917 2,292,215 2,479,404 2,567,617
National defense .................................................................... 304,882 348,555 404,920 455,908 465,871 447,398 International affairs ............................................................... 16,493 22,351 21,209 26,891 31,961 38,447 General science, space and technology ................................ 19,784 20,767 20,873 23,053 24,021 23,967 Energy ..................................................................................... 9 475 −735 −166 1,441 2,121 Natural resources and environment ...................................... 25,623 29,454 29,703 30,725 30,960 31,163 Agriculture .............................................................................. 26,253 21,966 22,497 15,440 30,504 26,020 Commerce and housing credit ............................................... 5,739 −390 735 5,273 10,653 6,816
On-budget ....................................................................... 3,437 261 5,980 9,403 11,663 2,753 Off-budget ...................................................................... 2,302 −651 −5,245 −4,130 −1,010 4,063
Transportation ........................................................................ 54,447 61,833 67,069 64,626 68,486 70,673 Community and regional development .................................. 11,773 12,981 18,850 15,797 20,141 19,097 Education, training, employment, and social services ......... 57,143 70,544 82,568 87,945 96,254 88,703 Health ...................................................................................... 172,270 196,544 219,576 240,134 257,532 268,396 Medicare ................................................................................. 217,384 230,855 249,433 269,360 295,432 345,746 Income security ...................................................................... 269,615 312,530 334,432 332,837 350,918 359,535 Social security ........................................................................ 432,958 455,980 474,680 495,548 519,686 544,821
On-budget ....................................................................... 11,701 13,969 13,279 14,348 16,388 16,066 Off-budget ...................................................................... 421,257 442,011 461,401 481,200 503,298 528,755
Veterans benefits and services ............................................. 45,039 50,984 57,022 59,779 68,161 68,390 Administration of justice ....................................................... 30,205 35,081 35,323 45,535 40,657 43,099 General government ............................................................... 14,260 16,905 23,071 21,822 18,855 17,754 Net interest ............................................................................. 206,167 170,949 153,073 160,245 177,948 211,076
On-budget ....................................................................... 274,978 247,769 236,618 246,473 269,943 309,220 Off-budget ...................................................................... −68,811 −76,820 −83,545 −86,228 −91,995 −98,144
Allowances .............................................................................. .................. .................. .................. .................. 34,899 24,168 Undistributed offsetting receipts ........................................... −47,011 −47,392 −54,382 −58,537 −64,976 −69,773
On-budget ....................................................................... −39,101 −38,514 −44,780 −47,206 −54,065 −58,416 Off-budget ...................................................................... −7,910 −8,878 −9,602 −11,331 −10,911 −11,357
1 Beginning 1984, includes universal service fund receipts. Note.—See Note, Table B–78. Sources: Department of the Treasury and Office of Management and Budget.
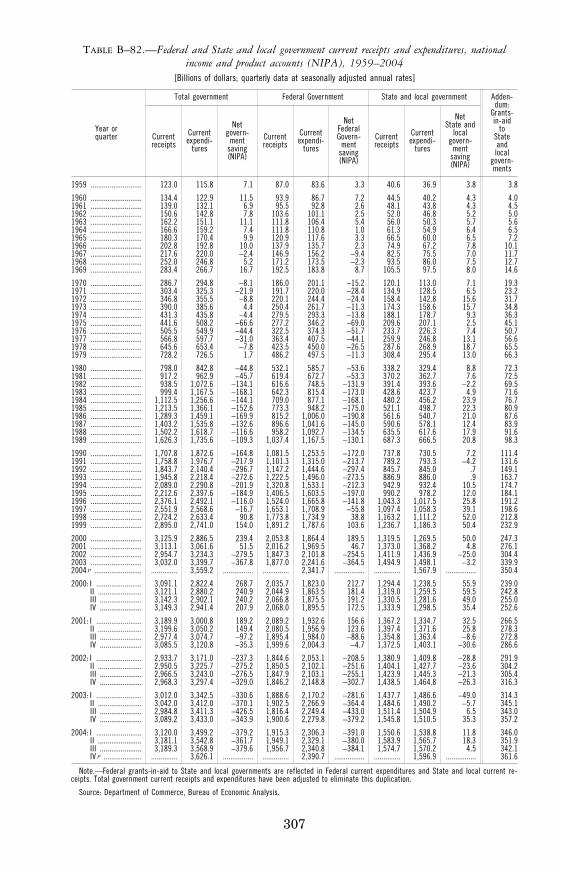
307
TABLE B–82.—Federal and State and local government current receipts and expenditures, national income and product accounts (NIPA), 1959–2004
[Billions of dollars; quarterly data at seasonally adjusted annual rates]
Year or quarter
Total government Federal Government State and local government Adden- dum:
Grants- in-aid
to State and local
govern- ments
Current receipts
Current expendi-
tures
Net govern-
ment saving (NIPA)
Current receipts
Current expendi-
tures
Net Federal Govern-
ment saving (NIPA)
Current receipts
Current expendi-
tures
Net State and
local govern-
ment saving (NIPA)
1959 ........................... 123.0 115.8 7.1 87.0 83.6 3.3 40.6 36.9 3.8 3.8
1960 ........................... 134.4 122.9 11.5 93.9 86.7 7.2 44.5 40.2 4.3 4.0 1961 ........................... 139.0 132.1 6.9 95.5 92.8 2.6 48.1 43.8 4.3 4.5 1962 ........................... 150.6 142.8 7.8 103.6 101.1 2.5 52.0 46.8 5.2 5.0 1963 ........................... 162.2 151.1 11.1 111.8 106.4 5.4 56.0 50.3 5.7 5.6 1964 ........................... 166.6 159.2 7.4 111.8 110.8 1.0 61.3 54.9 6.4 6.5 1965 ........................... 180.3 170.4 9.9 120.9 117.6 3.3 66.5 60.0 6.5 7.2 1966 ........................... 202.8 192.8 10.0 137.9 135.7 2.3 74.9 67.2 7.8 10.1 1967 ........................... 217.6 220.0 −2.4 146.9 156.2 −9.4 82.5 75.5 7.0 11.7 1968 ........................... 252.0 246.8 5.2 171.2 173.5 −2.3 93.5 86.0 7.5 12.7 1969 ........................... 283.4 266.7 16.7 192.5 183.8 8.7 105.5 97.5 8.0 14.6
1970 ........................... 286.7 294.8 −8.1 186.0 201.1 −15.2 120.1 113.0 7.1 19.3 1971 ........................... 303.4 325.3 −21.9 191.7 220.0 −28.4 134.9 128.5 6.5 23.2 1972 ........................... 346.8 355.5 −8.8 220.1 244.4 −24.4 158.4 142.8 15.6 31.7 1973 ........................... 390.0 385.6 4.4 250.4 261.7 −11.3 174.3 158.6 15.7 34.8 1974 ........................... 431.3 435.8 −4.4 279.5 293.3 −13.8 188.1 178.7 9.3 36.3 1975 ........................... 441.6 508.2 −66.6 277.2 346.2 −69.0 209.6 207.1 2.5 45.1 1976 ........................... 505.5 549.9 −44.4 322.5 374.3 −51.7 233.7 226.3 7.4 50.7 1977 ........................... 566.8 597.7 −31.0 363.4 407.5 −44.1 259.9 246.8 13.1 56.6 1978 ........................... 645.6 653.4 −7.8 423.5 450.0 −26.5 287.6 268.9 18.7 65.5 1979 ........................... 728.2 726.5 1.7 486.2 497.5 −11.3 308.4 295.4 13.0 66.3
1980 ........................... 798.0 842.8 −44.8 532.1 585.7 −53.6 338.2 329.4 8.8 72.3 1981 ........................... 917.2 962.9 −45.7 619.4 672.7 −53.3 370.2 362.7 7.6 72.5 1982 ........................... 938.5 1,072.6 −134.1 616.6 748.5 −131.9 391.4 393.6 −2.2 69.5 1983 ........................... 999.4 1,167.5 −168.1 642.3 815.4 −173.0 428.6 423.7 4.9 71.6 1984 ........................... 1,112.5 1,256.6 −144.1 709.0 877.1 −168.1 480.2 456.2 23.9 76.7 1985 ........................... 1,213.5 1,366.1 −152.6 773.3 948.2 −175.0 521.1 498.7 22.3 80.9 1986 ........................... 1,289.3 1,459.1 −169.9 815.2 1,006.0 −190.8 561.6 540.7 21.0 87.6 1987 ........................... 1,403.2 1,535.8 −132.6 896.6 1,041.6 −145.0 590.6 578.1 12.4 83.9 1988 ........................... 1,502.2 1,618.7 −116.6 958.2 1,092.7 −134.5 635.5 617.6 17.9 91.6 1989 ........................... 1,626.3 1,735.6 −109.3 1,037.4 1,167.5 −130.1 687.3 666.5 20.8 98.3
1990 ........................... 1,707.8 1,872.6 −164.8 1,081.5 1,253.5 −172.0 737.8 730.5 7.2 111.4 1991 ........................... 1,758.8 1,976.7 −217.9 1,101.3 1,315.0 −213.7 789.2 793.3 −4.2 131.6 1992 ........................... 1,843.7 2,140.4 −296.7 1,147.2 1,444.6 −297.4 845.7 845.0 .7 149.1 1993 ........................... 1,945.8 2,218.4 −272.6 1,222.5 1,496.0 −273.5 886.9 886.0 .9 163.7 1994 ........................... 2,089.0 2,290.8 −201.9 1,320.8 1,533.1 −212.3 942.9 932.4 10.5 174.7 1995 ........................... 2,212.6 2,397.6 −184.9 1,406.5 1,603.5 −197.0 990.2 978.2 12.0 184.1 1996 ........................... 2,376.1 2,492.1 −116.0 1,524.0 1,665.8 −141.8 1,043.3 1,017.5 25.8 191.2 1997 ........................... 2,551.9 2,568.6 −16.7 1,653.1 1,708.9 −55.8 1,097.4 1,058.3 39.1 198.6 1998 ........................... 2,724.2 2,633.4 90.8 1,773.8 1,734.9 38.8 1,163.2 1,111.2 52.0 212.8 1999 ........................... 2,895.0 2,741.0 154.0 1,891.2 1,787.6 103.6 1,236.7 1,186.3 50.4 232.9
2000 ........................... 3,125.9 2,886.5 239.4 2,053.8 1,864.4 189.5 1,319.5 1,269.5 50.0 247.3 2001 ........................... 3,113.1 3,061.6 51.5 2,016.2 1,969.5 46.7 1,373.0 1,368.2 4.8 276.1 2002 ........................... 2,954.7 3,234.3 −279.5 1,847.3 2,101.8 −254.5 1,411.9 1,436.9 −25.0 304.4 2003 ........................... 3,032.0 3,399.7 −367.8 1,877.0 2,241.6 −364.5 1,494.9 1,498.1 −3.2 339.9 2004 p ......................... .............. 3,559.2 ................ .............. 2,341.7 ................ .............. 1,567.9 ................ 350.4
2000: I ........................ 3,091.1 2,822.4 268.7 2,035.7 1,823.0 212.7 1,294.4 1,238.5 55.9 239.0 II ....................... 3,121.1 2,880.2 240.9 2,044.9 1,863.5 181.4 1,319.0 1,259.5 59.5 242.8 III ...................... 3,142.3 2,902.1 240.2 2,066.8 1,875.5 191.2 1,330.5 1,281.6 49.0 255.0 IV ...................... 3,149.3 2,941.4 207.9 2,068.0 1,895.5 172.5 1,333.9 1,298.5 35.4 252.6
2001: I ........................ 3,189.9 3,000.8 189.2 2,089.2 1,932.6 156.6 1,367.2 1,334.7 32.5 266.5 II ....................... 3,199.6 3,050.2 149.4 2,080.5 1,956.9 123.6 1,397.4 1,371.6 25.8 278.3 III ...................... 2,977.4 3,074.7 −97.2 1,895.4 1,984.0 −88.6 1,354.8 1,363.4 −8.6 272.8 IV ...................... 3,085.5 3,120.8 −35.3 1,999.6 2,004.3 −4.7 1,372.5 1,403.1 −30.6 286.6
2002: I ........................ 2,933.7 3,171.0 −237.3 1,844.6 2,053.1 −208.5 1,380.9 1,409.8 −28.8 291.9 II ....................... 2,950.5 3,225.7 −275.2 1,850.5 2,102.1 −251.6 1,404.1 1,427.7 −23.6 304.2 III ...................... 2,966.5 3,243.0 −276.5 1,847.9 2,103.1 −255.1 1,423.9 1,445.3 −21.3 305.4 IV ...................... 2,968.3 3,297.4 −329.0 1,846.2 2,148.8 −302.7 1,438.5 1,464.8 −26.3 316.3
2003: I ........................ 3,012.0 3,342.5 −330.6 1,888.6 2,170.2 −281.6 1,437.7 1,486.6 −49.0 314.3 II ....................... 3,042.0 3,412.0 −370.1 1,902.5 2,266.9 −364.4 1,484.6 1,490.2 −5.7 345.1 III ...................... 2,984.8 3,411.3 −426.5 1,816.4 2,249.4 −433.0 1,511.4 1,504.9 6.5 343.0 IV ...................... 3,089.2 3,433.0 −343.9 1,900.6 2,279.8 −379.2 1,545.8 1,510.5 35.3 357.2
2004: I ........................ 3,120.0 3,499.2 −379.2 1,915.3 2,306.3 −391.0 1,550.6 1,538.8 11.8 346.0 II ....................... 3,181.1 3,542.8 −361.7 1,949.1 2,329.1 −380.0 1,583.9 1,565.7 18.3 351.9 III ...................... 3,189.3 3,568.9 −379.6 1,956.7 2,340.8 −384.1 1,574.7 1,570.2 4.5 342.1 IV p .................... .............. 3,626.1 ................ .............. 2,390.7 ................ .............. 1,596.9 ................ 361.6
Note.—Federal grants-in-aid to State and local governments are reflected in Federal current expenditures and State and local current re-ceipts. Total government current receipts and expenditures have been adjusted to eliminate this duplication.
Source: Department of Commerce, Bureau of Economic Analysis.
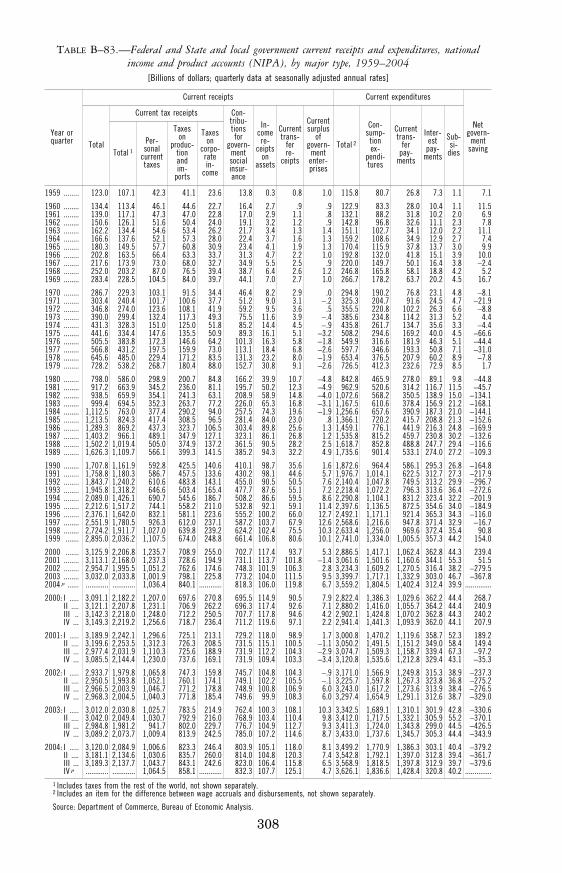
308
TABLE B–83.—Federal and State and local government current receipts and expenditures, national income and product accounts (NIPA), by major type, 1959–2004
[Billions of dollars; quarterly data at seasonally adjusted annual rates]
Year or quarter
Current receipts Current expenditures
Net govern-
ment saving Total
Current tax receipts Con- tribu- tions for
govern- ment social insur- ance
In- come re-
ceipts on
assets
Current trans-
fer re-
ceipts
Current surplus
of govern-
ment enter- prises
Total 2
Con- sump-
tion ex-
pendi- tures
Current trans-
fer pay-
ments
Inter-est
pay-ments
Sub-si-
dies Total 1 Per- sonal
current taxes
Taxes on
produc- tion and im-
ports
Taxes on
corpo- rate in-
come
1959 ........ 123.0 107.1 42.3 41.1 23.6 13.8 0.3 0.8 1.0 115.8 80.7 26.8 7.3 1.1 7.1
1960 ........ 134.4 113.4 46.1 44.6 22.7 16.4 2.7 .9 .9 122.9 83.3 28.0 10.4 1.1 11.5 1961 ........ 139.0 117.1 47.3 47.0 22.8 17.0 2.9 1.1 .8 132.1 88.2 31.8 10.2 2.0 6.9 1962 ........ 150.6 126.1 51.6 50.4 24.0 19.1 3.2 1.2 .9 142.8 96.8 32.6 11.1 2.3 7.8 1963 ........ 162.2 134.4 54.6 53.4 26.2 21.7 3.4 1.3 1.4 151.1 102.7 34.1 12.0 2.2 11.1 1964 ........ 166.6 137.6 52.1 57.3 28.0 22.4 3.7 1.6 1.3 159.2 108.6 34.9 12.9 2.7 7.4 1965 ........ 180.3 149.5 57.7 60.8 30.9 23.4 4.1 1.9 1.3 170.4 115.9 37.8 13.7 3.0 9.9 1966 ........ 202.8 163.5 66.4 63.3 33.7 31.3 4.7 2.2 1.0 192.8 132.0 41.8 15.1 3.9 10.0 1967 ........ 217.6 173.9 73.0 68.0 32.7 34.9 5.5 2.5 .9 220.0 149.7 50.1 16.4 3.8 −2.4 1968 ........ 252.0 203.2 87.0 76.5 39.4 38.7 6.4 2.6 1.2 246.8 165.8 58.1 18.8 4.2 5.2 1969 ........ 283.4 228.5 104.5 84.0 39.7 44.1 7.0 2.7 1.0 266.7 178.2 63.7 20.2 4.5 16.7
1970 ........ 286.7 229.3 103.1 91.5 34.4 46.4 8.2 2.9 .0 294.8 190.2 76.8 23.1 4.8 −8.1 1971 ........ 303.4 240.4 101.7 100.6 37.7 51.2 9.0 3.1 −.2 325.3 204.7 91.6 24.5 4.7 −21.9 1972 ........ 346.8 274.0 123.6 108.1 41.9 59.2 9.5 3.6 .5 355.5 220.8 102.2 26.3 6.6 −8.8 1973 ........ 390.0 299.4 132.4 117.3 49.3 75.5 11.6 3.9 −.4 385.6 234.8 114.2 31.3 5.2 4.4 1974 ........ 431.3 328.3 151.0 125.0 51.8 85.2 14.4 4.5 −.9 435.8 261.7 134.7 35.6 3.3 −4.4 1975 ........ 441.6 334.4 147.6 135.5 50.9 89.3 16.1 5.1 −3.2 508.2 294.6 169.2 40.0 4.5 −66.6 1976 ........ 505.5 383.8 172.3 146.6 64.2 101.3 16.3 5.8 −1.8 549.9 316.6 181.9 46.3 5.1 −44.4 1977 ........ 566.8 431.2 197.5 159.9 73.0 113.1 18.4 6.8 −2.6 597.7 346.6 193.3 50.8 7.1 −31.0 1978 ........ 645.6 485.0 229.4 171.2 83.5 131.3 23.2 8.0 −1.9 653.4 376.5 207.9 60.2 8.9 −7.8 1979 ........ 728.2 538.2 268.7 180.4 88.0 152.7 30.8 9.1 −2.6 726.5 412.3 232.6 72.9 8.5 1.7
1980 ........ 798.0 586.0 298.9 200.7 84.8 166.2 39.9 10.7 −4.8 842.8 465.9 278.0 89.1 9.8 −44.8 1981 ........ 917.2 663.9 345.2 236.0 81.1 195.7 50.2 12.3 −4.9 962.9 520.6 314.2 116.7 11.5 −45.7 1982 ........ 938.5 659.9 354.1 241.3 63.1 208.9 58.9 14.8 −4.0 1,072.6 568.2 350.5 138.9 15.0 −134.1 1983 ........ 999.4 694.5 352.3 263.7 77.2 226.0 65.3 16.8 −3.1 1,167.5 610.6 378.4 156.9 21.2 −168.1 1984 ........ 1,112.5 763.0 377.4 290.2 94.0 257.5 74.3 19.6 −1.9 1,256.6 657.6 390.9 187.3 21.0 −144.1 1985 ........ 1,213.5 824.3 417.4 308.5 96.5 281.4 84.0 23.0 .8 1,366.1 720.2 415.7 208.8 21.3 −152.6 1986 ........ 1,289.3 869.2 437.3 323.7 106.5 303.4 89.8 25.6 1.3 1,459.1 776.1 441.9 216.3 24.8 −169.9 1987 ........ 1,403.2 966.1 489.1 347.9 127.1 323.1 86.1 26.8 1.2 1,535.8 815.2 459.7 230.8 30.2 −132.6 1988 ........ 1,502.2 1,019.4 505.0 374.9 137.2 361.5 90.5 28.2 2.5 1,618.7 852.8 488.8 247.7 29.4 −116.6 1989 ........ 1,626.3 1,109.7 566.1 399.3 141.5 385.2 94.3 32.2 4.9 1,735.6 901.4 533.1 274.0 27.2 −109.3
1990 ........ 1,707.8 1,161.9 592.8 425.5 140.6 410.1 98.7 35.6 1.6 1,872.6 964.4 586.1 295.3 26.8 −164.8 1991 ........ 1,758.8 1,180.3 586.7 457.5 133.6 430.2 98.1 44.6 5.7 1,976.7 1,014.1 622.5 312.7 27.3 −217.9 1992 ........ 1,843.7 1,240.2 610.6 483.8 143.1 455.0 90.5 50.5 7.6 2,140.4 1,047.8 749.5 313.2 29.9 −296.7 1993 ........ 1,945.8 1,318.2 646.6 503.4 165.4 477.7 87.6 55.1 7.2 2,218.4 1,072.2 796.3 313.6 36.4 −272.6 1994 ........ 2,089.0 1,426.1 690.7 545.6 186.7 508.2 86.6 59.5 8.6 2,290.8 1,104.1 831.2 323.4 32.2 −201.9 1995 ........ 2,212.6 1,517.2 744.1 558.2 211.0 532.8 92.1 59.1 11.4 2,397.6 1,136.5 872.5 354.6 34.0 −184.9 1996 ........ 2,376.1 1,642.0 832.1 581.1 223.6 555.2 100.2 66.0 12.7 2,492.1 1,171.1 921.4 365.3 34.3 −116.0 1997 ........ 2,551.9 1,780.5 926.3 612.0 237.1 587.2 103.7 67.9 12.6 2,568.6 1,216.6 947.8 371.4 32.9 −16.7 1998 ........ 2,724.2 1,911.7 1,027.0 639.8 239.2 624.2 102.4 75.5 10.3 2,633.4 1,256.0 969.6 372.4 35.4 90.8 1999 ....... 2,895.0 2,036.2 1,107.5 674.0 248.8 661.4 106.8 80.6 10.1 2,741.0 1,334.0 1,005.5 357.3 44.2 154.0
2000 ....... 3,125.9 2,206.8 1,235.7 708.9 255.0 702.7 117.4 93.7 5.3 2,886.5 1,417.1 1,062.4 362.8 44.3 239.4 2001 ........ 3,113.1 2,168.0 1,237.3 728.6 194.9 731.1 113.7 101.8 −1.4 3,061.6 1,501.6 1,160.6 344.1 55.3 51.5 2002 ........ 2,954.7 1,995.5 1,051.2 762.6 174.6 748.3 101.9 106.3 2.8 3,234.3 1,609.2 1,270.5 316.4 38.2 −279.5 2003 ........ 3,032.0 2,033.8 1,001.9 798.1 225.8 773.2 104.0 111.5 9.5 3,399.7 1,717.1 1,332.9 303.0 46.7 −367.8 2004 p ...... ............ ............ 1,036.4 840.1 ............ 818.3 106.0 119.8 6.7 3,559.2 1,804.5 1,402.4 312.4 39.9 ..............
2000: I ..... 3,091.1 2,182.2 1,207.0 697.6 270.8 695.5 114.9 90.5 7.9 2,822.4 1,386.3 1,029.6 362.2 44.4 268.7 II .... 3,121.1 2,207.8 1,231.1 706.9 262.2 696.3 117.4 92.6 7.1 2,880.2 1,416.0 1,055.7 364.2 44.4 240.9 III .. 3,142.3 2,218.0 1,248.0 712.2 250.5 707.7 117.8 94.6 4.2 2,902.1 1,424.8 1,070.2 362.8 44.3 240.2 IV ... 3,149.3 2,219.2 1,256.6 718.7 236.4 711.2 119.6 97.1 2.2 2,941.4 1,441.3 1,093.9 362.0 44.1 207.9
2001: I ..... 3,189.9 2,242.1 1,296.6 725.1 213.1 729.2 118.0 98.9 1.7 3,000.8 1,470.2 1,119.6 358.7 52.3 189.2 II .... 3,199.6 2,253.5 1,312.3 726.3 208.5 731.5 115.1 100.5 −1.1 3,050.2 1,491.5 1,151.2 349.0 58.4 149.4 III ... 2,977.4 2,031.9 1,110.3 725.6 188.9 731.9 112.2 104.3 −2.9 3,074.7 1,509.3 1,158.7 339.4 67.3 −97.2 IV ... 3,085.5 2,144.4 1,230.0 737.6 169.1 731.9 109.4 103.3 −3.4 3,120.8 1,535.6 1,212.8 329.4 43.1 −35.3
2002: I ..... 2,933.7 1,979.8 1,065.8 747.3 159.8 745.7 104.8 104.3 −.9 3,171.0 1,566.9 1,249.8 315.3 38.9 −237.3 II .... 2,950.5 1,993.8 1,052.1 760.1 174.1 749.1 102.2 105.5 −.1 3,225.7 1,597.8 1,267.3 323.8 36.8 −275.2 III ... 2,966.5 2,003.9 1,046.7 771.2 178.8 748.9 100.8 106.9 6.0 3,243.0 1,617.2 1,273.6 313.9 38.4 −276.5 IV ... 2,968.3 2,004.5 1,040.3 771.8 185.4 749.6 99.9 108.3 6.0 3,297.4 1,654.9 1,291.1 312.6 38.7 −329.0
2003: I ..... 3,012.0 2,030.8 1,025.7 783.5 214.9 762.4 100.3 108.1 10.3 3,342.5 1,689.1 1,310.1 301.9 42.8 −330.6 II .... 3,042.0 2,049.4 1,030.7 792.9 216.0 768.9 103.4 110.4 9.8 3,412.0 1,717.5 1,332.1 3O5.9 55.2 −370.1 III ... 2,984.8 1,981.2 941.7 802.0 229.7 776.7 104.9 112.7 9.3 3,411.3 1,724.0 1,343.8 299.0 44.5 −426.5 IV ... 3,089.2 2,073.7 1,009.4 813.9 242.5 785.0 107.2 114.6 8.7 3,433.0 1,737.6 1,345.7 305.3 44.4 −343.9
2004: I ..... 3,120.0 2,084.9 1,006.6 823.3 246.4 803.9 105.1 118.0 8.1 3,499.2 1,770.9 1,386.3 303.1 40.4 −379.2 II .... 3,181.1 2,134.6 1,030.6 835.7 260.0 814.0 104.8 120.3 7.4 3,542.8 1,792.1 1,397.0 312.8 39.4 −361.7 III ... 3,189.3 2,137.7 1,043.7 843.1 242.6 823.0 106.4 115.8 6.5 3,568.9 1,818.5 1,397.8 312.9 39.7 −379.6 IV p ............ ............ 1,064.5 858.1 ............ 832.3 107.7 125.1 4.7 3,626.1 1,836.6 1,428.4 320.8 40.2 ..............
1 Includes taxes from the rest of the world, not shown separately. 2 Includes an item for the difference between wage accruals and disbursements, not shown separately.
Source: Department of Commerce, Bureau of Economic Analysis.
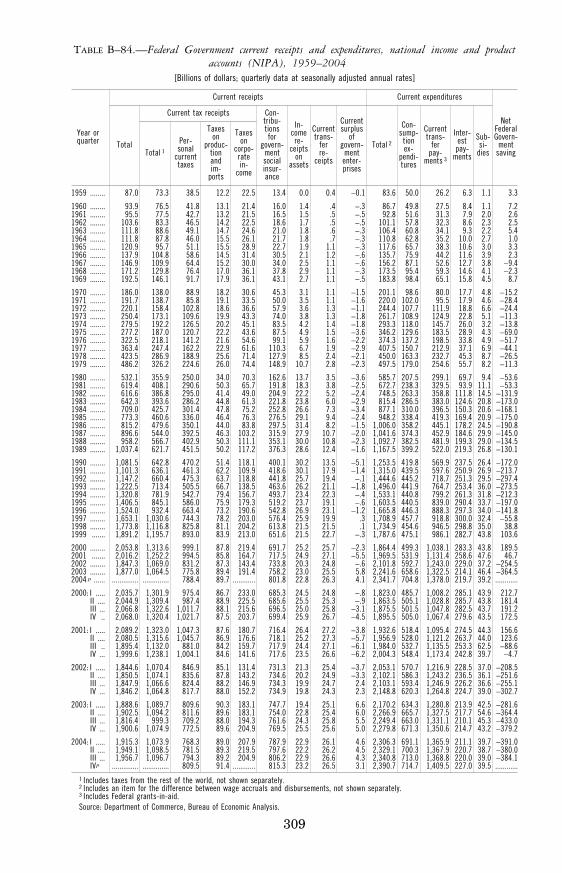
309
TABLE B–84.—Federal Government current receipts and expenditures, national income and product accounts (NIPA), 1959–2004
[Billions of dollars; quarterly data at seasonally adjusted annual rates]
Year or quarter
Current receipts Current expenditures
Net Federal Govern-
ment saving
Total
Current tax receipts Con- tribu- tions for
govern- ment social insur- ance
In- come re-
ceipts on
assets
Current trans-
fer re-
ceipts
Current surplus
of govern-
ment enter- prises
Total 2
Con-sump-
tion ex-
pendi-tures
Current trans-
fer pay-
ments 3
Inter-est
pay-ments
Sub-si-
dies Total 1 Per- sonal
current taxes
Taxes on
produc- tion and im-
ports
Taxes on
corpo- rate in-
come
1959 ........ 87.0 73.3 38.5 12.2 22.5 13.4 0.0 0.4 −0.1 83.6 50.0 26.2 6.3 1.1 3.3
1960 ........ 93.9 76.5 41.8 13.1 21.4 16.0 1.4 .4 −.3 86.7 49.8 27.5 8.4 1.1 7.2 1961 ........ 95.5 77.5 42.7 13.2 21.5 16.5 1.5 .5 −.5 92.8 51.6 31.3 7.9 2.0 2.6 1962 ........ 103.6 83.3 46.5 14.2 22.5 18.6 1.7 .5 −.5 101.1 57.8 32.3 8.6 2.3 2.5 1963 ........ 111.8 88.6 49.1 14.7 24.6 21.0 1.8 .6 −.3 106.4 60.8 34.1 9.3 2.2 5.4 1964 ........ 111.8 87.8 46.0 15.5 26.1 21.7 1.8 .7 −.3 110.8 62.8 35.2 10.0 2.7 1.0 1965 ........ 120.9 95.7 51.1 15.5 28.9 22.7 1.9 1.1 −.3 117.6 65.7 38.3 10.6 3.0 3.3 1966 ........ 137.9 104.8 58.6 14.5 31.4 30.5 2.1 1.2 −.6 135.7 75.9 44.2 11.6 3.9 2.3 1967 ........ 146.9 109.9 64.4 15.2 30.0 34.0 2.5 1.1 −.6 156.2 87.1 52.6 12.7 3.8 −9.4 1968 ........ 171.2 129.8 76.4 17.0 36.1 37.8 2.9 1.1 −.3 173.5 95.4 59.3 14.6 4.1 −2.3 1969 ........ 192.5 146.1 91.7 17.9 36.1 43.1 2.7 1.1 −.5 183.8 98.4 65.1 15.8 4.5 8.7
1970 ........ 186.0 138.0 88.9 18.2 30.6 45.3 3.1 1.1 −1.5 201.1 98.6 80.0 17.7 4.8 −15.2 1971 ........ 191.7 138.7 85.8 19.1 33.5 50.0 3.5 1.1 −1.6 220.0 102.0 95.5 17.9 4.6 −28.4 1972 ........ 220.1 158.4 102.8 18.6 36.6 57.9 3.6 1.3 −1.1 244.4 107.7 111.9 18.8 6.6 −24.4 1973 ........ 250.4 173.1 109.6 19.9 43.3 74.0 3.8 1.3 −1.8 261.7 108.9 124.9 22.8 5.1 −11.3 1974 ........ 279.5 192.2 126.5 20.2 45.1 83.5 4.2 1.4 −1.8 293.3 118.0 145.7 26.0 3.2 −13.8 1975 ........ 277.2 187.0 120.7 22.2 43.6 87.5 4.9 1.5 −3.6 346.2 129.6 183.5 28.9 4.3 −69.0 1976 ........ 322.5 218.1 141.2 21.6 54.6 99.1 5.9 1.6 −2.2 374.3 137.2 198.5 33.8 4.9 −51.7 1977 ........ 363.4 247.4 162.2 22.9 61.6 110.3 6.7 1.9 −2.9 407.5 150.7 212.9 37.1 6.9 −44.1 1978 ........ 423.5 286.9 188.9 25.6 71.4 127.9 8.5 2.4 −2.1 450.0 163.3 232.7 45.3 8.7 −26.5 1979 ........ 486.2 326.2 224.6 26.0 74.4 148.9 10.7 2.8 −2.3 497.5 179.0 254.6 55.7 8.2 −11.3
1980 ........ 532.1 355.9 250.0 34.0 70.3 162.6 13.7 3.5 −3.6 585.7 207.5 299.1 69.7 9.4 −53.6 1981 ........ 619.4 408.1 290.6 50.3 65.7 191.8 18.3 3.8 −2.5 672.7 238.3 329.5 93.9 11.1 −53.3 1982 ........ 616.6 386.8 295.0 41.4 49.0 204.9 22.2 5.2 −2.4 748.5 263.3 358.8 111.8 14.5 −131.9 1983 ........ 642.3 393.6 286.2 44.8 61.3 221.8 23.8 6.0 −2.9 815.4 286.5 383.0 124.6 20.8 −173.0 1984 ........ 709.0 425.7 301.4 47.8 75.2 252.8 26.6 7.3 −3.4 877.1 310.0 396.5 150.3 20.6 −168.1 1985 ........ 773.3 460.6 336.0 46.4 76.3 276.5 29.1 9.4 −2.4 948.2 338.4 419.3 169.4 20.9 −175.0 1986 ........ 815.2 479.6 350.1 44.0 83.8 297.5 31.4 8.2 −1.5 1,006.0 358.2 445.1 178.2 24.5 −190.8 1987 ........ 896.6 544.0 392.5 46.3 103.2 315.9 27.9 10.7 −2.0 1,041.6 374.3 452.9 184.6 29.9 −145.0 1988 ........ 958.2 566.7 402.9 50.3 111.1 353.1 30.0 10.8 −2.3 1,092.7 382.5 481.9 199.3 29.0 −134.5 1989 ........ 1,037.4 621.7 451.5 50.2 117.2 376.3 28.6 12.4 −1.6 1,167.5 399.2 522.0 219.3 26.8 −130.1
1990 ........ 1,081.5 642.8 470.2 51.4 118.1 400.1 30.2 13.5 −5.1 1,253.5 419.8 569.9 237.5 26.4 −172.0 1991 ........ 1,101.3 636.1 461.3 62.2 109.9 418.6 30.1 17.9 −1.4 1,315.0 439.5 597.6 250.9 26.9 −213.7 1992 ........ 1,147.2 660.4 475.3 63.7 118.8 441.8 25.7 19.4 −.1 1,444.6 445.2 718.7 251.3 29.5 −297.4 1993 ........ 1,222.5 713.4 505.5 66.7 138.5 463.6 26.2 21.1 −1.8 1,496.0 441.9 764.7 253.4 36.0 −273.5 1994 ........ 1,320.8 781.9 542.7 79.4 156.7 493.7 23.4 22.3 −.4 1,533.1 440.8 799.2 261.3 31.8 −212.3 1995 ........ 1,406.5 845.1 586.0 75.9 179.3 519.2 23.7 19.1 −.6 1,603.5 440.5 839.0 290.4 33.7 −197.0 1996 ........ 1,524.0 932.4 663.4 73.2 190.6 542.8 26.9 23.1 −1.2 1,665.8 446.3 888.3 297.3 34.0 −141.8 1997 ........ 1,653.1 1,030.6 744.3 78.2 203.0 576.4 25.9 19.9 .3 1,708.9 457.7 918.8 300.0 32.4 −55.8 1998 ........ 1,773.8 1,116.8 825.8 81.1 204.2 613.8 21.5 21.5 .1 1,734.9 454.6 946.5 298.8 35.0 38.8 1999 ....... 1,891.2 1,195.7 893.0 83.9 213.0 651.6 21.5 22.7 −.3 1,787.6 475.1 986.1 282.7 43.8 103.6
2000 ........ 2,053.8 1,313.6 999.1 87.8 219.4 691.7 25.2 25.7 −2.3 1,864.4 499.3 1,038.1 283.3 43.8 189.5 2001 ....... 2,016.2 1,252.2 994.5 85.8 164.7 717.5 24.9 27.1 −5.5 1,969.5 531.9 1,131.4 258.6 47.6 46.7 2002 ........ 1,847.3 1,069.0 831.2 87.3 143.4 733.8 20.3 24.8 −.6 2,101.8 592.7 1,243.0 229.0 37.2 −254.5 2003 ........ 1,877.0 1,064.5 775.8 89.4 191.4 758.2 23.0 25.5 5.8 2,241.6 658.6 1,322.5 214.1 46.4 −364.5 2004 p ...... .............. .............. 788.4 89.7 ............ 801.8 22.8 26.3 4.1 2,341.7 704.8 1,378.0 219.7 39.2 ............
2000: I ..... 2,035.7 1,301.9 975.4 86.7 233.0 685.3 24.5 24.8 −.8 1,823.0 485.7 1,008.2 285.1 43.9 212.7 II .... 2,044.9 1,309.4 987.4 88.9 225.5 685.6 25.5 25.3 −.9 1,863.5 505.1 1,028.8 285.7 43.8 181.4 III ... 2,066.8 1,322.6 1,011.7 88.1 215.6 696.5 25.0 25.8 −3.1 1,875.5 501.5 1,047.8 282.5 43.7 191.2 IV .. 2,068.0 1,320.4 1,021.7 87.5 203.7 699.4 25.9 26.7 −4.5 1,895.5 505.0 1,067.4 279.6 43.5 172.5
2001: I ..... 2,089.2 1,323.0 1,047.3 87.6 180.7 716.4 26.4 27.2 −3.8 1,932.6 518.4 1,095.4 274.5 44.3 156.6 II .... 2,080.5 1,315.6 1,045.7 86.9 176.6 718.1 25.2 27.3 −5.7 1,956.9 528.0 1,121.2 263.7 44.0 123.6 III .. 1,895.4 1,132.0 881.0 84.2 159.7 717.9 24.4 27.1 −6.1 1,984.0 532.7 1,135.5 253.3 62.5 −88.6 IV ... 1,999.6 1,238.1 1,004.1 84.6 141.6 717.6 23.5 26.6 −6.2 2,004.3 548.4 1,173.4 242.8 39.7 −4.7
2002: I ..... 1,844.6 1,070.4 846.9 85.1 131.4 731.3 21.3 25.4 −3.7 2,053.1 570.7 1,216.9 228.5 37.0 −208.5 II .... 1,850.5 1,074.1 835.6 87.8 143.2 734.6 20.2 24.9 −3.3 2,102.1 586.3 1,243.2 236.5 36.1 −251.6 III ... 1,847.9 1,066.6 824.4 88.2 146.9 734.3 19.9 24.7 2.4 2,103.1 593.4 1,246.9 226.2 36.6 −255.1 IV ... 1,846.2 1,064.8 817.7 88.0 152.2 734.9 19.8 24.3 2.3 2,148.8 620.3 1,264.8 224.7 39.0 −302.7
2003: I ..... 1,888.6 1,089.7 809.6 90.3 183.1 747.7 19.4 25.1 6.6 2,170.2 634.3 1,280.8 213.9 42.5 −281.6 II .... 1,902.5 1,094.2 811.6 89.6 183.1 754.0 22.8 25.4 6.0 2,266.9 665.7 1,327.5 217.7 54.6 −364.4 III ... 1,816.4 999.3 709.2 88.0 194.3 761.6 24.3 25.8 5.5 2,249.4 663.0 1,331.1 210.1 45.3 −433.0 IV ... 1,900.6 1,074.9 772.5 89.6 204.9 769.5 25.5 25.6 5.0 2,279.8 671.3 1,350.6 214.7 43.2 −379.2
2004: I ..... 1,915.3 1,073.9 768.3 89.0 207.9 787.9 22.9 26.1 4.6 2,306.3 691.1 1,365.9 211.1 39.7 −391.0 II .... 1,949.1 1,098.5 781.5 89.3 219.5 797.6 22.2 26.2 4.5 2,329.1 700.3 1,367.9 220.7 38.7 −380.0 III ... 1,956.7 1,096.7 794.3 89.2 204.9 806.2 22.9 26.6 4.3 2,340.8 713.0 1,368.8 220.0 39.0 −384.1 IVp .............. .............. 809.5 91.4 ............ 815.3 23.2 26.5 3.1 2,390.7 714.7 1,409.5 227.0 39.5 ............
1 Includes taxes from the rest of the world, not shown separately. 2 Includes an item for the difference between wage accruals and disbursements, not shown separately. 3 Includes Federal grants-in-aid. Source: Department of Commerce, Bureau of Economic Analysis.
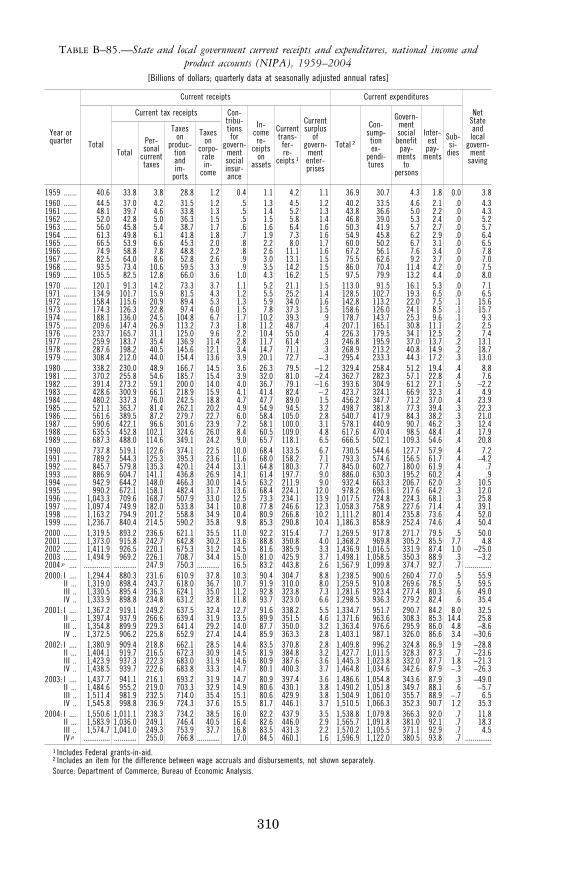
310
TABLE B–85.—State and local government current receipts and expenditures, national income and product accounts (NIPA), 1959–2004
[Billions of dollars; quarterly data at seasonally adjusted annual rates]
Year or quarter
Current receipts Current expenditures
Net State and local
govern-ment
saving
Total
Current tax receipts Con-tribu-tions for
govern-ment social insur-ance
In- come re-
ceipts on
assets
Current trans- fer- re-
ceipts 1
Current surplus
of govern-
ment enter- prises
Total 2
Con- sump-
tion ex-
pendi- tures
Govern- ment social benefit
pay- ments
to persons
Inter-est
pay-ments
Sub-si-
dies Total Per-sonal
current taxes
Taxes on
produc- tion and im-
ports
Taxes on
corpo- rate in-
come
1959 ....... 40.6 33.8 3.8 28.8 1.2 0.4 1.1 4.2 1.1 36.9 30.7 4.3 1.8 0.0 3.8 1960 ....... 44.5 37.0 4.2 31.5 1.2 .5 1.3 4.5 1.2 40.2 33.5 4.6 2.1 .0 4.3 1961 ....... 48.1 39.7 4.6 33.8 1.3 .5 1.4 5.2 1.3 43.8 36.6 5.0 2.2 .0 4.3 1962 ....... 52.0 42.8 5.0 36.3 1.5 .5 1.5 5.8 1.4 46.8 39.0 5.3 2.4 .0 5.2 1963 ....... 56.0 45.8 5.4 38.7 1.7 .6 1.6 6.4 1.6 50.3 41.9 5.7 2.7 .0 5.7 1964 ....... 61.3 49.8 6.1 41.8 1.8 .7 1.9 7.3 1.6 54.9 45.8 6.2 2.9 .0 6.4 1965 ....... 66.5 53.9 6.6 45.3 2.0 .8 2.2 8.0 1.7 60.0 50.2 6.7 3.1 .0 6.5 1966 ....... 74.9 58.8 7.8 48.8 2.2 .8 2.6 11.1 1.6 67.2 56.1 7.6 3.4 .0 7.8 1967 ....... 82.5 64.0 8.6 52.8 2.6 .9 3.0 13.1 1.5 75.5 62.6 9.2 3.7 .0 7.0 1968 ....... 93.5 73.4 10.6 59.5 3.3 .9 3.5 14.2 1.5 86.0 70.4 11.4 4.2 .0 7.5 1969 ....... 105.5 82.5 12.8 66.0 3.6 1.0 4.3 16.2 1.5 97.5 79.9 13.2 4.4 .0 8.0 1970 ....... 120.1 91.3 14.2 73.3 3.7 1.1 5.2 21.1 1.5 113.0 91.5 16.1 5.3 .0 7.1 1971 ....... 134.9 101.7 15.9 81.5 4.3 1.2 5.5 25.2 1.4 128.5 102.7 19.3 6.5 .0 6.5 1972 ....... 158.4 115.6 20.9 89.4 5.3 1.3 5.9 34.0 1.6 142.8 113.2 22.0 7.5 .1 15.6 1973 ....... 174.3 126.3 22.8 97.4 6.0 1.5 7.8 37.3 1.5 158.6 126.0 24.1 8.5 .1 15.7 1974 ....... 188.1 136.0 24.5 104.8 6.7 1.7 10.2 39.3 .9 178.7 143.7 25.3 9.6 .1 9.3 1975 ....... 209.6 147.4 26.9 113.2 7.3 1.8 11.2 48.7 .4 207.1 165.1 30.8 11.1 .2 2.5 1976 ....... 233.7 165.7 31.1 125.0 9.6 2.2 10.4 55.0 .4 226.3 179.5 34.1 12.5 .2 7.4 1977 ....... 259.9 183.7 35.4 136.9 11.4 2.8 11.7 61.4 .3 246.8 195.9 37.0 13.7 .2 13.1 1978 ....... 287.6 198.2 40.5 145.6 12.1 3.4 14.7 71.1 .3 268.9 213.2 40.8 14.9 .2 18.7 1979 ....... 308.4 212.0 44.0 154.4 13.6 3.9 20.1 72.7 −.3 295.4 233.3 44.3 17.2 .3 13.0 1980 ....... 338.2 230.0 48.9 166.7 14.5 3.6 26.3 79.5 −1.2 329.4 258.4 51.2 19.4 .4 8.8 1981 ....... 370.2 255.8 54.6 185.7 15.4 3.9 32.0 81.0 −2.4 362.7 282.3 57.1 22.8 .4 7.6 1982 ....... 391.4 273.2 59.1 200.0 14.0 4.0 36.7 79.1 −1.6 393.6 304.9 61.2 27.1 .5 −2.2 1983 ....... 428.6 300.9 66.1 218.9 15.9 4.1 41.4 82.4 −.2 423.7 324.1 66.9 32.3 .4 4.9 1984 ....... 480.2 337.3 76.0 242.5 18.8 4.7 47.7 89.0 1.5 456.2 347.7 71.2 37.0 .4 23.9 1985 ....... 521.1 363.7 81.4 262.1 20.2 4.9 54.9 94.5 3.2 498.7 381.8 77.3 39.4 .3 22.3 1986 ....... 561.6 389.5 87.2 279.7 22.7 6.0 58.4 105.0 2.8 540.7 417.9 84.3 38.2 .3 21.0 1987 ....... 590.6 422.1 96.6 301.6 23.9 7.2 58.1 100.0 3.1 578.1 440.9 90.7 46.2 .3 12.4 1988 ....... 635.5 452.8 102.1 324.6 26.0 8.4 60.5 109.0 4.8 617.6 470.4 98.5 48.4 .4 17.9 1989 ....... 687.3 488.0 114.6 349.1 24.2 9.0 65.7 118.1 6.5 666.5 502.1 109.3 54.6 .4 20.8 1990 ....... 737.8 519.1 122.6 374.1 22.5 10.0 68.4 133.5 6.7 730.5 544.6 127.7 57.9 .4 7.2 1991 ....... 789.2 544.3 125.3 395.3 23.6 11.6 68.0 158.2 7.1 793.3 574.6 156.5 61.7 .4 −4.2 1992 ....... 845.7 579.8 135.3 420.1 24.4 13.1 64.8 180.3 7.7 845.0 602.7 180.0 61.9 .4 .7 1993 ....... 886.9 604.7 141.1 436.8 26.9 14.1 61.4 197.7 9.0 886.0 630.3 195.2 60.2 .4 .9 1994 ....... 942.9 644.2 148.0 466.3 30.0 14.5 63.2 211.9 9.0 932.4 663.3 206.7 62.0 .3 10.5 1995 ....... 990.2 672.1 158.1 482.4 31.7 13.6 68.4 224.1 12.0 978.2 696.1 217.6 64.2 .3 12.0 1996 ....... 1,043.3 709.6 168.7 507.9 33.0 12.5 73.3 234.1 13.9 1,017.5 724.8 224.3 68.1 .3 25.8 1997 ....... 1,097.4 749.9 182.0 533.8 34.1 10.8 77.8 246.6 12.3 1,058.3 758.9 227.6 71.4 .4 39.1 1998 ....... 1,163.2 794.9 201.2 558.8 34.9 10.4 80.9 266.8 10.2 1,111.2 801.4 235.8 73.6 .4 52.0 1999 ....... 1,236.7 840.4 214.5 590.2 35.8 9.8 85.3 290.8 10.4 1,186.3 858.9 252.4 74.6 .4 50.4 2000 ....... 1,319.5 893.2 236.6 621.1 35.5 11.0 92.2 315.4 7.7 1,269.5 917.8 271.7 79.5 .5 50.0 2001 ....... 1,373.0 915.8 242.7 642.8 30.2 13.6 88.8 350.8 4.0 1,368.2 969.8 305.2 85.5 7.7 4.8 2002 ....... 1,411.9 926.5 220.1 675.3 31.2 14.5 81.6 385.9 3.3 1,436.9 1,016.5 331.9 87.4 1.0 −25.0 2003 ....... 1,494.9 969.2 226.1 708.7 34.4 15.0 81.0 425.9 3.7 1,498.1 1,058.5 350.3 88.9 .3 −3.2 2004 p .... .............. ............ 247.9 750.3 ............ 16.5 83.2 443.8 2.6 1,567.9 1,099.8 374.7 92.7 .7 ..............2000: I .... 1,294.4 880.3 231.6 610.9 37.8 10.3 90.4 304.7 8.8 1,238.5 900.6 260.4 77.0 .5 55.9
II ... 1,319.0 898.4 243.7 618.0 36.7 10.7 91.9 310.0 8.0 1,259.5 910.8 269.6 78.5 .5 59.5 III .. 1,330.5 895.4 236.3 624.1 35.0 11.2 92.8 323.8 7.3 1,281.6 923.4 277.4 80.3 .6 49.0 IV .. 1,333.9 898.8 234.8 631.2 32.8 11.8 93.7 323.0 6.6 1,298.5 936.3 279.2 82.4 .6 35.4
2001: I .... 1,367.2 919.1 249.2 637.5 32.4 12.7 91.6 338.2 5.5 1,334.7 951.7 290.7 84.2 8.0 32.5 II ... 1,397.4 937.9 266.6 639.4 31.9 13.5 89.9 351.5 4.6 1,371.6 963.6 308.3 85.3 14.4 25.8 III .. 1,354.8 899.9 229.3 641.4 29.2 14.0 87.7 350.0 3.2 1,363.4 976.6 295.9 86.0 4.8 −8.6 IV .. 1,372.5 906.2 225.8 652.9 27.4 14.4 85.9 363.3 2.8 1,403.1 987.1 326.0 86.6 3.4 −30.6
2002: I .... 1,380.9 909.4 218.8 662.1 28.5 14.4 83.5 370.8 2.8 1,409.8 996.2 324.8 86.9 1.9 −28.8 II ... 1,404.1 919.7 216.5 672.3 30.9 14.5 81.9 384.8 3.2 1,427.7 1,011.5 328.3 87.3 .7 −23.6 III .. 1,423.9 937.3 222.3 683.0 31.9 14.6 80.9 387.6 3.6 1,445.3 1,023.8 332.0 87.7 1.8 −21.3 IV .. 1,438.5 939.7 222.6 683.8 33.3 14.7 80.1 400.3 3.7 1,464.8 1,034.6 342.6 87.9 −.3 −26.3
2003: I .... 1,437.7 941.1 216.1 693.2 31.9 14.7 80.9 397.4 3.6 1,486.6 1,054.8 343.6 87.9 .3 −49.0 II ... 1,484.6 955.2 219.0 703.3 32.9 14.9 80.6 430.1 3.8 1,490.2 1,051.8 349.7 88.1 .6 −5.7 III .. 1,511.4 981.9 232.5 714.0 35.4 15.1 80.6 429.9 3.8 1,504.9 1,061.0 355.7 88.9 −.7 6.5 IV .. 1,545.8 998.8 236.9 724.3 37.6 15.5 81.7 446.1 3.7 1,510.5 1,066.3 352.3 90.7 1.2 35.3
2004: I .... 1,550.6 1,011.1 238.3 734.2 38.5 16.0 82.2 437.9 3.5 1,538.8 1,079.8 366.3 92.0 .7 11.8 II ... 1,583.9 1,036.0 249.1 746.4 40.5 16.4 82.6 446.0 2.9 1,565.7 1,091.8 381.0 92.1 .7 18.3 III .. 1,574.7 1,041.0 249.3 753.9 37.7 16.8 83.5 431.3 2.2 1,570.2 1,105.5 371.1 92.9 .7 4.5 IV p .............. ............ 255.0 766.8 ............ 17.0 84.5 460.1 1.6 1,596.9 1,122.0 380.5 93.8 .7 ..............
1 Includes Federal grants-in-aid. 2 Includes an item for the difference between wage accruals and disbursements, not shown separately. Source: Department of Commerce, Bureau of Economic Analysis.
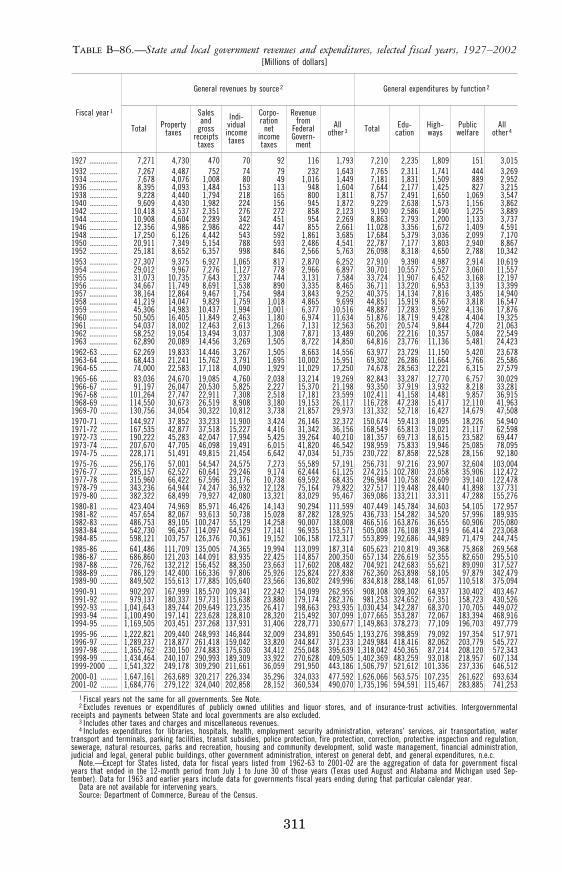
311
TABLE B–86.—State and local government revenues and expenditures, selected fiscal years, 1927–2002 [Millions of dollars]
Fiscal year 1
General revenues by source 2 General expenditures by function 2
Total Property taxes
Sales and
gross receipts
taxes
Indi- vidual income taxes
Corpo-ration
net income taxes
Revenue from
Federal Govern-
ment
All other 3 Total Edu-
cation High-ways
Public welfare
All other 4
1927 ............... 7,271 4,730 470 70 92 116 1,793 7,210 2,235 1,809 151 3,015 1932 ............... 7,267 4,487 752 74 79 232 1,643 7,765 2,311 1,741 444 3,269 1934 ............... 7,678 4,076 1,008 80 49 1,016 1,449 7,181 1,831 1,509 889 2,952 1936 ............... 8,395 4,093 1,484 153 113 948 1,604 7,644 2,177 1,425 827 3,215 1938 ............... 9,228 4,440 1,794 218 165 800 1,811 8,757 2,491 1,650 1,069 3,547 1940 ............... 9,609 4,430 1,982 224 156 945 1,872 9,229 2,638 1,573 1,156 3,862 1942 ............... 10,418 4,537 2,351 276 272 858 2,123 9,190 2,586 1,490 1,225 3,889 1944 ............... 10,908 4,604 2,289 342 451 954 2,269 8,863 2,793 1,200 1,133 3,737 1946 ............... 12,356 4,986 2,986 422 447 855 2,661 11,028 3,356 1,672 1,409 4,591 1948 ............... 17,250 6,126 4,442 543 592 1,861 3,685 17,684 5,379 3,036 2,099 7,170 1950 ............... 20,911 7,349 5,154 788 593 2,486 4,541 22,787 7,177 3,803 2,940 8,867 1952 ............... 25,181 8,652 6,357 998 846 2,566 5,763 26,098 8,318 4,650 2,788 10,342 1953 ............... 27,307 9,375 6,927 1,065 817 2,870 6,252 27,910 9,390 4,987 2,914 10,619 1954 ............... 29,012 9,967 7,276 1,127 778 2,966 6,897 30,701 10,557 5,527 3,060 11,557 1955 ............... 31,073 10,735 7,643 1,237 744 3,131 7,584 33,724 11,907 6,452 3,168 12,197 1956 ............... 34,667 11,749 8,691 1,538 890 3,335 8,465 36,711 13,220 6,953 3,139 13,399 1957 ............... 38,164 12,864 9,467 1,754 984 3,843 9,252 40,375 14,134 7,816 3,485 14,940 1958 ............... 41,219 14,047 9,829 1,759 1,018 4,865 9,699 44,851 15,919 8,567 3,818 16,547 1959 ............... 45,306 14,983 10,437 1,994 1,001 6,377 10,516 48,887 17,283 9,592 4,136 17,876 1960 ............... 50,505 16,405 11,849 2,463 1,180 6,974 11,634 51,876 18,719 9,428 4,404 19,325 1961 ............... 54,037 18,002 12,463 2,613 1,266 7,131 12,563 56,201 20,574 9,844 4,720 21,063 1962 ............... 58,252 19,054 13,494 3,037 1,308 7,871 13,489 60,206 22,216 10,357 5,084 22,549 1963 ............... 62,890 20,089 14,456 3,269 1,505 8,722 14,850 64,816 23,776 11,136 5,481 24,423 1962-63 ......... 62,269 19,833 14,446 3,267 1,505 8,663 14,556 63,977 23,729 11,150 5,420 23,678 1963-64 ......... 68,443 21,241 15,762 3,791 1,695 10,002 15,951 69,302 26,286 11,664 5,766 25,586 1964-65 ......... 74,000 22,583 17,118 4,090 1,929 11,029 17,250 74,678 28,563 12,221 6,315 27,579 1965-66 ......... 83,036 24,670 19,085 4,760 2,038 13,214 19,269 82,843 33,287 12,770 6,757 30,029 1966-67 ......... 91,197 26,047 20,530 5,825 2,227 15,370 21,198 93,350 37,919 13,932 8,218 33,281 1967-68 ......... 101,264 27,747 22,911 7,308 2,518 17,181 23,599 102,411 41,158 14,481 9,857 36,915 1968-69 ......... 114,550 30,673 26,519 8,908 3,180 19,153 26,117 116,728 47,238 15,417 12,110 41,963 1969-70 ......... 130,756 34,054 30,322 10,812 3,738 21,857 29,973 131,332 52,718 16,427 14,679 47,508 1970-71 ......... 144,927 37,852 33,233 11,900 3,424 26,146 32,372 150,674 59,413 18,095 18,226 54,940 1971-72 ......... 167,535 42,877 37,518 15,227 4,416 31,342 36,156 168,549 65,813 19,021 21,117 62,598 1972-73 ......... 190,222 45,283 42,047 17,994 5,425 39,264 40,210 181,357 69,713 18,615 23,582 69,447 1973-74 ......... 207,670 47,705 46,098 19,491 6,015 41,820 46,542 198,959 75,833 19,946 25,085 78,095 1974-75 ......... 228,171 51,491 49,815 21,454 6,642 47,034 51,735 230,722 87,858 22,528 28,156 92,180 1975-76 ......... 256,176 57,001 54,547 24,575 7,273 55,589 57,191 256,731 97,216 23,907 32,604 103,004 1976-77 ......... 285,157 62,527 60,641 29,246 9,174 62,444 61,125 274,215 102,780 23,058 35,906 112,472 1977-78 ......... 315,960 66,422 67,596 33,176 10,738 69,592 68,435 296,984 110,758 24,609 39,140 122,478 1978-79 ......... 343,236 64,944 74,247 36,932 12,128 75,164 79,822 327,517 119,448 28,440 41,898 137,731 1979-80 ......... 382,322 68,499 79,927 42,080 13,321 83,029 95,467 369,086 133,211 33,311 47,288 155,276 1980-81 ......... 423,404 74,969 85,971 46,426 14,143 90,294 111,599 407,449 145,784 34,603 54,105 172,957 1981-82 ......... 457,654 82,067 93,613 50,738 15,028 87,282 128,925 436,733 154,282 34,520 57,996 189,935 1982-83 ......... 486,753 89,105 100,247 55,129 14,258 90,007 138,008 466,516 163,876 36,655 60,906 205,080 1983-84 ......... 542,730 96,457 114,097 64,529 17,141 96,935 153,571 505,008 176,108 39,419 66,414 223,068 1984-85 ......... 598,121 103,757 126,376 70,361 19,152 106,158 172,317 553,899 192,686 44,989 71,479 244,745 1985-86 ......... 641,486 111,709 135,005 74,365 19,994 113,099 187,314 605,623 210,819 49,368 75,868 269,568 1986-87 ......... 686,860 121,203 144,091 83,935 22,425 114,857 200,350 657,134 226,619 52,355 82,650 295,510 1987-88 ......... 726,762 132,212 156,452 88,350 23,663 117,602 208,482 704,921 242,683 55,621 89,090 317,527 1988-89 ......... 786,129 142,400 166,336 97,806 25,926 125,824 227,838 762,360 263,898 58,105 97,879 342,479 1989-90 ......... 849,502 155,613 177,885 105,640 23,566 136,802 249,996 834,818 288,148 61,057 110,518 375,094 1990-91 ......... 902,207 167,999 185,570 109,341 22,242 154,099 262,955 908,108 309,302 64,937 130,402 403,467 1991-92 ......... 979,137 180,337 197,731 115,638 23,880 179,174 282,376 981,253 324,652 67,351 158,723 430,526 1992-93 ......... 1,041,643 189,744 209,649 123,235 26,417 198,663 293,935 1,030,434 342,287 68,370 170,705 449,072 1993-94 ......... 1,100,490 197,141 223,628 128,810 28,320 215,492 307,099 1,077,665 353,287 72,067 183,394 468,916 1994-95 ......... 1,169,505 203,451 237,268 137,931 31,406 228,771 330,677 1,149,863 378,273 77,109 196,703 497,779 1995-96 ......... 1,222,821 209,440 248,993 146,844 32,009 234,891 350,645 1,193,276 398,859 79,092 197,354 517,971 1996-97 ......... 1,289,237 218,877 261,418 159,042 33,820 244,847 371,233 1,249,984 418,416 82,062 203,779 545,727 1997-98 ......... 1,365,762 230,150 274,883 175,630 34,412 255,048 395,639 1,318,042 450,365 87,214 208,120 572,343 1998-99 ......... 1,434,464 240,107 290,993 189,309 33,922 270,628 409,505 1,402,369 483,259 93,018 218,957 607,134 1999-2000 ..... 1,541,322 249,178 309,290 211,661 36,059 291,950 443,186 1,506,797 521,612 101,336 237,336 646,512 2000-01 ......... 1,647,161 263,689 320,217 226,334 35,296 324,033 477,592 1,626,066 563,575 107,235 261,622 693,634 2001-02 ......... 1,684,776 279,122 324,040 202,858 28,152 360,534 490,070 1,735,196 594,591 115,467 283,885 741,253
1 Fiscal years not the same for all governments. See Note. 2 Excludes revenues or expenditures of publicly owned utilities and liquor stores, and of insurance-trust activities. Intergovernmental
receipts and payments between State and local governments are also excluded. 3 Includes other taxes and charges and miscellaneous revenues. 4 Includes expenditures for libraries, hospitals, health, employment security administration, veterans’ services, air transportation, water
transport and terminals, parking facilities, transit subsidies, police protection, fire protection, correction, protective inspection and regulation, sewerage, natural resources, parks and recreation, housing and community development, solid waste management, financial administration, judicial and legal, general public buildings, other government administration, interest on general debt, and general expenditures, n.e.c.
Note.—Except for States listed, data for fiscal years listed from 1962-63 to 2001-02 are the aggregation of data for government fiscal years that ended in the 12-month period from July 1 to June 30 of those years (Texas used August and Alabama and Michigan used Sep-tember). Data for 1963 and earlier years include data for governments fiscal years ending during that particular calendar year.
Data are not available for intervening years. Source: Department of Commerce, Bureau of the Census.
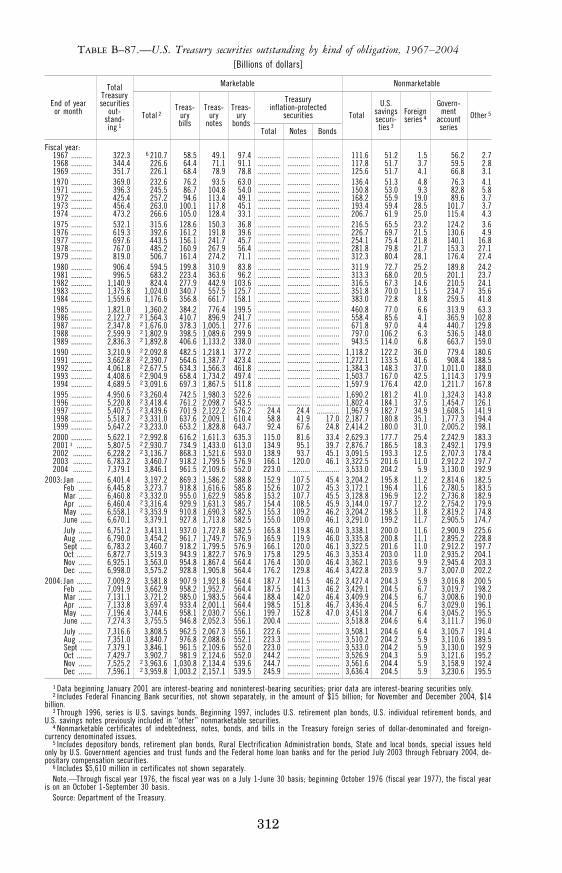
312
TABLE B–87.—U.S. Treasury securities outstanding by kind of obligation, 1967–2004 [Billions of dollars]
End of year or month
Total Treasury securities
out- stand- ing 1
Marketable Nonmarketable
Total 2 Treas-
ury bills
Treas- ury
notes
Treas-ury
bonds
Treasury inflation-protected
securities Total U.S.
savings securi-ties 3
Foreign series 4
Govern- ment
account series
Other 5
Total Notes Bonds
Fiscal year: 1967 ........... 322.3 6 210.7 58.5 49.1 97.4 ............ ............ ............ 111.6 51.2 1.5 56.2 2.7 1968 ........... 344.4 226.6 64.4 71.1 91.1 ............ ............ ............ 117.8 51.7 3.7 59.5 2.8 1969 ........... 351.7 226.1 68.4 78.9 78.8 ............ ............ ............ 125.6 51.7 4.1 66.8 3.1 1970 ........... 369.0 232.6 76.2 93.5 63.0 ............ ............ ............ 136.4 51.3 4.8 76.3 4.1 1971 ........... 396.3 245.5 86.7 104.8 54.0 ............ ............ ............ 150.8 53.0 9.3 82.8 5.8 1972 ........... 425.4 257.2 94.6 113.4 49.1 ............ ............ ............ 168.2 55.9 19.0 89.6 3.7 1973 ........... 456.4 263.0 100.1 117.8 45.1 ............ ............ ............ 193.4 59.4 28.5 101.7 3.7 1974 ........... 473.2 266.6 105.0 128.4 33.1 ............ ............ ............ 206.7 61.9 25.0 115.4 4.3 1975 ........... 532.1 315.6 128.6 150.3 36.8 ............ ............ ............ 216.5 65.5 23.2 124.2 3.6 1976 ........... 619.3 392.6 161.2 191.8 39.6 ............ ............ ............ 226.7 69.7 21.5 130.6 4.9 1977 ........... 697.6 443.5 156.1 241.7 45.7 ............ ............ ............ 254.1 75.4 21.8 140.1 16.8 1978 ........... 767.0 485.2 160.9 267.9 56.4 ............ ............ ............ 281.8 79.8 21.7 153.3 27.1 1979 ........... 819.0 506.7 161.4 274.2 71.1 ............ ............ ............ 312.3 80.4 28.1 176.4 27.4 1980 ........... 906.4 594.5 199.8 310.9 83.8 ............ ............ ............ 311.9 72.7 25.2 189.8 24.2 1981 ........... 996.5 683.2 223.4 363.6 96.2 ............ ............ ............ 313.3 68.0 20.5 201.1 23.7 1982 ........... 1,140.9 824.4 277.9 442.9 103.6 ............ ............ ............ 316.5 67.3 14.6 210.5 24.1 1983 ........... 1,375.8 1,024.0 340.7 557.5 125.7 ............ ............ ............ 351.8 70.0 11.5 234.7 35.6 1984 ........... 1,559.6 1,176.6 356.8 661.7 158.1 ............ ............ ............ 383.0 72.8 8.8 259.5 41.8 1985 ........... 1,821.0 1,360.2 384.2 776.4 199.5 ............ ............ ............ 460.8 77.0 6.6 313.9 63.3 1986 ........... 2,122.7 2 1,564.3 410.7 896.9 241.7 ............ ............ ............ 558.4 85.6 4.1 365.9 102.8 1987 ........... 2,347.8 2 1,676.0 378.3 1,005.1 277.6 ............ ............ ............ 671.8 97.0 4.4 440.7 129.8 1988 ........... 2,599.9 2 1,802.9 398.5 1,089.6 299.9 ............ ............ ............ 797.0 106.2 6.3 536.5 148.0 1989 ........... 2,836.3 2 1,892.8 406.6 1,133.2 338.0 ............ ............ ............ 943.5 114.0 6.8 663.7 159.0 1990 ........... 3,210.9 2 2,092.8 482.5 1,218.1 377.2 ............ ............ ............ 1,118.2 122.2 36.0 779.4 180.6 1991 ........... 3,662.8 2 2,390.7 564.6 1,387.7 423.4 ............ ............ ............ 1,272.1 133.5 41.6 908.4 188.5 1992 ........... 4,061.8 2 2,677.5 634.3 1,566.3 461.8 ............ ............ ............ 1,384.3 148.3 37.0 1,011.0 188.0 1993 ........... 4,408.6 2 2,904.9 658.4 1,734.2 497.4 ............ ............ ............ 1,503.7 167.0 42.5 1,114.3 179.9 1994 ........... 4,689.5 2 3,091.6 697.3 1,867.5 511.8 ............ ............ ............ 1,597.9 176.4 42.0 1,211.7 167.8 1995 ........... 4,950.6 2 3,260.4 742.5 1,980.3 522.6 ............ ............ ............ 1,690.2 181.2 41.0 1,324.3 143.8 1996 ........... 5,220.8 2 3,418.4 761.2 2,098.7 543.5 ............ ............ ............ 1,802.4 184.1 37.5 1,454.7 126.1 1997 ........... 5,407.5 2 3,439.6 701.9 2,122.2 576.2 24.4 24.4 ............ 1,967.9 182.7 34.9 1,608.5 141.9 1998 ........... 5,518.7 2 3,331.0 637.6 2,009.1 610.4 58.8 41.9 17.0 2,187.7 180.8 35.1 1,777.3 194.4 1999 ........... 5,647.2 2 3,233.0 653.2 1,828.8 643.7 92.4 67.6 24.8 2,414.2 180.0 31.0 2,005.2 198.1 2000 ........... 5,622.1 2 2,992.8 616.2 1,611.3 635.3 115.0 81.6 33.4 2,629.3 177.7 25.4 2,242.9 183.3 2001 1 ........ 5,807.5 2 2,930.7 734.9 1,433.0 613.0 134.9 95.1 39.7 2,876.7 186.5 18.3 2,492.1 179.9 2002 .......... 6,228.2 2 3,136.7 868.3 1,521.6 593.0 138.9 93.7 45.1 3,091.5 193.3 12.5 2,707.3 178.4 2003 .......... 6,783.2 3,460.7 918.2 1,799.5 576.9 166.1 120.0 46.1 3,322.5 201.6 11.0 2,912.2 197.7 2004 .......... 7,379.1 3,846.1 961.5 2,109.6 552.0 223.0 ............ ............ 3,533.0 204.2 5.9 3,130.0 192.9
2003: Jan ........ 6,401.4 3,197.2 869.3 1,586.2 588.8 152.9 107.5 45.4 3,204.2 195.8 11.2 2,814.6 182.5 Feb ....... 6,445.8 3,273.7 918.8 1,616.6 585.8 152.6 107.2 45.3 3,172.1 196.4 11.6 2,780.5 183.5 Mar ....... 6,460.8 2 3,332.0 955.0 1,622.9 585.8 153.2 107.7 45.5 3,128.8 196.9 12.2 2,736.8 182.9 Apr ....... 6,460.4 2 3,316.4 929.9 1,631.3 585.7 154.4 108.5 45.9 3,144.0 197.7 12.2 2,754.2 179.9 May ...... 6,558.1 2 3,353.9 910.8 1,690.3 582.5 155.3 109.2 46.2 3,204.2 198.5 11.8 2,819.2 174.8 June ...... 6,670.1 3,379.1 927.8 1,713.8 582.5 155.0 109.0 46.1 3,291.0 199.2 11.7 2,905.5 174.7 July ....... 6,751.2 3,413.1 937.0 1,727.8 582.5 165.8 119.8 46.0 3,338.1 200.0 11.6 2,900.9 225.6 Aug ....... 6,790.0 3,454.2 961.7 1,749.7 576.9 165.9 119.9 46.0 3,335.8 200.8 11.1 2,895.2 228.8 Sept ...... 6,783.2 3,460.7 918.2 1,799.5 576.9 166.1 120.0 46.1 3,322.5 201.6 11.0 2,912.2 197.7 Oct ........ 6,872.7 3,519.3 943.9 1,822.7 576.9 175.8 129.5 46.3 3,353.4 203.0 11.0 2,935.2 204.1 Nov ....... 6,925.1 3,563.0 954.8 1,867.4 564.4 176.4 130.0 46.4 3,362.1 203.6 9.9 2,945.4 203.3 Dec ....... 6,998.0 3,575.2 928.8 1,905.8 564.4 176.2 129.8 46.4 3,422.8 203.9 9.7 3,007.0 202.2
2004: Jan ........ 7,009.2 3,581.8 907.9 1,921.8 564.4 187.7 141.5 46.2 3,427.4 204.3 5.9 3,016.8 200.5 Feb ....... 7,091.9 3,662.9 958.2 1,952.7 564.4 187.5 141.3 46.2 3,429.1 204.5 6.7 3,019.7 198.2 Mar ....... 7,131.1 3,721.2 985.0 1,983.5 564.4 188.4 142.0 46.4 3,409.9 204.5 6.7 3,008.6 190.0 Apr ....... 7,133.8 3,697.4 933.4 2,001.1 564.4 198.5 151.8 46.7 3,436.4 204.5 6.7 3,029.0 196.1 May ...... 7,196.4 3,744.6 958.1 2,030.7 556.1 199.7 152.8 47.0 3,451.8 204.7 6.4 3,045.2 195.5 June ...... 7,274.3 3,755.5 946.8 2,052.3 556.1 200.4 ............ ............ 3,518.8 204.6 6.4 3,111.7 196.0 July ....... 7,316.6 3,808.5 962.5 2,067.3 556.1 222.6 ............ ............ 3,508.1 204.6 6.4 3,105.7 191.4 Aug ....... 7,351.0 3,840.7 976.8 2,088.6 552.1 223.3 ............ ............ 3,510.2 204.2 5.9 3,110.6 189.5 Sept ...... 7,379.1 3,846.1 961.5 2,109.6 552.0 223.0 ............ ............ 3,533.0 204.2 5.9 3,130.0 192.9 Oct ........ 7,429.7 3,902.7 981.9 2,124.6 552.0 244.2 ............ ............ 3,526.9 204.3 5.9 3,121.6 195.2 Nov ....... 7,525.2 2 3,963.6 1,030.8 2,134.4 539.6 244.7 ............ ............ 3,561.6 204.4 5.9 3,158.9 192.4 Dec ....... 7,596.1 2 3,959.8 1,003.2 2,157.1 539.5 245.9 ............ ............ 3,636.4 204.5 5.9 3,230.6 195.5
1 Data beginning January 2001 are interest-bearing and noninterest-bearing securities; prior data are interest-bearing securities only. 2 Includes Federal Financing Bank securities, not shown separately, in the amount of $15 billion; for November and December 2004, $14
billion. 3 Through 1996, series is U.S. savings bonds. Beginning 1997, includes U.S. retirement plan bonds, U.S. individual retirement bonds, and
U.S. savings notes previously included in ‘‘other’’ nonmarketable securities. 4 Nonmarketable certificates of indebtedness, notes, bonds, and bills in the Treasury foreign series of dollar-denominated and foreign-
currency denominated issues. 5 Includes depository bonds, retirement plan bonds, Rural Electrification Administration bonds, State and local bonds, special issues held
only by U.S. Government agencies and trust funds and the Federal home loan banks and for the period July 2003 through February 2004, de-positary compensation securities.
6 Includes $5,610 million in certificates not shown separately. Note.—Through fiscal year 1976, the fiscal year was on a July 1-June 30 basis; beginning October 1976 (fiscal year 1977), the fiscal year
is on an October 1-September 30 basis. Source: Department of the Treasury.
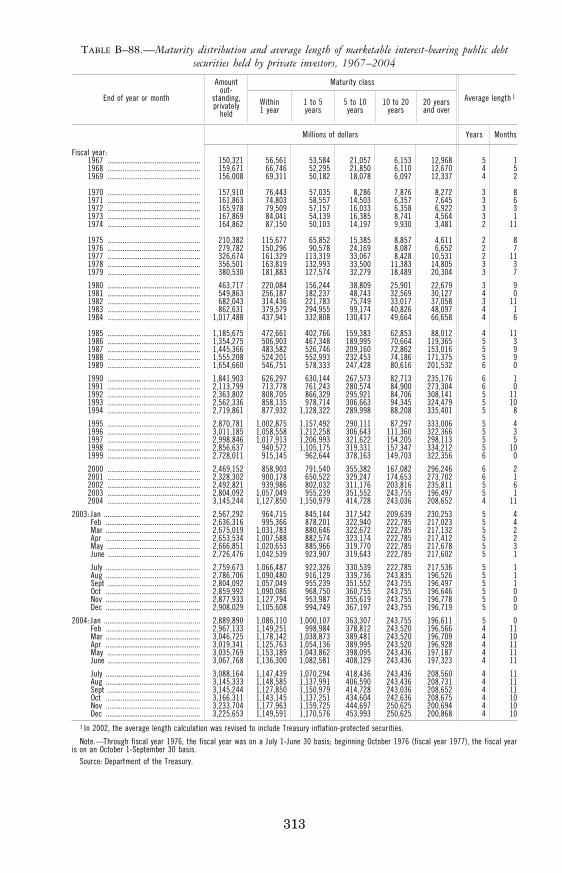
313
TABLE B–88.—Maturity distribution and average length of marketable interest-bearing public debt securities held by private investors, 1967–2004
End of year or month
Amount out-
standing, privately
held
Maturity class
Average length 1 Within 1 year
1 to 5 years
5 to 10 years
10 to 20 years
20 years and over
Millions of dollars Years Months
Fiscal year: 1967 ................................................. 150,321 56,561 53,584 21,057 6,153 12,968 5 1 1968 ................................................. 159,671 66,746 52,295 21,850 6,110 12,670 4 5 1969 ................................................. 156,008 69,311 50,182 18,078 6,097 12,337 4 2
1970 ................................................. 157,910 76,443 57,035 8,286 7,876 8,272 3 8 1971 ................................................. 161,863 74,803 58,557 14,503 6,357 7,645 3 6 1972 ................................................. 165,978 79,509 57,157 16,033 6,358 6,922 3 3 1973 ................................................. 167,869 84,041 54,139 16,385 8,741 4,564 3 1 1974 ................................................. 164,862 87,150 50,103 14,197 9,930 3,481 2 11
1975 ................................................. 210,382 115,677 65,852 15,385 8,857 4,611 2 8 1976 ................................................. 279,782 150,296 90,578 24,169 8,087 6,652 2 7 1977 ................................................. 326,674 161,329 113,319 33,067 8,428 10,531 2 11 1978 ................................................. 356,501 163,819 132,993 33,500 11,383 14,805 3 3 1979 ................................................. 380,530 181,883 127,574 32,279 18,489 20,304 3 7
1980 ................................................. 463,717 220,084 156,244 38,809 25,901 22,679 3 9 1981 ................................................. 549,863 256,187 182,237 48,743 32,569 30,127 4 0 1982 ................................................. 682,043 314,436 221,783 75,749 33,017 37,058 3 11 1983 ................................................. 862,631 379,579 294,955 99,174 40,826 48,097 4 1 1984 ................................................. 1,017,488 437,941 332,808 130,417 49,664 66,658 4 6
1985 ................................................. 1,185,675 472,661 402,766 159,383 62,853 88,012 4 11 1986 ................................................. 1,354,275 506,903 467,348 189,995 70,664 119,365 5 3 1987 ................................................. 1,445,366 483,582 526,746 209,160 72,862 153,016 5 9 1988 ................................................. 1,555,208 524,201 552,993 232,453 74,186 171,375 5 9 1989 ................................................. 1,654,660 546,751 578,333 247,428 80,616 201,532 6 0
1990 ................................................. 1,841,903 626,297 630,144 267,573 82,713 235,176 6 1 1991 ................................................. 2,113,799 713,778 761,243 280,574 84,900 273,304 6 0 1992 ................................................. 2,363,802 808,705 866,329 295,921 84,706 308,141 5 11 1993 ................................................. 2,562,336 858,135 978,714 306,663 94,345 324,479 5 10 1994 ................................................. 2,719,861 877,932 1,128,322 289,998 88,208 335,401 5 8
1995 ................................................. 2,870,781 1,002,875 1,157,492 290,111 87,297 333,006 5 4 1996 ................................................. 3,011,185 1,058,558 1,212,258 306,643 111,360 322,366 5 3 1997 ................................................. 2,998,846 1,017,913 1,206,993 321,622 154,205 298,113 5 5 1998 ................................................. 2,856,637 940,572 1,105,175 319,331 157,347 334,212 5 10 1999 ................................................. 2,728,011 915,145 962,644 378,163 149,703 322,356 6 0
2000 ................................................. 2,469,152 858,903 791,540 355,382 167,082 296,246 6 2 2001 ................................................. 2,328,302 900,178 650,522 329,247 174,653 273,702 6 1 2002 ................................................. 2,492,821 939,986 802,032 311,176 203,816 235,811 5 6 2003 ................................................. 2,804,092 1,057,049 955,239 351,552 243,755 196,497 5 1 2004 ................................................. 3,145,244 1,127,850 1,150,979 414,728 243,036 208,652 4 11
2003: Jan ................................................... 2,567,292 964,715 845,144 317,542 209,639 230,253 5 4 Feb .................................................. 2,636,316 995,366 878,201 322,940 222,785 217,023 5 4 Mar .................................................. 2,675,019 1,031,783 880,646 322,672 222,785 217,132 5 2 Apr .................................................. 2,653,534 1,007,588 882,574 323,174 222,785 217,412 5 2 May ................................................. 2,666,851 1,020,653 885,966 319,770 222,785 217,678 5 3 June ................................................. 2,726,476 1,042,539 923,907 319,643 222,785 217,602 5 1
July .................................................. 2,759,673 1,066,487 922,326 330,539 222,785 217,536 5 1 Aug .................................................. 2,786,706 1,090,480 916,129 339,736 243,835 196,526 5 1 Sept ................................................. 2,804,092 1,057,049 955,239 351,552 243,755 196,497 5 1 Oct .................................................. 2,859,992 1,090,086 968,750 360,755 243,755 196,646 5 0 Nov .................................................. 2,877,933 1,127,794 953,987 355,619 243,755 196,778 5 0 Dec .................................................. 2,908,029 1,105,608 994,749 367,197 243,755 196,719 5 0
2004: Jan ................................................... 2,889,890 1,086,110 1,000,107 363,307 243,755 196,611 5 0 Feb .................................................. 2,967,133 1,149,251 998,984 378,812 243,520 196,566 4 11 Mar .................................................. 3,046,725 1,178,142 1,038,873 389,481 243,520 196,709 4 10 Apr .................................................. 3,019,341 1,125,763 1,054,136 389,995 243,520 196,928 4 11 May ................................................. 3,035,769 1,153,189 1,043,862 398,095 243,436 197,187 4 11 June ................................................. 3,067,768 1,136,300 1,082,581 408,129 243,436 197,323 4 11
July .................................................. 3,088,164 1,147,439 1,070,294 418,436 243,436 208,560 4 11 Aug .................................................. 3,145,333 1,148,585 1,137,991 406,590 243,436 208,731 4 11 Sept ................................................. 3,145,244 1,127,850 1,150,979 414,728 243,036 208,652 4 11 Oct .................................................. 3,166,311 1,143,145 1,137,251 434,604 242,636 208,675 4 10 Nov .................................................. 3,233,704 1,177,963 1,159,725 444,697 250,625 200,694 4 10 Dec .................................................. 3,225,653 1,149,591 1,170,576 453,993 250,625 200,868 4 10
1 In 2002, the average length calculation was revised to include Treasury inflation-protected securities.
Note.—Through fiscal year 1976, the fiscal year was on a July 1-June 30 basis; beginning October 1976 (fiscal year 1977), the fiscal year is on an October 1-September 30 basis.
Source: Department of the Treasury.
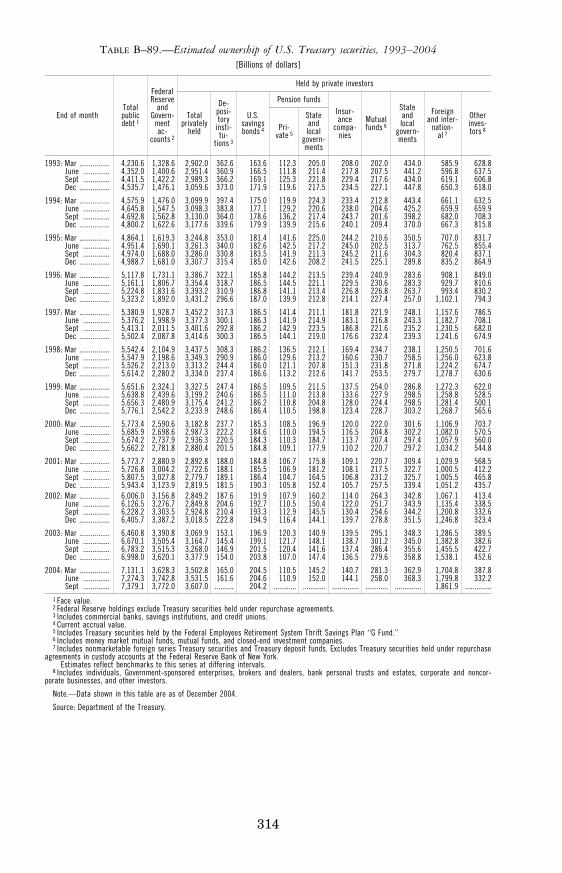
314
TABLE B–89.—Estimated ownership of U.S. Treasury securities, 1993–2004 [Billions of dollars]
End of month Total public debt 1
Federal Reserve
and Govern-
ment ac-
counts 2
Held by private investors
Total privately
held
De-posi-tory
insti-tu-
tions 3
U.S. savings bonds 4
Pension funds Insur-ance
compa-nies
Mutual funds 6
State and local
govern-ments
Foreign and inter-
nation- al 7
Other inves-tors 8 Pri-
vate 5
State and local
govern-ments
1993: Mar ................ 4,230.6 1,328.6 2,902.0 362.6 163.6 112.3 205.0 208.0 202.0 434.0 585.9 628.8 June .............. 4,352.0 1,400.6 2,951.4 360.9 166.5 111.8 211.4 217.8 207.5 441.2 596.8 637.5 Sept .............. 4,411.5 1,422.2 2,989.3 366.2 169.1 125.3 221.8 229.4 217.6 434.0 619.1 606.8 Dec ................ 4,535.7 1,476.1 3,059.6 373.0 171.9 119.6 217.5 234.5 227.1 447.8 650.3 618.0
1994: Mar ................ 4,575.9 1,476.0 3,099.9 397.4 175.0 119.9 224.3 233.4 212.8 443.4 661.1 632.5 June .............. 4,645.8 1,547.5 3,098.3 383.8 177.1 129.2 220.6 238.0 204.6 425.2 659.9 659.9 Sept .............. 4,692.8 1,562.8 3,130.0 364.0 178.6 136.2 217.4 243.7 201.6 398.2 682.0 708.3 Dec ................ 4,800.2 1,622.6 3,177.6 339.6 179.9 139.9 215.6 240.1 209.4 370.0 667.3 815.8
1995: Mar ................ 4,864.1 1,619.3 3,244.8 353.0 181.4 141.6 225.0 244.2 210.6 350.5 707.0 831.7 June .............. 4,951.4 1,690.1 3,261.3 340.0 182.6 142.5 217.2 245.0 202.5 313.7 762.5 855.4 Sept .............. 4,974.0 1,688.0 3,286.0 330.8 183.5 141.9 211.3 245.2 211.6 304.3 820.4 837.1 Dec ................ 4,988.7 1,681.0 3,307.7 315.4 185.0 142.6 208.2 241.5 225.1 289.8 835.2 864.9
1996: Mar ................ 5,117.8 1,731.1 3,386.7 322.1 185.8 144.2 213.5 239.4 240.9 283.6 908.1 849.0 June .............. 5,161.1 1,806.7 3,354.4 318.7 186.5 144.5 221.1 229.5 230.6 283.3 929.7 810.6 Sept .............. 5,224.8 1,831.6 3,393.2 310.9 186.8 141.1 213.4 226.8 226.8 263.7 993.4 830.2 Dec ................ 5,323.2 1,892.0 3,431.2 296.6 187.0 139.9 212.8 214.1 227.4 257.0 1,102.1 794.3
1997: Mar ................ 5,380.9 1,928.7 3,452.2 317.3 186.5 141.4 211.1 181.8 221.9 248.1 1,157.6 786.5 June .............. 5,376.2 1,998.9 3,377.3 300.1 186.3 141.9 214.9 183.1 216.8 243.3 1,182.7 708.1 Sept .............. 5,413.1 2,011.5 3,401.6 292.8 186.2 142.9 223.5 186.8 221.6 235.2 1,230.5 682.0 Dec ................ 5,502.4 2,087.8 3,414.6 300.3 186.5 144.1 219.0 176.6 232.4 239.3 1,241.6 674.9
1998: Mar ................ 5,542.4 2,104.9 3,437.5 308.3 186.2 136.5 212.1 169.4 234.7 238.1 1,250.5 701.6 June .............. 5,547.9 2,198.6 3,349.3 290.9 186.0 129.6 213.2 160.6 230.7 258.5 1,256.0 623.8 Sept .............. 5,526.2 2,213.0 3,313.2 244.4 186.0 121.1 207.8 151.3 231.8 271.8 1,224.2 674.7 Dec ................ 5,614.2 2,280.2 3,334.0 237.4 186.6 113.2 212.6 141.7 253.5 279.7 1,278.7 630.6
1999: Mar ................ 5,651.6 2,324.1 3,327.5 247.4 186.5 109.5 211.5 137.5 254.0 286.8 1,272.3 622.0 June .............. 5,638.8 2,439.6 3,199.2 240.6 186.5 111.0 213.8 133.6 227.9 298.5 1,258.8 528.5 Sept .............. 5,656.3 2,480.9 3,175.4 241.2 186.2 110.8 204.8 128.0 224.4 298.5 1,281.4 500.1 Dec ................ 5,776.1 2,542.2 3,233.9 248.6 186.4 110.5 198.8 123.4 228.7 303.2 1,268.7 565.6
2000: Mar ................ 5,773.4 2,590.6 3,182.8 237.7 185.3 108.5 196.9 120.0 222.0 301.6 1,106.9 703.7 June .............. 5,685.9 2,698.6 2,987.3 222.2 184.6 110.0 194.5 116.5 204.8 302.2 1,082.0 570.5 Sept .............. 5,674.2 2,737.9 2,936.3 220.5 184.3 110.3 184.7 113.7 207.4 297.4 1,057.9 560.0 Dec ................ 5,662.2 2,781.8 2,880.4 201.5 184.8 109.1 177.9 110.2 220.7 297.2 1,034.2 544.8
2001: Mar ................ 5,773.7 2,880.9 2,892.8 188.0 184.8 106.7 175.8 109.1 220.7 309.4 1,029.9 568.5 June .............. 5,726.8 3,004.2 2,722.6 188.1 185.5 106.9 181.2 108.1 217.5 322.7 1,000.5 412.2 Sept .............. 5,807.5 3,027.8 2,779.7 189.1 186.4 104.7 164.5 106.8 231.2 325.7 1,005.5 465.8 Dec ................ 5,943.4 3,123.9 2,819.5 181.5 190.3 105.8 152.4 105.7 257.5 339.4 1,051.2 435.7
2002: Mar ................ 6,006.0 3,156.8 2,849.2 187.6 191.9 107.9 160.2 114.0 264.3 342.8 1,067.1 413.4 June .............. 6,126.5 3,276.7 2,849.8 204.6 192.7 110.5 150.4 122.0 251.7 343.9 1,135.4 338.5 Sept .............. 6,228.2 3,303.5 2,924.8 210.4 193.3 112.9 145.5 130.4 254.6 344.2 1,200.8 332.6 Dec ................ 6,405.7 3,387.2 3,018.5 222.8 194.9 116.4 144.1 139.7 278.8 351.5 1,246.8 323.4
2003: Mar ................ 6,460.8 3,390.8 3,069.9 153.1 196.9 120.3 140.9 139.5 295.1 348.3 1,286.5 389.5 June .............. 6,670.1 3,505.4 3,164.7 145.4 199.1 121.7 148.1 138.7 301.2 345.0 1,382.8 382.6 Sept .............. 6,783.2 3,515.3 3,268.0 146.9 201.5 120.4 141.6 137.4 286.4 355.6 1,455.5 422.7 Dec ................ 6,998.0 3,620.1 3,377.9 154.0 203.8 107.0 147.4 136.5 279.6 358.8 1,538.1 452.6
2004: Mar ................ 7,131.1 3,628.3 3,502.8 165.0 204.5 110.5 145.2 140.7 281.3 362.9 1,704.8 387.8 June .............. 7,274.3 3,742.8 3,531.5 161.6 204.6 110.9 152.0 144.1 258.0 368.3 1,799.8 332.2 Sept .............. 7,379.1 3,772.0 3,607.0 .......... 204.2 ............ ............ .............. ............ .............. 1,861.9 ..............
1 Face value. 2 Federal Reserve holdings exclude Treasury securities held under repurchase agreements. 3 Includes commercial banks, savings institutions, and credit unions. 4 Current accrual value. 5 Includes Treasury securities held by the Federal Employees Retirement System Thrift Savings Plan ‘‘G Fund.’’ 6 Includes money market mutual funds, mutual funds, and closed-end investment companies. 7 Includes nonmarketable foreign series Treasury securities and Treasury deposit funds. Excludes Treasury securities held under repurchase
agreements in custody accounts at the Federal Reserve Bank of New York. Estimates reflect benchmarks to this series at differing intervals.
8 Includes individuals, Government-sponsored enterprises, brokers and dealers, bank personal trusts and estates, corporate and noncor-porate businesses, and other investors.
Note.—Data shown in this table are as of December 2004.
Source: Department of the Treasury.
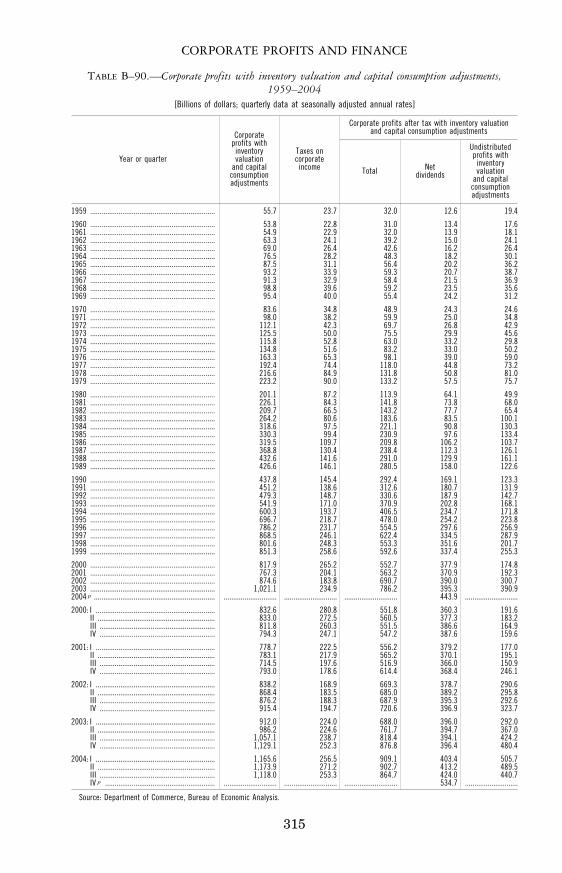
315
CORPORATE PROFITS AND FINANCE
TABLE B–90.—Corporate profits with inventory valuation and capital consumption adjustments, 1959–2004
[Billions of dollars; quarterly data at seasonally adjusted annual rates]
Year or quarter
Corporate profits with
inventory valuation
and capital consumption adjustments
Taxes on corporate income
Corporate profits after tax with inventory valuation and capital consumption adjustments
Total Net dividends
Undistributed profits with
inventory valuation
and capital consumption adjustments
1959 .................................................................. 55.7 23.7 32.0 12.6 19.4
1960 .................................................................. 53.8 22.8 31.0 13.4 17.6 1961 .................................................................. 54.9 22.9 32.0 13.9 18.1 1962 .................................................................. 63.3 24.1 39.2 15.0 24.1 1963 .................................................................. 69.0 26.4 42.6 16.2 26.4 1964 .................................................................. 76.5 28.2 48.3 18.2 30.1 1965 .................................................................. 87.5 31.1 56.4 20.2 36.2 1966 .................................................................. 93.2 33.9 59.3 20.7 38.7 1967 .................................................................. 91.3 32.9 58.4 21.5 36.9 1968 .................................................................. 98.8 39.6 59.2 23.5 35.6 1969 .................................................................. 95.4 40.0 55.4 24.2 31.2
1970 .................................................................. 83.6 34.8 48.9 24.3 24.6 1971 .................................................................. 98.0 38.2 59.9 25.0 34.8 1972 .................................................................. 112.1 42.3 69.7 26.8 42.9 1973 .................................................................. 125.5 50.0 75.5 29.9 45.6 1974 .................................................................. 115.8 52.8 63.0 33.2 29.8 1975 .................................................................. 134.8 51.6 83.2 33.0 50.2 1976 .................................................................. 163.3 65.3 98.1 39.0 59.0 1977 .................................................................. 192.4 74.4 118.0 44.8 73.2 1978 .................................................................. 216.6 84.9 131.8 50.8 81.0 1979 .................................................................. 223.2 90.0 133.2 57.5 75.7
1980 .................................................................. 201.1 87.2 113.9 64.1 49.9 1981 .................................................................. 226.1 84.3 141.8 73.8 68.0 1982 .................................................................. 209.7 66.5 143.2 77.7 65.4 1983 .................................................................. 264.2 80.6 183.6 83.5 100.1 1984 .................................................................. 318.6 97.5 221.1 90.8 130.3 1985 .................................................................. 330.3 99.4 230.9 97.6 133.4 1986 .................................................................. 319.5 109.7 209.8 106.2 103.7 1987 .................................................................. 368.8 130.4 238.4 112.3 126.1 1988 .................................................................. 432.6 141.6 291.0 129.9 161.1 1989 .................................................................. 426.6 146.1 280.5 158.0 122.6
1990 .................................................................. 437.8 145.4 292.4 169.1 123.3 1991 .................................................................. 451.2 138.6 312.6 180.7 131.9 1992 .................................................................. 479.3 148.7 330.6 187.9 142.7 1993 .................................................................. 541.9 171.0 370.9 202.8 168.1 1994 .................................................................. 600.3 193.7 406.5 234.7 171.8 1995 .................................................................. 696.7 218.7 478.0 254.2 223.8 1996 .................................................................. 786.2 231.7 554.5 297.6 256.9 1997 .................................................................. 868.5 246.1 622.4 334.5 287.9 1998 .................................................................. 801.6 248.3 553.3 351.6 201.7 1999 .................................................................. 851.3 258.6 592.6 337.4 255.3
2000 .................................................................. 817.9 265.2 552.7 377.9 174.8 2001 .................................................................. 767.3 204.1 563.2 370.9 192.3 2002 .................................................................. 874.6 183.8 690.7 390.0 300.7 2003 .................................................................. 1,021.1 234.9 786.2 395.3 390.9 2004 p ................................................................ ............................ ............................ ............................ 443.9 ............................
2000: I ............................................................... 832.6 280.8 551.8 360.3 191.6 II .............................................................. 833.0 272.5 560.5 377.3 183.2 III ............................................................. 811.8 260.3 551.5 386.6 164.9 IV ............................................................. 794.3 247.1 547.2 387.6 159.6
2001: I ............................................................... 778.7 222.5 556.2 379.2 177.0 II .............................................................. 783.1 217.9 565.2 370.1 195.1 III ............................................................. 714.5 197.6 516.9 366.0 150.9 IV ............................................................. 793.0 178.6 614.4 368.4 246.1
2002: I ............................................................... 838.2 168.9 669.3 378.7 290.6 II .............................................................. 868.4 183.5 685.0 389.2 295.8 III ............................................................. 876.2 188.3 687.9 395.3 292.6 IV ............................................................. 915.4 194.7 720.6 396.9 323.7
2003: I ............................................................... 912.0 224.0 688.0 396.0 292.0 II .............................................................. 986.2 224.6 761.7 394.7 367.0 III ............................................................. 1,057.1 238.7 818.4 394.1 424.2 IV ............................................................. 1,129.1 252.3 876.8 396.4 480.4
2004: I ............................................................... 1,165.6 256.5 909.1 403.4 505.7 II .............................................................. 1,173.9 271.2 902.7 413.2 489.5 III ............................................................. 1,118.0 253.3 864.7 424.0 440.7 IV p .......................................................... ............................ ............................ ............................ 534.7 ............................
Source: Department of Commerce, Bureau of Economic Analysis.
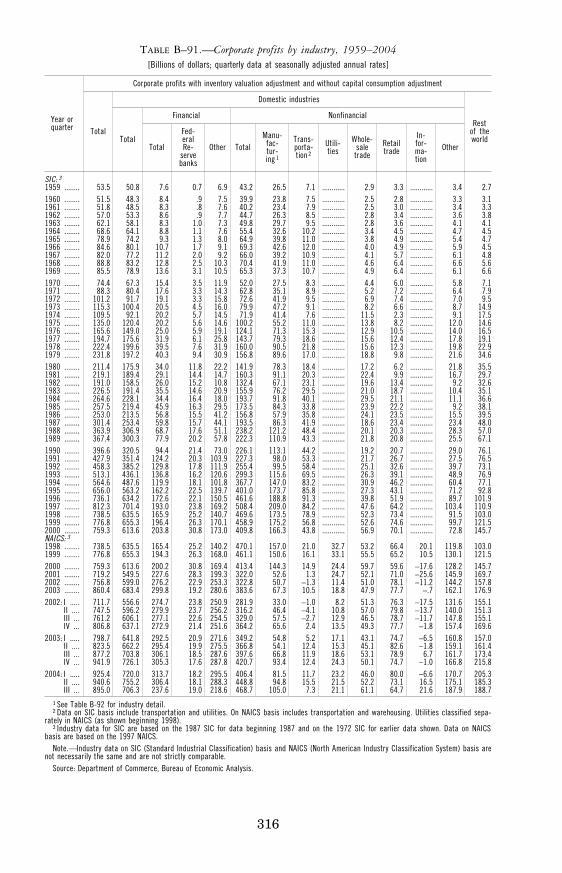
316
TABLE B–91.—Corporate profits by industry, 1959–2004 [Billions of dollars; quarterly data at seasonally adjusted annual rates]
Year or quarter
Corporate profits with inventory valuation adjustment and without capital consumption adjustment
Total
Domestic industries
Rest of the world Total
Financial Nonfinancial
Total
Fed- eral Re-
serve banks
Other Total Manu- fac- tur- ing 1
Trans- porta- tion 2
Utili- ties
Whole- sale trade
Retail trade
In- for- ma- tion
Other
SIC: 3 1959 ........ 53.5 50.8 7.6 0.7 6.9 43.2 26.5 7.1 ............ 2.9 3.3 ............ 3.4 2.7 1960 ........ 51.5 48.3 8.4 .9 7.5 39.9 23.8 7.5 ............ 2.5 2.8 ............ 3.3 3.1 1961 ........ 51.8 48.5 8.3 .8 7.6 40.2 23.4 7.9 ............ 2.5 3.0 ............ 3.4 3.3 1962 ........ 57.0 53.3 8.6 .9 7.7 44.7 26.3 8.5 ............ 2.8 3.4 ............ 3.6 3.8 1963 ........ 62.1 58.1 8.3 1.0 7.3 49.8 29.7 9.5 ............ 2.8 3.6 ............ 4.1 4.1 1964 ........ 68.6 64.1 8.8 1.1 7.6 55.4 32.6 10.2 ............ 3.4 4.5 ............ 4.7 4.5 1965 ........ 78.9 74.2 9.3 1.3 8.0 64.9 39.8 11.0 ............ 3.8 4.9 ............ 5.4 4.7 1966 ........ 84.6 80.1 10.7 1.7 9.1 69.3 42.6 12.0 ............ 4.0 4.9 ............ 5.9 4.5 1967 ........ 82.0 77.2 11.2 2.0 9.2 66.0 39.2 10.9 ............ 4.1 5.7 ............ 6.1 4.8 1968 ........ 88.8 83.2 12.8 2.5 10.3 70.4 41.9 11.0 ............ 4.6 6.4 ............ 6.6 5.6 1969 ........ 85.5 78.9 13.6 3.1 10.5 65.3 37.3 10.7 ............ 4.9 6.4 ............ 6.1 6.6 1970 ........ 74.4 67.3 15.4 3.5 11.9 52.0 27.5 8.3 ............ 4.4 6.0 ............ 5.8 7.1 1971 ........ 88.3 80.4 17.6 3.3 14.3 62.8 35.1 8.9 ............ 5.2 7.2 ............ 6.4 7.9 1972 ........ 101.2 91.7 19.1 3.3 15.8 72.6 41.9 9.5 ............ 6.9 7.4 ............ 7.0 9.5 1973 ........ 115.3 100.4 20.5 4.5 16.0 79.9 47.2 9.1 ............ 8.2 6.6 ............ 8.7 14.9 1974 ........ 109.5 92.1 20.2 5.7 14.5 71.9 41.4 7.6 ............ 11.5 2.3 ............ 9.1 17.5 1975 ........ 135.0 120.4 20.2 5.6 14.6 100.2 55.2 11.0 ............ 13.8 8.2 ............ 12.0 14.6 1976 ........ 165.6 149.0 25.0 5.9 19.1 124.1 71.3 15.3 ............ 12.9 10.5 ............ 14.0 16.5 1977 ........ 194.7 175.6 31.9 6.1 25.8 143.7 79.3 18.6 ............ 15.6 12.4 ............ 17.8 19.1 1978 ........ 222.4 199.6 39.5 7.6 31.9 160.0 90.5 21.8 ............ 15.6 12.3 ............ 19.8 22.9 1979 ........ 231.8 197.2 40.3 9.4 30.9 156.8 89.6 17.0 ............ 18.8 9.8 ............ 21.6 34.6 1980 ........ 211.4 175.9 34.0 11.8 22.2 141.9 78.3 18.4 ............ 17.2 6.2 ............ 21.8 35.5 1981 ........ 219.1 189.4 29.1 14.4 14.7 160.3 91.1 20.3 ............ 22.4 9.9 ............ 16.7 29.7 1982 ........ 191.0 158.5 26.0 15.2 10.8 132.4 67.1 23.1 ............ 19.6 13.4 ............ 9.2 32.6 1983 ........ 226.5 191.4 35.5 14.6 20.9 155.9 76.2 29.5 ............ 21.0 18.7 ............ 10.4 35.1 1984 ........ 264.6 228.1 34.4 16.4 18.0 193.7 91.8 40.1 ............ 29.5 21.1 ............ 11.1 36.6 1985 ........ 257.5 219.4 45.9 16.3 29.5 173.5 84.3 33.8 ............ 23.9 22.2 ............ 9.2 38.1 1986 ........ 253.0 213.5 56.8 15.5 41.2 156.8 57.9 35.8 ............ 24.1 23.5 ............ 15.5 39.5 1987 ........ 301.4 253.4 59.8 15.7 44.1 193.5 86.3 41.9 ............ 18.6 23.4 ............ 23.4 48.0 1988 ........ 363.9 306.9 68.7 17.6 51.1 238.2 121.2 48.4 ............ 20.1 20.3 ............ 28.3 57.0 1989 ........ 367.4 300.3 77.9 20.2 57.8 222.3 110.9 43.3 ............ 21.8 20.8 ............ 25.5 67.1 1990 ........ 396.6 320.5 94.4 21.4 73.0 226.1 113.1 44.2 ............ 19.2 20.7 ............ 29.0 76.1 1991 ........ 427.9 351.4 124.2 20.3 103.9 227.3 98.0 53.3 ............ 21.7 26.7 ............ 27.5 76.5 1992 ........ 458.3 385.2 129.8 17.8 111.9 255.4 99.5 58.4 ............ 25.1 32.6 ............ 39.7 73.1 1993 ........ 513.1 436.1 136.8 16.2 120.6 299.3 115.6 69.5 ............ 26.3 39.1 ............ 48.9 76.9 1994 ........ 564.6 487.6 119.9 18.1 101.8 367.7 147.0 83.2 ............ 30.9 46.2 ............ 60.4 77.1 1995 ........ 656.0 563.2 162.2 22.5 139.7 401.0 173.7 85.8 ............ 27.3 43.1 ............ 71.2 92.8 1996 ........ 736.1 634.2 172.6 22.1 150.5 461.6 188.8 91.3 ............ 39.8 51.9 ............ 89.7 101.9 1997 ........ 812.3 701.4 193.0 23.8 169.2 508.4 209.0 84.2 ............ 47.6 64.2 ............ 103.4 110.9 1998 ........ 738.5 635.5 165.9 25.2 140.7 469.6 173.5 78.9 ............ 52.3 73.4 ............ 91.5 103.0 1999 ........ 776.8 655.3 196.4 26.3 170.1 458.9 175.2 56.8 ............ 52.6 74.6 ............ 99.7 121.5 2000 ........ 759.3 613.6 203.8 30.8 173.0 409.8 166.3 43.8 ............ 56.9 70.1 ............ 72.8 145.7 NAICS: 3 1998 ........ 738.5 635.5 165.4 25.2 140.2 470.1 157.0 21.0 32.7 53.2 66.4 20.1 119.8 103.0 1999 ........ 776.8 655.3 194.3 26.3 168.0 461.1 150.6 16.1 33.1 55.5 65.2 10.5 130.1 121.5 2000 ........ 759.3 613.6 200.2 30.8 169.4 413.4 144.3 14.9 24.4 59.7 59.6 −17.6 128.2 145.7 2001 ........ 719.2 549.5 227.6 28.3 199.3 322.0 52.6 1.3 24.7 52.1 71.0 −25.6 145.9 169.7 2002 ........ 756.8 599.0 276.2 22.9 253.3 322.8 50.7 −1.3 11.4 51.0 78.1 −11.2 144.2 157.8 2003 ........ 860.4 683.4 299.8 19.2 280.6 383.6 67.3 10.5 18.8 47.9 77.7 −.7 162.1 176.9 2002: I ..... 711.7 556.6 274.7 23.8 250.9 281.9 33.0 −1.0 8.2 51.3 76.3 −17.5 131.6 155.1
II .... 747.5 596.2 279.9 23.7 256.2 316.2 46.4 −4.1 10.8 57.0 79.8 −13.7 140.0 151.3 III ... 761.2 606.1 277.1 22.6 254.5 329.0 57.5 −2.7 12.9 46.5 78.7 −11.7 147.8 155.1 IV ... 806.8 637.1 272.9 21.4 251.6 364.2 65.6 2.4 13.5 49.3 77.7 −1.8 157.4 169.6
2003: I ..... 798.7 641.8 292.5 20.9 271.6 349.2 54.8 5.2 17.1 43.1 74.7 −6.5 160.8 157.0 II .... 823.5 662.2 295.4 19.9 275.5 366.8 54.1 12.4 15.3 45.1 82.6 −1.8 159.1 161.4 III ... 877.2 703.8 306.1 18.5 287.6 397.6 66.8 11.9 18.6 53.1 78.9 6.7 161.7 173.4 IV ... 941.9 726.1 305.3 17.6 287.8 420.7 93.4 12.4 24.3 50.1 74.7 −1.0 166.8 215.8
2004: I ..... 925.4 720.0 313.7 18.2 295.5 406.4 81.5 11.7 23.2 46.0 80.0 −6.6 170.7 205.3 II .... 940.6 755.2 306.4 18.1 288.3 448.8 94.8 15.5 21.5 52.2 73.1 16.5 175.1 185.3 III ... 895.0 706.3 237.6 19.0 218.6 468.7 105.0 7.3 21.1 61.1 64.7 21.6 187.9 188.7
1 See Table B-92 for industry detail. 2 Data on SIC basis include transportation and utilities. On NAICS basis includes transportation and warehousing. Utilities classified sepa-
rately in NAICS (as shown beginning 1998). 3 Industry data for SIC are based on the 1987 SIC for data beginning 1987 and on the 1972 SIC for earlier data shown. Data on NAICS
basis are based on the 1997 NAICS. Note.—Industry data on SIC (Standard Industrial Classification) basis and NAICS (North American Industry Classification System) basis are
not necessarily the same and are not strictly comparable. Source: Department of Commerce, Bureau of Economic Analysis.
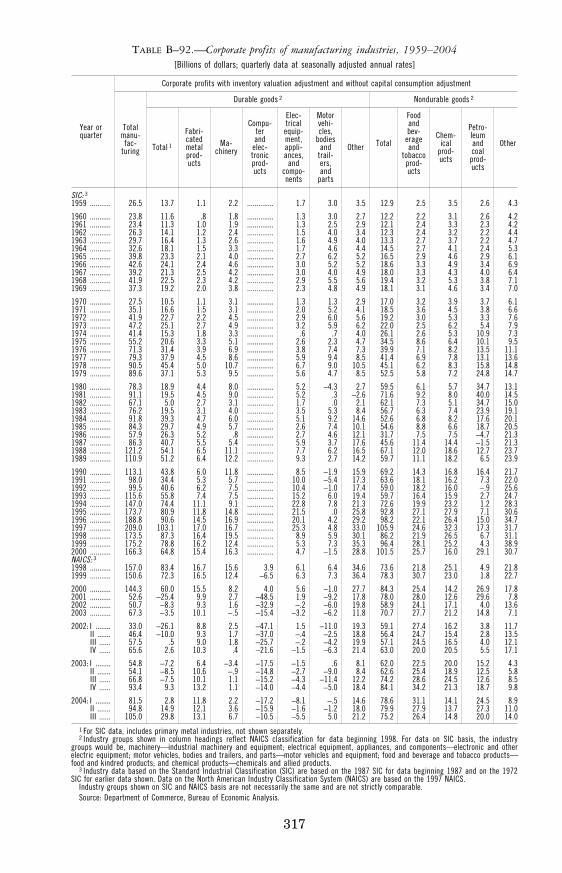
317
TABLE B–92.—Corporate profits of manufacturing industries, 1959–2004 [Billions of dollars; quarterly data at seasonally adjusted annual rates]
Year or quarter
Corporate profits with inventory valuation adjustment and without capital consumption adjustment
Total manu- fac-
turing
Durable goods 2 Nondurable goods 2
Total 1
Fabri- cated metal prod- ucts
Ma-chinery
Compu- ter and elec- tronic prod- ucts
Elec-trical equip-ment, appli- ances,
and compo- nents
Motor vehi-cles,
bodies and
trail-ers, and
parts
Other Total
Food and bev-
erage and
tobacco prod- ucts
Chem- ical
prod- ucts
Petro- leum and coal
prod- ucts
Other
SIC: 3 1959 ........... 26.5 13.7 1.1 2.2 .............. 1.7 3.0 3.5 12.9 2.5 3.5 2.6 4.3
1960 ........... 23.8 11.6 .8 1.8 .............. 1.3 3.0 2.7 12.2 2.2 3.1 2.6 4.2 1961 ........... 23.4 11.3 1.0 1.9 .............. 1.3 2.5 2.9 12.1 2.4 3.3 2.3 4.2 1962 ........... 26.3 14.1 1.2 2.4 .............. 1.5 4.0 3.4 12.3 2.4 3.2 2.2 4.4 1963 ........... 29.7 16.4 1.3 2.6 .............. 1.6 4.9 4.0 13.3 2.7 3.7 2.2 4.7 1964 ........... 32.6 18.1 1.5 3.3 .............. 1.7 4.6 4.4 14.5 2.7 4.1 2.4 5.3 1965 ........... 39.8 23.3 2.1 4.0 .............. 2.7 6.2 5.2 16.5 2.9 4.6 2.9 6.1 1966 ........... 42.6 24.1 2.4 4.6 .............. 3.0 5.2 5.2 18.6 3.3 4.9 3.4 6.9 1967 ........... 39.2 21.3 2.5 4.2 .............. 3.0 4.0 4.9 18.0 3.3 4.3 4.0 6.4 1968 ........... 41.9 22.5 2.3 4.2 .............. 2.9 5.5 5.6 19.4 3.2 5.3 3.8 7.1 1969 ........... 37.3 19.2 2.0 3.8 .............. 2.3 4.8 4.9 18.1 3.1 4.6 3.4 7.0
1970 ........... 27.5 10.5 1.1 3.1 .............. 1.3 1.3 2.9 17.0 3.2 3.9 3.7 6.1 1971 ........... 35.1 16.6 1.5 3.1 .............. 2.0 5.2 4.1 18.5 3.6 4.5 3.8 6.6 1972 ........... 41.9 22.7 2.2 4.5 .............. 2.9 6.0 5.6 19.2 3.0 5.3 3.3 7.6 1973 ........... 47.2 25.1 2.7 4.9 .............. 3.2 5.9 6.2 22.0 2.5 6.2 5.4 7.9 1974 ........... 41.4 15.3 1.8 3.3 .............. .6 .7 4.0 26.1 2.6 5.3 10.9 7.3 1975 ........... 55.2 20.6 3.3 5.1 .............. 2.6 2.3 4.7 34.5 8.6 6.4 10.1 9.5 1976 ........... 71.3 31.4 3.9 6.9 .............. 3.8 7.4 7.3 39.9 7.1 8.2 13.5 11.1 1977 ........... 79.3 37.9 4.5 8.6 .............. 5.9 9.4 8.5 41.4 6.9 7.8 13.1 13.6 1978 ........... 90.5 45.4 5.0 10.7 .............. 6.7 9.0 10.5 45.1 6.2 8.3 15.8 14.8 1979 ........... 89.6 37.1 5.3 9.5 .............. 5.6 4.7 8.5 52.5 5.8 7.2 24.8 14.7
1980 ........... 78.3 18.9 4.4 8.0 .............. 5.2 −4.3 2.7 59.5 6.1 5.7 34.7 13.1 1981 ........... 91.1 19.5 4.5 9.0 .............. 5.2 .3 −2.6 71.6 9.2 8.0 40.0 14.5 1982 ........... 67.1 5.0 2.7 3.1 .............. 1.7 .0 2.1 62.1 7.3 5.1 34.7 15.0 1983 ........... 76.2 19.5 3.1 4.0 .............. 3.5 5.3 8.4 56.7 6.3 7.4 23.9 19.1 1984 ........... 91.8 39.3 4.7 6.0 .............. 5.1 9.2 14.6 52.6 6.8 8.2 17.6 20.1 1985 ........... 84.3 29.7 4.9 5.7 .............. 2.6 7.4 10.1 54.6 8.8 6.6 18.7 20.5 1986 ........... 57.9 26.3 5.2 .8 .............. 2.7 4.6 12.1 31.7 7.5 7.5 −4.7 21.3 1987 ........... 86.3 40.7 5.5 5.4 .............. 5.9 3.7 17.6 45.6 11.4 14.4 −1.5 21.3 1988 ........... 121.2 54.1 6.5 11.1 .............. 7.7 6.2 16.5 67.1 12.0 18.6 12.7 23.7 1989 ........... 110.9 51.2 6.4 12.2 .............. 9.3 2.7 14.2 59.7 11.1 18.2 6.5 23.9
1990 ........... 113.1 43.8 6.0 11.8 .............. 8.5 −1.9 15.9 69.2 14.3 16.8 16.4 21.7 1991 ........... 98.0 34.4 5.3 5.7 .............. 10.0 −5.4 17.3 63.6 18.1 16.2 7.3 22.0 1992 ........... 99.5 40.6 6.2 7.5 .............. 10.4 −1.0 17.4 59.0 18.2 16.0 −.9 25.6 1993 ........... 115.6 55.8 7.4 7.5 .............. 15.2 6.0 19.4 59.7 16.4 15.9 2.7 24.7 1994 ........... 147.0 74.4 11.1 9.1 .............. 22.8 7.8 21.3 72.6 19.9 23.2 1.2 28.3 1995 ........... 173.7 80.9 11.8 14.8 .............. 21.5 .0 25.8 92.8 27.1 27.9 7.1 30.6 1996 ........... 188.8 90.6 14.5 16.9 .............. 20.1 4.2 29.2 98.2 22.1 26.4 15.0 34.7 1997 ........... 209.0 103.1 17.0 16.7 .............. 25.3 4.8 33.0 105.9 24.6 32.3 17.3 31.7 1998 ........... 173.5 87.3 16.4 19.5 .............. 8.9 5.9 30.1 86.2 21.9 26.5 6.7 31.1 1999 ........... 175.2 78.8 16.2 12.4 .............. 5.3 7.3 35.3 96.4 28.1 25.2 4.3 38.9 2000 ........... 166.3 64.8 15.4 16.3 .............. 4.7 −1.5 28.8 101.5 25.7 16.0 29.1 30.7 NAICS: 3 1998 ........... 157.0 83.4 16.7 15.6 3.9 6.1 6.4 34.6 73.6 21.8 25.1 4.9 21.8 1999 ........... 150.6 72.3 16.5 12.4 −6.5 6.3 7.3 36.4 78.3 30.7 23.0 1.8 22.7
2000 ........... 144.3 60.0 15.5 8.2 4.0 5.6 −1.0 27.7 84.3 25.4 14.2 26.9 17.8 2001 ........... 52.6 −25.4 9.9 2.7 −48.5 1.9 −9.2 17.8 78.0 28.0 12.6 29.6 7.8 2002 ........... 50.7 −8.3 9.3 1.6 −32.9 −.2 −6.0 19.8 58.9 24.1 17.1 4.0 13.6 2003 ........... 67.3 −3.5 10.1 −.5 −15.4 −3.2 −6.2 11.8 70.7 27.7 21.2 14.8 7.1
2002: I ........ 33.0 −26.1 8.8 2.5 −47.1 1.5 −11.0 19.3 59.1 27.4 16.2 3.8 11.7 II ....... 46.4 −10.0 9.3 1.7 −37.0 −.4 −2.5 18.8 56.4 24.7 15.4 2.8 13.5 III ...... 57.5 .5 9.0 1.8 −25.7 −.2 −4.2 19.9 57.1 24.5 16.5 4.0 12.1 IV ...... 65.6 2.6 10.3 .4 −21.6 −1.5 −6.3 21.4 63.0 20.0 20.5 5.5 17.1
2003: I ........ 54.8 −7.2 6.4 −3.4 −17.5 −1.5 .6 8.1 62.0 22.5 20.0 15.2 4.3 II ....... 54.1 −8.5 10.6 −.9 −14.8 −2.7 −9.0 8.4 62.6 25.4 18.9 12.5 5.8 III ...... 66.8 −7.5 10.1 1.1 −15.2 −4.3 −11.4 12.2 74.2 28.6 24.5 12.6 8.5 IV ...... 93.4 9.3 13.2 1.1 −14.0 −4.4 −5.0 18.4 84.1 34.2 21.3 18.7 9.8
2004: I ........ 81.5 2.8 11.8 2.2 −17.2 −8.1 −.5 14.6 78.6 31.1 14.1 24.5 8.9 II ....... 94.8 14.9 12.1 3.6 −15.9 −1.6 −1.2 18.0 79.9 27.9 13.7 27.3 11.0 III ...... 105.0 29.8 13.1 6.7 −10.5 −5.5 5.0 21.2 75.2 26.4 14.8 20.0 14.0
1 For SIC data, includes primary metal industries, not shown separately. 2 Industry groups shown in column headings reflect NAICS classification for data beginning 1998. For data on SIC basis, the industry
groups would be, machinery—industrial machinery and equipment; electrical equipment, appliances, and components—electronic and other electric equipment; motor vehicles, bodies and trailers, and parts—motor vehicles and equipment; food and beverage and tobacco products— food and kindred products; and chemical products—chemicals and allied products.
3 Industry data based on the Standard Industrial Classification (SIC) are based on the 1987 SIC for data beginning 1987 and on the 1972 SIC for earlier data shown. Data on the North American Industry Classification System (NAICS) are based on the 1997 NAICS.
Industry groups shown on SIC and NAICS basis are not necessarily the same and are not strictly comparable. Source: Department of Commerce, Bureau of Economic Analysis.
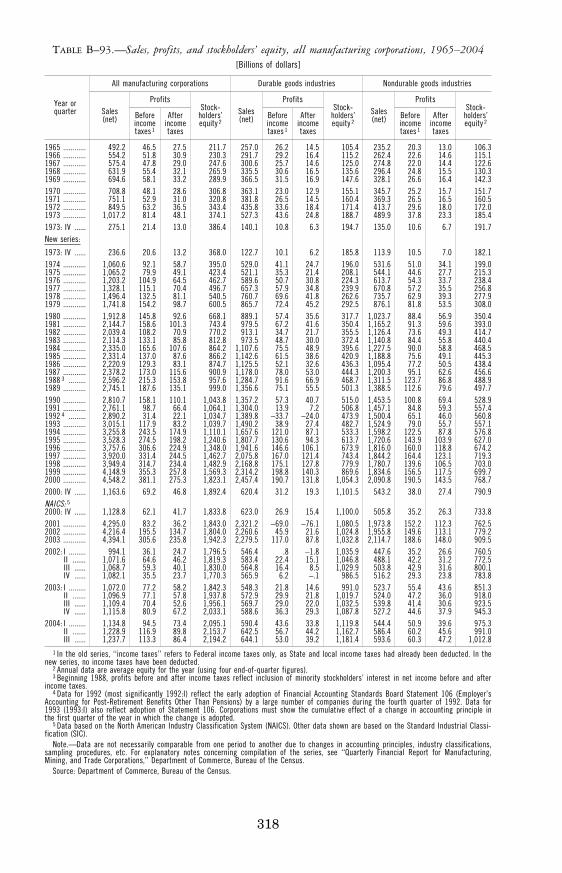
318
TABLE B–93.—Sales, profits, and stockholders’ equity, all manufacturing corporations, 1965–2004 [Billions of dollars]
Year or quarter
All manufacturing corporations Durable goods industries Nondurable goods industries
Sales (net)
Profits Stock-
holders’ equity 2
Sales (net)
Profits Stock-
holders’ equity 2
Sales (net)
Profits Stock-
holders’ equity 2
Before income taxes 1
After income taxes
Before income taxes 1
After income taxes
Before income taxes 1
After income taxes
1965 ............ 492.2 46.5 27.5 211.7 257.0 26.2 14.5 105.4 235.2 20.3 13.0 106.3 1966 ............ 554.2 51.8 30.9 230.3 291.7 29.2 16.4 115.2 262.4 22.6 14.6 115.1 1967 ............ 575.4 47.8 29.0 247.6 300.6 25.7 14.6 125.0 274.8 22.0 14.4 122.6 1968 ............ 631.9 55.4 32.1 265.9 335.5 30.6 16.5 135.6 296.4 24.8 15.5 130.3 1969 ............ 694.6 58.1 33.2 289.9 366.5 31.5 16.9 147.6 328.1 26.6 16.4 142.3 1970 ............ 708.8 48.1 28.6 306.8 363.1 23.0 12.9 155.1 345.7 25.2 15.7 151.7 1971 ............ 751.1 52.9 31.0 320.8 381.8 26.5 14.5 160.4 369.3 26.5 16.5 160.5 1972 ............ 849.5 63.2 36.5 343.4 435.8 33.6 18.4 171.4 413.7 29.6 18.0 172.0 1973 ............ 1,017.2 81.4 48.1 374.1 527.3 43.6 24.8 188.7 489.9 37.8 23.3 185.4 1973: IV ...... 275.1 21.4 13.0 386.4 140.1 10.8 6.3 194.7 135.0 10.6 6.7 191.7 New series:
1973: IV ...... 236.6 20.6 13.2 368.0 122.7 10.1 6.2 185.8 113.9 10.5 7.0 182.1 1974 ............ 1,060.6 92.1 58.7 395.0 529.0 41.1 24.7 196.0 531.6 51.0 34.1 199.0 1975 ............ 1,065.2 79.9 49.1 423.4 521.1 35.3 21.4 208.1 544.1 44.6 27.7 215.3 1976 ............ 1,203.2 104.9 64.5 462.7 589.6 50.7 30.8 224.3 613.7 54.3 33.7 238.4 1977 ............ 1,328.1 115.1 70.4 496.7 657.3 57.9 34.8 239.9 670.8 57.2 35.5 256.8 1978 ............ 1,496.4 132.5 81.1 540.5 760.7 69.6 41.8 262.6 735.7 62.9 39.3 277.9 1979 ............ 1,741.8 154.2 98.7 600.5 865.7 72.4 45.2 292.5 876.1 81.8 53.5 308.0 1980 ............ 1,912.8 145.8 92.6 668.1 889.1 57.4 35.6 317.7 1,023.7 88.4 56.9 350.4 1981 ............ 2,144.7 158.6 101.3 743.4 979.5 67.2 41.6 350.4 1,165.2 91.3 59.6 393.0 1982 ............ 2,039.4 108.2 70.9 770.2 913.1 34.7 21.7 355.5 1,126.4 73.6 49.3 414.7 1983 ............ 2,114.3 133.1 85.8 812.8 973.5 48.7 30.0 372.4 1,140.8 84.4 55.8 440.4 1984 ............ 2,335.0 165.6 107.6 864.2 1,107.6 75.5 48.9 395.6 1,227.5 90.0 58.8 468.5 1985 ............ 2,331.4 137.0 87.6 866.2 1,142.6 61.5 38.6 420.9 1,188.8 75.6 49.1 445.3 1986 ............ 2,220.9 129.3 83.1 874.7 1,125.5 52.1 32.6 436.3 1,095.4 77.2 50.5 438.4 1987 ............ 2,378.2 173.0 115.6 900.9 1,178.0 78.0 53.0 444.3 1,200.3 95.1 62.6 456.6 1988 3 ......... 2,596.2 215.3 153.8 957.6 1,284.7 91.6 66.9 468.7 1,311.5 123.7 86.8 488.9 1989 ............ 2,745.1 187.6 135.1 999.0 1,356.6 75.1 55.5 501.3 1,388.5 112.6 79.6 497.7 1990 ............ 2,810.7 158.1 110.1 1,043.8 1,357.2 57.3 40.7 515.0 1,453.5 100.8 69.4 528.9 1991 ............ 2,761.1 98.7 66.4 1,064.1 1,304.0 13.9 7.2 506.8 1,457.1 84.8 59.3 557.4 1992 4 ......... 2,890.2 31.4 22.1 1,034.7 1,389.8 −33.7 −24.0 473.9 1,500.4 65.1 46.0 560.8 1993 ............ 3,015.1 117.9 83.2 1,039.7 1,490.2 38.9 27.4 482.7 1,524.9 79.0 55.7 557.1 1994 ............ 3,255.8 243.5 174.9 1,110.1 1,657.6 121.0 87.1 533.3 1,598.2 122.5 87.8 576.8 1995 ............ 3,528.3 274.5 198.2 1,240.6 1,807.7 130.6 94.3 613.7 1,720.6 143.9 103.9 627.0 1996 ............ 3,757.6 306.6 224.9 1,348.0 1,941.6 146.6 106.1 673.9 1,816.0 160.0 118.8 674.2 1997 ............ 3,920.0 331.4 244.5 1,462.7 2,075.8 167.0 121.4 743.4 1,844.2 164.4 123.1 719.3 1998 ............ 3,949.4 314.7 234.4 1,482.9 2,168.8 175.1 127.8 779.9 1,780.7 139.6 106.5 703.0 1999 ............ 4,148.9 355.3 257.8 1,569.3 2,314.2 198.8 140.3 869.6 1,834.6 156.5 117.5 699.7 2000 ............ 4,548.2 381.1 275.3 1,823.1 2,457.4 190.7 131.8 1,054.3 2,090.8 190.5 143.5 768.7 2000: IV ...... 1,163.6 69.2 46.8 1,892.4 620.4 31.2 19.3 1,101.5 543.2 38.0 27.4 790.9 NAICS: 5 2000: IV ...... 1,128.8 62.1 41.7 1,833.8 623.0 26.9 15.4 1,100.0 505.8 35.2 26.3 733.8 2001 ............ 4,295.0 83.2 36.2 1,843.0 2,321.2 −69.0 −76.1 1,080.5 1,973.8 152.2 112.3 762.5 2002 ............ 4,216.4 195.5 134.7 1,804.0 2,260.6 45.9 21.6 1,024.8 1,955.8 149.6 113.1 779.2 2003 ............ 4,394.1 305.6 235.8 1,942.3 2,279.5 117.0 87.8 1,032.8 2,114.7 188.6 148.0 909.5 2002: I ......... 994.1 36.1 24.7 1,796.5 546.4 .8 −1.8 1,035.9 447.6 35.2 26.6 760.5
II ....... 1,071.6 64.6 46.2 1,819.3 583.4 22.4 15.1 1,046.8 488.1 42.2 31.2 772.5 III ...... 1,068.7 59.3 40.1 1,830.0 564.8 16.4 8.5 1,029.9 503.8 42.9 31.6 800.1 IV ...... 1,082.1 35.5 23.7 1,770.3 565.9 6.2 −.1 986.5 516.2 29.3 23.8 783.8
2003: I ......... 1,072.0 77.2 58.2 1,842.3 548.3 21.8 14.6 991.0 523.7 55.4 43.6 851.3 II ....... 1,096.9 77.1 57.8 1,937.8 572.9 29.9 21.8 1,019.7 524.0 47.2 36.0 918.0 III ...... 1,109.4 70.4 52.6 1,956.1 569.7 29.0 22.0 1,032.5 539.8 41.4 30.6 923.5 IV ...... 1,115.8 80.9 67.2 2,033.1 588.6 36.3 29.3 1,087.8 527.2 44.6 37.9 945.3
2004: I ......... 1,134.8 94.5 73.4 2,095.1 590.4 43.6 33.8 1,119.8 544.4 50.9 39.6 975.3 II ....... 1,228.9 116.9 89.8 2,153.7 642.5 56.7 44.2 1,162.7 586.4 60.2 45.6 991.0 III ...... 1,237.7 113.3 86.4 2,194.2 644.1 53.0 39.2 1,181.4 593.6 60.3 47.2 1,012.8
1 In the old series, ‘‘income taxes’’ refers to Federal income taxes only, as State and local income taxes had already been deducted. In the new series, no income taxes have been deducted.
2 Annual data are average equity for the year (using four end-of-quarter figures). 3 Beginning 1988, profits before and after income taxes reflect inclusion of minority stockholders’ interest in net income before and after
income taxes. 4 Data for 1992 (most significantly 1992:I) reflect the early adoption of Financial Accounting Standards Board Statement 106 (Employer’s
Accounting for Post-Retirement Benefits Other Than Pensions) by a large number of companies during the fourth quarter of 1992. Data for 1993 (1993:I) also reflect adoption of Statement 106. Corporations must show the cumulative effect of a change in accounting principle in the first quarter of the year in which the change is adopted.
5 Data based on the North American Industry Classification System (NAICS). Other data shown are based on the Standard Industrial Classi-fication (SIC).
Note.—Data are not necessarily comparable from one period to another due to changes in accounting principles, industry classifications, sampling procedures, etc. For explanatory notes concerning compilation of the series, see ‘‘Quarterly Financial Report for Manufacturing, Mining, and Trade Corporations,’’ Department of Commerce, Bureau of the Census.
Source: Department of Commerce, Bureau of the Census.
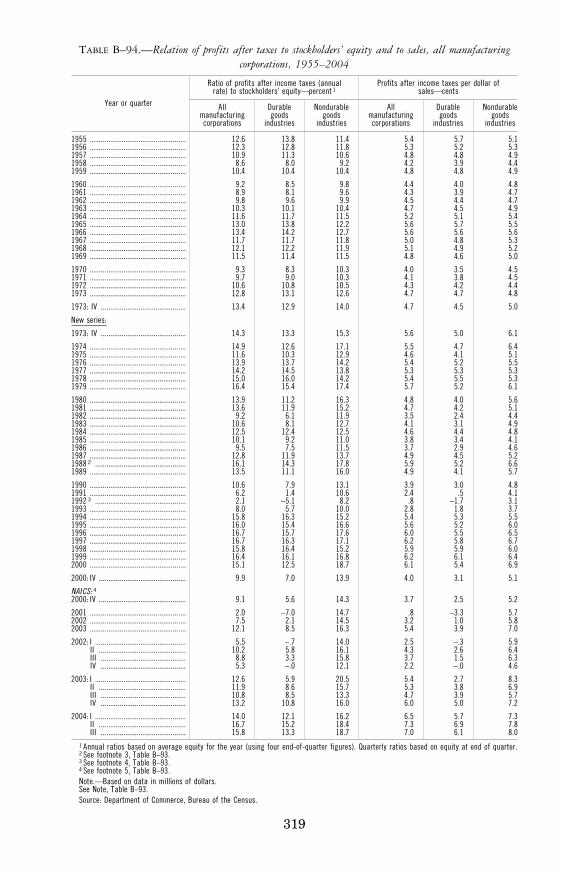
319
TABLE B–94.—Relation of profits after taxes to stockholders’ equity and to sales, all manufacturing corporations, 1955–2004
Year or quarter
Ratio of profits after income taxes (annual rate) to stockholders’ equity—percent 1
Profits after income taxes per dollar of sales—cents
All manufacturing corporations
Durable goods
industries
Nondurable goods
industries
All manufacturing corporations
Durable goods
industries
Nondurable goods
industries
1955 ................................................... 12.6 13.8 11.4 5.4 5.7 5.1 1956 ................................................... 12.3 12.8 11.8 5.3 5.2 5.3 1957 ................................................... 10.9 11.3 10.6 4.8 4.8 4.9 1958 ................................................... 8.6 8.0 9.2 4.2 3.9 4.4 1959 ................................................... 10.4 10.4 10.4 4.8 4.8 4.9
1960 ................................................... 9.2 8.5 9.8 4.4 4.0 4.8 1961 ................................................... 8.9 8.1 9.6 4.3 3.9 4.7 1962 ................................................... 9.8 9.6 9.9 4.5 4.4 4.7 1963 ................................................... 10.3 10.1 10.4 4.7 4.5 4.9 1964 ................................................... 11.6 11.7 11.5 5.2 5.1 5.4 1965 ................................................... 13.0 13.8 12.2 5.6 5.7 5.5 1966 ................................................... 13.4 14.2 12.7 5.6 5.6 5.6 1967 ................................................... 11.7 11.7 11.8 5.0 4.8 5.3 1968 ................................................... 12.1 12.2 11.9 5.1 4.9 5.2 1969 ................................................... 11.5 11.4 11.5 4.8 4.6 5.0
1970 ................................................... 9.3 8.3 10.3 4.0 3.5 4.5 1971 ................................................... 9.7 9.0 10.3 4.1 3.8 4.5 1972 ................................................... 10.6 10.8 10.5 4.3 4.2 4.4 1973 ................................................... 12.8 13.1 12.6 4.7 4.7 4.8
1973: IV ............................................. 13.4 12.9 14.0 4.7 4.5 5.0
New series:
1973: IV ............................................. 14.3 13.3 15.3 5.6 5.0 6.1
1974 ................................................... 14.9 12.6 17.1 5.5 4.7 6.4 1975 ................................................... 11.6 10.3 12.9 4.6 4.1 5.1 1976 ................................................... 13.9 13.7 14.2 5.4 5.2 5.5 1977 ................................................... 14.2 14.5 13.8 5.3 5.3 5.3 1978 ................................................... 15.0 16.0 14.2 5.4 5.5 5.3 1979 ................................................... 16.4 15.4 17.4 5.7 5.2 6.1
1980 ................................................... 13.9 11.2 16.3 4.8 4.0 5.6 1981 ................................................... 13.6 11.9 15.2 4.7 4.2 5.1 1982 ................................................... 9.2 6.1 11.9 3.5 2.4 4.4 1983 ................................................... 10.6 8.1 12.7 4.1 3.1 4.9 1984 ................................................... 12.5 12.4 12.5 4.6 4.4 4.8 1985 ................................................... 10.1 9.2 11.0 3.8 3.4 4.1 1986 ................................................... 9.5 7.5 11.5 3.7 2.9 4.6 1987 ................................................... 12.8 11.9 13.7 4.9 4.5 5.2 1988 2 ................................................ 16.1 14.3 17.8 5.9 5.2 6.6 1989 ................................................... 13.5 11.1 16.0 4.9 4.1 5.7
1990 ................................................... 10.6 7.9 13.1 3.9 3.0 4.8 1991 ................................................... 6.2 1.4 10.6 2.4 .5 4.1 1992 3 ................................................ 2.1 −5.1 8.2 .8 −1.7 3.1 1993 ................................................... 8.0 5.7 10.0 2.8 1.8 3.7 1994 ................................................... 15.8 16.3 15.2 5.4 5.3 5.5 1995 ................................................... 16.0 15.4 16.6 5.6 5.2 6.0 1996 ................................................... 16.7 15.7 17.6 6.0 5.5 6.5 1997 ................................................... 16.7 16.3 17.1 6.2 5.8 6.7 1998 ................................................... 15.8 16.4 15.2 5.9 5.9 6.0 1999 ................................................... 16.4 16.1 16.8 6.2 6.1 6.4 2000 ................................................... 15.1 12.5 18.7 6.1 5.4 6.9
2000: IV .............................................. 9.9 7.0 13.9 4.0 3.1 5.1
NAICS: 4 2000: IV .............................................. 9.1 5.6 14.3 3.7 2.5 5.2
2001 ................................................... 2.0 −7.0 14.7 .8 −3.3 5.7 2002 ................................................... 7.5 2.1 14.5 3.2 1.0 5.8 2003 ................................................... 12.1 8.5 16.3 5.4 3.9 7.0
2002: I ................................................ 5.5 −.7 14.0 2.5 −.3 5.9 II .............................................. 10.2 5.8 16.1 4.3 2.6 6.4 III ............................................. 8.8 3.3 15.8 3.7 1.5 6.3 IV ............................................. 5.3 −.0 12.1 2.2 −.0 4.6
2003: I ................................................ 12.6 5.9 20.5 5.4 2.7 8.3 II .............................................. 11.9 8.6 15.7 5.3 3.8 6.9 III ............................................. 10.8 8.5 13.3 4.7 3.9 5.7 IV ............................................. 13.2 10.8 16.0 6.0 5.0 7.2
2004: I ................................................ 14.0 12.1 16.2 6.5 5.7 7.3 II .............................................. 16.7 15.2 18.4 7.3 6.9 7.8 III ............................................. 15.8 13.3 18.7 7.0 6.1 8.0
1 Annual ratios based on average equity for the year (using four end-of-quarter figures). Quarterly ratios based on equity at end of quarter. 2 See footnote 3, Table B–93. 3 See footnote 4, Table B–93. 4 See footnote 5, Table B–93. Note.—Based on data in millions of dollars. See Note, Table B–93. Source: Department of Commerce, Bureau of the Census.
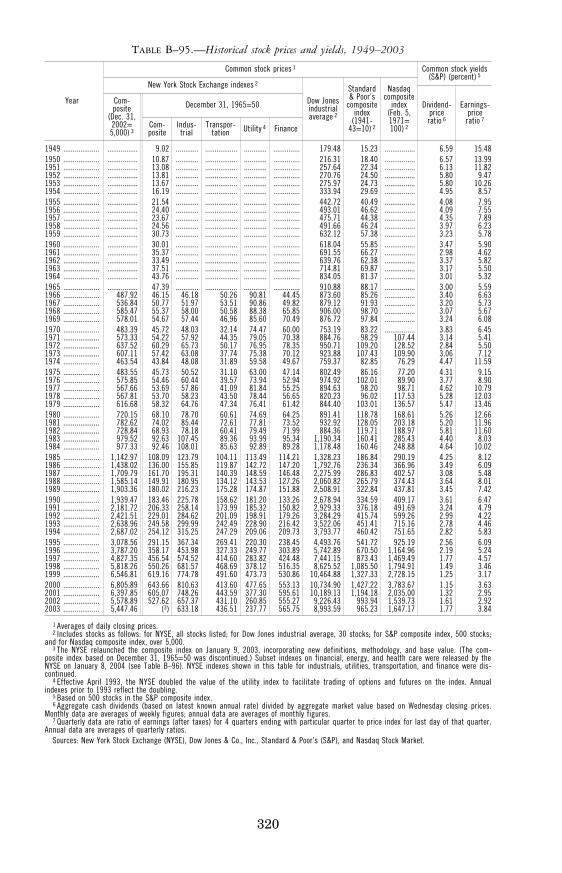
320
TABLE B–95.—Historical stock prices and yields, 1949–2003
Year
Common stock prices 1 Common stock yields (S&P) (percent) 5
New York Stock Exchange indexes 2
Dow Jones industrial average 2
Standard & Poor’s
composite index
(1941- 43=10) 2
Nasdaq composite
index (Feb. 5, 1971= 100) 2
Dividend- price ratio 6
Earnings- price ratio 7
Com-posite
(Dec. 31, 2002= 5,000) 3
December 31, 1965=50
Com- posite
Indus- trial
Transpor- tation Utility 4 Finance
1949 ................... ................ 9.02 ............ ................. ............ .............. 179.48 15.23 ................ 6.59 15.48 1950 ................... ................ 10.87 ............ ................. ............ .............. 216.31 18.40 ................ 6.57 13.99 1951 ................... ................ 13.08 ............ ................. ............ .............. 257.64 22.34 ................ 6.13 11.82 1952 ................... ................ 13.81 ............ ................. ............ .............. 270.76 24.50 ................ 5.80 9.47 1953 ................... ................ 13.67 ............ ................. ............ .............. 275.97 24.73 ................ 5.80 10.26 1954 ................... ................ 16.19 ............ ................. ............ .............. 333.94 29.69 ................ 4.95 8.57 1955 ................... ................ 21.54 ............ ................. ............ .............. 442.72 40.49 ................ 4.08 7.95 1956 ................... ................ 24.40 ............ ................. ............ .............. 493.01 46.62 ................ 4.09 7.55 1957 ................... ................ 23.67 ............ ................. ............ .............. 475.71 44.38 ................ 4.35 7.89 1958 ................... ................ 24.56 ............ ................. ............ .............. 491.66 46.24 ................ 3.97 6.23 1959 ................... ................ 30.73 ............ ................. ............ .............. 632.12 57.38 ................ 3.23 5.78 1960 ................... ................ 30.01 ............ ................. ............ .............. 618.04 55.85 ................ 3.47 5.90 1961 ................... ................ 35.37 ............ ................. ............ .............. 691.55 66.27 ................ 2.98 4.62 1962 ................... ................ 33.49 ............ ................. ............ .............. 639.76 62.38 ................ 3.37 5.82 1963 ................... ................ 37.51 ............ ................. ............ .............. 714.81 69.87 ................ 3.17 5.50 1964 ................... ................ 43.76 ............ ................. ............ .............. 834.05 81.37 ................ 3.01 5.32 1965 ................... ................ 47.39 ............ ................. ............ .............. 910.88 88.17 ................ 3.00 5.59 1966 ................... 487.92 46.15 46.18 50.26 90.81 44.45 873.60 85.26 ................ 3.40 6.63 1967 ................... 536.84 50.77 51.97 53.51 90.86 49.82 879.12 91.93 ................ 3.20 5.73 1968 ................... 585.47 55.37 58.00 50.58 88.38 65.85 906.00 98.70 ................ 3.07 5.67 1969 ................... 578.01 54.67 57.44 46.96 85.60 70.49 876.72 97.84 ................ 3.24 6.08 1970 ................... 483.39 45.72 48.03 32.14 74.47 60.00 753.19 83.22 ................ 3.83 6.45 1971 ................... 573.33 54.22 57.92 44.35 79.05 70.38 884.76 98.29 107.44 3.14 5.41 1972 ................... 637.52 60.29 65.73 50.17 76.95 78.35 950.71 109.20 128.52 2.84 5.50 1973 ................... 607.11 57.42 63.08 37.74 75.38 70.12 923.88 107.43 109.90 3.06 7.12 1974 ................... 463.54 43.84 48.08 31.89 59.58 49.67 759.37 82.85 76.29 4.47 11.59 1975 ................... 483.55 45.73 50.52 31.10 63.00 47.14 802.49 86.16 77.20 4.31 9.15 1976 ................... 575.85 54.46 60.44 39.57 73.94 52.94 974.92 102.01 89.90 3.77 8.90 1977 ................... 567.66 53.69 57.86 41.09 81.84 55.25 894.63 98.20 98.71 4.62 10.79 1978 ................... 567.81 53.70 58.23 43.50 78.44 56.65 820.23 96.02 117.53 5.28 12.03 1979 ................... 616.68 58.32 64.76 47.34 76.41 61.42 844.40 103.01 136.57 5.47 13.46 1980 ................... 720.15 68.10 78.70 60.61 74.69 64.25 891.41 118.78 168.61 5.26 12.66 1981 ................... 782.62 74.02 85.44 72.61 77.81 73.52 932.92 128.05 203.18 5.20 11.96 1982 ................... 728.84 68.93 78.18 60.41 79.49 71.99 884.36 119.71 188.97 5.81 11.60 1983 ................... 979.52 92.63 107.45 89.36 93.99 95.34 1,190.34 160.41 285.43 4.40 8.03 1984 ................... 977.33 92.46 108.01 85.63 92.89 89.28 1,178.48 160.46 248.88 4.64 10.02 1985 ................... 1,142.97 108.09 123.79 104.11 113.49 114.21 1,328.23 186.84 290.19 4.25 8.12 1986 ................... 1,438.02 136.00 155.85 119.87 142.72 147.20 1,792.76 236.34 366.96 3.49 6.09 1987 ................... 1,709.79 161.70 195.31 140.39 148.59 146.48 2,275.99 286.83 402.57 3.08 5.48 1988 ................... 1,585.14 149.91 180.95 134.12 143.53 127.26 2,060.82 265.79 374.43 3.64 8.01 1989 ................... 1,903.36 180.02 216.23 175.28 174.87 151.88 2,508.91 322.84 437.81 3.45 7.42 1990 ................... 1,939.47 183.46 225.78 158.62 181.20 133.26 2,678.94 334.59 409.17 3.61 6.47 1991 ................... 2,181.72 206.33 258.14 173.99 185.32 150.82 2,929.33 376.18 491.69 3.24 4.79 1992 ................... 2,421.51 229.01 284.62 201.09 198.91 179.26 3,284.29 415.74 599.26 2.99 4.22 1993 ................... 2,638.96 249.58 299.99 242.49 228.90 216.42 3,522.06 451.41 715.16 2.78 4.46 1994 ................... 2,687.02 254.12 315.25 247.29 209.06 209.73 3,793.77 460.42 751.65 2.82 5.83 1995 ................... 3,078.56 291.15 367.34 269.41 220.30 238.45 4,493.76 541.72 925.19 2.56 6.09 1996 ................... 3,787.20 358.17 453.98 327.33 249.77 303.89 5,742.89 670.50 1,164.96 2.19 5.24 1997 ................... 4,827.35 456.54 574.52 414.60 283.82 424.48 7,441.15 873.43 1,469.49 1.77 4.57 1998 ................... 5,818.26 550.26 681.57 468.69 378.12 516.35 8,625.52 1,085.50 1,794.91 1.49 3.46 1999 ................... 6,546.81 619.16 774.78 491.60 473.73 530.86 10,464.88 1,327.33 2,728.15 1.25 3.17 2000 ................... 6,805.89 643.66 810.63 413.60 477.65 553.13 10,734.90 1,427.22 3,783.67 1.15 3.63 2001 ................... 6,397.85 605.07 748.26 443.59 377.30 595.61 10,189.13 1,194.18 2,035.00 1.32 2.95 2002 ................... 5,578.89 527.62 657.37 431.10 260.85 555.27 9,226.43 993.94 1,539.73 1.61 2.92 2003 ................... 5,447.46 (3) 633.18 436.51 237.77 565.75 8,993.59 965.23 1,647.17 1.77 3.84
1 Averages of daily closing prices. 2 Includes stocks as follows: for NYSE, all stocks listed; for Dow Jones industrial average, 30 stocks; for S&P composite index, 500 stocks;
and for Nasdaq composite index, over 5,000. 3 The NYSE relaunched the composite index on January 9, 2003, incorporating new definitions, methodology, and base value. (The com-
posite index based on December 31, 1965=50 was discontinued.) Subset indexes on financial, energy, and health care were released by the NYSE on January 8, 2004 (see Table B–96). NYSE indexes shown in this table for industrials, utilities, transportation, and finance were dis-continued.
4 Effective April 1993, the NYSE doubled the value of the utility index to facilitate trading of options and futures on the index. Annual indexes prior to 1993 reflect the doubling.
5 Based on 500 stocks in the S&P composite index. 6 Aggregate cash dividends (based on latest known annual rate) divided by aggregate market value based on Wednesday closing prices.
Monthly data are averages of weekly figures; annual data are averages of monthly figures. 7 Quarterly data are ratio of earnings (after taxes) for 4 quarters ending with particular quarter to price index for last day of that quarter.
Annual data are averages of quarterly ratios. Sources: New York Stock Exchange (NYSE), Dow Jones & Co., Inc., Standard & Poor’s (S&P), and Nasdaq Stock Market.
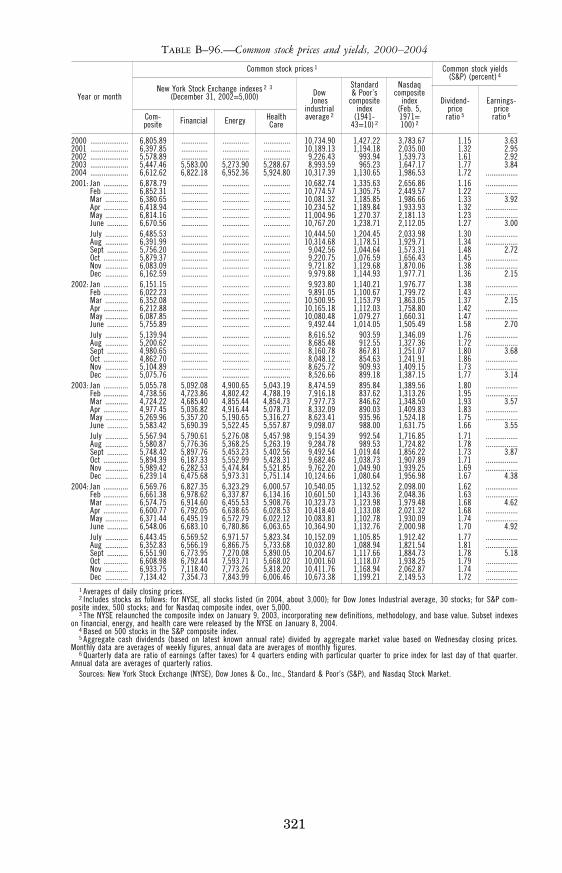
321
TABLE B–96.—Common stock prices and yields, 2000–2004
Year or month
Common stock prices 1 Common stock yields (S&P) (percent) 4
New York Stock Exchange indexes 2 3 (December 31, 2002=5,000) Dow
Jones industrial average 2
Standard & Poor’s
composite index
(1941- 43=10) 2
Nasdaq composite
index (Feb. 5, 1971= 100) 2
Dividend- price ratio 5
Earnings- price ratio 6 Com-
posite Financial Energy Health Care
2000 .................... 6,805.89 .............. .............. .............. 10,734.90 1,427.22 3,783.67 1.15 3.63 2001 .................... 6,397.85 .............. .............. .............. 10,189.13 1,194.18 2,035.00 1.32 2.95 2002 .................... 5,578.89 .............. .............. .............. 9,226.43 993.94 1,539.73 1.61 2.92 2003 .................... 5,447.46 5,583.00 5,273.90 5,288.67 8,993.59 965.23 1,647.17 1.77 3.84 2004 .................... 6,612.62 6,822.18 6,952.36 5,924.80 10,317.39 1,130.65 1,986.53 1.72 .................2001: Jan ............. 6,878.79 .............. .............. .............. 10,682.74 1,335.63 2,656.86 1.16 .................
Feb ............. 6,852.31 .............. .............. .............. 10,774.57 1,305.75 2,449.57 1.22 .................Mar ............ 6,380.65 .............. .............. .............. 10,081.32 1,185.85 1,986.66 1.33 3.92 Apr ............. 6,418.94 .............. .............. .............. 10,234.52 1,189.84 1,933.93 1.32 .................May ............ 6,814.16 .............. .............. .............. 11,004.96 1,270.37 2,181.13 1.23 .................June ........... 6,670.56 .............. .............. .............. 10,767.20 1,238.71 2,112.05 1.27 3.00 July ............ 6,485.53 .............. .............. .............. 10,444.50 1,204.45 2,033.98 1.30 .................Aug ............ 6,391.99 .............. .............. .............. 10,314.68 1,178.51 1,929.71 1.34 .................Sept ........... 5,756.20 .............. .............. .............. 9,042.56 1,044.64 1,573.31 1.48 2.72 Oct ............. 5,879.37 .............. .............. .............. 9,220.75 1,076.59 1,656.43 1.45 .................Nov ............ 6,083.09 .............. .............. .............. 9,721.82 1,129.68 1,870.06 1.38 .................Dec ............ 6,162.59 .............. .............. .............. 9,979.88 1,144.93 1,977.71 1.36 2.15
2002: Jan ............. 6,151.15 .............. .............. .............. 9,923.80 1,140.21 1,976.77 1.38 .................Feb ............. 6,022.23 .............. .............. .............. 9,891.05 1,100.67 1,799.72 1.43 .................Mar ............ 6,352.08 .............. .............. .............. 10,500.95 1,153.79 1,863.05 1.37 2.15 Apr ............. 6,212.88 .............. .............. .............. 10,165.18 1,112.03 1,758.80 1.42 .................May ............ 6,087.85 .............. .............. .............. 10,080.48 1,079.27 1,660.31 1.47 .................June ........... 5,755.89 .............. .............. .............. 9,492.44 1,014.05 1,505.49 1.58 2.70 July ............ 5,139.94 .............. .............. .............. 8,616.52 903.59 1,346.09 1.76 .................Aug ............ 5,200.62 .............. .............. .............. 8,685.48 912.55 1,327.36 1.72 .................Sept ........... 4,980.65 .............. .............. .............. 8,160.78 867.81 1,251.07 1.80 3.68 Oct ............. 4,862.70 .............. .............. .............. 8,048.12 854.63 1,241.91 1.86 .................Nov ............ 5,104.89 .............. .............. .............. 8,625.72 909.93 1,409.15 1.73 .................Dec ............ 5,075.76 .............. .............. .............. 8,526.66 899.18 1,387.15 1.77 3.14
2003: Jan ............. 5,055.78 5,092.08 4,900.65 5,043.19 8,474.59 895.84 1,389.56 1.80 .................Feb ............. 4,738.56 4,723.86 4,802.42 4,788.19 7,916.18 837.62 1,313.26 1.95 .................Mar ............ 4,724.22 4,685.40 4,855.44 4,854.73 7,977.73 846.62 1,348.50 1.93 3.57 Apr ............. 4,977.45 5,036.82 4,916.44 5,078.71 8,332.09 890.03 1,409.83 1.83 .................May ............ 5,269.96 5,357.20 5,190.65 5,316.27 8,623.41 935.96 1,524.18 1.75 .................June ........... 5,583.42 5,690.39 5,522.45 5,557.87 9,098.07 988.00 1,631.75 1.66 3.55 July ............ 5,567.94 5,790.61 5,276.08 5,457.98 9,154.39 992.54 1,716.85 1.71 .................Aug ............ 5,580.87 5,776.36 5,368.25 5,263.19 9,284.78 989.53 1,724.82 1.78 .................Sept ........... 5,748.42 5,897.76 5,453.23 5,402.56 9,492.54 1,019.44 1,856.22 1.73 3.87 Oct ............. 5,894.39 6,187.33 5,552.99 5,428.31 9,682.46 1,038.73 1,907.89 1.71 .................Nov ............ 5,989.42 6,282.53 5,474.84 5,521.85 9,762.20 1,049.90 1,939.25 1.69 .................Dec ............ 6,239.14 6,475.68 5,973.31 5,751.14 10,124.66 1,080.64 1,956.98 1.67 4.38
2004: Jan ............. 6,569.76 6,827.35 6,323.29 6,000.57 10,540.05 1,132.52 2,098.00 1.62 .................Feb ............. 6,661.38 6,978.62 6,337.87 6,134.16 10,601.50 1,143.36 2,048.36 1.63 .................Mar ............ 6,574.75 6,914.60 6,455.53 5,908.76 10,323.73 1,123.98 1,979.48 1.68 4.62 Apr ............. 6,600.77 6,792.05 6,638.65 6,028.53 10,418.40 1,133.08 2,021.32 1.68 .................May ............ 6,371.44 6,495.19 6,572.79 6,022.12 10,083.81 1,102.78 1,930.09 1.74 .................June ........... 6,548.06 6,683.10 6,780.86 6,063.65 10,364.90 1,132.76 2,000.98 1.70 4.92 July ............ 6,443.45 6,569.52 6,971.57 5,823.34 10,152.09 1,105.85 1,912.42 1.77 .................Aug ............ 6,352.83 6,566.19 6,866.75 5,733.68 10,032.80 1,088.94 1,821.54 1.81 .................Sept ........... 6,551.90 6,773.95 7,270.08 5,890.05 10,204.67 1,117.66 1,884.73 1.78 5.18 Oct ............. 6,608.98 6,792.44 7,593.71 5,668.02 10,001.60 1,118.07 1,938.25 1.79 .................Nov ............ 6,933.75 7,118.40 7,773.26 5,818.20 10,411.76 1,168.94 2,062.87 1.74 .................Dec ............ 7,134.42 7,354.73 7,843.99 6,006.46 10,673.38 1,199.21 2,149.53 1.72 .................
1 Averages of daily closing prices. 2 Includes stocks as follows: for NYSE, all stocks listed (in 2004, about 3,000); for Dow Jones Industrial average, 30 stocks; for S&P com-
posite index, 500 stocks; and for Nasdaq composite index, over 5,000. 3 The NYSE relaunched the composite index on January 9, 2003, incorporating new definitions, methodology, and base value. Subset indexes
on financial, energy, and health care were released by the NYSE on January 8, 2004. 4 Based on 500 stocks in the S&P composite index. 5 Aggregate cash dividends (based on latest known annual rate) divided by aggregate market value based on Wednesday closing prices.
Monthly data are averages of weekly figures, annual data are averages of monthly figures. 6 Quarterly data are ratio of earnings (after taxes) for 4 quarters ending with particular quarter to price index for last day of that quarter.
Annual data are averages of quarterly ratios. Sources: New York Stock Exchange (NYSE), Dow Jones & Co., Inc., Standard & Poor’s (S&P), and Nasdaq Stock Market.
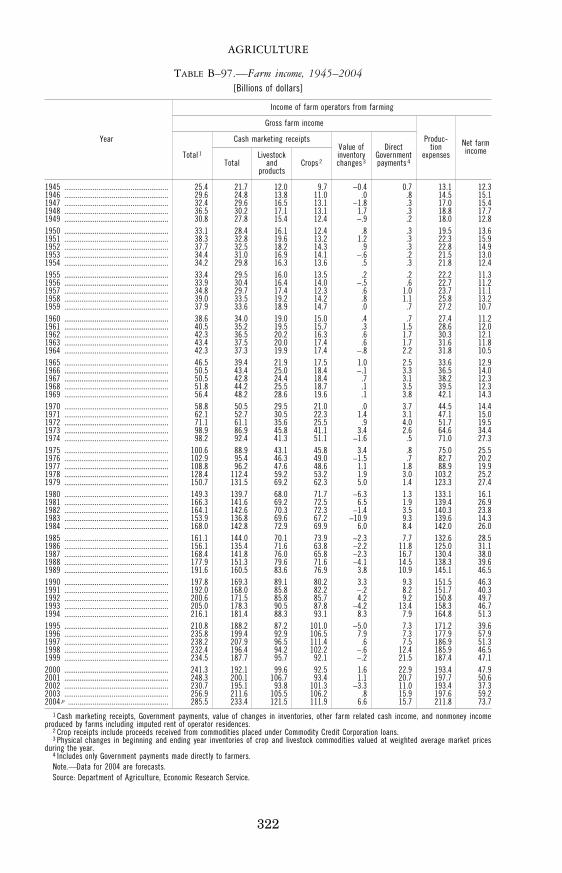
322
AGRICULTURE
TABLE B–97.—Farm income, 1945–2004 [Billions of dollars]
Year
Income of farm operators from farming
Gross farm income
Produc- tion
expenses Net farm income Total 1
Cash marketing receipts Value of inventory changes 3
Direct Government payments 4 Total
Livestock and
products Crops 2
1945 ....................................................... 25.4 21.7 12.0 9.7 −0.4 0.7 13.1 12.3 1946 ....................................................... 29.6 24.8 13.8 11.0 .0 .8 14.5 15.1 1947 ....................................................... 32.4 29.6 16.5 13.1 −1.8 .3 17.0 15.4 1948 ....................................................... 36.5 30.2 17.1 13.1 1.7 .3 18.8 17.7 1949 ....................................................... 30.8 27.8 15.4 12.4 −.9 .2 18.0 12.8 1950 ....................................................... 33.1 28.4 16.1 12.4 .8 .3 19.5 13.6 1951 ....................................................... 38.3 32.8 19.6 13.2 1.2 .3 22.3 15.9 1952 ....................................................... 37.7 32.5 18.2 14.3 .9 .3 22.8 14.9 1953 ....................................................... 34.4 31.0 16.9 14.1 −.6 .2 21.5 13.0 1954 ....................................................... 34.2 29.8 16.3 13.6 .5 .3 21.8 12.4 1955 ....................................................... 33.4 29.5 16.0 13.5 .2 .2 22.2 11.3 1956 ....................................................... 33.9 30.4 16.4 14.0 −.5 .6 22.7 11.2 1957 ....................................................... 34.8 29.7 17.4 12.3 .6 1.0 23.7 11.1 1958 ....................................................... 39.0 33.5 19.2 14.2 .8 1.1 25.8 13.2 1959 ....................................................... 37.9 33.6 18.9 14.7 .0 .7 27.2 10.7 1960 ....................................................... 38.6 34.0 19.0 15.0 .4 .7 27.4 11.2 1961 ....................................................... 40.5 35.2 19.5 15.7 .3 1.5 28.6 12.0 1962 ....................................................... 42.3 36.5 20.2 16.3 .6 1.7 30.3 12.1 1963 ....................................................... 43.4 37.5 20.0 17.4 .6 1.7 31.6 11.8 1964 ....................................................... 42.3 37.3 19.9 17.4 −.8 2.2 31.8 10.5 1965 ....................................................... 46.5 39.4 21.9 17.5 1.0 2.5 33.6 12.9 1966 ....................................................... 50.5 43.4 25.0 18.4 −.1 3.3 36.5 14.0 1967 ....................................................... 50.5 42.8 24.4 18.4 .7 3.1 38.2 12.3 1968 ....................................................... 51.8 44.2 25.5 18.7 .1 3.5 39.5 12.3 1969 ....................................................... 56.4 48.2 28.6 19.6 .1 3.8 42.1 14.3 1970 ....................................................... 58.8 50.5 29.5 21.0 .0 3.7 44.5 14.4 1971 ....................................................... 62.1 52.7 30.5 22.3 1.4 3.1 47.1 15.0 1972 ....................................................... 71.1 61.1 35.6 25.5 .9 4.0 51.7 19.5 1973 ....................................................... 98.9 86.9 45.8 41.1 3.4 2.6 64.6 34.4 1974 ....................................................... 98.2 92.4 41.3 51.1 −1.6 .5 71.0 27.3 1975 ....................................................... 100.6 88.9 43.1 45.8 3.4 .8 75.0 25.5 1976 ....................................................... 102.9 95.4 46.3 49.0 −1.5 .7 82.7 20.2 1977 ....................................................... 108.8 96.2 47.6 48.6 1.1 1.8 88.9 19.9 1978 ....................................................... 128.4 112.4 59.2 53.2 1.9 3.0 103.2 25.2 1979 ....................................................... 150.7 131.5 69.2 62.3 5.0 1.4 123.3 27.4 1980 ....................................................... 149.3 139.7 68.0 71.7 −6.3 1.3 133.1 16.1 1981 ....................................................... 166.3 141.6 69.2 72.5 6.5 1.9 139.4 26.9 1982 ....................................................... 164.1 142.6 70.3 72.3 −1.4 3.5 140.3 23.8 1983 ....................................................... 153.9 136.8 69.6 67.2 −10.9 9.3 139.6 14.3 1984 ....................................................... 168.0 142.8 72.9 69.9 6.0 8.4 142.0 26.0 1985 ....................................................... 161.1 144.0 70.1 73.9 −2.3 7.7 132.6 28.5 1986 ....................................................... 156.1 135.4 71.6 63.8 −2.2 11.8 125.0 31.1 1987 ....................................................... 168.4 141.8 76.0 65.8 −2.3 16.7 130.4 38.0 1988 ....................................................... 177.9 151.3 79.6 71.6 −4.1 14.5 138.3 39.6 1989 ....................................................... 191.6 160.5 83.6 76.9 3.8 10.9 145.1 46.5 1990 ....................................................... 197.8 169.3 89.1 80.2 3.3 9.3 151.5 46.3 1991 ....................................................... 192.0 168.0 85.8 82.2 −.2 8.2 151.7 40.3 1992 ....................................................... 200.6 171.5 85.8 85.7 4.2 9.2 150.8 49.7 1993 ....................................................... 205.0 178.3 90.5 87.8 −4.2 13.4 158.3 46.7 1994 ....................................................... 216.1 181.4 88.3 93.1 8.3 7.9 164.8 51.3 1995 ....................................................... 210.8 188.2 87.2 101.0 −5.0 7.3 171.2 39.6 1996 ....................................................... 235.8 199.4 92.9 106.5 7.9 7.3 177.9 57.9 1997 ....................................................... 238.2 207.9 96.5 111.4 .6 7.5 186.9 51.3 1998 ....................................................... 232.4 196.4 94.2 102.2 −.6 12.4 185.9 46.5 1999 ....................................................... 234.5 187.7 95.7 92.1 −.2 21.5 187.4 47.1 2000 ....................................................... 241.3 192.1 99.6 92.5 1.6 22.9 193.4 47.9 2001 ....................................................... 248.3 200.1 106.7 93.4 1.1 20.7 197.7 50.6 2002 ....................................................... 230.7 195.1 93.8 101.3 −3.3 11.0 193.4 37.3 2003 ....................................................... 256.9 211.6 105.5 106.2 .8 15.9 197.6 59.2 2004 p ..................................................... 285.5 233.4 121.5 111.9 6.6 15.7 211.8 73.7
1 Cash marketing receipts, Government payments, value of changes in inventories, other farm related cash income, and nonmoney income produced by farms including imputed rent of operator residences.
2 Crop receipts include proceeds received from commodities placed under Commodity Credit Corporation loans. 3 Physical changes in beginning and ending year inventories of crop and livestock commodities valued at weighted average market prices
during the year. 4 Includes only Government payments made directly to farmers. Note.—Data for 2004 are forecasts. Source: Department of Agriculture, Economic Research Service.
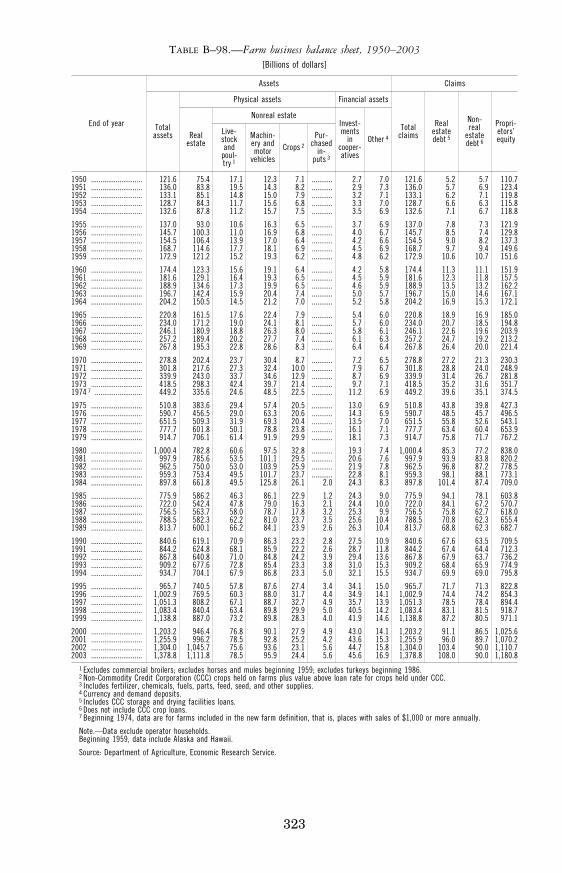
323
TABLE B–98.—Farm business balance sheet, 1950–2003 [Billions of dollars]
End of year
Assets Claims
Total assets
Physical assets Financial assets
Total claims
Real estate debt 5
Non- real
estate debt 6
Propri- etors’ equity Real
estate
Nonreal estate Invest- ments
in cooper- atives
Other 4 Live- stock and
poul- try 1
Machin- ery and motor
vehicles Crops 2
Pur- chased
in- puts 3
1950 ........................... 121 .6 75 .4 17 .1 12 .3 7 .1 ........... 2 .7 7 .0 121 .6 5 .2 5 .7 110 .7 1951 ........................... 136 .0 83 .8 19 .5 14 .3 8 .2 ........... 2 .9 7 .3 136 .0 5 .7 6 .9 123 .4 1952 ........................... 133 .1 85 .1 14 .8 15 .0 7 .9 ........... 3 .2 7 .1 133 .1 6 .2 7 .1 119 .8 1953 ........................... 128 .7 84 .3 11 .7 15 .6 6 .8 ........... 3 .3 7 .0 128 .7 6 .6 6 .3 115 .8 1954 ........................... 132 .6 87 .8 11 .2 15 .7 7 .5 ........... 3 .5 6 .9 132 .6 7 .1 6 .7 118 .8
1955 ........................... 137 .0 93 .0 10 .6 16 .3 6 .5 ........... 3 .7 6 .9 137 .0 7 .8 7 .3 121 .9 1956 ........................... 145 .7 100 .3 11 .0 16 .9 6 .8 ........... 4 .0 6 .7 145 .7 8 .5 7 .4 129 .8 1957 ........................... 154 .5 106 .4 13 .9 17 .0 6 .4 ........... 4 .2 6 .6 154 .5 9 .0 8 .2 137 .3 1958 ........................... 168 .7 114 .6 17 .7 18 .1 6 .9 ........... 4 .5 6 .9 168 .7 9 .7 9 .4 149 .6 1959 ........................... 172 .9 121 .2 15 .2 19 .3 6 .2 ........... 4 .8 6 .2 172 .9 10 .6 10 .7 151 .6
1960 ........................... 174 .4 123 .3 15 .6 19 .1 6 .4 ........... 4 .2 5 .8 174 .4 11 .3 11 .1 151 .9 1961 ........................... 181 .6 129 .1 16 .4 19 .3 6 .5 ........... 4 .5 5 .9 181 .6 12 .3 11 .8 157 .5 1962 ........................... 188 .9 134 .6 17 .3 19 .9 6 .5 ........... 4 .6 5 .9 188 .9 13 .5 13 .2 162 .2 1963 ........................... 196 .7 142 .4 15 .9 20 .4 7 .4 ........... 5 .0 5 .7 196 .7 15 .0 14 .6 167 .1 1964 ........................... 204 .2 150 .5 14 .5 21 .2 7 .0 ........... 5 .2 5 .8 204 .2 16 .9 15 .3 172 .1
1965 ........................... 220 .8 161 .5 17 .6 22 .4 7 .9 ........... 5 .4 6 .0 220 .8 18 .9 16 .9 185 .0 1966 ........................... 234 .0 171 .2 19 .0 24 .1 8 .1 ........... 5 .7 6 .0 234 .0 20 .7 18 .5 194 .8 1967 ........................... 246 .1 180 .9 18 .8 26 .3 8 .0 ........... 5 .8 6 .1 246 .1 22 .6 19 .6 203 .9 1968 ........................... 257 .2 189 .4 20 .2 27 .7 7 .4 ........... 6 .1 6 .3 257 .2 24 .7 19 .2 213 .2 1969 ........................... 267 .8 195 .3 22 .8 28 .6 8 .3 ........... 6 .4 6 .4 267 .8 26 .4 20 .0 221 .4
1970 ........................... 278 .8 202 .4 23 .7 30 .4 8 .7 ........... 7 .2 6 .5 278 .8 27 .2 21 .3 230 .3 1971 ........................... 301 .8 217 .6 27 .3 32 .4 10 .0 ........... 7 .9 6 .7 301 .8 28 .8 24 .0 248 .9 1972 ........................... 339 .9 243 .0 33 .7 34 .6 12 .9 ........... 8 .7 6 .9 339 .9 31 .4 26 .7 281 .8 1973 ........................... 418 .5 298 .3 42 .4 39 .7 21 .4 ........... 9 .7 7 .1 418 .5 35 .2 31 .6 351 .7 1974 7 ......................... 449 .2 335 .6 24 .6 48 .5 22 .5 ........... 11 .2 6 .9 449 .2 39 .6 35 .1 374 .5
1975 ........................... 510 .8 383 .6 29 .4 57 .4 20 .5 ........... 13 .0 6 .9 510 .8 43 .8 39 .8 427 .3 1976 ........................... 590 .7 456 .5 29 .0 63 .3 20 .6 ........... 14 .3 6 .9 590 .7 48 .5 45 .7 496 .5 1977 ........................... 651 .5 509 .3 31 .9 69 .3 20 .4 ........... 13 .5 7 .0 651 .5 55 .8 52 .6 543 .1 1978 ........................... 777 .7 601 .8 50 .1 78 .8 23 .8 ........... 16 .1 7 .1 777 .7 63 .4 60 .4 653 .9 1979 ........................... 914 .7 706 .1 61 .4 91 .9 29 .9 ........... 18 .1 7 .3 914 .7 75 .8 71 .7 767 .2
1980 ........................... 1,000 .4 782 .8 60 .6 97 .5 32 .8 ........... 19 .3 7 .4 1,000 .4 85 .3 77 .2 838 .0 1981 ........................... 997 .9 785 .6 53 .5 101 .1 29 .5 ........... 20 .6 7 .6 997 .9 93 .9 83 .8 820 .2 1982 ........................... 962 .5 750 .0 53 .0 103 .9 25 .9 ........... 21 .9 7 .8 962 .5 96 .8 87 .2 778 .5 1983 ........................... 959 .3 753 .4 49 .5 101 .7 23 .7 ........... 22 .8 8 .1 959 .3 98 .1 88 .1 773 .1 1984 ........................... 897 .8 661 .8 49 .5 125 .8 26 .1 2 .0 24 .3 8 .3 897 .8 101 .4 87 .4 709 .0
1985 ........................... 775 .9 586 .2 46 .3 86 .1 22 .9 1 .2 24 .3 9 .0 775 .9 94 .1 78 .1 603 .8 1986 ........................... 722 .0 542 .4 47 .8 79 .0 16 .3 2 .1 24 .4 10 .0 722 .0 84 .1 67 .2 570 .7 1987 ........................... 756 .5 563 .7 58 .0 78 .7 17 .8 3 .2 25 .3 9 .9 756 .5 75 .8 62 .7 618 .0 1988 ........................... 788 .5 582 .3 62 .2 81 .0 23 .7 3 .5 25 .6 10 .4 788 .5 70 .8 62 .3 655 .4 1989 ........................... 813 .7 600 .1 66 .2 84 .1 23 .9 2 .6 26 .3 10 .4 813 .7 68 .8 62 .3 682 .7
1990 ........................... 840 .6 619 .1 70 .9 86 .3 23 .2 2 .8 27 .5 10 .9 840 .6 67 .6 63 .5 709 .5 1991 ........................... 844 .2 624 .8 68 .1 85 .9 22 .2 2 .6 28 .7 11 .8 844 .2 67 .4 64 .4 712 .3 1992 ........................... 867 .8 640 .8 71 .0 84 .8 24 .2 3 .9 29 .4 13 .6 867 .8 67 .9 63 .7 736 .2 1993 ........................... 909 .2 677 .6 72 .8 85 .4 23 .3 3 .8 31 .0 15 .3 909 .2 68 .4 65 .9 774 .9 1994 ........................... 934 .7 704 .1 67 .9 86 .8 23 .3 5 .0 32 .1 15 .5 934 .7 69 .9 69 .0 795 .8
1995 ........................... 965 .7 740 .5 57 .8 87 .6 27 .4 3 .4 34 .1 15 .0 965 .7 71 .7 71 .3 822 .8 1996 ........................... 1,002 .9 769 .5 60 .3 88 .0 31 .7 4 .4 34 .9 14 .1 1,002 .9 74 .4 74 .2 854 .3 1997 ........................... 1,051 .3 808 .2 67 .1 88 .7 32 .7 4 .9 35 .7 13 .9 1,051 .3 78 .5 78 .4 894 .4 1998 ........................... 1,083 .4 840 .4 63 .4 89 .8 29 .9 5 .0 40 .5 14 .2 1,083 .4 83 .1 81 .5 918 .7 1999 ........................... 1,138 .8 887 .0 73 .2 89 .8 28 .3 4 .0 41 .9 14 .6 1,138 .8 87 .2 80 .5 971 .1
2000 ........................... 1,203 .2 946 .4 76 .8 90 .1 27 .9 4 .9 43 .0 14 .1 1,203 .2 91 .1 86 .5 1,025 .6 2001 ........................... 1,255 .9 996 .2 78 .5 92 .8 25 .2 4 .2 43 .6 15 .3 1,255 .9 96 .0 89 .7 1,070 .2 2002 ........................... 1,304 .0 1,045 .7 75 .6 93 .6 23 .1 5 .6 44 .7 15 .8 1,304 .0 103 .4 90 .0 1,110 .7 2003 ........................... 1,378 .8 1,111 .8 78 .5 95 .9 24 .4 5 .6 45 .6 16 .9 1,378 .8 108 .0 90 .0 1,180 .8
1 Excludes commercial broilers; excludes horses and mules beginning 1959; excludes turkeys beginning 1986. 2 Non-Commodity Credit Corporation (CCC) crops held on farms plus value above loan rate for crops held under CCC.3 Includes fertilizer, chemicals, fuels, parts, feed, seed, and other supplies. 4 Currency and demand deposits. 5 Includes CCC storage and drying facilities loans. 6 Does not include CCC crop loans. 7 Beginning 1974, data are for farms included in the new farm definition, that is, places with sales of $1,000 or more annually.
Note.—Data exclude operator households. Beginning 1959, data include Alaska and Hawaii.
Source: Department of Agriculture, Economic Research Service.
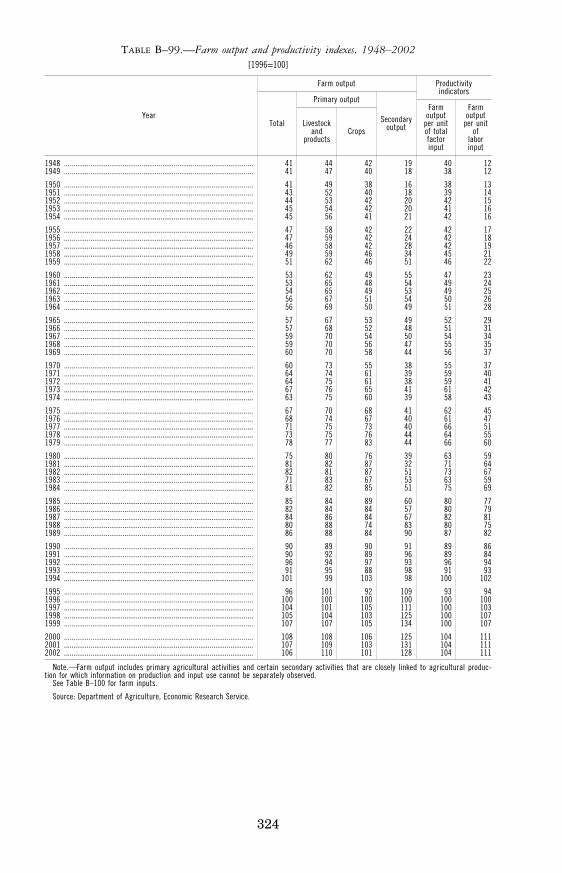
324
TABLE B–99.—Farm output and productivity indexes, 1948–2002 [1996=100]
Year
Farm output Productivity indicators
Total
Primary output
Secondary output
Farm output
per unit of total factor input
Farm output
per unit of
labor input
Livestock and
products Crops
1948 .................................................................................................... 41 44 42 19 40 12 1949 .................................................................................................... 41 47 40 18 38 12
1950 .................................................................................................... 41 49 38 16 38 13 1951 .................................................................................................... 43 52 40 18 39 14 1952 .................................................................................................... 44 53 42 20 42 15 1953 .................................................................................................... 45 54 42 20 41 16 1954 .................................................................................................... 45 56 41 21 42 16
1955 .................................................................................................... 47 58 42 22 42 17 1956 .................................................................................................... 47 59 42 24 42 18 1957 .................................................................................................... 46 58 42 28 42 19 1958 .................................................................................................... 49 59 46 34 45 21 1959 .................................................................................................... 51 62 46 51 46 22
1960 .................................................................................................... 53 62 49 55 47 23 1961 .................................................................................................... 53 65 48 54 49 24 1962 .................................................................................................... 54 65 49 53 49 25 1963 .................................................................................................... 56 67 51 54 50 26 1964 .................................................................................................... 56 69 50 49 51 28
1965 .................................................................................................... 57 67 53 49 52 29 1966 .................................................................................................... 57 68 52 48 51 31 1967 .................................................................................................... 59 70 54 50 54 34 1968 .................................................................................................... 59 70 56 47 55 35 1969 .................................................................................................... 60 70 58 44 56 37
1970 .................................................................................................... 60 73 55 38 55 37 1971 .................................................................................................... 64 74 61 39 59 40 1972 .................................................................................................... 64 75 61 38 59 41 1973 .................................................................................................... 67 76 65 41 61 42 1974 .................................................................................................... 63 75 60 39 58 43
1975 .................................................................................................... 67 70 68 41 62 45 1976 .................................................................................................... 68 74 67 40 61 47 1977 .................................................................................................... 71 75 73 40 66 51 1978 .................................................................................................... 73 75 76 44 64 55 1979 .................................................................................................... 78 77 83 44 66 60
1980 .................................................................................................... 75 80 76 39 63 59 1981 .................................................................................................... 81 82 87 32 71 64 1982 .................................................................................................... 82 81 87 51 73 67 1983 .................................................................................................... 71 83 67 53 63 59 1984 .................................................................................................... 81 82 85 51 75 69
1985 .................................................................................................... 85 84 89 60 80 77 1986 .................................................................................................... 82 84 84 57 80 79 1987 .................................................................................................... 84 86 84 67 82 81 1988 .................................................................................................... 80 88 74 83 80 75 1989 .................................................................................................... 86 88 84 90 87 82
1990 .................................................................................................... 90 89 90 91 89 86 1991 .................................................................................................... 90 92 89 96 89 84 1992 .................................................................................................... 96 94 97 93 96 94 1993 .................................................................................................... 91 95 88 98 91 93 1994 .................................................................................................... 101 99 103 98 100 102
1995 .................................................................................................... 96 101 92 109 93 94 1996 .................................................................................................... 100 100 100 100 100 100 1997 .................................................................................................... 104 101 105 111 100 103 1998 .................................................................................................... 105 104 103 125 100 107 1999 .................................................................................................... 107 107 105 134 100 107
2000 .................................................................................................... 108 108 106 125 104 111 2001 .................................................................................................... 107 109 103 131 104 111 2002 .................................................................................................... 106 110 101 128 104 111
Note.—Farm output includes primary agricultural activities and certain secondary activities that are closely linked to agricultural produc-tion for which information on production and input use cannot be separately observed.
See Table B–100 for farm inputs.
Source: Department of Agriculture, Economic Research Service.
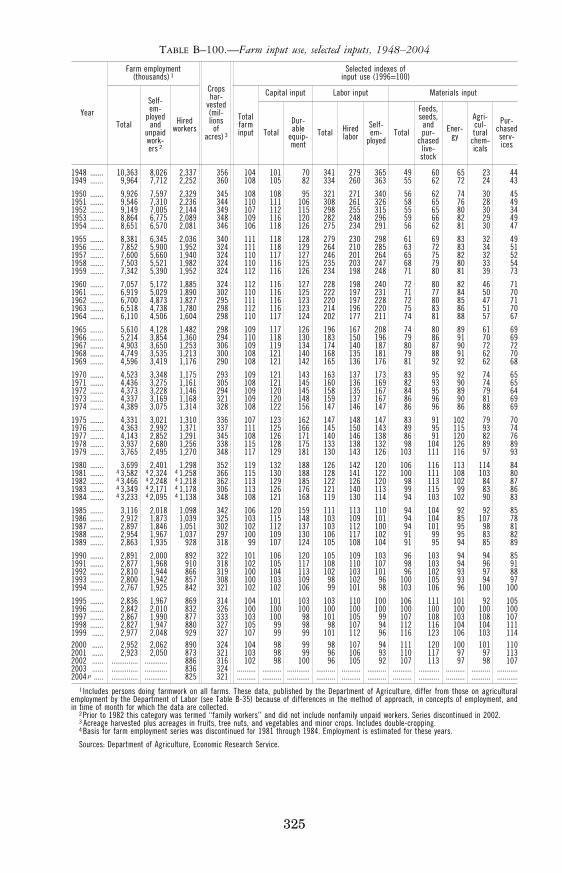
325
TABLE B–100.—Farm input use, selected inputs, 1948–2004
Year
Farm employment (thousands) 1
Crops har-
vested (mil- lions
of acres) 3
Selected indexes of input use (1996=100)
Total
Self- em-
ployed and
unpaid work- ers 2
Hired workers
Total farm input
Capital input Labor input Materials input
Total Dur- able
equip- ment
Total Hired labor
Self- em-
ployed Total
Feeds, seeds,
and pur-
chased live- stock
Ener- gy
Agri- cul- tural
chem- icals
Pur- chased serv- ices
1948 ....... 10,363 8,026 2,337 356 104 101 70 341 279 365 49 60 65 23 44 1949 ....... 9,964 7,712 2,252 360 108 105 82 334 260 363 55 62 72 24 43
1950 ....... 9,926 7,597 2,329 345 108 108 95 321 271 340 56 62 74 30 45 1951 ....... 9,546 7,310 2,236 344 110 111 106 308 261 326 58 65 76 28 49 1952 ....... 9,149 7,005 2,144 349 107 112 115 298 255 315 55 65 80 30 34 1953 ....... 8,864 6,775 2,089 348 109 116 120 282 248 296 59 66 82 29 49 1954 ....... 8,651 6,570 2,081 346 106 118 126 275 234 291 56 62 81 30 47
1955 ....... 8,381 6,345 2,036 340 111 118 128 279 230 298 61 69 83 32 49 1956 ....... 7,852 5,900 1,952 324 111 118 129 264 210 285 63 72 83 34 51 1957 ....... 7,600 5,660 1,940 324 110 117 127 246 201 264 65 75 82 32 52 1958 ....... 7,503 5,521 1,982 324 110 116 125 235 203 247 68 79 80 33 54 1959 ....... 7,342 5,390 1,952 324 112 116 126 234 198 248 71 80 81 39 73
1960 ....... 7,057 5,172 1,885 324 112 116 127 228 198 240 72 80 82 46 71 1961 ....... 6,919 5,029 1,890 302 110 116 125 222 197 231 71 77 84 50 70 1962 ....... 6,700 4,873 1,827 295 111 116 123 220 197 228 72 80 85 47 71 1963 ....... 6,518 4,738 1,780 298 112 116 123 214 196 220 75 83 86 51 70 1964 ....... 6,110 4,506 1,604 298 110 117 124 202 177 211 74 81 88 57 67
1965 ....... 5,610 4,128 1,482 298 109 117 126 196 167 208 74 80 89 61 69 1966 ....... 5,214 3,854 1,360 294 110 118 130 183 150 196 79 86 91 70 69 1967 ....... 4,903 3,650 1,253 306 109 119 134 174 140 187 80 87 90 72 72 1968 ....... 4,749 3,535 1,213 300 108 121 140 168 135 181 79 88 91 62 70 1969 ....... 4,596 3,419 1,176 290 108 121 142 165 136 176 81 92 92 62 68
1970 ....... 4,523 3,348 1,175 293 109 121 143 163 137 173 83 95 92 74 65 1971 ....... 4,436 3,275 1,161 305 108 121 145 160 136 169 82 93 90 74 65 1972 ....... 4,373 3,228 1,146 294 109 120 145 158 135 167 84 95 89 79 64 1973 ....... 4,337 3,169 1,168 321 109 120 148 159 137 167 86 96 90 81 69 1974 ....... 4,389 3,075 1,314 328 108 122 156 147 146 147 86 96 86 88 69
1975 ....... 4,331 3,021 1,310 336 107 123 162 147 148 147 83 91 102 79 70 1976 ....... 4,363 2,992 1,371 337 111 125 166 145 150 143 89 95 115 93 74 1977 ....... 4,143 2,852 1,291 345 108 126 171 140 146 138 86 91 120 82 76 1978 ....... 3,937 2,680 1,256 338 115 128 175 133 138 132 98 104 126 89 89 1979 ....... 3,765 2,495 1,270 348 117 129 181 130 143 126 103 111 116 97 93
1980 ....... 3,699 2,401 1,298 352 119 132 188 126 142 120 106 116 113 114 84 1981 ....... 4 3,582 4 2,324 4 1,258 366 115 130 188 128 141 122 100 111 108 103 80 1982 ....... 4 3,466 4 2,248 4 1,218 362 113 129 185 122 126 120 98 113 102 84 87 1983 ....... 4 3,349 4 2,171 4 1,178 306 113 126 176 121 140 113 99 115 99 83 86 1984 ....... 4 3,233 4 2,095 4 1,138 348 108 121 168 119 130 114 94 103 102 90 83
1985 ....... 3,116 2,018 1,098 342 106 120 159 111 113 110 94 104 92 92 85 1986 ....... 2,912 1,873 1,039 325 103 115 148 103 109 101 94 104 85 107 78 1987 ....... 2,897 1,846 1,051 302 102 112 137 103 112 100 94 101 95 98 81 1988 ....... 2,954 1,967 1,037 297 100 109 130 106 117 102 91 99 95 83 82 1989 ....... 2,863 1,935 928 318 99 107 124 105 108 104 91 95 94 85 89
1990 ....... 2,891 2,000 892 322 101 106 120 105 109 103 96 103 94 94 85 1991 ....... 2,877 1,968 910 318 102 105 117 108 110 107 98 103 94 96 91 1992 ....... 2,810 1,944 866 319 100 104 113 102 103 101 96 102 93 97 88 1993 ....... 2,800 1,942 857 308 100 103 109 98 102 96 100 105 93 94 97 1994 ....... 2,767 1,925 842 321 102 102 106 99 101 98 103 106 96 100 100
1995 ....... 2,836 1,967 869 314 104 101 103 103 110 100 106 111 101 92 105 1996 ....... 2,842 2,010 832 326 100 100 100 100 100 100 100 100 100 100 100 1997 ....... 2,867 1,990 877 333 103 100 98 101 105 99 107 108 103 108 107 1998 ....... 2,827 1,947 880 327 105 99 98 98 107 94 112 116 104 104 111 1999 ...... 2,977 2,048 929 327 107 99 99 101 112 96 116 123 106 103 114 2000 ...... 2,952 2,062 890 324 104 98 99 98 107 94 111 120 100 101 110 2001 ...... 2,923 2,050 873 321 103 98 99 96 106 93 110 117 97 97 113 2002 ...... .............. ............ 886 316 102 98 100 96 105 92 107 113 97 98 107 2003 ...... .............. ............ 836 324 .......... .......... ............ .......... .......... .......... .......... ........... .......... .......... ...........2004 p ..... .............. ............ 825 321 .......... .......... ............ .......... .......... .......... .......... ........... .......... .......... ...........
1 Includes persons doing farmwork on all farms. These data, published by the Department of Agriculture, differ from those on agricultural employment by the Department of Labor (see Table B-35) because of differences in the method of approach, in concepts of employment, and in time of month for which the data are collected.
2 Prior to 1982 this category was termed ‘‘family workers’’ and did not include nonfamily unpaid workers. Series discontinued in 2002. 3 Acreage harvested plus acreages in fruits, tree nuts, and vegetables and minor crops. Includes double-cropping. 4 Basis for farm employment series was discontinued for 1981 through 1984. Employment is estimated for these years.
Sources: Department of Agriculture, Economic Research Service.
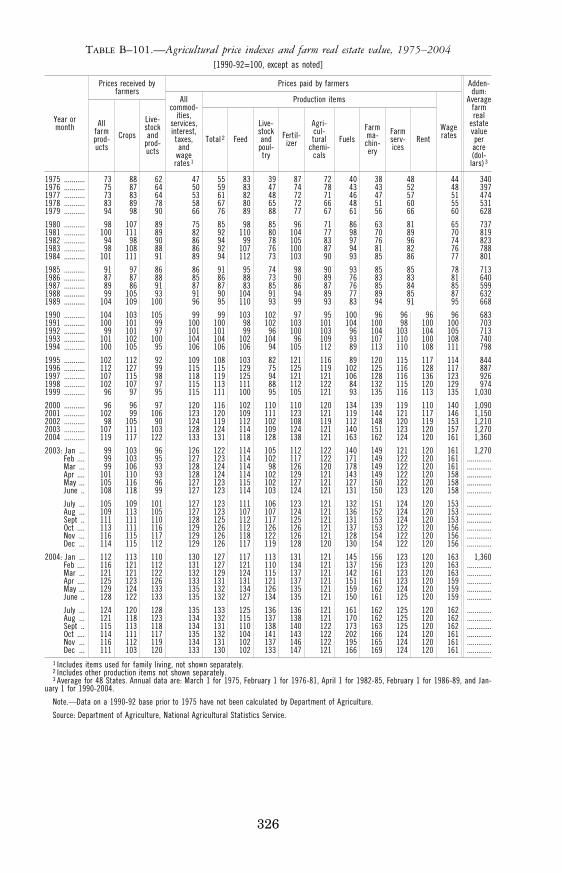
326
TABLE B–101.—Agricultural price indexes and farm real estate value, 1975–2004 [1990-92=100, except as noted]
Year or month
Prices received by farmers
Prices paid by farmers Adden- dum:
Average farm real
estate value per acre (dol-lars) 3
All farm prod- ucts
Crops
Live- stock and
prod- ucts
All commod-
ities, services, interest, taxes, and
wage rates 1
Production items
Wage rates Total 2 Feed
Live- stock and
poul- try
Fertil- izer
Agri- cul- tural
chemi- cals
Fuels Farm ma- chin- ery
Farm serv- ices
Rent
1975 ........... 73 88 62 47 55 83 39 87 72 40 38 48 44 340 1976 ........... 75 87 64 50 59 83 47 74 78 43 43 52 48 397 1977 ........... 73 83 64 53 61 82 48 72 71 46 47 57 51 474 1978 ........... 83 89 78 58 67 80 65 72 66 48 51 60 55 531 1979 ........... 94 98 90 66 76 89 88 77 67 61 56 66 60 628
1980 ........... 98 107 89 75 85 98 85 96 71 86 63 81 65 737 1981 ........... 100 111 89 82 92 110 80 104 77 98 70 89 70 819 1982 ........... 94 98 90 86 94 99 78 105 83 97 76 96 74 823 1983 ........... 98 108 88 86 92 107 76 100 87 94 81 82 76 788 1984 ........... 101 111 91 89 94 112 73 103 90 93 85 86 77 801
1985 ........... 91 97 86 86 91 95 74 98 90 93 85 85 78 713 1986 ........... 87 87 88 85 86 88 73 90 89 76 83 83 81 640 1987 ........... 89 86 91 87 87 83 85 86 87 76 85 84 85 599 1988 ........... 99 105 93 91 90 104 91 94 89 77 89 85 87 632 1989 ........... 104 109 100 96 95 110 93 99 93 83 94 91 95 668
1990 ........... 104 103 105 99 99 103 102 97 95 100 96 96 96 96 683 1991 ........... 100 101 99 100 100 98 102 103 101 104 100 98 100 100 703 1992 ........... 99 101 97 101 101 99 96 100 103 96 104 103 104 105 713 1993 ........... 101 102 100 104 104 102 104 96 109 93 107 110 100 108 740 1994 ........... 100 105 95 106 106 106 94 105 112 89 113 110 108 111 798
1995 ........... 102 112 92 109 108 103 82 121 116 89 120 115 117 114 844 1996 ........... 112 127 99 115 115 129 75 125 119 102 125 116 128 117 887 1997 ........... 107 115 98 118 119 125 94 121 121 106 128 116 136 123 926 1998 ........... 102 107 97 115 113 111 88 112 122 84 132 115 120 129 974 1999 ........... 96 97 95 115 111 100 95 105 121 93 135 116 113 135 1,030
2000 ........... 96 96 97 120 116 102 110 110 120 134 139 119 110 140 1,090 2001 ........... 102 99 106 123 120 109 111 123 121 119 144 121 117 146 1,150 2002 ........... 98 105 90 124 119 112 102 108 119 112 148 120 119 153 1,210 2003 ........... 107 111 103 128 124 114 109 124 121 140 151 123 120 157 1,270 2004 ........... 119 117 122 133 131 118 128 138 121 163 162 124 120 161 1,360
2003: Jan ... 99 103 96 126 122 114 105 112 122 140 149 121 120 161 1,270 Feb .... 99 103 95 127 123 114 102 117 122 171 149 122 120 161 .............Mar ... 99 106 93 128 124 114 98 126 120 178 149 122 120 161 .............Apr .... 101 110 93 128 124 114 102 129 121 143 149 122 120 158 .............May ... 105 116 96 127 123 115 102 127 121 127 150 122 120 158 .............June .. 108 118 99 127 123 114 103 124 121 131 150 123 120 158 .............
July ... 105 109 101 127 123 111 106 123 121 132 151 124 120 153 .............Aug ... 109 113 105 127 123 107 107 124 121 136 152 124 120 153 .............Sept .. 111 111 110 128 125 112 117 125 121 131 153 124 120 153 .............Oct .... 113 111 116 129 126 112 126 126 121 137 153 122 120 156 .............Nov ... 116 115 117 129 126 118 122 126 121 128 154 122 120 156 .............Dec ... 114 115 112 129 126 117 119 128 120 130 154 122 120 156 .............
2004: Jan ... 112 113 110 130 127 117 113 131 121 145 156 123 120 163 1,360 Feb .... 116 121 112 131 127 121 110 134 121 137 156 123 120 163 .............Mar ... 121 121 122 132 129 124 115 137 121 142 161 123 120 163 .............Apr .... 125 123 126 133 131 131 121 137 121 151 161 123 120 159 .............May ... 129 124 133 135 132 134 126 135 121 159 162 124 120 159 .............June .. 128 122 133 135 132 127 134 135 121 150 161 125 120 159 .............
July ... 124 120 128 135 133 125 136 136 121 161 162 125 120 162 .............Aug ... 121 118 123 134 132 115 137 138 121 170 162 125 120 162 .............Sept .. 115 113 118 134 131 110 138 140 122 173 163 125 120 162 .............Oct .... 114 111 117 135 132 104 141 143 122 202 166 124 120 161 .............Nov ... 116 112 119 134 131 102 137 146 122 195 165 124 120 161 .............Dec ... 111 103 120 133 130 102 133 147 121 166 169 124 120 161 .............
1 Includes items used for family living, not shown separately. 2 Includes other production items not shown separately. 3 Average for 48 States. Annual data are: March 1 for 1975, February 1 for 1976-81, April 1 for 1982-85, February 1 for 1986-89, and Jan-
uary 1 for 1990-2004.
Note.—Data on a 1990-92 base prior to 1975 have not been calculated by Department of Agriculture.
Source: Department of Agriculture, National Agricultural Statistics Service.
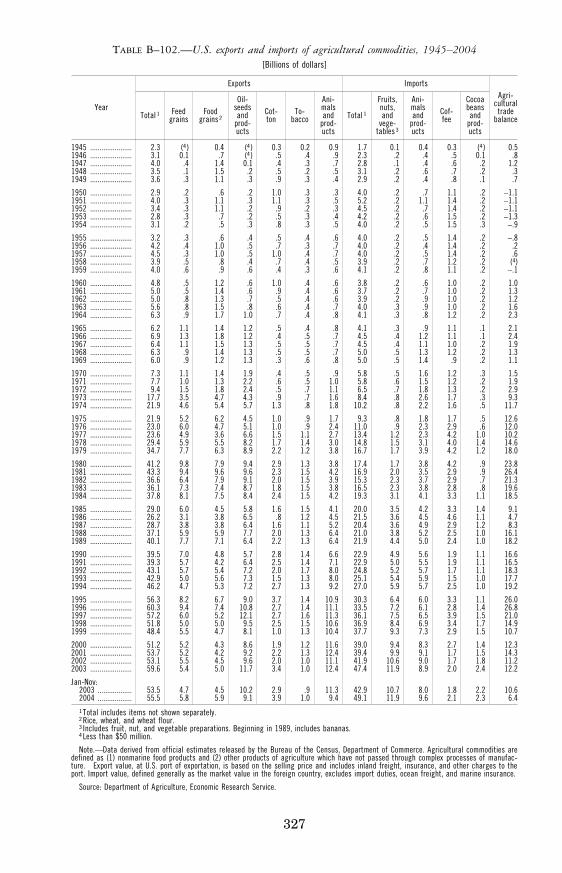
327
TABLE B–102.—U.S. exports and imports of agricultural commodities, 1945–2004 [Billions of dollars]
Year
Exports Imports Agri-
cultural trade
balance Total 1 Feed grains
Food grains 2
Oil- seeds and
prod- ucts
Cot- ton
To- bacco
Ani- mals and
prod- ucts
Total 1
Fruits, nuts, and
vege- tables 3
Ani- mals and
prod- ucts
Cof- fee
Cocoa beans and
prod- ucts
1945 ...................... 2.3 (4) 0.4 (4) 0.3 0.2 0.9 1.7 0.1 0.4 0.3 (4) 0.5 1946 ...................... 3.1 0.1 .7 (4) .5 .4 .9 2.3 .2 .4 .5 0.1 .8 1947 ...................... 4.0 .4 1.4 0.1 .4 .3 .7 2.8 .1 .4 .6 .2 1.2 1948 ...................... 3.5 .1 1.5 .2 .5 .2 .5 3.1 .2 .6 .7 .2 .3 1949 ...................... 3.6 .3 1.1 .3 .9 .3 .4 2.9 .2 .4 .8 .1 .7
1950 ...................... 2.9 .2 .6 .2 1.0 .3 .3 4.0 .2 .7 1.1 .2 −1.1 1951 ...................... 4.0 .3 1.1 .3 1.1 .3 .5 5.2 .2 1.1 1.4 .2 −1.1 1952 ...................... 3.4 .3 1.1 .2 .9 .2 .3 4.5 .2 .7 1.4 .2 −1.1 1953 ...................... 2.8 .3 .7 .2 .5 .3 .4 4.2 .2 .6 1.5 .2 −1.3 1954 ...................... 3.1 .2 .5 .3 .8 .3 .5 4.0 .2 .5 1.5 .3 −.9
1955 ...................... 3.2 .3 .6 .4 .5 .4 .6 4.0 .2 .5 1.4 .2 −.8 1956 ...................... 4.2 .4 1.0 .5 .7 .3 .7 4.0 .2 .4 1.4 .2 .2 1957 ...................... 4.5 .3 1.0 .5 1.0 .4 .7 4.0 .2 .5 1.4 .2 .6 1958 ...................... 3.9 .5 .8 .4 .7 .4 .5 3.9 .2 .7 1.2 .2 (4) 1959 ...................... 4.0 .6 .9 .6 .4 .3 .6 4.1 .2 .8 1.1 .2 −.1
1960 ...................... 4.8 .5 1.2 .6 1.0 .4 .6 3.8 .2 .6 1.0 .2 1.0 1961 ...................... 5.0 .5 1.4 .6 .9 .4 .6 3.7 .2 .7 1.0 .2 1.3 1962 ...................... 5.0 .8 1.3 .7 .5 .4 .6 3.9 .2 .9 1.0 .2 1.2 1963 ...................... 5.6 .8 1.5 .8 .6 .4 .7 4.0 .3 .9 1.0 .2 1.6 1964 ...................... 6.3 .9 1.7 1.0 .7 .4 .8 4.1 .3 .8 1.2 .2 2.3
1965 ...................... 6.2 1.1 1.4 1.2 .5 .4 .8 4.1 .3 .9 1.1 .1 2.1 1966 ...................... 6.9 1.3 1.8 1.2 .4 .5 .7 4.5 .4 1.2 1.1 .1 2.4 1967 ...................... 6.4 1.1 1.5 1.3 .5 .5 .7 4.5 .4 1.1 1.0 .2 1.9 1968 ...................... 6.3 .9 1.4 1.3 .5 .5 .7 5.0 .5 1.3 1.2 .2 1.3 1969 ...................... 6.0 .9 1.2 1.3 .3 .6 .8 5.0 .5 1.4 .9 .2 1.1
1970 ...................... 7.3 1.1 1.4 1.9 .4 .5 .9 5.8 .5 1.6 1.2 .3 1.5 1971 ...................... 7.7 1.0 1.3 2.2 .6 .5 1.0 5.8 .6 1.5 1.2 .2 1.9 1972 ...................... 9.4 1.5 1.8 2.4 .5 .7 1.1 6.5 .7 1.8 1.3 .2 2.9 1973 ...................... 17.7 3.5 4.7 4.3 .9 .7 1.6 8.4 .8 2.6 1.7 .3 9.3 1974 ...................... 21.9 4.6 5.4 5.7 1.3 .8 1.8 10.2 .8 2.2 1.6 .5 11.7
1975 ...................... 21.9 5.2 6.2 4.5 1.0 .9 1.7 9.3 .8 1.8 1.7 .5 12.6 1976 ...................... 23.0 6.0 4.7 5.1 1.0 .9 2.4 11.0 .9 2.3 2.9 .6 12.0 1977 ...................... 23.6 4.9 3.6 6.6 1.5 1.1 2.7 13.4 1.2 2.3 4.2 1.0 10.2 1978 ...................... 29.4 5.9 5.5 8.2 1.7 1.4 3.0 14.8 1.5 3.1 4.0 1.4 14.6 1979 ...................... 34.7 7.7 6.3 8.9 2.2 1.2 3.8 16.7 1.7 3.9 4.2 1.2 18.0
1980 ...................... 41.2 9.8 7.9 9.4 2.9 1.3 3.8 17.4 1.7 3.8 4.2 .9 23.8 1981 ...................... 43.3 9.4 9.6 9.6 2.3 1.5 4.2 16.9 2.0 3.5 2.9 .9 26.4 1982 ...................... 36.6 6.4 7.9 9.1 2.0 1.5 3.9 15.3 2.3 3.7 2.9 .7 21.3 1983 ...................... 36.1 7.3 7.4 8.7 1.8 1.5 3.8 16.5 2.3 3.8 2.8 .8 19.6 1984 ...................... 37.8 8.1 7.5 8.4 2.4 1.5 4.2 19.3 3.1 4.1 3.3 1.1 18.5
1985 ...................... 29.0 6.0 4.5 5.8 1.6 1.5 4.1 20.0 3.5 4.2 3.3 1.4 9.1 1986 ...................... 26.2 3.1 3.8 6.5 .8 1.2 4.5 21.5 3.6 4.5 4.6 1.1 4.7 1987 ...................... 28.7 3.8 3.8 6.4 1.6 1.1 5.2 20.4 3.6 4.9 2.9 1.2 8.3 1988 ...................... 37.1 5.9 5.9 7.7 2.0 1.3 6.4 21.0 3.8 5.2 2.5 1.0 16.1 1989 ...................... 40.1 7.7 7.1 6.4 2.2 1.3 6.4 21.9 4.4 5.0 2.4 1.0 18.2
1990 ...................... 39.5 7.0 4.8 5.7 2.8 1.4 6.6 22.9 4.9 5.6 1.9 1.1 16.6 1991 ...................... 39.3 5.7 4.2 6.4 2.5 1.4 7.1 22.9 5.0 5.5 1.9 1.1 16.5 1992 ...................... 43.1 5.7 5.4 7.2 2.0 1.7 8.0 24.8 5.2 5.7 1.7 1.1 18.3 1993 ...................... 42.9 5.0 5.6 7.3 1.5 1.3 8.0 25.1 5.4 5.9 1.5 1.0 17.7 1994 ...................... 46.2 4.7 5.3 7.2 2.7 1.3 9.2 27.0 5.9 5.7 2.5 1.0 19.2
1995 ...................... 56.3 8.2 6.7 9.0 3.7 1.4 10.9 30.3 6.4 6.0 3.3 1.1 26.0 1996 ...................... 60.3 9.4 7.4 10.8 2.7 1.4 11.1 33.5 7.2 6.1 2.8 1.4 26.8 1997 ...................... 57.2 6.0 5.2 12.1 2.7 1.6 11.3 36.1 7.5 6.5 3.9 1.5 21.0 1998 ...................... 51.8 5.0 5.0 9.5 2.5 1.5 10.6 36.9 8.4 6.9 3.4 1.7 14.9 1999 ...................... 48.4 5.5 4.7 8.1 1.0 1.3 10.4 37.7 9.3 7.3 2.9 1.5 10.7
2000 ...................... 51.2 5.2 4.3 8.6 1.9 1.2 11.6 39.0 9.4 8.3 2.7 1.4 12.3 2001 ...................... 53.7 5.2 4.2 9.2 2.2 1.3 12.4 39.4 9.9 9.1 1.7 1.5 14.3 2002 ...................... 53.1 5.5 4.5 9.6 2.0 1.0 11.1 41.9 10.6 9.0 1.7 1.8 11.2 2003 ...................... 59.6 5.4 5.0 11.7 3.4 1.0 12.4 47.4 11.9 8.9 2.0 2.4 12.2
Jan-Nov: 2003 .................. 53.5 4.7 4.5 10.2 2.9 .9 11.3 42.9 10.7 8.0 1.8 2.2 10.6 2004 .................. 55.5 5.8 5.9 9.1 3.9 1.0 9.4 49.1 11.9 9.6 2.1 2.3 6.4 1 Total includes items not shown separately. 2 Rice, wheat, and wheat flour. 3 Includes fruit, nut, and vegetable preparations. Beginning in 1989, includes bananas. 4 Less than $50 million.
Note.—Data derived from official estimates released by the Bureau of the Census, Department of Commerce. Agricultural commodities are defined as (1) nonmarine food products and (2) other products of agriculture which have not passed through complex processes of manufac-ture. Export value, at U.S. port of exportation, is based on the selling price and includes inland freight, insurance, and other charges to the port. Import value, defined generally as the market value in the foreign country, excludes import duties, ocean freight, and marine insurance.
Source: Department of Agriculture, Economic Research Service.
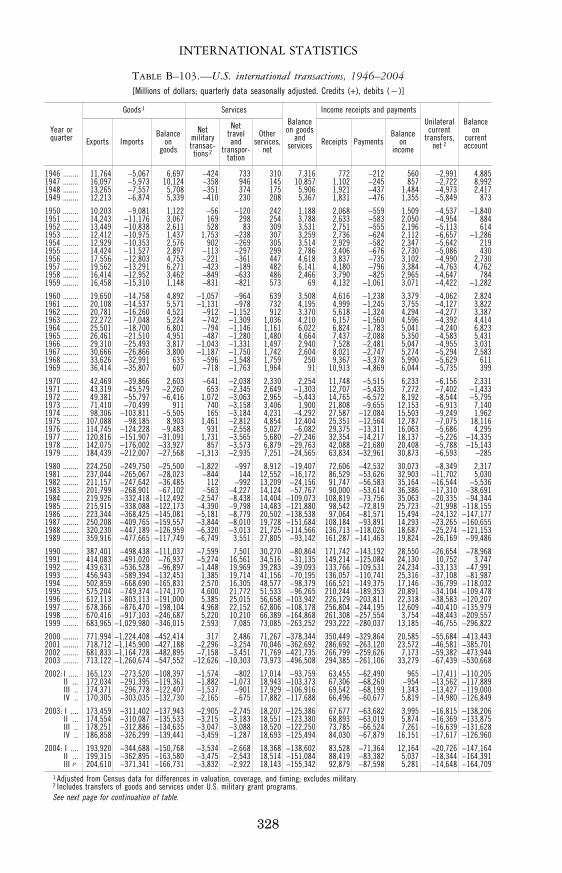
328
INTERNATIONAL STATISTICS
TABLE B–103.—U.S. international transactions, 1946–2004 [Millions of dollars; quarterly data seasonally adjusted. Credits (+), debits (¥)]
Year or quarter
Goods 1 Services Balance on goods
and services
Income receipts and payments Unilateral
current transfers,
net 2
Balance on
current account Exports Imports
Balance on
goods
Net military transac- tions 2
Net travel and
transpor-tation
Other services,
net Receipts Payments
Balance on
income
1946 ........ 11,764 −5,067 6,697 −424 733 310 7,316 772 −212 560 −2,991 4,885 1947 ........ 16,097 −5,973 10,124 −358 946 145 10,857 1,102 −245 857 −2,722 8,992 1948 ........ 13,265 −7,557 5,708 −351 374 175 5,906 1,921 −437 1,484 −4,973 2,417 1949 ........ 12,213 −6,874 5,339 −410 230 208 5,367 1,831 −476 1,355 −5,849 873
1950 ........ 10,203 −9,081 1,122 −56 −120 242 1,188 2,068 −559 1,509 −4,537 −1,840 1951 ........ 14,243 −11,176 3,067 169 298 254 3,788 2,633 −583 2,050 −4,954 884 1952 ........ 13,449 −10,838 2,611 528 83 309 3,531 2,751 −555 2,196 −5,113 614 1953 ........ 12,412 −10,975 1,437 1,753 −238 307 3,259 2,736 −624 2,112 −6,657 −1,286 1954 ........ 12,929 −10,353 2,576 902 −269 305 3,514 2,929 −582 2,347 −5,642 219 1955 ........ 14,424 −11,527 2,897 −113 −297 299 2,786 3,406 −676 2,730 −5,086 430 1956 ........ 17,556 −12,803 4,753 −221 −361 447 4,618 3,837 −735 3,102 −4,990 2,730 1957 ........ 19,562 −13,291 6,271 −423 −189 482 6,141 4,180 −796 3,384 −4,763 4,762 1958 ........ 16,414 −12,952 3,462 −849 −633 486 2,466 3,790 −825 2,965 −4,647 784 1959 ........ 16,458 −15,310 1,148 −831 −821 573 69 4,132 −1,061 3,071 −4,422 −1,282
1960 ........ 19,650 −14,758 4,892 −1,057 −964 639 3,508 4,616 −1,238 3,379 −4,062 2,824 1961 ........ 20,108 −14,537 5,571 −1,131 −978 732 4,195 4,999 −1,245 3,755 −4,127 3,822 1962 ........ 20,781 −16,260 4,521 −912 −1,152 912 3,370 5,618 −1,324 4,294 −4,277 3,387 1963 ........ 22,272 −17,048 5,224 −742 −1,309 1,036 4,210 6,157 −1,560 4,596 −4,392 4,414 1964 ........ 25,501 −18,700 6,801 −794 −1,146 1,161 6,022 6,824 −1,783 5,041 −4,240 6,823 1965 ........ 26,461 −21,510 4,951 −487 −1,280 1,480 4,664 7,437 −2,088 5,350 −4,583 5,431 1966 ........ 29,310 −25,493 3,817 −1,043 −1,331 1,497 2,940 7,528 −2,481 5,047 −4,955 3,031 1967 ........ 30,666 −26,866 3,800 −1,187 −1,750 1,742 2,604 8,021 −2,747 5,274 −5,294 2,583 1968 ........ 33,626 −32,991 635 −596 −1,548 1,759 250 9,367 −3,378 5,990 −5,629 611 1969 ........ 36,414 −35,807 607 −718 −1,763 1,964 91 10,913 −4,869 6,044 −5,735 399
1970 ........ 42,469 −39,866 2,603 −641 −2,038 2,330 2,254 11,748 −5,515 6,233 −6,156 2,331 1971 ........ 43,319 −45,579 −2,260 653 −2,345 2,649 −1,303 12,707 −5,435 7,272 −7,402 −1,433 1972 ........ 49,381 −55,797 −6,416 1,072 −3,063 2,965 −5,443 14,765 −6,572 8,192 −8,544 −5,795 1973 ........ 71,410 −70,499 911 740 −3,158 3,406 1,900 21,808 −9,655 12,153 −6,913 7,140 1974 ........ 98,306 −103,811 −5,505 165 −3,184 4,231 −4,292 27,587 −12,084 15,503 −9,249 1,962 1975 ........ 107,088 −98,185 8,903 1,461 −2,812 4,854 12,404 25,351 −12,564 12,787 −7,075 18,116 1976 ........ 114,745 −124,228 −9,483 931 −2,558 5,027 −6,082 29,375 −13,311 16,063 −5,686 4,295 1977 ........ 120,816 −151,907 −31,091 1,731 −3,565 5,680 −27,246 32,354 −14,217 18,137 −5,226 −14,335 1978 ........ 142,075 −176,002 −33,927 857 −3,573 6,879 −29,763 42,088 −21,680 20,408 −5,788 −15,143 1979 ........ 184,439 −212,007 −27,568 −1,313 −2,935 7,251 −24,565 63,834 −32,961 30,873 −6,593 −285
1980 ........ 224,250 −249,750 −25,500 −1,822 −997 8,912 −19,407 72,606 −42,532 30,073 −8,349 2,317 1981 ........ 237,044 −265,067 −28,023 −844 144 12,552 −16,172 86,529 −53,626 32,903 −11,702 5,030 1982 ........ 211,157 −247,642 −36,485 112 −992 13,209 −24,156 91,747 −56,583 35,164 −16,544 −5,536 1983 ........ 201,799 −268,901 −67,102 −563 −4,227 14,124 −57,767 90,000 −53,614 36,386 −17,310 −38,691 1984 ........ 219,926 −332,418 −112,492 −2,547 −8,438 14,404 −109,073 108,819 −73,756 35,063 −20,335 −94,344 1985 ........ 215,915 −338,088 −122,173 −4,390 −9,798 14,483 −121,880 98,542 −72,819 25,723 −21,998 −118,155 1986 ........ 223,344 −368,425 −145,081 −5,181 −8,779 20,502 −138,538 97,064 −81,571 15,494 −24,132 −147,177 1987 ........ 250,208 −409,765 −159,557 −3,844 −8,010 19,728 −151,684 108,184 −93,891 14,293 −23,265 −160,655 1988 ........ 320,230 −447,189 −126,959 −6,320 −3,013 21,725 −114,566 136,713 −118,026 18,687 −25,274 −121,153 1989 ........ 359,916 −477,665 −117,749 −6,749 3,551 27,805 −93,142 161,287 −141,463 19,824 −26,169 −99,486
1990 ........ 387,401 −498,438 −111,037 −7,599 7,501 30,270 −80,864 171,742 −143,192 28,550 −26,654 −78,968 1991 ........ 414,083 −491,020 −76,937 −5,274 16,561 34,516 −31,135 149,214 −125,084 24,130 10,752 3,747 1992 ........ 439,631 −536,528 −96,897 −1,448 19,969 39,283 −39,093 133,766 −109,531 24,234 −33,133 −47,991 1993 ........ 456,943 −589,394 −132,451 1,385 19,714 41,156 −70,195 136,057 −110,741 25,316 −37,108 −81,987 1994 ........ 502,859 −668,690 −165,831 2,570 16,305 48,577 −98,379 166,521 −149,375 17,146 −36,799 −118,032 1995 ........ 575,204 −749,374 −174,170 4,600 21,772 51,533 −96,265 210,244 −189,353 20,891 −34,104 −109,478 1996 ........ 612,113 −803,113 −191,000 5,385 25,015 56,658 −103,942 226,129 −203,811 22,318 −38,583 −120,207 1997 ........ 678,366 −876,470 −198,104 4,968 22,152 62,806 −108,178 256,804 −244,195 12,609 −40,410 −135,979 1998 ........ 670,416 −917,103 −246,687 5,220 10,210 66,389 −164,868 261,308 −257,554 3,754 −48,443 −209,557 1999 ........ 683,965 −1,029,980 −346,015 2,593 7,085 73,085 −263,252 293,222 −280,037 13,185 −46,755 −296,822
2000 ........ 771,994 −1,224,408 −452,414 317 2,486 71,267 −378,344 350,449 −329,864 20,585 −55,684 −413,443 2001 ........ 718,712 −1,145,900 −427,188 −2,296 −3,254 70,046 −362,692 286,692 −263,120 23,572 −46,581 −385,701 2002 ........ 681,833 −1,164,728 −482,895 −7,158 −3,451 71,769 −421,735 266,799 −259,626 7,173 −59,382 −473,944 2003 ........ 713,122 −1,260,674 −547,552 −12,626 −10,303 73,973 −496,508 294,385 −261,106 33,279 −67,439 −530,668
2002: I ..... 165,123 −273,520 −108,397 −1,574 −802 17,014 −93,759 63,455 −62,490 965 −17,411 −110,205 II ... 172,034 −291,395 −119,361 −1,882 −1,073 18,943 −103,373 67,306 −68,260 −954 −13,562 −117,889 III .. 174,371 −296,778 −122,407 −1,537 −901 17,929 −106,916 69,542 −68,199 1,343 −13,427 −119,000 IV .. 170,305 −303,035 −132,730 −2,165 −675 17,882 −117,688 66,496 −60,677 5,819 −14,980 −126,849
2003: I .... 173,459 −311,402 −137,943 −2,905 −2,745 18,207 −125,386 67,677 −63,682 3,995 −16,815 −138,206 II ... 174,554 −310,087 −135,533 −3,215 −3,183 18,551 −123,380 68,893 −63,019 5,874 −16,369 −133,875 III .. 178,251 −312,886 −134,635 −3,047 −3,088 18,520 −122,250 73,785 −66,524 7,261 −16,639 −131,628 IV .. 186,858 −326,299 −139,441 −3,459 −1,287 18,693 −125,494 84,030 −67,879 16,151 −17,617 −126,960
2004: I .... 193,920 −344,688 −150,768 −3,534 −2,668 18,368 −138,602 83,528 −71,364 12,164 −20,726 −147,164 II ... 199,315 −362,895 −163,580 −3,475 −2,543 18,514 −151,084 88,419 −83,382 5,037 −18,344 −164,391 III p 204,610 −371,341 −166,731 −3,832 −2,922 18,143 −155,342 92,879 −87,598 5,281 −14,648 −164,709
1 Adjusted from Census data for differences in valuation, coverage, and timing; excludes military. 2 Includes transfers of goods and services under U.S. military grant programs. See next page for continuation of table.
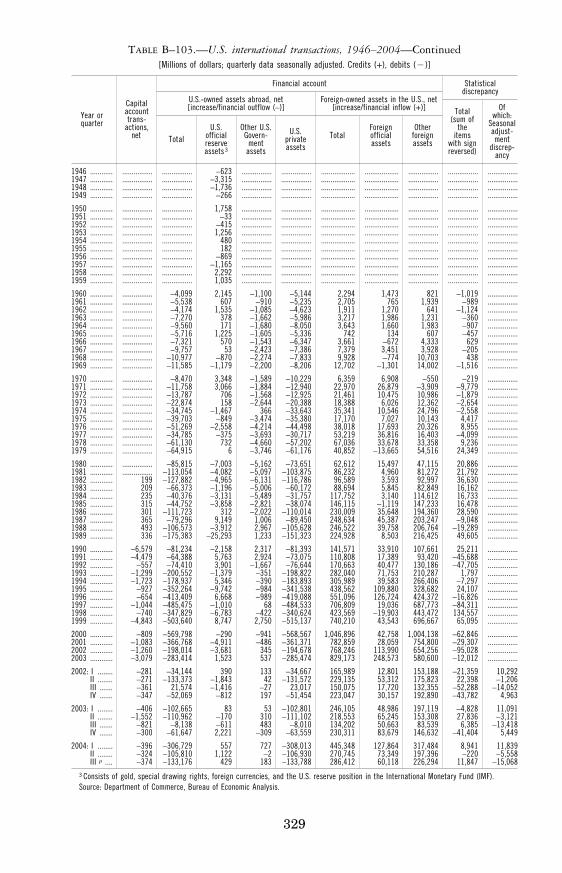
329
TABLE B–103.—U.S. international transactions, 1946–2004—Continued [Millions of dollars; quarterly data seasonally adjusted. Credits (+), debits (¥)]
Year or quarter
Capital account trans-
actions, net
Financial account Statistical discrepancy
U.S.-owned assets abroad, net [increase/financial outflow (−)]
Foreign-owned assets in the U.S., net [increase/financial inflow (+)] Total
(sum of the
items with sign reversed)
Of which:
Seasonal adjust-ment
discrep-ancy
Total U.S.
official reserve assets 3
Other U.S. Govern-
ment assets
U.S. private assets
TotalForeign official assets
Other foreign assets
1946 ............ ................ ................ −623 ................ ................ .................. .................. ................ ................ ................1947 ............ ................ ................ −3,315 ................ ................ .................. .................. ................ ................ ................1948 ............ ................ ................ −1,736 ................ ................ .................. .................. ................ ................ ................1949 ............ ................ ................ −266 ................ ................ .................. .................. ................ ................ ................
1950 ............ ................ ................ 1,758 ................ ................ .................. .................. ................ ................ ................1951 ............ ................ ................ −33 ................ ................ .................. .................. ................ ................ ................1952 ............ ................ ................ −415 ................ ................ .................. .................. ................ ................ ................1953 ............ ................ ................ 1,256 ................ ................ .................. .................. ................ ................ ................1954 ............ ................ ................ 480 ................ ................ .................. .................. ................ ................ ................1955 ............ ................ ................ 182 ................ ................ .................. .................. ................ ................ ................1956 ............ ................ ................ −869 ................ ................ .................. .................. ................ ................ ................1957 ............ ................ ................ −1,165 ................ ................ .................. .................. ................ ................ ................1958 ............ ................ ................ 2,292 ................ ................ .................. .................. ................ ................ ................1959 ............ ................ ................ 1,035 ................ ................ .................. .................. ................ ................ ................
1960 ............ ................ −4,099 2,145 −1,100 −5,144 2,294 1,473 821 −1,019 ................1961 ............ ................ −5,538 607 −910 −5,235 2,705 765 1,939 −989 ................1962 ............ ................ −4,174 1,535 −1,085 −4,623 1,911 1,270 641 −1,124 ................1963 ............ ................ −7,270 378 −1,662 −5,986 3,217 1,986 1,231 −360 ................1964 ............ ................ −9,560 171 −1,680 −8,050 3,643 1,660 1,983 −907 ................1965 ............ ................ −5,716 1,225 −1,605 −5,336 742 134 607 −457 ................1966 ............ ................ −7,321 570 −1,543 −6,347 3,661 −672 4,333 629 ................1967 ............ ................ −9,757 53 −2,423 −7,386 7,379 3,451 3,928 −205 ................1968 ............ ................ −10,977 −870 −2,274 −7,833 9,928 −774 10,703 438 ................1969 ............ ................ −11,585 −1,179 −2,200 −8,206 12,702 −1,301 14,002 −1,516 ................
1970 ............ ................ −8,470 3,348 −1,589 −10,229 6,359 6,908 −550 −219 ................1971 ............ ................ −11,758 3,066 −1,884 −12,940 22,970 26,879 −3,909 −9,779 ................1972 ............ ................ −13,787 706 −1,568 −12,925 21,461 10,475 10,986 −1,879 ................1973 ............ ................ −22,874 158 −2,644 −20,388 18,388 6,026 12,362 −2,654 ................1974 ............ ................ −34,745 −1,467 366 −33,643 35,341 10,546 24,796 −2,558 ................1975 ............ ................ −39,703 −849 −3,474 −35,380 17,170 7,027 10,143 4,417 ................1976 ............ ................ −51,269 −2,558 −4,214 −44,498 38,018 17,693 20,326 8,955 ................1977 ............ ................ −34,785 −375 −3,693 −30,717 53,219 36,816 16,403 −4,099 ................1978 ............ ................ −61,130 732 −4,660 −57,202 67,036 33,678 33,358 9,236 ................1979 ............ ................ −64,915 6 −3,746 −61,176 40,852 −13,665 54,516 24,349 ................
1980 ............ ................ −85,815 −7,003 −5,162 −73,651 62,612 15,497 47,115 20,886 ................1981 ............ ................ −113,054 −4,082 −5,097 −103,875 86,232 4,960 81,272 21,792 ................1982 ............ 199 −127,882 −4,965 −6,131 −116,786 96,589 3,593 92,997 36,630 ................1983 ............ 209 −66,373 −1,196 −5,006 −60,172 88,694 5,845 82,849 16,162 ................1984 ............ 235 −40,376 −3,131 −5,489 −31,757 117,752 3,140 114,612 16,733 ................1985 ............ 315 −44,752 −3,858 −2,821 −38,074 146,115 −1,119 147,233 16,478 ................1986 ............ 301 −111,723 312 −2,022 −110,014 230,009 35,648 194,360 28,590 ................1987 ............ 365 −79,296 9,149 1,006 −89,450 248,634 45,387 203,247 −9,048 ................1988 ............ 493 −106,573 −3,912 2,967 −105,628 246,522 39,758 206,764 −19,289 ................1989 ............ 336 −175,383 −25,293 1,233 −151,323 224,928 8,503 216,425 49,605 ................
1990 ............ −6,579 −81,234 −2,158 2,317 −81,393 141,571 33,910 107,661 25,211 ................1991 ............ −4,479 −64,388 5,763 2,924 −73,075 110,808 17,389 93,420 −45,688 ................1992 ............ −557 −74,410 3,901 −1,667 −76,644 170,663 40,477 130,186 −47,705 ................1993 ............ −1,299 −200,552 −1,379 −351 −198,822 282,040 71,753 210,287 1,797 ................1994 ............ −1,723 −178,937 5,346 −390 −183,893 305,989 39,583 266,406 −7,297 ................1995 ............ −927 −352,264 −9,742 −984 −341,538 438,562 109,880 328,682 24,107 ................1996 ............ −654 −413,409 6,668 −989 −419,088 551,096 126,724 424,372 −16,826 ................1997 ............ −1,044 −485,475 −1,010 68 −484,533 706,809 19,036 687,773 −84,311 ................1998 ............ −740 −347,829 −6,783 −422 −340,624 423,569 −19,903 443,472 134,557 ................1999 ............ −4,843 −503,640 8,747 2,750 −515,137 740,210 43,543 696,667 65,095 ................
2000 ............ −809 −569,798 −290 −941 −568,567 1,046,896 42,758 1,004,138 −62,846 ................2001 ............ −1,083 −366,768 −4,911 −486 −361,371 782,859 28,059 754,800 −29,307 ................2002 ............ −1,260 −198,014 −3,681 345 −194,678 768,246 113,990 654,256 −95,028 ................2003 ............ −3,079 −283,414 1,523 537 −285,474 829,173 248,573 580,600 −12,012 ................
2002: I ........ −281 −34,144 390 133 −34,667 165,989 12,801 153,188 −21,359 10,292 II ........ −271 −133,373 −1,843 42 −131,572 229,135 53,312 175,823 22,398 −1,206 III ....... −361 21,574 −1,416 −27 23,017 150,075 17,720 132,355 −52,288 −14,052 IV ....... −347 −52,069 −812 197 −51,454 223,047 30,157 192,890 −43,782 4,963
2003: I ........ −406 −102,665 83 53 −102,801 246,105 48,986 197,119 −4,828 11,091 II ........ −1,552 −110,962 −170 310 −111,102 218,553 65,245 153,308 27,836 −3,121 III ....... −821 −8,138 −611 483 −8,010 134,202 50,663 83,539 6,385 −13,418 IV ....... −300 −61,647 2,221 −309 −63,559 230,311 83,679 146,632 −41,404 5,449
2004: I ........ −396 −306,729 557 727 −308,013 445,348 127,864 317,484 8,941 11,839 II ........ −324 −105,810 1,122 −2 −106,930 270,745 73,349 197,396 −220 −5,558 III p .... −374 −133,176 429 183 −133,788 286,412 60,118 226,294 11,847 −15,068
3 Consists of gold, special drawing rights, foreign currencies, and the U.S. reserve position in the International Monetary Fund (IMF). Source: Department of Commerce, Bureau of Economic Analysis.
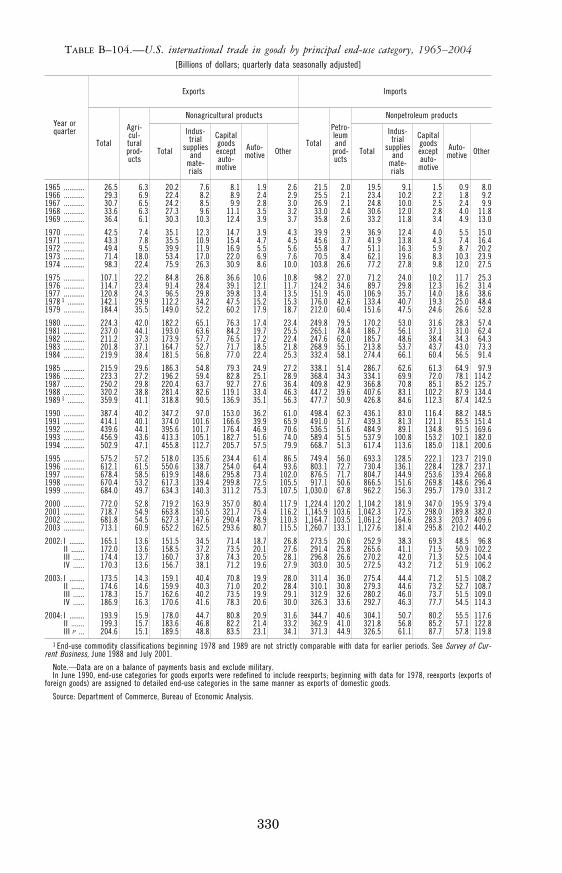
330
TABLE B–104.—U.S. international trade in goods by principal end-use category, 1965–2004 [Billions of dollars; quarterly data seasonally adjusted]
Year or quarter
Exports Imports
Total
Agri- cul- tural prod- ucts
Nonagricultural products
Total
Petro- leum and
prod- ucts
Nonpetroleum products
Total
Indus-trial
supplies and
mate-rials
Capital goods except auto-
motive
Auto-motive Other Total
Indus-trial
supplies and
mate-rials
Capital goods except auto-
motive
Auto-motive Other
1965 ........... 26.5 6.3 20.2 7.6 8.1 1.9 2.6 21.5 2.0 19.5 9.1 1.5 0.9 8.0 1966 ........... 29.3 6.9 22.4 8.2 8.9 2.4 2.9 25.5 2.1 23.4 10.2 2.2 1.8 9.2 1967 ........... 30.7 6.5 24.2 8.5 9.9 2.8 3.0 26.9 2.1 24.8 10.0 2.5 2.4 9.9 1968 ........... 33.6 6.3 27.3 9.6 11.1 3.5 3.2 33.0 2.4 30.6 12.0 2.8 4.0 11.8 1969 ........... 36.4 6.1 30.3 10.3 12.4 3.9 3.7 35.8 2.6 33.2 11.8 3.4 4.9 13.0
1970 ........... 42.5 7.4 35.1 12.3 14.7 3.9 4.3 39.9 2.9 36.9 12.4 4.0 5.5 15.0 1971 ........... 43.3 7.8 35.5 10.9 15.4 4.7 4.5 45.6 3.7 41.9 13.8 4.3 7.4 16.4 1972 ........... 49.4 9.5 39.9 11.9 16.9 5.5 5.6 55.8 4.7 51.1 16.3 5.9 8.7 20.2 1973 ........... 71.4 18.0 53.4 17.0 22.0 6.9 7.6 70.5 8.4 62.1 19.6 8.3 10.3 23.9 1974 ........... 98.3 22.4 75.9 26.3 30.9 8.6 10.0 103.8 26.6 77.2 27.8 9.8 12.0 27.5
1975 ........... 107.1 22.2 84.8 26.8 36.6 10.6 10.8 98.2 27.0 71.2 24.0 10.2 11.7 25.3 1976 ........... 114.7 23.4 91.4 28.4 39.1 12.1 11.7 124.2 34.6 89.7 29.8 12.3 16.2 31.4 1977 ........... 120.8 24.3 96.5 29.8 39.8 13.4 13.5 151.9 45.0 106.9 35.7 14.0 18.6 38.6 1978 1 ......... 142.1 29.9 112.2 34.2 47.5 15.2 15.3 176.0 42.6 133.4 40.7 19.3 25.0 48.4 1979 ........... 184.4 35.5 149.0 52.2 60.2 17.9 18.7 212.0 60.4 151.6 47.5 24.6 26.6 52.8
1980 ........... 224.3 42.0 182.2 65.1 76.3 17.4 23.4 249.8 79.5 170.2 53.0 31.6 28.3 57.4 1981 ........... 237.0 44.1 193.0 63.6 84.2 19.7 25.5 265.1 78.4 186.7 56.1 37.1 31.0 62.4 1982 ........... 211.2 37.3 173.9 57.7 76.5 17.2 22.4 247.6 62.0 185.7 48.6 38.4 34.3 64.3 1983 ........... 201.8 37.1 164.7 52.7 71.7 18.5 21.8 268.9 55.1 213.8 53.7 43.7 43.0 73.3 1984 ........... 219.9 38.4 181.5 56.8 77.0 22.4 25.3 332.4 58.1 274.4 66.1 60.4 56.5 91.4
1985 ........... 215.9 29.6 186.3 54.8 79.3 24.9 27.2 338.1 51.4 286.7 62.6 61.3 64.9 97.9 1986 ........... 223.3 27.2 196.2 59.4 82.8 25.1 28.9 368.4 34.3 334.1 69.9 72.0 78.1 114.2 1987 ........... 250.2 29.8 220.4 63.7 92.7 27.6 36.4 409.8 42.9 366.8 70.8 85.1 85.2 125.7 1988 ........... 320.2 38.8 281.4 82.6 119.1 33.4 46.3 447.2 39.6 407.6 83.1 102.2 87.9 134.4 1989 1 ......... 359.9 41.1 318.8 90.5 136.9 35.1 56.3 477.7 50.9 426.8 84.6 112.3 87.4 142.5
1990 ........... 387.4 40.2 347.2 97.0 153.0 36.2 61.0 498.4 62.3 436.1 83.0 116.4 88.2 148.5 1991 ........... 414.1 40.1 374.0 101.6 166.6 39.9 65.9 491.0 51.7 439.3 81.3 121.1 85.5 151.4 1992 ........... 439.6 44.1 395.6 101.7 176.4 46.9 70.6 536.5 51.6 484.9 89.1 134.8 91.5 169.6 1993 ........... 456.9 43.6 413.3 105.1 182.7 51.6 74.0 589.4 51.5 537.9 100.8 153.2 102.1 182.0 1994 ........... 502.9 47.1 455.8 112.7 205.7 57.5 79.9 668.7 51.3 617.4 113.6 185.0 118.1 200.6
1995 ........... 575.2 57.2 518.0 135.6 234.4 61.4 86.5 749.4 56.0 693.3 128.5 222.1 123.7 219.0 1996 ........... 612.1 61.5 550.6 138.7 254.0 64.4 93.6 803.1 72.7 730.4 136.1 228.4 128.7 237.1 1997 ........... 678.4 58.5 619.9 148.6 295.8 73.4 102.0 876.5 71.7 804.7 144.9 253.6 139.4 266.8 1998 ........... 670.4 53.2 617.3 139.4 299.8 72.5 105.5 917.1 50.6 866.5 151.6 269.8 148.6 296.4 1999 ........... 684.0 49.7 634.3 140.3 311.2 75.3 107.5 1,030.0 67.8 962.2 156.3 295.7 179.0 331.2
2000 ........... 772.0 52.8 719.2 163.9 357.0 80.4 117.9 1,224.4 120.2 1,104.2 181.9 347.0 195.9 379.4 2001 ........... 718.7 54.9 663.8 150.5 321.7 75.4 116.2 1,145.9 103.6 1,042.3 172.5 298.0 189.8 382.0 2002 ........... 681.8 54.5 627.3 147.6 290.4 78.9 110.3 1,164.7 103.5 1,061.2 164.6 283.3 203.7 409.6 2003 ........... 713.1 60.9 652.2 162.5 293.6 80.7 115.5 1,260.7 133.1 1,127.6 181.4 295.8 210.2 440.2
2002: I ........ 165.1 13.6 151.5 34.5 71.4 18.7 26.8 273.5 20.6 252.9 38.3 69.3 48.5 96.8 II ....... 172.0 13.6 158.5 37.2 73.5 20.1 27.6 291.4 25.8 265.6 41.1 71.5 50.9 102.2 III ...... 174.4 13.7 160.7 37.8 74.3 20.5 28.1 296.8 26.6 270.2 42.0 71.3 52.5 104.4 IV ...... 170.3 13.6 156.7 38.1 71.2 19.6 27.9 303.0 30.5 272.5 43.2 71.2 51.9 106.2
2003: I ........ 173.5 14.3 159.1 40.4 70.8 19.9 28.0 311.4 36.0 275.4 44.4 71.2 51.5 108.2 II ....... 174.6 14.6 159.9 40.3 71.0 20.2 28.4 310.1 30.8 279.3 44.6 73.2 52.7 108.7 III ...... 178.3 15.7 162.6 40.2 73.5 19.9 29.1 312.9 32.6 280.2 46.0 73.7 51.5 109.0 IV ...... 186.9 16.3 170.6 41.6 78.3 20.6 30.0 326.3 33.6 292.7 46.3 77.7 54.5 114.3
2004: I ........ 193.9 15.9 178.0 44.7 80.8 20.9 31.6 344.7 40.6 304.1 50.7 80.2 55.5 117.6 II ....... 199.3 15.7 183.6 46.8 82.2 21.4 33.2 362.9 41.0 321.8 56.8 85.2 57.1 122.8 III p ... 204.6 15.1 189.5 48.8 83.5 23.1 34.1 371.3 44.9 326.5 61.1 87.7 57.8 119.8
1 End-use commodity classifications beginning 1978 and 1989 are not strictly comparable with data for earlier periods. See Survey of Cur-rent Business, June 1988 and July 2001.
Note.—Data are on a balance of payments basis and exclude military. In June 1990, end-use categories for goods exports were redefined to include reexports; beginning with data for 1978, reexports (exports of
foreign goods) are assigned to detailed end-use categories in the same manner as exports of domestic goods.
Source: Department of Commerce, Bureau of Economic Analysis.
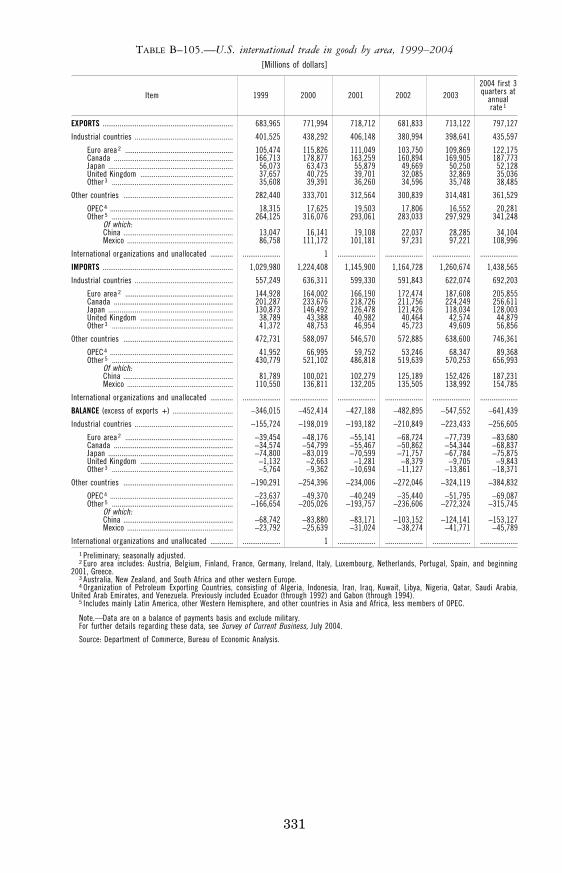
331
TABLE B–105.—U.S. international trade in goods by area, 1999–2004 [Millions of dollars]
Item 1999 2000 2001 2002 2003 2004 first 3 quarters at
annual rate 1
EXPORTS ..................................................................... 683,965 771,994 718,712 681,833 713,122 797,127
Industrial countries .................................................... 401,525 438,292 406,148 380,994 398,641 435,597
Euro area 2 ......................................................... 105,474 115,826 111,049 103,750 109,869 122,175 Canada ............................................................... 166,713 178,877 163,259 160,894 169,905 187,773 Japan .................................................................. 56,073 63,473 55,879 49,669 50,250 52,128 United Kingdom ................................................. 37,657 40,725 39,701 32,085 32,869 35,036 Other 3 ................................................................ 35,608 39,391 36,260 34,596 35,748 38,485
Other countries .......................................................... 282,440 333,701 312,564 300,839 314,481 361,529
OPEC 4 ................................................................. 18,315 17,625 19,503 17,806 16,552 20,281 Other 5 ................................................................ 264,125 316,076 293,061 283,033 297,929 341,248
Of which: China .......................................................... 13,047 16,141 19,108 22,037 28,285 34,104 Mexico ........................................................ 86,758 111,172 101,181 97,231 97,221 108,996
International organizations and unallocated ............ .................... 1 .................... .................... .................... ....................
IMPORTS ..................................................................... 1,029,980 1,224,408 1,145,900 1,164,728 1,260,674 1,438,565
Industrial countries .................................................... 557,249 636,311 599,330 591,843 622,074 692,203
Euro area 2 ......................................................... 144,928 164,002 166,190 172,474 187,608 205,855 Canada ............................................................... 201,287 233,676 218,726 211,756 224,249 256,611 Japan .................................................................. 130,873 146,492 126,478 121,426 118,034 128,003 United Kingdom ................................................. 38,789 43,388 40,982 40,464 42,574 44,879 Other 3 ................................................................ 41,372 48,753 46,954 45,723 49,609 56,856
Other countries .......................................................... 472,731 588,097 546,570 572,885 638,600 746,361
OPEC 4 ................................................................. 41,952 66,995 59,752 53,246 68,347 89,368 Other 5 ................................................................ 430,779 521,102 486,818 519,639 570,253 656,993
Of which: China .......................................................... 81,789 100,021 102,279 125,189 152,426 187,231 Mexico ........................................................ 110,550 136,811 132,205 135,505 138,992 154,785
International organizations and unallocated ............ .................... .................... .................... .................... .................... ....................
BALANCE (excess of exports +) ................................ −346,015 −452,414 −427,188 −482,895 −547,552 −641,439
Industrial countries .................................................... −155,724 −198,019 −193,182 −210,849 −223,433 −256,605
Euro area 2 ......................................................... −39,454 −48,176 −55,141 −68,724 −77,739 −83,680 Canada ............................................................... −34,574 −54,799 −55,467 −50,862 −54,344 −68,837 Japan .................................................................. −74,800 −83,019 −70,599 −71,757 −67,784 −75,875 United Kingdom ................................................. −1,132 −2,663 −1,281 −8,379 −9,705 −9,843 Other 3 ................................................................ −5,764 −9,362 −10,694 −11,127 −13,861 −18,371
Other countries .......................................................... −190,291 −254,396 −234,006 −272,046 −324,119 −384,832
OPEC 4 ................................................................. −23,637 −49,370 −40,249 −35,440 −51,795 −69,087 Other 5 ................................................................ −166,654 −205,026 −193,757 −236,606 −272,324 −315,745
Of which: China .......................................................... −68,742 −83,880 −83,171 −103,152 −124,141 −153,127 Mexico ........................................................ −23,792 −25,639 −31,024 −38,274 −41,771 −45,789
International organizations and unallocated ............ .................... 1 .................... .................... .................... ....................1 Preliminary; seasonally adjusted. 2 Euro area includes: Austria, Belgium, Finland, France, Germany, Ireland, Italy, Luxembourg, Netherlands, Portugal, Spain, and beginning
2001, Greece. 3 Australia, New Zealand, and South Africa and other western Europe. 4 Organization of Petroleum Exporting Countries, consisting of Algeria, Indonesia, Iran, Iraq, Kuwait, Libya, Nigeria, Qatar, Saudi Arabia,
United Arab Emirates, and Venezuela. Previously included Ecuador (through 1992) and Gabon (through 1994). 5 Includes mainly Latin America, other Western Hemisphere, and other countries in Asia and Africa, less members of OPEC.
Note.—Data are on a balance of payments basis and exclude military. For further details regarding these data, see Survey of Current Business, July 2004.
Source: Department of Commerce, Bureau of Economic Analysis.
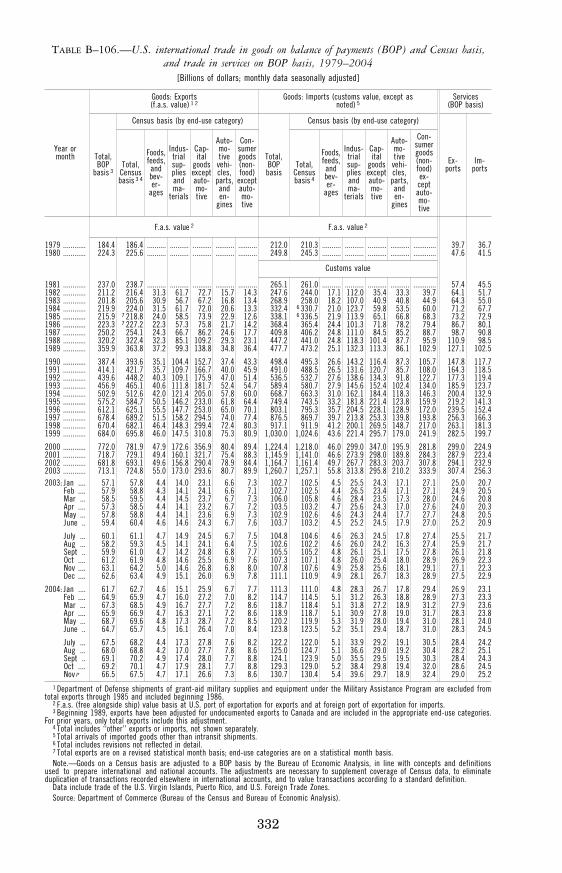
332
TABLE B–106.—U.S. international trade in goods on balance of payments (BOP) and Census basis, and trade in services on BOP basis, 1979–2004
[Billions of dollars; monthly data seasonally adjusted]
Year or month
Goods: Exports (f.a.s. value) 1 2
Goods: Imports (customs value, except as noted) 5
Services (BOP basis)
Total, BOP
basis 3
Census basis (by end-use category)
Total, BOP basis
Census basis (by end-use category)
Ex- ports
Im- ports Total,
Census basis 3 4
Foods, feeds, and bev- er-
ages
Indus-trial sup-plies and ma-
terials
Cap-ital
goods except auto-mo-tive
Auto-mo-tive
vehi-cles,
parts, and en-
gines
Con-sumer goods (non- food)
except auto- mo- tive
Total, Census basis 4
Foods, feeds, and bev- er-
ages
Indus-trial sup-plies and ma-
terials
Cap-ital
goods except auto-mo-tive
Auto-mo-tive
vehi-cles,
parts, and en-
gines
Con-sumer goods (non- food) ex- cept auto- mo- tive
F.a.s. value 2 F.a.s. value 2
1979 ............ 184.4 186.4 .......... .......... .......... .......... .......... 212.0 210.3 .......... .......... .......... .......... ............ 39.7 36.7 1980 ............ 224.3 225.6 .......... .......... .......... .......... .......... 249.8 245.3 .......... .......... .......... .......... ............ 47.6 41.5
Customs value
1981 ............ 237.0 238.7 .......... .......... .......... .......... .......... 265.1 261.0 .......... .......... .......... .......... ............ 57.4 45.5 1982 ............ 211.2 216.4 31.3 61.7 72.7 15.7 14.3 247.6 244.0 17.1 112.0 35.4 33.3 39.7 64.1 51.7 1983 ............ 201.8 205.6 30.9 56.7 67.2 16.8 13.4 268.9 258.0 18.2 107.0 40.9 40.8 44.9 64.3 55.0 1984 ............ 219.9 224.0 31.5 61.7 72.0 20.6 13.3 332.4 6 330.7 21.0 123.7 59.8 53.5 60.0 71.2 67.7 1985 ............ 215.9 7 218.8 24.0 58.5 73.9 22.9 12.6 338.1 6 336.5 21.9 113.9 65.1 66.8 68.3 73.2 72.9 1986 ............ 223.3 7 227.2 22.3 57.3 75.8 21.7 14.2 368.4 365.4 24.4 101.3 71.8 78.2 79.4 86.7 80.1 1987 ............ 250.2 254.1 24.3 66.7 86.2 24.6 17.7 409.8 406.2 24.8 111.0 84.5 85.2 88.7 98.7 90.8 1988 ............ 320.2 322.4 32.3 85.1 109.2 29.3 23.1 447.2 441.0 24.8 118.3 101.4 87.7 95.9 110.9 98.5 1989 ............ 359.9 363.8 37.2 99.3 138.8 34.8 36.4 477.7 473.2 25.1 132.3 113.3 86.1 102.9 127.1 102.5
1990 ............ 387.4 393.6 35.1 104.4 152.7 37.4 43.3 498.4 495.3 26.6 143.2 116.4 87.3 105.7 147.8 117.7 1991 ............ 414.1 421.7 35.7 109.7 166.7 40.0 45.9 491.0 488.5 26.5 131.6 120.7 85.7 108.0 164.3 118.5 1992 ............ 439.6 448.2 40.3 109.1 175.9 47.0 51.4 536.5 532.7 27.6 138.6 134.3 91.8 122.7 177.3 119.4 1993 ............ 456.9 465.1 40.6 111.8 181.7 52.4 54.7 589.4 580.7 27.9 145.6 152.4 102.4 134.0 185.9 123.7 1994 ............ 502.9 512.6 42.0 121.4 205.0 57.8 60.0 668.7 663.3 31.0 162.1 184.4 118.3 146.3 200.4 132.9 1995 ............ 575.2 584.7 50.5 146.2 233.0 61.8 64.4 749.4 743.5 33.2 181.8 221.4 123.8 159.9 219.2 141.3 1996 ............ 612.1 625.1 55.5 147.7 253.0 65.0 70.1 803.1 795.3 35.7 204.5 228.1 128.9 172.0 239.5 152.4 1997 ............ 678.4 689.2 51.5 158.2 294.5 74.0 77.4 876.5 869.7 39.7 213.8 253.3 139.8 193.8 256.3 166.3 1998 ............ 670.4 682.1 46.4 148.3 299.4 72.4 80.3 917.1 911.9 41.2 200.1 269.5 148.7 217.0 263.1 181.3 1999 ............ 684.0 695.8 46.0 147.5 310.8 75.3 80.9 1,030.0 1,024.6 43.6 221.4 295.7 179.0 241.9 282.5 199.7
2000 ............ 772.0 781.9 47.9 172.6 356.9 80.4 89.4 1,224.4 1,218.0 46.0 299.0 347.0 195.9 281.8 299.0 224.9 2001 ............ 718.7 729.1 49.4 160.1 321.7 75.4 88.3 1,145.9 1,141.0 46.6 273.9 298.0 189.8 284.3 287.9 223.4 2002 ............ 681.8 693.1 49.6 156.8 290.4 78.9 84.4 1,164.7 1,161.4 49.7 267.7 283.3 203.7 307.8 294.1 232.9 2003 ............ 713.1 724.8 55.0 173.0 293.6 80.7 89.9 1,260.7 1,257.1 55.8 313.8 295.8 210.2 333.9 307.4 256.3 2003: Jan .... 57.1 57.8 4.4 14.0 23.1 6.6 7.3 102.7 102.5 4.5 25.5 24.3 17.1 27.1 25.0 20.7
Feb .... 57.9 58.8 4.3 14.1 24.1 6.6 7.1 102.7 102.5 4.4 26.5 23.4 17.1 27.1 24.9 20.5 Mar ... 58.5 59.5 4.4 14.5 23.7 6.7 7.3 106.0 105.8 4.6 28.4 23.5 17.3 28.0 24.6 20.8 Apr .... 57.3 58.5 4.4 14.1 23.2 6.7 7.2 103.5 103.2 4.7 25.6 24.3 17.0 27.6 24.0 20.3 May ... 57.8 58.8 4.4 14.1 23.6 6.9 7.3 102.9 102.6 4.6 24.3 24.4 17.7 27.7 24.8 20.5 June .. 59.4 60.4 4.6 14.6 24.3 6.7 7.6 103.7 103.2 4.5 25.2 24.5 17.9 27.0 25.2 20.9
July ... 60.1 61.1 4.7 14.9 24.5 6.7 7.5 104.8 104.6 4.6 26.3 24.5 17.8 27.4 25.5 21.7 Aug ... 58.2 59.3 4.5 14.1 24.1 6.4 7.5 102.6 102.2 4.6 26.0 24.2 16.3 27.4 25.9 21.7 Sept .. 59.9 61.0 4.7 14.2 24.8 6.8 7.7 105.5 105.2 4.8 26.1 25.1 17.5 27.8 26.1 21.8 Oct .... 61.2 61.9 4.8 14.6 25.5 6.9 7.6 107.3 107.1 4.8 26.0 25.4 18.0 28.9 26.9 22.3 Nov .... 63.1 64.2 5.0 14.6 26.8 6.8 8.0 107.8 107.6 4.9 25.8 25.6 18.1 29.1 27.1 22.3 Dec .... 62.6 63.4 4.9 15.1 26.0 6.9 7.8 111.1 110.9 4.9 28.1 26.7 18.3 28.9 27.5 22.9
2004: Jan .... 61.7 62.7 4.6 15.1 25.9 6.7 7.7 111.3 111.0 4.8 28.3 26.7 17.8 29.4 26.9 23.1 Feb .... 64.9 65.9 4.7 16.0 27.2 7.0 8.2 114.7 114.5 5.1 31.2 26.3 18.8 28.9 27.3 23.3 Mar ... 67.3 68.5 4.9 16.7 27.7 7.2 8.6 118.7 118.4 5.1 31.8 27.2 18.9 31.2 27.9 23.6 Apr .... 65.9 66.9 4.7 16.3 27.1 7.2 8.6 118.9 118.7 5.1 30.9 27.8 19.0 31.7 28.3 23.8 May ... 68.7 69.6 4.8 17.3 28.7 7.2 8.5 120.2 119.9 5.3 31.9 28.0 19.4 31.0 28.1 24.0 June .. 64.7 65.7 4.5 16.1 26.4 7.0 8.4 123.8 123.5 5.2 35.1 29.4 18.7 31.0 28.3 24.5
July ... 67.5 68.2 4.4 17.3 27.8 7.6 8.2 122.2 122.0 5.1 33.9 29.2 19.1 30.5 28.4 24.2 Aug ... 68.0 68.8 4.2 17.0 27.7 7.8 8.6 125.0 124.7 5.1 36.6 29.0 19.2 30.4 28.2 25.1 Sept .. 69.1 70.2 4.9 17.4 28.0 7.7 8.8 124.1 123.9 5.0 35.5 29.5 19.5 30.3 28.4 24.3 Oct .... 69.2 70.1 4.7 17.9 28.1 7.7 8.8 129.3 129.0 5.2 38.4 29.8 19.4 32.0 28.6 24.5 Nov p 66.5 67.5 4.7 17.1 26.6 7.3 8.6 130.7 130.4 5.4 39.6 29.7 18.9 32.4 29.0 25.2
1 Department of Defense shipments of grant-aid military supplies and equipment under the Military Assistance Program are excluded from total exports through 1985 and included beginning 1986.
2 F.a.s. (free alongside ship) value basis at U.S. port of exportation for exports and at foreign port of exportation for imports. 3 Beginning 1989, exports have been adjusted for undocumented exports to Canada and are included in the appropriate end-use categories.
For prior years, only total exports include this adjustment. 4 Total includes ‘‘other’’ exports or imports, not shown separately. 5 Total arrivals of imported goods other than intransit shipments. 6 Total includes revisions not reflected in detail. 7 Total exports are on a revised statistical month basis; end-use categories are on a statistical month basis. Note.—Goods on a Census basis are adjusted to a BOP basis by the Bureau of Economic Analysis, in line with concepts and definitions
used to prepare international and national accounts. The adjustments are necessary to supplement coverage of Census data, to eliminate duplication of transactions recorded elsewhere in international accounts, and to value transactions according to a standard definition.
Data include trade of the U.S. Virgin Islands, Puerto Rico, and U.S. Foreign Trade Zones. Source: Department of Commerce (Bureau of the Census and Bureau of Economic Analysis).
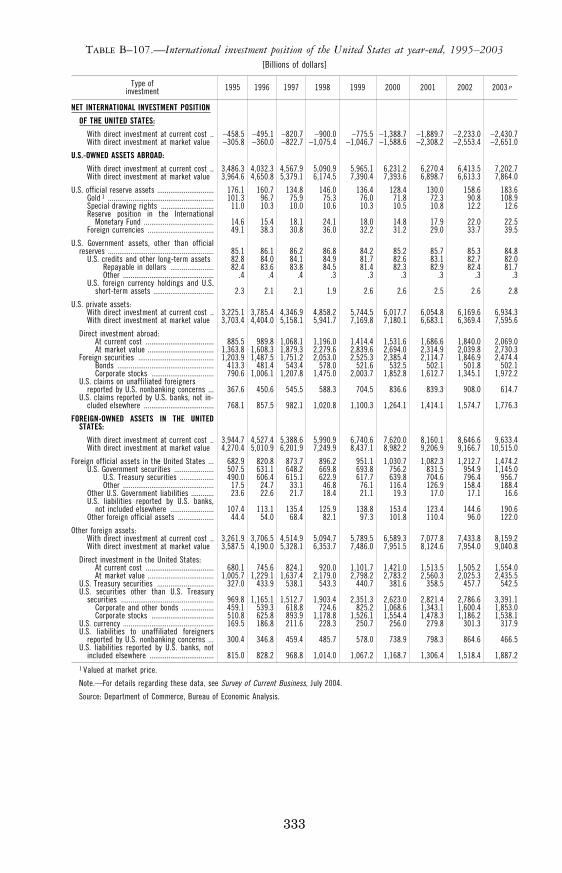
333
TABLE B–107.—International investment position of the United States at year-end, 1995–2003 [Billions of dollars]
Type of investment 1995 1996 1997 1998 1999 2000 2001 2002 2003 p
NET INTERNATIONAL INVESTMENT POSITION
OF THE UNITED STATES:
With direct investment at current cost .. −458.5 −495.1 −820.7 −900.0 −775.5 −1,388.7 −1,889.7 −2,233.0 −2,430.7 With direct investment at market value −305.8 −360.0 −822.7 −1,075.4 −1,046.7 −1,588.6 −2,308.2 −2,553.4 −2,651.0
U.S.-OWNED ASSETS ABROAD:
With direct investment at current cost .. 3,486.3 4,032.3 4,567.9 5,090.9 5,965.1 6,231.2 6,270.4 6,413.5 7,202.7 With direct investment at market value 3,964.6 4,650.8 5,379.1 6,174.5 7,390.4 7,393.6 6,898.7 6,613.3 7,864.0
U.S. official reserve assets .............................. 176.1 160.7 134.8 146.0 136.4 128.4 130.0 158.6 183.6 Gold 1 ........................................................ 101.3 96.7 75.9 75.3 76.0 71.8 72.3 90.8 108.9 Special drawing rights ............................ 11.0 10.3 10.0 10.6 10.3 10.5 10.8 12.2 12.6 Reserve position in the International
Monetary Fund ..................................... 14.6 15.4 18.1 24.1 18.0 14.8 17.9 22.0 22.5 Foreign currencies ................................... 49.1 38.3 30.8 36.0 32.2 31.2 29.0 33.7 39.5
U.S. Government assets, other than official reserves ........................................................ 85.1 86.1 86.2 86.8 84.2 85.2 85.7 85.3 84.8
U.S. credits and other long-term assets 82.8 84.0 84.1 84.9 81.7 82.6 83.1 82.7 82.0 Repayable in dollars ....................... 82.4 83.6 83.8 84.5 81.4 82.3 82.9 82.4 81.7 Other ................................................ .4 .4 .4 .3 .3 .3 .3 .3 .3
U.S. foreign currency holdings and U.S. short-term assets ................................ 2.3 2.1 2.1 1.9 2.6 2.6 2.5 2.6 2.8
U.S. private assets: With direct investment at current cost .. 3,225.1 3,785.4 4,346.9 4,858.2 5,744.5 6,017.7 6,054.8 6,169.6 6,934.3 With direct investment at market value 3,703.4 4,404.0 5,158.1 5,941.7 7,169.8 7,180.1 6,683.1 6,369.4 7,595.6
Direct investment abroad: At current cost .................................... 885.5 989.8 1,068.1 1,196.0 1,414.4 1,531.6 1,686.6 1,840.0 2,069.0 At market value ................................... 1,363.8 1,608.3 1,879.3 2,279.6 2,839.6 2,694.0 2,314.9 2,039.8 2,730.3
Foreign securities ........................................ 1,203.9 1,487.5 1,751.2 2,053.0 2,525.3 2,385.4 2,114.7 1,846.9 2,474.4 Bonds ................................................... 413.3 481.4 543.4 578.0 521.6 532.5 502.1 501.8 502.1 Corporate stocks ................................. 790.6 1,006.1 1,207.8 1,475.0 2,003.7 1,852.8 1,612.7 1,345.1 1,972.2
U.S. claims on unaffiliated foreigners reported by U.S. nonbanking concerns ... 367.6 450.6 545.5 588.3 704.5 836.6 839.3 908.0 614.7
U.S. claims reported by U.S. banks, not in-cluded elsewhere ..................................... 768.1 857.5 982.1 1,020.8 1,100.3 1,264.1 1,414.1 1,574.7 1,776.3
FOREIGN-OWNED ASSETS IN THE UNITED STATES:
With direct investment at current cost .. 3,944.7 4,527.4 5,388.6 5,990.9 6,740.6 7,620.0 8,160.1 8,646.6 9,633.4 With direct investment at market value 4,270.4 5,010.9 6,201.9 7,249.9 8,437.1 8,982.2 9,206.9 9,166.7 10,515.0
Foreign official assets in the United States ... 682.9 820.8 873.7 896.2 951.1 1,030.7 1,082.3 1,212.7 1,474.2 U.S. Government securities ..................... 507.5 631.1 648.2 669.8 693.8 756.2 831.5 954.9 1,145.0
U.S. Treasury securities .................. 490.0 606.4 615.1 622.9 617.7 639.8 704.6 796.4 956.7 Other ................................................ 17.5 24.7 33.1 46.8 76.1 116.4 126.9 158.4 188.4
Other U.S. Government liabilities ............ 23.6 22.6 21.7 18.4 21.1 19.3 17.0 17.1 16.6 U.S. liabilities reported by U.S. banks,
not included elsewhere ....................... 107.4 113.1 135.4 125.9 138.8 153.4 123.4 144.6 190.6 Other foreign official assets ................... 44.4 54.0 68.4 82.1 97.3 101.8 110.4 96.0 122.0
Other foreign assets: With direct investment at current cost .. 3,261.9 3,706.5 4,514.9 5,094.7 5,789.5 6,589.3 7,077.8 7,433.8 8,159.2 With direct investment at market value 3,587.5 4,190.0 5,328.1 6,353.7 7,486.0 7,951.5 8,124.6 7,954.0 9,040.8
Direct investment in the United States: At current cost .................................... 680.1 745.6 824.1 920.0 1,101.7 1,421.0 1,513.5 1,505.2 1,554.0 At market value ................................... 1,005.7 1,229.1 1,637.4 2,179.0 2,798.2 2,783.2 2,560.3 2,025.3 2,435.5
U.S. Treasury securities .............................. 327.0 433.9 538.1 543.3 440.7 381.6 358.5 457.7 542.5 U.S. securities other than U.S. Treasury
securities ................................................. 969.8 1,165.1 1,512.7 1,903.4 2,351.3 2,623.0 2,821.4 2,786.6 3,391.1 Corporate and other bonds ................. 459.1 539.3 618.8 724.6 825.2 1,068.6 1,343.1 1,600.4 1,853.0 Corporate stocks ................................. 510.8 625.8 893.9 1,178.8 1,526.1 1,554.4 1,478.3 1,186.2 1,538.1
U.S. currency ................................................ 169.5 186.8 211.6 228.3 250.7 256.0 279.8 301.3 317.9 U.S. liabilities to unaffiliated foreigners
reported by U.S. nonbanking concerns ... 300.4 346.8 459.4 485.7 578.0 738.9 798.3 864.6 466.5 U.S. liabilities reported by U.S. banks, not
included elsewhere .................................. 815.0 828.2 968.8 1,014.0 1,067.2 1,168.7 1,306.4 1,518.4 1,887.2 1 Valued at market price.
Note.—For details regarding these data, see Survey of Current Business, July 2004.
Source: Department of Commerce, Bureau of Economic Analysis.
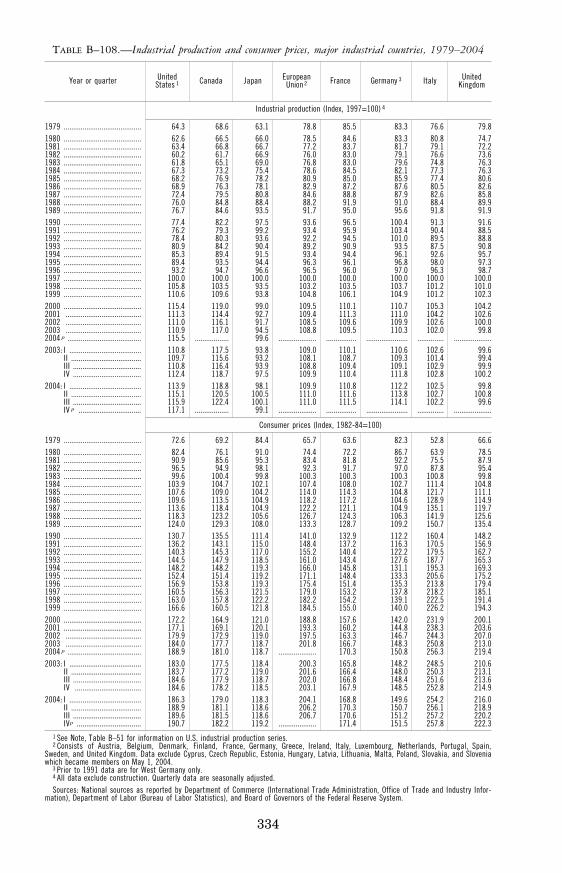
334
TABLE B–108.—Industrial production and consumer prices, major industrial countries, 1979–2004
Year or quarter United States 1 Canada Japan European
Union 2 France Germany 3 Italy United Kingdom
Industrial production (Index, 1997=100) 4
1979 ......................................... 64.3 68.6 63.1 78.8 85.5 83.3 76.6 79.8 1980 ......................................... 62.6 66.5 66.0 78.5 84.6 83.3 80.8 74.7 1981 ......................................... 63.4 66.8 66.7 77.2 83.7 81.7 79.1 72.2 1982 ......................................... 60.2 61.7 66.9 76.0 83.0 79.1 76.6 73.6 1983 ......................................... 61.8 65.1 69.0 76.8 83.0 79.6 74.8 76.3 1984 ......................................... 67.3 73.2 75.4 78.6 84.5 82.1 77.3 76.3 1985 ......................................... 68.2 76.9 78.2 80.9 85.0 85.9 77.4 80.6 1986 ......................................... 68.9 76.3 78.1 82.9 87.2 87.6 80.5 82.6 1987 ......................................... 72.4 79.5 80.8 84.6 88.8 87.9 82.6 85.8 1988 ......................................... 76.0 84.8 88.4 88.2 91.9 91.0 88.4 89.9 1989 ......................................... 76.7 84.6 93.5 91.7 95.0 95.6 91.8 91.9 1990 ......................................... 77.4 82.2 97.5 93.6 96.5 100.4 91.3 91.6 1991 ......................................... 76.2 79.3 99.2 93.4 95.9 103.4 90.4 88.5 1992 ......................................... 78.4 80.3 93.6 92.2 94.5 101.0 89.5 88.8 1993 ......................................... 80.9 84.2 90.4 89.2 90.9 93.5 87.5 90.8 1994 ......................................... 85.3 89.4 91.5 93.4 94.4 96.1 92.6 95.7 1995 ......................................... 89.4 93.5 94.4 96.3 96.1 96.8 98.0 97.3 1996 ......................................... 93.2 94.7 96.6 96.5 96.0 97.0 96.3 98.7 1997 ......................................... 100.0 100.0 100.0 100.0 100.0 100.0 100.0 100.0 1998 ......................................... 105.8 103.5 93.5 103.2 103.5 103.7 101.2 101.0 1999 ......................................... 110.6 109.6 93.8 104.8 106.1 104.9 101.2 102.3 2000 ......................................... 115.4 119.0 99.0 109.5 110.1 110.7 105.3 104.2 2001 ........................................ 111.3 114.4 92.7 109.4 111.3 111.0 104.2 102.6 2002 ........................................ 111.0 116.1 91.7 108.5 109.6 109.9 102.6 100.0 2003 ........................................ 110.9 117.0 94.5 108.8 109.5 110.3 102.0 99.8 2004 p ....................................... 115.5 .................. 99.6 .................... ................ ...................... .............. ....................2003: I ...................................... 110.8 117.5 93.8 109.0 110.1 110.6 102.6 99.6
II ..................................... 109.7 115.6 93.2 108.1 108.7 109.3 101.4 99.4 III .................................... 110.8 116.4 93.9 108.8 109.4 109.1 102.9 99.9 IV .................................... 112.4 118.7 97.5 109.9 110.4 111.8 102.8 100.2
2004: I ...................................... 113.9 118.8 98.1 109.9 110.8 112.2 102.5 99.8 II ..................................... 115.1 120.5 100.5 111.0 111.6 113.8 102.7 100.8 III .................................... 115.9 122.4 100.1 111.0 111.5 114.1 102.2 99.6 IV p ................................. 117.1 .................. 99.1 .................... ................ ...................... .............. ....................
Consumer prices (Index, 1982-84=100)
1979 ......................................... 72.6 69.2 84.4 65.7 63.6 82.3 52.8 66.6 1980 ......................................... 82.4 76.1 91.0 74.4 72.2 86.7 63.9 78.5 1981 ......................................... 90.9 85.6 95.3 83.4 81.8 92.2 75.5 87.9 1982 ......................................... 96.5 94.9 98.1 92.3 91.7 97.0 87.8 95.4 1983 ......................................... 99.6 100.4 99.8 100.3 100.3 100.3 100.8 99.8 1984 ......................................... 103.9 104.7 102.1 107.4 108.0 102.7 111.4 104.8 1985 ......................................... 107.6 109.0 104.2 114.0 114.3 104.8 121.7 111.1 1986 ......................................... 109.6 113.5 104.9 118.2 117.2 104.6 128.9 114.9 1987 ......................................... 113.6 118.4 104.9 122.2 121.1 104.9 135.1 119.7 1988 ......................................... 118.3 123.2 105.6 126.7 124.3 106.3 141.9 125.6 1989 ......................................... 124.0 129.3 108.0 133.3 128.7 109.2 150.7 135.4 1990 ......................................... 130.7 135.5 111.4 141.0 132.9 112.2 160.4 148.2 1991 ......................................... 136.2 143.1 115.0 148.4 137.2 116.3 170.5 156.9 1992 ......................................... 140.3 145.3 117.0 155.2 140.4 122.2 179.5 162.7 1993 ......................................... 144.5 147.9 118.5 161.0 143.4 127.6 187.7 165.3 1994 ......................................... 148.2 148.2 119.3 166.0 145.8 131.1 195.3 169.3 1995 ......................................... 152.4 151.4 119.2 171.1 148.4 133.3 205.6 175.2 1996 ......................................... 156.9 153.8 119.3 175.4 151.4 135.3 213.8 179.4 1997 ......................................... 160.5 156.3 121.5 179.0 153.2 137.8 218.2 185.1 1998 ......................................... 163.0 157.8 122.2 182.2 154.2 139.1 222.5 191.4 1999 ......................................... 166.6 160.5 121.8 184.5 155.0 140.0 226.2 194.3 2000 ......................................... 172.2 164.9 121.0 188.8 157.6 142.0 231.9 200.1 2001 ......................................... 177.1 169.1 120.1 193.3 160.2 144.8 238.3 203.6 2002 ........................................ 179.9 172.9 119.0 197.5 163.3 146.7 244.3 207.0 2003 ........................................ 184.0 177.7 118.7 201.8 166.7 148.3 250.8 213.0 2004 p ....................................... 188.9 181.0 118.7 .................... 170.3 150.8 256.3 219.4 2003: I ...................................... 183.0 177.5 118.4 200.3 165.8 148.2 248.5 210.6
II ..................................... 183.7 177.2 119.0 201.6 166.4 148.0 250.3 213.1 III .................................... 184.6 177.9 118.7 202.0 166.8 148.4 251.6 213.6 IV ................................... 184.6 178.2 118.5 203.1 167.9 148.5 252.8 214.9
2004: I ...................................... 186.3 179.0 118.3 204.1 168.8 149.6 254.2 216.0 II ..................................... 188.9 181.1 118.6 206.2 170.3 150.7 256.1 218.9 III .................................... 189.6 181.5 118.6 206.7 170.6 151.2 257.2 220.2 IVp .................................. 190.7 182.2 119.2 .................... 171.4 151.5 257.8 222.3
1 See Note, Table B–51 for information on U.S. industrial production series. 2 Consists of Austria, Belgium, Denmark, Finland, France, Germany, Greece, Ireland, Italy, Luxembourg, Netherlands, Portugal, Spain,
Sweden, and United Kingdom. Data exclude Cyprus, Czech Republic, Estonia, Hungary, Latvia, Lithuania, Malta, Poland, Slovakia, and Slovenia which became members on May 1, 2004.
3 Prior to 1991 data are for West Germany only. 4 All data exclude construction. Quarterly data are seasonally adjusted. Sources: National sources as reported by Department of Commerce (International Trade Administration, Office of Trade and Industry Infor-
mation), Department of Labor (Bureau of Labor Statistics), and Board of Governors of the Federal Reserve System.
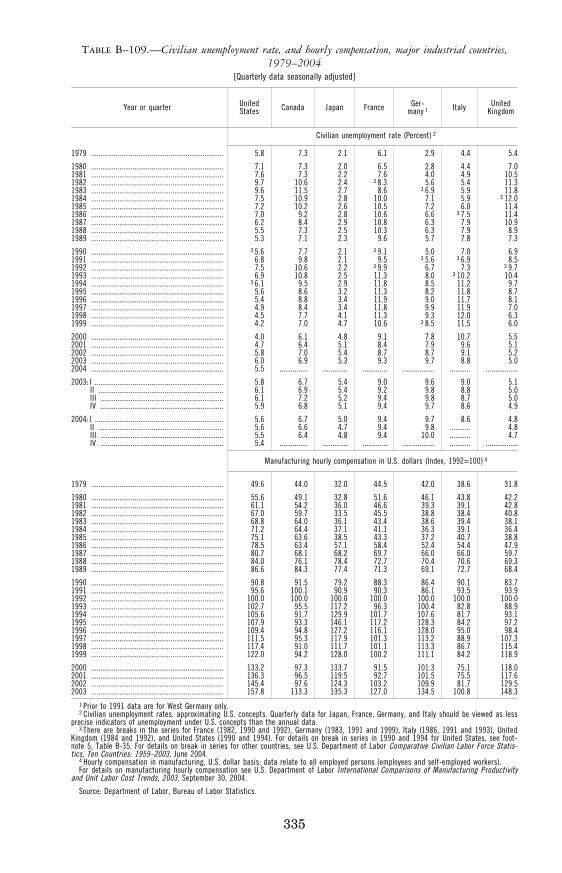
335
TABLE B–109.—Civilian unemployment rate, and hourly compensation, major industrial countries, 1979–2004
[Quarterly data seasonally adjusted]
Year or quarter United States Canada Japan France Ger-
many 1 Italy United Kingdom
Civilian unemployment rate (Percent) 2
1979 ...................................................................... 5.8 7.3 2.1 6.1 2.9 4.4 5.4
1980 ...................................................................... 7.1 7.3 2.0 6.5 2.8 4.4 7.0 1981 ...................................................................... 7.6 7.3 2.2 7.6 4.0 4.9 10.5 1982 ...................................................................... 9.7 10.6 2.4 3 8.3 5.6 5.4 11.3 1983 ...................................................................... 9.6 11.5 2.7 8.6 3 6.9 5.9 11.8 1984 ...................................................................... 7.5 10.9 2.8 10.0 7.1 5.9 3 12.0 1985 ...................................................................... 7.2 10.2 2.6 10.5 7.2 6.0 11.4 1986 ...................................................................... 7.0 9.2 2.8 10.6 6.6 3 7.5 11.4 1987 ...................................................................... 6.2 8.4 2.9 10.8 6.3 7.9 10.9 1988 ...................................................................... 5.5 7.3 2.5 10.3 6.3 7.9 8.9 1989 ...................................................................... 5.3 7.1 2.3 9.6 5.7 7.8 7.3
1990 ...................................................................... 3 5.6 7.7 2.1 3 9.1 5.0 7.0 6.9 1991 ...................................................................... 6.8 9.8 2.1 9.5 3 5.6 3 6.9 8.5 1992 ...................................................................... 7.5 10.6 2.2 3 9.9 6.7 7.3 3 9.7 1993 ...................................................................... 6.9 10.8 2.5 11.3 8.0 3 10.2 10.4 1994 ...................................................................... 3 6.1 9.5 2.9 11.8 8.5 11.2 9.7 1995 ...................................................................... 5.6 8.6 3.2 11.3 8.2 11.8 8.7 1996 ...................................................................... 5.4 8.8 3.4 11.9 9.0 11.7 8.1 1997 ...................................................................... 4.9 8.4 3.4 11.8 9.9 11.9 7.0 1998 ...................................................................... 4.5 7.7 4.1 11.3 9.3 12.0 6.3 1999 ...................................................................... 4.2 7.0 4.7 10.6 3 8.5 11.5 6.0
2000 ...................................................................... 4.0 6.1 4.8 9.1 7.8 10.7 5.5 2001 ...................................................................... 4.7 6.4 5.1 8.4 7.9 9.6 5.1 2002 ...................................................................... 5.8 7.0 5.4 8.7 8.7 9.1 5.2 2003 ...................................................................... 6.0 6.9 5.3 9.3 9.7 8.8 5.0 2004 ...................................................................... 5.5 ............... ............. ............. ................. ........... .................
2003: I .................................................................... 5.8 6.7 5.4 9.0 9.6 9.0 5.1 II .................................................................. 6.1 6.9 5.4 9.2 9.8 8.8 5.0 III ................................................................. 6.1 7.2 5.2 9.4 9.8 8.7 5.0 IV ................................................................. 5.9 6.8 5.1 9.4 9.7 8.6 4.9
2004: I .................................................................... 5.6 6.7 5.0 9.4 9.7 8.6 4.8 II .................................................................. 5.6 6.6 4.7 9.4 9.8 ........... 4.8 III ................................................................. 5.5 6.4 4.8 9.4 10.0 ........... 4.7 IV ................................................................. 5.4 ............... ............. ............. ................. ........... .................
Manufacturing hourly compensation in U.S. dollars (Index, 1992=100) 4
1979 ...................................................................... 49.6 44.0 32.0 44.5 42.0 38.6 31.8
1980 ...................................................................... 55.6 49.1 32.8 51.6 46.1 43.8 42.2 1981 ...................................................................... 61.1 54.2 36.0 46.6 39.3 39.1 42.8 1982 ...................................................................... 67.0 59.7 33.5 45.5 38.8 38.4 40.8 1983 ...................................................................... 68.8 64.0 36.1 43.4 38.6 39.4 38.1 1984 ...................................................................... 71.2 64.4 37.1 41.1 36.3 39.1 36.4 1985 ...................................................................... 75.1 63.6 38.5 43.3 37.2 40.7 38.8 1986 ...................................................................... 78.5 63.4 57.1 58.4 52.4 54.4 47.9 1987 ...................................................................... 80.7 68.1 68.2 69.7 66.0 66.0 59.7 1988 ...................................................................... 84.0 76.1 78.4 72.7 70.4 70.6 69.3 1989 ...................................................................... 86.6 84.3 77.4 71.3 69.1 72.7 68.4
1990 ...................................................................... 90.8 91.5 79.2 88.3 86.4 90.1 83.7 1991 ...................................................................... 95.6 100.1 90.9 90.3 86.1 93.5 93.9 1992 ...................................................................... 100.0 100.0 100.0 100.0 100.0 100.0 100.0 1993 ...................................................................... 102.7 95.5 117.2 96.3 100.4 82.8 88.9 1994 ...................................................................... 105.6 91.7 129.9 101.7 107.6 81.7 93.1 1995 ...................................................................... 107.9 93.3 146.1 117.2 128.3 84.2 97.2 1996 ...................................................................... 109.4 94.8 127.2 116.1 128.0 95.0 98.4 1997 ...................................................................... 111.5 95.3 117.9 101.3 113.2 88.9 107.3 1998 ...................................................................... 117.4 91.0 111.7 101.1 113.3 86.7 115.4 1999 ...................................................................... 122.0 94.2 128.0 100.2 111.1 84.2 118.9
2000 ...................................................................... 133.2 97.3 133.7 91.5 101.3 75.1 118.0 2001 ...................................................................... 136.3 96.5 119.5 92.7 101.5 75.5 117.6 2002 ...................................................................... 145.4 97.6 124.3 103.2 109.9 81.7 129.5 2003 ...................................................................... 157.8 113.3 135.3 127.0 134.5 100.8 148.3
1 Prior to 1991 data are for West Germany only. 2 Civilian unemployment rates, approximating U.S. concepts. Quarterly data for Japan, France, Germany, and Italy should be viewed as less
precise indicators of unemployment under U.S. concepts than the annual data. 3 There are breaks in the series for France (1982, 1990 and 1992), Germany (1983, 1991 and 1999), Italy (1986, 1991 and 1993), United
Kingdom (1984 and 1992), and United States (1990 and 1994). For details on break in series in 1990 and 1994 for United States, see foot-note 5, Table B-35. For details on break in series for other countries, see U.S. Department of Labor Comparative Civilian Labor Force Statis-tics, Ten Countries: 1959–2003, June 2004.
4 Hourly compensation in manufacturing, U.S. dollar basis; data relate to all employed persons (employees and self-employed workers). For details on manufacturing hourly compensation see U.S. Department of Labor International Comparisons of Manufacturing Productivity
and Unit Labor Cost Trends, 2003, September 30, 2004.
Source: Department of Labor, Bureau of Labor Statistics.
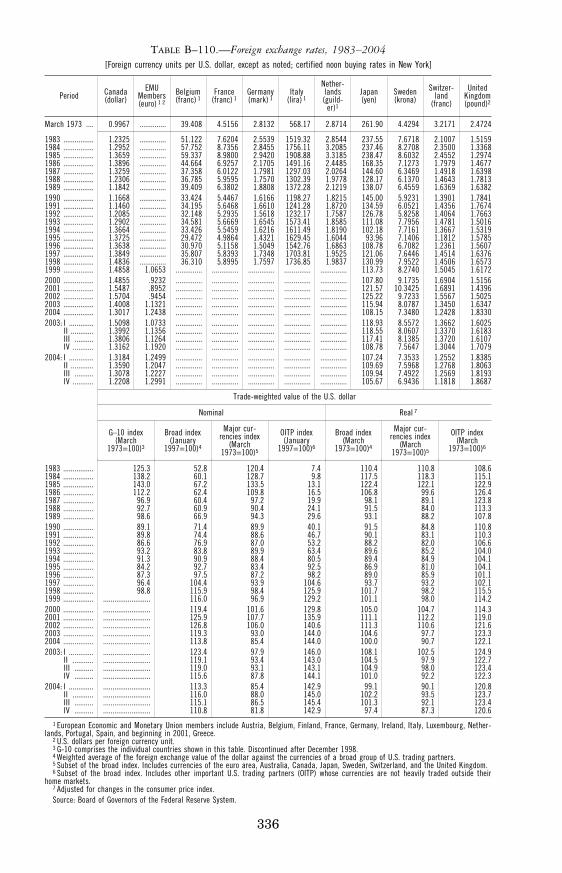
336
TABLE B–110.—Foreign exchange rates, 1983–2004 [Foreign currency units per U.S. dollar, except as noted; certified noon buying rates in New York]
Period Canada (dollar)
EMU Members (euro) 1 2
Belgium (franc) 1
France (franc) 1
Germany (mark) 1
Italy (lira) 1
Nether- lands
(guild-er)1
Japan (yen)
Sweden (krona)
Switzer- land
(franc)
United Kingdom (pound)2
March 1973 .... 0.9967 .............. 39.408 4.5156 2.8132 568.17 2.8714 261.90 4.4294 3.2171 2.4724
1983 ................ 1.2325 .............. 51.122 7.6204 2.5539 1519.32 2.8544 237.55 7.6718 2.1007 1.5159 1984 ................ 1.2952 .............. 57.752 8.7356 2.8455 1756.11 3.2085 237.46 8.2708 2.3500 1.3368 1985 ................ 1.3659 .............. 59.337 8.9800 2.9420 1908.88 3.3185 238.47 8.6032 2.4552 1.2974 1986 ................ 1.3896 .............. 44.664 6.9257 2.1705 1491.16 2.4485 168.35 7.1273 1.7979 1.4677 1987 ................ 1.3259 .............. 37.358 6.0122 1.7981 1297.03 2.0264 144.60 6.3469 1.4918 1.6398 1988 ................ 1.2306 .............. 36.785 5.9595 1.7570 1302.39 1.9778 128.17 6.1370 1.4643 1.7813 1989 ................ 1.1842 .............. 39.409 6.3802 1.8808 1372.28 2.1219 138.07 6.4559 1.6369 1.6382 1990 ................ 1.1668 .............. 33.424 5.4467 1.6166 1198.27 1.8215 145.00 5.9231 1.3901 1.7841 1991 ................ 1.1460 .............. 34.195 5.6468 1.6610 1241.28 1.8720 134.59 6.0521 1.4356 1.7674 1992 ................ 1.2085 .............. 32.148 5.2935 1.5618 1232.17 1.7587 126.78 5.8258 1.4064 1.7663 1993 ................ 1.2902 .............. 34.581 5.6669 1.6545 1573.41 1.8585 111.08 7.7956 1.4781 1.5016 1994 ................ 1.3664 .............. 33.426 5.5459 1.6216 1611.49 1.8190 102.18 7.7161 1.3667 1.5319 1995 ................ 1.3725 .............. 29.472 4.9864 1.4321 1629.45 1.6044 93.96 7.1406 1.1812 1.5785 1996 ................ 1.3638 .............. 30.970 5.1158 1.5049 1542.76 1.6863 108.78 6.7082 1.2361 1.5607 1997 ................ 1.3849 .............. 35.807 5.8393 1.7348 1703.81 1.9525 121.06 7.6446 1.4514 1.6376 1998 ................ 1.4836 .............. 36.310 5.8995 1.7597 1736.85 1.9837 130.99 7.9522 1.4506 1.6573 1999 ................ 1.4858 1.0653 .............. .............. .............. .............. .............. 113.73 8.2740 1.5045 1.6172 2000 ................ 1.4855 .9232 .............. .............. .............. .............. .............. 107.80 9.1735 1.6904 1.5156 2001 ................ 1.5487 .8952 .............. .............. .............. .............. .............. 121.57 10.3425 1.6891 1.4396 2002 ................ 1.5704 .9454 .............. .............. .............. .............. .............. 125.22 9.7233 1.5567 1.5025 2003 ................ 1.4008 1.1321 .............. .............. .............. .............. .............. 115.94 8.0787 1.3450 1.6347 2004 ................ 1.3017 1.2438 .............. .............. .............. .............. .............. 108.15 7.3480 1.2428 1.8330 2003: I ............. 1.5098 1.0733 .............. .............. .............. .............. .............. 118.93 8.5572 1.3662 1.6025
II ............ 1.3992 1.1356 .............. .............. .............. .............. .............. 118.55 8.0607 1.3370 1.6183 III .......... 1.3806 1.1264 .............. .............. .............. .............. .............. 117.41 8.1385 1.3720 1.6107 IV ........... 1.3162 1.1920 .............. .............. .............. .............. .............. 108.78 7.5647 1.3044 1.7079
2004: I ............. 1.3184 1.2499 .............. .............. .............. .............. .............. 107.24 7.3533 1.2552 1.8385 II ............ 1.3590 1.2047 .............. .............. .............. .............. .............. 109.69 7.5968 1.2768 1.8063 III .......... 1.3078 1.2227 .............. .............. .............. .............. .............. 109.94 7.4922 1.2569 1.8193 IV ........... 1.2208 1.2991 .............. .............. .............. .............. .............. 105.67 6.9436 1.1818 1.8687
Trade-weighted value of the U.S. dollar
Nominal Real 7
G–10 index (March
1973=100)3
Broad index (January
1997=100)4
Major cur-rencies index
(March 1973=100)5
OITP index (January
1997=100)6
Broad index (March
1973=100)4
Major cur-rencies index
(March 1973=100)5
OITP index (March
1973=100)6
1983 ................ 125.3 52.8 120.4 7.4 110.4 110.8 108.6 1984 ................ 138.2 60.1 128.7 9.8 117.5 118.3 115.1 1985 ................ 143.0 67.2 133.5 13.1 122.4 122.1 122.9 1986 ................ 112.2 62.4 109.8 16.5 106.8 99.6 126.4 1987 ................ 96.9 60.4 97.2 19.9 98.1 89.1 123.8 1988 ................ 92.7 60.9 90.4 24.1 91.5 84.0 113.3 1989 ................ 98.6 66.9 94.3 29.6 93.1 88.2 107.8 1990 ................ 89.1 71.4 89.9 40.1 91.5 84.8 110.8 1991 ................ 89.8 74.4 88.6 46.7 90.1 83.1 110.3 1992 ................ 86.6 76.9 87.0 53.2 88.2 82.0 106.6 1993 ................ 93.2 83.8 89.9 63.4 89.6 85.2 104.0 1994 ................ 91.3 90.9 88.4 80.5 89.4 84.9 104.1 1995 ................ 84.2 92.7 83.4 92.5 86.9 81.0 104.1 1996 ................ 87.3 97.5 87.2 98.2 89.0 85.9 101.1 1997 ................ 96.4 104.4 93.9 104.6 93.7 93.2 102.1 1998 ................ 98.8 115.9 98.4 125.9 101.7 98.2 115.5 1999 ................ ......................... 116.0 96.9 129.2 101.1 98.0 114.2 2000 ................ ......................... 119.4 101.6 129.8 105.0 104.7 114.3 2001 ................ ......................... 125.9 107.7 135.9 111.1 112.2 119.0 2002 ................ ......................... 126.8 106.0 140.6 111.3 110.6 121.6 2003 ................ ......................... 119.3 93.0 144.0 104.6 97.7 123.3 2004 ................ ......................... 113.8 85.4 144.0 100.0 90.7 122.1 2003: I ............. ......................... 123.4 97.9 146.0 108.1 102.5 124.9
II ........... ......................... 119.1 93.4 143.0 104.5 97.9 122.7 III .......... ......................... 119.0 93.1 143.1 104.9 98.0 123.4 IV .......... ......................... 115.6 87.8 144.1 101.0 92.2 122.3
2004: I ............. ......................... 113.3 85.4 142.9 99.1 90.1 120.8 II ........... ......................... 116.0 88.0 145.0 102.2 93.5 123.7 III .......... ......................... 115.1 86.5 145.4 101.3 92.1 123.4 IV .......... ......................... 110.8 81.8 142.9 97.4 87.3 120.6
1 European Economic and Monetary Union members include Austria, Belgium, Finland, France, Germany, Ireland, Italy, Luxembourg, Nether-lands, Portugal, Spain, and beginning in 2001, Greece.
2 U.S. dollars per foreign currency unit. 3 G-10 comprises the individual countries shown in this table. Discontinued after December 1998. 4 Weighted average of the foreign exchange value of the dollar against the currencies of a broad group of U.S. trading partners. 5 Subset of the broad index. Includes currencies of the euro area, Australia, Canada, Japan, Sweden, Switzerland, and the United Kingdom. 6 Subset of the broad index. Includes other important U.S. trading partners (OITP) whose currencies are not heavily traded outside their
home markets. 7 Adjusted for changes in the consumer price index. Source: Board of Governors of the Federal Reserve System.
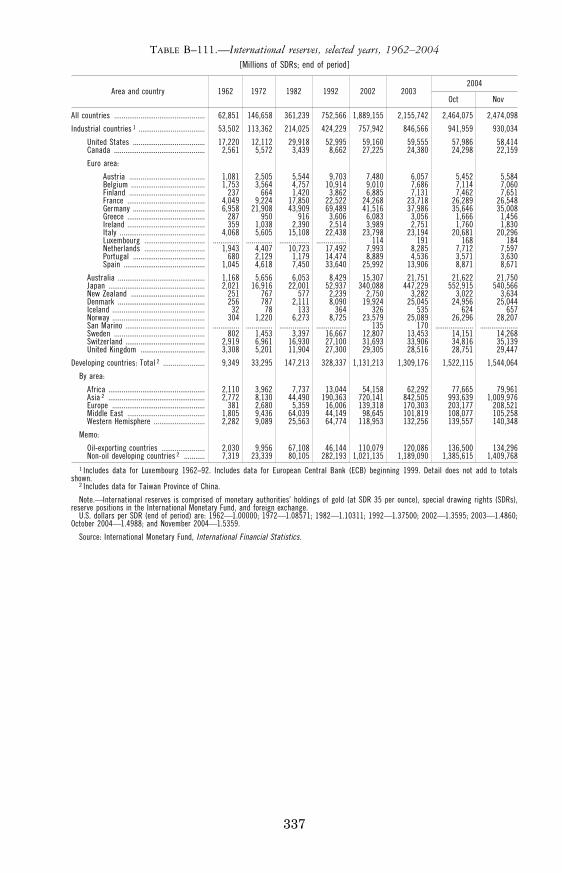
337
TABLE B–111.—International reserves, selected years, 1962–2004 [Millions of SDRs; end of period]
Area and country 1962 1972 1982 1992 2002 2003 2004
Oct Nov
All countries ................................................ 62,851 146,658 361,239 752,566 1,889,155 2,155,742 2,464,075 2,474,098
Industrial countries 1 ................................... 53,502 113,362 214,025 424,229 757,942 846,566 941,959 930,034
United States ...................................... 17,220 12,112 29,918 52,995 59,160 59,555 57,986 58,414 Canada ................................................ 2,561 5,572 3,439 8,662 27,225 24,380 24,298 22,159
Euro area:
Austria ........................................ 1,081 2,505 5,544 9,703 7,480 6,057 5,452 5,584 Belgium ....................................... 1,753 3,564 4,757 10,914 9,010 7,686 7,114 7,060 Finland ........................................ 237 664 1,420 3,862 6,885 7,131 7,462 7,651 France ......................................... 4,049 9,224 17,850 22,522 24,268 23,718 26,289 26,548 Germany ...................................... 6,958 21,908 43,909 69,489 41,516 37,986 35,646 35,008 Greece ......................................... 287 950 916 3,606 6,083 3,056 1,666 1,456 Ireland ......................................... 359 1,038 2,390 2,514 3,989 2,751 1,760 1,830 Italy ............................................. 4,068 5,605 15,108 22,438 23,798 23,194 20,681 20,296 Luxembourg ................................ .............. .............. ................ ................ 114 191 168 184 Netherlands ................................ 1,943 4,407 10,723 17,492 7,993 8,285 7,712 7,597 Portugal ...................................... 680 2,129 1,179 14,474 8,889 4,536 3,571 3,630 Spain ........................................... 1,045 4,618 7,450 33,640 25,992 13,906 8,871 8,671
Australia .............................................. 1,168 5,656 6,053 8,429 15,307 21,751 21,622 21,750 Japan ................................................... 2,021 16,916 22,001 52,937 340,088 447,229 552,915 540,566 New Zealand ....................................... 251 767 577 2,239 2,750 3,282 3,022 3,634 Denmark .............................................. 256 787 2,111 8,090 19,924 25,045 24,956 25,044 Iceland ................................................. 32 78 133 364 326 535 624 657 Norway ................................................. 304 1,220 6,273 8,725 23,579 25,089 26,296 28,207 San Marino .......................................... .............. .............. ................ ................ 135 170 .................... ....................Sweden ................................................ 802 1,453 3,397 16,667 12,807 13,453 14,151 14,268 Switzerland .......................................... 2,919 6,961 16,930 27,100 31,693 33,906 34,816 35,139 United Kingdom .................................. 3,308 5,201 11,904 27,300 29,305 28,516 28,751 29,447
Developing countries: Total 2 ...................... 9,349 33,295 147,213 328,337 1,131,213 1,309,176 1,522,115 1,544,064
By area:
Africa ................................................... 2,110 3,962 7,737 13,044 54,158 62,292 77,665 79,961 Asia 2 ................................................... 2,772 8,130 44,490 190,363 720,141 842,505 993,639 1,009,976 Europe ................................................. 381 2,680 5,359 16,006 139,318 170,303 203,177 208,521 Middle East ......................................... 1,805 9,436 64,039 44,149 98,645 101,819 108,077 105,258 Western Hemisphere ........................... 2,282 9,089 25,563 64,774 118,953 132,256 139,557 140,348
Memo:
Oil-exporting countries ....................... 2,030 9,956 67,108 46,144 110,079 120,086 136,500 134,296 Non-oil developing countries 2 ........... 7,319 23,339 80,105 282,193 1,021,135 1,189,090 1,385,615 1,409,768
1 Includes data for Luxembourg 1962–92. Includes data for European Central Bank (ECB) beginning 1999. Detail does not add to totals shown.
2 Includes data for Taiwan Province of China.
Note.—International reserves is comprised of monetary authorities’ holdings of gold (at SDR 35 per ounce), special drawing rights (SDRs), reserve positions in the International Monetary Fund, and foreign exchange.
U.S. dollars per SDR (end of period) are: 1962—1.00000; 1972—1.08571; 1982—1.10311; 1992—1.37500; 2002—1.3595; 2003—1.4860; October 2004—1.4988; and November 2004—1.5359.
Source: International Monetary Fund, International Financial Statistics.
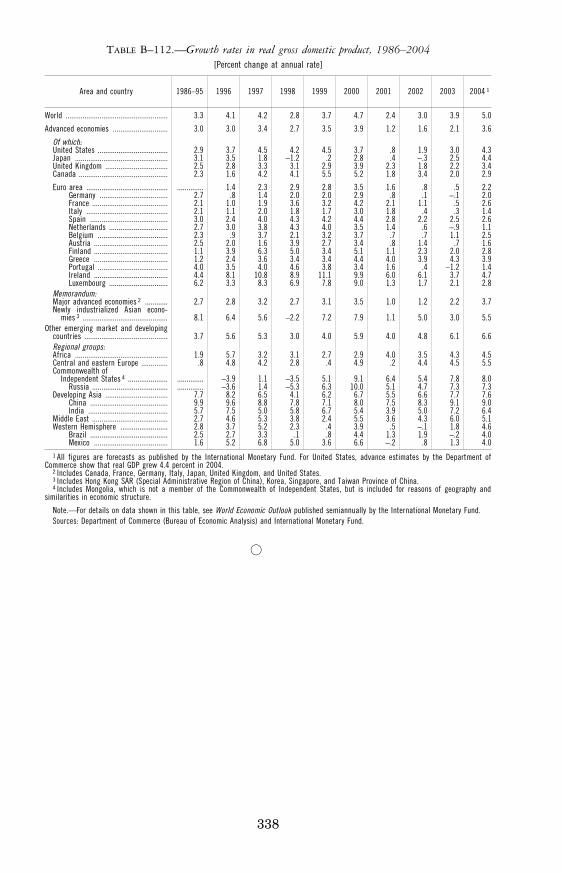
338
TABLE B–112.—Growth rates in real gross domestic product, 1986–2004 [Percent change at annual rate]
Area and country 1986–95 1996 1997 1998 1999 2000 2001 2002 2003 2004 1
World ...................................................... 3.3 4.1 4.2 2.8 3.7 4.7 2.4 3.0 3.9 5.0
Advanced economies ............................. 3.0 3.0 3.4 2.7 3.5 3.9 1.2 1.6 2.1 3.6
Of which: United States ..................................... 2.9 3.7 4.5 4.2 4.5 3.7 .8 1.9 3.0 4.3 Japan ................................................. 3.1 3.5 1.8 −1.2 .2 2.8 .4 −.3 2.5 4.4 United Kingdom ................................. 2.5 2.8 3.3 3.1 2.9 3.9 2.3 1.8 2.2 3.4 Canada ............................................... 2.3 1.6 4.2 4.1 5.5 5.2 1.8 3.4 2.0 2.9
Euro area ........................................... .............. 1.4 2.3 2.9 2.8 3.5 1.6 .8 .5 2.2 Germany .................................... 2.7 .8 1.4 2.0 2.0 2.9 .8 .1 −.1 2.0 France ........................................ 2.1 1.0 1.9 3.6 3.2 4.2 2.1 1.1 .5 2.6 Italy ........................................... 2.1 1.1 2.0 1.8 1.7 3.0 1.8 .4 .3 1.4 Spain ......................................... 3.0 2.4 4.0 4.3 4.2 4.4 2.8 2.2 2.5 2.6 Netherlands ............................... 2.7 3.0 3.8 4.3 4.0 3.5 1.4 .6 −.9 1.1 Belgium ..................................... 2.3 .9 3.7 2.1 3.2 3.7 .7 .7 1.1 2.5 Austria ....................................... 2.5 2.0 1.6 3.9 2.7 3.4 .8 1.4 .7 1.6 Finland ....................................... 1.1 3.9 6.3 5.0 3.4 5.1 1.1 2.3 2.0 2.8 Greece ....................................... 1.2 2.4 3.6 3.4 3.4 4.4 4.0 3.9 4.3 3.9 Portugal ..................................... 4.0 3.5 4.0 4.6 3.8 3.4 1.6 .4 −1.2 1.4 Ireland ....................................... 4.4 8.1 10.8 8.9 11.1 9.9 6.0 6.1 3.7 4.7 Luxembourg ............................... 6.2 3.3 8.3 6.9 7.8 9.0 1.3 1.7 2.1 2.8
Memorandum: Major advanced economies 2 ............ 2.7 2.8 3.2 2.7 3.1 3.5 1.0 1.2 2.2 3.7 Newly industrialized Asian econo-
mies 3 ............................................. 8.1 6.4 5.6 −2.2 7.2 7.9 1.1 5.0 3.0 5.5 Other emerging market and developing
countries ............................................ 3.7 5.6 5.3 3.0 4.0 5.9 4.0 4.8 6.1 6.6 Regional groups: Africa ................................................. 1.9 5.7 3.2 3.1 2.7 2.9 4.0 3.5 4.3 4.5 Central and eastern Europe .............. .8 4.8 4.2 2.8 .4 4.9 .2 4.4 4.5 5.5 Commonwealth of
Independent States 4 ..................... .............. −3.9 1.1 −3.5 5.1 9.1 6.4 5.4 7.8 8.0 Russia ........................................ .............. −3.6 1.4 −5.3 6.3 10.0 5.1 4.7 7.3 7.3
Developing Asia ................................. 7.7 8.2 6.5 4.1 6.2 6.7 5.5 6.6 7.7 7.6 China ......................................... 9.9 9.6 8.8 7.8 7.1 8.0 7.5 8.3 9.1 9.0 India .......................................... 5.7 7.5 5.0 5.8 6.7 5.4 3.9 5.0 7.2 6.4
Middle East ........................................ 2.7 4.6 5.3 3.8 2.4 5.5 3.6 4.3 6.0 5.1 Western Hemisphere ......................... 2.8 3.7 5.2 2.3 .4 3.9 .5 −.1 1.8 4.6
Brazil ......................................... 2.5 2.7 3.3 .1 .8 4.4 1.3 1.9 −.2 4.0 Mexico ....................................... 1.6 5.2 6.8 5.0 3.6 6.6 −.2 .8 1.3 4.0
1 All figures are forecasts as published by the International Monetary Fund. For United States, advance estimates by the Department of Commerce show that real GDP grew 4.4 percent in 2004.
2 Includes Canada, France, Germany, Italy, Japan, United Kingdom, and United States. 3 Includes Hong Kong SAR (Special Administrative Region of China), Korea, Singapore, and Taiwan Province of China. 4 Includes Mongolia, which is not a member of the Commonwealth of Independent States, but is included for reasons of geography and
similarities in economic structure.
Note.—For details on data shown in this table, see World Economic Outlook published semiannually by the International Monetary Fund. Sources: Department of Commerce (Bureau of Economic Analysis) and International Monetary Fund.
Æ