ERNA KALEVA Optimization of Quantitative High-Frequency...
78
ERNA KALEVA Optimization of Quantitative High-Frequency Ultrasound Imaging of Articular Cartilage JOKA KUOPIO 2009 KUOPION YLIOPISTON JULKAISUJA C. LUONNONTIETEET JA YMPÄRISTÖTIETEET 268 KUOPIO UNIVERSITY PUBLICATIONS C. NATURAL AND ENVIRONMENTAL SCIENCES 268 Doctoral dissertation To be presented by permission of the Faculty of Natural and Environmental Sciences of the University of Kuopio for public examination in Auditorium L22, Snellmania building, University of Kuopio, on Friday 11 th December 2009, at 12 noon Department of Physics, University of Kuopio Department of Clinical Neurophysiology, Kuopio University Hospital and University of Kuopio Department of Clinical Physiology and Nuclear Medicine, Kuopio University Hospital and University of Kuopio
Transcript of ERNA KALEVA Optimization of Quantitative High-Frequency...

ERNA KALEVA
Optimization of Quantitative High-Frequency Ultrasound
Imaging of Articular Cartilage
JOKAKUOPIO 2009
KUOPION YLIOPISTON JULKAISUJA C. LUONNONTIETEET JA YMPÄRISTÖTIETEET 268KUOPIO UNIVERSITY PUBLICATIONS C. NATURAL AND ENVIRONMENTAL SCIENCES 268
Doctoral dissertation
To be presented by permission of the Faculty of Natural and Environmental Sciences
of the University of Kuopio for public examination in Auditorium L22, Snellmania building,
University of Kuopio, on Friday 11th December 2009, at 12 noon
Department of Physics, University of KuopioDepartment of Clinical Neurophysiology,
Kuopio University Hospital and University of KuopioDepartment of Clinical Physiology and Nuclear Medicine,
Kuopio University Hospital and University of Kuopio

Distributor : Kuopio University Library P.O. Box 1627 FI-70211 KUOPIO FINLAND Tel. +358 40 355 3430 Fax +358 17 163 410 http://www.uku.fi/kirjasto/julkaisutoiminta/julkmyyn.shtml
Series Editor : Professor Pertti Pasanen, Ph.D. Department of Environmental Science
Author’s address: Department of Physics University of Kuopio P.O. Box 1627 FI-70211 KUOPIO FINLAND Tel. +358 50 375 0781 Fax +358 17 162 585 E-mail : [email protected]
Supervisors: Professor Jukka Jurvelin, Ph.D. Department of Physics University of Kuopio
Professor Juha Töyräs, Ph.D. Department of Physics University of Kuopio
Adjunct Professor Simo Saarakkala, Ph.D. Department of Physics University of Kuopio
Reviewers: Research Scientist Amena Saïed, Ph.D. Laboratoire d’Imagerie Paramétrique CNRS - Univesité Pierre et Marie Curie, France
Professor Georg N. Duda, Ph.D. Julius Wolff Institut Charité - Universitätsmedizin Berlin, Germany
Opponent: Principal Research Scientist Jun-Kyo Francis Suh, Ph.D. Convergence Technology Laboratories Korea Institute of Science and Technology, Korea
ISBN 978-951-27-1406-3ISBN 978-951-27-1461-2 (PDF)ISSN 1235-0486
KopijyväKuopio 2009Finland

Kaleva, Erna. Optimization of quantitative high-frequency ultrasound imaging of articularcartilage. Kuopio University Publications C. Natural and Environmental Sciences 268. 2009.77 p.ISBN 978-951-27-1406-3ISBN 978-951-27-1461-2 (PDF)ISSN 1235-0486
ABSTRACT
Osteoarthrosis (OA) is a common musculoskeletal disease affecting the quality of life espe-cially amongst the elderly. In OA, the cartilage tissue in articulating joints, such as the knee,degenerates and eventually wears out, exposing the subchondral bone. The first symptoms ofOA - pain and limited mobility - usually appear during the late stage of the disease, when thechanges in the cartilage are already irreversible. Early signs of OA cannot be detected withthe current clinical imaging methods.
Quantitative high-frequency ultrasound imaging is a promising method for detecting earlydegenerative changes in articular cartilage. This thesis work has further developed the quan-titative ultrasound methodology for the assessment of cartilage in order to improve the sensi-tivity of OA diagnostics. Bovine and human osteochondral samples were studied in vitro. Theacoustic parameters associated with ultrasound reflection from the surface of the cartilage androughness of the superficial cartilage were evaluated. The values of the acoustic parameterswere related with the structural integrity of the cartilage as assessed by microscopical imagingand histological scoring. Acoustic parameters defined in time and frequency domains or us-ing wavelet transform were compared with each other in order to find the optimal parameterfor detecting the changes related to OA. The effects of ultrasound frequency, temporal sam-pling frequency, spatial sampling step and angle of incidence of the ultrasound pulse withrespect to the articular surface were investigated to optimize the imaging parameters and toclarify the effect of sources of uncertainties associated with potential clinical measurements.For the first time, a sample-specific acoustic model was constructed to numerically evaluatethe effects of varying surface roughness, material parameters and inclination of the articularsurface on the ultrasound reflection.
The wavelet parameters, including both the time and frequency information of the origi-nal reflected ultrasound signal, were not superior to the traditional time or frequency domainparameters. On the contrary, their complexity might well hinder their usability in a clini-cal measurement. The acoustically determined roughness of the cartilage surface was themost reliable indicator of the degeneration of the tissue. The major limitation to the use of theroughness parameter is the greater technical requirements demanded of the imaging system incomparison to those needed with the parameters describing the amplitude of the reflected ul-trasound. In particular, the ultrasound transducer must be focused and the frequency shouldbe high (> 5 MHz). The strong attenuation of the high-frequency ultrasound hinders the si-multaneous assessment of the subchondral bone, which is also affected in OA. However, theroughness parameter was less susceptible to the angle of incidence of the ultrasound pulsewith respect to the surface of the cartilage. The modeling results supported the findings ofthe present experimental studies and indicated that ultrasound successfully detects changesin the cartilage that are characteristic of OA.
In conclusion, the presented methods provide useful information about the optimizationof quantitative high-frequency ultrasound imaging of articular cartilage, and may be utilizedin further development of clinical ultrasound applications.
PACS Classification: 43.35.+dUniversal Decimal Classification: 534.321.9National Library of Medicine Classification: QT 34, QT 36, WE 300, WE 348, WN 208Medical Subject Headings: Musculoskeletal Diseases/diagnosis; Joint Diseases/diagnosis; Osteoarthri-tis/diagnosis; Cartilage, Articular/ultrasonography; Collagen; Proteoglycans; Diagnostic Imaging; Ul-trasonography; Ultrasonics; Acoustics; Surface Properties


To Tuomas


ACKNOWLEDGMENTS
This study was carried out during the years 2006-2009 at the Department of Physics,University of Kuopio, at the Department of Clinical Neurophysiology, Kuopio Uni-versity Hospital and University of Kuopio and at the Department of Clinical Physiol-ogy and Nuclear Medicine, Kuopio University Hospital and University of Kuopio.
I am grateful to professor Jukka Jurvelin, Ph.D., my main supervisor and the leaderof our research group Biophysics of Bone and Cartilage, BBC, for giving me the op-portunity to work in this successful and inspiring group.
I thank my second supervisor professor Juha Töyräs, Ph.D. for guiding my thesiswork and always finding the time for enthusiastically solving scientific challenges.
I wish to express my gratitude also to my third supervisor, adjunct professor SimoSaarakkala, Ph.D., for his valuable hands-on help and maintaining a considerate atti-tude throughout the thesis process.
I am grateful to the official reviewers of this thesis, Research Scientist AmenaSaïed, Ph.D. and Univ.-Prof. Dr. Georg N. Duda, Ph.D., for their constructive criti-cism and encouraging comments. I thank Professor Ewen Macdonald, D.Pharm. forlinguistic review.
Working in the ever growing BBC research group has been a real joy during the lastyears. The openness and friendly atmosphere have helped me through some toughphases during the thesis project.
Particularly, I wish to thank Eveliina Lammentausta, Heikki Nieminen, and MikkoNissi for ”showing me the ropes” in the beginning, Pauno Lötjönen and Antti Aula forassistance in sample preparation, Matti Timonen for programming custom made mea-surement software when needed, Janne Karjalainen for introducing me the principlesof ultrasonic measurements, Tuomas Virén for participating in the exhausting noctur-nal measurement sessions, Tuomo Silvast for conducting the microCT measurementsof my samples and Jukka Liukkonen for his efforts in modeling.
My thanks go also to the past and present members and visitors of the BBC groupand Rami Korhonen’s research group who I have had the priviledge of working with(in alphabetical order): Jatta Berberat, Mikko Hakulinen, Yale Huang, Hanna Isaks-son, Petro Julkunen, Panu Kiviranta, Yevgeniya Kobrina, Harri Kokkonen, Rami Kor-honen, Katariina Kulmala, Mikko Laasanen, Markus Malo, Juho Marjanen, Mika Mik-kola, Mika Mononen, Jaana Mäkitalo, Laetitia Nasser, Viktoria Prantner, SariannePääkkö, Ossi Riekkinen, Lassi Rieppo, Lauri Rytkönen, Elli-Noora Salo, Dimitry Se-menov, Petri Tanska, Mikael Turunen, Siru Turunen, Cora Verheijen and Sami Väänä-nen.
I want to acknowledge the staff at the Institute of Biomedicine, Anatomy and theBioMater Centre, especially Eija Rahunen, Kari Kotikumpu, Riikka Kärnä, MikkoLammi, Heikki Helminen, Virpi Miettinen, Arto Koistinen and Ritva Sormunen fortheir efforts and help in sample processing and related issues.
I also wish to thank the staff at the Department of Physics and especially JarkkoLeskinen for degassing bucketloads of saline for my measurements.
I acknowledge Atria Suomi Oy, Kuopio, Finland for providing bovine joints asresearch material.
This thesis work was financially supported by several Finnish institutions: Kuo-pio University Hospital (EVO grants 5041719 and 5031337), the National Graduate

School of Musculoskeletal Disorders and Biomaterials (TBGS) and Päivikki and SakariSohlberg Foundation (grant 49720) (and my mother). The North Savo Regional Fundof the Finnish Cultural Foundation, Jenny and Antti Wihuri Foundation and I-SKTS,Foundation for Advanced Technology of Eastern Finland are acknowledged for theirhighly valuable personal grants.
I send my dearest thanks to the friends and relatives who have believed in me andgiven my life a deeper meaning. Especially I want to thank my parents Heli and JouniKaleva and my brother Sampo Kaleva for supporting me on the path I have chosen. Ialso cordially thank Pepsi, Ensio, Purre and Unto for their soft, unconditional support.
I owe my deepest gratitude to my significant other Tuomas for his endless loveand support, occasional technical and liguistic assistance and bearing the side effectsduring the years of my thesis work.
Kuopio, November 22nd, 2009
Erna Kaleva

ABBREVIATIONS
1D one-dimensional2D two-dimensional3D three-dimensionalA/D analog/digitalA-mode 1D amplitude representation of a reflected ultrasound waveB-scan 2D ultrasound imageCCD charge-coupled deviceCT computed tomographyEDTA ethylenediaminetetraacetate acidFDTD finite difference time domainFEPA Federation of European Producers of AbrasivesFFT fast Fourier transformFMC femoral medial condyleFT femoral trochleaFWHM full width at half of the maximumFWTM full width at one tenth of the maximumLPG lateral patellar grooveMRI magnetic resonance imagingMTP medial tibial plateauOA osteoarthrosis, osteoarthritisPAT patellaPBS phosphate-buffered salinePG proteoglycanQUI quantitative ultrasound imagingRMS root mean squareROC receiver operating characteristicSEM scanning electron microscopyUS ultrasoundWT wavelet transformX-ray radiographic imaging

SYMBOLS AND NOTATIONS
a dilation parameter or scaleA amplitude of the ultrasound signalAi amplitude of the i:th A-mode US signalAref
i amplitude of the reference A-mode US signalA0(z, f) frequency and depth-dependent attenuation function in PBSα ultrasound attenuation coefficientb location parameterc speed of sound, ultrasound wave velocityCV coefficient of variationCQI cartilage quality indexd distancedi distance between US transducer and sample in i:th A-mode US signalD diameter of ultrasound transducerDbeam cross-sectional diameter of ultrasound beam∆f frequency bandwidthE Young’s (elastic) modulusE(f) acoustoelectric transfer functionED echo durationf frequency of ultrasound or pseudo frequencyfc central frequency of a mother wavelet functionF focal lengthFz focal zoneφ bulk viscosityG(f) acquisition system transfer functionH2
s (z, f) surface-integrated diffraction function in pulse echo modeη shear viscosityI intensity of the ultrasound signalIRC integrated reflection coefficientIRCexp experimental integrated reflection coefficientIRCmodel modeled integrated reflection coefficientj imaginary unitk wave numberλ wavelength or first Lamé constantm number of A-mode ultrasound signals or powermM molarity, millimoles per literMM maximum magnitudeµ second Lamé constantn number of samples or datapointsν Poisson’s ratioω angular temporal frequencyp statistical significance

r correlation coefficientR ultrasound reflection coefficientR(f) frequency-dependent reflection coefficientRref(f) frequency-dependent reflection coefficient of the reference signalRdB(f) frequency-dependent reflection coefficient in decibelsρ densityS(z, f) frequency spectrum of the ultrasound reflection signal
from the cartilage surfaceSref(z, f) frequency spectrum of the ultrasound reflection signal
from the reference surfaceT transmission coefficientSD standard deviationt timeT (a, b) continuous wavelet transform coefficientθi angle of incidenceθr angle of refractionTOF time of flightu particle displacementURI ultrasound reflection indexvl longitudinal ultrasound wave velocityw 2D displacement vectorx 1D signalψ mother wavelet functionz distance or depthzR Rayleigh distanceZ acoustic impedance〈· · · 〉 spatial average|· · ·| absolute value∂ partial difference operator∇ gradient operator∇· divergence operator∗ complex conjugate


LIST OF ORIGINAL PUBLICATIONS
This thesis is based on the following original articles referred to in the text by theirRoman numerals:
I Kaleva E., Saarakkala S., Töyräs J., Nieminen H.J. and Jurvelin J.S.: In vitrocomparison of time-domain, frequency-domain and wavelet ultrasound param-eters in diagnostics of cartilage degeneration, Ultrasound in Medicine and Biology,34(1):155-9 (2008);doi:10.1016/j.ultrasmedbio.2007.06.028
II Kaleva E., Saarakkala S., Jurvelin J.S., Virén T. and Töyräs J.: Effects of ultra-sound beam angle and surface roughness on the quantitative ultrasound param-eters of articular cartilage, Ultrasound in Medicine and Biology, 35(8):1344-1351(2009);doi:10.1016/j.ultrasmedbio.2009.03.009
III Kaleva E., Töyräs J., Jurvelin J.S., Virén T. and Saarakkala S.: Effects of ultra-sound frequency, temporal sampling frequency and spatial sampling step onthe quantitative ultrasound parameters of articular cartilage, IEEE Trans Ultra-son Ferroelectr Freq Control, 56(7):1383-1393 (2009);doi:10.1109/TUFFC.2009.1194
IV Kaleva E., Liukkonen J., Töyräs J., Saarakkala S., Kiviranta P. and Jurvelin J.S.:Two-dimensional finite difference time domain model of ultrasound reflectionfrom normal and osteoarthritic human articular cartilage surface, accepted forpublication in IEEE Trans Ultrason Ferroelectr Freq Control (2009).
The original articles have been reproduced with permission of the copyright holders.The thesis also contains previously unpublished data.


CONTENTS
1 Introduction 17
2 Articular cartilage 212.1 Structure and composition . . . . . . . . . . . . . . . . . . . . . . . . . . 212.2 Function . . . . . . . . . . . . . . . . . . . . . . . . . . . . . . . . . . . . 222.3 Osteoarthrosis; pathophysiology, diagnosis and treatment . . . . . . . . 23
3 Ultrasonic assessment of articular cartilage 253.1 Basic physics of ultrasound . . . . . . . . . . . . . . . . . . . . . . . . . 253.2 Technical aspects of ultrasound imaging . . . . . . . . . . . . . . . . . . 263.3 Quantitative ultrasonic evaluation of articular cartilage . . . . . . . . . 28
4 Aims of the present study 31
5 Materials and methods 335.1 Articular cartilage samples . . . . . . . . . . . . . . . . . . . . . . . . . . 345.2 Phantoms . . . . . . . . . . . . . . . . . . . . . . . . . . . . . . . . . . . . 345.3 Ultrasonic imaging and quantitative measurements . . . . . . . . . . . 34
5.3.1 Dermascan . . . . . . . . . . . . . . . . . . . . . . . . . . . . . . . 355.3.2 UltraPAC . . . . . . . . . . . . . . . . . . . . . . . . . . . . . . . . 355.3.3 Ultrascan . . . . . . . . . . . . . . . . . . . . . . . . . . . . . . . . 36
5.4 Quantitative ultrasound parameters . . . . . . . . . . . . . . . . . . . . 365.4.1 Reflection parameters IRC and R . . . . . . . . . . . . . . . . . . 375.4.2 Roughness parameter URI . . . . . . . . . . . . . . . . . . . . . . 385.4.3 Wavelet parameters MM and ED . . . . . . . . . . . . . . . . . . 39
5.5 Reference methods . . . . . . . . . . . . . . . . . . . . . . . . . . . . . . 405.5.1 Light microscopy . . . . . . . . . . . . . . . . . . . . . . . . . . . 405.5.2 Scanning electron microscopy . . . . . . . . . . . . . . . . . . . . 425.5.3 High-resolution computed tomography . . . . . . . . . . . . . . 43
5.6 Acoustic modeling . . . . . . . . . . . . . . . . . . . . . . . . . . . . . . 435.7 Statistical analyses . . . . . . . . . . . . . . . . . . . . . . . . . . . . . . . 46
kaleva
Rectangle
6 Results 496.1 Comparison of ultrasound parameters in time, frequency and wavelet
domains . . . . . . . . . . . . . . . . . . . . . . . . . . . . . . . . . . . . 496.2 Effects of articular surface roughness on ultrasound parameters . . . . 496.3 Effects of ultrasound angle of incidence on ultrasound parameters . . . 526.4 Effects of ultrasound frequency, temporal sampling frequency and spa-
tial sampling step on ultrasound parameters . . . . . . . . . . . . . . . 53
7 Discussion 577.1 Time, frequency and wavelet domain parameters . . . . . . . . . . . . . 577.2 Effects of articular surface roughness on ultrasound results . . . . . . . 587.3 Significance of ultrasound angle of incidence on ultrasound results . . 597.4 Effects of measurement parameters on ultrasound results . . . . . . . . 607.5 Limitations of ultrasonic modeling of articular cartilage . . . . . . . . . 61
8 Summary and conclusions 63
References 66
Appendix: Original publications

CHAPTER I
Introduction
Osteoarthrosis (OA), also referred to as osteoarthritis, is a very common musculoskele-tal disease of the joints. Typically it is initiated by injuries, exessive loading, obesityand aging [18, 103, 106]. In addition to the decrease in the individual’s quality of life,OA causes significant costs to the society because of lost working ability and treat-ment expenses [18, 35, 45, 86, 87, 130]. In the USA, the number of people with clinicalOA has gone up from 21 million in 1995 to 27 million in 2008 [86], and the medicaland prescription costs per patient alone were more than one thousand dollars yearly[35]. Aging of the population will further increase the socio-economical impact of OAin Finland also.
Progressive OA is associated with an increase of the water content, depletion of theproteoglycans (PG) and disruption of the collagen matrix in cartilage [6, 17, 101, 105].If an intervention is to be made while the osteoarthritic changes might still be re-versible, one would need to have a method capable of detecting early changes in thecartilage, such as fibrillation of the surface. Further, the possibility to monitor andreliably quantify properties of healing cartilage is a prerequisite for developing andimproving remedies and surgical repair methods. The resolution of the current clini-cal imaging methods (X-ray imaging, magnetic resonance imaging) is not sufficient todetect the earliest signs of degeneration of the cartilage [77]. The qualitative arthro-scopic examination, based on the visual assessment of the surface of the cartilage, issubjective and unable to detect early degeneration of the tissue [116, 115].
High frequency ultrasound has been shown to reveal spontaneous and enzymat-ically or mechanically induced morphological changes in articular cartilage both inhuman and animal in vitro studies [2, 24, 25, 26, 29, 52, 65, 93, 111, 122, 131, 133, 134,135, 137, 144]. Furthermore, quantitative ultrasound imaging (QUI) has been usedfor evaluation of healing of cartilage lesions after surgical repair both spontaneously[81, 85] and with tissue-engineered cartilage [55, 56]. Quantitative ultrasound pa-rameters defined in time and frequency domains have been applied successfully fordiagnosing the integrity of articular cartilage in vitro [25, 133]. Attempts have beenmade to define parameters based on the wavelet transform (WT) of an ultrasoundsignal as a way of estimating surface irregularity and thickness of articular cartilage[52]. The WT analysis has been applied also in vivo during examination of humanknee, ankle, elbow and wrist cartilage during arthroscopic surgery [51, 54, 112, 136].
In study I of this thesis, time-domain, frequency-domain and WT ultrasound pa-rameters were evaluated to determine their potential for detecting degenerative chan-
17

18
ges in the surface of articular cartilage. The usefulness of the WT parameters wascompared with that of the time and frequency domain parameters. It was hypothe-sized that because of the intrinsic ability of the WT analysis to simultaneously pre-serve the time-domain and frequency-domain information of an ultrasound signal, itmight provide more useful information about the cartilage tissue than the time- orfrequency-domain analyses separately.
Non-perpendicular angle of incidence of the ultrasound beam or the natural cur-vature of the articular surface can jeopardize the reliability of the QUI measurements.In material sciences, the reflection and scattering of ultrasound from inclined planarrough phantoms have been studied [121, 154]. Although the dependence of specularreflection on the inclination of an interface is generally well understood for homo-geneous materials, this is not the case with biological materials, e.g. the ultrasoundreflected and scattered from a degenerated articular surface. The susceptibility of theQUI of cartilage to variations in the angle of incidence of the ultrasound beam relativeto the investigated surface has not been studied thoroughly. However, it is known thatthe angle of incidence of the ultrasound beam on the cartilage can affect the amplitudeof the reflected ultrasound differently in healthy and degenerated cartilage [13, 24].In study II, the susceptibility of the ultrasound parameters to non-perpendicularityof the ultrasound angle of incidence with respect to the articular surface was investi-gated. Visually intact and degenerated cartilage surfaces were included in the studyto investigate the effect of the surface characteristics on the angular dependence of theparameters.
In OA, subchondral sclerosis and osteophyte formation are known to occur in par-allel with the cartilage degeneration [18]. Therefore, the ultrasonic analysis of thesubchondral bone could provide diagnostically valuable information. Encouragingresults have been achieved in simultaneous ultrasound diagnostics of the cartilageand the subchondral bone; the shape of the frequency profiles [13] or the ratio of thereflection coefficients of the cartilage and bone at 10 MHz [14] have been found to dif-ferentiate degraded cartilage from normal tissue. Changes in acoustic impedances, re-flecting the changes in the elastic properties and density of cartilage and subchondralbone, have indicated subchondral sclerosis at 50 MHz [90]. The amplitude of the re-flection from the cartilage-bone interface has been found to increase in spontaneouslydegenerated tissue [133]. Unfortunately, excessive attenuation at high (> 10 MHz)ultrasound frequencies limits the imaging depth and can prevent effective ultrasonicimaging of the subchodral bone. For example, the measurement of the ultrasoundscattering from within the bone becomes unfeasible. Therefore, in bone diagnostics,low (∼5 MHz) ultrasound frequencies are generally used [20, 44, 47, 58, 70]. However,low (∼ 5 MHz) ultrasound frequencies have not been applied in the QUI of the car-tilage. Furthermore, the frequency and focusing affect the ultrasound beam diameterand thus the imaging resolution of the ultrasound method. Similarly, the size of thespatial sampling step and temporal sampling frequency were hypothesized to affectthe quantitative ultrasound parameters - especially the ultrasound roughness index(URI) which was introduced earlier as a way of conducting ultrasonic determinationof surface roughness of cartilage [131]. Different sampling steps and temporal sam-pling frequencies have been used in QUI studies of articular cartilage [25, 131, 133],but their effects on the calculated parameters have not been studied thoroughly pre-viously. Study III aimed to clarify to what extent the focusing and frequency of the
1. Introduction 19
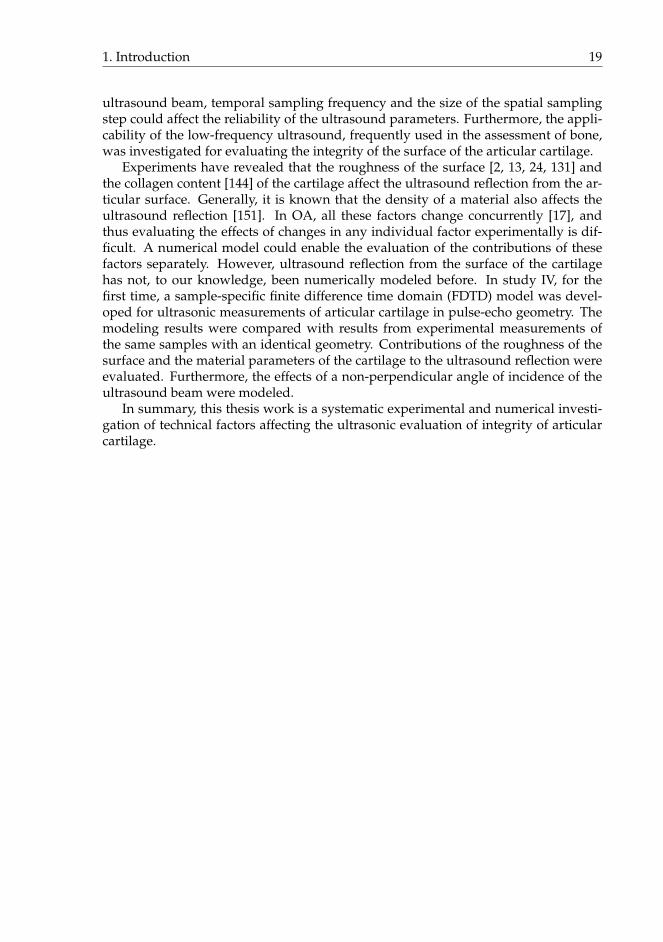
ultrasound beam, temporal sampling frequency and the size of the spatial samplingstep could affect the reliability of the ultrasound parameters. Furthermore, the appli-cability of the low-frequency ultrasound, frequently used in the assessment of bone,was investigated for evaluating the integrity of the surface of the articular cartilage.
Experiments have revealed that the roughness of the surface [2, 13, 24, 131] andthe collagen content [144] of the cartilage affect the ultrasound reflection from the ar-ticular surface. Generally, it is known that the density of a material also affects theultrasound reflection [151]. In OA, all these factors change concurrently [17], andthus evaluating the effects of changes in any individual factor experimentally is dif-ficult. A numerical model could enable the evaluation of the contributions of thesefactors separately. However, ultrasound reflection from the surface of the cartilagehas not, to our knowledge, been numerically modeled before. In study IV, for thefirst time, a sample-specific finite difference time domain (FDTD) model was devel-oped for ultrasonic measurements of articular cartilage in pulse-echo geometry. Themodeling results were compared with results from experimental measurements ofthe same samples with an identical geometry. Contributions of the roughness of thesurface and the material parameters of the cartilage to the ultrasound reflection wereevaluated. Furthermore, the effects of a non-perpendicular angle of incidence of theultrasound beam were modeled.
In summary, this thesis work is a systematic experimental and numerical investi-gation of technical factors affecting the ultrasonic evaluation of integrity of articularcartilage.

20

CHAPTER II
Articular cartilage
2.1 Structure and composition
Articular cartilage is aneural and avascular connective tissue that covers the epiphy-ses of articulating bones [17]. Articular cartilage distributes loads and creates, to-gether with synovial fluid, an almost frictionless interface between the bones. Thethickness of the tissue varies, depending on the location, age, weight, gender andspecies [8, 34, 48, 102, 139]; in the human knee joint, the thickness of the cartilage istypically between 1 and 6 mm [8, 34, 48].
Interstitial water makes up about 65 - 80 % of the total mass of the cartilage [16, 17].The solid part of the cartilage tissue consists mainly of a type II collagen fibril net-work embodying interfibrillar proteoglycan (PG) macromolecules and chondrocytes[16, 17].
The structure of the articular cartilage is highly anisotropic and inhomogeneous(figure 2.1). In the superficial zone, the collagen fibrils are thin (diameter ≈ 20 - 50 nm[50]) and aligned with the surface of the cartilage. In the transitional zone, the fibrilsstart gradually to thicken (reaching a diameter of 200 - 300 nm [50]) and bend towardsthe subchondral bone, and reach a perpendicular orientation in the deep zone. Thecollagen fibrils penetrate into the subchondral bone via the calcified cartilage layer.The collagen content of fully hydrated cartilage tissue is lowest in the disorganizedtransitional zone and higher in the organized deep and superficial zones [16, 50, 105].
The collagen matrix is maintained under tension by the osmotic pressure attribut-able to the negatively charged proteoglycans [30, 97]. The proteoglycans bind chem-ically to the collagen fibers or become mechanically entrapped within the collagenmatrix [16]. The concentration of the PGs increases as a function of the depth in thecartilage. Since the interstitial water fills the molecular framework, the water contentconversely decreases as a function of the depth [16].
The chondrocyte, which is responsible for the cartilage matrix synthesis, is theonly cell type within normal articular cartilage [16]. In human cartilage tissue, thechondrocytes make up only about 1 % of the total volume of the cartilage tissue [16].The shape of the chondrocytes changes from flat in the superficial zone to being morespherical in the deep zone. The density of the chondrocytes decreases as a functionof the depth in the cartilage [50]. The outermost thin layer of cartilage, on top of thesuperficial layer, is, however, cell-free [17]. This dense web of collagen fibrils forms a
21

22 2.2. Function
trabecular bone
subchondral bonecalcified cartilagetidemark
deep zone
transitional zone
superficial zone
chondrocyte
collagen fibril
Figure 2.1: The structure of articular cartilage tissue.
”skin” of the articular cartilage that prevents leakage of PGs out of the cartilage andantibodies and proteins into the cartilage [16].
2.2 Function
Articular cartilage provides a low-friction interface between the articulating bones.Intact cartilage surface is very smooth, showing roughness values less than 1 µm[39, 60]. The coefficient of friction between lubricated cartilage surfaces can be aslow as 0.01 [22, 38, 99]. In comparison, a Teflon-Teflon interface has a coefficient offriction of about 0.04. The low friction between the articulating surfaces can be ex-plained by two lubrication mechanisms. During dynamic loading (e.g. jumping) theinterstitial fluid is pressurized and thus it supports the load and diminishes the fric-tion [7]. During static loading (e.g. standing), the surface of cartilage is lubricated bysynovial macromolecules, e.g. lubricin [42, 64].
Another important function of the articular cartilage is to transmit and distributeforces between the articulating bones and to protect the bones from excessive loads[16, 105]. The articular cartilage is a poroviscoelastic material that has an excellentability to adapt to various types of loads. The behavior of the cartilage under load-ing is highly dependent on the type of the loading. When there is a short impulseload, such as during walking or running, the interstitial fluid does not have time tosqueeze out of the cartilage because the permeability of the tissue to fluid flow isnormally quite low (4.7 × 10⁻¹⁵ m4/Ns [105]). The collagen matrix resists the defor-mation pressure caused by the nearly incompressible interstitial water thus makingthe cartilage very stiff under impact loading [76, 105]. The superficial collagen fibersare also responsible for the tensile stiffness and resistance to shear forces on the super-ficial cartilage [72, 80]. In situations of static long-term loading, such as standing, the

2. Articular cartilage 23
role of the proteoglycans becomes more important [84]. With time, the fluid flows outot the tissue until a static equilibrium, primarily due to the electrostatic repulsion be-tween the PGs, is reached [105]. The equilibrium modulus of cartilage is in the rangeof 0.2 - 0.6 MPa as opposed to the instant modulus, which can be in the range of 1- 16 MPa [84]. The Poisson’s ratio ν for healthy cartilage is in the range of 0.05 - 0.4[50, 84].
2.3 Osteoarthrosis; pathophysiology, diagnosis and treatment
Osteoarthrosis is a severe degenerative joint disease typically found in the knee, hand,hip and spine [4, 17]. The cause of primary osteoarthrosis (OA) is poorly under-stood, but its prevalence is strongly associated with aging [10, 17]. Sometimes OAcan be initiated by injuries or else it can be a hereditary, inflammatory, developmen-tal, metabolic or neurologic disorder, and in that case is referred to as secondary OA[17]. The disease is, however, primarily characterized by disruption of the structureand impairment of the functional properties of the articular cartilage, together withincreased subchondral bone remodeling [17, 138]. Failure of the chondrocytes to re-pair or stabilize the cartilage tissue leads to the final stage of OA.
Increase in the water content of cartilage [17, 96, 98], depletion of proteoglycans insuperficial cartilage [101, 105] and degradation of collagen network [101] are knownto occur at an early stage of OA. These compositional and structural changes makecartilage softer and more prone to further damage [6]. Disruption of the collagennetwork, in contrast to depletion of proteoglycans, is especially harmful because it isregarded as a virtually irreversible process [16, 40, 146].
The earliest visually detectable sign of OA is fibrillation of the cartilage surface.In advanced OA, the roughness of degenerated cartilage may be over 100 µm [104],which is visually detectable. It is especially important to be able to evaluate thechanges in the properties of the superficial layer of the articular cartilage becausethe mechanical properties of the tissue are highly dependent on the integrity of thesuperficial collagen matrix [68, 80, 129, 149]. Furthermore, degradation of the superfi-cial collagen matrix can cause leakage of the superficial PGs out of the cartilage tissueand, thus, further affect the equilibrium stiffness of the cartilage [129]. In the finalstage of OA, the wear and tear on the cartilage can be excessive, and the subchon-dral bone may be revealed [12, 17, 150]. In addition, the degenerative changes in thecartilage, structural and biomechanical changes of the subchondral bone, such as for-mation of osteophytes and cysts or subchondral sclerosis, are also known to occur ineven the early stages of OA [5, 11, 17, 28, 127].
It is common that only the first symptoms, e.g. joint stiffness, limited range of mo-tion or pain associated with joint motion, convince the patients to make their way toclinical examinations [4, 17]. By that time, a significant portion of the cartilage tissuemay be already worn out and at this advanced stage of OA, the cartilage will not beable to recover. The current diagnosis techniques of OA include X-ray imaging, mag-netic resonance imaging (MRI) and arthroscopy. With X-ray imaging, only an indirectindication of cartilage wear, i.e. the narrowing of the joint space, is revealed. The in-creased density of subchondral bone and osteophytes can also be detected with radio-graphy, but as well as the joint space narrowing, these are typically signs of advancedOA. The MRI enables visualization of the cartilage tissue as well. Unfortunately, the

24 2.3. Osteoarthrosis; pathophysiology, diagnosis and treatment
resolution of the clinical MRI is not sufficient to allow the detection of the incipientfibrillation of the tissue. Arthroscopy enables direct inspection of the surface of thearticular cartilage, but the evaluation is based only on qualitative visual evaluationand mechanical palpation. All in all, the current diagnosis methods are unable to de-tect with any degree of accuracy the early OA changes, such as initial fibrillation ofthe superficial articular cartilage.
Since the ability of cartilage to repair itself is limited, an early diagnosis of cartilagedegeneration is of critical importance in order to initiate preventive, even reconstruc-tive actions. Elimination or reduction of certain risk factors, such as obesity, muscleweakness and repetitive and intense loading of the joint, is possible, whereas others,such as genetical background, gender or aging, cannot be influenced. The pain asso-ciated with OA can be relieved with analgesics and anti-inflammatory drugs [4, 17]and the mobility of the joint is claimed to be improved with intra-articular hyluronaninjection [118].
Currently, there is no cure for the primary OA, but disease modifying osteoarthri-tis drugs, such as glycosamine sulfate [63] and calcitonin [71], are under constantresearch and development. However, the effectiveness of the glycosamine sulfatetreatment is controversial [100, 125]. Surgical methods, such as mosaicplasty or autol-ogous chondrocyte transplantation have been developed for repair of focal cartilagedefects caused by injuries [15]. In some cases, the results have been good [17], but thelong term durability of the repaired tissue is questionable [32, 78].
Further development of the existing and new drugs and surgical methods for OArequire a sensitive method capable of imaging and quantifying the effectiveness ofthe treatments [126]. The current clinical methods lack sufficient sensitivity to detectthe changes related to early OA, whereas quantitative ultrasound imaging (QUI) hasshown potential e.g. in detecting the incipient fibrillation of the articular surface. TheQUI, however, is not yet a clinically applicable method. This thesis work has focusedon mapping the techical limitations and optimizing the imaging parameters of theQUI method as a way of advancing the potential clinical applications of ultrasound.

CHAPTER III
Ultrasonic assessment of articularcartilage
3.1 Basic physics of ultrasound
Ultrasound is a mechanical wave motion, the frequency of which is beyond the hu-man hearing range, i.e. above 20 kHz. Ultrasound can be generated through thepiezoelectric phenomenon (Greek: piezo ≈ press or squeeze), where the electrical sig-nal from a pulser is converted into mechanical vibration in the piezoelectric materialof the ultrasound transducer. The particles in a medium can vibrate along or acrossthe direction of the propagating ultrasound wave. When the direction of the vibra-tion of the particles and the propagation of the wave is the same, the rarefaction andcompression fronts in the medium form a longitudinal wave. When the oscillation ofthe particles happens perpendicular to the direction of the wave propagation, a trans-verse, i.e. shear wave is formed. Non-viscous fluids do not support shear waves [151].In articular cartilage, the shear waves are negligible in comparison to the longitudinalwaves [41, 94].
The linear wave equation describing simple harmonic vibration, derived fromNewton’s second law, can be used to approximate for the vibration caused by ul-trasound in a homogeneous, linear and isotropic material (equations (3.1) and (3.2)in table 3.1). When ultrasound propagates in and between media, the main physicalinteractions are attenuation, reflection and refraction. The angles, θ, of reflection andrefraction between two materials obey Snell’s law (equation (3.3) in table 3.1). Thereflection and refraction (equations (3.4) and (3.5) in table 3.1) are governed by thedifferences in acoustic impedances Z (equation (3.6) in table 3.1) of the media [151].
In reality, the interaction between ultrasound and a medium is never completelylossless because of different attenuation mechanisms. The intensity Iz of ultrasoundpropagating in direction z in a medium attenuates through both absorption and scat-tering (equation (3.7) in table 3.1). The absorption coefficient αabsorption (equation (3.8)in table 3.1) depends on the properties of the material, and for soft tissues, such as ar-ticular cartilage, the power of the frequency dependence, m, is 0.8-1.2 in a frequencyrange from 100 kHz to 10 MHz [152, 119]. The attenuation is usually expressed as aratio αabsorption/f and for soft tissues one attains a range of 0.3 - 3.5 dB cm−1 MHz−1in the frequency range from 100 kHz to 10 MHz [151, 152, 155]. Absorption mech-anisms involving conversion of energy from the vibrational form include e.g. elastichysteresis, viscosity and heat conduction in fluids [151]. In biological materials, such
25

26 3.2. Technical aspects of ultrasound imaging
Table 3.1: Basic equations for physics of ultrasound
Parameter/law Equation Number
Linear wave equation ∂2u∂z2 − 1
c2∂2u∂t2 = 0 (3.1)
Wave function u(z, t) = u0ej(ωt−kz) (3.2)
Snell’s law sin θisin θr
= c1c2
(3.3)Reflection coefficient R = preflected
pincident= Z2 cos θincident−Z1 cos θreflected
Z2 cos θincident+Z1 cos θreflected(3.4)
Transmission coefficient T = ptransmittedpincident
= 2Z2 cos θincidentZ2 cos θincident+Z1 cos θreflected
(3.5)Acoustic impedance Z = ρc (3.6)Intensity of ultrasound propagating in z-direction Iz = I0e
−2(αabsorption+αscattering)z (3.7)Attenuation coefficient in biological tissues αabsorption = α0f
m , m ≈ 0.8 - 1.2 (3.8)α0 = attenuation coefficientc = f
λ= velocity of the ultrasound wave in the direction of the ultrasound propagation
f = frequency of ultrasoundj = imaginary unitk = 2π/λ = wave numberλ = wavelength of ultrasoundω = 2πf = angular frequencyρ = densityt = timeθi = angle of incidenceθr = angle of refractionu = the displacement amplitude of a particle in the medium where ultrasound propagatesu0 = the displacement amplitude of a particle in the medium where ultrasound propagates at t = 0z = direction of the ultrasound propagation
as articular cartilage, relaxation originating from molecular or lattice vibrational en-ergy or translational energy is the dominant absorption interaction [151]. Scatteringof ultrasound is caused by elastic discontinuities within the medium. The nature ofscattering is determined by the size and shape of the scatterers. If the size of thescatterers is much smaller than the wavelength of the ultrasound, Rayleigh scatteringoccurs and the ultrasound is scattered uniformly in all directions. When the size ofthe scatterers is close to the wavelength, the distribution of the scattered ultrasounddepends strongly on the acoustic impedance and the geometry of the scatterers andthe scattering distributions can be very complex. When the size of the scatterers be-comes much larger than the wavelength, the proportion of scattering diminishes andthe specular reflection becomes the dominant interaction [151].
3.2 Technical aspects of ultrasound imaging
In this thesis, the ultrasonic measurements were done in a pulse-echo geometry, withthe same transducer being used to transmit and receive the ultrasonic signal, becausethe articular surface was the target of interest. Ultrasonic detection of details in themicrometer scale, such as fibrillation of the superficial articular cartilage, poses de-manding requirements for the resolution of the ultrasound transducer.
The axial resolution of an ultrasound system is defined as the ability to resolve tworeflectors in parallel to the direction of the ultrasound beam axis and thus it is directlyrelated to the wavelength of the ultrasound [31]. As a general rule, the wavelength ofan ultrasound pulse decreases as the frequency of the ultrasound increases. However,the attenuation of ultrasound also increases as a function of the frequency (see equa-

3. Ultrasonic assessment of articular cartilage 27
tion (3.8) in table 3.1) and thus there is a limit to the resolution that can be achievedby increasing the frequency [49].
When pulsed ultrasound is used, the axial resolution, roughly determined as halfof the spatial pulse length, is better than with continuous ultrasound. Further, the fre-quency spectrum of the ultrasonic pulse widens as the duration of the pulse shortens.Thus, with shorter pulses, e.g. the attenuation of the ultrasound can be determinedwithin a wider range of frequencies.
The ultrasound field, generated by a piezoelectric transducer, can be roughly di-vided into two zones: the near field or Fresnel zone and the far field or Fraunhoferzone. In the near field, the ultrasound pulse fluctuates between high-amplitude max-ima and minima due to diffraction [37]. The distance from the surface of the trans-ducer to the last maximum of the near field, where the characteristic focus of thetransducer occurs, is called the Rayleigh distance, zR.
zR =πD2
4λ, (3.9)
where D is the diameter of a circular transducer element. Beyond the Rayleigh dis-tance, the far field begins and the pressure of the ultrasound signal gradually dropsto zero. For pulsed ultrasound, the pressure fluctuation in the near field is not as sig-nificant as for continuous ultrasound. Thus, with pulsed ultrasound, measurementscan be conducted in the near field as well.
The lateral resolution of the ultrasound system is primarily determined by thediameter of the ultrasound beam at the region of interest. The smaller the beam di-ameter, the better the lateral resolution and also the greater the energy reflected backfrom an acoustic interface. Usually, the beam diameter is defined by using the -6 dBlimit, where the intensity of the beam has dropped to half of the maximum in thedirection perpendicular to the beam axis:
Dbeam(−6dB) ≈ 1.028Fc
fD≈ 0.257D
F
zR, (3.10)
where F is the focal length, i.e. the distance from the surface of the transducer to thelocation of the maximum amplitude in the ultrasound field [128]. For an unfocusedtransducer, equation (3.10) can be used by setting the fraction F/zR = 1.
To increase the lateral resolution, ultrasound transducers can be focused e.g. byusing lenses, reflectors, concave transducers or electrical control of phase differencesof the ultrasound waves transmitted by an array of transducers. The focal zone Fz,can be defined as the distance around the focus along the beam direction, where theintensity of the beam is within -6 dB of the maximum:
Fz =2F 2
zR + F2
. (3.11)
In the experimental ultrasonic measurements, as a means to maximize the signal-to-noise ratio, the region of interest should always be within the focal zone.
For planar surfaces, the amplitude of the ultrasound echo signal recorded at nor-mal incidence decreases as the roughness of the surface increases [121, 154]. Further-more, when the angle of incidence of the ultrasound beam increases, the energy of thereceived signal decreases [154]. When ultrasound is used to assess a rough curved or

28 3.3. Quantitative ultrasonic evaluation of articular cartilage
tilted surface in a pulse-echo geometry, a focused transducer should be used. This canhelp to minimize the effects of the radius of curvature or the non-perpendicular angleof incidence e.g. on roughness discrimination [23, 154]. When the angle of incidenceis sufficiently large, the incoherent scattering dominates and the roughness effects be-come more evident [23]. These issues have to be considered carefully, when naturallycontoured articular surfaces with variable degenerative states are being assessed withultrasound.
3.3 Quantitative ultrasonic evaluation of articular cartilage
Articular cartilage is a poroviscoelastic, inhomogenous and anisotropic material, theacoustic properties of which depend on the composition and structure of the tissue.
The speed of sound in cartilage depends on the anatomical location and integrityof the tissue [82, 143]. Maturation has also been reported to affect the speed of soundin rat and porcine cartilage [26, 62, 73]. A reduced collagen content reduces thespeed of sound [65, 122, 143]. The collagen fibril orientation also affects the speedof ultrasound; the speed is highest when the orientation of the fibrils lies parallelto the direction of the ultrasound beam [43, 89, 120]. A decrease in the PG content[65, 123, 143, 144, 156] or an increase in the water content [123, 143] also leads to re-duced speed of sound. Typically the values of speed of ultrasound in normal humanor bovine cartilage of the knee joint are in the range 1580 - 1760 m/s [65, 91, 107, 109,110, 111, 120, 143, 144]. In enzymatically or spontaneously degenerated cartilage, thespeed of sound is slightly decreased to 1550 - 1660 m/s [65, 107, 109, 111, 144].
The density of cartilage has been measured to be about 1050 kg/m3 [67]. Whenthe water content of damaged cartilage increases, the density approaches the densityof water, 1000 kg/m3. Assuming isotropy and elasticity, the characteristic acousticimpedance of the cartilage can be estimated from its density and the speed of sound.Based on the above values, the acoustic impedance of human or bovine cartilagewould thus fall between 1.55 - 1.85 ×10⁶ kg/(m2s). However, the acoustic impedanceof human articular cartilage has been discovered to increase continuously from thesurface towards the subchondral bone, and a mean value of (2.12±0.02)×106 kg/(m2s)determined with 50 MHz ultrasound has been reported [90]. The characteristic acous-tic impedance of water is about 1.52 ×10⁶ kg/(m2s) [153] and according to equation(3.4), the ultrasound reflection coefficient at a water - cartilage interface can be as-sumed to vary between 1% and 10%. This has been confirmed experimentally also(see table 3.2).
The attenuation of ultrasound depends strongly on the frequency of the ultra-sound [92, 151]. The attenuation of ultrasound in cartilage has been found to correlatesignificantly with the histologic integrity of the tissue [109]. An increase in the atten-uation coefficient has been related to PG loss [65] and breaking of the intermolecularcross-links in collagen [3]. Nieminen et al. reported integrated attenuation coefficientfor bovine articular cartilage to be 2.65 ± 0.58 dB/mm at 10 MHz [109] and Senziget al. reported 3.2 - 7.5 Np/cm (≈ 2.78 - 6.51 dB/mm) at 10 - 40 MHz [135]. The ab-sorption of shear waves in soft tissues is much greater than that of longitudinal waves[41, 94], and thus for practical purposes the shear waves can usually be neglected.
Ultrasound reflection and scattering from the surface and backscattering from theinternal cartilage are extremely complex processes [33, 66, 153]. The ultrasound reflec-

3. Ultrasonic assessment of articular cartilage 29
tion parameters are able to distinguish osteoarthritic changes [25], maturation [25],enzymatical degradation [131] and spontaneously repaired cartilage [85] from intactcartilage. Enzymatically induced PG depletion has been detected with ultrasound byrecording an echo from the digestion front [144, 148]. However, the collagen contentis the dominant component determining the acoustic impedance and hence the reflec-tion properties of cartilage [36, 124, 144]. Reflected ultrasonic signals have been usedto differentiate PG-depleted or collagen meshwork-disrupted cartilage from normaltissue based on changes in the features of their frequency spectra [13]. Quantitatively,the ultrasound reflection and scattering from the surface of the cartilage have beenevaluated and correlated with the roughness and composition of the cartilage in vitro[2, 24, 25, 52, 82, 85, 131, 133]. Quantitative ultrasonic evaluation of human articularcartilage has been tested also in vivo during arthroscopic surgery [53, 54, 112, 136].Recently, a potentially less invasive method utilizing intravascular ultrasound probeshas been tested for evaluation of articular cartilage as well [61, 147].
The roughening of the cartilage surface has been quantified using the ultrasoundroughness index, URI [82, 131], the degree of broadening in the angle-dependentpressure amplitude [2], incoherent mean backscattered power [24] as well as the in-tegrated reflection coefficient IRC [25] and reflection coefficient R [85]. Histologicalscoring of the structure of the cartilage has been successfully related with the semi-quantitative ultrasonographic grading [29, 88, 137]. Ultrasonic measurements havealso been combined with mechanical compression e.g. in elastography [117, 79], in-dentation [83, 140, 159] and water-jet indentation [158].
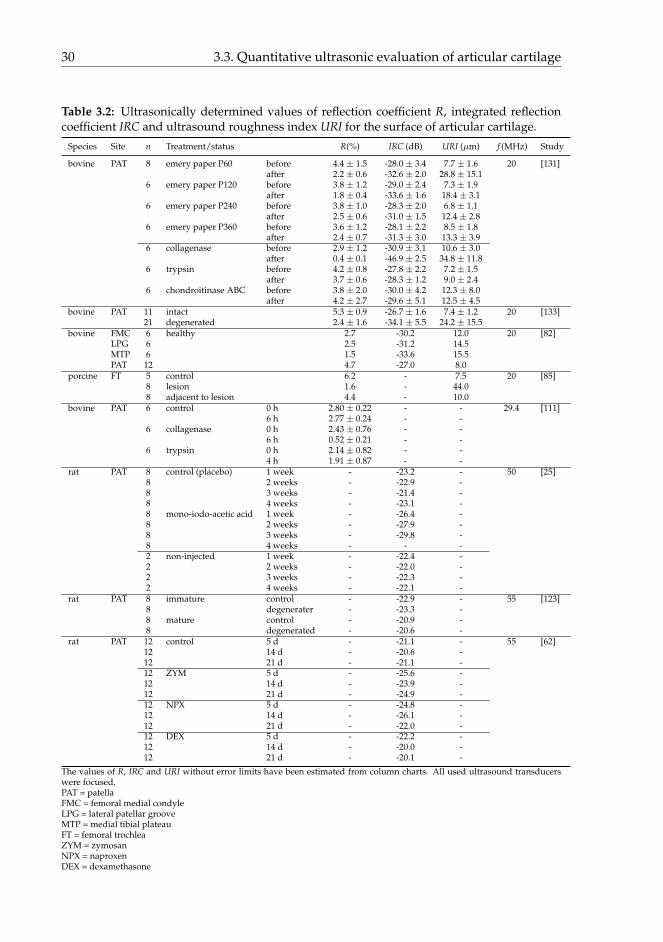
Some values presented in the literature for the surface reflection parameters R andIRC and the roughness parameter URI are listed in table 3.2.
30 3.3. Quantitative ultrasonic evaluation of articular cartilage
Table 3.2: Ultrasonically determined values of reflection coefficient R, integrated reflectioncoefficient IRC and ultrasound roughness index URI for the surface of articular cartilage.
Species Site n Treatment/status R(%) IRC (dB) URI (µm) f (MHz) Study
bovine PAT 8 emery paper P60 before 4.4 ± 1.5 -28.0 ± 3.4 7.7 ± 1.6 20 [131]after 2.2 ± 0.6 -32.6 ± 2.0 28.8 ± 15.1
6 emery paper P120 before 3.8 ± 1.2 -29.0 ± 2.4 7.3 ± 1.9after 1.8 ± 0.4 -33.6 ± 1.6 18.4 ± 3.1
6 emery paper P240 before 3.8 ± 1.0 -28.3 ± 2.0 6.8 ± 1.1after 2.5 ± 0.6 -31.0 ± 1.5 12.4 ± 2.8
6 emery paper P360 before 3.6 ± 1.2 -28.1 ± 2.2 8.5 ± 1.8after 2.4 ± 0.7 -31.3 ± 3.0 13.3 ± 3.9
6 collagenase before 2.9 ± 1.2 -30.9 ± 3.1 10.6 ± 3.0after 0.4 ± 0.1 -46.9 ± 2.5 34.8 ± 11.8
6 trypsin before 4.2 ± 0.8 -27.8 ± 2.2 7.2 ± 1.5after 3.7 ± 0.6 -28.3 ± 1.2 9.0 ± 2.4
6 chondroitinase ABC before 3.8 ± 2.0 -30.0 ± 4.2 12.3 ± 8.0after 4.2 ± 2.7 -29.6 ± 5.1 12.5 ± 4.5
bovine PAT 11 intact 5.3 ± 0.9 -26.7 ± 1.6 7.4 ± 1.2 20 [133]21 degenerated 2.4 ± 1.6 -34.1 ± 5.5 24.2 ± 15.5
bovine FMC 6 healthy 2.7 -30.2 12.0 20 [82]LPG 6 2.5 -31.2 14.5MTP 6 1.5 -33.6 15.5PAT 12 4.7 -27.0 8.0
porcine FT 5 control 6.2 - 7.5 20 [85]8 lesion 1.6 - 44.08 adjacent to lesion 4.4 - 10.0
bovine PAT 6 control 0 h 2.80 ± 0.22 - - 29.4 [111]6 h 2.77 ± 0.24 - -
6 collagenase 0 h 2.43 ± 0.76 - -6 h 0.52 ± 0.21 - -
6 trypsin 0 h 2.14 ± 0.82 - -4 h 1.91 ± 0.87 - -
rat PAT 8 control (placebo) 1 week - -23.2 - 50 [25]8 2 weeks - -22.9 -8 3 weeks - -21.4 -8 4 weeks - -23.1 -8 mono-iodo-acetic acid 1 week - -26.4 -8 2 weeks - -27.9 -8 3 weeks - -29.8 -8 4 weeks - - -2 non-injected 1 week - -22.4 -2 2 weeks - -22.0 -2 3 weeks - -22.3 -2 4 weeks - -22.1 -
rat PAT 8 immature control - -22.9 - 55 [123]8 degenerater - -23.3 -8 mature control - -20.9 -8 degenerated - -20.6 -
rat PAT 12 control 5 d - -21.1 - 55 [62]12 14 d - -20.6 -12 21 d - -21.1 -12 ZYM 5 d - -25.6 -12 14 d - -23.9 -12 21 d - -24.9 -12 NPX 5 d - -24.8 -12 14 d - -26.1 -12 21 d - -22.0 -12 DEX 5 d - -22.2 -12 14 d - -20.0 -12 21 d - -20.1 -
The values of R, IRC and URI without error limits have been estimated from column charts. All used ultrasound transducerswere focused.PAT = patellaFMC = femoral medial condyleLPG = lateral patellar grooveMTP = medial tibial plateauFT = femoral trochleaZYM = zymosanNPX = naproxenDEX = dexamethasone

CHAPTER IV
Aims of the present study
This thesis work has continued earlier research on the ultrasonic assessment of artic-ular cartilage and further investigated the ultrasound methodology for quantitativeevaluation of osteoarthrotic changes in the cartilage. Acoustic parameters describingchanges occurring at an early stage of osteoarthrosis were determined and comparedwith histological reference data and data acquired from a sample-specific numericalmodel.
The specific aims of this thesis were:
1. to compare quantitative time domain, frequency domain and wavelet transformultrasound parameters to determine their diagnostic potential in evaluating de-generative changes of surface of articular cartilage
2. to clarify whether the ultrasound roughness index (URI) is less susceptible tovariations in the angle of incidence of the ultrasound beam than the correspond-ing reflection and scattering parameters
3. to specify the optimal characteristics and operation settings of an ultrasoundtransducer for evaluation of superficial articular cartilage
4. to develop a sample-specific finite difference time domain (FDTD) model for ul-trasonic measurements of articular cartilage in a pulse-echo geometry and eval-uate the effects of roughness of the articular surface and angle of incidence of theultrasound beam on the ultrasound reflection and scattering from the cartilagesurface.
31

32

CHAPTER V
Materials and methods
This thesis consists of four independent studies (I-IV). For studies I and IV, the ul-trasound raw data and histological sections have been extracted from earlier studies(Saarakkala et al. [133] and Kiviranta et al. [75]). In studies I and IV, the raw data hasbeen analyzed from a different perspective. For studies II and III, all sample materialwas new. The materials and methods used in each study are summarized in table 5.1
Table 5.1: Summary of materials and methods used in studies I - IV. All measurements wereconducted in room temperature (typically 20 - 23 ◦C).
Study Samples n Methods Parameters
I Bovine patellae Ultrasound imaging R, IRC, URI,* visually intact 11 MM, ED* spontaneously degenerated 21 Histological analysis Mankin score, CQI
II Bovine patellae Ultrasound imaging R, IRC, URI* visually intact 8 Light microscopy RMS roughness* mechanically degraded 6 Histological analysis Mankin scoreHuman tibiae Scanning electron microscopy qualitative* spontaneously fibrillated 1* spontaneously PG-depleted 1
III Bovine patellae Ultrasound imaging R, IRC, URI,* visually intact 8 MM, ED,* mechanically degraded 8 Light microscopy RMS roughnessHuman tibiae Histological analysis Mankin score* spontaneously fibrillated 1 Scanning electron microscopy qualitative* spontaneously PG-depleted 1Phantoms* P60 (mean particle size 269 µm) 1* P120 (mean particle size 125 µm) 1* P240 (mean particle size 58.5 µm) 1* P360 (mean particle size 40.5 µm) 1
IV Human patellae Ultrasound imaging IRCexp* healthy 24 FDTD-modeling IRCmodel* early degeneration 11 Light microscopy RMS roughness* advanced degeneration 8
CQI = cartilage quality index IRCexp = experimentally determined IRC PG = proteoglycanED = echo duration IRCmodel = modeled IRC R = reflection coefficientFDTD = finite difference time domain MM = maximum magnitude RMS = root mean squareIRC = integrated reflection coefficient n = number of the samples URI = ultrasound roughness index
33

34 5.1. Articular cartilage samples
5.1 Articular cartilage samples
Osteochondral samples from bovine patellae and human patellae and tibiae wereused in this thesis work. The bovine knees were obtained from the local abattoir(Atria Oyj, Kuopio, Finland) and opened within a few hours post mortem. Humancadaver knees were obtained from Jyväskylä Central Hospital, Jyväskylä, Finland,as approved by the national authority (National Authority for Medicolegal Affairs,Helsinki, Finland, permission 1781/32/200/01). The human patellae and proximalepiphyses of tibiae were detached from cadavers at autopsy within 48 h post mortem,wrapped in gauze damped with phosphate buffered saline (PBS) and frozen untilsubsequent sample preparation.
The bovine samples used in study I were originally prepared for an earlier study[132]. In that study, cylindrical osteochondral plugs (diameter = 19 mm) were takenfrom the upper quadrants of the patellae. Cartilage surfaces with both normal anddegenerated appearances were included in the study. For studies II and III, cylindricalosteochondral plugs were prepared from visually intact lateral upper quadrants of thebovine patellae (diameter = 6 mm) and lateral plateaus of the human tibiae (diameter= 4 mm). The data for the human samples used in study IV were extracted from anearlier study [75]. In that study, 14 patellae were collected from right knees. Themeasurements were conducted in situ from six sites on the patellae: superomedial,superolateral, central medial, central lateral, inferomedial and inferolateral.
After the preparation, all the samples were stored in PBS in a freezer and thawedat room temperature just before the measurements. During the measurements, thesamples were immersed in PBS containing inhibitors of proteolytic enzymes (5 mMethylenediaminetetraacetic acid (EDTA) and 5 mM benzamide HCl). In studies II andIII, some of the bovine samples were degraded mechanically to simulate fibrillationof the cartilage surface typical of OA. The cartilage surfaces were ground along twoperpendicular directions with emery paper (P120, FEPA standard; average particlediameter = 125 µm) just before the measurements.
5.2 Phantoms
For study III, five phantoms (area = 1 cm2) with different surface roughnesses weremade. Emery paper (FEPA standard: P360, P240, P120 or P60) or a polished steelplate was pressed on the surface of hot-setting adhesive (3M Jet-melt, 3764-Q; 3M, St.Paul, USA). The average particle sizes of the emery papers were 40.5 µm (P360), 58.5µm (P240), 125 µm (P120) and 269 µm (P60). Since the adhesive material was homo-geneous, only one acoustic interface was formed between the PBS and the phantomduring the ultrasonic measurements.
5.3 Ultrasonic imaging and quantitative measurements
The properties of the ultrasound transducers used in this thesis are listed in table 5.2.The principles of the measurement systems are described next and the measurementgeometries are illustrated in figures 5.1, 5.2 and 5.3.

5. Materials and methods 35
Table 5.2: Summary of the characteristics of the ultrasound transducers used in this thesis.
Transducer model (Panametrics) V3758M V3193 V307 XMS310Nominal central frequency (MHz) 20 50 5 10Measured -6 dB frequency range (MHz) 6 - 28 8.0 - 41.5 2.7 - 6.3 9.0 - 14.5Focal length (mm) 15.01 25.0 49.9 -Focal zone (mm) 3 3.7 8.8 -Element diameter (mm) 6.35 6.35 25.4 2.0Confocal beam diameter (µm) 200 120 600 -Study I II & III III III & IV
5.3.1 Dermascan
The data for study I was measured with a Dermascan 20 MHz ultrasound instrument(Cortex Ltd., Hadsund, Denmark) (see table 5.2) [133]. An external data-acquisitionsystem (Physical Acoustics Corporation, Princeton, NJ, USA) operating at a samplingfrequency of 250 MHz was used. The A-mode reflections from the cartilage surfacewere recorded using spatial sampling steps of 76 µm. The maximum reflection am-plitude was used as an indicator while manually adjusting the cartilage surface per-pendicularly in respect to the direction of the ultrasound beam [133]. Details of themeasurement are presented in an earlier study [133] and the principle of the measure-ment is visualized in figure 5.1.
cartilage
PBSbone
ultrasoundtransducer
20 MHz
scan
signal tocomputer
sample19 mm
Figure 5.1: Schematic presentation of the measurement geometry of study I. Not to scale.
5.3.2 UltraPAC
The UltraPAC scanning acoustic system (Physical Acoustics Corporation, Princeton,NJ, USA) consists of a 0.5 to 100 MHz ultrasound pulser-receiver board and a 500MHz 8-bit A/D board. The 3D motor system enables moving the ultrasound trans-ducer in 5.1 µm steps in the XY-plane and in 3.8 µm steps in the Z-direction. The

36 5.4. Quantitative ultrasound parameters
UltraPAC system was used with 50 MHz (studies II and III), 10 MHz (study III) and5 MHz (study III) ultrasound transducers (see table 5.2). The whole cartilage surfacesof the osteochondral samples were imaged with 20 µm spatial steps and a samplingfrequency of 500 MHz. In study II, the surfaces of the samples were tilted 2◦, 5◦ or 7◦
using goniometers. The principle of the measurements is visualized in figure 5.2.
angle0 , 2 , 5 or 7
5, 10 or 50 MHzultrasound transducer
signal tocomputer
goniometers
cartilagebone
scan
focal length50, 12 or 25 mm
PBS
sample4 or 6 mm
Figure 5.2: Schematic presentation of the measurement geometry applid in studies II and III.Not to scale.
5.3.3 Ultrascan
The UltraScan device combines a hand-held arthroscopic indentation instrument (Art-scan200, Artscan Oy, Helsinki, Finland) with a miniature 10 MHz-ultrasound trans-ducer (Panametrics XMS310, Panametrics Inc., Waltham, MA, USA) (see table 5.2)[83]. The ultrasound reflections from cartilage surface were recorded at a constantdistance (3 mm) at six measurement sites on human patellae (see figure 5.3) with theUltraScan device by Kiviranta et al. [75]. In study IV of this thesis, the ultrasound rawdata was analyzed from a different perspective and compared with sample-specificfinite difference modeling results.
5.4 Quantitative ultrasound parameters
The ultrasonic analyses in this thesis (see table 5.1) were conducted with LabVIEW (v.6.1, National Instruments, Austin, TX, USA) (in study I) and MATLAB (v. 6.0-7.5.0,The Mathworks Inc. Natick, MA, USA) (in studies I-IV) sotfwares.

5. Materials and methods 37
PBS humanpatella
10 MHzultrasoundtransducer
3 mm
signal to computer
cartilagesurface
Figure 5.3: Schematic presentation of the measurement geometry applied in study IV. Not toscale.
5.4.1 Reflection parameters IRC and R
The amplitude of the ultrasound signal reflected from the surface of the cartilage orphantom was quantified with the integrated reflection coefficient IRC (dB) in fre-quency domain [25] and the reflection coefficient R (%) in time domain [131]. Thereflection amplitude from the cartilage or phantom surface was normalized with thereflection amplitude from a perfect reflector at the same distance. In studies II and III,the reference reflection was recorded from PBS-polished steel interface and in studiesI and IV from the PBS-air interface. According to equation (3.4) (on page 26), about94% of the ultrasound pressure is reflected from the PBS-steel interface and about 99%from the PBS-air interface.
In order to calculate the IRC, the frequency spectra for the cartilage surface S(z, f)and for the reference signal Sref(z, f) at depth z at normal incidence need to be deter-mined. Sref(z, f) can be determined as
S(z, f) = E(f)×G(f)× A0(z, f)×H2s (z, f)×R(f) , (5.1)
where E(f) is the acoustoelectric transfer function, G(f) is the acquisition systemtransfer function, A0(z, f) is the frequency and depth-dependent attenuation functionin PBS, H2
s (z, f) is the surface-integrated diffraction function in pulse echo mode andR(f) is the frequency-dependent reflection coefficient of the cartilage surface. Simi-larly, for the reference interface, the signal Sref can be expressed as
Sref(z, f) = E(f)×G(f)× A0(z, f)×H2s (z, f)×Rref(f) . (5.2)
Equations (5.1) and (5.2) assume that the surface of the sample is uniform, and per-pendicular to the direction of the incident ultrasound signal. Furthermore, z has tobe large enough 1) compared with the size of the transducer element size to distin-guish the attenuation and diffraction and 2) compared with dimensions of the surfaceinsonified by the ultrasound beam.

38 5.4. Quantitative ultrasound parameters
When the surface diffraction function and the acquisition system characteristicsare assumed to be invariable, combining equations (5.1) and (5.2), and assuming thatRref ≈ 1, the frequency-dependent reflection coefficient for the cartilage surface re-duces to
R(f) =S(z, f)
Sref(z, f). (5.3)
The frequency-dependent reflection coefficient is conveniently expressed in decibelsas
RdB(f) = 10× log10〈|R(f)|2〉 . (5.4)
In this thesis, the spectra S(z, f) and Sref(z, f) were determined experimentally bydelimiting the reflection from the surface of the cartilage in the time domain with arectangular time window (for the reference signal) or a Hamming window (for thecartilage signal). These time domain signals of equal length were then transformedto the frequency domain by fast Fourier transform (FFT). Finally, the IRC was calcu-lated as an integral over the -6 dB frequency bandwidth ∆f of the reference spectrumSref(z, f) at the focus:
IRC =1
∆f
∫∆f
RdB(f)df . (5.5)
The -6 dB frequency bandwidths ∆f were 8 - 20 MHz (in study I) for the 20 MHztransducer, 9 - 47 MHz (in study II) and 8 - 41.5 MHz (in study III) for the 50 MHztransducer, 9 - 14.5 MHz (in study III) and 5.3 to 15.5 MHz (in study IV) for the 10MHz transducer and 2.7 - 6.3 MHz (in study III) for the 5 MHz transducer.
The definition of the reflection coefficient, R, in the time domain includes similarassumptions as used in the definition of the IRC (see equations (5.1), (5.2) and (5.3))and is defined as
R =Ai
Arefi
× 100% , (5.6)
where Ai is the peak-to-peak amplitude of the time-domain ultrasound signal re-flected from the cartilage or phantom surface and Aref
i is the peak-to-peak amplitudeof the ultrasound signal reflected from the reference interface.
5.4.2 Roughness parameter URI
The ultrasound roughness index (URI (µm)), analogous to the RMS roughness in ma-terial sciences, is determined from the ultrasonically obtained surface profile of a sam-ple [131].
URI =
√√√√ 1
m
m∑i=1
(di − 〈d〉
)2, (5.7)
where m is the number of the measurement points, i.e. A-mode ultrasound signals,di is the distance from the transducer to the sample surface at the i:th A-mode signal

5. Materials and methods 39
and 〈d〉 is the average distance. The distances di were determined from the ultrasoundtime of flight (TOF) information:
di =c× TOF
2, (5.8)
where the speed of ultrasound c for the PBS was 1495 m/s [131]. The TOF valueswere evaluated using the cross-correlation method [21]. The cross-correlation vectorwas determined using interpolated (cubic interpolation, ratio = 10) ultrasound signalsmeasured from the cartilage surface and from the perfect reflector at a fixed distance.Finally, before calculating the URI, the natural surface contour of the cartilage wasremoved by fitting a smoothing spline to the measured profile and subtracting thecontour from the original profile [133]. The smoothing parameter of the spline wasmanually selected so that the spline function closely followed the general trend of thesurface.
5.4.3 Wavelet parameters MM and ED
Continuous wavelet transform (WT) of a signal x as a function of time t can be ex-pressed as
T (a, b) =1√a
∫ ∞
−∞x(t)ψ∗
(t− b
a
)dt , (5.9)
where a is the dilation parameter or scale, b is the location parameter, ψ is the motherwavelet function and ∗ denotes the complex conjugate [1, 27]. The wavelet transformanalysis preserves both the time and frequency information of the original signal.Thus, the wavelet analysis might provide additional information of the cartilage tis-sue in contrast to only time or frequency domain analysis. In study I, three motherwavelet functions resembling ultrasound reflections from cartilage were chosen foranalysis: Morlet, Gaussian and Daubechies (morl, gaus5 and db6 in the MATLABwavelet toolbox library, see figure 5.4). In study IV, only gaus5 was used.
The wavelet coefficients T (a, b) can be plotted to form a wavelet map. For a moreexplicit presentation, the location parameter b can be converted to time and the scalea can be converted to (pseudo)frequency f :
f =fc
a, (5.10)
where fc is the central frequency of the mother wavelet function (see figure 5.5).The maximum magnitude, MM (%) [52], is the largest value in a wavelet transform
map, normalized with the largest value in the WT map of the reference signal. Thecoordinates of the MM value in the WT map represent a single (pseudo)frequencycomponent and a single point in time. To calculate the ED (µs) [52], the frequencycomponent was fixed, and thus a 2D cross-section of the 3D map at that particularfrequency was selected. The Hilbert envelope was then calculated for this 2D signal,and the ED was determined as the full width at one tenth of the maximum (FWTM)(in study I) or at the full width at half of the maximum (FWHM) (in study III) of theenvelope.

40 5.5. Reference methods
Morlet wavelet: morl Gaussian wavelet: gaus5 Daubechies wavelet: db6
10 MHz 5 MHz
0 0.2 0.4 0.6 0.8 1time (µs) time (µs) time (µs)
ampl
itude
ampl
itude
ampl
itude
50 MHz
0 0.2 0.4 0.6 0.8 1 0 0.2 0.4 0.6 0.8 1
Figure 5.4: The mother wavelet functions selected for study I (top row) and representativeultrasound signals reflected from an intact bovine cartilage surface (bottom row) recordedwith the ultrasound transducers used in studies II-IV (see table 5.2).
5.5 Reference methods
Several reference methods were used to relate the values of the calculated ultrasoundparameters to the degenerative state of the cartilage tissue or the roughness of thesurfaces of the phantoms. The reference methods included light microscopy, scanningelectron microscopy, microCT imaging and histological scoring, which are briefly de-scribed next.
5.5.1 Light microscopy
Before the ultrasound measuremets in studies II and III, the cartilage surfaces wereimaged with a light microscope (Zeiss SV 8, Carl Zeiss Vision International GmbH,Aalen, Germany) to qualitatively estimate the conditions of the surfaces.
After the measurements in all the studies I-IV, microscopic sections (thickness 3µm) were prepared from the sample as close as practically possible to the region thatwas measured with ultrasound. The sections were stained with Safranin O for histo-logic analysis of the samples [74] and imaged with an optical microscope equippedwith a CCD camera (Nikon Microphot FXA and Nikon CoolSNAP, Nikon Corpora-tion, Tokyo, Japan). In studies II-IV, all the sections were inspected and one represen-tative histological image per sample was digitized (see figure 5.6). The surface profilewas traced on the image manually (in studies II and III) or automatically based on theabrupt changes in the contrast between the cartilage and the background (study IV).The pixel sizes in light microscopy were 4.52 µm (studies II and III) and 3.57 µm (studyIV). The RMS roughness values were then calculated from the digitized profiles as areference for the ultrasonically determined roughness.
Mankin et al. have introduced a grading system for histological osteochondral

5. Materials and methods 41
ANALOGY:measured ultrasoundsignal in time domain
ANALOGY:frequency profiles of
the ultrasound signals
3D presentation ofa wavelet transformed
ultrasound signal
time
ampl
itude
reflection fromsubchondral bone
reflection fromcartilage surface
scale a
(or frequency)
location parameter b(or time)
reflection fromcartilage surface
reflection fromsubchondral bone
wav
elet
coef
ficie
ntT(
a,b)
ampl
itude
frequency
cartilage
frequency
ampl
itude
subchondral
bone
wavelet transform map
time (µs)
(pse
udo)
freq
uenc
y (M
Hz)
0 1 2 3 4 55
10
2050 maximum magnitude
MM
echo durationED
wavelet coefficient
(not normalized)
0
4
-4
2
-2
Figure 5.5: Principle of the wavelet transform and determination of the ultrasonic waveletparameters of articular cartilage.

42 5.5. Reference methods
visually intact cartilage surface
degraded cartilage surface
Digitized cartilage surface profileRMS roughness = 4.6 µm
Digitized cartilage surface profileRMS roughness = 28.0 µm
0
-80
80
dist
ance
(µm
)
distance (mm)0 1 2 3 4
distance (mm)0 1 2 3 4
0
-80
80di
stan
ce (µ
m)
Figure 5.6: Histological sections (left) of intact (top) and degraded (bottom) osteochondralsamples and their digitized surface profiles (right).
sections [95]. Table 5.3 lists the factors included in the Mankin score. In this thesis,the Mankin score was used in studies I-III. A Mankin score was assigned for the me-chanically degraded cartilage samples also, although the degeneration was artificial.Since the mechanically degraded samples were originally visually inspected as beingintact, other signs of degeneration than surface irregularities, such as changes in thecell content and organization, were generally missing.
In study I, the samples were divided into two groups according to their Mankinscore: intact (Mankin score = 0) and degenerated (Mankin score = 1-10). In studiesII and III, the bovine samples were divided into visually intact and mechanically de-graded groups. The Mankin scores in those groups were 0-1 and 1, respectively inboth studies. The human samples were awarded Mankin scores 3 and 6 (study II) and1 and 3 (study III), which correspond to moderate osteoarthritic changes.
In study I, in addition to the Mankin score, the cartilage quality index (CQI) wasused. This combines the Mankin score with the water content and dynamic andYoung’s moduli to reflect the structure, composition, and functional characteristicsof the cartilage tissue [109, 113]. The range of the CQI is from 0 for perfectly intactcartilage to 40 for severely degenerated cartilage [109, 113]. The values of the CQIused in study I were extracted from Nieminen et al. [109].
5.5.2 Scanning electron microscopy
After the measurements, a half of every sample in studies II and III was prepared forscanning electron microscopy (SEM) (Philips XL30 ESEM, Fei Company, Eindhoven,

5. Materials and methods 43
Table 5.3: Histological-histochemical grading using Mankin scoring [95]
Grade Grade
1. Structure 3. Safranin O staininga) normal 0 a) normal 0b) surface irregularities 1 b) slight reduction 1c) pannus and surface irregularities 2 c) moderate reduction 2d) clefts to transitional zone 3 d) severe reduction 3e) clefts to radial zone 4 e) no dye noted 4f) clefts to calcified zone 5g) complete disorganization 6
2. Cellsa) normal 0b) diffuse hypercellularity 1 4. Tidemark integrityc) cloning 2 a) intact 0d) hypocellularity 3 b) crossed by blood vessels 1
The Netherlands). Before the SEM imaging, the samples were fixed in 2% glutaralde-hyde buffered with 0.1 mol/l cacodylate (pH 7.4), dehydrated in an ascending seriesof ethanol solutions, dried using the critical point technique, and coated with a sput-tered gold layer [69]. The SEM images were used to qualitatively assess the surfacesof the cartilage samples (see figure 5.7).
5.5.3 High-resolution computed tomography
The custom-made phantoms in studies II and III were imaged with a microCT de-vice (computer tomography) (Sky-Scan-1172, SkyScan, Kontich, Belgium)(voltage =100 kV, filter = 0.5 mm Al) from the region as close as possible to site of the ultra-sonic measurements. From the reconstructed slices, the surface profiles were tracedand digitized manually and the RMS-roughnesses were evaluated similarly as con-ducted for the histological cartilage samples. The microCT images were averages offive image frames taken from the same location. The voxel size was (2.08 µm)3 ≈ 9µm3.
5.6 Acoustic modeling
In study IV, a sample-specific finite difference time domain (FDTD) model for ultra-sonic measurements of articular cartilage in a pulse-echo geometry was developed.The FDTD model for ultrasound reflection from the cartilage surface was constructedusing Wave 2000 Plus 3.00 R3 software (CyberLogic Inc., New York, NY, USA). TheWave software solves an acoustic wave equation within each homogenous grid ele-ment and computes the displacement vector at each time step of the simulation:
ρ∂w
∂t=
[µ+ η
∂
∂t
]∇w +
[λ+ µ+ φ
∂
∂t+η
3
∂
∂t
]∇(∇ ·w) , (5.11)
where w is a two-dimensional displacement vector, t [s] is time, ρ [kg/m3] is density,λ [N/m2] is the first Lamé constant, µ [N/m2] is the second Lamé constant, η [Ns/m2]

44 5.6. Acoustic modeling
SEM
Ligh
t mic
rosc
opy
intactmechanically
degradedspontaneously
fibrillated
900 µm
900 µm
Figure 5.7: Representative images of the articular surfaces of intact and degraded bovine sam-ples and spontaneously fibrillated human sample.
is shear viscosity and φ [Ns/m2] is bulk viscosity. In this equation, isotropy and linearelasticity of the material are assumed.
The model geometry was constructed to be identical with the experimental geom-etry in study IV (see figure 5.3). This comprised of a non-focused 10 MHz ultrasoundtransducer and single-phasic homogenous cartilage material immersed in PBS (seefigure 5.8). The roughness profiles of the samples, obtained from the digitized histo-logical sections, were implemented in the model individually for each sample. Thewaveform of the ultrasound signal was digitized from the datasheet of the XMS-31010 MHz - transducer used in the experimental measurements (see table 5.2). The sim-ulation job parameters were set as follows: time step scale = 1 and point/cycle = 1.The resolving wavelength was set according to the pixel resolution of the model: (280pix/mm)−1 ≈ 3.57 µm. This resolving wavelength enabled modeling of ultrasoundfrequencies up to 15.5 MHz.
The digitized histological human cartilage sections (n = 43) were implemented intothe model to simulate the reflection of the ultrasound from cartilage surfaces with avisually intact appearance and with different grades of osteoarthritic surface degener-ation. The surface profiles were adjusted to be horizontal by aligning a linear fit of theprofile with the horizontal axis. The RMS roughness values of the cartilage surfaceswere determined after filtering out the natural curvatures with a smoothing spline fit[133]. The roughness values were in the range of 2 to 64 µm. Young’s modulus E wasassigned individually to each cartilage sample based on the experimentally obtainedvalues from an earlier study [75]. The density ρ of the cartilage and the longitudinal

5. Materials and methods 45
time
ampl
itude
modeledultrasound reflection
3 m
mcartilage
PBS
ultrasound pulse
10 MHzUS-transducer
dia. = 3 mm
histologic cartilagesection
+
densityultrasound velocityYoung’s modulusdamping parameters
Figure 5.8: Schematic presentation of the model geometry. The cartilage section (middle) hasbeen obtained by thresholding the contrast information of the original histological image (onleft).
velocity vl were fixed at 1000 kg/m3 and 1600 m/s, respectively. Finally the experi-mentally determined IRCexp was calculated.
To evaluate systematically the effect of the roughness of the cartilage surface onthe integrated reflection coefficient IRC (see equation (5.5)), seven artificial rough-ness profiles were generated (with MATLAB v.7.6.0, The Mathworks Inc. Natick, MA,USA) using a randomized algorithm producing a RMS roughness in a predeterminedrange around each of the seven desired roughnesses (0.0, 5.1, 7.8, 13.1, 26.2, 28.8 and29.7 µm). The roughness values selected for the artificially created cartilage surfaceprofiles corresponded to the roughness values reported for early degeneration of car-tilage [2, 24, 39, 104, 133]. The IRCmodel was calculated from the modeled data obtainedfor the seven roughnesses with eleven different combinations of the values for mate-rial parameters: longitudinal velocity (vl), density (ρ) and Young’s modulus (E) (table5.4).
The values of the material parameters were chosen so that they correspond to therealistic range of the parameter values for articular cartilage. The selected range of thevl was from 1500 m/s to 1700 m/s [3, 111, 143]. The ρ was estimated to range between1000 kg/m3 and 1100 kg/m3 [67]. Dynamic moduli in a range from about 2 MPa [84]to about 240 MPa have been reported [19]. Based on this, Young’s modulus E was setto vary between 0 MPa and 100 MPa in the simulations.
Three combinations of the values of the material parameters vl, ρ and E were se-lected (materials 1, 5 and 10 in table 5.4) to study the effect of inclining the surfaceof the cartilage with respect to the direction of the ultrasound beam. The aforemen-tioned seven artificial roughness profiles were inclined by steps of 1◦ from -5◦ to 5◦,the 0◦ corresponding to the position where the direction of the ultrasound beam wasnormal to the surface profile. Again, the IRCmodel was determined.

46 5.7. Statistical analyses
Table 5.4: Combinations of the values of the material parameters for the artificial cartilagesamples used in the acoustic model. Young’s modulus E, longitudinal velocity vl and densityρ were used to calculate the Lamé constants λ and µ. The viscous damping parameters η(shear viscosity) and φ (bulk viscosity) were set to constant values of 1.75 Ns/m2 and 199.7 ×10⁻⁶ Ns/m2, respectively.
material E (MPa) vl (m/s) ρ (kg/m3) λ (MPa) µ (MPa)
0 0 1500 1000 2250.0 0.01 10 1525 1010 2342.7 3.32 20 1550 1020 2438.2 6.73 30 1575 1030 2536.5 10.04 40 1600 1040 2637.7 13.45 50 1625 1050 2741.8 16.76 60 1650 1060 2848.8 20.07 70 1675 1070 2958.7 23.48 80 1700 1080 3071.7 26.79 90 1725 1090 3187.7 30.110 100 1750 1100 3306.9 33.4
5.7 Statistical analyses
All statistical analyses in studies I-IV were conducted using SPSS 14.0 program (SPSSINC., Chicago, IL, USA).
In study I, the relationships between the continuous ultrasound parameters andthe discrete cartilage scoring parameters (the CQI and Mankin score) were investi-gated using the Spearman’s correlation analysis. The Mann-Whitney U test was usedto detect statistically significant differences in the ultrasound parameter values be-tween the intact and degenerated cartilage groups. The reproducibilities of the ED andMM were determined by analyzing three repeated measurements of eight intact sam-ples and quantified by determining coefficients of variation (CV ). Receiver operatingcharacteristic (ROC) analysis was used to determine the cutoff value, sensitivity andspecificity of the ultrasound parameters. Stepwise linear regression analysis was usedto determine which ultrasound parameters predicted the value of the Mankin score.
In study II, Wilcoxon signed rank test was done within the cartilage groups intactand mechanically degraded to see whether there were statistically significant differencesbetween the parameter values obtained in different angles of incidence (0◦, 2◦, 5◦ and7◦). Mann-Whitney U test was conducted to detect statistically significant differencesbetween the parameter values obtained in the normal incidence (0◦) of the mechanicallydegraded group and in 0◦, 2◦, 5◦ or 7◦ angle of incidence of the intact group.
In study III, the Mann-Whitney U test was used to detect statistically significantdifferences in the ultrasound parameter values between the intact and mechanicallydegraded cartilage groups. The Wilcoxon signed ranks test was used to evaluate theeffects of altering the ultrasound frequency, temporal sampling frequency and spatialsampling step.
In study IV, Spearman’s correlation coefficients were determined for the compar-isons between ultrasound parameters and reference roughness values. The mixed

5. Materials and methods 47
linear model was used to investigate the statistical significance of spatial variation ofthe IRCexp values between the different measurement sites on the healthy and degen-erated patellae.

48 5.7. Statistical analyses

CHAPTER VI
Results
The most important results of the studies I - IV are summarized in this chapter. Thecomplete results are presented in the original studies I - IV.
6.1 Comparison of ultrasound parameters in time, frequency andwavelet domains
All ultrasound parameters evaluated in study I (IRC, R, URI, MM and ED) were ableto differentiate the intact samples from the degenerated bovine cartilage samples (table6.1). The choice of the mother wavelet (morl, db6 or gaus5) (see figure 5.4) had a minoreffect on the absolute values of the ED, but almost no effect on the MM. The sensitivityof the ED in detecting cartilage degeneration depended on the chosen mother waveletalso, whereas the sensitivity of the MM remained almost constant. The reproducibilitywas good for both the MM (CV = 4.9% - 5.1%) and the ED (CV = 0.3% - 1.3%) and itwas only slightly dependent on the choice of the mother wavelet.
Significant correlations (r = 0.669 - 0.833, (r2 = 0.448 - 0.694,) p < 0.01) were estab-lished between all the ultrasound parameters and the cartilage scoring parameters, i.e.the CQI and the Mankin score (table 6.1). The wavelet parameters MM and ED didnot improve the ability to predict the value of the Mankin score compared with thelinear combination of only the URI, R and IRC (stepwise linear regression, r = 0.842 ,p < 0.0001). The specificities of all the parameters were excellent and the sensitivitiesto the degeneration of the cartilage were also good (table 6.1).
6.2 Effects of articular surface roughness on ultrasound parameters
In all experimental ultrasound measurements of studies I - IV, the roughness of thecartilage surface (spontaneous or mechanically induced roughening) affected all theultrasound parameters. The effect of the surface roughness on the ultrasound param-eters was evaluated systematically with phantoms (in study III) and by numericalmodeling (in study IV).
The URI distinguished between the intact and degraded bovine cartilage groups instudies I,II and III. Furthermore, in studies II and III, with the 50 MHz ultrasoundtransducer, the URI was effective in reproducing the ”true” roughness values evalu-ated from the safranin O stained microscopic slices (for cartilage) or microCT profiles
49

50 6.2. Effects of articular surface roughness on ultrasound parameters
Table 6.1: Mean values of the ultrasound parameters (± SD) and their specificities, sensitivi-ties and Spearman’s correlations with the cartilage scoring parameters for intact and degener-ated cartilage groups. All ultrasound parameters differentiated between the cartilage groups.
average (n = 11): average (n = 21): correlation with correlation withintact degenerated specificity sensitivity Mankin score CQI
R (%)IRC (dB)URI (µm)MMgaus5 (%)EDgaus5 (µm)
5.3 ± 0.9-26.7 ± 1.6
7.4 ± 1.24.6 ± 0.9
0.18 ± 0.01
2.4 ± 1.7∗
-34.1 ± 5.5∗
24.2 ± 15.5∗
2.2 ± 1.5∗
0.29 ± 0.10∗
1.000.911.001.001.00
0.860.860.910.760.86
-0.833-0.8260.825
-0.7990.823
-0.745-0.7520.693
-0.7470.669
∗ Statistically significant difference (p < 0.001, Mann-Whitney U test) in the ultrasound parameter values was detected between
the intact and degenerated cartilage sample groups for all the ultrasound parameters.
(for phantoms). However, in study III, it was observed that the URI revealed the diffe-rences in the roughnesses of the surfaces of the phantoms and between the intact anddegraded cartilage groups only when determined with the focused 50 MHz transducer.
In studies I - IV, the reflection parameters R and IRC detected spontaneous or me-chanically induced roughening of the cartilage surface. In study IV, the dependenceof the IRCmodel on the artificially generated surface roughness was very similar withdifferent combinations of the values of the material parameters (table 6.2). When theroughness of the surface of the cartilage was increased from 0 µm to ∼30 µm, thechange in the values of the IRCmodel was from -8 to -14 dB for any chosen combinationof the values of the material parameters. To obtain the same change in the values ofthe IRCmodel by changing the values of the material parameters, Young’s modulus Ewould have to change by about 80 MPa, the longitudinal velocity vl by about 200 m/sand the density ρ by about 80 kg/m3.
Table 6.2: The values of IRCmodel (dB) as a function of the surface roughness for different com-binations of the values of the material parameters (see table 5.4). The values of the IRCmodeldecrease as the roughness of the surface increases for all combinations of the values of thematerial parameters.
material roughness (µm)(see table 5.4) 0.0 5.1 7.8 13.1 26.2 28.8 29.7
1 -24.0 -27.5 -27.0 -36.6 -37.5 -36.4 -35.45 -13.4 -16.8 -16.9 -31.1 -31.2 -28.9 -26.9
10 -8.0 -11.3 -11.6 -26.4 -26.9 -22.8 -20.8
In study IV, the correlation between the IRC and the ”true” roughness of the hu-man samples was significant (r = -0.574, p < 0.01 for IRCexp and r = -0.523, p < 0.01for IRCmodel) (figure 6.1). However, the correlation between the experimentally andnumerically determined values of the IRC was very weak (r = 0.155, p = 0.320) (figure6.1).
In the experimental cartilage data from study III, no correlation was found be-tween the ”true” roughness of the cartilage surface, evaluated from the safranin O

6. Results 51
stained microscopic slices, and the IRC (figure 6.2). There was no correlation betweenthe ”true” roughness and the URI either (figure 6.2). However, a good correlation wasobtained between the ultrasonically determined roughness, URI, and the IRC (figure6.2). For the phantoms the ”true” roughness was evaluated from the microCT profilesand the Spearman’s correlation coefficients were -0.900 (roughness vs. IRC), 1.000(roughness vs. URI) and -0.900 (URI vs. IRC).
The MM, which closely corresponds to the R (r = 0.815 - 0.982, p < 0.01), detectedvariation in the roughnesses of the phantoms and the degradation of the superficialcartilage (p < 0.01, Mann-Whitney U test) in study III. The ED was rather insensitiveto the changes in the surface characteristics of the samples.
IRC m
odel
(dB)
IRCexp (dB)
r = 0.155p = 0.320n = 43
-20
-25
-30
-35
-40-50 -45 -40 -35 -30 -25 -200 10 20 30 40 50 60 70
IRC
(dB)
Roughness (µm)
r = -0.523p < 0.01n = 43
r = -0.574p < 0.01n = 43
IRCexpIRCmodel
Linear fit of IRCexpLinear fit of IRCmodel
-20
-25
-30
-35
-40
-45
-50
Figure 6.1: Linear correlations between the surface roughness of the human samples and theexperimentally and numerically evaluated (with 10 MHz unfocused ultrasound transducer)integrated reflection coefficients IRCexp and IRCmodel (data from study IV).
r = 0.007p = 0.977n = 18
0 5 10 15 20 25 30 35-45
-40
-35
-30
-25
Roughness (µm)
IRC
(dB)
r = -0.849p < 0.01n = 18
0 5 10 15 20 25-45
-40
-35
-30
-25
IRC
(dB)
URI (µm)
r = -0.049p = 0.848n = 18
0 5 10 15 20 25 30 350
5
10
15
20
25
Roughness (µm)
UR
I (µ
m)
Figure 6.2: Linear correlations between surface roughness, URI and IRC evaluated with 50MHz focused ultrasound transducer for bovine cartilage (unpublished data from study III).

52 6.3. Effects of ultrasound angle of incidence on ultrasound parameters
6.3 Effects of ultrasound angle of incidence on ultrasound parame-ters
The effects of angle of incidence of the ultrasound beam with respect to the surface ofthe sample on the ultrasound parameters was investigated experimentally with car-tilage samples (in study II) and by modelling the ultrasound reflection from cartilagetissue with artificial surface profiles (in study IV).
In study II, the angle of incidence of the ultrasound beam affected the values ofthe ultrasound parameters less in the degraded group than in the intact group (p <0.05). When the surface of the sample was inclined from 0◦ to 7◦, the values of the IRCdecreased from -29.0 dB to -42.9 dB in the intact cartilage group and from -45.5 dB to-48.9 dB in the degraded cartilage group (figure 6.3). Inclining the surface also affectedthe URI, which increased from 6.4 µm to 19.3 µm in the intact group and from 21.7µm to 32.7 µm in the degraded group (figure 6.3). The changes in the IRC and the URIwere statistically significant (p < 0.05). The angular dependence of the URI was rathersimilar in both the intact and degraded groups.
0 1 2 3 4 5 6 7-55
-50
-45
-40
-35
-30
-25
IRC
(dB)
intact
mechanically degraded05
10152025303540
0 1 2 3 4 5 6 7angle ( )
UR
I (µ
m)
mechanically degraded
intact
angle ( )
Figure 6.3: Angular dependence of the IRC and the URI determined with the 50 MHz ultra-sound transducer (data from study II).
In study II, the values of all ultrasound parameters of a spontaneously fibrillatedhuman cartilage sample (Mankin score = 6, i.e. moderate degeneration) in any angleof incidence differed from the values of the intact samples examined at a normal an-gle of incidence, and thus the fibrillated sample could always be distinguished. TheURI could even discern the fibrillated sample irrespective of the angles of incidenceof the fibrillated and the intact samples. Furthermore, all the ultrasound parametersdistinguished (p < 0.05) the mechanically degraded group from the intact group regard-less of the change in the angle of incidence of the degraded samples, up to an angle ofincidence of 5◦ of the intact samples.
In the intact group, the values of the R and the IRC in 0◦ angle (normal incidence)were distinguished (p < 0.05) from the values in the 5◦ and 7◦ angles of incidence. Inthe degraded group, only the values of the R and the IRC in the 7◦ angle of incidencewere distinguishable (p < 0.05) from the values of the R and the IRC in the normalincidence (0◦). Furthermore, in the intact group, the values of the URI in the normal

6. Results 53
incidence (0◦) could be distinguished from values of the URI in all the other angles ofincidence (2◦, 5◦ and 7◦). In the degraded group, the values of the URI in the 5◦ and 7◦
angles of incidence were differentiatable from the values of the URI in the 0◦ angle.In study IV, a strong angular dependence of the IRCmodel was found for the per-
fectly smooth cartilage surface for all three chosen combinations of the values of thematerial parameters (figure 6.4). A threshold between the roughness values 7.8 µmand 13.1 µm was found, beyond which, when the roughness increased, the reflectionof the ultrasound strongly diminished and the angular dependence of the reflectionseemed to disappear (figure 6.4).
roughness 29.7 µm
material 10material 5material 1
roughness 28.8 µm
roughness 26.2 µm
roughness 13.1 µm
roughness 7.8 µm
roughness 5.1 µm
0-10-20-30-40-50
IRC
mod
el (d
B)
0 1 2 3 4 5-1-2-3-4-5angle ( )
roughness 0.0 µm
0-10-20-30-40-50
IRC
mod
el (d
B)
0-10-20-30-40-50
IRC
mod
el (d
B)
0-10-20-30-40-50
IRC
mod
el (d
B)
0-10-20-30-40-50
IRC
mod
el (d
B)
0-10-20-30-40-50
IRC
mod
el (d
B)0
-10-20-30-40-50
IRC
mod
el (d
B)
0 1 2 3 4 5-1-2-3-4-5angle ( )
0 1 2 3 4 5-1-2-3-4-5angle ( )
0 1 2 3 4 5-1-2-3-4-5angle ( )
0 1 2 3 4 5-1-2-3-4-5angle ( )
0 1 2 3 4 5-1-2-3-4-5angle ( )
0 1 2 3 4 5-1-2-3-4-5angle ( )
Figure 6.4: The angular dependence of IRCmodel for three combinations of the values of thematerial parameters (see table 5.4) and different values of surface roughness determined withthe 10 MHz ultrasound FDTD model.
6.4 Effects of ultrasound frequency, temporal sampling frequencyand spatial sampling step on ultrasound parameters
In study III, the effects of ultrasound frequency and focusing, temporal sampling fre-quency and spatial sampling step were investigated. The results for the URI, the IRCand the ED evaluated with three different ultrasound transducers are summarized intable 6.3. The values of the R and the MM are omitted from table 6.3, because theresults for the R and the MM were in close agreement with those of the IRC.

546.4. Effects of ultrasound frequency, temporal sampling frequency and spatial
sampling step on ultrasound parameters
Table 6.3: Values of ultrasound parameters, determined using frequencies 50, 10 and 5 MHz,for phantoms and cartilage samples with different surface characteristics. The differences inthe roughnesses of the phantoms are revealed only with the 50 MHz transducer.
Ultrasound polished smooth intact degradedfrequency steel phantom P360 P240 P120 P60 (n = 8) (n = 8)
50 MHzURI (µm) 0.2 1.3 6.3 9.6 27.7 33.2 5.3 ± 2.1 20.9 ± 3.5∗∗∗
IRC (dB) -1.3 -14.1 -27.6 -33.7 -37.6 -36.2 -34.2 ± 4.1 -41.6 ± 3.5∗∗
ED (µs) 0.07 0.06 0.09 0.11 0.11 0.12 0.08 ± 0.02 0.14 ± 0.02∗∗∗
10 MHzURI (µm) 0.7 0.4 0.8 0.9 24.9 23.5 1.1 ± 0.3 1.3 ± 0.3IRC (dB) -0.1 -23.2 -24.6 -32.6 -41.5 -52.0 -36.4 ± 6.2 -45.8 ± 4.7 ∗
ED (µs) 0.19 0.20 0.19 0.19 0.41 0.26 0.20 ± 0.03 0.20 ± 0.055 MHz
URI (µm) 0.9 0.3 0.9 0.8 3.2 3.7 1.1 ± 0.3 1.5 ± 0.3IRC (dB) -0.1 -20.8 -22.6 -23.4 -33.0 -37.9 -32.5 ± 2.5 -36.5 ± 1.4∗∗
ED (µs) 0.26 0.29 0.28 0.29 0.33 0.34 0.29 ± 0.03 0.32 ± 0.03
∗ p < 0.05, ∗∗ p < 0.01, ∗∗∗ p < 0.001. Statistically significant difference between the parameter valuesobtained in the intact and degraded sample groups determined by Mann-Whitney U test.The mean particle sizes of the emery papers used to cast the phantoms are 40.5 µm (P360), 58.5 µm(P240), 125 µm (P120) and 269 µm (P60).
At the ultrasound frequencies of 5 MHz and 10 MHz, the URI failed to differentiatethe surface roughnesses of the phantoms from each other and between the cartilagesample groups (table 6.3, figure 6.5). The type of ultrasound transducer in use affectedthe values of the URI significantly (p < 0.05, for phantoms, p < 0.01 for cartilage),except between the 5 MHz and 10 MHz transducers.
In the cartilage measurements, the R, the IRC and the MM detected mechanicallyinduced degradation of the surface at all the investigated frequencies (p < 0.05)(ta-ble 6.3). The ED was not as sensitive, and with 10 MHz and 5 MHz, the intact anddegraded cartilage groups were not distinguished. The type of the ultrasound trans-ducer affected the values of the R, the IRC the MM and the ED significantly (p < 0.05,for phantoms, p < 0.01 for cartilage).
Altering the size of the spatial sampling step only affected the URI (p < 0.05 forphantoms, p < 0.01 for cartilage). However, although the absolute values of the URIincreased as the size of the spatial sampling step increased, the differences betweenthe phantoms and between the cartilage groups were discernible (p < 0.05) with allsampling steps (table 6.4). Decreasing the temporal sampling frequency affected thevalues of all the investigated ultrasound parameters of the cartilage samples (p < 0.01)and the values of the R and ED of the phantoms (p < 0.05) significantly. However, theintact and degraded cartilage groups could always be distinguished.

6. Results 55
Figure 6.5: B-mode ultrasound images (top) and corresponding ultrasonically determinedsurface profiles (middle) of one degenerated cartilage sample evaluated using 50 MHz, 10MHz and 5 MHz ultrasound transducers. Values of ultrasound parameters determined ateach frequency are listed (bottom).
Table 6.4: The URI for phantoms and cartilage samples with different spatial sampling stepsdetermined with the 50 MHz ultrasound transducer. Increasing the spatial sampling stepaffected the URI significantly, while the other parameters remained unaffected.
Step size polished smooth intact degraded(µm) steel phantom P360 P240 P120 P60 (n = 8) (n = 8)
20 0.2 1.3 6.3 9.6 27.7 33.2 5.3 ± 2.1 20.9 ± 3.5∗∗∗
60 0.3 2.0 7.9 11.5 36.2 44.1 7.6 ± 2.4 25.6 ± 4.4∗∗∗
120 0.3 3.2 9.2 13.0 41.1 46.2 11.2 ± 5.4 27.7 ± 4.6∗∗∗
240 0.4 3.8 10.2 19.0 38.3 60.5 16.8 ± 10.7 28.9 ± 5.2∗
∗ p < 0.05, ∗∗∗ p < 0.001. Statistically significant difference between the parameter values obtained inthe intact and degraded sample groups determined by Mann-Whitney U test.The mean particle sizes of the emery papers used to cast the phantoms are 40.5 µm (P360), 58.5 µm(P240), 125 µm (P120) and 269 µm (P60).

566.4. Effects of ultrasound frequency, temporal sampling frequency and spatial
sampling step on ultrasound parameters

CHAPTER VII
Discussion
In this thesis, quantitative ultrasound imaging (QUI) parameters of articular cartilagewere assessed in terms of their ability to detect the characteristic signs of cartilagedegeneration in early osteoarthrosis. In study I, parameters based on time domain,frequency domain and wavelet transform (WT) analyses were compared. In study II,the effects of non-perpendicular ultrasound angle of incidence on the QUI parameterswere investigated. In study III, the effects of ultrasound frequency, temporal samplingfrequency and size of the spatial sampling step on the QUI parameters were studied.In study IV, an FDTD model for the ultrasound reflection from the surface of artic-ular cartilage was constructed to evaluate the effects of varying surface roughness,material parameters and inclination of the cartilage sample on the QUI parameters.
7.1 Time, frequency and wavelet domain parameters
All QUI parameters investigated in study I correlated with the structure, composi-tion and mechanical properties of articular cartilage. The linear correlation of the QUIparameters was better with the Mankin score than with the cartilage quality index(CQI). This is probably explained by the fact that the samples displayed predomi-nantly superficial changes, such as fibrillation, and thus the Mankin scores (see table5.3) were low (0-10/14, mean 2.8, mode 0). The CQI , on the other hand, takes intoaccount also the water content and the dynamic and Young’s moduli of the cartilage,which reflect the properties of the bulk tissue. Thus, the CQI is not as sensitive to thesuperficial changes as the Mankin score.
The URI, by definition, is determined from multiple A-mode ultrasound reflec-tions. The other QUI parameters can, in principle, be evaluated from a point mea-surement. In practice, however, parameters from multiple adjacent A-mode data ac-quisitions should be averaged to obtain more representative results.
The WT parameters provided no additional information compared with the R, IRCand URI. Hence, the results suggest that the relatively simple time-domain parame-ters (the R and the URI) are diagnostically as sensitive as the more complex frequency-domain (IRC) or wavelet trasform (the MM and the ED) parameters. Indeed, in studyIII, the strong linear correlation (r = 0.815 - 0.982, p < 0.01) between the R and theMM proved that the information manifested by those parameters is essentially thesame and, thus, the calculation of the more complex wavelet parameter might not berelevant.
57

58 7.2. Effects of articular surface roughness on ultrasound results
The complexity of the WT parameters may even hinder real-time clinical analysis.Sophisticated and thus a probably time-consuming algorithm for quantifying the EDwould be needed in order to minimize the effects of fluctuation and impulse noiseof the ultrasound signal if it were to be included in an automated clinical applica-tion. The values of the ED even for intact cartilage corresponded to > 320 µm depth,assuming a speed of sound of 1600 m/s for the cartilage. Thus, the ED does not di-rectly represent the ”true” roughness of the surface, whereas the URI was found tocorrespond more closely to the microscopically determined roughness in studies I, IIand III. Furthermore, in degenerated cartilage, the values of ED showed significantvariation between different transducer positions. Therefore, the ED value must beinterpreted carefully [157]. In study III, the changes in the ED between the intact anddegraded sample groups were not distinguishable with the lower frequencies, becausethe long pulse lengths obscured any changes related to superficial degeneration.
The current WT assessment of articular cartilage can extract the MM and ED val-ues freely corresponding to different (pseudo)frequencies. Since the acoustic prop-erties of cartilage depend on the structure and composition of the tissue, validationof the MM and ED at certain fixed frequencies might provide more specific informa-tion on the integrity of the articular cartilage and improve the reproducibility of theparameters. If developed further, the WT analysis might provide some additionalinformation compared with separate analyses in the time or frequency domains forthe determination of the properties of the cartilage-bone interface, due to its ability topreserve the time and frequency information simultaneously.
7.2 Effects of articular surface roughness on ultrasound results
In study III, the URI value determined with the focused 50 MHz ultrasound trans-ducer for the polished steel surface was 100 nm and for intact cartilage it was about4.8 ± 1.7 µm. A surface roughness of 10 nm has been reported for polished steel mea-sured with a surface profilometer [142], and 0.8 ± 0.2 µm for intact cartilage deter-mined with laser profilometry [39]. The results are consistent, if the measuring limitof the present ultrasound system and limitations of the analysis techniques are takeninto account. In all ultrasound systems, there is always some noise that affects the ul-trasound signals. Furthermore, since the -6 dB width of the 50 MHz ultrasound beamis 120 µm (table 5.2) and the wavelength of the ultrasound is around 30 µm, it is notpossible to detect roughness differences in the nanometer scale using an ultrasoundtransducer. However, the resolution is sufficient to quantify pathological increase inthe roughness of the cartilage surface [104].
Although the values of the URI for the cartilage surfaces were within the samerange as the ”true” roughnesses evaluated from the microscopic slices, there was nocorrelation between the URI and the ”true” roughness (r = -0.049)(figure 6.2). Themajor factor responsible for the lack of correlation was probably the difference inthe spatial location of the ultrasound and microscopic measurements. Furthermore,some discrepancy between the URI and ”true” roughness may arise from the arti-facts caused by preparation of the cartilage slices for microscopy. This speculation issupported by the result that the correlations for the phantoms between the URI and”true” roughness extracted from microCT images were excellent (r = 1.000). In themicroCT imaging, no sample processing is needed and thus the image artifacts are

7. Discussion 59
practically negligible.In study IV, the ”true” surface roughness of the human cartilage samples corre-
lated moderately with the IRCexp determined experimentally (r = -0.574) and with theIRCmodel extracted from the numerical FDTD model (r = -0.523). However, the poorcorrelation between the IRCexp and IRCmodel (r = 0.155) suggests that, in addition tothe roughness, the material parameters also contribute significantly to the value ofthe IRC (figure 6.1). It can be seen from figure 6.1, that corresponding to a narrowroughness range (e.g. 1 -2 µm), there can be many different values of the experimentalIRCexp. This also suggests that the absolute values of the IRCexp are affected by theintrinsic material properties of the cartilage. The water content and, thus, the densityof the cartilage probably had a major impact on the IRC, because in the model thedensity was fixed whereas in the experimental measurements its value varied. Withthe phantoms, the roughness was the major factor causing differences in the IRC, be-cause the phantoms were all made of the same homogeneous and isotropic material(hot-setting adhesive).
In study III, there was no correlation between the ”true” roughness and the IRCof the cartilage samples (r = 0.007, p = 0.977, n = 18) (figure 6.2). The discrepancycompared with the results of study IV might arise from the more sophisticated digi-tizing of the roughness profiles from the microscopic slices in study IV. However, thesame digitizing procedure of the surface profile was used for the phantoms and thecorrelation between the ”true” roughness and the IRC for the phantoms was higher(r = -0.900, p = 0.037, n = 5). Thus, the discrepancy in the cartilage measurements ismore likely to be due to the spatial difference between the ultrasonic and microscopicmeasurement sites and processing artifacts in the microscopic cartilage sections ratherthan by being attributable to the digitizing process.
In study III, it was confirmed that the focusing and the frequency of the ultrasoundtransducer could affect the ability of the ultrasound method to detect the roughnessof the surface of the sample - generally, a focused transducer with a sufficiently highfrequency is needed. Therefore, if a focused transducer had been used in the modelingin study IV, the relative effect of the roughness on the ultrasound reflection might havebeen greater than the effect of the material parameters.
7.3 Significance of ultrasound angle of incidence on ultrasound re-sults
In study II, the angle of incidence of the ultrasound beam affected all investigated ul-trasound parameters significantly (p < 0.05). For the intact samples, the R and the IRCdecreased significantly as a function of the angle of incidence of the ultrasound beam,but the angular dependence was not so pronounced with the degraded or fibrillatedsamples (figure 6.3). This may be explained by the different contributions of specularreflection and scattering, the latter being more dominant at a fibrillated cartilage sur-face [23, 141]. This conclusion is also supported by the fact that the ultrasound signalreflected from the polished steel surface decreased rapidly as a function of the angleof incidence.
In study II, the URI was less susceptible to the increase in the angle of incidencethan the R or the IRC (figure 6.3). Nonetheless, the angular dependence of the URI

60 7.4. Effects of measurement parameters on ultrasound results
was detectable and might have been caused by a deterioration in the signal-to-noiseratio and changes of the pulse shape of the ultrasound signal at the higher angles ofincidence. In study IV, when the roughness of the cartilage surface was increased, theangular dependence of the IRCmodel disappeared between the roughness values of 7.8µm and 13.1 µm (figure 6.4). This supports the conclusion of study II that scatteringmay be a more dominant phenomenon than the specular reflection from the surfaceof the degenerated cartilage.
In study IV, a threshold of about 2◦ in the angle of incidence was found, beyondwhich the values of the IRCmodel became nearly constant, probably because of in-creased proportion of scattering (compared with specular reflection) and the decreaseof the signal-to-noise ratio (figure 6.4). It is, however, significant that in study II, thedegraded samples were distinguished from the intact ones up to an angle of incidenceof 5◦ for the intact samples.
If minor fibrillation of a cartilage surface is to be detected reliably with the presentQUI parameters, the angle of incidence of the ultrasound beam has to be carefully con-trolled in the measurements. In a clinical measurement, the natural curvature of thearticular surface varies also, and it may be challenging to achieve perfect perpendic-ularity between the ultrasound beam and the surface of the cartilage. Consequently,a mathematical correction based on estimating the angle of incidence from the ultra-sound echo information might be valuable. However, the proportions of ultrasoundreflection and scattering change as a function of the angle of incidence. Furthermore,the proportion of scattering probably increases as a function of the surface fibrillationof the cartilage. Thus, mathematical correction of the angle of incidence might not bestraightforward in the case of the reflection parameters R and IRC.
7.4 Effects of measurement parameters on ultrasound results
The URI values determined with the 50 MHz ultrasound transducer were in the samerange as the reference roughness values determined from the microCT or histologicalimages of the phantoms (study III) and the cartilage samples (studies II and III), re-spectively. However, at the lower frequencies (5 and 10 MHz), the URI was insensitiveto changes in the reference roughness probably due to an increased pulse length and awider beam diameter. Thus, one advantage of using high ultrasound frequency (∼50MHz) is the short pulse duration. This reduces the possibility of complications, dueto the alteration of the shape of the reflected ultrasound signal, in the determinationof the surface profile using the cross correlation method used in the calculation of theURI.
The ED was also insensitive to the surface characteristics of the cartilage at thelow frequencies (5 and 10 MHz) and did not separate the cartilage groups at thoseultrasound frequencies. In contrast to the other QUI parameters, the ED, by defini-tion, depends on the properties of the ultrasound transducer, especially on the pulseduration. Therefore, a comparison of the values of the ED between the ultrasoundfrequencies and transducers is irrelevant.
The ultrasound reflection parameters R, IRC and MM detected the cartilage degra-dation also at the low ultrasound frequencies. Ultrasound reflection and backscatter-ing at 5 MHz QUI have been reported to be strongly related to the structure, com-position, density and mechanical properties of the bone [47, 57]. This is important

7. Discussion 61
because both the cartilage and subchondral bone are affected in the OA process [18]and application of low ultrasound frequencies (∼5 MHz) could enable simultaneousdiagnosis of the properties of both tissues. Monitoring the changes in the subchon-dral bone would also be useful for evaluating the healing of a cartilage injury e.g. aftersurgical repair [145].
According to earlier studies, enzymatic PG depletion has no significant effect onthe ultrasound reflection from the surface of the cartilage [83, 111, 123, 144]. This issupported by our finding in study III that the values of the reflection parameters R,IRC and MM did not reveal the histologically confirmed PG loss in a human sam-ple. Although the surface was visually intact in the histological image, the superficialcollagen matrix of the sample might have been damaged, because the URI value ofthe PG depleted human sample was of the same order of magnitude as the URI val-ues of the mechanically degenerated bovine cartilage samples. Thus, the variation inthe ultrasonically determined roughness may be a more characteristic sign of incip-ient degenerative changes in cartilage than the variation in the specular ultrasoundreflection.
The normalized amplitude of the ultrasound reflection from the cartilage surface(IRC, R and MM) depended on the frequency of the ultrasound. The frequency de-pendence is probably due to different proportions of scattering and specular reflectionat the cartilage surface, because dispersion of the speed of sound is minimal in softtissues [153].
In this thesis, the 50 MHz transducer (table 5.2), which has a beam diameter of 120µm, best met the requirements for frequency, focusing and size of the beam diame-ter [23, 24] for evaluating the roughness of a surface of a sample. However, due tothe different focusing properties of the ultrasound transducers used in study III, theindividual effects of ultrasound frequency and focusing could not be separated.
In study III, it was shown that the size of the spatial sampling step can be increasedup to the size of the beam diameter without any significant loss of information. Thetemporal sampling frequency affected significantly the values of the QUI parameters,but as long as the Nyquist sampling rule [114] was satisfied, the diagnostic power ofthe ultrasound system was not compromised. This was confirmed by the fact that theintact and degraded sample groups could always be distinguished.
7.5 Limitations of ultrasonic modeling of articular cartilage
In study IV, the ultrasonic pulse-echo modeling of articular cartilage was conducted.In the model, both the measurement geometry and the structure and composition ofthe cartilage tissue were simplified considerably.
An obvious limitation of the present model is that it is two-dimensional, and con-sequently cannot fully represent the real three-dimensional measurement situation.The modeling was limited to two dimensions for practical reasons, because a cor-responding 3D Wave 3000 model with a voxel size of (3.57 µm)3 ≈ 45 µm3 and atransducer-sample distance of 3 mm would have required over 40 GB of random ac-cess memory.
Articular cartilage is a highly anisotropic tissue with multiple phases and a fibermatrix structure. In the acoustic model, the assumption of homogeneity and isotropyof the cartilage material was a considerable simplification, but the effects of the sim-

62 7.5. Limitations of ultrasonic modeling of articular cartilage
plifications were probably reduced because only the ultrasound reflection from thesurface of the cartilage was considered. Furthermore, in the model, the shear ultra-sound wave was negligible compared with the longitudinal ultrasound wave. Thisassumption is justified because the absorption of shear waves in soft tissues is muchgreater than that of longitudinal waves [41, 94]. This is especially true for cartilagetissue that may contain as much as 80% water.
In the future, adding anisotropy and layers with different compositions wouldbring the acoustic model of cartilage closer to the real measurement situation. Sinceosteoarthritic changes are concurrent in cartilage and bone, simultaneous ultrasonicevaluation of cartilage and bone may be diagnostically valuable. Inclusion of sub-chondral bone in the acoustic model is feasible, because FDTD modeling of bone hasbeen successfully applied earlier [9, 46, 59, 108]. An acoustic model including realis-tically implemented cartilage and bone might enable more accurate interpretation ofhigh-frequency ultrasound measurements.

CHAPTER VIII
Summary and conclusions
Quantitative ultrasound imaging (QUI) shows significant clinical potential for diag-nosis of degenerative cartilage diseases, such as OA. This thesis work continued theinvestigation and validation of ultrasound methods using experimental and numeri-cal tools. The main conclusions of this thesis are summarized as follows:
1. Complex wavelet transform QUI parameters, the MM and the ED, provided noadditional information about the integrity of articular cartilage compared withthe time and frequency domain parameters (R, URI, IRC).
2. The ultrasound roughness parameter URI, as well as the reflection parametersIRC and R, was significantly affected by the angle of incidence of the ultrasoundbeam. However, in contrast to the reflection parameters, the angular depen-dence of the URI was similar for intact and denegerated cartilage, and thus thediagnostic power was maintained regardless of the angle of incidence up till 7◦.
3. In order to evaluate the URI reliably, a focused ultrasound transducer must beused. Ultrasound frequency must be greater than 5 MHz; in this thesis it wasfound that 50 MHz was sufficient. Increasing the spatial step size does not affectthe diagnostic power of the QUI parameters as long as the step is smaller thanthe ultrasound beam diameter at the focus. The limit for the temporal samplingfrequency is the Nyquist sampling frequency, above which the diagnostic powerof the QUI parameters is preserved.
4. The first ever sample-specific FDTD model for ultrasonic measurements of ar-ticular cartilage in a pulse-echo geometry was constructed. The model was suc-cessful in reproducing experimentally determined results. It was confirmed thatin addition to the roughness of the surface of the cartilage, the values of the ma-terial parameters also have a significant impact on the ultrasound reflection.Beyond an angle of incidence of 2◦ of the ultrasound beam, the increased pro-portion of scattering (compared with specular reflection) and the decrease of thesignal-to-noise ratio caused the IRC to become constant.
In conclusion, among the parameters measured in the present studies, the URI seemsto be the most optimal parameter in detecting the first signs of OA and it is leastaffected by the angle of incidence of the ultrasound. However, the clinical applicationof the URI imposes major technical demands on the imaging system. The reflection
63

64
parameters R and IRC have the advantage of maintaining their usability with lowerultrasound frequencies than the URI. Thus, they might be especially suitable for usewith the recently introduced novel minimally invasive ultrasound method, wherethe condition of articular cartilage and subchondral bone is assessed with an intra-articular ultrasound probe [147].
Although the methods presented in this thesis are not readily applicable for clin-ical use, they provide valuable guidelines concerning the technical factors affectingthe ultrasonic evaluation of the integrity of the articular cartilage and form the basisfor further development of clinical ultrasonic applications.

8. Summary and conclusions 65

66 References

REFERENCES
[1] P. S. Addison. The illustrated wavelet transform handbook. IOP Publishing Ltd,Bristol, 2002.
[2] R. S. Adler, D. K. Dedrick, T. J. Laing, E. H. Chiang, C. R. Meyer, P. H. Bland,and J. M. Rubin. Quantitative assessment of cartilage surface roughness in os-teoarthritis using high frequency ultrasound. Ultrasound Med Biol, 18(1):51–8,1992.
[3] D. H. Agemura, W. D. O’Brien Jr., J. E. Olerud, L. E. Chun, and D. E. Eyre.Ultrasonic propagation properties of articular cartilage at 100 MHz. J AcoustSoc Am, 87(4):1786–91, 1990.
[4] R. D. Altman. Overview of osteoarthritis. Am J Med, 83(4B):65–9, 1987.[5] J. M. Anderson-MacKenzie, H. L. Quasnichka, R. L. Starr, E. J. Lewis, E. J.
Billingham, and A. J. Bailey. Fundamental subchondral bone changes in spon-taneous knee osteoarthritis. Int J Biochem Cell Biol, 37:224–236, 2005.
[6] C. G. Armstrong and V. C. Mow. Variations in the intrinsic mechanical proper-ties of human articular cartilage with age, degeneration, and water content. JBone Joint Surg Am, 64(1):88–94, 1982.
[7] G. A. Ateshian. The role of interstitial fluid pressurization in articular cartilagelubrication. J Biomech, 42:1163–1176, 2009.
[8] G. A. Ateshian, L. J. Soslowsky, and V. C. Mow. Quantitation of articular surfacetopography and cartilage thickness in knee joints using stereophotogrammetry.J Biomech, 24(8):761–776, 1991.
[9] A. S. Aula, J. Töyräs, M. A. Hakulinen, and J. S. Jurvelin. Effect of bone marrowon acoustic properties of trabecular bone - 3D finite difference modeling study.Ultrasound Med Biol, 35(2):308–318, 2009.
[10] M. Aurich, G. R. Squires, A. Reiner, J. A. Mollenhauer, K. E. Kuettner, A. R.Poole, and A. A. Cole. Differential matrix degradation and turnover in earlycartilage lesions of human knee and ankle joints. Arthritis Rheum, 52(1):112–119, 2005.
[11] A. J. Bailey, J. P. Mansell, T. J. Sims, and X. Banse. Biochemical and mechanicalproperties of subchondral bone in osteoarthritis. Biorheology, 41:349–358, 2004.
[12] F. J. Blanco, R. Guitian, E. Vázquez-Martul, F. J. deToro, and F. Galdo. Os-teoarthritis chondrocytes die by apoptosis. Arthritis Rheum, 41(2):284–289, 1998.
[13] C. P. Brown, S. W. Hughes, R. W. Crawford, and A. Oloyede. Ultrasound assess-
67

68 References
ment of articular cartilage: analysis of the frequency profile of reflected signalsfrom naturally and artificially degraded samples. Connect Tissue Res, 48(6):277–285, 2007.
[14] C. P. Brown, S. W. Hughes, R. W. Crawford, and A. Oloyede. Joint laminatedegradation assessed by reflected ultrasound from the cartilage surface and os-teochondral junction. Phys Med Biol, 53:4123–4135, 2008.
[15] J. A. Buckwalter. Evaluating methods of restoring cartilaginous articular sur-faces. Clin Orthop Relat Res, (367 Suppl):S224–38, 1999.
[16] J. A. Buckwalter and H. J. Mankin. Articular cartilage: Part I. Tissue design andchondrocyte-matrix interactions. J Bone Joint Surg Am, 79-A(4):600–611, 1997.
[17] J. A. Buckwalter and J. Martin. Degenerative joint disease. Clin Symp, 47(2):1–32,1995.
[18] J. A. Buckwalter and J. A. Martin. Osteoarthritis. Adv Drug Deliv Rev, 58(2):150–167, 2006.
[19] L. V. Burgin and M. A. Richard. Impact testing to determine the mechanicalproperties of articular cartilage in isolation and on bone. J Mater Sci Mater Med,19(2):703–711, 2008.
[20] S. Chaffaî, F. Peyrin, S. Nuzzo, R. Porcher, G. Berger, and P. Laugier. Ultrasoniccharacterization of human cancellous bone using transmission and backscattermeasurements: relationships to density and microstructure. Bone, 30(1):229–237, 2002.
[21] R. E. Challis and R. I. Kitney. Biomedical signal processing (in four parts). Part1. Time-domain methods. Med Biol Eng Comput, 28(6):509–24, 1990.
[22] J. Charnley. The lubrication of animal joints in relation to surgical reconstructionby arthroplasty. Ann Rheum Dis, 19:10–19, 1960.
[23] E. H. Chiang, R. S. Adler, C. R. Meyer, J. M. Rubin, D. K. Dedrick, and T. J. Laing.Quantitative assessment of surface roughness using backscattered ultrasound:the effects of finite surface curvature. Ultrasound Med Biol, 20(2):123–135, 1994.
[24] E. H. Chiang, T. J. Laing, C. R. Meyer, J. L. Boes, J. M. Rubin, and R. S. Adler.Ultrasonic characterization of in vitro osteoarthritic articular cartilage with val-idation by confocal microscopy. Ultrasound Med Biol, 23(2):205–213, 1997.
[25] E. Chérin, A. Saïed, P. Laugier, P. Netter, and G. Berger. Evaluation of acousti-cal parameter sensitivity to age-related and osteoarthritic changes in articularcartilage using 50-MHz ultrasound. Ultrasound Med Biol, 24(3):341–354, 1998.
[26] E. Chérin, A. Saïed, B. Pellaumail, D. Loeuille, P. Laugier, P. Gillet, P. Netter,and G. Berger. Assessment of rat articular cartilage maturation using 50-MHzquantitative ultrasonography. Osteoarthritis Cartilage, 9:178–186, 2001.
[27] I. Daubechies. Ten lectures on wavelets. CNMS-NSF Regional conference se-ries in applied mathematics. Society for Industrial and Applied Mathematics,Philadelphia, 1992.
[28] J. S. Day, J. C. van der Linden, R. A. Bank, M. Ding, I. Hvid, D.R. Sumner,and H. Weinans. Adaptation of subchondral bone in osteoarthritis. Biorheol-ogy, 41:359–368, 2004.
[29] D. G. Disler, E. Raymond, D. A. May, J. S. Wayne, and T. R. McCauley. Articularcartilage defects: in vitro evaluation of accuracy and interobserver reliability fordetection and grading with US. Radiology, 215(3):846–851, 2000.
[30] F. G. Donnan. The theory of membrane equilibria. Chem Rev, 1:73–90, 1924.

References 69
[31] D. J. Dowsett, P. A. Kenny, and R. E. Johnston. The Physics of Diagnostic Imaging.Hodder Arnold, London, 2006.
[32] G. N. Duda, A. Haisch, M. Endres, C. Gebert, D. Schroeder, J. E. Hoffmann, andM. Sittinger. Mechanical quality of tissue engineered cartilage: results after 6and 12 weeks in vivo. J Biomed Mater Res (Appl Biomater), 53:673–677, 2000.
[33] K. R. Erikson, F. J. Fry, and P. J. Joie. Ultrasound in medicine-a review. IEEETrans Sonics Ultrason, SU-21(3):144–170, 1974.
[34] S. C. Faber, F. Eckstein, S. Lukasz, R. Mühlbauer, J. Hohe, K.-H. Englmeier, andM. Reiser. Gender differences in knee joint cartilage thickness, volume and ar-ticular surface areas: assessment with quantitative three-dimensional MR imag-ing. Skeletal Radiol, 30:144–150, 2001.
[35] T. C. Fenter, M. J. Naslund, M. B. Shah, M. T. Eaddy, and L. Black. The cost oftreating the 10 most prevalent diseases in men 50 years of age or older. Am JManag Care, 12:S90–S98, 2006.
[36] S. Fields and F. Dunn. Correlation of echographic visualizability of tissue withbiological composition and physiological state. J Acoust Soc Am, 54(3):809–812,1973.
[37] M. A. Fink and J.-F. Cardoso. Diffraction effects in pulse-echo measurement.IEEE Trans Sonics Ultrason, SU-31(4):313–329, 1984.
[38] H. Forster and J. Fisher. The influence of loading time and lubricant on thefriction of articular cartilage. Proc Inst Mech Eng H, 210(2):109–19, 1996.
[39] H. Forster and J. Fisher. The influence of continuous sliding and subsequent sur-face wear on the friction of articular cartilage. Proc Inst Mech Eng H, 213(4):329–345, 1999.
[40] M. A. Freeman. Is collagen fatigue failure a cause of osteoarthrosis and pros-thetic component migration? A hypothesis. J Orthop Res, 17(1):3–8, 1999.
[41] L. A. Frizzell, E. L. Carstensen, and J. F: Dyro. Shear properties of mammaliantissues at low megahertz frequencies. J Acoust Soc Am, 60(6):1409–1411, 1976.
[42] J. P. Gleghorn, A. R. C. Jones, C. R. Flannery, and L. J. Bonassar. Boundary modelubrication of articular cartilage by recombinant human lubricin. J Orthop Res,27(6):771–777, 2009.
[43] S.A. Goss and W. D. O’Brien Jr. Direct ultrasonic velocity measurements ofmammalian collagen threads. J Acoust Soc Am, 65(2):507–511, 1979.
[44] G. Guglielmi and F. de Terlizzi. Quantitative ultrasound in the assessment ofosteoporosis. Eur J Radiol, 2009.
[45] S. Gupta, G. A. Hawker, A. Laporte, R. Croxford, and P. C. Coyte. The economicburden of disabling hip and knee osteoarthritis (OA) from the perspective ofindividuals living with this condition. Rheumatology, 44:1531–1537, 2005.
[46] G. Haïat, F. Padilla, and P. Laugier. Sensitivity of QUS parameters to controlledvariations of bone strength assessed with a cellular model. IEEE Trans UltrasonFerroelectr Freq Control, 55(7):1488–1496, 2008.
[47] M. A. Hakulinen, J. S. Day, J. Töyräs, M. Timonen, H. Kroger, H. Weinans,I. Kiviranta, and J. S. Jurvelin. Prediction of density and mechanical proper-ties of human trabecular bone in vitro by using ultrasound transmission andbackscattering measurements at 0.2-6.7 MHz frequency range. Phys Med Biol,50(8):1629–1642, 2005.
[48] F. M. Hall and G. Wyshak. Thickness of articular cartilage in the normal knee. J

70 References
Bone Joint Surg, 62-A(3):408–413, 1980.[49] R. A. Harris, D. H. Follett, M. Halliwell, and P. N. Wells. Ultimate limits in
ultrasonic imaging resolution. Ultrasound Med Biol, 17(6):547–58, 1991.[50] E. M. Hasler, W. Herzog, J. Z. Wu, W. Muller, and U. Wyss. Articular carti-
lage biomechanics: theoretical models, material properties, and biosynthetic re-sponse. Crit Rev Biomed Eng, 27(6):415–88, 1999.
[51] K. Hattori, K. Ikeuchi, Y. Morita, and Y. Takakura. Quantitative ultrasonic as-sessment for detecting microscopic cartilage damage in osteoarthritis. ArthritisRes Ther, 7:R38–R46, 2004.
[52] K. Hattori, K. Mori, T. Habata, Y. Takakura, and K. Ikeuchi. Measurement of themechanical condition of articular cartilage with an ultrasonic probe: quantita-tive evaluation using wavelet transformation. Clin Biomech, 18:553–557, 2003.
[53] K. Hattori, Y. Takakura, M. Ishimura, T. Habata, K. Uematsu, and K. Ikeuchi.Quantitative arthroscopic ultrasound evaluation of living human cartilage. ClinBiomech, 19:213–216, 2004.
[54] K. Hattori, Y. Takakura, M. Ishimura, Y. Tanaka, T. Habata, and K. Ikeuchi. Dif-ferential acoustic properties of early cartilage lesions in living human knee andankle joints. Arthritis Rheum, 52(10):3125–3131, 2005.
[55] K. Hattori, Y. Takakura, H. Ohgushi, T. Habata, K. Uematsu, and K. Ikeuchi.Novel ultrasonic evaluation of tissue-engineered cartilage for large osteochon-dral defects - non-invasive judgment of tissue-engineered cartilage. J OrthopRes, 23:1179–1183, 2005.
[56] K. Hattori, Y. Takakura, H. Ohgushi, T. Habata, K. Uematsu, J. Yamauchi, K. Ya-mashita, T. Fukuchi, M. Sato, and K. Ikeuchi. Quantitative ultrasound can as-sess the regeneration process of tissue-engineered cartilage using a complex be-tween adherent bone marrow cells and a three-dimensional scaffold. ArthritisRes Ther, 7:R552–R559, 2005.
[57] B. K. Hoffmeister, D. P. Johnston, J. A. Janeski, D. A. Keedy, B. W. Steinert, A. M.Viano, and S. C. Kaste. Ultrasonic characterization of human cancellous bonein vitro using three different apparent backscatter parameters in the frequencyrange 0.6-15.0 MHz. IEEE Trans Ultrason Ferroelectr Freq Control, 55(7):1442–1452,2008.
[58] B. K. Hoffmeister, S. A. Whitten, S. C. Kaste, and J. Y. Rho. Effect of collagenand mineral content on the high-frequency ultrasonic properties of human can-cellous bone. Osteoporos Int, 13:26–32, 2002.
[59] A. Hosokawa. Development of a numerical cancellous bone model for finite-difference time-domain simulations of ultrasound propagation. IEEE Trans Ul-trason Ferroelectr Freq Control, 55(6):1219–1233, 2008.
[60] K. Hu, P. Radhakrishnan, R. V. Patel, and J. J. Mao. Regional structural andviscoelastic properties of fibrocartilage upon dynamic nanoindentation of thearticular condyle. J Struct Biol, 136(1):46–52, 2001.
[61] Y.-P. Huang and Y. P. Zheng. Intravascular ultrasound (IVUS): a potentialarthroscopic tool for quantitative assessment of articular cartilage. Open BiomedEng J, 3:13–20, 2009.
[62] B. Jaffré, A. Watrin, D. Loeuille, P. Gillet, P. Netter, P. Laugier, and A. Saïed.Effects of antiinflammatory drugs on arthritic cartilage. Arthritis Rheum,48(6):1594–1601, 2003.

References 71
[63] C.-B. James and T.L. Uhl. A review of articular cartilage pathology and the useof glucosamine sulfate. J Athl Train, 36(4):413–419, 2001.
[64] G. D. Jay, J. R. Torres, M. L. Warman, M. C. Laderer, and K. S. Breuer. The roleof lubricin in the mechanical behavior of synovial fluid. Proc Natl Acad Sci USA,104(15):6194–6199, 2007.
[65] G. A. Joiner, E. R. Bogoch, K. P. Pritzker, M. D. Buschmann, A. Chevrier, andF. S. Foster. High frequency acoustic parameters of human and bovine artic-ular cartilage following experimentally-induced matrix degradation. UltrasonImaging, 23(2):106–116, 2001.
[66] J. P. Jones. Quantitative characterization of tissue using ultrasound. IEEE TransNucl Sci, NS-27(3):1168–1175, 1980.
[67] D. Joseph, W. Y. Gu, X. G. Mao, W. M. Lai, and V. C. Mow. True density ofnormal and enzymatically treated bovine articular cartilage. Trans Orthop ResSoc, 24:642, 1999.
[68] P. Julkunen, T. Harjula, J. Iivarinen, J. Marjanen, K. Seppänen, T. Närhi,J. Arokoski, M. J. Lammi, P. A. Brama, J. S. Jurvelin, and H. J. Helminen. Biome-chanical, biochemical and structural correlations in immature and mature rabbitarticular cartilage. Osteoarthritis Cartilage, in press, 2009.
[69] J. Jurvelin, T. Kuusela, R. Heikkilä, A. Pelttari, I. Kiviranta, M. Tammi, and H. J.Helminen. Investigation of articular cartilage surface morphology with a semi-quantitative scanning electron microscopic method. Acta Anat, 116(4):302–311,1983.
[70] J. P. Karjalainen, J. Töyräs, O. Riekkinen, M. Hakulinen, and J. S. Jurvelin. Ul-trasound backscatter imaging provides frequency-dependent infromation onstructure, composition and mechanical properties of human trabecular bone.Ultrasound Med Biol, 35(8):1376–1384, 2009.
[71] M. A. Karsdal, L. B. Tanko, B. J. Riis, B. C. Sondergard, K. Henriksen, R. D. Alt-man, P. Qvist, and C. Christiansen. Review: Calsitonin is involved in cartilagehomeostasis: Is calcitonin a treatment for OA? Osteoarthritis Cartilage, 14:617–624, 2006.
[72] G. E. Kempson, H. Muir, C. Pollard, and M. Tuke. The tensile properties ofthe cartilage of human femoral condyles related to the content of collagen andglycosaminoglycans. Biochim Biophys Acta, 297(2):456–72, 1973.
[73] H. K. Kim, P. S. Babyn, K. A. Harasiewicz, H. K. Gahunia, K. P. Pritzker, and F. S.Foster. Imaging of immature articular cartilage using ultrasound backscattermicroscopy at 50 MHz. J Orthop Res, 13(6):963–70, 1995.
[74] I. Kiviranta, J. Jurvelin, M. Tammi, A. M. Säämänen, and H. J. Helminen. Mi-crospectrophotometric quantitation of glycosaminoglycans in articular cartilagesections stained with safranin O. Histochemistry, 82(3):249–55, 1985.
[75] P. Kiviranta, E. Lammentausta, J. Töyräs, I. Kiviranta, and J. S. Jurvelin. Indenta-tion diagnostics of cartilage degeneration. Osteoarthritis Cartilage, 16(7):796–804,2008.
[76] P. Kiviranta, J. Rieppo, R. K. Korhonen, P. Julkunen, J. Töyräs, and J. S. Jurvelin.Collagen network primarily controls Poisson’s ratio of bovine articular cartilagein compression. J Orthop Res, 24(4):690–699, 2006.
[77] P. Kiviranta, J. Töyräs, M. T. Nieminen, M S. Laasanen, S. Saarakkala, H. J.Nieminen, M. J. Nissi, and J. S. Jurvelin. Comparison of novel clinically ap-

72 References
plicable methodology for sensitive diagnostics of cartilage degeneration. EurCell Mater, 13:46–55, 2007.
[78] R. U. Kleemann, H. Schell, M. Thompson, D. R. Epari, G. N. Duda, andA. Weiler. Mechanical behavior of articular cartilage after osteochondral au-tograft transfer in an ovine model. Am J Sports Med, 35(4):555–563, 2007.
[79] E. E. Konofagou, T. P. Harrigan, J. Ophir, and T. A. Krouskop. Poroelastography:imaging the poroelastic properties of tissues. Ultrasound Med Biol, 27(10):1387–1397, 2001.
[80] R. K. Korhonen, M. Wong, J. Arokoski, R. Lindgren, H. J. Helminen, E. B. Hun-ziker, and J. S. Jurvelin. Importance of the superficial tissue layer for the inden-tation stiffness of articular cartilage. Med Eng Phys, 24:99–108, 2002.
[81] H. Kuroki, Y. Nakagawa, K. Mori, M. Ohba, T. Suzuki, Y. Mizuno, K. Ando,M. Takenaka, K. Ikeuchi, and T. Nakamura. Acoustic stiffness and change inplug cartilage over time after autologous osteochondral grafting: correlationbetween ultrasound signal intensity and histological score in a rabbit model.Arthritis Res Ther, 6:R492–R504, 2004.
[82] M. S. Laasanen, S. Saarakkala, J. Töyräs, J. Rieppo, and J. S. Jurvelin. Site-specificultrasound reflection properties and superficial collagen content of bovine kneearticular cartilage. Phys Med Biol, 50:3221–3233, 2005.
[83] M. S. Laasanen, J. Töyräs, J. Hirvonen, S. Saarakkala, R. K. Korhonen, M. T.Nieminen, I. Kiviranta, and J. S. Jurvelin. Novel mechano-acoustic techniqueand instrument for diagnosis of cartilage degeneration. Physiol Meas, 23(3):491–503, 2002.
[84] M. S. Laasanen, J. Töyräs, R. K. Korhonen, J. Rieppo, S. Saarakkala, M. T. Niem-inen, J. Hirvonen, and J. S. Jurvelin. Biomechanical properties of knee articularcartilage. Biorheology, 40(1-3):133–140, 2003.
[85] M. S. Laasanen, J. Töyräs, A. Vasara, S. Saarakkala, M. M. Hyttinen, I. Kiviranta,and J. S. Jurvelin. Quantitative ultrasound imaging of spontaneous repair ofporcine cartilage. Osteoarthritis Cartilage, 14:258–263, 2006.
[86] R. C. Lawrence, D. T. Felson, C. G. Helmick, L. M. Arnold, H. Choi, R. A. Deyo,S. Gabriel, R. Hirsch, M. C. Hochberg, G. G. Hunder, J. M. Jordan, J. N. Katz,H. M. Kremers, and F. Wolfe. Estimates of the prevalence of arthritis and otherrheumatic conditions in the United States. Arthritis Rheum, 58(1):26–35, 2008.
[87] C. Le Pen, C. Reygrobellet, and I. Gérentes. Financial cost of osteoarthritis inFrance. the "COART" France study. Joint Bone Spine, 72:567–570, 2005.
[88] C.-L. Lee, M.-H. Huang, C.-Y. Chai, C.-H. Chen, J.-Y. Su, and Y.-C. Tien. Thevalidity of in vivo ultrasonographic grading of osteoarthritic femoral condylarcartilage: a comparison with in vitro ultrasonographic and histologic gradings.Osteoarthritis Cartilage, 16(3):352–358, 2008.
[89] S. Lees, J. D. Heeley, J. M. Ahern, and M. G. Oravecz. Axial phase velocity inrat tail tendon fibers at 100 MHz by ultrasonic microscopy. IEEE Trans SonicsUltrason, 30(2):85–90, 1983.
[90] S. Leicht and K. Raum. Acoustic impedance changes in cartilage and subchon-dral bone due to primary arthrosis. Ultrasonics, 48(6-7):613–620, 2008.
[91] H. Y. Ling, Y. P. Zheng, and S. G. Patil. Strain dependence of ultrasound speedin bovine articular cartilage under compression in vitro. Ultrasound Med Biol,33(10):1599–1608, 2007.

References 73
[92] M. Linzer and S. J. Norton. Ultrasonic tissue characterization. Annu Rev BiophysBioeng, 11:303–329, 1982.
[93] M.-H. Lu, Y. P. Zheng, Q.-H. Huang, C. Ling, Q. Wang, L. Bridal, L. Qin, andA. Mak. Noncontact evaluation of articular cartilage degeneration using a novelultrasound water jet indentation system. Ann Biomed Eng, 37(1):164–175, 2009.
[94] E. L. Madsen, H. J. Sathoff, and J. A. Zagzebski. Ultrasonic shear wave prop-erties of soft tissues and tissuelike materials. J Acoust Soc Am, 74(5):1346–1355,1983.
[95] H. J. Mankin, H. Dorfman, L. Lippiello, and A. Zarins. Biochemical andmetabolic abnormalities in articular cartilage from osteo-arthritic human hips.II. Correlation of morphology with biochemical and metabolic data. J Bone JointSurg Am, 53(3):523–537, 1971.
[96] H. J. Mankin and A. Z. Thrasher. Water content and binding in normal andosteoarthritic human cartilage. J Bone Joint Surg Am, 57(1):76–80., 1975.
[97] A. Maroudas. Distribution and diffusion of solutes in articular cartilage. BiophysJ, 10(5):365–379, 1970.
[98] A. Maroudas and M. Venn. Chemical composition and swelling of normal andosteoarthrotic femoral head cartilage. II. Swelling. Ann Rheum Dis, 36(5):399–406., 1977.
[99] C. W. Mc Cutchen. The frictional properties of animal joints. Wear, 5:1–17, 1962.[100] T. McAlindon, M. Formica, M. LaValley, M. Lehmer, and K. Kabbara. Effec-
tiveness of glucosamine for symptoms of knee osteoarthritis: results from anintertet-based randomized double-blind controlled trial. Am J Med, 117:643–649, 2004.
[101] C. A. McDevitt. Biochemistry of articular cartilage. Nature of proteoglycansand collagen of articular cartilage and their role in ageing and in osteoarthrosis.Ann Rheum Dis, 32(4):364–378, 1973.
[102] G. Meachim. Effect of age on the thickness of adult articular cartilage at theshoulder joint. Ann Rheum Dis, 30:43–36, 1971.
[103] G. Meachim. Age-related degeneration of patellar articular cartilage. J Anat,134(Pt 2):365–371, 1982.
[104] R. J. Minns, F. S. Steven, and K. Hardinge. Osteoarthrotic articular cartilagelesions of the femoral head observed in the scanning electron microscope. JPathol, 122(2):63–70, 1977.
[105] V. C. Mow, D. C. Fithian, and M. A. Kelly. Fundamentals of articular cartilageand meniscus biomechanics. In J. W. Ewing, editor, Articular cartilage and kneejoint function: basic science and arthroscopy. Raven Press Ltd., New York, 1990.
[106] S. L. Murphy, D. M. Strasburg, A. K. Lyden, D. M. Smith, J. F. Koliba, D. P.Dadabhoy, and S. M. Wallis. Effects of activity strategy training on pain andphysical activity in older adults with knee or hip osteoarthritis: A pilot study.Arthritis Care & Research, 59(10):1480–1487, 2008.
[107] S. L. Myers, K. Dines, D. A. Brandt, K. D. Brandt, and M. E. Albrecht. Experi-mental assessment by high frequency ultrasound of articular cartilage thicknessand osteoarthritic changes. J Rheumatol, 22(1):109–16, 1995.
[108] Y. Nagatani, K. Mizuno, T. Saeki, M. Matsukawa, T. Sakaguchi, and H. Hosoi.Numerical and experimental study on the wave attenuation in bone - FDTDsimulation of ultrasound propagation in cancellous bone. Ultrasonics, 48(6-

74 References
7):607–612, 2008.[109] H. J. Nieminen, S. Saarakkala, M. S. Laasanen, J. Hirvonen, J. S. Jurvelin, and
J. Töyräs. Ultrasound attenuation in normal and spontaneously degeneratedarticular cartilage. Ultrasound Med Biol, 30(4):493–500, 2004.
[110] H. J. Nieminen, J. Töyräs, M. S. Laasanen, and J. S. Jurvelin. Acoustic propertiesof articular cartilage under mechanical stress. Biorheology, 43:523–535, 2006.
[111] H. J. Nieminen, J. Töyräs, J. Rieppo, M. T. Nieminen, J. Hirvonen, R. Korhonen,and J. S. Jurvelin. Real-time ultrasound analysis of articular cartilage degrada-tion in vitro. Ultrasound Med Biol, 28(4):519–525, 2002.
[112] K. Nishitani, Y. Nakagawa, T. Gotoh, M. Kobayashi, and T. Nakamura. Intra-operative acoustic evaluation of living human cartilage of the elbow and kneeduring mosaicplasty for osteochondritis dissecans of the elbow. Am J SportsMed, 36(12):2345–53, 2008.
[113] M. J. Nissi, J. Töyräs, M. S. Laasanen, J. Rieppo, S. Saarakkala, R. Lappalainen,J. S. Jurvelin, and M. T. Nieminen. Proteoglycan and collagen sensitive MRIevaluation of normal and degenerated articular cartilage. J Orthop Res, 22:557–564, 2004.
[114] H. Nyquist. Certain topics in telegraph transmission theory. Transactions of theA.I.E.E., pages 617–644, 1928.
[115] S. P. Oakley and M. N. Lassere. A critical appraisal of quantitative arthroscopyas an outcome measure in osteoarthritis of the knee. Semin Arthritis Rheum,33(2):83–105, 2003.
[116] S. P. Oakley, I. Portek, Z. Szomor, A. Turnbull, G. A. C. Murrell, B. W. Kirkham,and M. N. Lassere. Accuracy and reliability of arthroscopic estimates of carti-lage lesion size in a plastic knee simulation model. Arthroscopy, 19(3):282–289,2003.
[117] J. Ophir, I. Cespedes, H. Ponnekanti, Y. Yazdi, and X. Li. Elastography: a quan-titative method for imaging the elasticity of biological tissues. Ultrason Imaging,13(2):111–34, 1991.
[118] M. Pagnano and G. Westrich. Successful nonoperative management of chronicosteoarthritis pain of the knee: safety and efficacy of retreatment with intra-articular hyaluronans. Osteoarthritis Cartilage, 13:751–761, 2005.
[119] K. J. Parker, R. M. Lerner, and R. C. Waag. Attenuation of ultrasound: mag-nitude and frequency dependence for frequency characterization. Radiology,153:785–788, 1984.
[120] S. G. Patil, Y. P. Zheng, J. Y. Wu, and J. Shi. Measurement of depth-dependenceand anisotropy of ultrasound speed of bovine articular cartilage in vitro. Ultra-sound Med Biol, 30(7):953–963, 2004.
[121] P. C. Pedersen and A. Grebe. Application of time delay spectrometry for roughsurfae characterization. Ultrasonics, 39:101–108, 2001.
[122] B. Pellaumail, D. Loeuille, A. Watrin, P. Netter, G. Berger, and A. Saïed. Cor-relation of high frequency ultrasound backscatter with cartilage matrix con-stituents. IEEE Ultrasonics Symposium, pages 1463–1466, 1998.
[123] B. Pellaumail, A. Watrin, D. Loeuille, P. Netter, G. Berger, P. Laugier, andA. Saïed. Effect of articular cartilage proteoglycan depletion on high frequencyultrasound backscatter. Osteoarthritis Cartilage, 10(7):535–541, 2002.
[124] J. Pohlhammer and W. D. O’Brien Jr. Dependence of the ultrasonic scatter

References 75
coefficient on collagen concentration in mammalian tissues. J Acoust Soc Am,69(1):283–5, 1981.
[125] C.-J. Qu, H. M. Karjalainen, H. J. Helminen, and M. J. Lammi. The lack ofeffect of glucosamine sulphate on aggrecan mRNA expression and 35S-sulphateincorporation in bovine promary chondrocytes. Biochim Biophys Acta, pages453–459, 2006.
[126] P. Qvist, A.-C. Bay-Jensen, C. Christiansen, E. B. Dam, P. Pastoureau, and M. A.Karsdal. The disease modifying osteoarthritis drug (DMOAD): Is it in the hori-zon? Pharmacol Res, 58:1–7, 2008.
[127] E. L. Radin, I. L. Paul, and M. J. Tolkoff. Subchondral bone changes in patientswith early degenerative joint disease. Arthritis Rheum, 13(4):400–5, 1970.
[128] K. Raum and Jr. O’Brien, W. D. Pulse-echo filed distribution measurement tech-nique for high-frequency ultrasound sources. IEEE Trans Ultrason FerroelectrFreq Control, 44(4):810–815, 1997.
[129] J. Rieppo, J. Töyräs, M. T. Nieminen, V. Kovanen, M. M. Hyttinen, R. K. Ko-rhonen, J. S. Jurvelin, and H. J. Helminen. Structure-function relationships inenzymatically modified articular cartilage. Cells Tissues Organs, 175(3):121–32,2003.
[130] J. Rothfuss, W. Mau, H. Zeidler, and M. H. Brenner. Socioeconomic evaluationof rheumatoid arthritis and osteoarthritis: a literature review. Semin ArthritisRheum, 26(5):771–779, 1997.
[131] S. Saarakkala, R. K. Korhonen, M. Laasanen, J. Töyräs, J. Rieppo, and J. S. Ju-rvelin. Mechano-acoustic determination of Young’s modulus of articular carti-lage. Biorheology, 41:167–179, 2004.
[132] S. Saarakkala, M. S. Laasanen, J. S. Jurvelin, K. Törrönen, M. J. Lammi, R. Lap-palainen, and J. Töyräs. Ultrasound indentation of normal and spontaneouslydegenerated bovine articular cartilage. Osteoarthritis Cartilage, 11:697–705, 2003.
[133] S. Saarakkala, M S. Laasanen, J. S. Jurvelin, and J. Töyräs. Quantitative ultra-sound imaging detects degenerative changes in articular cartilage surface andsubchondral bone. Phys Med Biol, 51(20):5333–5346, 2006.
[134] A. Saïed, E. Chérin, H. Gaucher, P. Laugier, P. Gillet, J. Floquet, P. Netter, andG. Berger. Assessment of articular cartilage and subchondral bone: subtle andprogressive changes in experimental osteoarthritis using 50 MHz echographyin vitro. J Bone Miner Res, 12(9):1378–1386, 1997.
[135] D. A. Senzig, F. K. Forster, and J. E. Olerud. Ultrasonic attenuation in articularcartilage. J Acoust Soc Am, 92(2):676–681, 1992.
[136] K. Shigematsu, K. Hattori, Y. Kobata, K. Kawamura, H. Yajima, and Y. Takakura.A pilot feasibility study for ultrasound evaluation of living human wrist carti-lage: site-specific differences in acoustic properties. J Hand Surg, 34A:34–39,2009.
[137] M. P. Spriet, C. A. Girard, F. S. Foster, K. A. Harasiewicz, D. W. Holdsworth,and S. Laverty. Validation of a 40 MHz B-scan ultrasound biomicroscope for theevaluation of osteoarthritis lesions in an animal model. Osteoarthritis Cartilage,13:171–179, 2005.
[138] G. R. Squires, S. Okouneff, M. Ionescu, and A. R. Poole. The pathobiology of fo-cal lesion development in aging human articular cartilage and molecular matrixchanges characteristic of osteoarthritis. Arthritis Rheum, 48(5):1261–1270, 2003.

76 References
[139] R. A. Stockwell. The interrelationship of cell density and cartilage thickness inmammalian articular cartilage. J Anat, 109(3):411–421, 1971.
[140] J.-K. F. Suh, I. Youn, and F. H. Fu. An in situ calibration of an ultrasound trans-ducer: a potential application for an ultrasonic indentation test of articular car-tilage. J Biomech, 34(10):1347–1353, 2001.
[141] P. D. Thorne and N. G. Pace. Acoustic studies of broadband scattering from amodel rough surface. J Acoust Soc Am, 75(1):133–144, 1984.
[142] J. Töyräs, R. K. Korhonen, T. Voutilainen, J. S. Jurvelin, and R. Lappalainen. Im-provement of arthroscopic cartilage stiffness probe using amorphous diamondcoating. J Biomed Mater Res B Appl Biomater, 73B(1):15–22, 2005.
[143] J. Töyräs, M. S. Laasanen, S. Saarakkala, M. J. Lammi, J. Rieppo, J. Kurkijärvi,R. Lappalainen, and J. S. Jurvelin. Speed of sound in normal and degeneratedbovine articular cartilage. Ultrasound Med Biol, 29(3):447–454, 2003.
[144] J. Töyräs, J. Rieppo, M. T. Nieminen, H. J. Helminen, and J. S. Jurvelin. Char-acterization of enzymatically induced degradation of articular cartilage usinghigh frequency ultrasound. Phys Med Biol, 44(11):2723–2733, 1999.
[145] A. I. Vasara, M. M. Hyttinen, M. J. Lammi, P. E.. Lammi, T.K. Långsjö, A. Lin-dahl, L. Peterson, M. Kellomäki, Y. T. Konttinen, H. J. Helminen, and I. Kivi-ranta. Subchondral bone reaction associated with chondral defect and at-tempted cartilage repair in goats. Calcif Tissue Int, 74:107–114, 2004.
[146] N. Verzijl, J. DeGroot, R. A. Bank, M. T. Bayliss, J. W. J. Bijlsma, F. P. J. G. Lafeber,A. Maroudas, and J. M. TeKoppele. Age-related accumulation of the advancedglycation endproduct pentosidine in human articular cartilage aggrecan: theuse of pentosidine levels as a quantitative measure of protein turnover. MatrixBiol, 20:409–417, 2001.
[147] T. Virén, S. Saarakkala, E. Kaleva, H. J. Nieminen, J. S. Jurvelin, and J. Töyräs.Minimally invasive ultrasound method for intra-articular diagnostics of carti-lage degeneration. Ultrasound Med Biol, 35(9):1546–1554, 2009.
[148] Q. Wang, Y.-P. Zheng, L. Qin, Q.-H. Huang, W.-L. Lam, G. Leung, X. Guo, andH.-B. Lu. Real-time ultrasonic assessment of progressive proteoglycan deple-tion in articular cartilage. Ultrasound Med Biol, 34(7):1085–1092, 2008.
[149] J. S. Wayne, K. A. Kraft, K. J. Shields, C. Yin, J. R. Owen, and D. G. Disler. MRimaging of normal and matrix-depleted cartilage: correlation with biomechan-ical function and biochemical composition. Radiology, 228(2):493–499, 2003.
[150] C. Weiss and S. Mirow. An ultrastructural study of osteoarthritic changes in thearticular cartilage of human knees. J Bone Joint Surg Am, 54(5):954–72, 1972.
[151] P. N. T. Wells. Physical principles of ultrasonic diagnosis, volume 1 of Medicalphysics. Academic Press Inc., New York, 1969.
[152] P. N. T. Wells. Review: absorption and dispersion of ultrasound in biologicaltissue. Ultrasound Med Biol, 1(4):369–76, 1975.
[153] P. N. T. Wells. Biomedical ultrasonics. Medical physics. Academic Press Inc., NewYork, 1977.
[154] J. E. Wilhjelm, P. C. Pedersen, and S. M. Jacobsen. The influence of roughness,angle, range, and transducer type on the echo signal from planar interfaces.IEEE Trans Ultrason Ferroelectr Freq Control, 48(2):511–521, 2001.
[155] S. Yongchen, D. Yanwu, T. Jie, and T. Zhensheng. Ultrasonic propagation pa-rameters in human tissues. Proceedings of Ultrasonics Symposium, 1986.

References 77
[156] I. Youn, F. H. Fu, and J.-K. Suh. Determination of the mechanical propertiesof articular cartilage using a high-frequency ultrasonic indentation technique.Trans Orthop Res Soc, 23:162, 1999.
[157] Y. P. Zheng and Y. P. Huang. More intrinsic parameters should be used in assess-ing degeneration of articular cartilage with quantitative ultrasound. ArthritisRes Ther, 10, 2008.
[158] Y. P. Zheng, M.-H. Lu, and Q. Wang. Ultrasound elastomicroscopy using waterjet and osmosis loading: potentials for assessment for articular cartilage. Ultra-sonics, 44:e203–e209, 2006.
[159] Y. P. Zheng and A. F. Mak. An ultrasound indentation system for biomechanicalproperties assessment of soft tissues in-vivo. IEEE Trans Biomed Eng, 43(9):912–8, 1996.
Kuopio University Publications C. Natural and Environmental Sciences C 238. Pinto, Delia M. Ozonolysis of constitutively-emitted and herbivory-induced volatile organic compounds (VOCs) from plants: consequences in multitrophic interactions. 2008. 110 p. Acad. Diss. C 239. Berberat nee Kurkijärvi, Jatta. Quantitative magnetic resonance imaging of native and repaired articular cartilage: an experimental and clinical approach. 2008. 90 p. Acad. Diss. C 240. Soininen, Pasi. Quantitative ¹H NMR spectroscopy: chemical and biological applicatons. 2008. 128 p. Acad. Diss. C 241. Klemola, Kaisa. Cytotoxicity and spermatozoa motility inhibition resulting from reactive dyes and dyed fabrics. 2008. 67 p. Acad. Diss. C 242. Pyykönen, Teija. Environmental factors and reproduction in farmed blue fox (Vulpes lagopus) vixens. 2008. 78 p. Acad. Diss. C 243. Savolainen, Tuomo. Modulaarinen, adaptiivinen impedanssitomografialaitteisto. 2008. 188 p. Acad. Diss. C 244. Riekkinen, Ossi. Development and application of ultrasound backscatter methods for the diagnostics of trabecular bone. 2008. 79 p. Acad. Diss. C 245. Autio, Elena. Loose housing of horses in a cold climate: effects on behaviour, nutrition, growth and cold resistance. 2008. 76 p. Acad. Diss. C 246. Saramäki, Anna. Regulation of the p21 (CDKNIA) gene at the chromatin level by 1 alfa,25-dihydroxyvitamin D3. 2008. 100 p. Acad. Diss. C 247. Tiiva, Päivi. Isoprene emission from northern ecosystems under climate change. 2008. 98 p. Acad. Diss. C 248. Himanen, Sari J. Climate change and genetically modified insecticidal plants: plant-herbivore interactions and secondary chemistry of Bt Cryl Ac-Toxin producing oilseed rape (Brassica napus L.) under elevated CO2 or O3. 2008. 42 p. Acad. Diss. C 249. Silvennoinen, Hanna. Nitrogen and greenhouse gas dynamics in rivers and estuaries of theBothnian Bay (Northern Baltic Sea). 2008. 98 p. Acad. Diss. C 250. Degenhardt, Tatjana. An integrated view of PPAR-dependent transcription. 2009. 120 p. Acad. Diss. C 251. Häikiö, Elina. Clonal differences of aspen (Populus spp.) in responses to elevated ozone and soil nitrogen. 2009. 49 p. Acad. Diss. C 252. Hassinen, Viivi H. Search for metal-responsive genes in plants: putative roles in metal tolerance of accumulation. 2009. 84 p. Acad. Diss.