
ERM-GC Model Solutions Spring 2018 - soa.org · ERM-GC Spring 2018 Solutions Page 1 ERM-GC Model...
44
ERM-GC Spring 2018 Solutions Page 1 ERM-GC Model Solutions Spring 2018 1. Learning Objectives: 1. The candidate will understand the types of risks faced by an entity and be able to identify and analyze these risks. 2. The candidate will understand the concepts of risk modeling and be able to evaluate and understand the importance of risk models. 4. The candidate will understand the approaches for managing risks and how an entity makes decisions about appropriate techniques. 5. The candidate will understand the concept of economic capital, risk measures in capital assessment and techniques to allocate the cost of risks within business units. Learning Outcomes: (1b) Explain risk taxonomy and its application to different frameworks. (2c) Analyze and evaluate risk aggregation techniques, including use of correlation, integrated risk distributions and copulas. (2f) Analyze the importance of tails of distributions, tail correlations, and low frequency/high severity events. (2h) Construct approaches to modeling various risks and evaluate how an entity makes decisions about techniques to model, measure and aggregate risks including but not limited to stochastic processes. (4j) Demonstrate risk management strategies for other key risks (for example, operational, strategic, legal, and insurance risks). (5b) Define the basic elements and explain the uses of economic capital. Explain the challenges and limits of economic capital calculations and explain how economic capital may differ from external requirements of rating agencies and regulators. (5c) Apply risk measures and demonstrate how to use them in capital assessment. Contrast regulatory, accounting, statutory and economic capital.
Transcript of ERM-GC Model Solutions Spring 2018 - soa.org · ERM-GC Spring 2018 Solutions Page 1 ERM-GC Model...

ERM-GC Spring 2018 Solutions Page 1
ERM-GC Model Solutions Spring 2018
1. Learning Objectives:
1. The candidate will understand the types of risks faced by an entity and be able to identify and analyze these risks.
2. The candidate will understand the concepts of risk modeling and be able to
evaluate and understand the importance of risk models. 4. The candidate will understand the approaches for managing risks and how an
entity makes decisions about appropriate techniques. 5. The candidate will understand the concept of economic capital, risk measures in
capital assessment and techniques to allocate the cost of risks within business units.
Learning Outcomes: (1b) Explain risk taxonomy and its application to different frameworks. (2c) Analyze and evaluate risk aggregation techniques, including use of correlation,
integrated risk distributions and copulas. (2f) Analyze the importance of tails of distributions, tail correlations, and low
frequency/high severity events. (2h) Construct approaches to modeling various risks and evaluate how an entity makes
decisions about techniques to model, measure and aggregate risks including but not limited to stochastic processes.
(4j) Demonstrate risk management strategies for other key risks (for example,
operational, strategic, legal, and insurance risks). (5b) Define the basic elements and explain the uses of economic capital. Explain the
challenges and limits of economic capital calculations and explain how economic capital may differ from external requirements of rating agencies and regulators.
(5c) Apply risk measures and demonstrate how to use them in capital assessment.
Contrast regulatory, accounting, statutory and economic capital.
ERM-GC Spring 2018 Solutions Page 2
1. Continued Sources: ERM-702-12: IAA Note on ERM for Capital and Solvency Purposes in the Insurance Industry ERM-101-12: Measurement and Modeling of Dependencies in Economic Capital SOA Monograph- A New Approach to Managing Operational Risk -Chapter 8 ERM-106-12: Economic Capital-Practical Considerations-Milliman Commentary on Question: Commentary listed underneath question component. Solution: (a) To acquire the data needed for your initial analysis, you meet with Bill, the Chief
Investigator of the CIU, and Tom, the head of JDY’s claims department. Bill and Tom use different criteria to identify fraudulent claims.
(i) Explain how the absence of a universal risk language may inhibit the
effectiveness of a company’s ERM framework.
(ii) Recommend effective risk management practices that should be adopted by JDY in order to ensure consistent reporting of fraudulent claims.
Commentary on Question: 3 coherent points for each part required for full credit. Other responses than those provided below could be valid. Responses for part (ii) needed to focus on the reporting of fraudulent claims to receive credit. No credit was provided for recommending generic ERM practices with no consideration of fraudulent claims or JDY. Part (i)
• Reinforces “silo approach” to risk management. • Inconsistent risk measurements may complicate risk aggregation. • Focus is on form over substance.
Part (ii)
• Develop standard templates to be used across the organization to ensure consistency.
• Assign a “risk owner” to aggregate data and report to management. • Clearly define what constitutes a fraudulent claim and how loss should be
reported.

ERM-GC Spring 2018 Solutions Page 3
1. Continued (b) JDY’s current economic capital level is maintained at a level such that, in a given
year, JDY will have no greater than a 0.5% chance of losses due to fraudulent claims exceeding capital held. You propose using the Actuarial Approach for modeling annual aggregate losses based on the data provided.
(i) Describe the three main components of an economic capital definition in
the context of JDY.
(ii) Recommend an appropriate distribution for modeling JDY’s frequency of fraudulent claims. Justify your response using the data provided.
(iii) Describe the key attributes of an appropriate distribution for modeling average loss amount for fraudulent claims for JDY.
Based on the proposed model, you perform 10,000 Monte Carlo simulations of future fraudulent claims activity and determine that the appropriate standalone economic capital is $35,700,000. JDY’s CEO comments that the economic capital amount seems excessive, but is satisfied that the work is complete and the requirements of Solvency II are met.
(iv) Describe the requirements of the CEIOPS Use Test pertaining of the use
of internal models for measuring economic capital that should be communicated to the CEO.
(v) Outline and explain the key considerations for incorporating fraudulent claims risk into JDY’s aggregate economic capital framework.
Commentary on Question: • Partial credit was provided for a list of the components for part (i) without
incorporating the context of JDY. Many candidates did not provide qualitative justification for frequency distribution.
• Credit was awarded for other distribution (e.g. negative binomial) with appropriate justification.
• Most candidates did not address requirements of the CEIPS Use Test that pertain to the CEO or senior management. Instead, most candidates focused on best practices for internal models
• The primary focus of part (v) was on correlation with other risks and how the correlation, if any, would be modeled.
ERM-GC Spring 2018 Solutions Page 4
1. Continued Part (i)
• Risk Measure: JDY uses the Value at Risk metric. • Probability Threshold: 99.5%. • Time Horizon: One Year.
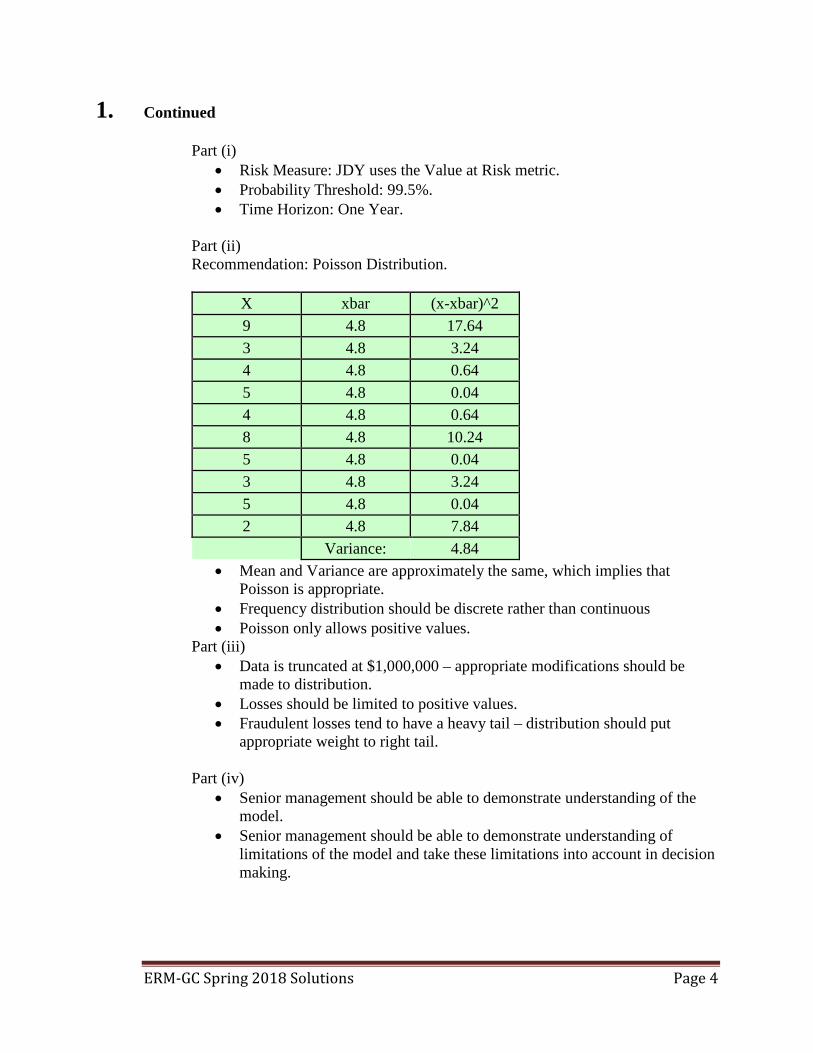
Part (ii) Recommendation: Poisson Distribution.
X xbar (x-xbar)^2 9 4.8 17.64 3 4.8 3.24 4 4.8 0.64 5 4.8 0.04 4 4.8 0.64 8 4.8 10.24 5 4.8 0.04 3 4.8 3.24 5 4.8 0.04 2 4.8 7.84
Variance: 4.84 • Mean and Variance are approximately the same, which implies that
Poisson is appropriate. • Frequency distribution should be discrete rather than continuous • Poisson only allows positive values.
Part (iii) • Data is truncated at $1,000,000 – appropriate modifications should be
made to distribution. • Losses should be limited to positive values. • Fraudulent losses tend to have a heavy tail – distribution should put
appropriate weight to right tail.
Part (iv) • Senior management should be able to demonstrate understanding of the
model. • Senior management should be able to demonstrate understanding of
limitations of the model and take these limitations into account in decision making.
ERM-GC Spring 2018 Solutions Page 5
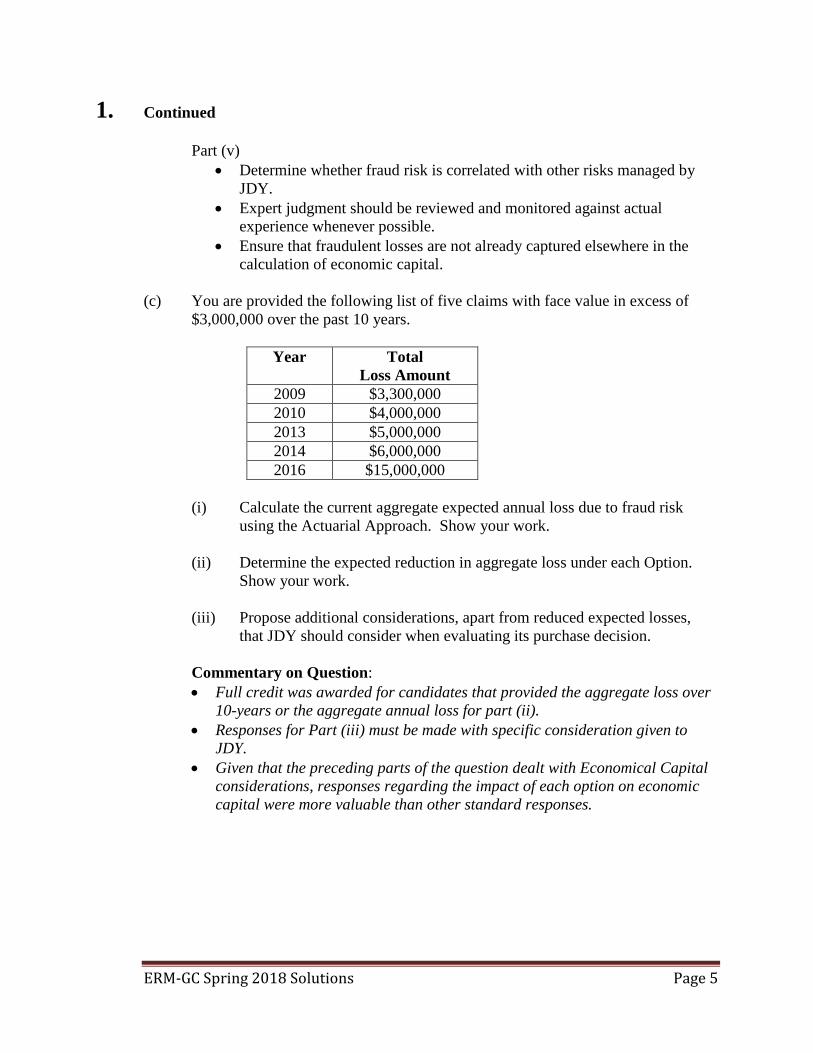
1. Continued Part (v)
• Determine whether fraud risk is correlated with other risks managed by JDY.
• Expert judgment should be reviewed and monitored against actual experience whenever possible.
• Ensure that fraudulent losses are not already captured elsewhere in the calculation of economic capital.
(c) You are provided the following list of five claims with face value in excess of
$3,000,000 over the past 10 years.
Year Total Loss Amount
2009 $3,300,000 2010 $4,000,000 2013 $5,000,000 2014 $6,000,000 2016 $15,000,000
(i) Calculate the current aggregate expected annual loss due to fraud risk
using the Actuarial Approach. Show your work.
(ii) Determine the expected reduction in aggregate loss under each Option. Show your work.
(iii) Propose additional considerations, apart from reduced expected losses, that JDY should consider when evaluating its purchase decision.
Commentary on Question: • Full credit was awarded for candidates that provided the aggregate loss over
10-years or the aggregate annual loss for part (ii). • Responses for Part (iii) must be made with specific consideration given to
JDY. • Given that the preceding parts of the question dealt with Economical Capital
considerations, responses regarding the impact of each option on economic capital were more valuable than other standard responses.
ERM-GC Spring 2018 Solutions Page 6
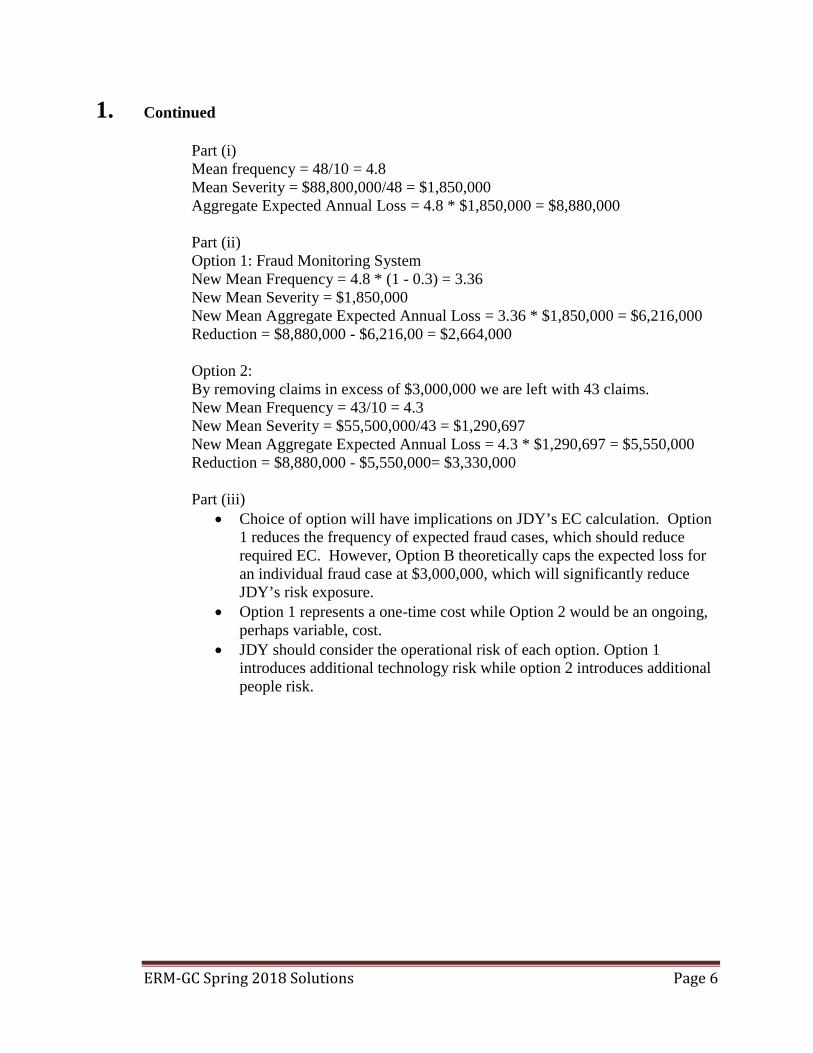
1. Continued Part (i) Mean frequency = 48/10 = 4.8 Mean Severity = $88,800,000/48 = $1,850,000 Aggregate Expected Annual Loss = 4.8 * $1,850,000 = $8,880,000 Part (ii) Option 1: Fraud Monitoring System New Mean Frequency = 4.8 * (1 - 0.3) = 3.36 New Mean Severity = $1,850,000 New Mean Aggregate Expected Annual Loss = 3.36 * $1,850,000 = $6,216,000 Reduction = $8,880,000 - $6,216,00 = $2,664,000 Option 2: By removing claims in excess of $3,000,000 we are left with 43 claims. New Mean Frequency = 43/10 = 4.3 New Mean Severity = $55,500,000/43 = $1,290,697 New Mean Aggregate Expected Annual Loss = 4.3 * $1,290,697 = $5,550,000 Reduction = $8,880,000 - $5,550,000= $3,330,000 Part (iii)
• Choice of option will have implications on JDY’s EC calculation. Option 1 reduces the frequency of expected fraud cases, which should reduce required EC. However, Option B theoretically caps the expected loss for an individual fraud case at $3,000,000, which will significantly reduce JDY’s risk exposure.
• Option 1 represents a one-time cost while Option 2 would be an ongoing, perhaps variable, cost.
• JDY should consider the operational risk of each option. Option 1 introduces additional technology risk while option 2 introduces additional people risk.

ERM-GC Spring 2018 Solutions Page 7
2. Learning Objectives: 2. The candidate will understand the concepts of risk modeling and be able to
evaluate and understand the importance of risk models. Learning Outcomes: (2e) Evaluate the theory and applications of extreme value theory in the measuring and
modeling of risk. (2g) Analyze and evaluate model and parameter risk. (2h) Construct approaches to modeling various risks and evaluate how an entity makes
decisions about techniques to model, measure and aggregate risks including but not limited to stochastic processes.
Sources: Article: Modeling Tail Behavior with Extreme Value Theory, Risk Management, Sept 2009 Article: Variance of the CTE Estimator, Risk Management, August 2008 SOA Monograph- A New Approach to Managing Operational Risk -Chapter 8 Commentary on Question: This question tests the candidate’s ability to apply extreme value theory to model operational risk, assess the precision of estimated capital requirement and evaluate the estimation method for a particular company. Candidates generally struggled with the calculation components of the question in parts (a)(i), (a)(ii), and (b)(i), and performed better with the explanation and recommendation components in parts (b)(iii), (c)(i), and (c)(ii). Solution: (a) You are simulating 1,000 values resulting from the entire CDF and you are given
the highest five numbers generated.
Rank Simulated value 996 0.9903 997 0.9913 998 0.9928 999 0.9955 1000 0.9983

ERM-GC Spring 2018 Solutions Page 8
2. Continued
(i) Demonstrate that k = - 0.247 and s = 251.
(ii) Calculate KTY’s economic capital using the simulation results. Show your work.
Commentary on Question: Part (a)(i) required the recollection and application of the formulas in the “Modeling Tail Behaviour with Extreme Value Theory” source reading. Many candidates failed to recall these formulas and struggled with these calculations. Part (a)(ii) required the application of the formulas provided in the question, along with the use of the simulated values to determine the economic capital at the CTE(99.8) level. Full credit was awarded for calculating the economic capital using either the last three data points (rank 998, 999, and 1,000) or the last two data points (rank 999 and 1,000). (i) u is set at the 70th percentile
x represents only those values in the distribution beyond the 70th percentile u = 6.0 �̅�𝑥 = 1
3∑ (𝑥𝑥 − 𝑢𝑢)31 = ((6-6) + (10-6) + (1000-6)) / 3 = 332.7
w = 1
3∑ (𝑥𝑥 − 𝑢𝑢)231 = ((6-6)2 + (10-6)2 + (1000-6)2) / 3 = 329,350.7
A = 332.72 / (329,350.7-332.72) = 0.5062 s = 0.5 * 332.7 * (1+0.5062) = 251 k = 0.5 * (0.5062-1) = - 0.247
(ii) F(x) = 0.7 + 0.3 * [1 - {1 + 0.247 * (x-6) / 251} ^ (1/(-0.247))]
Use the last two simulated values and F(x) to calculate CTE(99.8) 0.9955 = 0.7 + 0.3 * [1 - {1 + 0.247 * (X999-6) / 251} ^ {1/(-0.247)}] X999 = 1,857.17 0.9983 = 0.7 + 0.3 * [1 - {1 + 0.247 * (X1000-6) / 251} ^ {1/(-0.247)}] X1000 = 2,636.55 CTE(99.8) = (X999 + X1000) / 2 = (1,857.17 + 2,636.55) / 2 = 2,246.86
ERM-GC Spring 2018 Solutions Page 9
2. Continued
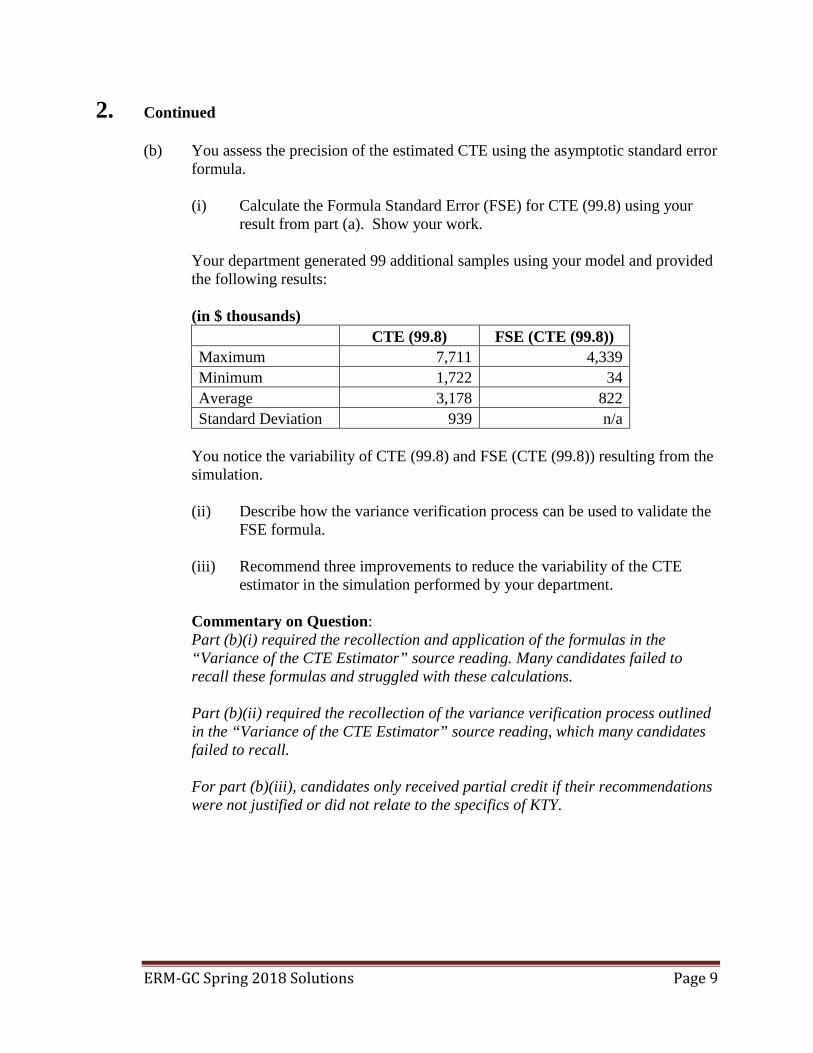
(b) You assess the precision of the estimated CTE using the asymptotic standard error formula.
(i) Calculate the Formula Standard Error (FSE) for CTE (99.8) using your
result from part (a). Show your work.
Your department generated 99 additional samples using your model and provided the following results:
(in $ thousands) CTE (99.8) FSE (CTE (99.8)) Maximum 7,711 4,339 Minimum 1,722 34 Average 3,178 822 Standard Deviation 939 n/a
You notice the variability of CTE (99.8) and FSE (CTE (99.8)) resulting from the simulation.
(ii) Describe how the variance verification process can be used to validate the
FSE formula.
(iii) Recommend three improvements to reduce the variability of the CTE estimator in the simulation performed by your department.
Commentary on Question: Part (b)(i) required the recollection and application of the formulas in the “Variance of the CTE Estimator” source reading. Many candidates failed to recall these formulas and struggled with these calculations. Part (b)(ii) required the recollection of the variance verification process outlined in the “Variance of the CTE Estimator” source reading, which many candidates failed to recall. For part (b)(iii), candidates only received partial credit if their recommendations were not justified or did not relate to the specifics of KTY.

ERM-GC Spring 2018 Solutions Page 10
2. Continued (i) Note: The formulas below refer to both Variance (VAR) and Value at Risk
(VaR). FSE{CTEn(α)} = SQRT[{VAR(X(1),…,X(k)) + α * (CTE(α)- X(k))2} / {n * (1- α)}] n = 1,000 α = 0.998 FSE{CTE(99.8)} = SQRT[{VAR(X999, X1000) + 0.998 * (CTE(99.8)-VaR(99.8))2} / {1000 * (1-0.998)}] VAR(X999, X1000) = [{X999 - AVG(X999, X1000)}2 + {X1000 - AVG(X999, X1000)}2] / 2 VAR(X999, X1000) = {(1,857.17-2,246.86)2 + (2,636.55-2,246.86)2) / 2 VAR(X999, X1000) = 151,858 VaR(99.8) = X998 0.9928 = 0.7 + 0.3 * [1 - {1 + 0.247 * (X998-6) / 251} ^ (1/(-0.247))] VaR(99.8) = X998 = 1,542.89 FSE(CTE(99.8)) = SQRT[{151,858 + 0.998 * (2,246.86 – 1,542.89)2} / {1000 * (1-0.998)}] FSE(CTE(99.8)) = 568.52
(ii) 1) Generate a large sample (say 5000) from the GPD CDF.
2) Choose as a subset M sub-samples of size N without replacement. 3) Calculate CTE and FSE for each of the M samples and check if the best answer lies in the approximate confidence interval for CTE(99.8). 4) Use the standard deviation of the CTE in step 3 to validate the asymptotic formula.
(iii) 1) Increase simulation sample size: Using only 1,000 values is likely to
create bias and large standard errors as we compare the average FSE standard deviation of CTE(99.8). 2) Use variance reduction techniques: Variance reduction tools such as importance sampling and control variate methods can be adapted to the CTE problem to improve the precision of the CTE estimator.
ERM-GC Spring 2018 Solutions Page 11
2. Continued 3) Change the actual sampling distribution: The Generalized Pareto Distribution may be too heavy tailed or the threshold u may be too low to accurately estimate the tail parameters. Increasing the number of observations used to estimate the tail parameters or trying to fit a different distribution (e.g. Burr, Lognormal) may reduce the variability.
(c) KTY received news that an industry peer recently paid a $100 million settlement.
KTY’s CRO is concerned that the capital level produced by your model grossly underestimates potential losses.
(i) Explain why the CRO’s concern is appropriate.
(ii) Recommend how you would improve operational risk modeling to address
the issue raised by the CRO.
Commentary on Question: Candidates generally performed well on this part of the question. Only partial credit was awarded if candidates failed to apply their response to the specifics of operational risk or to KTY’s specific situation. (i) Measuring operational risk metrics requires the estimation of low
frequency/high severity events. KTY internal data may not have enough data points to capture the low frequency/high severity events with only ten years of historical data. Given the small size of KTY, its internal data may lack the information on the true severity of claims. This information is crucial for the actuarial approach and is helpful to alleviate the data scarcity problem.
(ii) Use external data to capture additional extreme settlement events from
larger companies as we are interested in only the most severe losses. External data may also reveal the true expected frequency/severity of claim events given appropriate considerations based on KTY's smaller size. Use soft data based on empirical observation of industry settlements to provide a useful proxy for operational risk analysis. Incorporate stress testing where different scenarios could reflect potential extreme settlement amounts not available with external data.

ERM-GC Spring 2018 Solutions Page 12
3. Learning Objectives: 4. The candidate will understand the approaches for managing risks and how an
entity makes decisions about appropriate techniques. 5. The candidate will understand the concept of economic capital, risk measures in
capital assessment and techniques to allocate the cost of risks within business units.
Learning Outcomes: (4h) Analyze funding and portfolio management strategies to control equity and
interest rate risk, including key rate risks. Contrast the various risk measures and be able to apply these risk measures to various entities. Explain the concepts of immunization including modern refinements and practical limitations.
(5a) Describe the concepts of measures of value and capital requirements (for
example, EVA, embedded value, economic capital, regulatory measures, and accounting measures) and demonstrate their uses in the risk management and corporate decision-making processes.
Sources: ERM-111-12: Key Rate Durations: Measures of Interest Rate Risks Risk Appetite: Linkage with Strategic Planning Report Commentary on Question: This question tests the candidate’s knowledge on how to calculate Interest CaR (capital at risk) and Total CaR, and on employing strategies on controlling the former. Overall, candidates performed better in part (a) than in part (b). Many did not “critique” and did not “justify” sufficiently to receive marks, and they received partial marks depending on the quality of their answers. Solution: (a)
(i) Determine whether the company is within its current risk appetite limit under this stress scenario. Show your work.
(ii) You noticed that the following stress scenario was once employed in the past.
Interest Rate Scenario
Change in Yield Curve 5 year 10 year 20 year
99.5th percentile -2% -2% -2% Describe the shortcomings of this stress scenario relative to the original scenario.
ERM-GC Spring 2018 Solutions Page 13
3. Continued
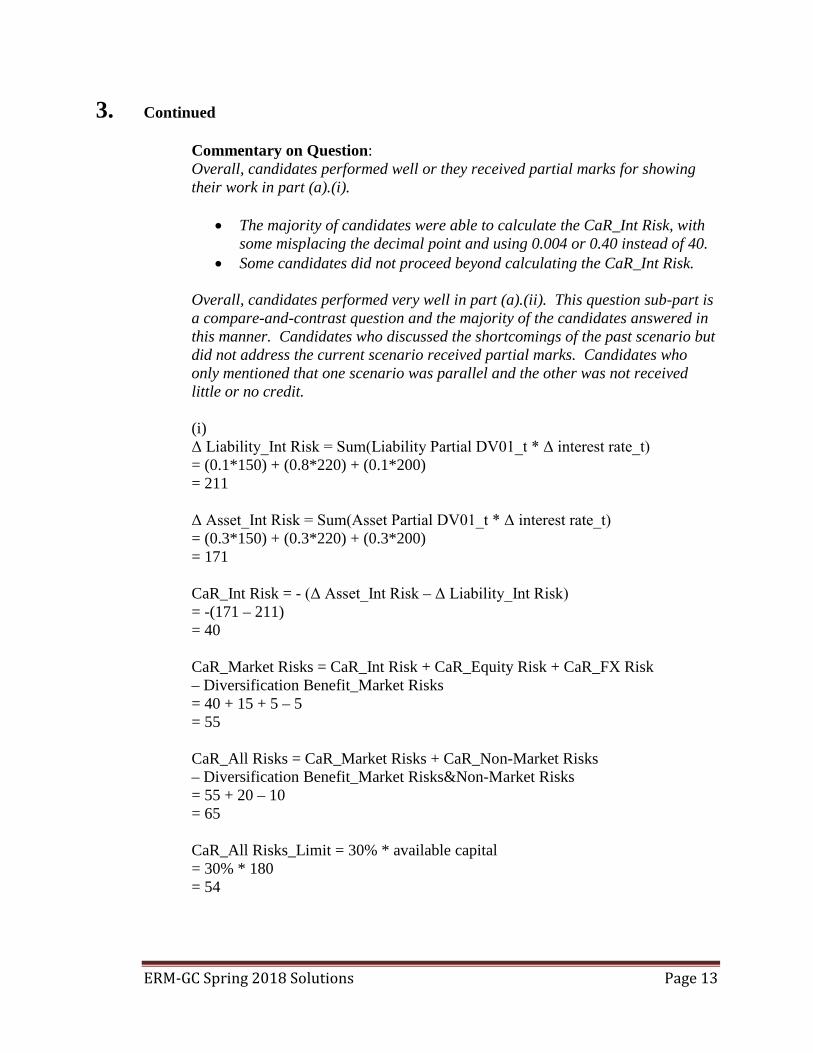
Commentary on Question: Overall, candidates performed well or they received partial marks for showing their work in part (a).(i).
• The majority of candidates were able to calculate the CaR_Int Risk, with some misplacing the decimal point and using 0.004 or 0.40 instead of 40.
• Some candidates did not proceed beyond calculating the CaR_Int Risk.
Overall, candidates performed very well in part (a).(ii). This question sub-part is a compare-and-contrast question and the majority of the candidates answered in this manner. Candidates who discussed the shortcomings of the past scenario but did not address the current scenario received partial marks. Candidates who only mentioned that one scenario was parallel and the other was not received little or no credit. (i) Δ Liability_Int Risk = Sum(Liability Partial DV01_t * Δ interest rate_t) = (0.1*150) + (0.8*220) + (0.1*200) = 211 Δ Asset_Int Risk = Sum(Asset Partial DV01_t * Δ interest rate_t) = (0.3*150) + (0.3*220) + (0.3*200) = 171 CaR_Int Risk = - (Δ Asset_Int Risk – Δ Liability_Int Risk) = -(171 – 211) = 40 CaR_Market Risks = CaR_Int Risk + CaR_Equity Risk + CaR_FX Risk – Diversification Benefit_Market Risks = 40 + 15 + 5 – 5 = 55 CaR_All Risks = CaR_Market Risks + CaR_Non-Market Risks – Diversification Benefit_Market Risks&Non-Market Risks = 55 + 20 – 10 = 65 CaR_All Risks_Limit = 30% * available capital = 30% * 180 = 54
ERM-GC Spring 2018 Solutions Page 14
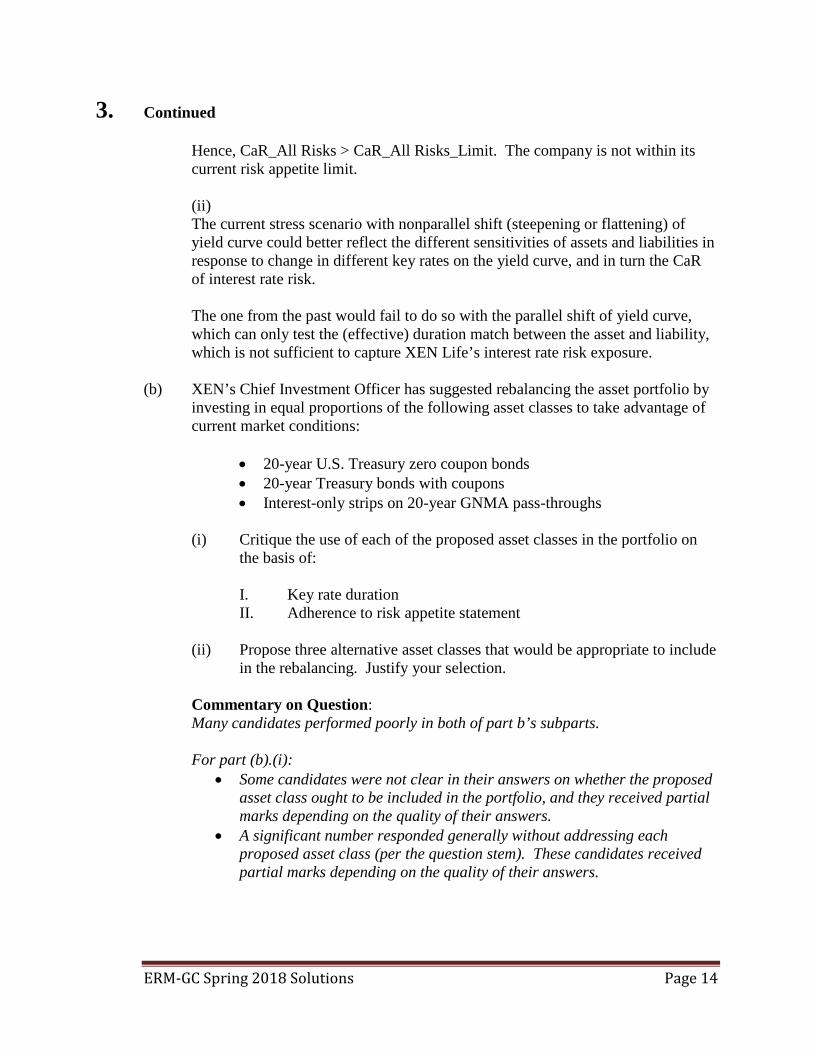
3. Continued Hence, CaR_All Risks > CaR_All Risks_Limit. The company is not within its current risk appetite limit. (ii) The current stress scenario with nonparallel shift (steepening or flattening) of yield curve could better reflect the different sensitivities of assets and liabilities in response to change in different key rates on the yield curve, and in turn the CaR of interest rate risk. The one from the past would fail to do so with the parallel shift of yield curve, which can only test the (effective) duration match between the asset and liability, which is not sufficient to capture XEN Life’s interest rate risk exposure.
(b) XEN’s Chief Investment Officer has suggested rebalancing the asset portfolio by
investing in equal proportions of the following asset classes to take advantage of current market conditions:
• 20-year U.S. Treasury zero coupon bonds • 20-year Treasury bonds with coupons • Interest-only strips on 20-year GNMA pass-throughs
(i) Critique the use of each of the proposed asset classes in the portfolio on the basis of:
I. Key rate duration II. Adherence to risk appetite statement
(ii) Propose three alternative asset classes that would be appropriate to include
in the rebalancing. Justify your selection.
Commentary on Question: Many candidates performed poorly in both of part b’s subparts. For part (b).(i):
• Some candidates were not clear in their answers on whether the proposed asset class ought to be included in the portfolio, and they received partial marks depending on the quality of their answers.
• A significant number responded generally without addressing each proposed asset class (per the question stem). These candidates received partial marks depending on the quality of their answers.
ERM-GC Spring 2018 Solutions Page 15
3. Continued
• Some candidates interpreted that the rebalancing was a replacement of the entire portfolio with the three named asset classes, while others interpreted that new money investment would be on these three asset classes. Points were given for either interpretation, depending on the quality of the answers.
• A significant number did not understand the properties of interest-only strips.
For part b.(ii):
• Some candidates merely listed asset classes and did not provide justification. These candidates received no marks.
• Some candidates proposed more than three asset classes. Only the first three asset classes written were graded. The remainder did not receive marks.
(i) 1. 20-year U.S. Treasury zero coupon bonds This asset class would have a duration of nearly 20 because their only payment is the principal at the end of the 20th year. Therefore, to have such a high concentration of them in the portfolio would not help align the durations of assets and liabilities. For the risk statement, these assets expose the portfolio to greater volatility in asset values and hence surplus, so it would not be useful to have such a high concentration. 2. 20-year U.S.Treasury bonds with coupons This asset class would have a duration lower than the zero-coupon bonds noted above, so some amount of them would be useful in the portfolio despite the large maturity payment. Likewise, they are not nearly as volatile when interest rates change so, by themselves, they should not create issues with the risk appetite in the absence of very large interest rate changes. One drawback to using them is that, with a 20-year maturity, they would not be perfect for a liability with a 10-year maturity. 3. Interest-only strips on 20-year GNMA pass-throughs This asset class would likely have negative key rate durations at many maturities as well as a negative effective duration, making them a poor choice for the portfolio in any amount. Adherence to the risk appetite statement would be a problem: with such a large proportion, they would act contrary to almost any other asset class and would decline in value during interest rate decreases and cause problems.

ERM-GC Spring 2018 Solutions Page 16
3. Continued (ii) 1. Ten-year U.S. Treasury zero coupon bonds - some amount of this security would be appropriate because the bulk of the liability key rate duration is concentrated at 10 years, similar to a 10-year zero coupon. 2. 20-year GNMA pass-through securities - the distribution of key rate durations will have a bell-shaped pattern for this security. This is similar to the liability key rate duration although the patterns won't be identical. 3. 20-year callable corporate bonds - the distribution of key rate durations will have a bell-shaped pattern for this security. The exact pattern, and hence the degree to which it should be used, will depend on the coupon rate: lower coupon rates will cause the key rates to be skewed more to later durations.

ERM-GC Spring 2018 Solutions Page 17
4. Learning Objectives: 4. The candidate will understand the approaches for managing risks and how an
entity makes decisions about appropriate techniques. Learning Outcomes: (4d) Demonstrate how derivatives, synthetic securities, and financial contracting may
be used to reduce risk or to assign it to the party most able to bear it. (4e) Develop an appropriate choice of a risk mitigation strategy for a given situation
(e.g., reinsurance, derivatives, financial contracting), which balances benefits with inherent costs, including exposure to credit risk, basis risk, moral hazard and other risks.
(4g) Demonstrate the use of tools and techniques for analyzing and managing credit
and counterparty risk. Sources: ERM-124-15: Counterparty Credit Risk, First Edition, Jon Gregory, Chapter 2: Defining Counterparty Credit Risk ERM-128-17: The Breadth and Scope of the Global Reinsurance Market and the Critical Role Such Market Plays in Supporting Insurance in the United States, Ch. III, IV, and VI Commentary on Question: Candidates generally got at least partial credit on this question. Solution: (a) Recommend a quota share reinsurance agreement that allows XYZ to achieve a
ratio of 4:1. Commentary on Question: Candidates generally did well on this. Assuming the maximum gross premium is X, in order to maintain 4:1 NWP to PHS ratio, the following needs to hold: 100*(1 – X%) / 20 = 4 Solve for X to get X% = 20% Therefore, under a 20% quota share reinsurance agreement, XYZ can maintain the required ratio.

ERM-GC Spring 2018 Solutions Page 18
4. Continued (b) A natural disaster recently occurred, and all the major reinsurance companies in
the market now have much lower capacity to write new business.
(i) Describe how each of the following three alternative reinsurance instruments could address this situation. Justify your response.
I. Catastrophe (cat) bond II. Sidecar III. Industry Loss Warranty (ILW)
(ii) Recommend the best option for XYZ. Justify your response.
XYZ decides to issue catastrophe (cat) bonds with an industry loss trigger.
(iii) Describe the risks to which investors of these bonds are exposed.
Commentary on Question: • For Part (i), candidates did not get full credit if they only described the
structures and did not explain how they could be applied in this situation. • For Part (ii), partial credit was awarded if candidates provided reasonable
support for the other potential recommendations. • For Part (iii):
1. Many candidates skipped this part of the question. 2. Candidates who answered this part often mentioned Counterparty or
Credit Risk, but Cat Bonds are set up through SPVs, which would be fully collateralized and minimize the counterparty risk.
(i) Cat Bond could address the situation because it is collateralized, and
therefore reduces credit risk. It also enhances the predictability of reinsurance costs because the bond term is typically several years. Sidecar could address the situation because it provides an additional source of reinsurance when the reinsurance market has limited capital, and therefore allows an insurer to write more business at a time when rates are high. Industry Loss Warranty (ILW) could address the situation as it offers low transaction costs because the payout is linked to an industry loss figure, not the specific portfolio of the insurer, so it may be a more affordable solution to catastrophe protection.
ERM-GC Spring 2018 Solutions Page 19
4. Continued
(ii) Recommend sidecar as the most appropriate solution because: • It is a temporary reinsurance vehicle that shares premiums and
losses on a pro-rata basis, which XYZ is looking for. • It is generally used for business associated with catastrophe risk,
which is the current situation. • It provides an additional source of reinsurance when the
reinsurance market has limited capital, which is the current situation.
(iii) Catastrophe risk: the risk that investors could receive less than the bond’s principle at maturity if a catastrophe occurs. Asymmetric information/moral hazard: the risk that bond issuers and purchasers disagree on the insured loss incurred by the insurance, which could include the risk of setting a non-standard indemnity trigger (bond issuers understand their business better than the purchasers of the bond).
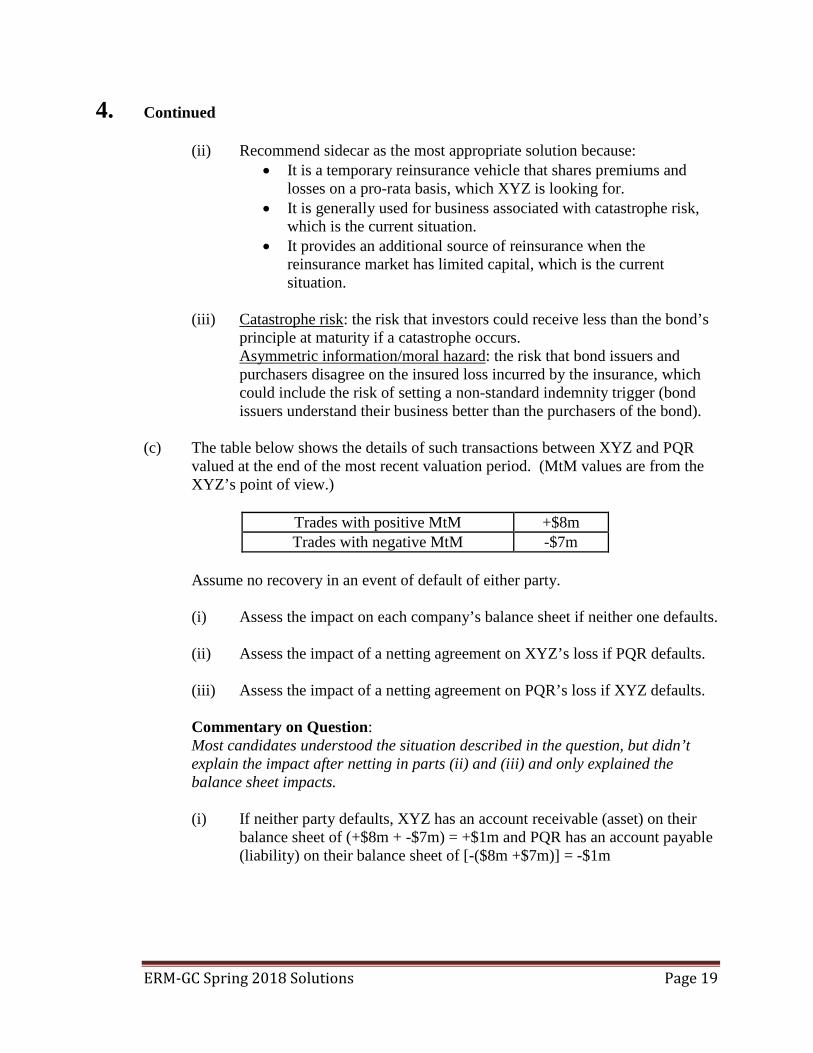
(c) The table below shows the details of such transactions between XYZ and PQR
valued at the end of the most recent valuation period. (MtM values are from the XYZ’s point of view.)
Trades with positive MtM +$8m Trades with negative MtM -$7m
Assume no recovery in an event of default of either party.
(i) Assess the impact on each company’s balance sheet if neither one defaults.
(ii) Assess the impact of a netting agreement on XYZ’s loss if PQR defaults.
(iii) Assess the impact of a netting agreement on PQR’s loss if XYZ defaults.
Commentary on Question: Most candidates understood the situation described in the question, but didn’t explain the impact after netting in parts (ii) and (iii) and only explained the balance sheet impacts. (i) If neither party defaults, XYZ has an account receivable (asset) on their
balance sheet of (+$8m + -$7m) = +$1m and PQR has an account payable (liability) on their balance sheet of [-($8m +$7m)] = -$1m
ERM-GC Spring 2018 Solutions Page 20
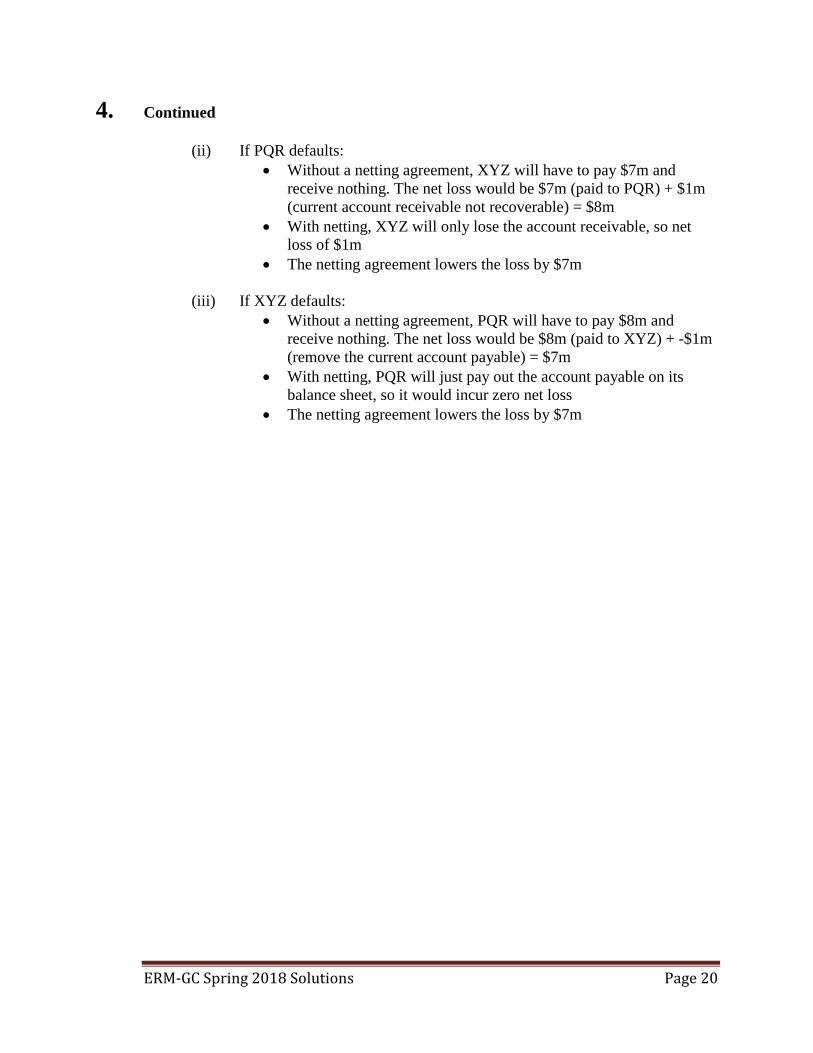
4. Continued
(ii) If PQR defaults: • Without a netting agreement, XYZ will have to pay $7m and
receive nothing. The net loss would be $7m (paid to PQR) + $1m (current account receivable not recoverable) = $8m
• With netting, XYZ will only lose the account receivable, so net loss of $1m
• The netting agreement lowers the loss by $7m
(iii) If XYZ defaults: • Without a netting agreement, PQR will have to pay $8m and
receive nothing. The net loss would be $8m (paid to XYZ) + -$1m (remove the current account payable) = $7m
• With netting, PQR will just pay out the account payable on its balance sheet, so it would incur zero net loss
• The netting agreement lowers the loss by $7m
ERM-GC Spring 2018 Solutions Page 21
5. Learning Objectives: 2. The candidate will understand the concepts of risk modeling and be able to
evaluate and understand the importance of risk models. 3. The candidate will understand how the risks faced by an entity can be quantified
and the use of metrics to measure risk. Learning Outcomes: (2b) Evaluate how risks are correlated, and give examples of risks that are positively
correlated and risks that are negatively correlated. (3a) Apply and construct risk metrics to quantify major types of risk exposure such as
market risk, credit risk, liquidity risk, regulatory risk, etc., and tolerances in the context of an integrated risk management process.
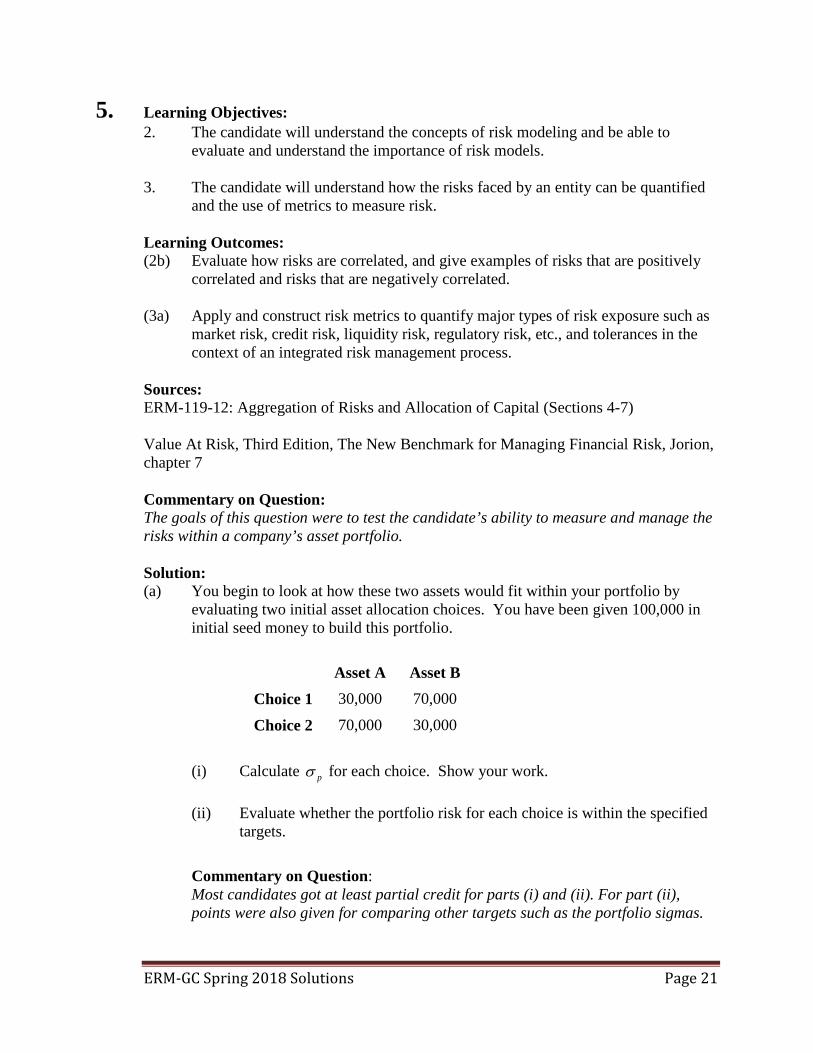
Sources: ERM-119-12: Aggregation of Risks and Allocation of Capital (Sections 4-7) Value At Risk, Third Edition, The New Benchmark for Managing Financial Risk, Jorion, chapter 7 Commentary on Question: The goals of this question were to test the candidate’s ability to measure and manage the risks within a company’s asset portfolio. Solution: (a) You begin to look at how these two assets would fit within your portfolio by
evaluating two initial asset allocation choices. You have been given 100,000 in initial seed money to build this portfolio.
Asset A Asset B
Choice 1 30,000 70,000
Choice 2 70,000 30,000
(i) Calculate pσ for each choice. Show your work.
(ii) Evaluate whether the portfolio risk for each choice is within the specified targets.
Commentary on Question: Most candidates got at least partial credit for parts (i) and (ii). For part (ii), points were also given for comparing other targets such as the portfolio sigmas.

ERM-GC Spring 2018 Solutions Page 22
5. Continued Part (a)(i) Use portfolio risk formula Portfolio Risk = ((wA^2)*(SigmaA^2)) + ((wB^2)*(SigmaB^2)) + 2*(wA)*(wB)*CorrelationAB* SigmaA* SigmaB
= ((wA^2)*(0.16^2)) + ((wB^2)*(0.12^2)) + 2*(wA)*(wB)*0.6*0.16*0.12 Sigma for Portfolio Choice 1 = square root (0.01420) = 11.92% Sigma for Portfolio Choice 2 = square root (0.01868) = 13.67%
Part (a)(ii) VaR of Choice 1 = 1.6449*(square root of 0.01420)*100,000 = 19,600 VaR of Choice 2 = 1.6449*(square root of 0.01868)*100,000 = 22,481 Thus, both of these choices are acceptable because portfolio VaR has to be less than 25% of the total portfolio value, or 25,000
(b) You ultimately decide on a third choice (shown as “Original” below), hoping to
emphasize Asset A’s favorable return. After you make this investment, your manager asks you to determine the change in VaR that would result if $10,000 were transferred from Asset B to Asset A (shown as “Alternate” below).
(i) Calculate the change in Absolute Portfolio VaR for each investment choice using incremental VaR. Show your work.
(ii) Calculate the change in Absolute Portfolio VaR for each investment choice using marginal VaR. Show your work.
(iii) Assess whether marginal VaR or incremental VaR is more appropriate in evaluating the investment choices. Justify your response.
(iv) Propose which of the two investment choices (Original vs. Alternate) you would recommend to management. Justify your response.
Investment Choice
Asset A Allocation
Asset B Allocation σp
Original 80,000 20,000 14.35% Alternate 90,000 10,000 15.17%

ERM-GC Spring 2018 Solutions Page 23
5. Continued
Commentary on Question: There were a wide range of scores on each part of this question. • For Part b(i), some candidates tried to incorporate the split in the portfolios
between assets A and B into the calculation when only the total portfolio amount was relevant.
• For Part b(ii), some candidates tried incorporating the Alternate portfolio amounts into the calculation when only the Original portfolio was relevant. Results within a reasonable range were accepted for credit due to rounding of some of the intermediate numbers.
• For Part b(iii), a majority of candidates received partial credit for explaining distinctions between marginal and incremental VaR.
• For Part b(iv), candidates received some credit if their argument in favor of one approach or the other was supported by a reasonable explanation.
Part (b)(i) VaR = alpha * SigmaPortfolio * W VaR for Original Choice = 1.6445 * 14.35% * 100,000 = 23,604 VaR for Alternate Choice = 1.6445 * 15.17% * 100,000 = 24,953 Incremental VaR = 24,953 – 23,604 = 1,349
Part (b)(ii) 1. Calculate covariance of assets A and B:
CovA,B = (Correlation coefficient for A and B) * SigmaA* SigmaB = (0.6) * (0.16) * (0.12) = 0.01152
2. Determine covariance of asset A and Original portfolio:
CovA,Portfolio = (wA * VarianceA) + (wB * CovA,B) = [(0.8)*(0.16^2)] + [(0.2)*(0.01152)] = 0.02048 + 0.002304 = 0.022784
3. Determine covariance of asset B and Original portfolio: CovB,Portfolio = (wB * VarianceB) + (wA * CovA,B) = [(0.2)*(0.12^2)] + [(0.8)*(0.01152)] = 0.00288 + 0.009216
= 0.012096 4. Determine marginal VaR for asset A
Marginal VaRA = [alpha * CovA,Portfolio] / SigmaPortfolio
= [1.6445 * .022784] / 0.1435 = 0.26110
ERM-GC Spring 2018 Solutions Page 24
5. Continued
5. Determine marginal VaR for asset B Marginal VaRB = [alpha * CovB,Portfolio] / SigmaPortfolio
= [1.6445 * .012096] / 0.1435 = 0.13862
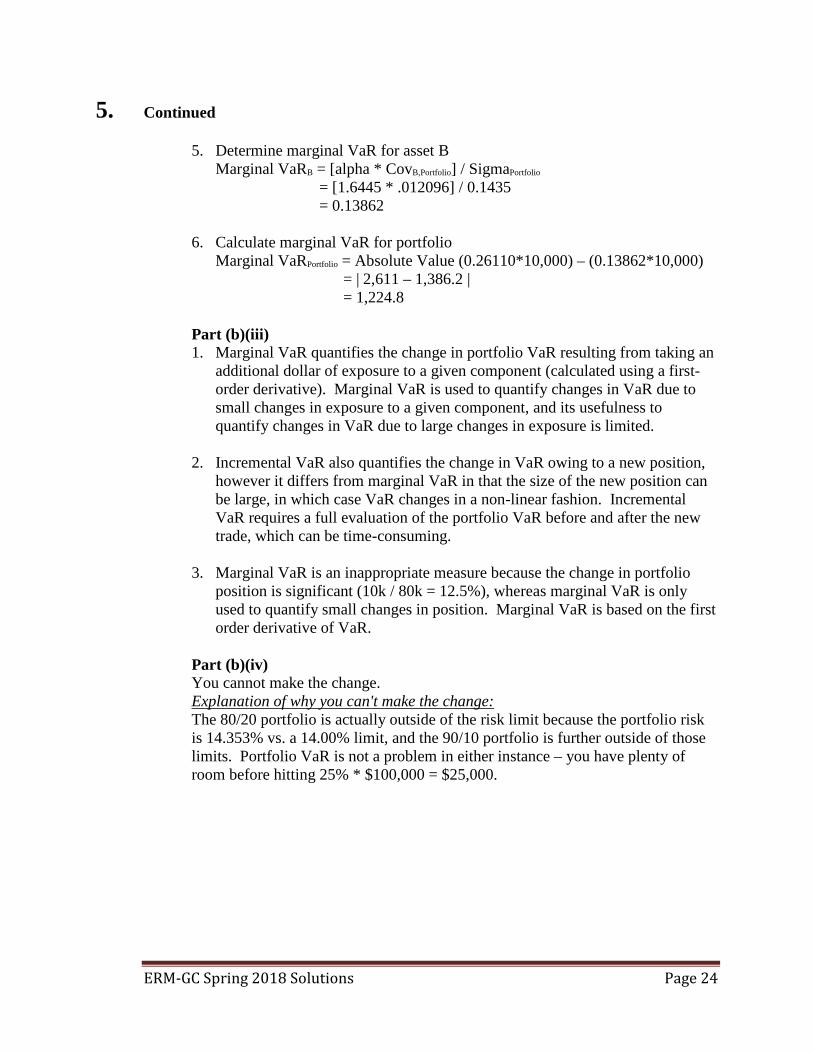
6. Calculate marginal VaR for portfolio Marginal VaRPortfolio = Absolute Value (0.26110*10,000) – (0.13862*10,000) = | 2,611 – 1,386.2 | = 1,224.8
Part (b)(iii) 1. Marginal VaR quantifies the change in portfolio VaR resulting from taking an
additional dollar of exposure to a given component (calculated using a first-order derivative). Marginal VaR is used to quantify changes in VaR due to small changes in exposure to a given component, and its usefulness to quantify changes in VaR due to large changes in exposure is limited.
2. Incremental VaR also quantifies the change in VaR owing to a new position, however it differs from marginal VaR in that the size of the new position can be large, in which case VaR changes in a non-linear fashion. Incremental VaR requires a full evaluation of the portfolio VaR before and after the new trade, which can be time-consuming.
3. Marginal VaR is an inappropriate measure because the change in portfolio
position is significant (10k / 80k = 12.5%), whereas marginal VaR is only used to quantify small changes in position. Marginal VaR is based on the first order derivative of VaR.
Part (b)(iv) You cannot make the change. Explanation of why you can't make the change: The 80/20 portfolio is actually outside of the risk limit because the portfolio risk is 14.353% vs. a 14.00% limit, and the 90/10 portfolio is further outside of those limits. Portfolio VaR is not a problem in either instance – you have plenty of room before hitting 25% * $100,000 = $25,000.
ERM-GC Spring 2018 Solutions Page 25
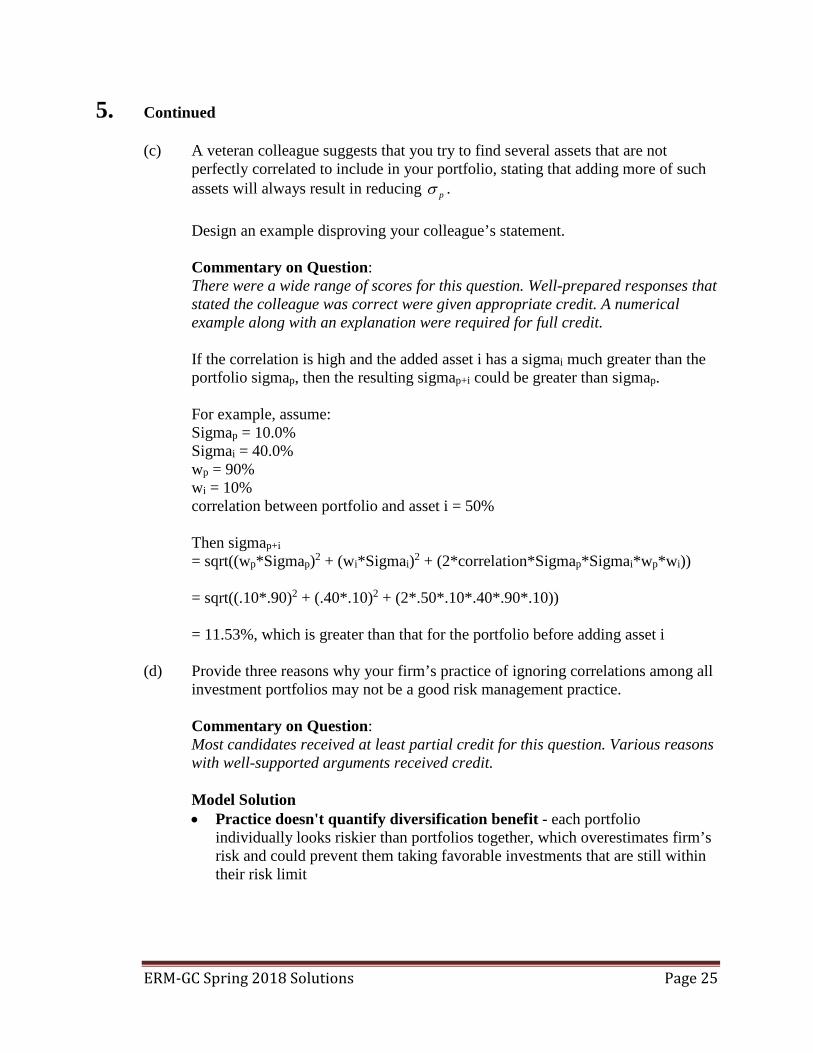
5. Continued (c) A veteran colleague suggests that you try to find several assets that are not
perfectly correlated to include in your portfolio, stating that adding more of such assets will always result in reducing pσ .
Design an example disproving your colleague’s statement.
Commentary on Question: There were a wide range of scores for this question. Well-prepared responses that stated the colleague was correct were given appropriate credit. A numerical example along with an explanation were required for full credit. If the correlation is high and the added asset i has a sigmai much greater than the portfolio sigmap, then the resulting sigmap+i could be greater than sigmap. For example, assume: Sigmap = 10.0% Sigmai = 40.0% wp = 90% wi = 10% correlation between portfolio and asset i = 50% Then sigmap+i = sqrt((wp*Sigmap)2 + (wi*Sigmai)2 + (2*correlation*Sigmap*Sigmai*wp*wi)) = sqrt((.10*.90)2 + (.40*.10)2 + (2*.50*.10*.40*.90*.10)) = 11.53%, which is greater than that for the portfolio before adding asset i
(d) Provide three reasons why your firm’s practice of ignoring correlations among all investment portfolios may not be a good risk management practice.
Commentary on Question: Most candidates received at least partial credit for this question. Various reasons with well-supported arguments received credit. Model Solution • Practice doesn't quantify diversification benefit - each portfolio
individually looks riskier than portfolios together, which overestimates firm’s risk and could prevent them taking favorable investments that are still within their risk limit

ERM-GC Spring 2018 Solutions Page 26
5. Continued
• Liquidity - becomes cumbersome to evaluate overall liquidity, because different assets will have different liquidity characteristics and because it will be difficult to know which assets to sell if liquidity needs arise ahead of time (due to tax implications, future performance expectations, etc.)
• Overconcentration - managers may invest in same assets (industries, sectors, counterparties, etc.) without knowing it
(e) After raising concerns about your firm’s practice of ignoring correlations among
all investment portfolios, you have been tasked with preparing a descriptive report of the correlation between your two technology-related holdings and the firm’s other large asset holdings (listed below).
I. ABC Aviation – a pioneer in high-end drone technology who has only
recently become widely known. Seeking investors to help scale operations and bring its most successful prototype to retail stores by the end of the year.
II. FGH Tax Advisory LLC – a small consulting group which has specialized in helping state governments structure their tax policies. Seeking additional investment to fund the acquisition of a similar firm which specializes in consulting about federal taxation policy.
III. UVW Manufacturing – a small manufacturing company specializing in home door and entryway construction. Seeking investors to fund a major factory expansion to enable marketing to American consumers.
Provide qualitative observations, for each of the three firms, about the correlation between your two technology-related holdings and each firm in the event of a broad economic recession.
Commentary on Question: Candidates generally did well on this question. A wide range of answers were accepted for credit as long as there was a reasonable supporting argument. Model Solution ABC Aviation a. Heavy technology-based business model that may get dragged down with
defaults in tech specialties. b. Both tech firms and aviation firm produce high-end consumer goods – sales
likely to suffer if broader economy suffers, and tech industry is highly correlated with broader economy.
ERM-GC Spring 2018 Solutions Page 27
5. Continued
FGH Tax Advisory LL a. State governments will have less money to spend on consulting services
during economically tough times because of lower tax revenues and increased welfare and assistance program spending.
b. At the same time States may need to prioritize tax policy when tax revenues are lower, isolating FGH from the recession somewhat.
UVW Manufacturing a. Housing purchases are highly correlated with broader economic stability, and
tech industry is highly correlated with broader economy. b. UVW does not have significant intellectual property, so value of firm is
almost entirely dependent on manufacturing sales.

ERM-GC Spring 2018 Solutions Page 28
6. Learning Objectives: 1. The candidate will understand the types of risks faced by an entity and be able to
identify and analyze these risks. 2. The candidate will understand the concepts of risk modeling and be able to
evaluate and understand the importance of risk models. 3. The candidate will understand how the risks faced by an entity can be quantified
and the use of metrics to measure risk. 4. The candidate will understand the approaches for managing risks and how an
entity makes decisions about appropriate techniques. Learning Outcomes: (1c) Identify and assess the potential impact of risks faced by an entity, including but
not limited to market risk, currency risk, credit risk, counterparty risk, spread risk, liquidity risk, interest rate risk, equity risk, hazard/insurance risk, inflationary risk, environmental risk, pricing risk, product risk, operational risk, project risk and strategic risk.
(2d) Apply and analyze scenario and stress testing in the risk measurement process. (3d) Analyze risks that are not easily quantifiable, such as operational and liquidity
risks. (4j) Demonstrate risk management strategies for other key risks (for example,
operational, strategic, legal, and insurance risks).
(4k) Apply best practices in risk measurement, modeling and management of various financial and non-financial risks faced by an entity.
Sources: Financial Enterprise Risk Management, Sweeting, 2011, Ch. 14 Quantifying Particular Risks Value-at- Risk, Third Edition, The New Benchmark for Managing Financial Risk, Jorion Ch. 13 Liquidity Risk Risk Appetite: Linkage with Strategic Planning Report ERM-120-14: IAA Note on Stress Testing and Scenario Analysis (pp. 1-6 and 14-17)
ERM-GC Spring 2018 Solutions Page 29
6. Continued Commentary on Question: The question tests both theoretical and practical considerations about liquidity risk in the context of company ABC. In particular, questions are asked about the main components of liquidity and their potential interaction, as well as how liquidity risk should be integrated into a risk appetite statement. In addition, the candidate is asked to assess the potential impact of various scenarios on the liquidity position of the firm, considering both modeled and non-modeled risks. In order to obtain maximum points for this question, candidates were required to not only to provide valid answers to each question, but also demonstrate an understanding of this topic in the specific context of ABC. Solution: (a)
(i) Describe the two primary components of liquidity risk. (ii) Explain how the interaction of these components might impact the net
liquidity position of ABC.
Commentary on Question: Most candidates answered (i) correctly. For (ii), maximum points were given to candidates who explained how the interaction between liquidity of the assets and liquidity of the liabilities impacted the overall liquidity position in the context of ABC. Many candidates provided valid theoretical statements but did not relate them directly to the company.
(i) There are the two main components.
• Asset liquidity risk. Asset liquidity risk refers to the marketability and the ability of an asset to be converted to a fluctuating cash value as needed without affecting its underlying value. The depth of the secondary market affects its liquid value, which is often referred as “bid-ask spread”.
• Liability or Funding liquidity risk. This risk refers to the fluctuating of cash demands on a company originating from the liability side of the balance sheet. The demand for liquid funds can originate from purely financial funding from both on- and off-balance sheet funding instruments or, in the case of insurance companies, from embedded features/options in insurance/annuity products.
ERM-GC Spring 2018 Solutions Page 30
6. Continued
(ii) Conceptually, given a set of events, internal and/or external, assets liquidity will vary according to its own dynamic – asset liquidity risk. This is particularly relevant at ABC given the high percentage of assets held in investment-grade securities and private placements. In addition, ABC’s stated objective of Buy and Hold might be affected if necessary.
At the same time, liabilities will exhibit a behavior of their own. For example, during extreme situations surrenders and lapses on long-term life policies and leases will have a major impact on ABC financial condition, particularly in the medium term. For GICs, the impact might be more important in the short-term but represent a lower percentage of ABC's overall liability. Lines of credit, both availability and cost, will react more quickly. The impact of the sales force might exacerbate the problem.
Globally, ABC's net overall liquidity position will be affected, particularly in the medium term since there is an imbalance as seen on the balance sheet.
(b) You’ve been asked to develop ABC’s liquidity risk appetite statement.
(i) Describe four considerations you would take into account. (ii) Outline an appropriate liquidity risk appetite statement for ABC.
Commentary on Question: Part (i) focused on the general and theoretical considerations that pertain to a liquidity risk appetite statement appropriate for ABC. In order to obtain maximum points, candidates were required to not only list valid considerations, but also had to describe how they relate to ABC. Many candidates failed to relate their responses to ABC.
Part (ii) required candidates to draft a liquidity risk appetite statement based on the four relevant considerations outlined in (i). Few candidates were capable of proposing a valid statement that was relevant to ABC and that was in line with their response to (i).
ERM-GC Spring 2018 Solutions Page 31
6. Continued (i)
• The statement should qualitatively describe the aspects of ABC’s operations – assets, liabilities, products – that should be included in the definition of liquidity risk. This should include the level of Board oversight and monitoring activities.
Although ABC seems to be in equilibrium in the short-term, only focusing its liquidity statement on this aspect would be misleading. For example, a high percentage of assets are maintained in non-tradeable assets, i.e. private placements, that exhibit a different liquidity behavior than traded securities. On the liability side, GICs and long-term leases do not exhibit and react the same way to events and might result in different liquidity impacts. There could be embedded optionality in the products that could affect liquidity, which should be taken into account.
• The statement should describe explicit quantitative objectives about
ABC's liquidity target, tolerance and issuing limits. These objectives should go beyond “normal” operational and historical liquidity fluctuations and cover concentration issues as well.
For example, a dollar amount of required liquidity, composed of certain types of assets, would cover catastrophic, financial crisis, systemic event, reputational event, and terrorism risks. The objective could include an objective stated as a VaR-adjusted liquidity objective at a certain confidence level over a certain period.
• The statement should describe if the interaction between assets and liabilities resulting from external/internal events.
• The statement should describe a specific modelling approach about how liquidity risk should be assessed: bottom-up analysis or top-down analysis coupled with stress tests and scenario analysis.
(ii) ABC’s liquidity risk appetite statement will take into account both traded
and non-traded assets, excluding foreign investments. All liabilities will be taken into account including contingent sources of funding beyond the existing line of credit.
ABC's objective is to be able to survive an extreme situation with a high-degree of confidence that is in line with desired overall credit rating of AA. Liquidity risk will be monitored continuously for ABC as a whole, reported quarterly to the Board of Directors, and discussed with other relevant parties as required – i.e. regulators and rating agencies.
ERM-GC Spring 2018 Solutions Page 32
6. Continued ABC will model the interaction and concentration of both assets and liabilities. It will take into account both historical and forward-looking assessment of this risk as well as internal management actions in this regard, both existing and envisioned. Its preferred methodology will be to test scenarios developed by the ERM group in consultation with the individual business units. The modeling will include the impact of new business as well and integrate strategic plans as they develop.
(c) ABC’s ERM committee has identified the following scenarios that could affect
liquidity at ABC. These scenarios were developed based on an analysis of past external events that have affected the industry in general, other companies similar to ABC, and the global economy.
(1) Credit risk: ABC credit risk downgrade from AA to B (2) Catastrophic risk: A pandemic similar to the 1918 flu (3) Systemic risk: Global financial crisis similar to that in 2008-2009, with high market decline and substantial credit losses (4) Operational risk: Permanent negative impact on ABC’s reputation (5) Operational risk: Fraud in the distribution channel (6) Business risk: Upcoming retirement of CFO with established succession plan
Assess the relevance of risks (4), (5), and (6) to ABC’s liquidity position. Justify your answers.
Commentary on Question: The purpose of this question was to test the candidate’s ability to conceptually assess how certain risks the liquidity position of ABC. Successful candidates justified their assessment based on ABC-specific information. Many candidates were able to perform a theoretical assessment, but failed to relate to ABC. • Operational risk: a permanent negative impact on ABC's reputation.
The impact on reputation is relevant to ABC given its dominance in North America and its desire to maintain its AA rating. The impact would likely be limited in the short-term but may affect the renewals of GICs going forward. Long-term liabilities might not react as quickly because of the 50% surrender charge that would be imposed. Leases are generally long-term while the investment-grade portfolio and private placements would act as a buffer. The impact would be felt more with new business underwriting, particularly from brokers, who are usually more sensitive to reputational events than ABC's dedicated sales force.

ERM-GC Spring 2018 Solutions Page 33
6. Continued
• Operational risk: fraud in the distribution channel.
This scenario is relevant at ABC given the rudimentary state of its ERM and concentration in North America. Again, we might see an impact on reputation, affecting ABC’s relationship with brokers who were not involved in this matter. The dedicated sales force might also be affected if their clients start questioning ABC's practices. The impact on liquidity might be felt not only in terms of renewals but also in terms of new business as well depending on ABC's reaction. However, a ''run on the bank'' is not envisioned as ABC's liabilities have fixed term dates, with the exception of the line of credit. Since ABC is not a SIFI, regulators might be less concerned about its impact on the insurance industry.
• Business risk: upcoming retirement of the CFO with an established succession
plan.
This impact of this risk on ABC's liquidity position is expected to be more limited because of the established succession plan. Also, no strategic expansion is envisioned at this point, which reduces the potential impact of this event on ABC’s liquidity position.
(d) For the risks (1), (2), and (3) listed in part (c):
(i) Assess the potential impact on ABC's cash flows.
(ii) Assess the interaction with the other risks currently modeled by ABC.
Commentary on Question: Part (i) tested the ability of candidates to assess the cash flow impact of certain risks from a high-level perspective, both for assets and liabilities. In order to obtain maximum points, successful candidates related their assessment to the stated context of ABC. Part (ii) tested the ability of candidates to conceptually assess the possible interaction/correlation of each scenario with the other risks currently modeled by ABC (credit, market and insurance). In order to obtain maximum points, candidates were required to properly assess the impact of each scenario on ABC's cash flows as well as how risks 1, 2, and 3 would potentially impact the modelling of existing risks at ABC.
ERM-GC Spring 2018 Solutions Page 34
6. Continued • ABC credit downgrade: from AA to B.
(i) This is a pretty drastic downgrade. It may signal that assets are impaired, thus affecting their modeled and actual cash flows. This is relevant to ABC as private placements represent 30% of assets. It might also indicate that assets categorized as investment-grade might not be as secure as originally thought, and cash flows would have to be re-assessed. However, long-term life insurance cash flows, both from lapses and premiums, might be less affected as their 50% surrender charge would act as a buffer. New business cash inflows would certainly be affected as some brokers would now be barred from dealing with a non-investment grade counterparty, ABC. (ii) This event would certainly impact the modelling of credit risk at ABC, particularly for private placements. Insurance risk would be affected by additional lapses although mortality would be less affected since ABC's life portfolio is constituted of traditional products, not lapse-supported ones. Market risk would not be affected except for the modelling of interest rate for the line of credit.
• Catastrophic event: pandemic flu like the one in 1918
(i) This would represent a direct hit to ABC's cash outflows from the additional payments on its long-term life portfolio since it represents 50% of its liabilities, particularly if the pandemic is concentrated in North America. GICs would not be affected as their repayments are not insurance-based but may not be renewed at maturity. A pandemic would also affect asset cash flows even from investment-grade securities since the overall economy would be affected. (ii) This event would directly impact the modelling of insurance risk at ABC (mortality, morbidity, lapses). In addition, market risk would be affected as the impact of a pandemic on the economy could affect overall interest rates and currency exchange rates. Creditworthiness of counterparties would be affected and additional non-modeled credit defaults and downgrades would be expected.
ERM-GC Spring 2018 Solutions Page 35
6. Continued • Systemic risk: global financial crisis
(i) Even given ABC’s “buy and hold” strategy, many of its counterparties might default, particularly from private placements, negatively affecting its cash inflows. Investments might have to be restructured, affecting cash inflows in the short-term. For investment-grade securities, particularly government-issued securities, there might a flight to quality; therefore their cash flows might not be affected at all, even increasing in price if ABC needs to liquidate them to fund some of its liabilities. (ii) This event would certainly influence the modelling of market risk (interest rates, currency exchange rates) as was observed during the 2008 financial crisis. For example, Central Banks drastically modified their interest rate structures and their implementation of quantitative easing impacted long-term rates during the crisis. Insurance risk might be less affected particularly if ABC is capable of maintaining its AA rating. Credit risk modeling would certainly have to be updated, particularly for defaults and downgrades on some of its investment portfolios.
ERM-GC Spring 2018 Solutions Page 36
7. Learning Objectives: 1. The candidate will understand the types of risks faced by an entity and be able to
identify and analyze these risks. Learning Outcomes: (1a) Explain risk concepts and be able to apply risk definitions to different entities. (1b) Explain risk taxonomy and its application to different frameworks. (1c) Identify and assess the potential impact of risks faced by an entity, including but
not limited to market risk, currency risk, credit risk, counterparty risk, spread risk, liquidity risk, interest rate risk, equity risk, hazard/insurance risk, inflationary risk, environmental risk, pricing risk, product risk, operational risk, project risk and strategic risk.
Sources: ERM-814-15: Cognitive Bias and their Implications on the Financial Market Financial Enterprise Risk Management, Sweeting, 2011, Ch. 8 Risk Identification Regulatory Risk and North American Insurance Organizations (sections 6.1-6.14 and section 7) ERM-812-15: Valuation for Mergers and Acquisitions - Chapter 1 Commentary on Question: In this question we are testing the candidate's knowledge of how shortcuts in decision making can cause serious errors in judgement and how to mitigate that problem. We then test their analytical abilities regarding the purchase of Eureka versus Columbia. Solution: (a)
(i) Explain how heuristics can influence the decision to acquire Eureka.
(ii) Identify the heuristic each person is exhibiting. Justify your answer.
ERM-GC Spring 2018 Solutions Page 37
7. Continued Commentary on Question: (i) Most candidates did well at describing and defining a heuristic but candidates
who did not relate it to the proposed Eureka purchase only received partial credit.
(ii) Many candidates were confused by the difference between the representativeness and availability heuristics and ascribed them to the wrong associates. In this case they received partial credit if they described the heuristic’s application.
(i) Heuristics are mental shortcuts that can lead to biases in the decision-
making process. This could cause AHA to make a decision on whether or not to acquire Eureka without fully considering all of the aspects of the deal.
(ii) Sue Mahi: Availability Heuristic - Sue is making judgments on the basis of how easily she can use information currently available in her memory that she perceives as relevant circumstances. She is focusing on how great AHA is perceived to be, rather than the facts of the situation. Bob Seoul: Anchoring and Adjustment - Bob is attaching to a certain number (the anchor) and now that this anchor is formed, he is giving little value to new information. He is ignoring the fact that there are certain items that need further consideration and due diligence and instead focusing on the initial hurdle rate discussed. B.G. Bucks: Representativeness Heuristic - Representativeness is used when people judge the probability of an uncertain event based on the results of a similar or representative population. B.G. is making judgements on how well-suited Eureka is for the New York market based on Bonanza’s experience.
(b) Recommend what you believe to be the most effective risk identification
technique that you can use before or during this follow-up meeting to get past these biases. Justify your response, also noting any potential shortcomings of your approach.
ERM-GC Spring 2018 Solutions Page 38
7. Continued
Commentary on Question: Independent Group Analysis, which was provided by a few candidates, was considered the best technique and received the most credit. Candidates received partial credit for describing other methods such as brainstorming and surveys especially when potential shortcomings were noted.
Recommendation: Independent group analysis In this approach, meeting participants would write down their ideas on the potential risks AHA would face with the Eureka acquisition. After this is complete, a discussion around the risks independently identified by each individual can occur. In this instance, many meeting participants have been very vocal and have already voiced biases on the acquisition. One of the issues with other risk identification techniques, such as brain-storming, is that these vocal individuals could influence others who are quieter or those who haven't formed opinions yet. This technique would allow everyone's voice to be heard and help avoid group think.
(c) After the follow-up meeting, B.G. Bucks sends you the Lyon Board’s three
overarching principles for any acquisition identified by an affiliate:
1. The acquisition should be strategic to the affiliate 2. The acquisition should provide clearly identifiable benefits 3. The risks involved in the integration must be clearly identified
(i) Evaluate how the Eureka and Columbia acquisitions would meet each of
the three principles.
(ii) Recommend which acquisition, if any, is best for AHA given your answer to part (i). Justify your response.
Commentary on Question: (i) Most candidates did satisfactorily on this sub-part. (ii) If the candidate selected Columbia, they received partial credit based on
the justification. If the candidate said they would not buy either company, they received partial credit again based on the justification.
ERM-GC Spring 2018 Solutions Page 39
7. Continued (i) Eureka Acquisition Principle 1: - AHA can expand its geographical presence and enter the New York market - With one new state, there's not much regulatory burden - This allows AHA to enter a market without much infrastructure cost - Although they will have to integrate the administration system, and this could cause a problem as it is home grown. Principle 2: - Satisfies strategic reasons - Allows AHA to get into a very large medical market without much cost Principle 3: - Poses an operational risk as the home-grown administration system of Eureka would have to be integrated with AHA's own system - Low regulatory risk with only one state - Has some financial issues that could pose a problem in the integration - High broker fees could pose a problem, although these fees are on a different product than what AHA currently sells
(i) Columbia Acquisition Principle 1: - AHA would expand its reach to many new states - This would require AHA build a lot of new infrastructure to support this - This defeats the strategic purpose of entering a new market without much infrastructure cost - Will have to integrate the administration system - since it's an outside system it should integrate more easily Principle 2: - Acquire underwriters who have strong relationships with clients - Very conservative - Can expand reach very quickly Principle 3: - There is operational risk, but less so than the acquisition with Eureka because Columbia's administration system is contracted out to its vendors - Could create more regulatory risk as Columbia sells in almost all states and doesn't have any regulatory staff to ease the burden AHA would take on - How to integrate the same products when Columbia doesn't use brokers

ERM-GC Spring 2018 Solutions Page 40
7. Continued (ii) Recommendation: Eureka acquisition is better for AHA The strategic goal of this merger is for AHA to enter a new market without much infrastructure. Eureka offers AHA an opportunity to get into a new market without needing to build up a lot of regulatory and compliance infrastructure that would come with Columbia. Since Columbia is in 35 new states, AHA will need to deal with this new, immense regulatory burden year after year. In contrast, Eureka simply adds the headache of a new administration system. AHA will need to figure out how to integrate Eureka's administration system with AHA's, but this will be a one time cost, rather than having to do this and the regulatory compliance Columbia requires. At the end of the day, Eureka offers AHA the strategic opportunity they are looking for without significant costs or risks.
ERM-GC Spring 2018 Solutions Page 41
8. Learning Objectives: 1. The candidate will understand the types of risks faced by an entity and be able to
identify and analyze these risks. 2. The candidate will understand the concepts of risk modeling and be able to
evaluate and understand the importance of risk models. 5. The candidate will understand the concept of economic capital, risk measures in
capital assessment and techniques to allocate the cost of risks within business units.
Learning Outcomes: (1a) Explain risk concepts and be able to apply risk definitions to different entities. (2a) Demonstrate how each of the financial and non-financial risks faced by an entity
can be amenable to quantitative analysis including an explanation of the advantages and disadvantages of various techniques such as Value at Risk (VaR), stochastic analysis, and scenario analysis
(5a) Describe the concepts of measures of value and capital requirements (for
example, EVA, embedded value, economic capital, regulatory measures, and accounting measures) and demonstrate their uses in the risk management and corporate decision-making processes.
Sources: ERM-414-17: A Tale of Two Formulas ERM-815-15: Basel Committee - Developments in Modelling Risk Aggregation, Sections 3-8 (7-32) ERM-501-12: Risk Based Capital-General Overview Financial Enterprise Risk Management, Sweeting, 2011 Ch. 16 Responses to Risk Commentary on Question: Candidates did reasonably well on this question for parts a-c, but struggled on part d. The goal of this question was to test the candidate's knowledge of capital requirements and have candidates recognize risks related to a specific business situation. Solution: (a)
(i) Describe what elements of SLIC’s current EC model may be useful in developing a Solvency II required capital model.
(ii) Recommend two adjustments that would help bring the current EC model up to Solvency II standards.

ERM-GC Spring 2018 Solutions Page 42
8. Continued
Commentary on Question: To receive full credit, candidates needed two well explained answers for both parts i & ii. Candidates generally did well on this section. (i) SLIC's EC model targets a 99% confidence level of solvency over a 1-year time horizon which is very similar to the 99.5% VAR over 1-year defined in Solvency II. The EC model aggregates risks using a correlation matrix. Solvency II uses a similar risk aggregation approach. SLIC would be able to leverage the current capabilities of the EC model to calculate the Solvency II SCR. (ii) SLIC needs to include an operational risk model and not just add 10% of liabilities. Solvency II requires modeling of all material risks. The method used to form the correlation matrix is not precisely stated in the case study. SLIC needs to ensure the aggregation approach is consistent with the Variance-Covariance approach required by Solvency II.
(b) The Solvency II capital requirement for ZZZ on a standalone basis was found to
be larger than the RBC requirement. The Solvency II capital requirement for ZZZ on a standalone basis was found to be lower than SLIC’s required EC calculated using the current method. (i) Provide two reasons why the Solvency II capital requirement could be
lower than SLIC’s current required EC.
(ii) Provide two reasons why the Solvency II capital requirement could be larger than the RBC requirement.
Commentary on Question: Many answers were accepted in this section. To receive full credit, the reasons provided had to be reasonable and provide the correct directional relationship between the capital requirements. Candidate performance was mixed on this section. (i) SLIC is calculating the EC requirement for operational risks as 10% of the fair value of liabilities. This calculation may overstate operational risk in comparison to Solvency II.

ERM-GC Spring 2018 Solutions Page 43
8. Continued SLIC’s model for insurance risk may use more adverse stresses compared to those defined in Solvency II. (ii) Solvency II uses a correlation matrix to aggregate risks, while RBC implicitly assumes that correlations are either 0 or 1. RBC may give greater diversification benefits than Solvency II. Studies have shown that required statutory capital for underwriting risks is generally much smaller for US RBC compared to Solvency II. Underwriting risks are a large factor in a term life portfolio.
(c) Describe three new risks SLIC would be exposed to as a result of acquiring
Atlantis-based insurer ZZZ.
Commentary on Question: Candidates generally did well on this section. To receive full credit, the risks described needed to be new risks to SLIC as a result of the acquisition. Exchange Rate Risk – SLIC would likely receive premiums and pay benefits in the local currency of Atlantis if it were to acquire this block, exposing them to exchange rate risk which they did not previously face. Regulatory Risk - SLIC’s operations are all currently in the US. SLIC has not had to comply with Solvency II regulatory requirements in the past. SLIC may have difficulty complying with Solvency II, due to the lack of expertise on staff. Political/Legal Risk – SLIC is likely not familiar with the political climate in Atlantis. SLIC is now exposed to the risk that Atlantis changes insurance and/or investment laws which reduce profitability of the business it has acquired
(d) The term products sold by ZZZ are similar to the term products currently sold by
SLIC. ZZZ offers 10-year, 20-year, and 30-year level premium products. Each product offers coverage following the level term period at premiums that increase sharply each year.
ZZZ has found that, following the level term period, the term products experience very high lapse rates and dramatic increases in mortality. Explain how increased lapse rates and the corresponding mortality deterioration are captured in each of the following capital frameworks:
ERM-GC Spring 2018 Solutions Page 44
8. Continued (i) U.S. Risk Based Capital
(ii) SLIC’s current required EC
(iii) Solvency II
Commentary on Question: Candidates did poorly on this section. Most candidates understood how insurance risk is reflected in each framework, but failed to adequately explain how this situation would be reflected. (i) For US RBC, the difference in risk is not captured at all. The C2 factor is intended to capture insurance risk. However, this factor is applied to the net amount at risk (face amount – stat reserves) and does not vary based on where the policy is in its life cycle (i.e. whether it is in the initial level period or the YRT period). (ii) SLIC does not capture this risk. Insurance risk is captured as a series of stress tests that do not take into account the fact that mortality is more unpredictable in the post-level vs. level pay period. (iii) Solvency II is intended to capture all material risks. For a large term insurance writer, post level-term mortality deterioration is a material risk and should be captured in the company’s required capital.