Ericsson Motyli b i Report - Notizie dal mondo ICT ... · three feature articles in this report....
26
Ericsson Mobility Report with Western Europe appendix NOVEMBER 2017
Transcript of Ericsson Motyli b i Report - Notizie dal mondo ICT ... · three feature articles in this report....

Ericsson Mobility Report
with Western Europe appendix
NOVEMBER 2017
2 ERICSSON MOBILITY REPORT NOVEMBER 2017
Ericsson Mobility ReportEricsson Mobility Report
WESTERN EUROPE KEY FIGURES
2017
2023CAGR
2017–2023
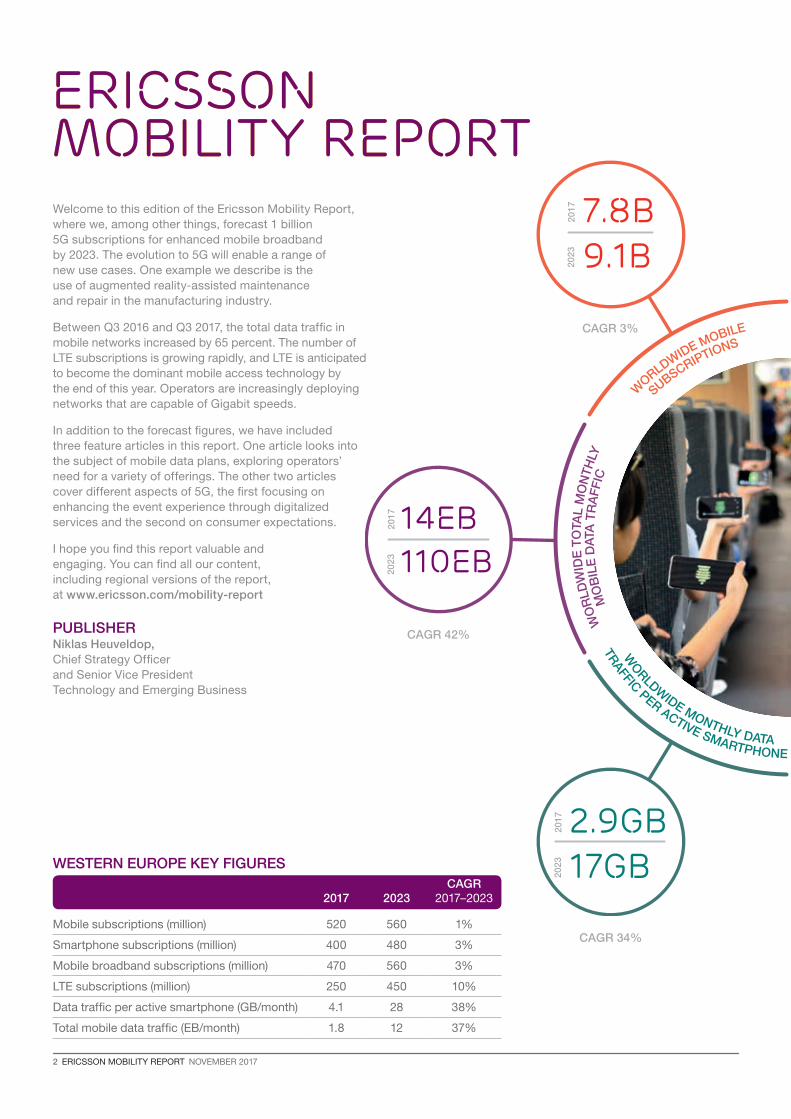
Mobile subscriptions (million) 520 560 1%
Smartphone subscriptions (million) 400 480 3%
Mobile broadband subscriptions (million) 470 560 3%
LTE subscriptions (million) 250 450 10%
Data traffic per active smartphone (GB/month) 4.1 28 38%
Total mobile data traffic (EB/month) 1.8 12 37%
Welcome to this edition of the Ericsson Mobility Report, where we, among other things, forecast 1 billion 5G subscriptions for enhanced mobile broadband by 2023. The evolution to 5G will enable a range of new use cases. One example we describe is the use of augmented reality-assisted maintenance and repair in the manufacturing industry.
Between Q3 2016 and Q3 2017, the total data traffic in mobile networks increased by 65 percent. The number of LTE subscriptions is growing rapidly, and LTE is anticipated to become the dominant mobile access technology by the end of this year. Operators are increasingly deploying networks that are capable of Gigabit speeds.
In addition to the forecast figures, we have included three feature articles in this report. One article looks into the subject of mobile data plans, exploring operators’ need for a variety of offerings. The other two articles cover different aspects of 5G, the first focusing on enhancing the event experience through digitalized services and the second on consumer expectations.
I hope you find this report valuable and engaging. You can find all our content, including regional versions of the report, at www.ericsson.com/mobility-report
PUBLISHERNiklas Heuveldop, Chief Strategy Officer and Senior Vice President Technology and Emerging Business
14EB
7.8B
2.9GB
110EB
9.1B
17GB
CAGR 42%
CAGR 3%
CAGR 34%
2023
2023
2017
2017
2023
2017
WORLDWIDE SMARTPHONE
SUBSCRIPTIONS
WORLDWIDE LT
E
SUBSCRIPTIONS
TRAFFIC PER ACTIVE SMARTPHONE
WO
RLD
WID
E T
OTA
L M
ON
THLY
WO
RLDWIDE MONTHLY DATA
MO
BIL
E D
ATA
TR
AF
FIC
W
ORLDWIDE MOBILE
SUBSCRIPTIONS

NOVEMBER 2017 ERICSSON MOBILITY REPORT 3
28 Western Europe in focus
29 Mobile traffic
30 Merged reality to drive 5G expectations
31 Industry opportunities for 5G
Western Europe appendix
contents
KEY CONTRIBUTORS
Executive Editor: Patrik Cerwall
Project Manager: Anette Lundvall
Editors: Peter Jonsson, Stephen Carson
Forecasts: Richard Möller
Articles: Peter Jonsson, Stephen Carson, Jasmeet Singh Sethi, Mats Arvedson, Ritva Svenningsson, Per Lindberg, Kati Öhman, Patrik Hedlund
Regional Appendices: Veronica Gully, Steven Davis
The content of this document is based on a number of theoretical dependencies and assumptions and Ericsson shall not be bound by or liable for any statement, representation, undertaking or omission made in this document. Furthermore Ericsson may at any time change the contents of this document at its sole discretion and shall not be liable for the consequences of such changes.
5.2B
4.4B
2.6B
8.5B
7.3B
5.5B
CAGR 9%
CAGR 9%
CAGR 13%
2023
2023
2023
2017
2017
2017
WORLDWIDE SMARTPHONE
WO
RLD
WID
E M
OB
ILE
SUBSCRIPTIONS
WORLDWIDE LT
E
SUBSCRIPTIONS
TRAFFIC PER ACTIVE SMARTPHONE
WO
RLDWIDE MONTHLY DATA
W
ORLDWIDE MOBILE
SUBSCRIPTIONS
BR
OA
DB
AN
D S
UB
SC
RIP
TION
S
18 Shifting mobile data plans
22 Enhancing the event experience
26 Millennials’ expectations for 5G
32 Methodology
33 Glossary
34 Global and regional key figures
Forecast
Articles
04 Mobile subscriptions Q3 2017
06 Mobile subscriptions outlook
08 Regional subscriptions outlook
09 Voice over LTE outlook
10 Mobile traffic Q3 2017
11 Mobile traffic by application category
12 Mobile data traffic outlook
14 IoT connections outlook
15 Network coverage
16 Network evolution

4 ERICSSON MOBILITY REPORT NOVEMBER 2017
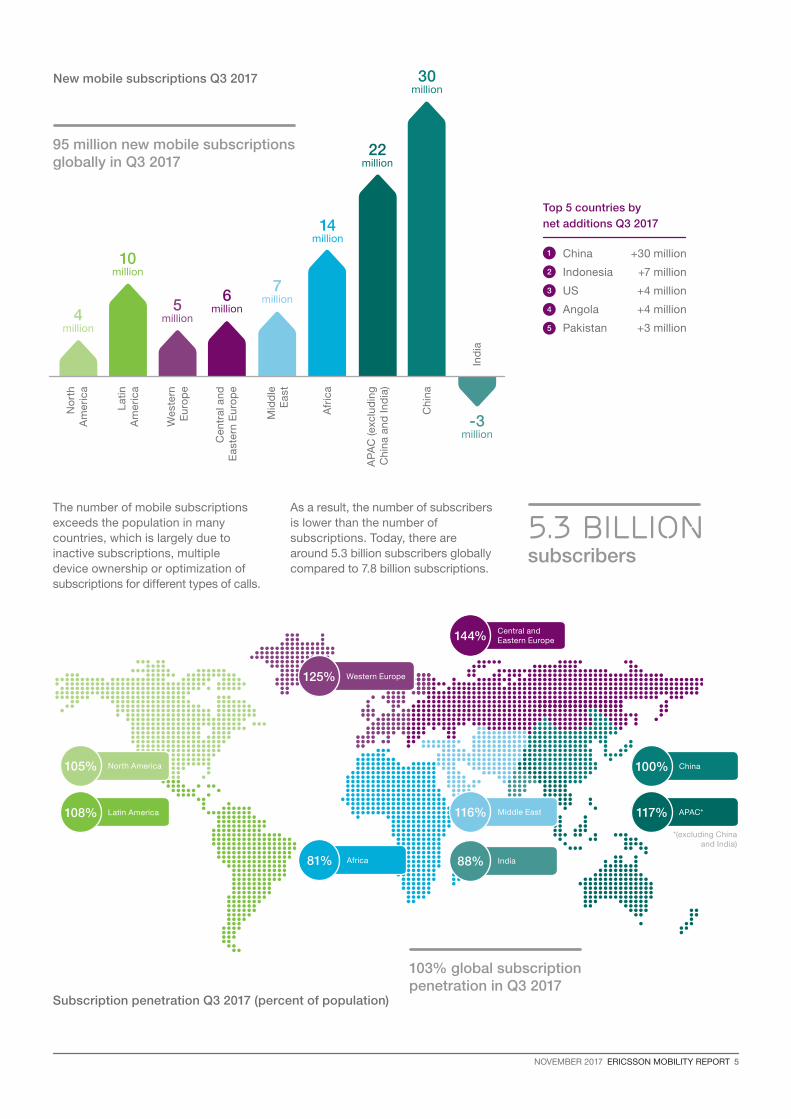
The number of mobile subscriptions is growing at almost 6 percent year-on-year, reaching 7.8 billion in Q3. China had the most net additions during the quarter (+30 million), followed by Indonesia (+7 million), the US (+4 million), Angola (+4 million) and Pakistan (+3 million).
The number of mobile broadband subscriptions1 is growing at around 20 percent year-on-year, increasing by 210 million in Q3 2017 alone. The total number is now 5 billion.
During Q3 2017, 170 million LTE subscriptions were added to reach a total of 2.5 billion. The net additions for WCDMA/HSPA were around 60 million subscriptions during the quarter. The majority of 3G/4G subscriptions can use GSM/EDGE as a fallback.
Over the same period, GSM/EDGE-only subscriptions declined by 130 million. Other technologies declined by around 5 million.
Subscriptions associated with smartphones now account for 57 percent of all mobile phone subscriptions. Around 400 million smartphones were sold in Q3, which equates to 83 percent of all mobile phones sold in the quarter.
380
No
rth
Am
eric
a
425
Mid
dle
E
ast
There are now 5 billion mobile broadband subscriptions
Mobile subscriptions Q3 2017 (million)
520
Wes
tern
E
uro
pe
585
Cen
tral
an
d
Eas
tern
Eu
rop
e
1,015
Afr
ica
1,560
AP
AC
(exc
lud
ing
Ch
ina
and
Ind
ia)
1,185
Ind
ia
700
Lat
in A
mer
ica
1,395
Ch
ina
In Q3, 95 million new mobile subscriptions were added, resulting in a total of 7.8 billion
Mobile subscriptionsq3 2017
1 Mobile broadband includes radio access technologies HSPA (3G), LTE (4G), 5G, CDMA2000 EV-DO, TD-SCDMA and Mobile WiMAX Note: WCDMA without HSPA and GPRS/EDGE (2G) are not included
NOVEMBER 2017 ERICSSON MOBILITY REPORT 5
China100%
APAC*117%
*(excluding China and India)
Western Europe125%
Central and Eastern Europe144%
Middle East116%
Africa81%
North America105%
Latin America108%
India88%
6 million
7 million
10 million
5 million4
million
New mobile subscriptions Q3 2017
Top 5 countries by
net additions Q3 2017
China +30 million
Indonesia +7 million
US +4 million
Angola +4 million
Pakistan +3 million
1
2
3
4
5
Cen
tral
an
d
Eas
tern
Eu
rop
e
Mid
dle
E
ast
14 million
Lat
in
Am
eric
a
No
rth
Am
eric
a
AP
AC
(exc
lud
ing
C
hin
a an
d In
dia
)
22 million
Ch
ina
30 million
Ind
ia
-3 million
95 million new mobile subscriptions globally in Q3 2017
Subscription penetration Q3 2017 (percent of population)
The number of mobile subscriptions exceeds the population in many countries, which is largely due to inactive subscriptions, multiple device ownership or optimization of subscriptions for different types of calls.
As a result, the number of subscribers is lower than the number of subscriptions. Today, there are around 5.3 billion subscribers globally compared to 7.8 billion subscriptions.
5.3 billion subscribers
Wes
tern
E
uro
pe
Afr
ica
103% global subscription penetration in Q3 2017
6 ERICSSON MOBILITY REPORT NOVEMBER 2017
A 5G subscription is here counted as such when associated with a device that supports NR as specified in 3GPP Release 15, connected to a 5G-enabled network.
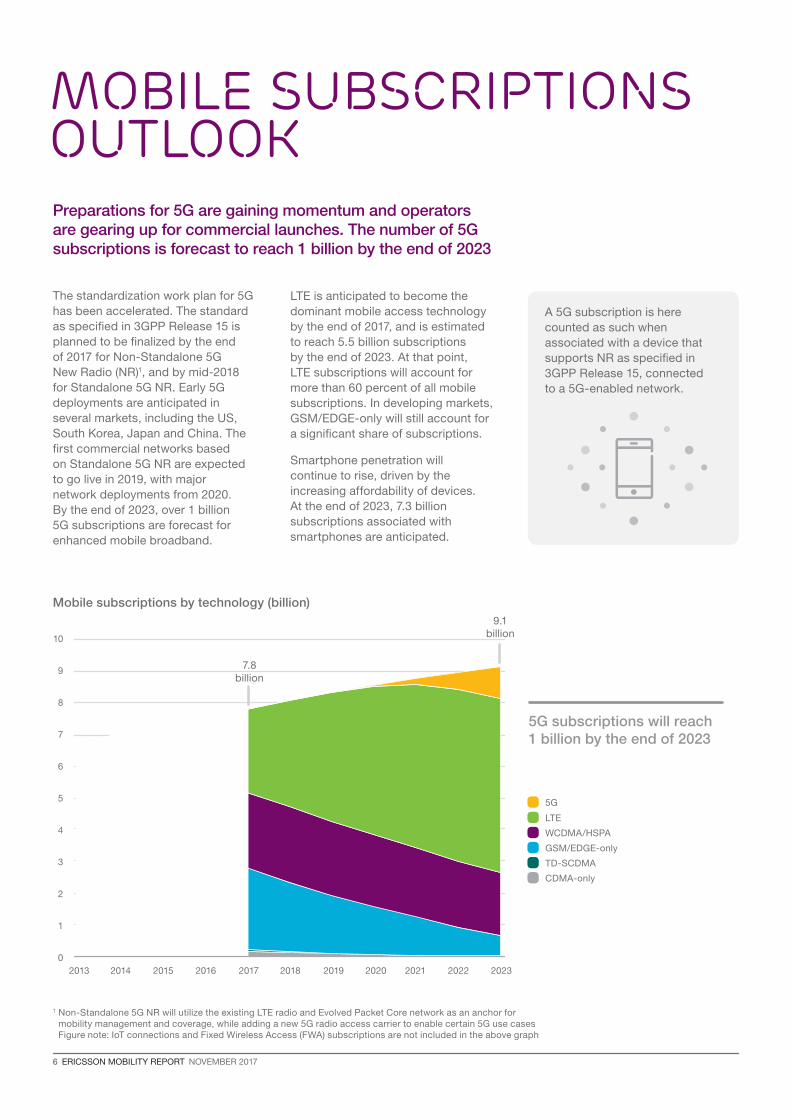
The standardization work plan for 5G has been accelerated. The standard as specified in 3GPP Release 15 is planned to be finalized by the end of 2017 for Non-Standalone 5G New Radio (NR)1, and by mid-2018 for Standalone 5G NR. Early 5G deployments are anticipated in several markets, including the US, South Korea, Japan and China. The first commercial networks based on Standalone 5G NR are expected to go live in 2019, with major network deployments from 2020. By the end of 2023, over 1 billion 5G subscriptions are forecast for enhanced mobile broadband.
5G subscriptions will reach 1 billion by the end of 2023
1 Non-Standalone 5G NR will utilize the existing LTE radio and Evolved Packet Core network as an anchor for mobility management and coverage, while adding a new 5G radio access carrier to enable certain 5G use cases Figure note: IoT connections and Fixed Wireless Access (FWA) subscriptions are not included in the above graph
MOBILE SUBSCRIPTIONS OUTLOOKPreparations for 5G are gaining momentum and operators are gearing up for commercial launches. The number of 5G subscriptions is forecast to reach 1 billion by the end of 2023
10
1
2
3
4
5
6
7
8
9
0
Mobile subscriptions by technology (billion)
2013 2016 2022 20232014 2015 2017 2018 2019 2020 2021
9.1 billion
LTE
5G
WCDMA/HSPA
GSM/EDGE-only
TD-SCDMA
CDMA-only
7.8 billion
LTE is anticipated to become the dominant mobile access technology by the end of 2017, and is estimated to reach 5.5 billion subscriptions by the end of 2023. At that point, LTE subscriptions will account for more than 60 percent of all mobile subscriptions. In developing markets, GSM/EDGE-only will still account for a significant share of subscriptions.
Smartphone penetration will continue to rise, driven by the increasing affordability of devices. At the end of 2023, 7.3 billion subscriptions associated with smartphones are anticipated.
NOVEMBER 2017 ERICSSON MOBILITY REPORT 7
5G will be introduced in higher spectrum bands to meet new traffic demands
Mobile broadband traffic is expected to increase by eight times over the coming six years, while commercial 5G systems will be introduced from 2019. However, below 3GHz, most of the mobile cellular spectrum bands currently used by service providers are becoming congested during busy hours in highly loaded cells.
In response to increasing demands, the mobile industry is focusing on optimizing the spectral efficiency of LTE in existing frequency bands using new advanced functionalities,
such as Multiple Input Multiple Output (MIMO) and carrier aggregation. To solve capacity needs long term, most countries are expected to make additional spectrum available under new national 5G regulatory regimes. This will be achieved by extending the use of spectrum to higher bands, where a large amount of bandwidth could help accommodate the expected mobile data consumption from around 1 billion new 5G subscriptions in 2023.
Several suitable bands are currently being considered to support 5G subscription growth, and to deliver the data rates needed to meet the future demand for broadband services and applications. Currently bandwidth in the 28GHz band (26.5–29.5GHz)
is being allocated in some countries, but bandwidth in the 26GHz band (24.25–27.5GHz) is also being considered. The latter band is part of the International Telecommunication Union’s (ITU) World Radiocommunication Conference 2019 (WRC-19) agenda, while the former band is being assigned under an already existing mobile allocation in the ITU Radio Regulations.
The mobile industry considers these two bands to be the most important for terrestrial mobile applications on higher frequencies (above 6GHz). The 38GHz and 42GHz bands are also being considered as complementary resources to support 5G requirements.
2017 20222019 202120182016 202320202013 20152014
Subscriptions/lines, subscribers (billion)
2 The number of fixed broadband users is at least three times the number of fixed broadband connections, due to shared subscriptions in households, enterprises and public access spots. This is the opposite of the situation for mobile phones, where subscription numbers exceed user numbers
1
2
3
4
5
6
7
8
9
10
0
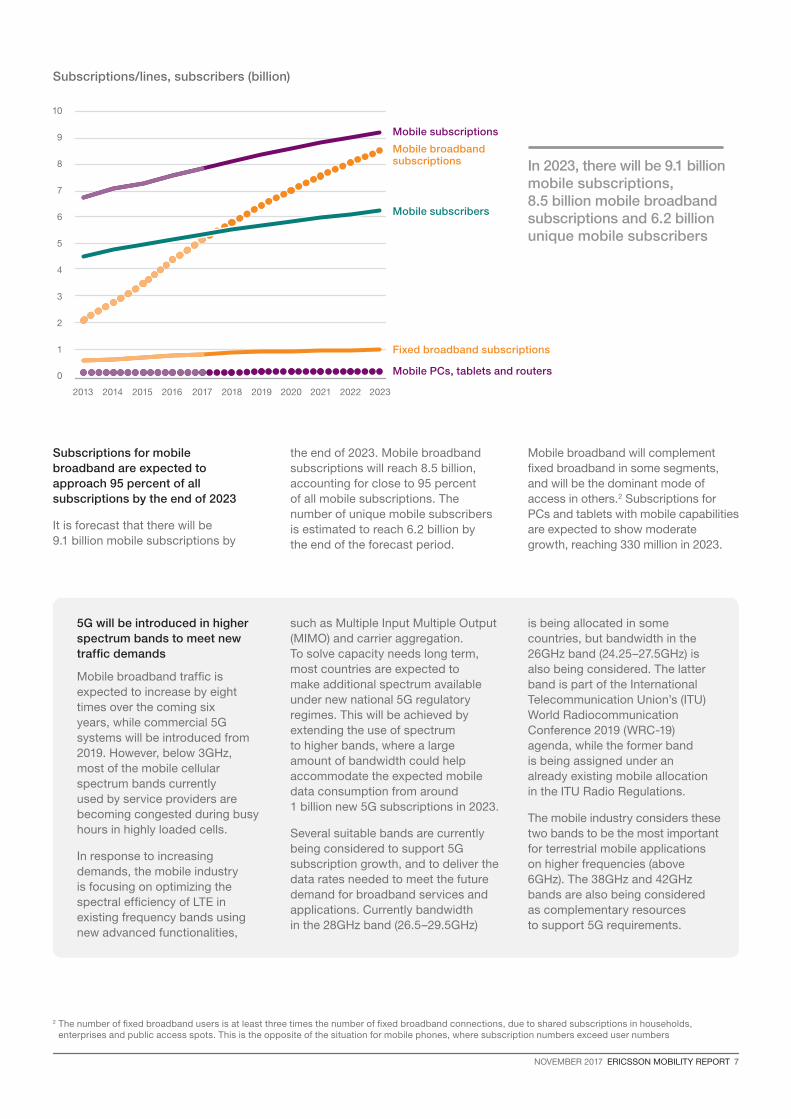
Subscriptions for mobile broadband are expected to approach 95 percent of all subscriptions by the end of 2023
It is forecast that there will be 9.1 billion mobile subscriptions by
the end of 2023. Mobile broadband subscriptions will reach 8.5 billion, accounting for close to 95 percent of all mobile subscriptions. The number of unique mobile subscribers is estimated to reach 6.2 billion by the end of the forecast period.
Mobile broadband will complement fixed broadband in some segments, and will be the dominant mode of access in others.2 Subscriptions for PCs and tablets with mobile capabilities are expected to show moderate growth, reaching 330 million in 2023.
In 2023, there will be 9.1 billion mobile subscriptions, 8.5 billion mobile broadband subscriptions and 6.2 billion unique mobile subscribers
Mobile subscriptions
Mobile subscribers
Mobile broadband subscriptions
Fixed broadband subscriptions
Mobile PCs, tablets and routers

8 ERICSSON MOBILITY REPORT NOVEMBER 2017
Mobile broadband drives subscription growth across all regions
The number of mobile subscriptions continues to grow across the regions, fueled by a strong uptake in mobile broadband.1 There are still large variations between regions. However, with the exception of India, subscriptions for mobile broadband now make up 50 percent or more of total subscriptions in all regions. Globally, the most common way to access the internet is over a mobile network.
By the end of 2023, the Middle East and Africa region will transform from a situation where half of all mobile subscriptions are GSM/EDGE-only, to one where 90 percent of subscriptions are for mobile broadband. Driving factors for this growth include a young and growing population with increasing digital skills, as well as more affordable smartphones.
In North East Asia, 5G is expected to be deployed early in South Korea, Japan and China. For the region as a whole, 5G subscription penetration is expected to reach 34 percent by the end of the forecast period.
North America currently has the highest penetration of LTE subscriptions at close to 80 percent. The region will also lead 5G uptake, with major operators stating their intentions to deploy 5G early. 5G subscriptions are expected to account for 37 percent of all mobile subscriptions in the region by the end of 2023.
Western Europe is expected to evolve more slowly, with 5G making up 16 percent of mobile subscriptions at the end of the period.
GSM/EDGE-only
regional SUBSCRIPTIONS OUTLOOK
LTE
WCDMA/HSPA5G TD-SCDMA
CDMA-only
20
40
0
60
80
100
Mobile subscriptions by region and technology (percent)
Latin America
2017 2023
44%
75%
Central and Eastern Europe
2017 2023
44%
85%
37% of subscriptions in North America are expected to be for 5G in 2023
1 Mobile broadband includes radio access technologies HSPA (3G), LTE (4G), 5G, CDMA2000 EV-DO, TD-SCDMA and Mobile WiMAX Note: WCDMA without HSPA and GPRS/EDGE (2G) are not included
North America
2017 2023
79% 37%16%
Western Europe
2017 2023
48%
81%
Middle East and Africa
2017 2023
50%
49%
North East Asia
2017 2023
73% 34%
South East Asia and Oceania
2017 2023
49%
52%
India
2017 2023
67%
60%

NOVEMBER 2017 ERICSSON MOBILITY REPORT 9
VoLTE has now been launched in more than 125 networks in over 60 countries across all regions. The number of VoLTE subscriptions is projected to reach 5.5 billion by the end of 2023, accounting for more than 80 percent of the combined LTE and 5G subscriptions.
Enabling new consumer and enterprise use cases with VoLTE
VoLTE is delivered via the IP Multimedia Subsystem (IMS) and enables operators to offer high-quality, simultaneous communication and data services on smartphones and other devices. Functionality includes HD voice, HD voice+ and music within calls with the new Enhanced Voice Services (EVS) codec, content sharing within calls, video communication, IP messaging and evolution to chat bots, and allowing several devices to share the same phone number.
Wi-Fi calling is built on the same core network systems as VoLTE, and enables operators to extend their voice service to places with limited cellular coverage. To date, Wi-Fi calling has been implemented on over 55 networks in more than 30 countries.2
There are more than 1,300 VoLTE-enabled device models.3 Cellular smartwatches are one of the latest devices to utilize VoLTE. Users are able to make voice calls directly on their smartwatch, without having a smartphone nearby. Calls can also be transferred between a user’s smartphone and watch.
VoLTE support in Cat-M1-capable Internet of Things (IoT) devices and network infrastructure is now being enabled, and new use cases are being explored. Many IoT use cases could benefit by incorporating basic voice calling functionality. One example is in assistance situations, such as using an alarm panel in an elevator, or calling the owner of a lost dog via its IoT-connected collar. The technology could also be used to improve business performance, for example, enabling faster repair of vending machines by providing a button to call a service center easily.
VoLTE technology will be the foundation for enabling voice calls over 5G access. New communication service use cases in a 5G context are being explored, such as combining them with augmented reality and virtual reality.
1 A subscriber is counted as having a VoLTE subscription if making at least one VoLTE call per month2 GSMA (November 2017)3 GSA (July 2017), supporting different regions and frequencies
Voice over LTE outlookVoLTE subscriptions1 are expected to exceed 650 million by the end of 2017, creating a foundation for interoperable consumer and enterprise communication services on different devices
VoLTE subscriptions by region (billion)
3
4
5
6
1
2
0
Latin America
North America
Asia Pacific
Middle East and Africa
Europe
2014 2021 2022 20232013 2015 2016 20182017 2019 2020
5.5 billion
650 million
VoLTE subscriptions are expected to reach 5.5 billion in 2023

10 ERICSSON MOBILITY REPORT NOVEMBER 2017
Mobile data traffic1 continues to grow. This is driven by increasing smartphone subscriptions and increasing average data volume per subscription, fueled primarily by more viewing of video content.
The graph below shows total global monthly data and voice traffic from Q3 2012 to Q3 2017, along with the year-on-year percentage change for mobile data traffic.
This curve illustrates a typical moderating growth rate as the market has evolved over time, which has been disrupted on a couple of occasions. In 2015, the growth rate was influenced by zero-rated video offers in North America. In 2016, introductory free data traffic offers in India pushed up the global traffic noticeably.
In Q3 2017, data traffic grew around 10 percent quarter-on-quarter and around 65 percent year-on-year. However, there are large differences in traffic levels between markets, regions and operators.
Voice
Data
Year-on-year growth
2 20
4 40
140
8
10
80
100
120
6 60
0 0
Tota
l (u
plin
k +
do
wn
link)
tra
ffic
(Exa
Byt
es
pe
r m
on
th)
Ye
ar-
on
-ye
ar
gro
wth
(p
erc
en
t)
1 Traffic does not include DVB-H, Wi-Fi, or Mobile WiMAX. VoIP is included in data traffic
mobile traffic q3 2017
Source: Ericsson traffic measurements (Q3 2017)
Q3 2012
Q4 Q1 2013
Q2 Q3 Q4 Q1 2014
Q2 Q3 Q4 Q1 2015
Q2 Q3 Q4 Q1 2016
Q2 Q2 Q3Q3 Q4 Q1 2017
Data traffic grew 65% between Q3 2016 and Q3 2017
14
12

NOVEMBER 2017 ERICSSON MOBILITY REPORT 11
Mobile traffic by application category CAGR 2017–2023
Mobile video traffic is forecast to grow by around 50 percent annually through 2023 to account for 75 percent of all mobile data traffic. Social networking is also expected to grow – increasing by 34 percent annually over the next 6 years. However, its relative share of traffic will decline from 12 percent in 2017 to around 8 percent in 2023, as a result of the stronger growth of video.
Other application categories have annual growth rates ranging from 20 to 32 percent, and so are shrinking as a proportion of overall traffic. The use of embedded video in social media and webpages (here counted as video traffic) is also growing, fueled by larger device screens, higher resolution and new platforms supporting live streaming.
The emergence of new applications and changes in consumer behavior can shift the forecast relative traffic volumes. Streaming videos in different resolutions can impact data traffic consumption to a high degree. Watching HD video (1080p) rather than video at a standard resolution (480p) typically increases the data traffic volume by around 4 times. An emerging trend with increased streaming of immersive video formats, such as 360-degree video, would also impact data traffic consumption. For example, a YouTube 360-degree video consumes 4 to 5 times as much bandwidth as a normal YouTube video at the same resolution.
Another driver is an increasing preference among consumers for on-demand and catch-up TV over scheduled linear TV viewing. Consumer research indicates that as early as 2020, half of all TV and video viewing will be done on a mobile screen.1
Mobile data traffic by application category per month (ExaBytes)
Mobile traffic by application categoryIncreased viewing of video on mobile devices, embedded video and emerging video formats will drive data consumption
1 Ericsson ConsumerLab, TV and Media (2017) Base: Population aged 16–69 watching TV/video at least weekly and having broadband at home in Brazil, Canada, China, Germany, Italy, Mexico, Russia, South Korea, Spain, Sweden, Taiwan, the UK and the US
File sharing
Web browsing
Audio Software download
Social networking
Video
20% 21%
32%31%34%
48%
File sharing
Other
Web browsing
Software download
Social networking
Audio
Video
2017 14 ExaBytes
per month
2023 110 ExaBytes
per month
In 2023, video will account for around
75% of mobile data traffic
55% video

12 ERICSSON MOBILITY REPORT NOVEMBER 2017
Global mobile data traffic (ExaBytes per month)
mobile DATA traffic outlook
Data traffic per active smartphone (GigaBytes per month)
0 10 20 40 5030 60
Middle East and
Africa
South East Asia and Oceania
North East Asia
Latin America
India
Western Europe
Central and Eastern Europe
North America
60
120
100
80
0
20
40
20232013 2018
Mobile PCs, tablets and routers
Smartphones
Monthly mobile data traffic per smartphone continues to increase in all regions. North America has the highest usage, and traffic is expected to reach 7.1 GigaBytes (GB) per month per smartphone by the end of the year and increase to 48GB by the end of 2023. Western Europe has the second highest usage, with traffic set to reach 4.1GB by the end of 2017 and 28GB by the end of 2023. Western Europe will be the region with the highest growth rate in monthly mobile data traffic per smartphone during the forecast period.
The high average usage in India – estimated to reach 3.9GB per month per smartphone at the end of 2017 – is mainly due to an introductory LTE offer by an operator during the latter half of 2016, which included free voice and data traffic. Data traffic is expected to continue to grow, reaching 18GB per month per smartphone in 2023.
Factors that will drive higher usage in general include an increase in the number of LTE subscriptions, improved device capabilities and more affordable data plans, as well as an increase in data-intensive content. As virtual reality and augmented reality technologies are more widely adopted, content will become even more data intensive.
Total mobile data traffic is expected to rise at a compound annual growth rate (CAGR) of 42 percent
Total mobile data traffic for all devices is anticipated to increase by 8 times during the forecast period, reaching around 110EB per month by the end of 2023. At close to 85 percent, data traffic generated by smartphones is already accounting for the largest proportion of mobile data traffic. Going forward, smartphone data traffic will become even more dominant, and is expected to increase by 9 times during the forecast period to account for close to 95 percent of total mobile data traffic by the end of 2023.
Close to 95% of mobile data traffic will come from smartphones in 2023
110EB2017
2017
2017
2017
2017
2017
2017
2017
2023
2023
2023
2023
2023
2023
2023
2023
In 2023, monthly global mobile data traffic will surpass 100 ExaBytes (EB)
NOVEMBER 2017 ERICSSON MOBILITY REPORT 13
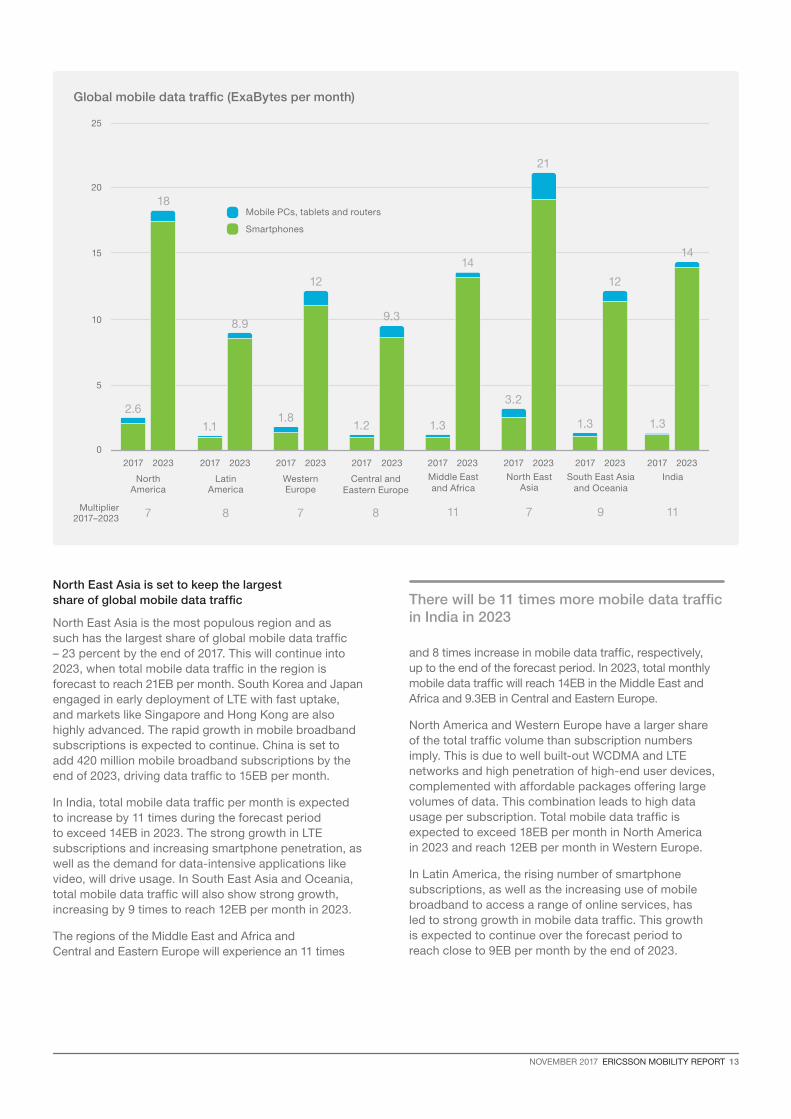
North East Asia is set to keep the largest share of global mobile data traffic
North East Asia is the most populous region and as such has the largest share of global mobile data traffic – 23 percent by the end of 2017. This will continue into 2023, when total mobile data traffic in the region is forecast to reach 21EB per month. South Korea and Japan engaged in early deployment of LTE with fast uptake, and markets like Singapore and Hong Kong are also highly advanced. The rapid growth in mobile broadband subscriptions is expected to continue. China is set to add 420 million mobile broadband subscriptions by the end of 2023, driving data traffic to 15EB per month.
In India, total mobile data traffic per month is expected to increase by 11 times during the forecast period to exceed 14EB in 2023. The strong growth in LTE subscriptions and increasing smartphone penetration, as well as the demand for data-intensive applications like video, will drive usage. In South East Asia and Oceania, total mobile data traffic will also show strong growth, increasing by 9 times to reach 12EB per month in 2023.
The regions of the Middle East and Africa and Central and Eastern Europe will experience an 11 times
and 8 times increase in mobile data traffic, respectively, up to the end of the forecast period. In 2023, total monthly mobile data traffic will reach 14EB in the Middle East and Africa and 9.3EB in Central and Eastern Europe.
North America and Western Europe have a larger share of the total traffic volume than subscription numbers imply. This is due to well built-out WCDMA and LTE networks and high penetration of high-end user devices, complemented with affordable packages offering large volumes of data. This combination leads to high data usage per subscription. Total mobile data traffic is expected to exceed 18EB per month in North America in 2023 and reach 12EB per month in Western Europe.
In Latin America, the rising number of smartphone subscriptions, as well as the increasing use of mobile broadband to access a range of online services, has led to strong growth in mobile data traffic. This growth is expected to continue over the forecast period to reach close to 9EB per month by the end of 2023.
0
5
10
15
20
25
2023 20232023 20232017 20172017 2017
Middle East and Africa
11
South East Asia and Oceania
9
North East Asia
7
India
11
20232017
North America
7
2.6
18
8.9
1.8
12
9.3
14
3.2
12
14
1.31.3
21
1.31.21.1
Multiplier 2017–2023
20232017
Latin America
8
20232017
Western Europe
7
20232017
Central and Eastern Europe
8
Mobile PCs, tablets and routers
Smartphones
There will be 11 times more mobile data traffic in India in 2023
Global mobile data traffic (ExaBytes per month)
14 ERICSSON MOBILITY REPORT NOVEMBER 2017
IoT Connections Outlook
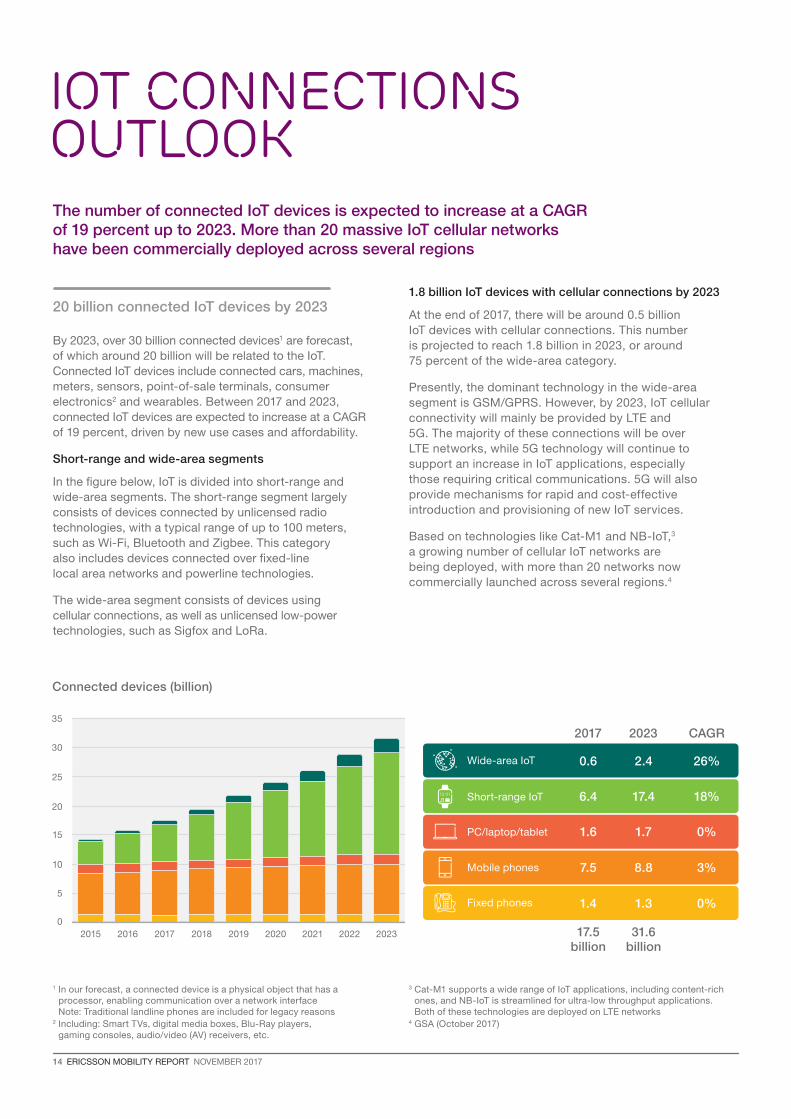
By 2023, over 30 billion connected devices1 are forecast, of which around 20 billion will be related to the IoT. Connected IoT devices include connected cars, machines, meters, sensors, point-of-sale terminals, consumer electronics2 and wearables. Between 2017 and 2023, connected IoT devices are expected to increase at a CAGR of 19 percent, driven by new use cases and affordability.
Short-range and wide-area segments
In the figure below, IoT is divided into short-range and wide-area segments. The short-range segment largely consists of devices connected by unlicensed radio technologies, with a typical range of up to 100 meters, such as Wi-Fi, Bluetooth and Zigbee. This category also includes devices connected over fixed-line local area networks and powerline technologies.
The wide-area segment consists of devices using cellular connections, as well as unlicensed low-power technologies, such as Sigfox and LoRa.
1.8 billion IoT devices with cellular connections by 2023
At the end of 2017, there will be around 0.5 billion IoT devices with cellular connections. This number is projected to reach 1.8 billion in 2023, or around 75 percent of the wide-area category.
Presently, the dominant technology in the wide-area segment is GSM/GPRS. However, by 2023, IoT cellular connectivity will mainly be provided by LTE and 5G. The majority of these connections will be over LTE networks, while 5G technology will continue to support an increase in IoT applications, especially those requiring critical communications. 5G will also provide mechanisms for rapid and cost-effective introduction and provisioning of new IoT services.
Based on technologies like Cat-M1 and NB-IoT,3 a growing number of cellular IoT networks are being deployed, with more than 20 networks now commercially launched across several regions.4
Connected devices (billion)
1 In our forecast, a connected device is a physical object that has a processor, enabling communication over a network interface Note: Traditional landline phones are included for legacy reasons
2 Including: Smart TVs, digital media boxes, Blu-Ray players, gaming consoles, audio/video (AV) receivers, etc.
3 Cat-M1 supports a wide range of IoT applications, including content-rich ones, and NB-IoT is streamlined for ultra-low throughput applications. Both of these technologies are deployed on LTE networks
4 GSA (October 2017)
0
5
10
15
20
25
30
35
2021 2022 2023202020192018201720162015
Wide-area IoT
Short-range IoT
PC/laptop/tablet
Mobile phones
Fixed phones
17.5 billion
31.6 billion
CAGR20232017
0.6 2.4 26%
6.4 17.4 18%
1.6 1.7 0%
7.5 8.8 3%
1.4 1.3 0%
The number of connected IoT devices is expected to increase at a CAGR of 19 percent up to 2023. More than 20 massive IoT cellular networks have been commercially deployed across several regions
20 billion connected IoT devices by 2023

NOVEMBER 2017 ERICSSON MOBILITY REPORT 15
Demand for population and geographical coverage
Historically, mobile services have been centered on providing sufficient radio signal for the world’s inhabitants where they live, which is defined as population coverage. Today, mobile networks cover around 95 percent of the world’s population and this figure continues to grow.
Mobile service usage has evolved from predominantly voice to messaging and internet access, as well as to a variety of apps on a range of smart devices, placing greater demands on network performance.
For mobile broadband (WCDMA/HSPA or a later technology), population coverage is currently at around 80 percent and forecast to grow to over 95 percent in 2023.
With the expected growth of IoT services, there is a higher demand on geographical coverage – be it wide-area or dedicated coverage – as networks of sensors are installed in places with low population density such as agricultural areas or forestland.
LTE deployment continues to gain momentum
In terms of build-out and subscription uptake, LTE is the fastest-deployed mobile communication technology to date. It took just 5 years for LTE to cover 2.5 billion people, compared to 8 years for WCDMA/HSPA.
LTE is driven by demand for improved user experience and faster networks. Several drivers are further increasing the speed of LTE deployment. In India, a rise in low-cost offerings and low cost per MegaByte is making the technology attractive. Similar drivers are also prevalent in other high-growth markets.
LTE population coverage is currently around 55 percent and is forecast to grow to more than 85 percent in 2023.
Providing coverage for 5G use cases
In the past, mobile networks have first been deployed in urban areas, and then gradually expanded to areas such as suburban and major interconnecting highways.
In a similar fashion, 5G is expected to be deployed first in dense urban areas to support enhanced mobile broadband services, and by 2023, more than 20 percent of the world’s population is expected to be covered by the technology.
In 2023, more than 20 percent of the world’s population will be covered by 5G
1 The figures refer to population coverage of each technology. The ability to utilize the technology is subject to factors such as access to devices and subscriptions
2016
2016
2023
2023
Total population coverage of 3GPP cellular technologies
LTE is driven by demand for improved user experience and faster networks
5G coverage will commence in metropolitan and urban areas
~55%
>85%
0%
>20%
World population coverage by technology1
network COVERAGE
2016 ~95%
2023 >95%
To a large extent, 5G is driven by use cases with a wide range of requirements. One of the first commercial uses for 5G is expected to be for Fixed Wireless Access (FWA), implying a coverage build-out in urban areas. Other use cases will come from industries such as automotive, manufacturing, energy and utilities, and healthcare, and will drive demand for dedicated coverage.
16 ERICSSON MOBILITY REPORT NOVEMBER 2017
14 Gigabit LTE networks have been commercially launched
1 Category (Cat) labels the theoretical maximum downlink speed a mobile device supports. The higher the Cat number, the faster the speeds
Mobile networks are evolving to deliver enhanced mobile broadband and communication services with high data throughput, quality of service and low latency requirements, as well as new IoT services with strong requirements on scalability, reliability, availability and latency. Significant radio performance enhancements, together with a more flexible and agile core network, will enable operators to serve a much broader range of use cases in the future.
Gigabit LTE network deployments gaining momentum
Operators have deployed multi-standard access networks with GSM, HSPA and LTE, and are evolving their existing LTE networks to LTE-Advanced (LTE-A), enabling Gigabit network speeds. Device ecosystems are well aligned, as most new smartphones support the latest 3GPP Category1 (Cat 16).
By using higher order carrier aggregation, operators can combine more spectrum assets. As carrier aggregation is coupled with 4x4 MIMO and 256 QAM, operators can achieve network speeds with peak rates of Gigabit per second. This will lead to increased network capacity, a wider coverage area, and faster average end-user data speeds.
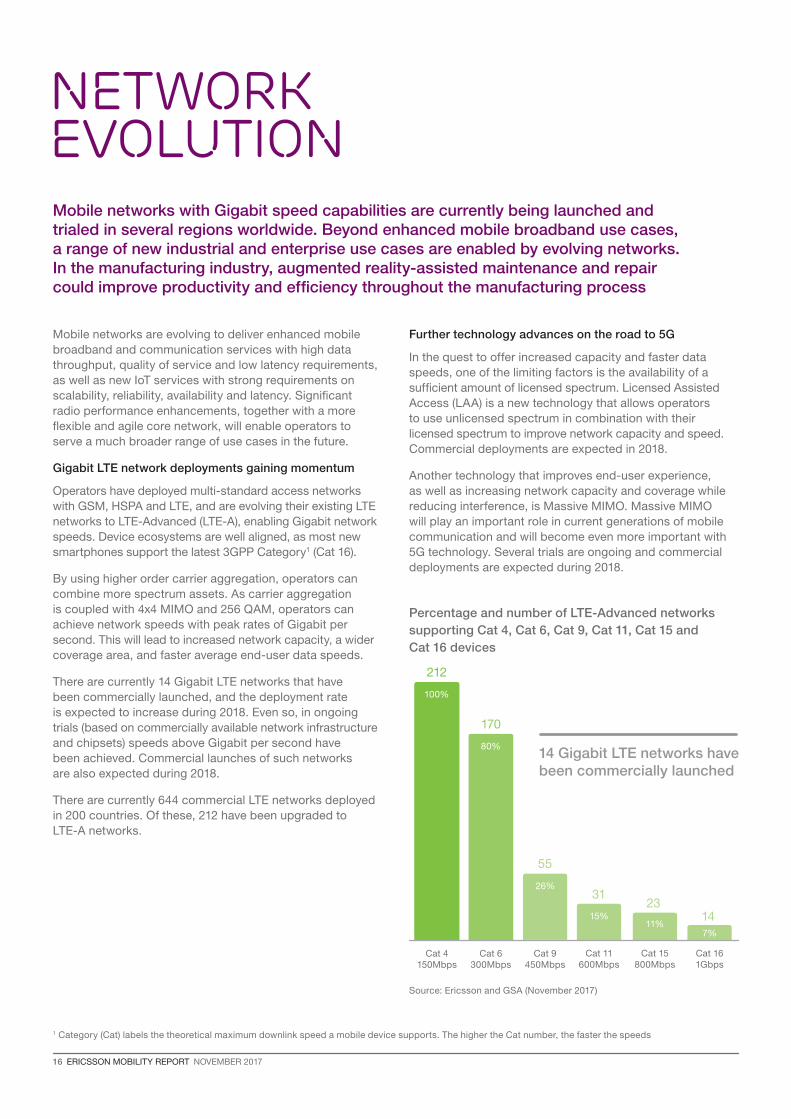
There are currently 14 Gigabit LTE networks that have been commercially launched, and the deployment rate is expected to increase during 2018. Even so, in ongoing trials (based on commercially available network infrastructure and chipsets) speeds above Gigabit per second have been achieved. Commercial launches of such networks are also expected during 2018.
There are currently 644 commercial LTE networks deployed in 200 countries. Of these, 212 have been upgraded to LTE-A networks.
Mobile networks with Gigabit speed capabilities are currently being launched and trialed in several regions worldwide. Beyond enhanced mobile broadband use cases, a range of new industrial and enterprise use cases are enabled by evolving networks. In the manufacturing industry, augmented reality-assisted maintenance and repair could improve productivity and efficiency throughout the manufacturing process
Percentage and number of LTE-Advanced networks supporting Cat 4, Cat 6, Cat 9, Cat 11, Cat 15 and Cat 16 devices
Source: Ericsson and GSA (November 2017)
Cat 4 150Mbps
212
Cat 6 300Mbps
Cat 9 450Mbps
Cat 11 600Mbps
Cat 15 800Mbps
Cat 16 1Gbps
100%
170
80%
26%
15%11%
7%
55
3123
14
network evolution
Further technology advances on the road to 5G
In the quest to offer increased capacity and faster data speeds, one of the limiting factors is the availability of a sufficient amount of licensed spectrum. Licensed Assisted Access (LAA) is a new technology that allows operators to use unlicensed spectrum in combination with their licensed spectrum to improve network capacity and speed. Commercial deployments are expected in 2018.
Another technology that improves end-user experience, as well as increasing network capacity and coverage while reducing interference, is Massive MIMO. Massive MIMO will play an important role in current generations of mobile communication and will become even more important with 5G technology. Several trials are ongoing and commercial deployments are expected during 2018.
NOVEMBER 2017 ERICSSON MOBILITY REPORT 17
2 Live direct or indirect view of a physical, real-world environment with elements augmented by computer-generated sensory input such as sound, video and graphics
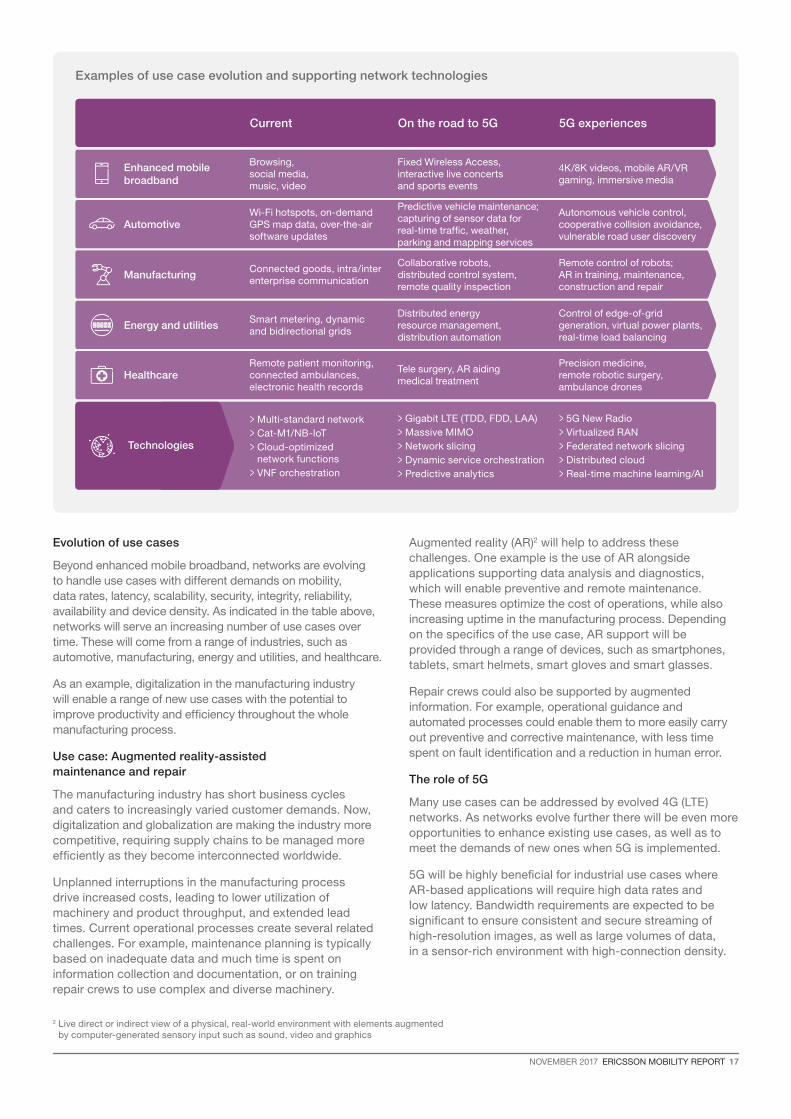
Evolution of use cases
Beyond enhanced mobile broadband, networks are evolving to handle use cases with different demands on mobility, data rates, latency, scalability, security, integrity, reliability, availability and device density. As indicated in the table above, networks will serve an increasing number of use cases over time. These will come from a range of industries, such as automotive, manufacturing, energy and utilities, and healthcare.
As an example, digitalization in the manufacturing industry will enable a range of new use cases with the potential to improve productivity and efficiency throughout the whole manufacturing process.
Use case: Augmented reality-assisted maintenance and repair
The manufacturing industry has short business cycles and caters to increasingly varied customer demands. Now, digitalization and globalization are making the industry more competitive, requiring supply chains to be managed more efficiently as they become interconnected worldwide.
Unplanned interruptions in the manufacturing process drive increased costs, leading to lower utilization of machinery and product throughput, and extended lead times. Current operational processes create several related challenges. For example, maintenance planning is typically based on inadequate data and much time is spent on information collection and documentation, or on training repair crews to use complex and diverse machinery.
Augmented reality (AR)2 will help to address these challenges. One example is the use of AR alongside applications supporting data analysis and diagnostics, which will enable preventive and remote maintenance. These measures optimize the cost of operations, while also increasing uptime in the manufacturing process. Depending on the specifics of the use case, AR support will be provided through a range of devices, such as smartphones, tablets, smart helmets, smart gloves and smart glasses.
Repair crews could also be supported by augmented information. For example, operational guidance and automated processes could enable them to more easily carry out preventive and corrective maintenance, with less time spent on fault identification and a reduction in human error.
The role of 5G
Many use cases can be addressed by evolved 4G (LTE) networks. As networks evolve further there will be even more opportunities to enhance existing use cases, as well as to meet the demands of new ones when 5G is implemented.
5G will be highly beneficial for industrial use cases where AR-based applications will require high data rates and low latency. Bandwidth requirements are expected to be significant to ensure consistent and secure streaming of high-resolution images, as well as large volumes of data, in a sensor-rich environment with high-connection density.
Current On the road to 5G 5G experiences
Enhanced mobile broadband
Browsing, social media, music, video
Fixed Wireless Access, interactive live concerts and sports events
4K/8K videos, mobile AR/VR gaming, immersive media
AutomotiveWi-Fi hotspots, on-demand GPS map data, over-the-air software updates
Predictive vehicle maintenance; capturing of sensor data for real-time traffic, weather, parking and mapping services
Autonomous vehicle control, cooperative collision avoidance, vulnerable road user discovery
ManufacturingConnected goods, intra/inter enterprise communication
Collaborative robots, distributed control system, remote quality inspection
Remote control of robots; AR in training, maintenance, construction and repair
Energy and utilitiesSmart metering, dynamic and bidirectional grids
Distributed energy resource management, distribution automation
Control of edge-of-grid generation, virtual power plants, real-time load balancing
HealthcareRemote patient monitoring, connected ambulances, electronic health records
Tele surgery, AR aiding medical treatment
Precision medicine, remote robotic surgery, ambulance drones
Technologies
> Multi-standard network> Cat-M1/NB-IoT> Cloud-optimized
network functions> VNF orchestration
> Gigabit LTE (TDD, FDD, LAA)> Massive MIMO> Network slicing> Dynamic service orchestration> Predictive analytics
> 5G New Radio> Virtualized RAN> Federated network slicing> Distributed cloud> Real-time machine learning/AI
Examples of use case evolution and supporting network technologies

28 ERICSSON MOBILITY REPORT NOVEMBER 2017
Economic growth in Western Europe1 is steady and the region’s governments are supporting future digital developments, paving the way for 5G adoption. By the end of 2017, LTE will be the dominant mobile technology and, with a compound annual growth rate (CAGR) of 10 percent, it is continuing to expand
Key figures: Western Europe 2017 2023 CAGR 2017–2023
Mobile subscriptions (million) 520 560 1%
Smartphone subscriptions (million) 400 480 3%
Mobile broadband subscriptions (million) 470 560 3%
LTE subscriptions (million) 250 450 10%
Cellular IoT subscriptions (million) 120 410 22%
Data traffic per active smartphone (GB/month) 4.1 28 38%
Total mobile data traffic (EB/month) 1.8 12 37%
Countries in Western Europe are showing a continued and steady recovery.2 Economic growth is being supported by recent expansionary fiscal policies, combined with strengthened monetary policies. As part of these policies, many governments in Western Europe are supporting developments in their information and communication infrastructure to boost long-term economic growth. For example, the UK government has committed GBP 1.1 billion to its future digital infrastructure, including fiber and 5G.3
1 In this report, Western Europe includes: Åland Islands, Andorra, Austria, Belgium, Cyprus, Denmark, Faroe Islands, Finland, France, Germany, Gibraltar, Greece, Greenland, Guernsey, Iceland, Ireland, Isle of Man, Italy, Jersey, Liechtenstein, Luxembourg, Malta, Monaco, Netherlands, Norway, Portugal, Réunion, San Marino, Spain, Svalbard and Jan Mayen, Sweden, Switzerland, United Kingdom
2 OECD Economic Outlook, Volume 2017, Issue 1 (June 2017). This issue showed that in the Eurozone, GDP growth is projected to remain around 1.75 percent in 2017 and 2018
3 UK Government Department for Culture, Media and Sport, Next Generation Mobile Technologies: A 5G Strategy for the UK (March 2017)
Mobile subscriptions by technology in Western Europe Smartphone penetration of handsets (percent)
0 0
600
500
100
400
80
300
60
20040
100 20
2013 20132014 20142015 20152016 20162017 20172018 20182019 20192020 20202021 20212022 20222023 2023
LTE5G WCDMA/HSPA Western Europe GlobalGSM/EDGE-only
Western Europe in focus
Countries within Western Europe have developed economies, with high gross domestic product (GDP) per capita. This enables an increased rate of information and communication technology adoption, reflected in the high levels of smartphone ownership. The left-hand graph below shows that, by the end of 2017, LTE will be the dominant mobile technology, with around 50 percent of all subscriptions, representing an 11 percentage point increase compared to 2016. The first commercial 5G networks and devices based on 3GPP standards are expected to go live in 2019, with major network deployments from 2020. By 2023, 5G will make up 16 percent of all mobile subscriptions in the region.

NOVEMBER 2017 ERICSSON MOBILITY REPORT 29
By 2023, data usage is expected to be 6.5 times that of the end of 2017. This is a result of the increased consumption of broadband-intensive services, such as video, and new applications like virtual reality (VR) and augmented reality (AR)
Mobile traffic
1 Calculated with an average streaming video media rate of 5Mbps2 The statistics on mobile consumption were sourced from App Annie. App Annie Intelligence data for
Android phones was derived from mobile usage data collected from a large sample of real-world users 3 Ericsson analysis of App Annie data for Android OS smartphone apps
Base: Active Android OS smartphone users (September 2016–August 2017)
Smartphones dominate mobile subscriptions and drive data traffic
In 2023, total mobile data usage in Western Europe is expected to reach around 12 ExaBytes (EB) per month – equivalent to 6 billion hours of movie watching.1 This growth is fueled by the continued transition to LTE, as well as increased usage by individual smartphone users. Today, smartphones dominate the mobile subscription market with a 76 percent share of subscriptions. Average data traffic per smartphone will increase from 4.1GB per month per user at the end of 2017 to 28GB by 2023 – a CAGR of 38 percent.
Western Europe has the world’s second highest consumption of traffic per month per active smartphone, exceeded only by North America. Across both Western Europe and North America, a combination of high-end user devices, well-built-out WCDMA and LTE networks, and affordable packages that offer large volumes of data resulted in high data usage per subscription.
Demand for video shows no sign of slowing
Video is a significant contributor to data traffic, and consumer demand for video services shows no sign of slowing down. The chart below2 shows the consumption of two popular video services on Android phones (YouTube and Netflix) over a year and across four countries: the UK,
Germany, France and Spain. The graph shows that there is a common trend among all four countries – that the amount of both time and data consumed per user per month have significantly increased over the period September 2016 to August 2017.
Analysis of data across the UK, Germany, France and Spain for Android smartphone users shows that the number using video services has increased, impacting the overall level of data consumption. For example, YouTube penetration rose by around 20 percent from September 2016 to August 2017 across the 4 markets, while for Netflix the number of active Android users has doubled in the same period.3
Western Europe traffic forecast (EB/month)
2013 2014 2015 2016 2017 20212019 20232018 20222020
0
14
12
10
8
6
4
2
Smartphone PC/tablet/router
Source: Ericsson analysis of App Annie data for Android OS smartphone apps. Base: Active Android OS smartphone users (September 2016–August 2017)
Average increase in Gigabytes consumed per user per month from September 2016 to August 2017 (percent)
NetflixYouTube
Average increase in time per user per month from September 2016 to August 2017 (percent)
NetflixYouTube
0
404550
3530252015105
UK France SpainGermany0
8090
100
70605040302010
UK France SpainGermany

30 ERICSSON MOBILITY REPORT NOVEMBER 2017
MERGED REALITY TO DRIVE 5G EXPECTATIONSToday, early adopters of VR and AR are already starting to recognize the potential for 5G to improve the current experience. In Western Europe 40 percent of consumers are aware of 5G today
1 Foreign Affairs, Klaus Schwab, The Fourth Industrial Revolution (December 2015)2 Ericsson ConsumerLab, Merged Realities (2017)3 Ericsson ConsumerLab, Analytical Platform (2017)
Moving towards a merged reality
VR and AR could shift our use of technology by enabling consumers to transition between virtual and physical worlds. The idea of merging the real with the digital has been coined the Fourth Industrial Revolution.1
There are many recent examples of physical reality being merged with virtual experiences – challenging traditional notions of “real experience”.
For example, the location-based AR game Pokémon Go allows players to catch virtual monsters on real streets, in parks and in subway stations (or wherever they happen to be). Global hotelier Marriott teleports its guests to exotic locations virtually, helping them to decide on a vacation spot, and the Guinness World Records book allows readers to have their picture taken with the world’s shortest man through an AR-enriched app, before sending it to friends and family.
Improving the VR experience
With many of these experiences, VR technologies in their current form collide rather than merge with our physical reality. Bulky headsets cut the user off from their surroundings and hinder mobility, and a highly interactive VR experience can induce nausea for some people.
A report highlighted that, during qualitative VR tests, for the majority of users the amount of lag determined whether or not they felt nauseous. However, at opposite ends of the spectrum there were some users who were almost immune to nausea and some who would always feel nauseous.2 A next-generation network, like 5G, that minimizes lag time could address this issue, but today only around 20 percent of early VR adopters surveyed expect 5G technology to do so.
A third of early adopters believe that next-generation networks could enable more shared experiences and wireless headsets with less lag. However, despite the qualitative research showing the connection between lag and nausea, a limited number of consumers understand the impact that lag has on nausea today. With lower latency, new features like haptics can be added to the VR experience, but still only around a quarter of users expect 5G to deliver on that promise.
These figures show that some early adopters of VR, though small in number today, are starting to recognize the potential of 5G. This is despite only 40 percent of consumers being aware of 5G, and 1 in 10 saying they felt comfortable explaining it to others, according to another recent survey in Germany, France, Ireland and the UK.3
0
5
30
35
25
20
15
10
5G could enable users to have more shared experiences
since it will reduce the lag in the network considerably
5G could make wired VR headsets wireless by providing a high-bandwidth, less-lag network
5G could enable adding haptic feedback or the sense
of touch to VR devices
5G could help to overcome the nausea and sickness
associated with VR experiences since it will reduce the lag in
the network considerably
Source: Ericsson ConsumerLab, Merged Realities (2017)Base: Smartphone users aged 15–69 across France, Germany, Italy, Spain and the UK, who currently use tethered VR headsets at least several times a week
Share of early adopters of VR that expect 5G will play a central role (percent)

NOVEMBER 2017 ERICSSON MOBILITY REPORT 31
Industry Opportunities for 5G5G will be a major driver of digitalization. It will enable and enhance use cases including immersive gaming, autonomous driving, remote robotic surgery, production-line robotics, VR and AR
1 Ericsson, The 5G Business Potential, second edition (October 2017)
5G-fueled business potential
Cellular Internet of Things (IoT) in Western Europe is growing at a CAGR of 22 percent – rising from 120 million to 410 million by 2023 – and representing almost 30 percent of total cellular IoT connections globally.
IoT communications, high-performance mobile connectivity and cloud services are expected to become key driving forces behind business innovation. A recent report identifies opportunities for telecom operators who address industry digitalization.1 The report highlights a 5G digitalization revenue potential of USD 619 billion globally in 2026, with an equivalent of USD 150 billion in Western Europe.
Globally, the sectors that have the greatest revenue potential for operators when enhanced by 5G are manufacturing, energy and utilities – and the same is true for Western Europe.
The graphs below illustrate that the manufacturing, energy and utilities industries are worth a potential USD 27.5 billion and USD 22.5 billion respectively to operators in the region. Germany, followed by the UK,
France, Italy and Spain, are the five markets in Western Europe with the highest 5G-enabled business potential for manufacturing.
New operator opportunities
Industry digitalization presents new opportunities, and operators can take on a range of roles along the value chain, including:
> IoT connectivity provider: Providing reliable and scalable networks to connect the growing numbers of devices and manage the connections securely and cost effectively
> IoT service enabler: Offering flexible and agile platforms to enable swift onboarding of new ecosystem partners and speedy launches of new IoT services to the market
> IoT service creator: Creating innovative, end-to-end services that go directly to end users while transforming own sales, distribution and delivery channels for targeted market segments
Operator-addressable 5G digitalization revenue potential for Western Europe in 2026 (percent)
Operator-addressable market for manufacturing in Western Europe (billion)
Source: Ericsson, The 5G Business Potential, second edition (October 2017)Base: Operator-addressable 5G industry digitalization revenues, 2026, Western Europe
Financial services
UKAutomotive
Germany
Manufacturing
Energy and utilities
Others
Healthcare
France
Public transport
Spain
Media and entertainment
Public safety
ItalyRetail
8%
5%
5%
12%
18%
10%13%
12%
16%
USD 150 billion
1% Agriculture
0
5
30
25
20
15
10
2020 2021 2022 2023 2024 2025 2026

32 ERICSSON MOBILITY REPORT NOVEMBER 2017
Forecast methodology
Ericsson makes forecasts on a regular basis to support internal decisions and planning, as well as market communication. The subscription and traffic forecast baseline in this report uses historical data from various sources, validated with Ericsson internal data, including extensive measurements in customer networks. Future development is estimated based on macroeconomic trends, user trends (researched by Ericsson ConsumerLab), market maturity, technology development expectations and documents – such as industry analyst reports – on national and regional levels, together with internal assumptions and analyses.
Historical data may be revised if the underlying data changes – for example, if operators report updated subscription figures.
Mobile subscriptions include all mobile technologies. Subscriptions are defined by the most advanced technology that the mobile phone and network are capable of. Figures are rounded and therefore summing up rounded data may result in slight differences from the actual totals. In the key figures tables, subscriptions have been rounded to the nearest 10th million. However, when used in highlights in the articles, subscriptions are usually expressed in full billions or to one decimal. Compound annual growth rate (CAGR) is rounded to the nearest full percentage figure, and traffic volumes are expressed in two digits, for example, 69GB/month or 8.5GB/month.
Traffic refers to aggregated traffic in mobile access networks and does not include DVB-H, Wi-Fi or Mobile WiMAX traffic. VoIP is included in data traffic.
Traffic measurements
New devices and applications affect mobile networks. Having a deep and up-to-date knowledge of the traffic characteristics of different devices and applications is important when designing, testing and managing mobile networks. Ericsson regularly performs traffic measurements in over 100 live networks covering all major regions of the world. Detailed measurements are made in a selected number of commercial WCDMA/HSPA and LTE networks with the purpose of discovering different traffic patterns. All subscriber data is made anonymous before it reaches Ericsson’s analysts.
Population coverage methodology
Population coverage is estimated using a database of regional population and territory distribution based on population density. This is then combined with proprietary data on the installed base of Radio Base Stations (RBS) combined with estimated coverage per RBS for each of six population density categories (from metro to wilderness). Based on this, the portion of each area that is covered by a certain technology can be estimated, as well as the percentage of the population it represents. By aggregating these areas on a regional and global level, world population coverage per technology can be calculated.
methodology

NOVEMBER 2017 ERICSSON MOBILITY REPORT 33
2G: 2nd generation mobile networks (GSM, CDMA 1x)
3G: 3rd generation mobile networks (WCDMA/HSPA, TD-SCDMA, CDMA EV-DO, Mobile WiMAX)
3GPP: 3rd Generation Partnership Project
4G: 4th generation mobile networks (LTE, LTE-A)
5G: 5th generation mobile networks (not yet standardized)
App: A software application that can be downloaded and run on a smartphone or tablet
CAGR: Compound annual growth rate
Cat-M1: A 3GPP standardized low-power wide-area (LPWA) cellular technology for IoT connectivity. Cat-M1 is a solution that can be deployed on LTE, targeting a wide range of IoT applications from simple to rich content
CDMA: Code Division Multiple Access
dB: In radio transmission, a decibel is a logarithmic unit that can be used to sum up total signal gains or losses from a transmitter to a receiver through the media a signal passes
DL: Downlink
EB: ExaByte, 1018 bytes
EDGE: Enhanced Data Rates for Global Evolution
EPC: Evolved Packet Core
GB: GigaByte, 109 bytes
GHz: Gigahertz, 109 hertz (unit of frequency)
Gbps: Gigabits per second
GSA: Global mobile Suppliers Association
GSM: Global System for Mobile Communications
GSMA: GSM Association
HSPA: High Speed Packet Access
ICT: Information and Communications Technology
IMS: IP Multimedia Subsystem
ITU: International Telecommunication Union
IoT: Internet of Things
Kbps: Kilobits per second
LTE: Long-Term Evolution
MB: MegaByte, 106 bytes
MBB: Mobile Broadband (defined as CDMA2000 EV-DO, HSPA, LTE, Mobile WiMAX and TD-SCDMA)
Mbps: Megabits per second
MHz: Megahertz, 106 hertz (unit of frequency)
MIMO: Multiple Input Multiple Output is the use of multiple transmitters and receivers (multiple antennas) on wireless devices for improved performance
Mobile PC: Defined as laptop or desktop PC devices with built-in cellular modem or external USB dongle
Mobile router: A device with a cellular network connection to the internet and Wi-Fi or Ethernet connection to one or several clients (such as PCs or tablets)
NB-IoT: A 3GPP standardized low-power wide-area (LPWA) cellular technology for IoT connectivity. NB-IoT is a narrowband solution that can be deployed on LTE, or as a standalone solution, targeting ultra-low-throughput IoT applications
NFV: Network Functions Virtualization
NR: New Radio as defined by 3GPP Release 15
OS: Operating System
PB: PetaByte, 1015 bytes
QAM: Quadrature Amplitude Modulation
SDN: Software-Defined Networking
Smartphone: Mobile phone with OS capable of downloading and running “apps” e.g. iPhones, Android OS phones, Windows phones and also Symbian and Blackberry OS
TD-SCDMA: Time Division-Synchronous Code Division Multiple Access
TDD: Time Division Duplex
VoIP: Voice over IP (Internet Protocol)
VoLTE: Voice over LTE as defined by GSMA IR.92 specification. An end-to-end mobile system including IP Multimedia Subsystem (IMS), Evolved Packet Core (EPC), LTE RAN, Subscriber Data Management and OSS/BSS
UL: Uplink
WCDMA: Wideband Code Division Multiple Access
glossary

34 ERICSSON MOBILITY REPORT NOVEMBER 2017
2016 20172023
forecastCAGR**
2017–2023 Unit
Mobile subscriptions
Worldwide mobile subscriptions 7,510 7,790 9,120 3% million
> Smartphone subscriptions 3,840 4,410 7,270 9% million
> Mobile PC, tablet and mobile router* subscriptions
240 260 330 4% million
> Mobile broadband subscriptions 4,410 5,160 8,450 9% million
> Mobile subscriptions, GSM/EDGE-only 3,010 2,560 640 -21% million
> Mobile subscriptions, WCDMA/HSPA 2,260 2,380 1,970 -3% million
> Mobile subscriptions, LTE 1,900 2,620 5,470 13% million
> Mobile subscriptions, 5G 1,000 million
Mobile data traffic*
> Data traffic per smartphone 2.1 2.9 17 34% GB/month
> Data traffic per mobile PC 7.7 9.8 27 18% GB/month
> Data traffic per tablet 3.6 4.6 12 18% GB/month
1 These figures are also included in the figures for North East Asia2 These figures exclude Pakistan3 These figures are also included in the figures for Middle East and Africa
* Active devices ** CAGR is calculated on unrounded figures *** Figures are rounded (see methodology) and therefore summing up
of rounded data may result in slight differences from the actual total
Global and regional key figuresIn this edition of the Ericsson Mobility Report, we have included the regional key figures in addition to the global figures
GLOBAL Key figures
Total data traffic***
Total mobile data traffic 8.8 14 110 42% EB/month
> Smartphones 7.2 11 100 44% EB/month
> Mobile PCs and routers 1.3 1.6 4.5 19% EB/month
> Tablets 0.32 0.47 1.8 25% EB/month
Total fixed data traffic 70 80 250 20% EB/month
To find out more, scan the QR code, or visit
www.ericsson.com/mobility-report
Traffic Exploration Tool:
Create your own graphs, tables and data using the Ericsson Traffic Exploration
Tool. The information available here can be filtered by region, subscription,
technology, traffic and device type. You may use charts generated from this
tool in your own publications as long as Ericsson is stated as the source.
Regional versions:
This time we have provided five versions of the report: a standalone global version as well
as four variations of this, each containing a section for a different region of the world.

NOVEMBER 2017 ERICSSON MOBILITY REPORT 35
2016 20172023
forecastCAGR**
2017–2023 Unit
Mobile subscriptions
North America 380 390 460 3% million
Latin America 690 700 780 2% million
Western Europe 520 520 560 1% million
Central and Eastern Europe 580 610 640 1% million
North East Asia 1,720 1,780 2,090 3% million
China1 1,320 1,380 1,600 3% million
South East Asia and Oceania 1,070 1,110 1,290 3% million
India, Nepal and Bhutan 1,160 1,240 1,500 3% million
Middle East and Africa2 1,390 1,440 1,800 4% million
Sub-Saharan Africa3 660 700 990 6% million
Smartphone subscriptions
North America 290 310 390 4% million
Latin America 410 460 610 5% million
Western Europe 380 400 480 3% million
Central and Eastern Europe 240 270 490 10% million
North East Asia 1,310 1,430 1,940 5% million
China1 1,050 1,150 1,560 5% million
South East Asia and Oceania 470 560 1,050 11% million
India, Nepal and Bhutan 270 380 970 17% million
Middle East and Africa2 470 600 1,340 14% million
Sub-Saharan Africa3 260 340 850 17% million
Total mobile data traffic
North America 1.8 2.6 18 39% EB/month
Latin America 0.7 1.1 8.9 42% EB/month
Western Europe 1.2 1.8 12 37% EB/month
Central and Eastern Europe 0.76 1.2 9.3 41% EB/month
North East Asia 1.9 3.2 21 37% EB/month
China1 1.0 1.8 15 41% EB/month
South East Asia and Oceania 0.79 1.3 12 45% EB/month
India, Nepal and Bhutan 1.0 1.3 14 48% EB/month
Middle East and Africa 0.71 1.3 14 48% EB/month
Sub-Saharan Africa3 0.25 0.41 4.6 50% EB/month
Data traffic per smartphone*
North America 5.2 7.1 48 37% GB/month
Latin America 1.7 2.4 16 36% GB/month
Western Europe 2.8 4.1 28 38% GB/month
Central and Eastern Europe 2.7 3.8 19 31% GB/month
North East Asia 1.2 1.9 12 35% GB/month
China1 0.84 1.5 9.5 36% GB/month
South East Asia and Oceania 1.8 2.7 15 34% GB/month
India, Nepal and Bhutan 4.1 3.9 18 30% GB/month
Middle East and Africa 1.3 2.0 11 34% GB/month
Sub-Saharan Africa3 1.0 1.4 7.0 31% GB/month
regional Key figures

EAB-17:013260 Uen RevA
© Ericsson AB 2017
Ericsson
SE-164 80 Stockholm, Sweden
Telephone +46 10 719 0000
www.ericsson.com
Ericsson is a world leader in communications technology and services
with headquarters in Stockholm, Sweden. Our organization consists
of more than 111,000 experts who provide customers in 180 countries
with innovative solutions and services. Together we are building a
more connected future where anyone and any industry is empowered
to reach their full potential. Net sales in 2016 were SEK 222.6 billion
(USD 24.5 billion). The Ericsson stock is listed on Nasdaq Stockholm
and on NASDAQ in New York. Read more on www.ericsson.com