
Ericsson ConsumerLab: Experience shapes mobile customer loyalty
Upload
ericssonCategory
view
991download
1
CONSUMERLAB
The Indoor Influence
Consumer Insight Summary Report April 2015
Regional report Europe
METHODOLOGYThe data presented in this report was gathered in 2014 from a total of 14,246 online interviews and 250 face-to-face interviews conducted across 8 countries in Europe: Austria, Denmark, Germany, Italy, Russia, Sweden, UK and Ukraine. Interviews were conducted with consumers aged 15–69 years old. Overall, the data represents 218 million people living in Europe.
Ericsson ConsumerLab has 20 years’ experience of studying people’s behaviors and values, including the way they act and think about ICT products and services. Ericsson ConsumerLab provides unique insights on market and consumer trends.
Ericsson ConsumerLab gains its knowledge through a global consumer research program based on interviews with 100,000 individuals each year, in more than 40 countries and 15 megacities – statistically representing the views of 1.1 billion people.
contents FROM DUSK ’TIL DAWN 3
LOCATION EQUATION 4
THE GENERATION GAME 6
INFORMATION IN HAND 7
DEVICE PICKS 8
CONNECTIVITY CHECKLIST 9
Both quantitative and qualitative methods are used, and hundreds of hours are spent with consumers from different cultures. To be close to the market and consumers, Ericsson ConsumerLab has analysts in all regions where Ericsson is present, developing a thorough global understanding of the ICT market and business models.
All reports can be found at: www.ericsson.com/consumerlab
the voice of the consumer
2 ERICSSON CONSUMERLAB THE INDOOR INFLUENCE EUROPE
Key findings
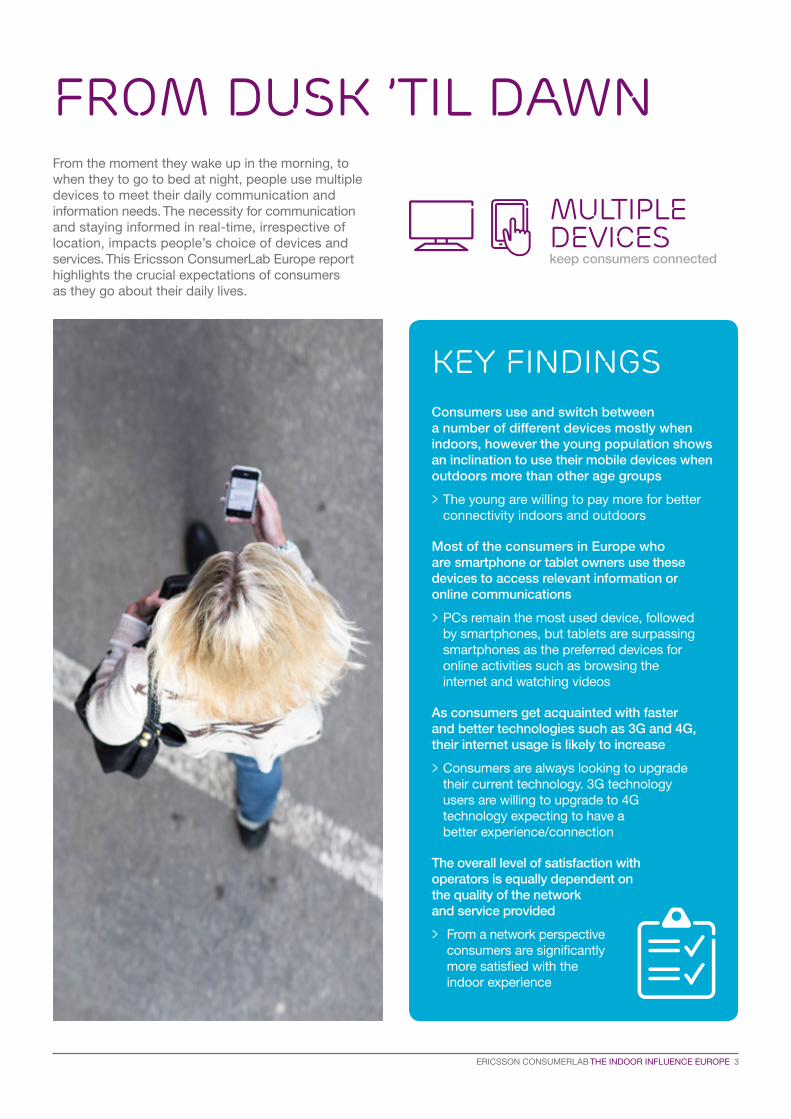
FROM DUSK ’TIL DAWNFrom the moment they wake up in the morning, to when they to go to bed at night, people use multiple devices to meet their daily communication and information needs. The necessity for communication and staying informed in real-time, irrespective of location, impacts people’s choice of devices and services. This Ericsson ConsumerLab Europe report highlights the crucial expectations of consumers as they go about their daily lives.
MULTIPLE DEVICES keep consumers connected
Consumers use and switch between a number of different devices mostly when indoors, however the young population shows an inclination to use their mobile devices when outdoors more than other age groups
> The young are willing to pay more for better connectivity indoors and outdoors
Most of the consumers in Europe who are smartphone or tablet owners use these devices to access relevant information or online communications
> PCs remain the most used device, followed by smartphones, but tablets are surpassing smartphones as the preferred devices for online activities such as browsing the internet and watching videos
As consumers get acquainted with faster and better technologies such as 3G and 4G, their internet usage is likely to increase
> Consumers are always looking to upgrade their current technology. 3G technology users are willing to upgrade to 4G technology expecting to have a better experience/connection
The overall level of satisfaction with operators is equally dependent on the quality of the network and service provided
> From a network perspective consumers are significantly more satisfied with the indoor experience
ERICSSON CONSUMERLAB THE INDOOR INFLUENCE EUROPE 3
LOCATION EQUATION
Source: Ericsson ConsumerLab, The indoor influence Europe, 2015Base: Users of respective services on any device
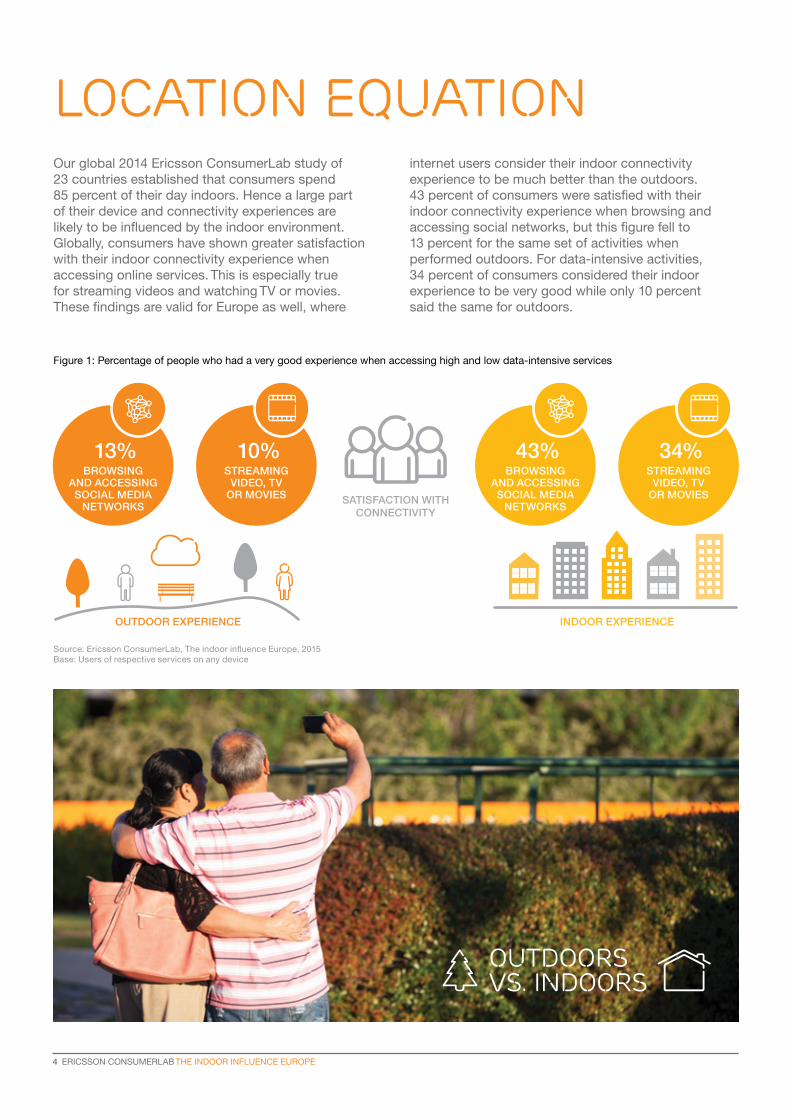
Our global 2014 Ericsson ConsumerLab study of 23 countries established that consumers spend 85 percent of their day indoors. Hence a large part of their device and connectivity experiences are likely to be influenced by the indoor environment. Globally, consumers have shown greater satisfaction with their indoor connectivity experience when accessing online services. This is especially true for streaming videos and watching TV or movies. These findings are valid for Europe as well, where
internet users consider their indoor connectivity experience to be much better than the outdoors. 43 percent of consumers were satisfied with their indoor connectivity experience when browsing and accessing social networks, but this figure fell to 13 percent for the same set of activities when performed outdoors. For data-intensive activities, 34 percent of consumers considered their indoor experience to be very good while only 10 percent said the same for outdoors.
Figure 1: Percentage of people who had a very good experience when accessing high and low data-intensive services
OUTDOOR EXPERIENCE
OUTDOORS VS. INDOORS
INDOOR EXPERIENCE
SATISFACTION WITH CONNECTIVITY
STREAMING VIDEO, TV
OR MOVIES
STREAMING VIDEO, TV
OR MOVIES
BROWSING AND ACCESSING SOCIAL MEDIA
NETWORKS
BROWSING AND ACCESSING SOCIAL MEDIA
NETWORKS
34% 10% 43% 13%
4 ERICSSON CONSUMERLAB THE INDOOR INFLUENCE EUROPE
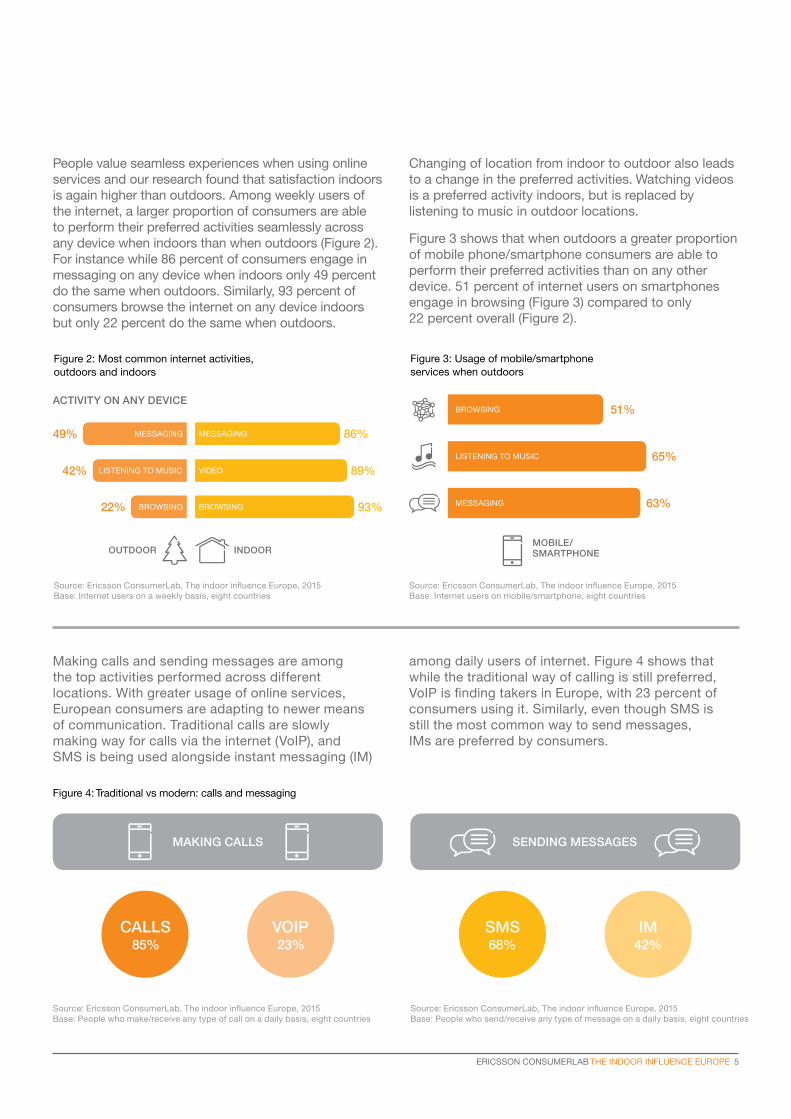
Figure 2: Most common internet activities, outdoors and indoors
People value seamless experiences when using online services and our research found that satisfaction indoors is again higher than outdoors. Among weekly users of the internet, a larger proportion of consumers are able to perform their preferred activities seamlessly across any device when indoors than when outdoors (Figure 2). For instance while 86 percent of consumers engage in messaging on any device when indoors only 49 percent do the same when outdoors. Similarly, 93 percent of consumers browse the internet on any device indoors but only 22 percent do the same when outdoors.
Changing of location from indoor to outdoor also leads to a change in the preferred activities. Watching videos is a preferred activity indoors, but is replaced by listening to music in outdoor locations.
Figure 3 shows that when outdoors a greater proportion of mobile phone/smartphone consumers are able to perform their preferred activities than on any other device. 51 percent of internet users on smartphones engage in browsing (Figure 3) compared to only 22 percent overall (Figure 2).
BROWSING
VIDEO
MESSAGINGMESSAGING
LISTENING TO MUSIC
BROWSING
Figure 3: Usage of mobile/smartphone services when outdoors
93%22%
42%
49%
89%
86%
MOBILE/ SMARTPHONE
Source: Ericsson ConsumerLab, The indoor influence Europe, 2015Base: Internet users on mobile/smartphone, eight countries
Source: Ericsson ConsumerLab, The indoor influence Europe, 2015 Base: Internet users on a weekly basis, eight countries
51%BROWSING
65%LISTENING TO MUSIC
63%MESSAGING
Source: Ericsson ConsumerLab, The indoor influence Europe, 2015 Base: People who make/receive any type of call on a daily basis, eight countries
Figure 4: Traditional vs modern: calls and messaging
MAKING CALLS
ACTIVITY ON ANY DEVICE
Source: Ericsson ConsumerLab, The indoor influence Europe, 2015 Base: People who send/receive any type of message on a daily basis, eight countries
SENDING MESSAGES
Making calls and sending messages are among the top activities performed across different locations. With greater usage of online services, European consumers are adapting to newer means of communication. Traditional calls are slowly making way for calls via the internet (VoIP), and SMS is being used alongside instant messaging (IM)
among daily users of internet. Figure 4 shows that while the traditional way of calling is still preferred, VoIP is finding takers in Europe, with 23 percent of consumers using it. Similarly, even though SMS is still the most common way to send messages, IMs are preferred by consumers.
INDOOROUTDOOR
68% 42%IMSMS
85% 23%VOIPCALLS
ERICSSON CONSUMERLAB THE INDOOR INFLUENCE EUROPE 5
MESSAGINGSOCIAL NETWORKING
INTERNET BROWSING
ONLINE SHOPPING
WORK/STUDY RELATED
GAMING LISTENING TO MUSIC
WATCHING VIDEO
CALLS
51%48% 48%
40%
33%
28%
36%34%
29%
23%
14%11%
15–24 25–29 30–39 40–49 50–59 60+
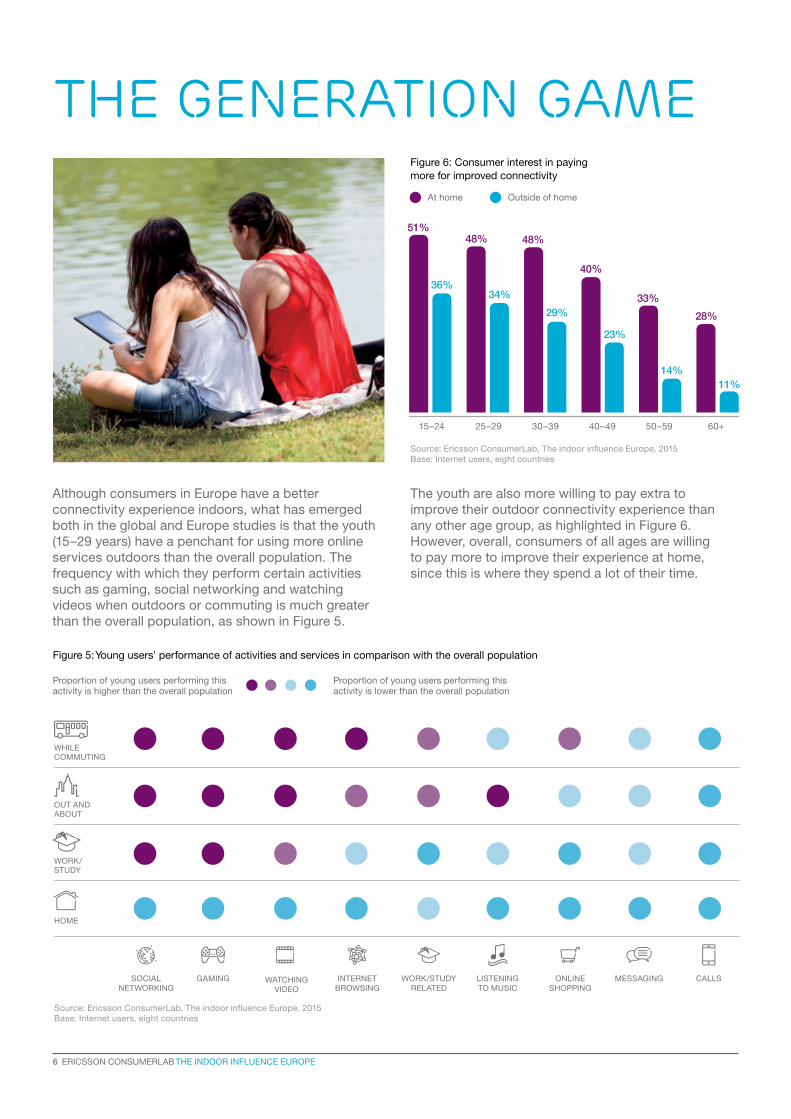
Although consumers in Europe have a better connectivity experience indoors, what has emerged both in the global and Europe studies is that the youth (15–29 years) have a penchant for using more online services outdoors than the overall population. The frequency with which they perform certain activities such as gaming, social networking and watching videos when outdoors or commuting is much greater than the overall population, as shown in Figure 5.
The youth are also more willing to pay extra to improve their outdoor connectivity experience than any other age group, as highlighted in Figure 6. However, overall, consumers of all ages are willing to pay more to improve their experience at home, since this is where they spend a lot of their time.
THE GENERATION GAMEFigure 6: Consumer interest in paying more for improved connectivity
Figure 5: Young users’ performance of activities and services in comparison with the overall population
At home Outside of home
OUT AND ABOUT
WHILE COMMUTING
WORK/ STUDY
HOME
Proportion of young users performing this activity is lower than the overall population
Proportion of young users performing this activity is higher than the overall population
Source: Ericsson ConsumerLab, The indoor influence Europe, 2015 Base: Internet users, eight countries
Source: Ericsson ConsumerLab, The indoor influence Europe, 2015 Base: Internet users, eight countries
6 ERICSSON CONSUMERLAB THE INDOOR INFLUENCE EUROPE
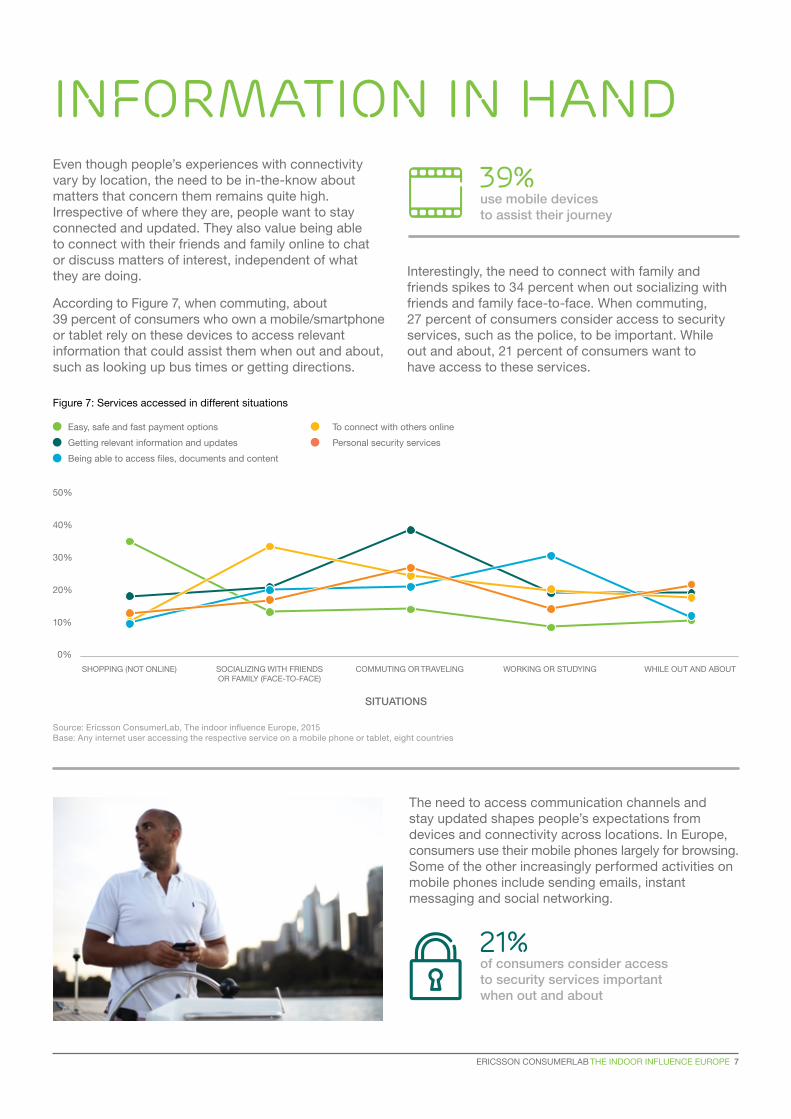
Even though people’s experiences with connectivity vary by location, the need to be in-the-know about matters that concern them remains quite high. Irrespective of where they are, people want to stay connected and updated. They also value being able to connect with their friends and family online to chat or discuss matters of interest, independent of what they are doing.
According to Figure 7, when commuting, about 39 percent of consumers who own a mobile/smartphone or tablet rely on these devices to access relevant information that could assist them when out and about, such as looking up bus times or getting directions.
Interestingly, the need to connect with family and friends spikes to 34 percent when out socializing with friends and family face-to-face. When commuting, 27 percent of consumers consider access to security services, such as the police, to be important. While out and about, 21 percent of consumers want to have access to these services.
The need to access communication channels and stay updated shapes people’s expectations from devices and connectivity across locations. In Europe, consumers use their mobile phones largely for browsing. Some of the other increasingly performed activities on mobile phones include sending emails, instant messaging and social networking.
INFORMATION IN HAND
Figure 7: Services accessed in different situations
Source: Ericsson ConsumerLab, The indoor influence Europe, 2015 Base: Any internet user accessing the respective service on a mobile phone or tablet, eight countries
SHOPPING (NOT ONLINE)
10%
20%
0%
30%
40%
50%
SOCIALIZING WITH FRIENDS OR FAMILY (FACE-TO-FACE)
COMMUTING OR TRAVELING
SITUATIONS
WORKING OR STUDYING WHILE OUT AND ABOUT
Easy, safe and fast payment options
Getting relevant information and updates
Being able to access files, documents and content
To connect with others online
Personal security services
39%use mobile devices to assist their journey
21%of consumers consider access to security services important when out and about
ERICSSON CONSUMERLAB THE INDOOR INFLUENCE EUROPE 7
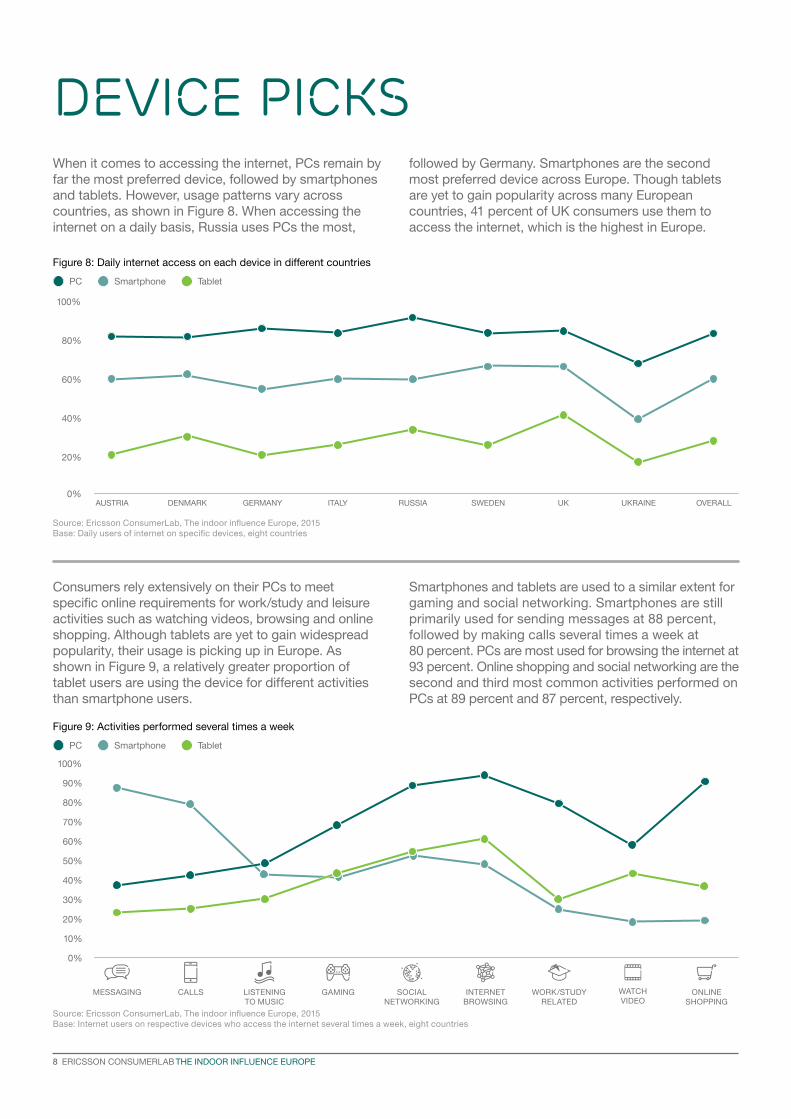
Consumers rely extensively on their PCs to meet specific online requirements for work/study and leisure activities such as watching videos, browsing and online shopping. Although tablets are yet to gain widespread popularity, their usage is picking up in Europe. As shown in Figure 9, a relatively greater proportion of tablet users are using the device for different activities than smartphone users.
Smartphones and tablets are used to a similar extent for gaming and social networking. Smartphones are still primarily used for sending messages at 88 percent, followed by making calls several times a week at 80 percent. PCs are most used for browsing the internet at 93 percent. Online shopping and social networking are the second and third most common activities performed on PCs at 89 percent and 87 percent, respectively.
When it comes to accessing the internet, PCs remain by far the most preferred device, followed by smartphones and tablets. However, usage patterns vary across countries, as shown in Figure 8. When accessing the internet on a daily basis, Russia uses PCs the most,
followed by Germany. Smartphones are the second most preferred device across Europe. Though tablets are yet to gain popularity across many European countries, 41 percent of UK consumers use them to access the internet, which is the highest in Europe.
Figure 8: Daily internet access on each device in different countries
Figure 9: Activities performed several times a week
DEVICE PICKS
10%
60%
60%
20%
0%
20%
0%
70%
30%
80%
80%
40%
40%
90%
50%
100%
100%
PC
PC
Smartphone
Smartphone
Tablet
Tablet
LISTENING TO MUSIC
GAMING SOCIAL NETWORKING
CALLS ONLINE SHOPPING
WATCH VIDEO
WORK/STUDY RELATED
MESSAGING INTERNET BROWSING
AUSTRIA DENMARK GERMANY ITALY RUSSIA SWEDEN UK UKRAINE OVERALL
Source: Ericsson ConsumerLab, The indoor influence Europe, 2015 Base: Internet users on respective devices who access the internet several times a week, eight countries
Source: Ericsson ConsumerLab, The indoor influence Europe, 2015 Base: Daily users of internet on specific devices, eight countries
8 ERICSSON CONSUMERLAB THE INDOOR INFLUENCE EUROPE
10%
60%
20%
0%
30%
40%
50%
3G 4G
LISTENING TO MUSIC
GAMING SOCIAL NETWORKING
CALLS ONLINE SHOPPING
WATCH VIDEO
WORK/STUDY RELATED
MESSAGING INTERNET BROWSING
Source: Ericsson ConsumerLab, The indoor influence Europe, 2015 Base: Internet users who use respective generations of mobile internet, eight countries
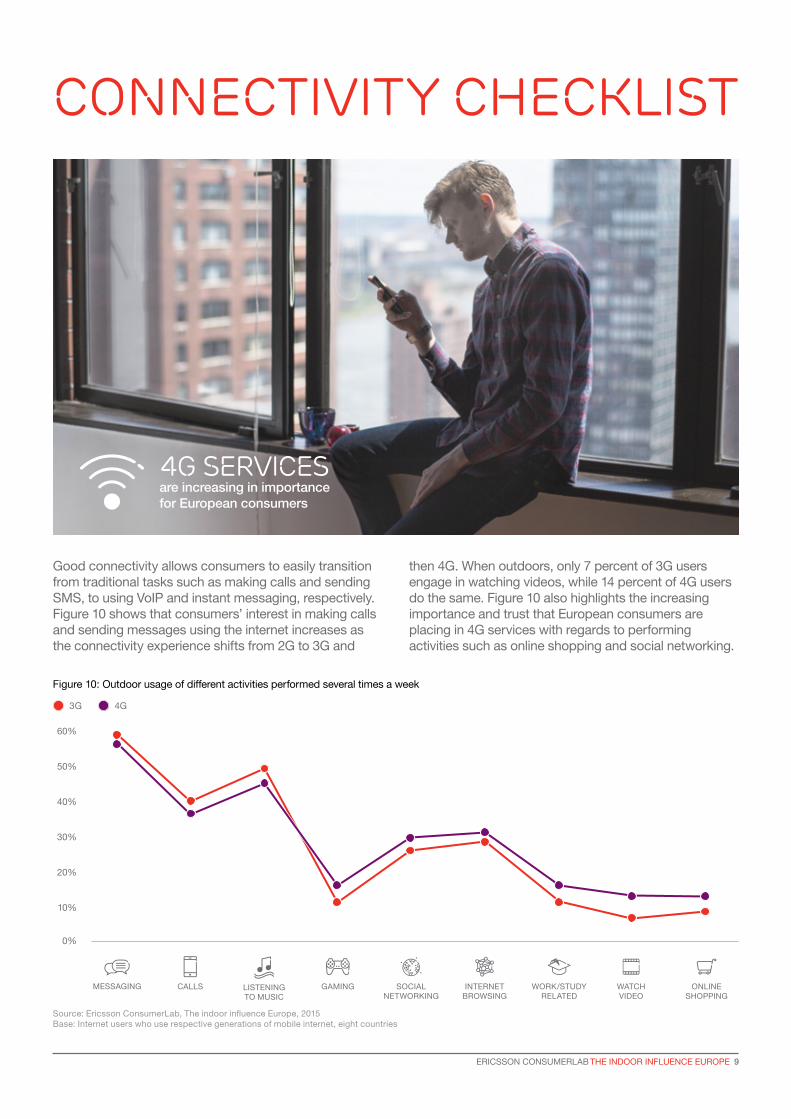
Good connectivity allows consumers to easily transition from traditional tasks such as making calls and sending SMS, to using VoIP and instant messaging, respectively. Figure 10 shows that consumers’ interest in making calls and sending messages using the internet increases as the connectivity experience shifts from 2G to 3G and
then 4G. When outdoors, only 7 percent of 3G users engage in watching videos, while 14 percent of 4G users do the same. Figure 10 also highlights the increasing importance and trust that European consumers are placing in 4G services with regards to performing activities such as online shopping and social networking.
CONNECTIVITY CHECKLIST
Figure 10: Outdoor usage of different activities performed several times a week
4G services are increasing in importance for European consumers
ERICSSON CONSUMERLAB THE INDOOR INFLUENCE EUROPE 9
PLANNING TO UPGRADE TO 4G
PLANNING TO UPGRADE TO 3G
PLANNING TO CHANGE NETWORK/ CONNECTION PLAN
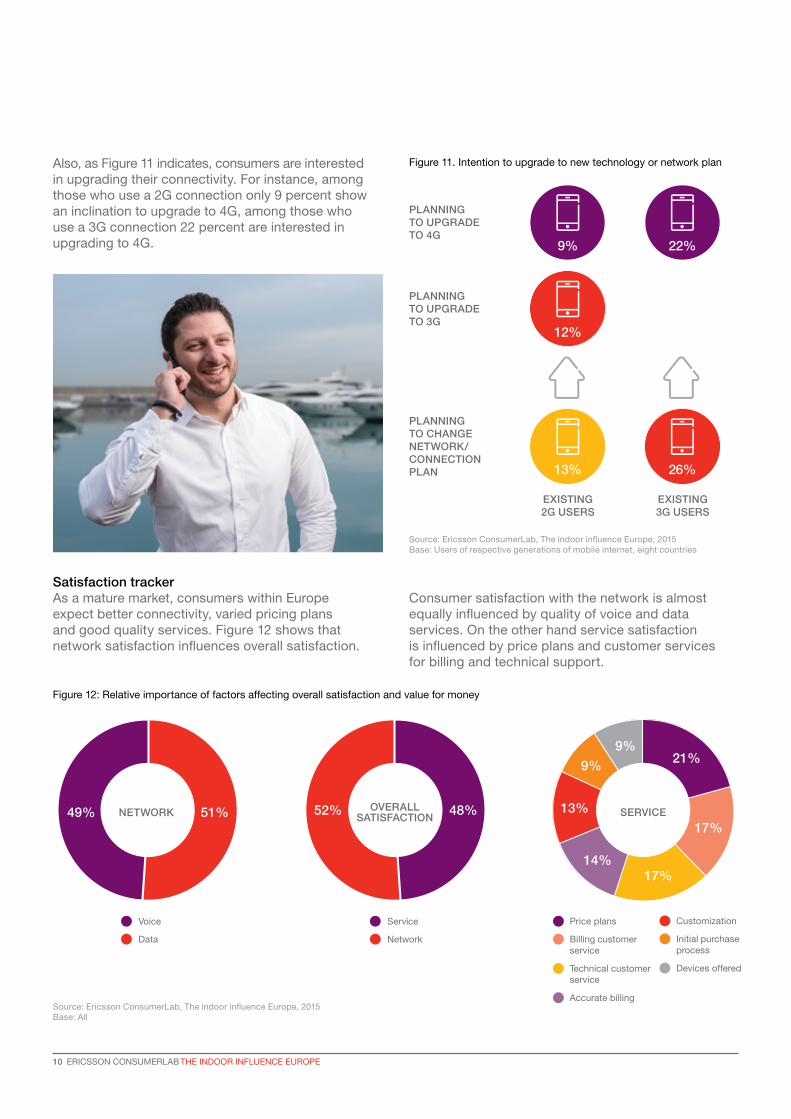
Figure 11. Intention to upgrade to new technology or network plan
Figure 12: Relative importance of factors affecting overall satisfaction and value for money
Satisfaction trackerAs a mature market, consumers within Europe expect better connectivity, varied pricing plans and good quality services. Figure 12 shows that network satisfaction influences overall satisfaction.
Consumer satisfaction with the network is almost equally influenced by quality of voice and data services. On the other hand service satisfaction is influenced by price plans and customer services for billing and technical support.
EXISTING 3G USERS
EXISTING 2G USERS
26%
22%
13%
12%
9%
Devices offered
Initial purchase process
Customization
Accurate billing
Technical customer service
Billing customer service
Price plans
Source: Ericsson ConsumerLab, The indoor influence Europe, 2015 Base: Users of respective generations of mobile internet, eight countries
Source: Ericsson ConsumerLab, The indoor influence Europe, 2015 Base: All
21%
17%
17%14%
13%
9%
9%
Also, as Figure 11 indicates, consumers are interested in upgrading their connectivity. For instance, among those who use a 2G connection only 9 percent show an inclination to upgrade to 4G, among those who use a 3G connection 22 percent are interested in upgrading to 4G.
Service
Network
52% 48%OVERALL SATISFACTION51%49%
Voice
Data
NETWORK SERVICE
10 ERICSSON CONSUMERLAB THE INDOOR INFLUENCE EUROPE
Overall, the European market still favors PCs, followed by smartphones. Consumers are keen to use their mobile devices to track updates and stay informed, irrespective of location. This need is met through the seamless use of devices mostly when indoors, and to a lesser extent, outdoors. When compared to the overall population, the youth show a greater inclination to use their mobile devices outdoors.
In Europe operator satisfaction is balanced between network performance and the service provided. These, and other factors such as the rise in smartphone usage, the openess of youth to greater connectivity and the spread of 4G will determine the manner in which consumers in Europe will assess and adapt to new technologies and services.
Network performance and service are key to customer satisfaction
ERICSSON CONSUMERLAB THE INDOOR INFLUENCE EUROPE 11
EAB-14:063296 Uen © Ericsson AB 2015
EricssonSE-126 25 Stockholm, Sweden Telephone +46 10 719 00 00 www.ericsson.com
The content of this document is subject to revision withoutnotice due to continued progress in methodology, design andmanufacturing. Ericsson shall have no liability for any error ordamage of any kind resulting from the use of this document.
Ericsson is the driving force behind the Networked Society – a world leader in communications technology and services. Our long-term relationships with every major telecom operator in the world allow people, business and society to fulfill their potential and create a more sustainable future.
Our services, software and infrastructure – especially in mobility, broadband and the cloud – are enabling the telecom industry and other sectors to do better business, increase efficiency, improve the user experience and capture new opportunities.
With approximately 115,000 professionals and customers in 180 countries, we combine global scale with technology and services leadership. We support networks that connect more than 2.5 billion subscribers. Forty percent of the world’s mobile traffic is carried over Ericsson networks. And our investments in research and development ensure that our solutions – and our customers – stay in front.
Founded in 1876, Ericsson has its headquarters in Stockholm, Sweden. Net sales in 2014 were SEK 228.0 billion (USD 33.1 billion). Ericsson is listed on NASDAQ OMX stock exchange in Stockholm and the NASDAQ in New York.