ERDF South West operational programme - Gov.uk
154
South West Competitiveness and Employment Programme Operational Programme 2007-13
Transcript of ERDF South West operational programme - Gov.uk

South West Competitiveness and
Employment Programme
Operational Programme 2007-13

The South West Competitiveness and Employment Operational Programme
Contents
1 Executive Summary ......................................................................................................................1
2 Introduction ................................................................................................................................. 13
3 Socio-Economic Baseline – Headline Analysis ........................................................................ 14
4 Strengths, Weaknesses, Opportunities and Threats ............................................................... 56
5 Strategy for the Programme....................................................................................................... 59 5.1 Process for Chosen Strategy............................................................................................ 59 5.2 Strategy Context for the Strategy: Economic, Policy and Resources .......................... 60 5.3 Programme Contribution to Policy................................................................................... 66 5.4 Contributing to the Regional Economic Strategy ........................................................... 68 5.5 Meeting European Requirements..................................................................................... 70
6 Priorities....................................................................................................................................... 75 6.1 Introduction........................................................................................................................ 75 6.2 Summary Financial Allocations........................................................................................ 75 6.3 Priority Axis 1: Innovation and Knowledge .................................................................... 77 6.4 Priority Axis 2: Enterprise and Growth............................................................................ 85 6.5 Priority Axis 3: Urban Enterprise......................................................................................92 6.6 Priority Axis 4: Technical Assistance ............................................................................ 100
7 Cross-Cutting Themes.............................................................................................................. 102 7.1 Equality and Diversity ..................................................................................................... 102 7.2 Environment ..................................................................................................................... 110
8 Financial Allocations................................................................................................................. 118
9 Co-ordination............................................................................................................................. 120
10 Implementing Provision............................................................................................................ 127 Bibliography .................................................................................................................Annex A Equality Impact Assessment Screening ....................................................................Annex B Categorisation of Structural Funds Assistance ........................................................Annex C Strategic Environmental Assessment ........................................................................Annex D SEA Non Technical Summary .....................................................................................Annex E Ex Ante Evaluation.......................................................................................................Annex F Ex Ante Evaluation Summary .....................................................................................Annex G

The South West Competitiveness Operational Programme
1
1 Executive Summary
1.1 Introduction The South West of England will benefit from European Structural Funds for the period 2007-13. Under the European Regional Development Fund (ERDF) the South West Competitiveness Area1 has been allocated €124.7 million, which will be matched equally by the UK public sector. The total value of the ERDF Competitiveness funding to the South West is €249.3 million. The Operational Programme has been produced under the guidance provided by the South West Cohesion Group, supported by a considerable number of workshops attended by a variety of stakeholders to help develop proposals. The South West Cohesion Framework, which has guided the development of the Operational Programme, is a result of two years work by a number of key partners. The Programme has four Priorities as follows: Priority Axis 1: Innovation and Knowledge Priority Axis 2: Enterprise and Growth Priority Axis 3: Urban Enterprise Priority Axis 4: Technical Assistance This is a balanced set of Priorities that takes account of the Lisbon and Gothenburg agendas. The focus is on improving the competitiveness of the regions of Europe, while taking account of the need to develop and maintain an inclusive society and protect and enhance our environment. The Programme Priority Axes have clear linkages with the National Strategic Reference Framework (NSRF) priorities of: (i) Promoting innovation and knowledge transfer, (ii) stimulating enterprise and supporting successful business, and (iii) building sustainable communities. Furthermore, the Environment Cross Cutting Theme links to the NSRF priority of ensuring sustainable development, production, and consumption. The Lisbon Reform Plan priorities have been covered by the NSRF Priorities. Particular linkages may also be made with the Community Strategic Guidelines (CSG) priorities of: (i) enhancing the attractiveness of member states, regions, and cities, (ii) encouraging innovation, entrepreneurship and the growth of the knowledge economy. Activity to address the CSG priority of creating more and better jobs by attracting more people into employment, improving adaptability of workers and enterprise and increasing investment in human capital will be predominantly delivered through the South West ESF Framework. A fuller analysis of the linkages between the Competitiveness and European and National Policy is provided in the Strategy for the Programme section of the main document.
1.2 Socio-Economic Baseline Population and Economy A key feature of the South West economy is the wide disparities that exist in GVA. In recent years the South West GVA growth has outperformed the UK, at a time of national economic growth, however the best performing regions are located in the North and East of the region. Within the South West there are significant variations in the level of GVA per head, ranging between £24,300 in Swindon to only £10,200 in Torbay. The South West has experienced significant levels of population growth in recent years. Inward migration has included a significant proportion of working age people, which have contributed to the 1 The whole of the South West Excluding Cornwall and the Isles of Scilly
2
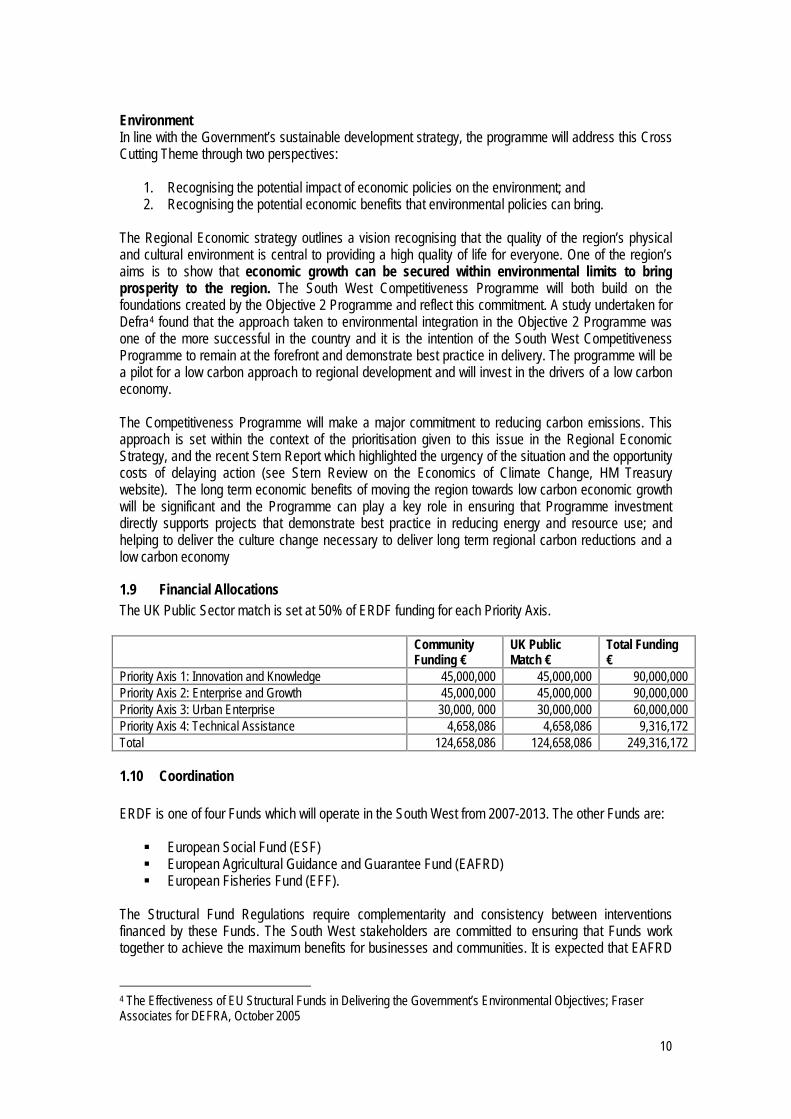
economic output of the region. However the steady aging of the population has implications for service provision, particularly within certain areas. The region has benefited from strong employment growth rates over the past twenty years, however significant levels of part-time employment reflect the dominance of lower paid employment (particularly in the health, retail, and tourism). This is a particular issue in the region’s many rural areas, and towards the west of the region. Key Sectors The South West has a number of strengths on which to build amongst its target sectors, with above average levels of GVA per employee generated in advanced engineering, environmental technologies and the marine sector. Other sectors with lower levels of GVA per head continue to play an important role, including tourism and food and drink, which continue to employ large numbers of local workers. A number of sectors play an important role in providing employment in the west of the region, where employment rates are below the regional average. Enterprise While the region has a high level of business density, well above the national average, this is not being translated into higher rates of productivity, reflecting the high proportion of businesses in lower value added sectors. Businesses within the region tend to be smaller than nationally (only 23% employ more than five people) and while the region’s high rates of business survival allude to a strong business base, it may also indicate a lack of competitive pressure within the South West market. Innovation Investment in Research and Development (R&D) within the region’s business base is stronger than nationally. However the region performs below average concerning the number of high technology patent applications submitted to the European Patent Office and R&D investment among the region’s HEIs is weak. Innovative activity2 is largely concentrated in the north east of the region, which is home to a high proportion of the region’s high-tech industries. R&D is heavily concentrated in the aerospace and defence and communications technology sectors and the region needs to address the challenge of broadening engagement in other innovative sectors and elsewhere in the region. Skills The region’s working age population is relatively well qualified, however the existing skills base is not being fully utilised by the region’s businesses. A large number of working age individuals that do not hold qualifications at level 2 and many of these are among the 59% with poor numeracy skills and the 13% with poor literacy skills. The region’s skills gaps are currently concentrated in the blue-collar sectors and elementary occupations. The region’s skills shortage vacancies are most acutely felt among smaller companies, on which the impact of such vacancies is likely to be more severe due to their limited size. The pattern of increasing employment in managerial, professional and associate occupations is set to continue and the number of people employed in elementary occupations is forecast to decline. Despite this, the ageing workforce means there will still be significant replacement demand in elementary occupations as people retire. Deprivation Although the South West experiences lower levels of deprivation than nationally, there are pockets of severe deprivation across the region, primarily in the urban areas. Plymouth and Bristol have the largest concentrations of severe disadvantage, although other centres are also affected. 2 Measured by patent and high technology patents submitted to the European Patent Office and Research and Development Activity.

3
There is a need to reduce the number of workless households and to provide support for those on sickness and incapacity benefit to re-enter the labour market. This group – some 7.2% of the working age population – potentially represent a valuable resource for the labour market given the current lack of capacity to increase employment levels from within the existing economically active population. Rural and Urban Issues The proportion of South West residents residing in rural areas is the highest of the nine English regions (34.1%). Rural areas also account for one third of the region’s businesses. Rural areas will face particular potential pressures arising as a consequence of the CAP reforms, which are expected to affect the amount of land used for agricultural purposes. Additional challenges relate to poor access to jobs and services, notably in the more peripheral areas of the region. These issues, highlighted by the Index of Multiple Deprivation (IMD), present a challenge to the achievement of balanced, sustainable and inclusive economic development. The region’s urban areas act as a key driver of economic growth in the region. A key challenge is to ensure that economic growth within the region’s urban areas is inclusive, given the concentrations of deprivation that exist in many urban areas. A further issue is to ensure that the functional links between the urban areas and the rest of the region reflect the physical and economic roles that each area performs in the regional economy. Environment The region’s high quality of life and high quality environment are central elements of the region’s ‘brand’. In addition to generating tourism, they make a significant contribution to both inward investment and the retention of businesses within the region. Underpinning the environment driver agenda is the need to ensure that the quality of the region’s environmental assets is maintained. These assets are the amenity value of both the natural (landscape, biodiversity) and the built and historic environment. All these assets have intrinsic value and many demonstrate positive economic linkages. The existing strengths of the environmental goods and services sector (including environmental technology and renewable energy) in the South West provide an important economic opportunity as attention to environmental issues increases. However, while the industry has grown significantly (by 44%) in the South West since 19983, share relative to the UK as a whole has fallen in the South West in that period (from 88 to 68 where UK is 100). Investment in this sector will aim to reverse this decline. The UK Centre for Economic and Environmental Development has identified seven key drivers for the environmental business sector. These include legislation, resource scarcity and consumer influence. This Programme will seek to address two specific drivers – investment in R&D and commercialisation activities, and public procurement policy – a particularly powerful driver of environmentally improved products and services. It is also important to recognise that investment in the environmental goods and services sector is an important component of the Programme’s strategy to invest in the drivers of a low carbon economy and deliver economic growth within environmental limits. The South West is not one homogeneous economy. There is a clear east west divide in the region, with the three western zones, including Cornwall and the Isles of Scilly characterised by: lower employment rates and higher levels of worklessness; lower levels of productivity and a business base with lower proportions of growth and higher skilled sectors; and a workforce profile with high numbers with basic and low level skills.
1.3 SWOT Analysis The balance of the regional SWOT reflects the South West’s position as a mid ranking English region. The strengths are reasonable – enterprise culture, some strong sectors, reasonably qualified workforce 3 An assessment of the sector was carried out by Ekos Consulting on behalf of the SW Objective 2 Programme Environmental Sustainability Theme Partnership and the Cornwall and Isles of Scilly Objective One Partnership Office.

4
– while the weaknesses are challenging, without being threatening. The exception is the disparity between east and north of the region, compared to the and south and west, particularly the far west. There are very real prospect that the gap will widen. The SWOT suggests that there is a much sharper contrast within the region, than between the region and nationally. The opportunities are also adequate, although again probably more weighted to the more prosperous parts of the region, with the possible exception of environmental technologies and renewable energy. Strengths 1. Good enterprise culture and business start up
rate 2. Strong presence of some growth sectors –
including ICT, creative industries and biotechnology
3. Higher than average business investment in R&D and large number of high technology patent applications (from small number of sectors)
4. Relatively good qualifications of young people and a well qualified workforce
5. Environmental goods and services base distributed across the region
6. Quality of the natural environment which attracts residents and investment
7. Connectivity of the north east of the region to London and South East based markets.
8. Awareness of the environment as an economic driver
Weaknesses 1. Low productivity levels generated by the
region’s business base and under-representation of knowledge intensive growth sectors
2. Low levels of exporting and concentration in small number of sectors and companies
3. Peripherality of the west of the Competitiveness Area and structural bias towards low value added and seasonal economic activity, coupled with other rural isolation elsewhere in the region
4. Concentrated areas of deprivation (notably Bristol, Torbay and Plymouth) and economic and social exclusion
5. Basic skills issues in terms of numeracy and ICT
6. A large number of very small businesses 7. Concentration of R&D in a small number of
large businesses in aerospace and defence and communication technologies
Opportunities 1. The potential for SMEs in certain sectors to
take advantage of growing national and international markets
2. Demand for environmental technologies and renewable energies – further promoted through the Stern Report
3. Higher Education Institutes and opportunities for knowledge transfer
4. Opportunities arising from digital applications, more widespread broadband and ICT adoption and applications resulting in new business opportunities
5. Export potential and further trade opportunities in markets of Asia, Oceania and Eastern Europe, generated through increasing globalisation.
6. Addressing the challenge of delivering a low carbon economy.
Threats 1. Potential for diverging patterns of employment
growth in the west of the region, notably Torbay, Plymouth and parts of rural Devon
2. Growing international competition for jobs in manufacturing and service industries leading to outsourcing and offshoring
3. Structural adjustment in more remote rural areas
4. Increasing energy prices and uncertainty of supply
5. Climate change resulting in adverse weather, flooding and sea level rise
6. Carbon emissions and the potential impact of legislation on businesses.

5
1.4 Policy Context: Summary European Policy (Revised Lisbon Agenda Strategic Guidelines)
UK Policy (Lisbon National Reform Programme and National Strategic Reference Framework)
Programme Actions
Knowledge and Innovation Increase and improve investment in RTD
Promoting Productivity and Growth: Science, Innovation, and Knowledge Transfer
Under Priority 1 support will be provided for business/HE technology institutes based on proven business demand, allowing SMEs in supply chains to access knowledge and quickly apply new technologies; support for IPR and its exploitation; and business and HE/FE interaction.
Facilitate innovation and promote entrepreneurship
Promoting Productivity and Growth: Enterprise and Successful Business Promoting Productivity and Growth: Science, Innovation and Knowledge Transfer Promoting Productivity and Growth: Building Sustainable Communities
Priority 1 will provide high quality support for new starts based on innovative product, and process developments with considerable market potential. Priority 1 will also promote the management and exploitation of the full range of intellectual assets to generate business innovation and product and process improvements. Priority 2 will support new starts with growth potential in knowledge based sectors.
Promote the Information Society for all
The Programme will promote ICT skills across the region. In addition, the knowledge based focus of Priorities 1 and 2 will further promote importance of ICT skills in assisting business growth.
Improve access to finance
Promoting Productivity and Growth: Enterprise and Successful Business & Promoting Productivity and Growth: Investment
Priority 1 will provide proof of concept funding critical to the pre-commercial development new ideas relating to environmental technologies. Priority 2 will provide support to new starts with growth potential in knowledge based sectors in addition to activities aimed at improving the competitiveness of companies’ high growth potential. Access to finance and investor readiness support may be provided under this priority, if appropriate. Priority 3 will provide micro-finance initiatives, including small scale loans, where there is a clear market failure.
An attractive area in which to invest and work To strengthen the synergies between environmental protection and growth.
Promoting Productivity and Growth: Sustainable development, production and consumption and related innovation: Promoting Productivity and Growth: Building Sustainable Communities
Sustainable development underpins all Programme activities. More specifically, Priorities 1 and 2 will promote the development of the Environmental Goods and Services sector. Priority 2 will also promote activities to promote the environmental performance of businesses in the region. Priority 3 will stimulate local people,

6
businesses, and social enterprises to develop commercial opportunities with regard to environmental opportunities, such as energy efficiency and renewable energy.
Address Europe’s intensive use of traditional energy sources
Promoting Productivity and Growth: Sustainable development, production and consumption and related innovation
Priorities 1 and 2 will promote the development of the Environmental Goods and Services sector, including renewables. Priority 3 will stimulate local people, businesses, and social enterprises to develop commercial opportunities with regard to environmental opportunities, such as energy efficiency and renewable energy.
Attract and retain more people in employment and modernise social protection systems
Employment Opportunity for All: Extending Working Lives
Activities under ERDF Priorities 1 and 2 will provide higher quality and more sustainable employment opportunities.
Improve adaptability of workers and enterprises and the flexibility of the labour market
Promoting Productivity and Growth: Skills & Employment Opportunity for All: Developing a Skilled and Adaptable Workforce
Activities under ERDF Priorities 1 and 2 will indirectly stimulate demand from employers to raise skills within the workforce.
Increase investment in human capital through better education and skills
Promoting Productivity and Growth: Skills & Employment Opportunity for All: Equipping People to Realise their potential Employment Opportunity for All: Developing a Skilled and Adaptable Workforce
Activities under ERDF Priorities 1 and 2 will assist the development of knowledge based firms within the region, further promoting demand for higher level skills within the region.
1.5 Strategy for the Programme The development of the Operational Programme has been overseen by the South West Cohesion Group, made up of senior stakeholders covering the key public sector agencies and groups, including the voluntary sectors. This Group was established in 2004, and has reviewed each stage of the process, including the development process which engaged a wide range of stakeholders. This strategy has been developed through an extensive process of consultation with regional and local stakeholders. Emerging priorities were developed through two initial Task and Finish Groups: Innovation and Competitiveness and Growth and Sustainable Communities. This was followed by a further series of Task and Finish Groups, four regional consultation events and a formal 12 weeks consultation exercise which resulted in 30 responses. The Strategy developed takes full account of European, national and regional policy and builds upon the SWOT analysis outlined earlier. The work of the various partnerships groups has further refined the strategy to ensure that it meets the needs of the region.

7
1.6 The Context for the Strategy The evidence indicates that there is a need in the west of the region to accelerate the re-structuring process, creating jobs and businesses in new, higher skilled sectors. The continuing re-structuring of the industrial base in the west, along with a similar situation in rural areas, has exacerbated intra regional disparities. The need to develop higher value added jobs in sectors where there are long term growth prospects applies across the whole region. As well as restructuring, there is a need to focus on increasing productivity of the business base as a means of maintaining employment levels and increasing wages. Innovation has an important role to play in helping existing businesses improve their competitiveness. The evidence also indicates that the region’s average performance at a national level hides significant and long standing sub-regional disparities. While the strategy has taken full account of the EU and national policies, and the Regional Economic Strategy, additional policy developments which have had a major impact on the strategy include the Stern Report and the implications of climate change. The emergence of the Local Enterprise Growth Initiative has added a new dimension to addressing the difficulties facing disadvantaged communities, by developing locally based enterprise support. As resources are very limited, the need to set objectives which are both realistic and achievable becomes more important. It is not realistic to expect ERDF funding to solve all of these problems. Resources need to be targeted at tightly defined priorities in order to affect significant change. The Programme has a single objective to increase the prosperity of the region through supporting enterprises and individuals to develop ideas and plans which contribute to increased productivity and competitiveness, which in turn is supported by four operational objectives:
• Increasing the productivity of the region’s business base, through the promotion and support of innovation, research and development and the application of knowledge;
• Reduce intra regional disparities through stimulating enterprise and accelerating business growth in those parts of the region lagging behind;
• To increase employment and enterprise in the region’s most disadvantaged communities; and • Protect and enhance the region’s environmental assets and work towards developing a low
carbon economy. These will require the region to:
• Improve the productivity of existing businesses through incremental innovation and capitalising on knowledge and intellectual property;
• Develop a business base with a greater proportion of employment in higher paid jobs and in sectors where the growth prospects are positive i.e. a more rounded, modern, knowledge based economy. This is a very high priority for the west of the region, and for those local economies (such as Torbay) which have been under-performing; and
• Improve the skills of the workforce and better utilise the skills of existing workers to improve the performance of the region’s businesses.

8
1.7 Priority Axes Three main Priorities have been developed to address the objectives, supported by a Technical Assistance Programme to help manage and implement Programme activities. These Priorities will be aligned with other European Programme to achieve the maximum benefits for the region. Account has also been taken of the limited budget available in the South West. Priority Axis 1: Knowledge and Innovation The aim of this Priority is to improve the regions overall performance with regard to innovation and close the intra-regional gap in innovation performance, bringing the rest of the region closer to the high performing Gloucestershire, Wiltshire and North Somerset area. The Priority has a key role to play in maximising the economic contribution from the region’s HE/FE institutions and helping companies exploit their own ideas and innovations. The strategic objectives are to:
1) Improve the sales and productivity of companies through increasing the rate of innovation and the economic benefits from the pull through and exploitation of knowledge (research and development and other intellectual assets) including product and process improvements.
2) Increase the number of high value added, innovative new start businesses. Supported Activities Financial Range Supporting ideas and innovation 25%- 45% Improving FE/HE interactions with SMEs 25%-40% Business/HE technology initiatives 20%-30% Environmental goods and services (including environmental technologies and renewable energy)
Total Funds (EU and UK)
€90m 2007-2013 10%- 25%
Priority Axis 2: Enterprise and Growth The aim of this priority is to increase the contribution that high value added businesses make to the economy and reduce intra-regional disparities. This priority has a key role to play in addressing the low earnings, low skilled nature of the economy. This Priority Axis will not fund generic new start and business support, but will focus on high growth businesses, companies in high value added sectors, and those requiring a highly skilled workforce. The strategic objectives are to:
1. Increase the proportion of businesses and employment in high value added business activities. 2. Increase the quality of new starts through supporting high growth / value added new starts. 3. Increase the sales and productivity of businesses through the provision of high quality business
support in key areas including internationalisation and investment support. Supported Activities Financial Range High growth new starts and accelerating business growth 30%-60% Internationalisation 20%-25% Environmental performance in business 10%-15% Environmental Goods and Services (including Environmental Technologies and Renewable Energy
Total Funds (EU and UK)
€90m 2007-2013 10%-25%

9
Priority Axis 3: Urban Enterprise The aim of this priority is to find new approaches to addressing the problems in the region’s most deprived neighbourhoods through enterprise creation. This priority has a key role to play in testing new ideas to stimulate enterprise amongst people from all backgrounds in the region’s most deprived neighbourhoods. Given the limited resources available, resources will be focused on activities to benefit the deprived neighbourhoods of Bristol, Plymouth and Torbay. The strategic objective is to increase the level of enterprise / social enterprise activity in the region’s most deprived neighbourhoods. Supported Activities Financial Range Small scale infrastructure and facilities 10%-25% Promoting and encouraging new enterprises / social enterprises 20%-35% Access to finance 10%-20% Targeted business support services in the community 20%-35% Enterprise opportunities from environmental improvements
Total Funds (EU and UK)
€60m 2007-2013
10%-20% Priority Axis 4: Technical Assistance Partners have high expectations as to the quality of ERDF investments and Technical Assistance (TA) will be used in a focused way so that it supports the development of these investments. Any use of TA will be within the context of Article 45 of the EU Regulation 1083/2006 and will be applied to the following activities. Supported Activities Financial Range Programme development and capacity building 20%-40% The provision of management and monitoring information 20%-40% Programme related analysis, monitoring, and evaluation 20%-30% Activity to support collaborative and joint working 10%-20% Publicity and communications
Total Funds (EU and UK)
€9.3m 2007-2013
10%-20%
1.8 Cross Cutting Themes Equality and Diversity For the region’s economic growth targets to be achieved, all members of society need to be able to contribute their full economic potential. However, whilst legislation is in place to prevent discrimination within the workplace some people are working below their full potential due to a range of barriers. The challenge for the Programme is to ensure that all members of society are able to benefit and access the support proposed under this programme. Many of the proposed activities are tightly focused on developing a knowledge based economy and left unchecked there is a risk that under-represented groups will be indirectly discriminated against. The objectives for the Programme will be to:
Increase the number of people from under-represented groups owning their own business. Increase the take-up of quality training and employment by under-represented target groups. Increase the number of people in under-represented groups accessing training and
employment in higher skilled occupations and sectors where they are currently under-represented.
Ensure that business support is inclusive and responsive to the needs of all communities and under-represented groups.
Increase the participation of people from under-represented groups in the management and implementation structures of the programme. It is important that partnerships, selection panels and other administrative groups are representative at all levels and positive steps are taken to gain the active involvement of under-represented groups.
10
Environment In line with the Government’s sustainable development strategy, the programme will address this Cross Cutting Theme through two perspectives:
1. Recognising the potential impact of economic policies on the environment; and 2. Recognising the potential economic benefits that environmental policies can bring.
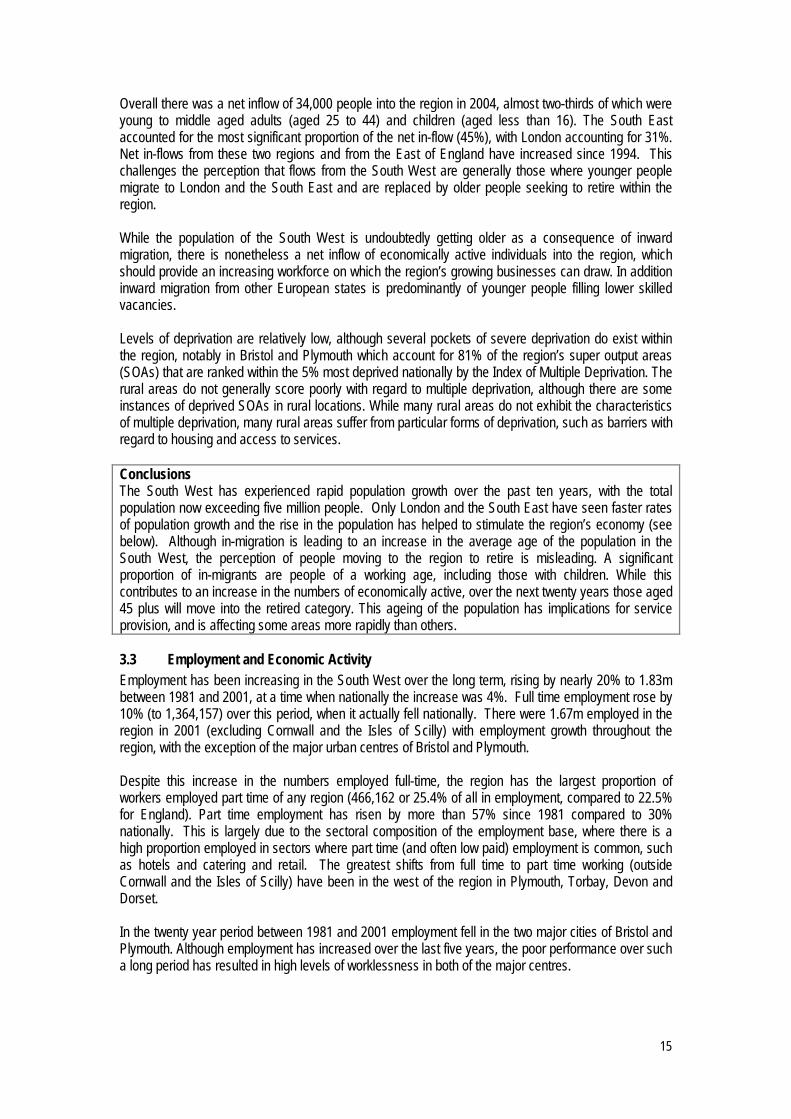
The Regional Economic strategy outlines a vision recognising that the quality of the region’s physical and cultural environment is central to providing a high quality of life for everyone. One of the region’s aims is to show that economic growth can be secured within environmental limits to bring prosperity to the region. The South West Competitiveness Programme will both build on the foundations created by the Objective 2 Programme and reflect this commitment. A study undertaken for Defra4 found that the approach taken to environmental integration in the Objective 2 Programme was one of the more successful in the country and it is the intention of the South West Competitiveness Programme to remain at the forefront and demonstrate best practice in delivery. The programme will be a pilot for a low carbon approach to regional development and will invest in the drivers of a low carbon economy. The Competitiveness Programme will make a major commitment to reducing carbon emissions. This approach is set within the context of the prioritisation given to this issue in the Regional Economic Strategy, and the recent Stern Report which highlighted the urgency of the situation and the opportunity costs of delaying action (see Stern Review on the Economics of Climate Change, HM Treasury website). The long term economic benefits of moving the region towards low carbon economic growth will be significant and the Programme can play a key role in ensuring that Programme investment directly supports projects that demonstrate best practice in reducing energy and resource use; and helping to deliver the culture change necessary to deliver long term regional carbon reductions and a low carbon economy
1.9 Financial Allocations The UK Public Sector match is set at 50% of ERDF funding for each Priority Axis. Community
Funding € UK Public Match €
Total Funding €
Priority Axis 1: Innovation and Knowledge 45,000,000 45,000,000 90,000,000 Priority Axis 2: Enterprise and Growth 45,000,000 45,000,000 90,000,000 Priority Axis 3: Urban Enterprise 30,000, 000 30,000,000 60,000,000 Priority Axis 4: Technical Assistance 4,658,086 4,658,086 9,316,172 Total 124,658,086 124,658,086 249,316,172
1.10 Coordination ERDF is one of four Funds which will operate in the South West from 2007-2013. The other Funds are:
European Social Fund (ESF) European Agricultural Guidance and Guarantee Fund (EAFRD) European Fisheries Fund (EFF).
The Structural Fund Regulations require complementarity and consistency between interventions financed by these Funds. The South West stakeholders are committed to ensuring that Funds work together to achieve the maximum benefits for businesses and communities. It is expected that EAFRD
4 The Effectiveness of EU Structural Funds in Delivering the Government’s Environmental Objectives; Fraser Associates for DEFRA, October 2005

11
will support important rural development activities relevant to land based and other rural businesses. ESF will provide support with regard to reducing worklessness and up-skilling of the workforce. Links between the Competitiveness and Convergence Programmes Cornwall and the Isles of Scilly, in the far west of the region, has benefited from an Objective One Programme, which in spite of significant investment and some notable successes, continues to lag behind other regions. A Convergence Programme funded by ERDF will operate between 2007 and 2013. There are close links between the west of Devon and east Cornwall and south east Cornwall and Plymouth. There are a number of strands of activity which are relevant to the two Programmes, including renewable energy and environmental technologies, innovation and enterprise. It will be important that businesses in Cornwall and the Isles of Scilly and the west of the Competitiveness area are part of regional networks and local collaborative activities. There is a strong commitment to ensuring complementarity and the alignment of activities across the Programmes. Programme Added Value Although the South West Operational Programme has a limited budget, set within a large regional economy, there is a need to ensure that the maximum benefit is derived from the proposed Priorities. The implementation phase will however take place in the context of clear expectations as regard contribution to the Programme’s objectives. In summary aims and operational objectives will be met by: Programme Aim Impact To increase the prosperity of the region through supporting enterprises and individuals to develop ideas and plans which contribute to increased productivity and competitiveness
By creating 5,670 net additional new jobs and £208m of net additional value added.
Operational Objectives Impact Increase the productivity of the region’s business base, through the promotion and support of innovation, research and development and the application of knowledge
By creating 4,870 net additional new jobs and £192m of net additional value added.
Reduce intra regional disparities through stimulating enterprise and accelerating business growth in those parts of the region lagging behind.
By creating 2,435 jobs and £91m of net additional value added in the west of the region.
Increase employment and enterprise in the region’s most disadvantaged communities
By creating 400 new enterprises and 800 net additional jobs in the target areas of Bristol, Plymouth and Torbay.
Protect and enhance the region’s environmental assets and work towards developing a low carbon economy.
By assisting 700 enterprises involved in provision of environmental goods and services (including environmental technologies and renewable energy) and over 855 net additional jobs in these companies and assisting 1,400 companies to be energy efficient.

12
Community Added Value The availability of additional ERDF monies increases the scale of interventions available over the period 2007-20103 in the key areas of innovation and enterprise. While the additional funds will generate considerable impacts, there is considerable added value in terms of the key elements of the Programme Strategy. These are:
The introduction of Urban Enterprise into the region, with the potential to use the lessons learnt from this approach in other disadvantaged areas in due course.
A focus on environmental goods and services enterprises at a time when opportunities are increasing and where the business potential is evident in all parts of the region, including rural areas.
An increased focus on intra regional disparities and rural areas at a time when many aspects of national policy has limited spatial focus per se.
The opportunity to pursue the benefits of a moving towards a low carbon economy Increased incentive to work with Cornwall and the Isles of Scilly, with a number of shared
themes, notably on environmental technologies and carbon. An increased focus on linking higher education and Further Education to the needs of
businesses. Other Community Added Value benefits will emerge around linking in to national and international knowledge networks, both at Priority level and through Regions for Economic Change. The Community Added Value is considerable, and will have a significant effect on the west and rural parts of the region.

13
2 Introduction The South West of England will benefit from European Union Structural funds for the period 2007-2013. This will consist of five related programmes. These are:
Convergence Programme for Cornwall and the Isles of Scilly, funded by European Regional Development Fund (ERDF).
Competitiveness Programme for the South West (excluding Cornwall and the Isles of Scilly), also funded by European Regional Development Fund (ERDF).
The England European Social Fund (ESF) Operational Programme, implemented through a South West Regional Framework and a Convergence Regional Framework.
A Rural Development Programme, supported by the European Agricultural and Regional Development Programme; and
A Fisheries Programme, supported by the European Fisheries Fund. A total of €124.7 (circa £85m) of ERDF funding has been allocated for the South West Competitiveness Programme and this will be complemented by €144.1 (circa £97m) of ESF funding for learning and skills. The latter will be provided through the English ESF Operational Programme. Structural Funds will be matched by a significant contribution of match funding from the UK public sector. The Operational Programme has been produced under the guidance provided by the South West Cohesion Group, supported by a considerable number of workshops attended by a variety of stakeholders to help develop proposals. The South West Cohesion Framework, which has guided the development of the Operational Programme, is a result of two years work by a number of key partners. The Operational Programme sets out three broad areas for intervention – Innovation and Knowledge, Enterprise and Growth and Urban Enterprise. This is a balanced set of Priorities which takes account of the Lisbon and Gothenburg agendas. The focus is on improving competitiveness of the regions of Europe, while taking account of the need to develop an inclusive society and protect and enhance our environment. There are a number of distinguishing features of this Operational Programme. These are:
An approach which focuses on doing a few things very effectively, rather than trying to undertake a broad range of actions, reflects the limited budget.
A focus on research and development, innovation and knowledge. An ambition to develop the environmental goods and services sectors across the South West. The provision of dedicated resources to the most disadvantaged communities in Torbay,
Plymouth and Bristol in a concerted attempt to reduce economic and social exclusion. An ambition to use the structural funds to work towards and, where appropriate, invest on the
drivers of a low carbon economy. There is an opportunity for the Competitiveness Operational Programme to make a real difference in a number of key areas of intervention. This is dependent upon three related factors:
The ability to focus and prioritise actions and activities which will make a difference; The quality of proposals and the degree to which they are innovative and leading edge; and The sustainability of proposals and the potential of their legacy.
The specification of the Priorities has taken into account the limited funds available and the need to focus resources to achieve impact.

14
3 Socio-Economic Baseline – Headline Analysis
3.1 Introduction This analysis of the socio-economic evidence base informs the South West Competitiveness and Employment Operational Programme 2007-13. It focuses on the key points and draws out the headline analysis for the Programme. The summary analysis is structured in the following way:
Summary of the eligible area Competition Innovation Skills Rural and Urban Spatial Issues. Employment Enterprise Investment Unemployment and Multiple Deprivation Environment
The analysis draws upon the extensive evidence base already available in the region, including the evidence base used to revise the Regional Economic Strategy.
3.2 The South West Programme Area The South West Competitiveness and Employment Operational Programme covers the whole of the South West with the exception of Cornwall and the Isles of Scilly, which is eligible for support under the Convergence Programme.
The South West is the largest region in England, 15% of the total land area, ranging from upland moors in the west to fertile plains in the east. The region is home to 60% of England’s undeveloped coast line and two national parks (Exmoor and Dartmoor), which cover 1,631km2, or 8.3% of the regions land area. Areas of Outstanding Natural Beauty (AONB) cover approximately a fifth of the region. The Cornwall and West Devon Mining Heritage was declared a World Heritage Site in 2006, adding to the Jurassic Coast, Bath and Stonehenge. The region’s environment is one of its key under-pinning assets. The outstanding historic and natural environment is complemented by many towns and villages in an attractive rural setting. This combines to offer a high quality of life and the region has for many years attracted a net in-flow of people, particularly from the South East of England. Between 1995 and 2005, the population of the South West grew by 6%, to 5,067,800; with only London and the South East exhibiting faster growth rates. This compares to a national growth rate of 4.2% over the same period. The population age profile of the South West is older than that seen nationally, with 49% of individuals within the region aged over 40, compared to 45% for England.
The region has a relatively small BME population, 2.3% in the South West, compared to 9.1% nationally. Bristol has the largest BME population, 8.2% of its total population, which consists of a mixture of Mixed Ethnicity, Black, and Asian communities. There is a clear pattern to the spatial distribution of the region’s BME communities, with significant communities in Bristol and, to a lesser extent, Bournemouth.
All of the sub-regions experienced population growth that either matched or was higher than the national rate of 4.2%. Population growth has been greatest over the last ten years in rural areas, notably Dorset (16.0%), Torridge (North West Devon), West Wiltshire, Exeter, Mid-Devon (all above 10%). Plymouth was the only local authority within the South West to witness a decline in its population over this period, of 1.7% or 4,200 individuals.
15
Overall there was a net inflow of 34,000 people into the region in 2004, almost two-thirds of which were young to middle aged adults (aged 25 to 44) and children (aged less than 16). The South East accounted for the most significant proportion of the net in-flow (45%), with London accounting for 31%. Net in-flows from these two regions and from the East of England have increased since 1994. This challenges the perception that flows from the South West are generally those where younger people migrate to London and the South East and are replaced by older people seeking to retire within the region. While the population of the South West is undoubtedly getting older as a consequence of inward migration, there is nonetheless a net inflow of economically active individuals into the region, which should provide an increasing workforce on which the region’s growing businesses can draw. In addition inward migration from other European states is predominantly of younger people filling lower skilled vacancies. Levels of deprivation are relatively low, although several pockets of severe deprivation do exist within the region, notably in Bristol and Plymouth which account for 81% of the region’s super output areas (SOAs) that are ranked within the 5% most deprived nationally by the Index of Multiple Deprivation. The rural areas do not generally score poorly with regard to multiple deprivation, although there are some instances of deprived SOAs in rural locations. While many rural areas do not exhibit the characteristics of multiple deprivation, many rural areas suffer from particular forms of deprivation, such as barriers with regard to housing and access to services. Conclusions The South West has experienced rapid population growth over the past ten years, with the total population now exceeding five million people. Only London and the South East have seen faster rates of population growth and the rise in the population has helped to stimulate the region’s economy (see below). Although in-migration is leading to an increase in the average age of the population in the South West, the perception of people moving to the region to retire is misleading. A significant proportion of in-migrants are people of a working age, including those with children. While this contributes to an increase in the numbers of economically active, over the next twenty years those aged 45 plus will move into the retired category. This ageing of the population has implications for service provision, and is affecting some areas more rapidly than others.
3.3 Employment and Economic Activity Employment has been increasing in the South West over the long term, rising by nearly 20% to 1.83m between 1981 and 2001, at a time when nationally the increase was 4%. Full time employment rose by 10% (to 1,364,157) over this period, when it actually fell nationally. There were 1.67m employed in the region in 2001 (excluding Cornwall and the Isles of Scilly) with employment growth throughout the region, with the exception of the major urban centres of Bristol and Plymouth. Despite this increase in the numbers employed full-time, the region has the largest proportion of workers employed part time of any region (466,162 or 25.4% of all in employment, compared to 22.5% for England). Part time employment has risen by more than 57% since 1981 compared to 30% nationally. This is largely due to the sectoral composition of the employment base, where there is a high proportion employed in sectors where part time (and often low paid) employment is common, such as hotels and catering and retail. The greatest shifts from full time to part time working (outside Cornwall and the Isles of Scilly) have been in the west of the region in Plymouth, Torbay, Devon and Dorset. In the twenty year period between 1981 and 2001 employment fell in the two major cities of Bristol and Plymouth. Although employment has increased over the last five years, the poor performance over such a long period has resulted in high levels of worklessness in both of the major centres.

16
Growth of Full-Time and Part-Time Employment (Employees only)
2001 10 Year Growth 1991-2001
20 Year Growth 1981-2001
Total Emp’
Full Time
Part Time
Total Emp’
Full Time
Part Time
Total Emp’
Full Time
Part Time
South West 1,830,319 1,364,157 466,162 8.0% 5.0% 17.6% 19.4% 10.3% 57.3% England 18,591,178 14,407,228 4,183,950 3.2% 0.9% 11.9% 4.1% -1.6% 30.2% Bristol 147,804 114,943 32,861 0.5% -0.7% 5.0% -4.1% -7.1% 8.2% Plymouth 89,914 67,290 22,624 -0.5% -4.4% 13.3% -2.1% -12.3% 49.4%
Source: Census 1981-2001 The region has a relatively high proportion in self-employment again reflecting that full time paid employment is less prevalent in the South West than in other regions and the high proportion of lifestyle businesses. In 2001 some 16.2% (or 354,179) of those in work were self-employed, compared to only 13.7% across England. The incidence of self-employment was highest in the South and West of the region; with over 20% in Devon and Cornwall. The lowest proportions are in the urban centres, notably Swindon and Plymouth, where the proportion is less than 10%. Total Self Employment and Self Employment as a Proportion of Total Employment
1981 1991 2001 % Total % Total % Total Cornwall and IoS 21.0% 32,393 23.9% 44,432 21.3% 43,883 Devon 19.4% 44,334 22.4% 61,925 20.9% 62,902 South West 13.2% 233,871 16.7% 338,823 16.2% 354,179 England 9.5% 1,875,942 13.0% 2,701,614 13.7% 2,945,036 Plymouth 7.0% 6,874 10.4% 10,494 9.9% 9,849 Swindon 6.8% 4,631 9.3% 7,889 8.9% 8,077
Source: Census 1981-2001 In 2004, the gender split of full time employees was 63:37 (male: female), while the part-time split was 25:75. These are not dissimilar to those nationally, however between 1998 and 2004 the employment growth patterns varied sub-nationally. Generally, part-time employment grew faster than part-time, 17% and 10% respectively for the South West; however in parts of the North East of the region (Bath and North East Somerset, North Somerset, South Gloucestershire, and Wiltshire) employment growth was fastest for full-time positions. In the year ending March 2005, 41% of the region’s employees were employed in largely private sector services and 35% in mainly public sector services. A further 13% were employed in manufacturing, with construction accounting for 8% and agriculture, forestry and fishing 2%. In recent years, the public sector has been a significant source of jobs growth in the region, partially driven by the increase in the population and the provision of associated services such as education, health and social services. The South West’s employment structure is characterised by:
High levels of employment in distribution, hotels and catering and the public sector; and Lower levels of employment in banking finance and business services, in spite of recent growth
in parts of the region. Although the region is perceived as rural in nature, it has a significant manufacturing base, much of which is located in rural parts of the region.
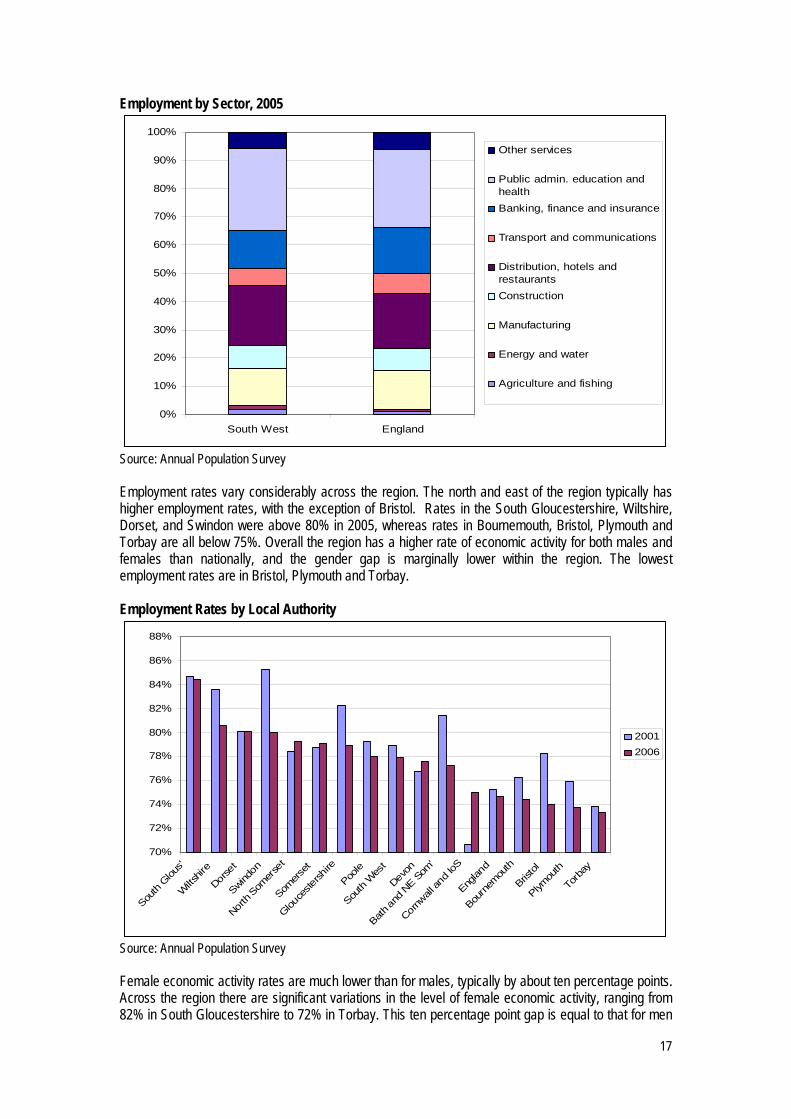
17
Employment by Sector, 2005
0%
10%
20%
30%
40%
50%
60%
70%
80%
90%
100%
South West England
Other services
Public admin. education andhealthBanking, finance and insurance
Transport and communications
Distribution, hotels andrestaurantsConstruction
Manufacturing
Energy and water
Agriculture and fishing
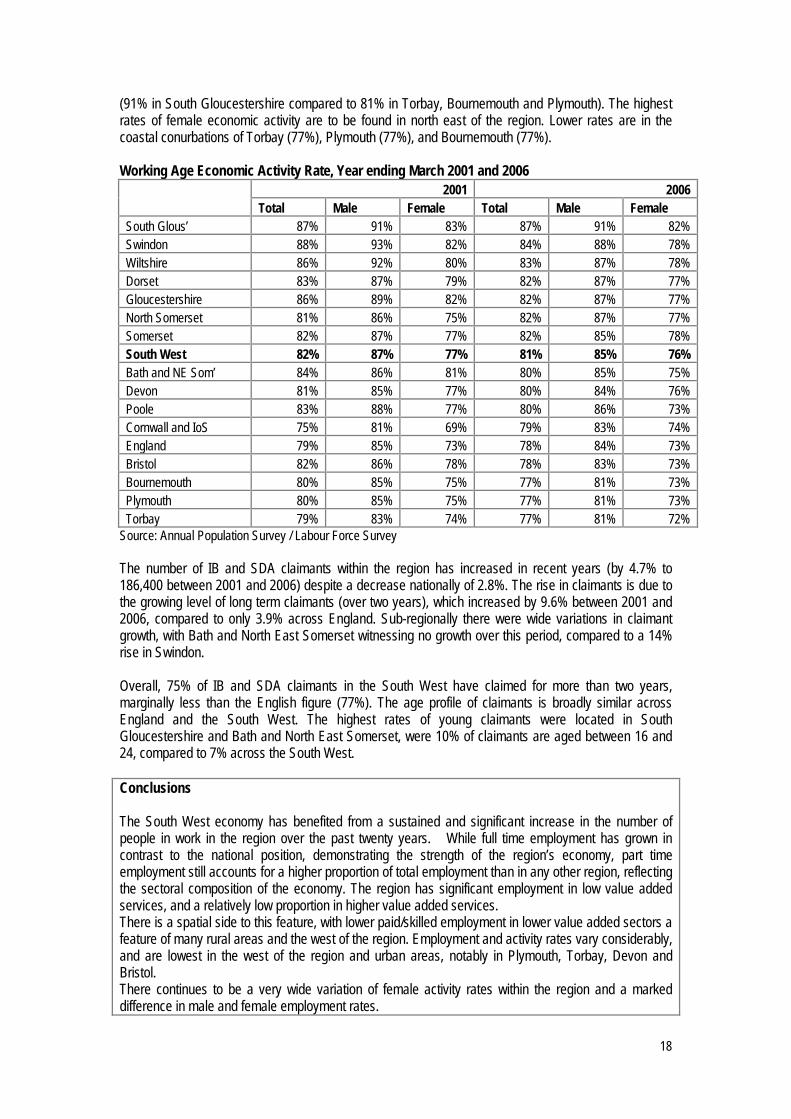
Source: Annual Population Survey Employment rates vary considerably across the region. The north and east of the region typically has higher employment rates, with the exception of Bristol. Rates in the South Gloucestershire, Wiltshire, Dorset, and Swindon were above 80% in 2005, whereas rates in Bournemouth, Bristol, Plymouth and Torbay are all below 75%. Overall the region has a higher rate of economic activity for both males and females than nationally, and the gender gap is marginally lower within the region. The lowest employment rates are in Bristol, Plymouth and Torbay. Employment Rates by Local Authority
70%
72%
74%
76%
78%
80%
82%
84%
86%
88%
South
Glous'
Wilts
hire
Dorse
t
Swindon
North
Somer
set
Somers
et
Glouce
stersh
ire
Poole
South
Wes
t
Devon
Bath an
d NE S
om'
Cornw
all an
d IoS
Englan
d
Bourn
emou
th
Bristol
Plymou
th
Torb
ay
20012006
Source: Annual Population Survey Female economic activity rates are much lower than for males, typically by about ten percentage points. Across the region there are significant variations in the level of female economic activity, ranging from 82% in South Gloucestershire to 72% in Torbay. This ten percentage point gap is equal to that for men
18
(91% in South Gloucestershire compared to 81% in Torbay, Bournemouth and Plymouth). The highest rates of female economic activity are to be found in north east of the region. Lower rates are in the coastal conurbations of Torbay (77%), Plymouth (77%), and Bournemouth (77%). Working Age Economic Activity Rate, Year ending March 2001 and 2006
2001 2006 Total Male Female Total Male Female South Glous’ 87% 91% 83% 87% 91% 82% Swindon 88% 93% 82% 84% 88% 78% Wiltshire 86% 92% 80% 83% 87% 78% Dorset 83% 87% 79% 82% 87% 77% Gloucestershire 86% 89% 82% 82% 87% 77% North Somerset 81% 86% 75% 82% 87% 77% Somerset 82% 87% 77% 82% 85% 78% South West 82% 87% 77% 81% 85% 76% Bath and NE Som’ 84% 86% 81% 80% 85% 75% Devon 81% 85% 77% 80% 84% 76% Poole 83% 88% 77% 80% 86% 73% Cornwall and IoS 75% 81% 69% 79% 83% 74% England 79% 85% 73% 78% 84% 73% Bristol 82% 86% 78% 78% 83% 73% Bournemouth 80% 85% 75% 77% 81% 73% Plymouth 80% 85% 75% 77% 81% 73% Torbay 79% 83% 74% 77% 81% 72%
Source: Annual Population Survey / Labour Force Survey The number of IB and SDA claimants within the region has increased in recent years (by 4.7% to 186,400 between 2001 and 2006) despite a decrease nationally of 2.8%. The rise in claimants is due to the growing level of long term claimants (over two years), which increased by 9.6% between 2001 and 2006, compared to only 3.9% across England. Sub-regionally there were wide variations in claimant growth, with Bath and North East Somerset witnessing no growth over this period, compared to a 14% rise in Swindon. Overall, 75% of IB and SDA claimants in the South West have claimed for more than two years, marginally less than the English figure (77%). The age profile of claimants is broadly similar across England and the South West. The highest rates of young claimants were located in South Gloucestershire and Bath and North East Somerset, were 10% of claimants are aged between 16 and 24, compared to 7% across the South West. Conclusions The South West economy has benefited from a sustained and significant increase in the number of people in work in the region over the past twenty years. While full time employment has grown in contrast to the national position, demonstrating the strength of the region’s economy, part time employment still accounts for a higher proportion of total employment than in any other region, reflecting the sectoral composition of the economy. The region has significant employment in low value added services, and a relatively low proportion in higher value added services. There is a spatial side to this feature, with lower paid/skilled employment in lower value added sectors a feature of many rural areas and the west of the region. Employment and activity rates vary considerably, and are lowest in the west of the region and urban areas, notably in Plymouth, Torbay, Devon and Bristol. There continues to be a very wide variation of female activity rates within the region and a marked difference in male and female employment rates.

19
3.4 The Economy and Competition Gross Value Added Over the last decade the South West economy has grown relatively well compared with the UK average5 in terms of Gross Value Added (GVA – a key measure of current output). In the last five years, amongst the twelve UK regions and devolved administrations, growth in the South West has only been bettered by the East of England. The recent data indicates that:
The regional economy was worth £79 billion in nominal terms and continued to grow faster
than the UK average (1999-2004). In 2004, the South West raised its GVA per head to £15,611, although this was still 7.1%
below the UK average. As a result, the South West’s share of UK GVA has been rising, from 7.6% in the early
1990s to 7.8% in 2004, although growth in share has levelled off since 2002. (Figure 1) With total GVA of about £79 billion in 2004, the South West has the seventh largest economy of the twelve regions/devolved administrations. Annual Growth of SW and UK GVA
4.0
4.5
5.0
5.5
6.0
6.5
7.0
7.5
1992 1993 1994 1995 1996 1997 1998 1999 2000 2001 2002 2003 2004
Year
% g
row
th
SW UK
Source: Gross Value Added, ONS At the broad sectoral level, both the Hotels and Restaurants sector and Public Administration and Defence are growing sectors in which the South West has strengths relative to England (of 7.8% and 2.5% pa between 1993-2003 respectively). The strongest levels of growth occurred in the Real Estate Renting and Business Activities and Other Services sectors (9% pa) which accounted for £17.4bn or 23% of the region’s total output. However, despite the high level of growth, the South West remains under-represented in this sector. Only the agriculture and mining sectors witnessed a decline in output over the period 1993-2003 and the fastest growth, in excess of 5%, was witnessed in the private sector services and construction sectors. Government forecasts indicate that the region’s economy will grow in real terms at a rate above the UK average (fourth highest behind London, Northern Ireland and South East), i.e. about 2.8%, between 2006 and 2015. Demographic growth is projected to be slightly faster. The resulting relative improvement in GVA per head is modest. In nominal terms, the region’s GVA will exceed £100 billion before 2010, from about £79 billion in 2004.
5 Regional Gross Value Added – ONS, 2005

20
At a sector level, fastest real growth (over 4.5% per annum) is forecast in business services, other services, education, and hotels and catering. The sectors forecast to decline are the production sectors of mining and quarrying, agriculture, fishing and forestry, and manufacturing. The balance of growth and declining sectors suggest that rural areas and the west of the region are most likely to be affected by low levels of growth. This is supported by the sub-regional forecasts, with a relative improvement forecast for Gloucestershire, Wiltshire, and North Somerset (GWNS). It is also important to understand the strong regional disparity that already exists in terms of contribution to regional GVA. In 2003, the Gloucestershire Wiltshire and North Somerset area contributed 54% of regional GVA with 45% of the employment base, whereas Cornwall and the Isles of Scilly (CIoS) contributed 7% with 10% of the population. These variations in GVA per head are prevalent in the west, notably Torbay and rural parts of Devon. NUTs 2 Area Contribution to Regional GVA
010 000
20 00030 00040 000
50 00060 000
70 00080 000
1995 1996 1997 1998 1999 2000 2001 2002 2003Year
% o
f SW
GVA
GWNS Dorset/Somerset CIoS Devon
Source: ONS The strongest GVA growth between 1997 and 2003 occurred in Cornwall and the Isles of Scilly (3.6%) and this is set to continue moving forwards (3.4% between 2006-2015). Within the Programme area, there has been a persistent East-West disparity in GVA performance. Devon experienced the lowest rate of GVA growth (2% pa 1997-2003, with a forecast of 2.4% between 2006 and 2015) and GWNS experiences the highest levels (3.2% 1997-2003 and 3.0% 2006-15). The GVA projections assume that current differences in sub-regional economic performance persist, because agglomeration effects favour GWNS and the negative aspects of structural change are more dominant beyond the major urban areas. Cornwall’s figures indicate the “catch up” effects of relatively significant intervention policies. GVA per Head and Productivity GVA per head has stayed relatively static in the South West compared to the UK average since 1996 (at around 93% of the average in 2003), whilst GVA per job and GVA per hour have improved (from 91.3% to 93.8% and 90.2% to 95.8% of the UK averages respectively). This pattern indicates that labour productivity is improving, the region’s relatively rapid population growth, whilst contributing to overall economic growth, has restricted the growth in GVA per head. There is also wide variation in the level of GVA per head across the region, ranging from £24,300 in Swindon to only £10,200 in Torbay in 2003. This compares to the regional average of £15,000. In particular, the Torbay GVA per head figure lies below that for Cornwall and the Isles of Scilly, and its performance has declined relative to the regional figure since 1999. Research by the University of the West of England (Meeting the Productivity Gap 2) identified a 33% gap between the region and London. Four factors were identified which explained this gap:

21
Capital stock per employee; Industry structure; Ownership, full /part time ratio, skills gravity type effect and population density; and Travel time to London and other major conurbations.
These factors are more of a constraint in the west of the region, where the industrial structure is heavily weighted towards low value added sectors and businesses are more distant from major markets. Earnings Gross average weekly earnings for South West employees were £326 in 2005, compared to a UK average of £350, ranking the South West eighth of the 12 UK regions / devolved administrations. This represents an improvement from ninth position in 2002 but the average figure disguises the underlying weakness of parts of the region’s economy. The pattern is for higher earnings in the east and north of the region, with total gross weekly earnings by unitary authority of residence ranging from £368 in North Somerset to £274 in Torbay, closely matching the pattern of contribution to regional GVA and reflecting the relative strengths of the dominant employment sectors in different parts of the South West. The resident analysis by local authority shows that people living in the cities (Exeter, Plymouth and Bristol) on average earn less than those living in surrounding areas. The workplace analysis shows the reverse of this, clearly highlighting the effects of commuting, and indicating that the revival of the South West’s urban economies is not necessarily benefiting local residents. Within the eligible area, the district of Torridge performs poorly, reflecting its poor transport links to any significant urban area. In recent years, the earnings growth of women in the region has been strong. The earnings of all female workers increased by 30% between 1999 and 2005, compared to 19% for men; and was higher than the gender growth disparity witnessed nationally, reflecting the catch up mechanism implicit in the narrowing of employment differentials over the last ten years. It is not clear if this is a temporary or semi-permanent development. Earnings differentials between full-time employees by gender have shifted to a lesser extent in recent years, in relation to each other and to equivalent UK averages. However, wages of female workers still lag behind that of their male counterparts. In 2005 the weekly pay of all female workers stood at £243, compared to £410, which narrows to £339 and £442 for female and male full-time workers respectively. Gross Weekly Pay of all Workers, by Gender
0.0
50.0
100.0
150.0
200.0
250.0
300.0
350.0
400.0
450.0
500.0
England South West England South West
1999 2005
Media
n Wee
kly P
ay (£
s)
TotalMaleFemale
Source: Annual Survey of Hours and Earnings
22
Conclusions The Gross Value Added generated in the South West has risen substantially in recent years, with growth out-performing the national economy. There have also been improvements in productivity per hour and productivity per worker. There are significant and in some cases increasing disparities between the east and west of the region, driven by the geographical distribution of low productivity sectors. The geographical distribution means that the west of the region has a higher proportion of part time and lower paid employment and this is reflected in GVA performance. The Torbay GVA per head figure is now lower than Cornwall and the Isles of Scilly (a Convergence Area). Research undertaken explains the 33% productivity gap between the region and London through differences in capital stock per employee, industrial structure, ownership and full/part time ratios, and distance from major markets, factors which have a greater effect in the west of the region. International Trade Open and fair international trade helps to create competitive pressures and stimulate regional growth, contributing to improved productivity amongst exporting firms. Businesses engaged in international competition tend to lead in the dissemination of best practice and product and process innovation and workers in trade orientated businesses tend to be better trained, more productive, and better paid than their counterparts in other sectors.
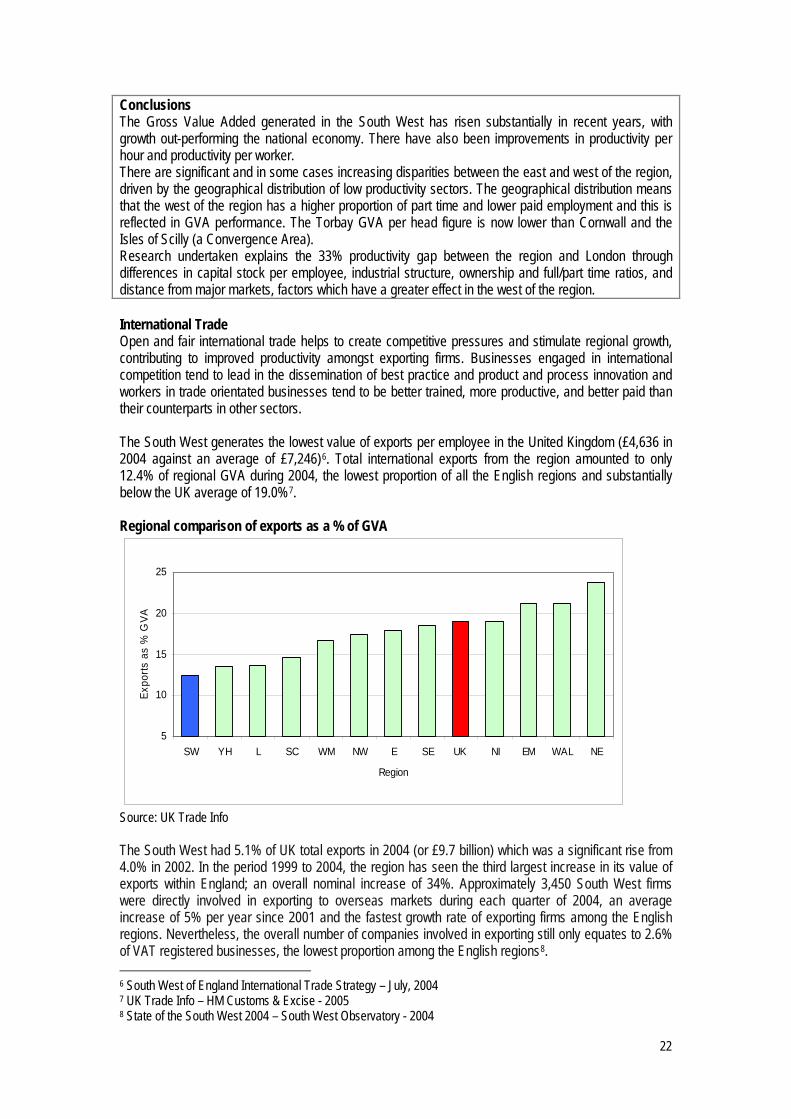
The South West generates the lowest value of exports per employee in the United Kingdom (£4,636 in 2004 against an average of £7,246)6. Total international exports from the region amounted to only 12.4% of regional GVA during 2004, the lowest proportion of all the English regions and substantially below the UK average of 19.0%7. Regional comparison of exports as a % of GVA
5
10
15
20
25
SW YH L SC WM NW E SE UK NI EM WAL NE
Region
Expo
rts a
s %
GVA
Source: UK Trade Info
The South West had 5.1% of UK total exports in 2004 (or £9.7 billion) which was a significant rise from 4.0% in 2002. In the period 1999 to 2004, the region has seen the third largest increase in its value of exports within England; an overall nominal increase of 34%. Approximately 3,450 South West firms were directly involved in exporting to overseas markets during each quarter of 2004, an average increase of 5% per year since 2001 and the fastest growth rate of exporting firms among the English regions. Nevertheless, the overall number of companies involved in exporting still only equates to 2.6% of VAT registered businesses, the lowest proportion among the English regions8. 6 South West of England International Trade Strategy – July, 2004 7 UK Trade Info – HM Customs & Excise - 2005 8 State of the South West 2004 – South West Observatory - 2004

23
Destination of Exports by Value, 2004
0%
20%
40%
60%
80%
100%
SW UK
% of
expo
rts
Asia & Oceania
European Union (EU=25)
Other Europe
Latin America and Caribbean
Middle East & Africa
North America
Source: UK Trade Info The predominant share of exports in the South West is destined for the European Union market (EU 25). Exports to the EU25 account for over 60% of regional exports, amounting to £6 billion. In recent years, this market has shown low growth rates. The South West has performed well in capturing export growth to ‘Asia and Oceania’ (£1.2 billion) and to ‘Other Europe’ (£500 million) with growth of 116% and 83% respectively between 1999 and 2004, significantly higher than national figures9. This highlights the success of businesses in capturing benefits from the expansion of economies in Asia and the accession countries into the EU. There is a concern that this is a temporary trend linked to restructuring and the export of second-hand manufacturing equipment to the new growth markets. Exports (value) by Broad Sector, 2004
0%
20%
40%
60%
80%
100%
UK SW
Commodities Not Classified Elsewhere
Miscellaneous Manufactured GoodsMachinery and Transport Equipment
Manufactured Goods
Chemicals and Related ProductsAnimal and Vegetable Oils, etc.
Minerals, Fuels, Lubricants, etc.
Crude Materials, Inedible, excl. Fuels
Beverages and TobaccoFood and Live Animals
Source: UK Trade Info The two priority sectors of aerospace and advanced engineering and marine technologies are important contributors to export values under transport and machinery. In 2004, other significant goods exporters were electrical machinery and appliances (14%), and industrial machinery (6%). In 2004 over 40% of all exports were concentrated in these three broad industrial groups and, in turn, these were dominated by 9 UK Trade Info – HM Customs & Excise - 2005
24
a small number of large suppliers. The region exhibits a degree of export specialisation, which is important in exploiting comparative advantage, but may expose the regional economy to risks associated with strategic decisions of major firms10. Inward investment to the South West constituted just 5.5% by value of the UK total in 2002/3. Non-UK firms in the region tend to be significantly more productive than UK firms, demonstrating the potential benefits to the wider economy of attracting external investors to the region. As might be expected, the value of primary sector imports to the South West relative to their exports from the South West (i.e. the imports / export ratio) is high, reflecting their importance in the production process. For example, the value of South West exports of mineral, fuels, and lubricants is 25% of the value of imports of these goods into the South West. The region exported only 52% of the value of food and live animals that it imported in 2004, although this is far higher than nationally (36%). In 2004, goods exports were £9.7 billion and imports £10.9 billion. The region is far from self-sufficient but its relative agricultural presence may offer a potential advantage for boosting market share through trade. The manufacturing sector is relatively important to the South West in terms of trade – both in the sense of volume and net contribution. Within that South West trade is dominated by transport equipment and electronics, which is a net exporter with export values increasing from 3% of import values in 2003 to 11% in 2004. This sector accounts for almost two-thirds of goods overseas exports according to the South West Regional Accounts. Those South West sectors heavily involved in international trade are relatively successful. Conclusions Although exports rose by over one third between 1999 and 2004, the third greatest increase in England, the South West has the lowest level of exports per employee and exports account of the lowest proportion of GVA of any English regions. The South West also has the lowest proportion of VAT registered businesses involved in exporting. The region is dependent on a limited number of successful sectors and a limited number of major companies with regard to exporting. This is a significant weakness in the context of increasing global trade. Sectors In terms of contribution to output (GVA) and employment (FTEs) four broad sectors are significant; business services, manufacturing, distribution and retail, and the public sector (public administration and defence, health and education). These account for 69% of GVA and 67% of employment. Other sectors with more than 5% of output and employment are construction, and transport and communication. When compared to UK averages, the South West has a greater share of GVA and employment from manufacturing and in particular transport equipment and a lesser share of GVA from services, particularly business services.
The current RES11 identifies eight priority sectors for the South West. The priority sectors are12:
Advanced engineering (including aerospace); Bio-technologies; Creative industries (media and non-media); Environmental technologies; Food and drink (from farm to market); Information and communication technologies (ICT); Marine (including manufacturing and leisure); and Tourism.
10 Business Guide 2005 – Western Daily Press, 2004 – lists the region’s major firms. 11 Regional Economic Strategy for South West England 2006-2015 12 See RES Evidence Base appendix on sectors for further analysis of priority sectors

25
The relative performance within the region of the key sectors on output per worker indicates that:
The ICT, Creative Industries, Advanced Engineering, Environmental Technologies and Biotechnology sectors in the South West broadly perform better than the regional average, with GVA per FTE ranging from £35,100 in the Creative Industries to £58,900 in the Environmental Technologies sector in the South West in 2002.
Food & Drink and Tourism perform below average. Food and Drink is the least productive priority sector, with GVA per FTE of £22,100 and witnessed a decline in its absolute GVA of 17% between 1998 and 2002 to £2.495bn.
Marine performance fluctuates over time, in part due to its small overall size (its total GVA was £347m in 2002 and it employed 11,967 in 2004) and concentrated distribution. This makes it more susceptible to step changes in data arising from the “lumpiness” of markets for some major sector players.
The relative performance of the sectors compared to their national counterparts on output per worker indicates that:
Compared to national sector performance, Advanced Engineering performs better than average, with a GVE per FTE in 2002 of £45,900 in the South West, compared to £35,100 in Great Britain.
Environmental Technologies and Marine also performs better than average, although the gap between South West and Great Britain Marine productivity narrowed considerably in both 2000 and 2002. In 2002 GVA per FTE was £58,900 in the Environmental Technologies sector in the South West, compared to £45,600 across Great Britain,
Food & Drink, Tourism, Biotech, Creative and ICT perform below the national average, with the gap between South West and Great Britain Biotech productivity narrowing over time. Between 1998 and 2002 GVA per FTE in the Biotechnology Sector has increased from 73% of the Great Britain average to 97% (or £45,000).
Sector Profiles Advanced Engineering, including Aerospace generated GVA of £2.6 billion in 2002 with 37% of its workforce employed in the aerospace sub-sector. Advanced manufacturing (39.3%) and the automotive (24%) are also significant sub-sectors, by employment. The aerospace sub-sector generated GVA of £1.2 billion in 2002 and accounted for 3.2% of spending by all firms in the region, indicating the high level of dependency within the overall manufacturing supply chain. The sub-sector is also a significant exporter, generating 19.4% of all overseas exports from the South West economy, and the regions comparative advantage in this sub-sector has been highlighted by the Society of British Aerospace13. The advanced engineering sector employs a high proportion of craft and related occupations (28% of FTE jobs in 2001 compared to 15% for all businesses in the South West), suggesting that the sector has a strong skills base. The sectors GVA per business site (£1.27 million, compared to £134,000 for the region and £884,000 for the Advanced Manufacturing sectors of the other GB regions) indicates the relative size of the businesses sites in the sectors, and could imply a higher level of potential ‘business dependency’ on larger business sites in the region. Biotechnology has experienced relatively rapid growth in the region (77.3% employment growth between 2000 and 2004 and GVA growth of 110% to £483 million between 1998 and 2002). However, employing 11,500 in 2004 or 0.5% of the regional workforce it is the smallest of the South West RDA priority sectors14. The sector is characterised by a small number of sites and high levels of FTE workers 13 Society of British Aerospace Companies (SBAC) – UK Aerospace Facts and Figures 2003 14 Annual Business Inquiry – ONS

26
by site (circa 18 per site in 2004, compared to 4 for all industries in the region), suggesting the dominance of relatively sizeable companies. GVA per business site of £850,122 is much higher than the regional average for all industries (South West = £134,433), yet one third lower than the average for Biotechnology in other regions (excl. London). The sector has relatively high levels of overseas exports and imports (39% and 29% of sectoral output respectively) which will play an important role in the development of regional trade. The sector is highly concentrated in Wiltshire and Swindon, reflecting the small number of large sites. The sector performs well in terms of the proportion of its workforce that holds higher qualifications: 75% of the workforce has A Levels, which represents the highest figure among the priority sectors15. The relative ‘immaturity’ of the sector is reflected in the relatively low levels of GVA, employment & business sites. Recently, however, it is showing signs of faster growth. Creative Industries in the South West generated GVA of £2.024 billion in 2002 and total employment of 53,300 in 2004 (reflecting an increase of 8.2% since 2000). The majority of employment is located in the West of England16 (18,300) and Bristol has the highest location quotient for creative industry employment of the English Core Cities17. The sector employs a well educated workforce, with 30.4% of its employees holding a degree of equivalent qualification. The sector is characterised by high levels of self-employment and is highly fragmented; with 70% of employees located in enterprises of fewer than 50 employees. There are only a handful of companies employing 200 employees, based primarily in Bristol and Plymouth. However, creative businesses have steadily increased in size, with the proportion of employment located in micro-businesses (employing fewer than 10 staff) decreasing from 36.9% in 1998 to 32.5% in 2001. Business start-up rates are high across each of the sub-regions, ranging from 31% in Devon and Cornwall to 23% in the GWNS, or 26% for the South West as a whole. These start-up rates, combined with the sectoral characteristics of small to medium sized businesses operating in a relatively immature market, suggest the potential for high sectoral growth. Environmental Technologies is an extremely diverse sector, consisting of a number of sub-sectors; some overlapping with other sectors including Agriculture, Biotechnology and Advanced Engineering. The sector presents particular opportunities for the South West economy, given the increasing prominence of EU and UK environmental legislation and the fact that the sector has the highest average annual earnings of any of the key sectors: £37,400 (2001)18. However, it is has recently experienced significant employment losses, losing 12.5% of its total workforce between 2000 and 200419 - largely reflecting the continued restructuring of the ex-nationalised utility companies such as water and waste. Indeed, while the industry has grown by 44% in the region since 1998, with a high number of small new businesses entering the market, share in relation to the UK as a whole has fallen from 88-68 (where UK =100) in the region (although this has remained broadly static in Devon.20 Employment remains dominated by the Utilities sub-sector and in 2004, it employed 19,000 people, making it the third smallest priority sector. In 2002 the sector generated GVA of £1.261 billion, representing a fall of 10.9% from 2002. The sector is strongest in the North East of the region, although Devon has a significant environmental presence. Wiltshire and Swindon is the only sub-region with an employment location quotient greater than the national average. However, employment quotient is influenced by the location of the headquarters for the ex-nationalised utility companies. The region has a relative employment 15 South West Regional Accounts – South West Economy Centre - 2000 16 Which includes Bristol, Bath & North East Somerset, North Somerset and South Gloucestershire 17 Regional Mapping and Economic Impact Study of the Creative Industries – Culture South West, South West RDA – May 2004 18 South West Regional Accounts – South West Economy Centre - 2000 19 Annual Business Inquiry – ONS 20 South West Objective 1 and 2 Programmes – investment in the environment sector, evaluation study – Ekos Consulting on behalf of the SW Objective 2 Environmental Sustainability Theme Partnership, July 2007

27
specialisation in manufacture, electrical distribution and apparatus, and a significant under-representation in technical testing and analysis. It is important to note that the wider natural environment has played and continues to play a pivotal role in the economy of the South West. The protection and improvement of the region’s environmental capital is a major driver of the regional economy. Environmental technologies and services, such as renewable energy, represent a significant and growing economy. This is partly as a response to the Government aim to reduce carbon dioxide emissions by 60% by 2050 and an aim for renewable energy to supply 20% of UK electricity by 202021. The market share currently stands at 2.9% of electricity generated. There is an emerging niche sector focussed on the technologies around renewable energy (as distinct from the production of renewable energy), and this has been actively promoted by Sustainability South West. These companies include a broad range of companies, with some focused on development and design, while other have specialist engineering skills. The Food & Drink sector faces the combined pressures of imports from low-cost countries and the increasing buying power of supermarkets. In 2002 the sectoral GVA of £2.495 billion represented 83% of the 1998 figure, and the sector has been surpassed by ICT and Advanced Engineering as the largest priority sectors22. The decline in the recent period has extended long-term structural decline, specifically in the Fishing and Agricultural sector, although this is being addressed, in part, by diversification. While this decline could reflect the process of farm consolidations, such trends are expected to continue as a response to the reform of the Common Agricultural Policy. It is also the least productive priority sector, generating GVA per FTE of £22,080, 67% of the regional figure, in 2002. The sector remains a significant employer (112,996 FTEs in 200223) and the decline of employment has been most pronounced in the land based activities, in contrast to food processing. The distribution of GVA in the region represents its rural inclination, with food processing and preparation tending to be located near points of production. The sector generates significant exports (12.3% of the regional total). The future focus in this sector is likely to move towards the promotion of higher value added productions, which may generate further drops in employment24. In addition, the improvements to the sectors productivity may generate a loss of lower value manual jobs within the region. The reform of the Common Agricultural Policy (CAP), EU Enlargement and the EU Common Fisheries Policy (CFP) will have a potentially large supply side impact and promote market forces. There is significant potential for the Food and Drink sector to contribute to the region’s degree of environmental sustainability. Potential issues include the approaches to the environmental management of land and wider supply chain developments, such as the local sourcing of produce. Information & Communications Technology is the largest priority sector, accounting for 4.2% of regional GVA (£2.98 billion) and employing 59,500 FTEs in 2002. GVA per FTE of £56,500 in 2002 was well above the South West average for all industries, (£38,500), but significantly it was below the sectors average FTE/GVA across Great Britain (£64,700)25. The sector is marked by relatively high investment levels reflecting its relatively high capital intensity and the potential role of investment as a productivity driver. It has strong export performance, 9% of all SW exports, with the office machinery & computers (£276 million) and transmitters for TV radio and phone (£380 million) sub-sectors generating the greatest levels of exports.
21 Energy White Paper – HM Government 22 South West Regional Accounts - 2001 23 Annual Business Inquiry – ONS 24 The State of the Key Sectors – Arthur D Little, South West RDA - 2004 25 South West Regional Economic Strategy Evidence Base, 2006-15 (South West Regional Accounts, BEM, SWRO for the South West RDA)
28
The sector has a relatively young workforce – 63.2% of all employed in the sector were aged 25-45 years, which also well qualified – 29.6% hold a degree or equivalent. The sector can play a key role in attracting a young and qualified workforce into the region. Currently the provision of ICT support is lower in the South West peninsula than in the Bristol and Swindon area26. ICT also plays an important “secondary role” in support of all other modern industries and a well developed ICT sector is required to develop and support the growth and adoption of technological change. Research has shown that differentials in productivity between the United Kingdom and the United States are determined less by shortfalls in investment in physical and human capital and more by different ways of working (around half of the gap) – how firms are organised and use technology27. The SW economy has further to develop on this front. The Marine Technologies is the smallest priority sector, generating £347 million in 2002. It accounts for the second lowest number of jobs (11,967), but has shown healthy employment growth in recent years, increasing by 22.2% between 2000 and 200428. The sector is heavily concentrated in Devon (including Plymouth and Torbay), which had 62.2% of total Marine sector employment in 2004. More specifically, the sector is dominated by Plymouth, which accounts for well over half of all regional GVA. Within Plymouth it accounts for a substantial 6.4% of local GVA. Tourism is a significant employer within the region, employing 78,168 FTE employees in 2004, representing growth of 14.4% on employment in 2000. Its GVA growth has also outpaced the average regional GVA growth (25% compared to 21% across the region between 1998 and 2002); however the sector has not kept pace with the national sectoral growth of 43% over the same period. The sector is less productive within the region than nationally (with GVA per FTE of £23,334 in the South West compared to £30,078 nationally) and it employs more part time staff than any other sector within the South West (52%). Leisure & Tourism employs disproportionately high levels in certain sub-regions. Work undertaken to forecast priority sector development29 shows a wide range of expected experience over the next twenty years, with, for example, biotechnology growing strongly in both GVA and employment terms, advanced engineering growing in GVA terms but contracting in employment terms and tourism relatively flat on both measures. Such forecasts are indicative only, assuming no policy impact and a lack of exogenous shocks or endogenous proactive or reactive strategies. Nevertheless, they imply a growing contribution to regional productivity from the priority sectors. Conclusions The South West has a number of strengths on which to build amongst its key target sectors, with above average GVA per employee in advanced engineering, environmental technologies and the marine sector. Other sectors with lower levels of GVA per head continue to play an important role in the regional and sub-regional economies, including tourism and food and drink, particularly with regard to employment. These sectors are also very important to the rural economy. This geographical variation in sectoral profile is a distinctive feature of the South West, and reflects the marked difference between the east of the region, with a profile similar to the South East of England, and the west, which remains dominated by traditional industries and sectors. The priority sectors face different challenges affected by the business make up (small, medium and large sized companies); the trajectory of the sector; exposure to national and international markets; and the pace of innovation and new product development.
26 Research Project into Business Uptake, Understanding and Awareness of ICT and Broadband in the South West – South West RDA/Broadband Access Strategies LLP 27 ‘The UK’s Productivity Gap – What research tells us and what we need to find out’ – ESRC - 2004 28 Annual Business Inquiry – ONS 29 The Spatial Dynamics of Change in the Region’s Key Sectors – AD Little/DTZ Pieda – January 2005
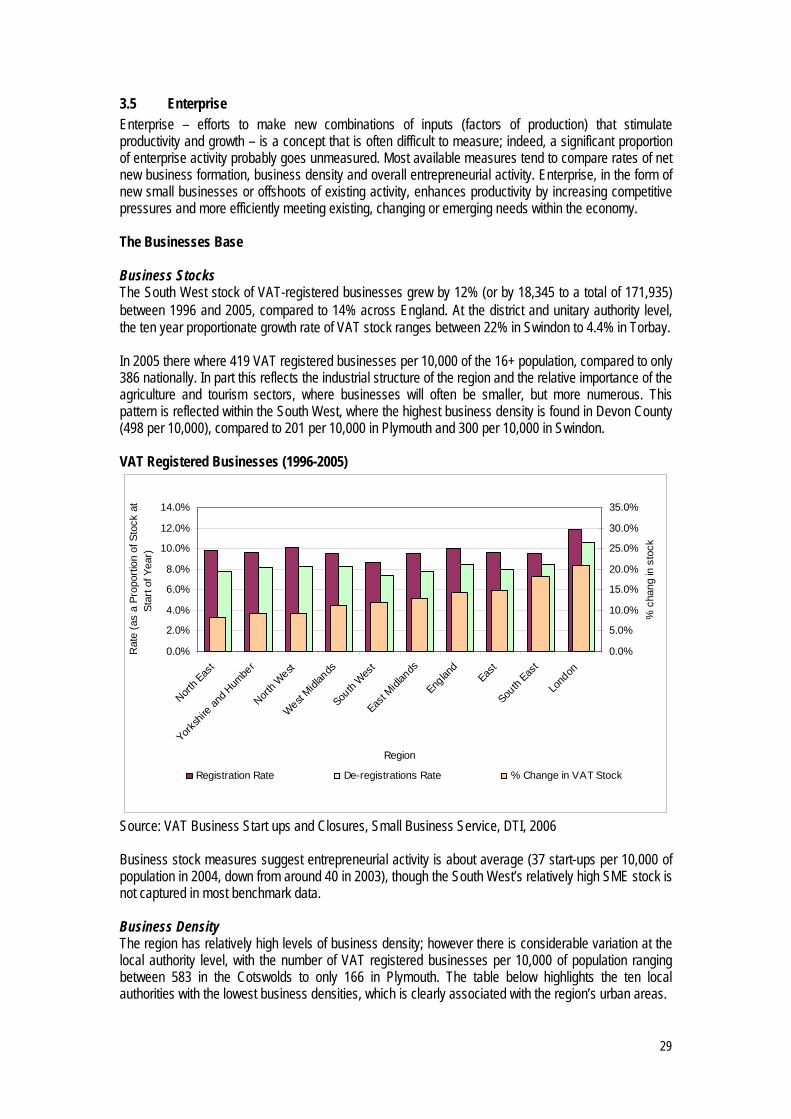
29
3.5 Enterprise Enterprise – efforts to make new combinations of inputs (factors of production) that stimulate productivity and growth – is a concept that is often difficult to measure; indeed, a significant proportion of enterprise activity probably goes unmeasured. Most available measures tend to compare rates of net new business formation, business density and overall entrepreneurial activity. Enterprise, in the form of new small businesses or offshoots of existing activity, enhances productivity by increasing competitive pressures and more efficiently meeting existing, changing or emerging needs within the economy.
The Businesses Base Business Stocks The South West stock of VAT-registered businesses grew by 12% (or by 18,345 to a total of 171,935) between 1996 and 2005, compared to 14% across England. At the district and unitary authority level, the ten year proportionate growth rate of VAT stock ranges between 22% in Swindon to 4.4% in Torbay. In 2005 there where 419 VAT registered businesses per 10,000 of the 16+ population, compared to only 386 nationally. In part this reflects the industrial structure of the region and the relative importance of the agriculture and tourism sectors, where businesses will often be smaller, but more numerous. This pattern is reflected within the South West, where the highest business density is found in Devon County (498 per 10,000), compared to 201 per 10,000 in Plymouth and 300 per 10,000 in Swindon. VAT Registered Businesses (1996-2005)
0.0%
2.0%
4.0%
6.0%
8.0%
10.0%
12.0%
14.0%
North E
ast
Yorksh
ire an
d Hum
ber
North W
est
West Midl
ands
South
West
East M
idlan
ds
Englan
dEas
t
South
East
Lond
on
Region
Rat
e (a
s a
Prop
ortio
n of
Sto
ck a
tSt
art o
f Yea
r)
0.0%
5.0%
10.0%
15.0%
20.0%
25.0%
30.0%
35.0%
% c
hang
in s
tock
Registration Rate De-registrations Rate % Change in VAT Stock
Source: VAT Business Start ups and Closures, Small Business Service, DTI, 2006 Business stock measures suggest entrepreneurial activity is about average (37 start-ups per 10,000 of population in 2004, down from around 40 in 2003), though the South West’s relatively high SME stock is not captured in most benchmark data. Business Density The region has relatively high levels of business density; however there is considerable variation at the local authority level, with the number of VAT registered businesses per 10,000 of population ranging between 583 in the Cotswolds to only 166 in Plymouth. The table below highlights the ten local authorities with the lowest business densities, which is clearly associated with the region’s urban areas.

30
Lowest Performing Business Density Areas Local Authority VAT Stocks per
10,000 of Population Plymouth 166 Weymouth and Portland 209 Gloucester 223 Swindon 246 Torbay 254 Exeter 258 South Gloucestershire 283 Bristol 293 Bournemouth 294 North Somerset 315 South West 342
Source: ONS (Nomis VAT Registrations), 2005 Business Growth by Sector In 2005 there were 8.7% VAT registrations per VAT registered business, compared to 10.0% nationally. While this appears to highlight a lower level of business start-ups and expansions (above the VAT threshold) within the region, it is measured against a large base of VAT registered businesses. The largest proportion of start-ups is in the Hotels and Restaurant Sector (12.5%), although this rate of registrations is lower than for the UK (15.0%). Broadly in line with the national figures, the Transport, Communications and Storage (10.8%), and the Real estate, Renting and Business Activities (11.2%) also account for a significant proportion of registrations. The table below provides details of VAT stocks by sector and their ten year proportionate change between 1996 and 2005. Between 1996 and 2005, the most significant growth of VAT registered businesses occurred in the Real Estate, Renting and Business Activities sectors, which increased by 55% or almost 16,000 businesses, reflecting the national pattern. In contrast the growth rate of the Financial Intermediation Sector within the South West (40%) was double the growth rate witnessed nationally. A further significant deviation from the national trends occurred in Education, Health and Social Work, where VAT stocks remained static in the South West, compared to a 15% increase nationally. Vat Stock and 10 Year Percentage Growth, by Sector
England South West
2005 VAT Stock
1996-2005 % Change
2005 VAT Stock
1996-2005 % Change
Real estate, renting and bus’ act 484,700 54% 44,870 55% Financial intermediation 17,750 20% 1,390 40% Construction 176,215 16% 21,695 19% Hotels and restaurants 105,880 20% 13,515 17% Mining and quarrying; Electricity... 1,200 -2% 185 12% Transport, storage and comms 68,220 12% 6,500 10% Public administration... 126,780 10% 12,310 9% Education; Health and social work 24,225 15% 2,820 0% Manufacturing 133,960 -7% 13,350 -2% Wholesale, retail and repairs 328,580 -6% 34,035 -6% Agriculture and forestry; Fishing 91,445 -11% 21,270 -11% All VAT Stocks 1,558,950 14% 17,1935 12%
Source: VAT Business Start-ups and Closures, Small Business Service, DTI, 2006
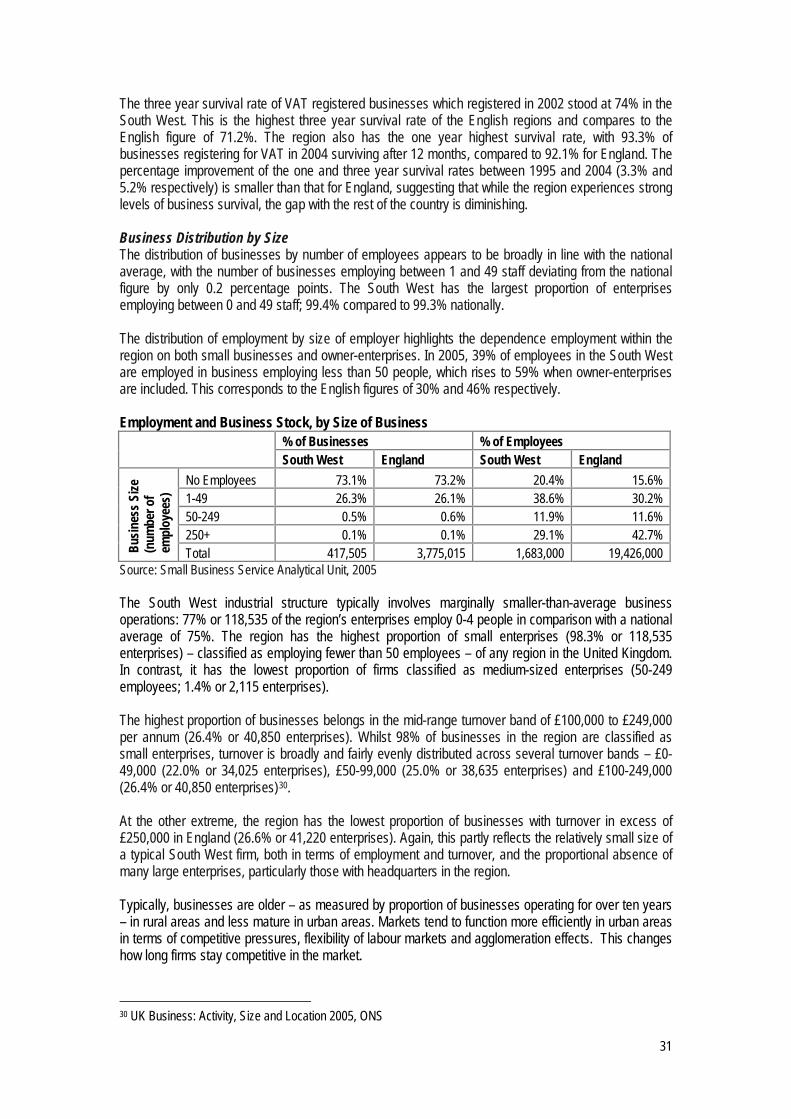
31
The three year survival rate of VAT registered businesses which registered in 2002 stood at 74% in the South West. This is the highest three year survival rate of the English regions and compares to the English figure of 71.2%. The region also has the one year highest survival rate, with 93.3% of businesses registering for VAT in 2004 surviving after 12 months, compared to 92.1% for England. The percentage improvement of the one and three year survival rates between 1995 and 2004 (3.3% and 5.2% respectively) is smaller than that for England, suggesting that while the region experiences strong levels of business survival, the gap with the rest of the country is diminishing. Business Distribution by Size The distribution of businesses by number of employees appears to be broadly in line with the national average, with the number of businesses employing between 1 and 49 staff deviating from the national figure by only 0.2 percentage points. The South West has the largest proportion of enterprises employing between 0 and 49 staff; 99.4% compared to 99.3% nationally. The distribution of employment by size of employer highlights the dependence employment within the region on both small businesses and owner-enterprises. In 2005, 39% of employees in the South West are employed in business employing less than 50 people, which rises to 59% when owner-enterprises are included. This corresponds to the English figures of 30% and 46% respectively. Employment and Business Stock, by Size of Business
% of Businesses % of Employees South West England South West England
No Employees 73.1% 73.2% 20.4% 15.6% 1-49 26.3% 26.1% 38.6% 30.2% 50-249 0.5% 0.6% 11.9% 11.6% 250+ 0.1% 0.1% 29.1% 42.7%
Busin
ess S
ize
(num
ber o
f em
ploy
ees)
Total 417,505 3,775,015 1,683,000 19,426,000 Source: Small Business Service Analytical Unit, 2005 The South West industrial structure typically involves marginally smaller-than-average business operations: 77% or 118,535 of the region’s enterprises employ 0-4 people in comparison with a national average of 75%. The region has the highest proportion of small enterprises (98.3% or 118,535 enterprises) – classified as employing fewer than 50 employees – of any region in the United Kingdom. In contrast, it has the lowest proportion of firms classified as medium-sized enterprises (50-249 employees; 1.4% or 2,115 enterprises). The highest proportion of businesses belongs in the mid-range turnover band of £100,000 to £249,000 per annum (26.4% or 40,850 enterprises). Whilst 98% of businesses in the region are classified as small enterprises, turnover is broadly and fairly evenly distributed across several turnover bands – £0-49,000 (22.0% or 34,025 enterprises), £50-99,000 (25.0% or 38,635 enterprises) and £100-249,000 (26.4% or 40,850 enterprises)30. At the other extreme, the region has the lowest proportion of businesses with turnover in excess of £250,000 in England (26.6% or 41,220 enterprises). Again, this partly reflects the relatively small size of a typical South West firm, both in terms of employment and turnover, and the proportional absence of many large enterprises, particularly those with headquarters in the region. Typically, businesses are older – as measured by proportion of businesses operating for over ten years – in rural areas and less mature in urban areas. Markets tend to function more efficiently in urban areas in terms of competitive pressures, flexibility of labour markets and agglomeration effects. This changes how long firms stay competitive in the market.
30 UK Business: Activity, Size and Location 2005, ONS

32
Entrepreneurship In addition to the VAT data there are a number of other sources of data on entrepreneurship. Data from the Barriers to Survival and Growth in UK Small Firms Survey in 2004, which measures entrepreneurial activity – defined as an attempt at new business or new venture creation - shows that the South West was above the national average at 6.8% of those surveyed31 (up from 5.1% in 2002). Although this is lower than the level of entrepreneurial activity in London and the South East, it was higher than in all other regions. Whilst in 2004 London and SE levels both dropped to around 7%, the South West maintained its position. Consequently, the gap between the South West and these regions is now very small. There has also been an increase of 1.7% in entrepreneurial activity throughout the region between 2002 and 2004 – a relatively buoyant picture. Barclays’ analysis32 of UK business start-ups (which measures bank account openings and tends to focus more on small, non-registered businesses) shows strong growth in 2004 (+49,000) led by growth in construction (+34%) and transport and communication (+27%). The South West saw a small decline in the number of start-ups (-4% to 49,000) but remained a relative “hotspot”. Business Start-ups in the SW Sub-Regions, 2004 Above the regional average Below the regional average Area No.
(000s) Rate/1,000 population
Area No. (000s) Rate/1,000 population
Somerset 6.7 23 South West 49 17 Bournemouth 2 19 BNES 2 16 Cornwall & IoS 6 19 Somerset 1.7 16 Torbay 1.3 18 Bristol 4 15 Wiltshire 4.8 18 Dorset 3 15 Devon 7 17 Gloucestershire 5.3 15 South West 49 17 Poole 0.9 11 S. Glos. 1.7 11 Swindon 1.8 11 Plymouth 1.4 9 Source: Barclays SME Research Team, News Release, March 2005 Sub-regionally, Somerset had the highest rate of start-ups in 2004, followed by Bournemouth, Torbay, Wiltshire and Devon. When this is compared with the sub-regional pattern for productivity, high business start-up rates correlate with low GVA per head. This may suggest that a proportion of these business start-ups are driven by a lack of alternative options or distress such as unemployment. In 2004, the region had a higher level of start-ups that used new technology than any other region (30% of all start-up activity), almost doubling since 2003 (17%) and overtaking London33. This is an indication that South West firms have been relatively active in adopting new technology. More than a third of new starts in 2004 were in business activities, real estate and renting – the highest in proportion and absolute terms, although this reflects national trends (and the proportion is higher nationally). New starts in the region remain proportionately higher in lower value added sectors.
At 8.2%, the proportion of South West self-employed women ranks second highest (after London) and considerably higher than the UK average of 6.9%34, although this is far lower the rate amongst men (18.3%). These figures are supported by Barclays’ analysis, which shows that entrepreneurial activity amongst women is higher than anywhere else in the UK, with 20,600 female mainstream starts in 2004.
31 Barriers to Survival and Growth in UK Small Firms – 2004 Survey, FSB 32 Barclays SME Research Team – News Release, March 2005 33 Global Entrepreneurship Monitor UK – London Business School, 2004 34 Annual Population Survey – ONS, 2004/05

33
Conclusions The South West has a high business density and a reasonable start up rate, although there are considerable variations within the region. A high proportion of the business stock is in very small companies, both in terms of employment and turnover, and in sectors where value added is low. Businesses in the region also tend to be smaller on average than those in the rest of the UK. Only 23% of businesses employ more than 5 people and 73% have a turnover of less than £250,000 per annum. Despite strong levels of VAT registrations in the Real Estate, Renting and Business Activities sector, business start-ups in the region are concentrated in sectors with lower value added, such as Hotels and Restaurants, Construction and Retail. These patterns reinforce the issues concerning low productivity facing the South West.
3.6 Innovation Innovation is a key enabling force for improved economic performance. Innovation relates to the ability to find and introduce new products and processes. International studies suggest knowledge transfer is a driver of productivity in the long term.
Research and Development Research and Development (R&D) has a positive impact on the competitiveness of regional firms and is a key driver of underlying growth in productivity. In 2004, total R&D expenditure by businesses in the South West amounted to £1.361 billion35, or 1.7% of SW GVA, above the figure for the UK of 1.3%36.
The region accounted for 10.1% of all R&D business expenditure in 2004, which is significantly above its GVA and population shares and indicates a strong presence in R&D. The region has also experienced strong recent growth in business R&D expenditure with an approximate 57% increase during the period 2000 to 2004 (compared to 16% growth in England). Overall, expenditure on R&D across business, government and higher education accounted for 2.4% of South West GVA in 2003, again comparing favourably with the UK average 2.1%. As with all other regions, R&D within the South West occurs primarily within businesses, accounting for around 76% of all R&D spend. In 2003, the proportion of R&D spend within businesses in the South West was the fourth highest at 76.3% and well above the UK average (67.9%). The South West receives a relatively large share of government funding for research: the third (equal) largest in 2003 at 0.3% of GVA. This has fallen in recent years from 0.6% in 1998. Conversely, the region has a poorer record in winning funding for research within higher education institutions and was lowest (equal with West Midlands) in 2003 at 0.3% of GVA (UK average of 0.5%). The region’s Higher Education sector has a low share of the region’s R&D (11% compared to 22% for the UK).
The UK Innovation Survey 2001, which quantified innovation activity and performance across the regions, found that the South West was average in terms of innovation activity – defined as introduction of a new or significantly improved good, service or process; engagement in innovation projects and/or longer-term innovation activity (i.e. basic R&D or technology watch); innovation-directed expenditure; or formal co-operation on innovation activities with other enterprises or institutions. In the South West, 46% of enterprises were classed as “innovation active”, compared to a UK average of 47%.
35 UK Business Enterprise Research and Development 2005 – ONS, 2005 36 Based on provisional GVA figures – ONS

34
High Technology Patent Applications, 2002
Source: Eurostat The South West performs below the UK average in terms of high-technology patent applications. Only three English regions and the devolved administrations of Wales and Northern Ireland37 have lower levels of high-tech patent applications. The region has shown higher than average growth in the period 1997 to 2002. Again, the GWNS area performs strongly and accounted for 56.4% of the total number of patents registered in the region. A slightly lower proportion of patent applications originating in the South West were classified as high tech than was the case in the UK as a whole (21.3% compared to 22.5%). Sub-regional Patent activity
0
50
100
150
200
250
Cornw all and Islesof Scilly
Devon Dorset andSomerset
Gloucestershire,Wiltshire and North
Somerset
SW Sub-region
No.
and
Rat
e (S
W=1
00) Total Patents
App per head (SW=100)
Source: Eurostat Cornwall and the Isles of Scilly had the lowest number of patent applications in 2002, although in terms of applications per head of population Devon and Dorset and Somerset had similarly low levels of patent activity. Gloucestershire, Wiltshire and North Somerset was the only NUTS 3 sub-region where the number of applications per head was above the regional average and even here applications were considerably lower than in the UK as a whole (106 per million inhabitants compared to 122 per million).
37 No data is available for Scotland for 2002
0
20
40
60
80
SCO W NI NW NE EM SW YH WM UK L SE E
Region
Appl
icat
ions
(per
milli
on in
habi
tant
s)

35
High Technology Applications, by Sector, 2002
0%
20%
40%
60%
80%
100%
UK SW
% o
f app
licat
ions
Aviation
Communication technology
Computer and automated business equipment
Laser
Micro-organism and genetic engineering
Semiconductors
Source: Eurostat The region has particular strengths for computer and automated business equipment and communication technology. Patent activity is geographically concentrated in the north/east of the region, which reflects knowledge-sector clustering, particularly in aerospace. The sector mix of sub-regions, with aerospace and communication technologies particularly important in the GWNS area, is the key driver of intra-regional differences. These patent applications play a role in these sectors building a lead in key, high value added, knowledge-related sectors. The South West’s R&D effort tends to be concentrated in private business and the (defence-related) public sector. The relative importance of the education sector is modest. Knowledge transfer and related supply chain linkages are a key element of modern economic performance and development. Cooperative Activity Innovation co-operation refers to firms actively participating in joint innovation projects (including research and development) with other organisations. The figure below highlights the strong performance of the South West against this measure between 1998 and 2000, with the second highest proportion of firms reporting cooperation agreements. However, care must be taken when analysing these results as the 95% confidence intervals for most regions overlap. Percentage of Firms Reporting Co-operation Agreements on Innovation Activities, 1998-2000
0.00% 2.00% 4.00% 6.00% 8.00% 10.00% 12.00%
London
Yorkshire and Humber
North East
North West
East Midlands
England
East of England
West Midlands
South West
South East
Source: DTI Regional Competitiveness and State of the Regions (ABI)
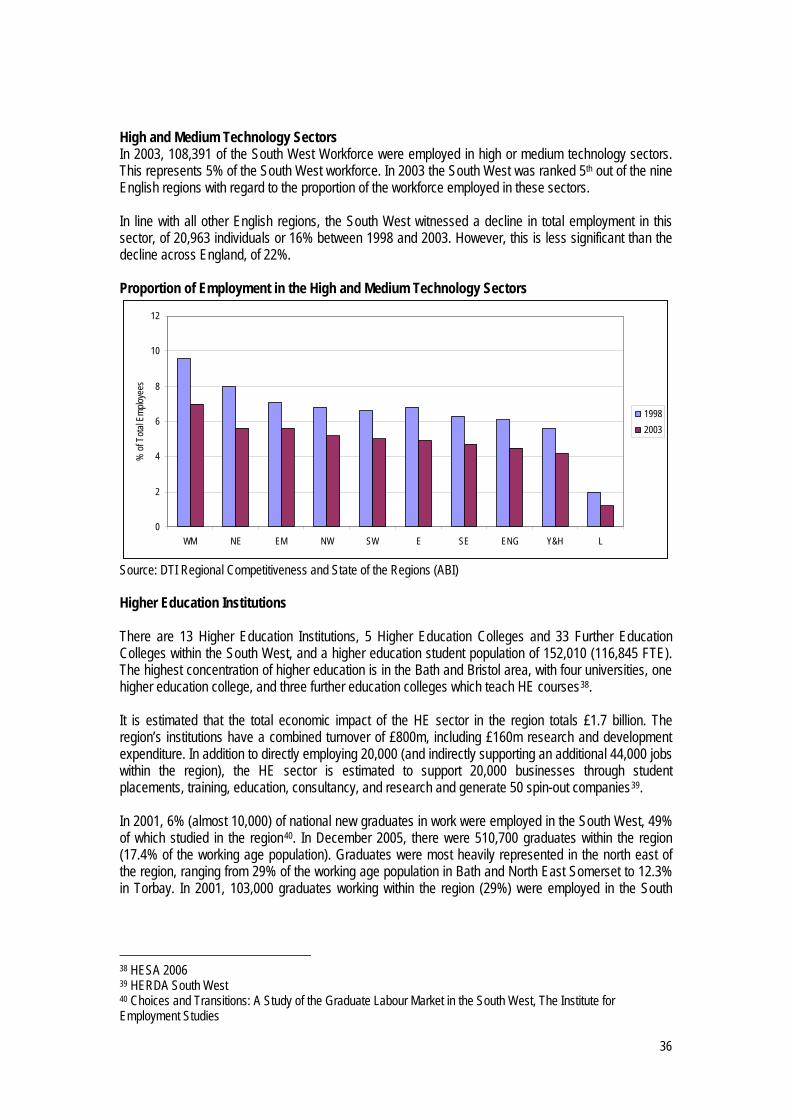
36
High and Medium Technology Sectors In 2003, 108,391 of the South West Workforce were employed in high or medium technology sectors. This represents 5% of the South West workforce. In 2003 the South West was ranked 5th out of the nine English regions with regard to the proportion of the workforce employed in these sectors. In line with all other English regions, the South West witnessed a decline in total employment in this sector, of 20,963 individuals or 16% between 1998 and 2003. However, this is less significant than the decline across England, of 22%. Proportion of Employment in the High and Medium Technology Sectors
0
2
4
6
8
10
12
WM NE EM NW SW E SE ENG Y&H L
% of
Tota
l Emp
loyee
s
19982003
Source: DTI Regional Competitiveness and State of the Regions (ABI) Higher Education Institutions There are 13 Higher Education Institutions, 5 Higher Education Colleges and 33 Further Education Colleges within the South West, and a higher education student population of 152,010 (116,845 FTE). The highest concentration of higher education is in the Bath and Bristol area, with four universities, one higher education college, and three further education colleges which teach HE courses38. It is estimated that the total economic impact of the HE sector in the region totals £1.7 billion. The region’s institutions have a combined turnover of £800m, including £160m research and development expenditure. In addition to directly employing 20,000 (and indirectly supporting an additional 44,000 jobs within the region), the HE sector is estimated to support 20,000 businesses through student placements, training, education, consultancy, and research and generate 50 spin-out companies39.
In 2001, 6% (almost 10,000) of national new graduates in work were employed in the South West, 49% of which studied in the region40. In December 2005, there were 510,700 graduates within the region (17.4% of the working age population). Graduates were most heavily represented in the north east of the region, ranging from 29% of the working age population in Bath and North East Somerset to 12.3% in Torbay. In 2001, 103,000 graduates working within the region (29%) were employed in the South
38 HESA 2006 39 HERDA South West 40 Choices and Transitions: A Study of the Graduate Labour Market in the South West, The Institute for Employment Studies

37
West Priority Sectors, with the Creative Industries and ICT employing the greatest proportion of graduates41. An Arthur D Little report concerning the region’s knowledge base highlights that the region’s HEIs show many examples of world class strength, including chemistry at Bristol, pharmacy at Bath, and marine sciences at Plymouth. In addition there are examples of actions and initiatives that promote industrial exploitation, such as the enterprise teams set-up by several universities and collaborative exploitation activities (Coral Reef and composite technologies). There are a number of key issues concerning Higher Education capacity of the region across a number of fields. In particular, the HEFCE higher education-business and community interaction survey42 found that South West institutions had fewer staff (12%) engaging with commercial partners than the England average (18%), making it the 2nd poorest performing region after London on this measure. This may reflect the relative size of the region’s universities compared to those elsewhere. Three of out the 13 institutions do not have any capabilities (either internal or through an external agency) to seek out licensing opportunities for their Intellectual Property. However, all 13 institutions have a central enquiry point for SMEs and a central dedicated unit to assist SMES specify their needs. The White Paper on Higher Education calls into question the ability of the region’s HEIs to qualify for the UK’s premier league of research led universities (although Bristol University is in the Russell Group), which may add pressure to adopt strategies including focusing on industry-relevant excellence, collaboration for critical mass, and increased industry links. Additional concerns relating to the provision of HE across the region, concern the geographical location of its HEIs, with the ‘full spectrum’ universities (i.e. those offering a broad range of teaching and research in the main field of study) being confined to the Exeter, Plymouth and Bath / Bristol area. 43 Conclusions The South West performs well against some indicators of innovation, and exhibits some strengths among business; higher employment in high and medium technology sectors, higher rates of R&D and an indication of higher than average collaborative activity. R&D expenditure accounted for 2.4% of regional GVA in 2004, compared to a UK average of 2.1%. Business investment in R&D is particularly important in the region, accounting for 1.7% of GVA compared to 1.3% nationally. Conversely investment in R&D by HEIs in the region accounts for a lower proportion of GVA than elsewhere – only 0.3% of GVA or 11% of total regional R&D investment. The region performs below the UK average in terms of the number of high technology patent applications generated per million of population. This performance is not uniform and there is stronger performance in the GWNS area which has a high proportion of the South West’s high-tech industries. The areas with the highest number of patent applications per head in the South West are all in the north and east of the region, potentially exacerbating intra-regional disparities in productivity and GVA levels. Research and development and patent activity is heavily concentrated in the aerospace and defence and communications technology sectors. There is a challenge in broadening business engagement in these activities in other sectors to lessening its reliance on these and increase innovation and productivity in other sectors and other parts of the region. The region’s 13 HEIs are clustered in the North and East of the Region and its ‘full spectrum’
41 Choices and Transitions: A Study of the Graduate Labour Market in the South West, The Institute for Employment Studies 42 Higher education business and community interaction survey 2003-04. HEFCE 2006. 43 Exploiting the Knowledge Base of the South West of England, Part 1: The Potential of the Knowledge Base, Volume 1, Arthur D Little, 2003
38
universities are located in the Bath/Bristol area, Plymouth, and Exeter. Although there are a number of outstanding research Departments, only a low proportion of HEI staff are engaged with commercial partnerships. The Government White Paper on Higher Education points to pressures that may encourage the region’s HEIs to focus on industry-relevant excellence, collaborative activity and increased industry links. In addition, research by HEFCE implies that there is the potential / need for improving the level of engagement with commercial partners by HEI staff.
3.7 Infrastructure (Sites and Premises) and Connectivity The Operational Programme has a limited budget and consequently will not play a role in addressing the sites and premises constraints identified at the sub regional level. Nevertheless, some of the infrastructure constraints may have an impact on maintaining economic growth in the north and east of the region, and securing significant new investment in the west of the region. Hence, a brief summary of the key issues is provided below. An analysis of strategic employment sites in 200544 identified a good distribution of such sites across the South West, clustered around the main urban centres. The largest number of sites is located within the North East Triangle, with a particular bias to the Bristol and Avonmouth area. However, the report identified the following employment land constraints:
In the North East Triangle, there is insufficient choice of sites available both
immediately and in the short term, and clear gaps in the availability of sites outside the Bristol and Avonmouth area;
The South East Zone has a good number of sites, but these provide a small total site area (198.1ha). There is latent demand in the Portland and Weymouth area which is unlikely to be met by the sites identified, current employment stock is of older units whereas demand is for new, smaller units;
As the main economic centre of the South Central Functional Zone, Exeter needs to provide more choice of site to ensure that investors are not attracted to sites further up the M5 or A303; and
In Plymouth there is a shortage of industrial land, which could be alleviated by availability at Langage Park. Plymouth also lacks a city centre employment quarter, such as Capricorn Quay in Bristol, which could be fulfilled by Millbay / Sutton Harbour
These major site issues are of strategic importance for the attraction of significant new investment from outside of the region, and to ensure the recent high levels of economic growth can be maintained. Connectivity - Transport Generally, road transport in the South West is marked by lower car ownership, lower than average vehicle flows and lower average travel to work times. Although there are congestion points in the region, there are generally lower overall traffic flows compared to the national average. The region has seen typically high traffic growth over the previous decade, with 22.9% growth in traffic flows (1994 to 2004) – the third highest (equal) level of growth of any region. The most significant commuter in-flows in absolute terms are for the Bristol/Bath area (55,000 people), Bournemouth/Poole area (26,000) and Cheltenham/Gloucester area (25,000). The most significant flows as a proportion of the population who work in each area are for the Cheltenham/Gloucester area and Bristol/Bath area (24% and 22% respectively)45.
44 Market Facing Assessment of the Demand for Supply of Employment Land, and an Assessment of the Supply from Non-Industrial Sources, King Sturge 45 2001 Census – ONS

39
With regards to rail travel, there remains a heavy reliance on connections to the Greater London area. In 2002-03, 75 million journeys were made within, to and from the Great Western Main Line (GWML) area – around 8% of national rail journeys. Only 25.8 million related to areas within the South West region46. There were 7.6 million journeys (29.5%) to or from central London, with almost 67% of these in the “to London” direction47. This traffic is more heavily weighted towards the east of the region – 43% of journeys originating from Wiltshire were completed in Central London and this, in part, highlights the extensive draw of London’s labour market.
Air travel is still a relatively less important mode of transport when measured in total passenger numbers, although it is growing fast and is forecast to continue to grow. Air travel is regarded as an important element in addressing time-distance constraints faced by the business community in the west of the region.
In terms of public transport availability, the South West lags behind all other regions and has the lowest use of public transport to travel to work. In 2004, 5% of people used public transport to travel to work, compared to a national average of 14%. Bus availability in the South West, measured as a proportion of households within a 13 minute walk of a bus stop with a service at least once an hour, is the lowest in Great Britain48. In 2003/04, South West bus availability was 82%, compared to 90% for Great Britain. Over the last 20 years, the region has seen considerable improvement in the availability of bus services (a 17% rise since 1992/94), although other regions with poor bus availability, such as the East of England and South East, have shown greater improvement over this period. ICT Infrastructure A review of internet access undertaken on behalf of the SW partnership49 found that 58% of businesses within the South West have internet access, ranging from 55% in Dorset to 63% in Gloucestershire. A total of 35% of businesses did not have ICT access and a further 6% reported having ICT access, but not internet access. The study found that these results were in line with the findings of an earlier survey in 2004, suggesting that internet take up within the region has recently levelled off. Broadband was the dominant internet connection (74%), followed by dial-up (18%). Of those with an internet connection, 16% had recently changed their internet connection, 59% of which changed from a dial-up to broadband connection. ICT change amongst businesses in the region is driven by demands from customers, staff, the actions of competitors and the wider business community. Many businesses do not have in-house expertise and are reliant on an ‘IT enthusiast’ to address their ICT needs. The importance of ‘IT enthusiast’ suggests that the full benefits to business of ICT are not being realised in the region. Providing support to businesses to enable them to make informed decisions on the adoption of ICT could increase business benefits. This could include the adoption of home-working, which is being enabled by the roll-out of broadband across the South West. Conclusions In parts of the region, some of the available sites and premises do not meet market need, and there is a shortage of choice in locations such as Exeter and Plymouth. Ensuring that an appropriate supply of sites and premises is available to the market will be important to ensure the on-going growth of the region’s economy. This is likely to involve some public sector investment, although not ERDF due to limited resources. South West England has lower congestion problems than elsewhere, although the rate of traffic growth is higher and forecast population and economic growth will place increased pressure on the region’s transport infrastructure. The region has less public transport capacity than most other regions, and this
46 As classified as Bristol Area, South West, Cotswolds, Wiltshire 47 Consultation Great Western Main Line – Route Utilisation Strategy – Strategic Rail Authority 48 National Travel Survey, DfT 49 ConnectingSW Partnership Benchmarking Research, 2005

40
will limit some people’s access to employment markets. Transport provision is linked to connectivity and peripherality and resulting constraints on productivity and growth. Although 58% of businesses in the South West have internet access, this represents a levelling off of take-up since 2004. This suggests that those businesses that do not yet use broadband may be the ‘hard to reach’ and more efforts may be necessary to encourage take-up in future. Many businesses in the region report a lack of in-house ICT expertise, and again this may be reducing the benefits to business of improved connectivity.
3.8 Skills Overall the South West performs well in terms of the educational attainment of the adult population, with 83% of the population holding at least NVQ1, compared to 77% across England. The region and the Gloucestershire, Wiltshire, and North Somerset (GWNS) area outperform the national figures at all educational levels (i.e. NVQ1+ to NVQ4+). However, there are gaps in the proportion of individuals with higher level qualifications in parts of the region, particularly concerning the proportion of the population that hold NVQ4 and above (i.e. graduate level qualifications) among Devon and Cornwall and, to a lesser extent, Dorset and Somerset. Despite the positive performance relative to the national picture, there are still substantial skills gaps across the working age population. For example, across the South West, 10% (or 294,100) of the working age population do not hold at least an NVQ level 1 qualification, rising to 19% in Cornwall and the Isles of Scilly. NVQ level 2 is generally regarded as the entry level benchmark for employment and across the South West, 34% of the working age population do not hold qualifications to this level. Educational Attainment of the Working Age Population, 2005
NVQ4+ NVQ3+ NVQ2+ NVQ1+ GWNS 30.0 47.7 66.8 82.9 South West 26.5 46.0 66.2 82.0 Dorset and Somerset 25.1 46.2 66.4 81.6 Devon 23.7 44.1 65.0 81.3 Cornwall and IoS 20.4 42.8 65.8 80.8 England 26.2 43.9 62.5 77.1
Source: Annual Population Survey Looking back over the past five years, the proportion of the working age population with NVQ3+ has increased marginally from 44.8% to 46%, compared to a small decline nationally from 44.9 to 43.9%. The proportion of working age adults with NVQ3+ has increased from 38.4% to 42.8% within Cornwall and the Isles of Scilly and from 43.1% to 46.2% in Dorset and Somerset, whilst remaining relatively static elsewhere. A lack of qualifications is a more serious issue among older people, with the proportion of individuals with NVQ levels 2 or 3 peaking for the 25-29 age group. The figure below highlights this key issue, by clearly showing the positive relationship between an individual’s age and the likelihood of them not holding any qualifications. The peak of no qualifications among those ages 16 to 19 is most likely to reflect the fact that many will not yet have completed college courses, however the proportion without NVQ levels 1 or 2 (GCSE equivalent and below) is significant. The pattern of qualifications by gender within the region is mixed, but the proportion of individuals educated to NVQ4+ is broadly in line among males and females and women are more likely to be educated to NVQ levels 1 or 2. However, women are less likely to hold any qualifications, both regionally and nationally.

41
These facts underline two key issues concerning the educational attainment of women. Firstly, once women embark on formal qualifications, they are more likely to stop once they have achieved NVQ level 1 or 2, and secondly, there is an initial challenge in getting women to embark on formal qualifications at all. Proportion of Working Age Individuals with No Qualifications, by Age, 2005
0.0%
5.0%
10.0%
15.0%
20.0%
25.0%
16-19
20-24
25-29
30-39
40-49
50-ret
irement
age
Working
Age Popu
lation
South WestEngland
Source: Annual Population Survey Business Demand for Skills Business demand for skills is comprehensively measured by the National Employer Skills Survey (NESS)50. The purpose of the survey is to establish where skills shortages and deficiencies lie in the economy and identify what employers are doing to increase the supply of skills.
In 2005 the NESS reported a total of 19,202 hard-to-fill vacancies within the South West, accounting for 31% of all vacancies within the region; slightly lower than the English figure of 35%. The proportion of vacancies that are hard-to-fill was highest in Devon & Cornwall (35%) and Somerset (36%), whereas the lowest figures were found in the West of England and Gloucestershire (30% in each). Hard-to-fill vacancies were most common for employers within a range of ‘blue collar’ sectors (for example 64% of vacancies in the land-based industries and 61% in transport were hard-to-fill) and for smaller companies, particularly those employing 5 to 24 staff, where the proportion of hard-to-fill vacancies was 37% of all vacancies.
While Skills Shortage Vacancies were less significant within the region than nationally, accounting for 18% of all vacancies in the South West and 25% across England, they did account for 58% of all hard-to-fill vacancies within the region. Their significance is greatest in the production and manufacturing sectors. Establishments employing less than 25 people accounted for 71% of skills shortage vacancies, despite these firms employing approximately 35% of the work force.
Overall, 15% of South West establishments reported internal skills gaps, in line with the national figure. The number of reported skills gaps declined by 46% between 2003 and 2005, and the prevalence of skills gaps is fairly equally distributed between the sub-regions. Skills gaps are most likely to be found within the retail, hospitality, construction, engineering, and social care sectors and skills gaps are most
50 The National Employer Skills Survey 2005 for the South West Region of England. May 2006. BMG Research - DRAFT

42
frequently observed in the lower skilled occupational groups (46% were in sales and elementary occupations). When asked to assess the impact of skills gaps, 47% of employers reported that they increased the workload for other staff and 20% reported that they increase operating costs.
Employer training is typical of the national picture with 45% percent of establishments having a training plan in place and 33% having a training budget. The proportion of establishments providing training is 65%, which is equal to the national average and represents an increase from 62% in 2003. There are close links between skills and the development of a sustainable, knowledge-based economy. Important shifts in demand for workforce skills are underway. The “knowledge-based” value added economy of the future needs both a solid foundation of people with basic skills, able to make the most of technological and process change, and an increasing supply of people with higher level skills, able to innovate flexibly in response to, and anticipation of, demand.
The juxtaposition of relatively high employment, high qualification levels and low productivity appears to confirm the picture painted by recent research into labour and skills – that the South West exhibits high labour utilisation in quantitative terms but is not utilising its skills base to best effect51 52. Conclusions A large number of the working age population do not hold qualifications at Level 2, the minimum perceived requirement to function effectively in the modern labour market. Many of these are amongst the 50% with poor numeracy skills and the 13% of people in the region with poor literacy skills. Although the working age population is well qualified, the existing skills base is under-utilised by the region’s businesses, and this is reflected in the region’s low productivity and wage rates. In line with nationally, there are also diversity issues, with women and older workers being less likely to hold formal qualifications. Alongside the under-utilisation of highly qualified workers, the region continues to experience skills shortages and skills gaps. Skills shortages are currently highest in blue collar sectors and elementary occupations. Smaller companies are most likely to experience skills shortage vacancies and given their limited size the impact on the performance of the business is likely to be more severe than is the case for larger firms, potentially limiting the small firm sector’s contribution to regional economic growth. In future, the pattern of increasing employment in managerial, professional and associate occupations is set to continue and the number of people employed in elementary occupations is forecast to decline. Despite this, the ageing workforce means there will still be significant replacement demand in elementary occupations as people retire.
3.9 Unemployment and Multiple Deprivation Unemployment The region has one of the lowest ILO unemployment rates in the country53. In the year ending December 2005, the LFS based unemployment rate was 3.4% compared to an English average of 4.8%. ILO unemployment rates are typically highest in the urban areas – Plymouth (5.8%), Torbay
51 South West Skills Market: A Review of Supply and Demand – SLIM for SW Observatory, 2004 52 South West Healthy Labour Market Review – SWESA, 2005. 53 ILO (International Labour Organisation) Unemployment is an internationally agreed measure of unemployment. Unemployed people are defined as individuals over 16 who are either without a job, have actively sought work within the past four weeks, and available to start work within two weeks; or out of work, have found work, and are waiting to start within the next two weeks. The ILO Unemployment rate is expressed as a proportion of the total economically active population. (Source: ONS)

43
(5.3%), Swindon (4.7%), and Bristol (4.4%). The exceptions amongst the more rural areas are Somerset and Cornwall at 3.8% and 3.9% respectively. The region experiences higher than average rates of unemployment among younger people, which stood at 9.9% in 2006 for those aged 16-24 compared to 2.3% for those aged 25-49. Unemployment among older people (50+) is in line with the population aged 25-49, although this age group experienced a higher rate of inactivity, suggesting that many individuals drop out of the labour market. Unemployment amongst BME individuals is considerably lower in the South West compared to England (ILO unemployment of 4.5% and 11% respectively in 2006), although the figure is still above the overall South West unemployment rate (3.5%). Where data is available at the regional level 54, unemployment is below the English figure for all BME groups, however unemployment ranges between 5% for the Other Ethnic Group (11% in England) to 6.6% for the Mixed Ethnic Group (12.3% in England). For claimant count, almost two thirds of the region’s local authorities fall below the South West’s 1.6% average, and all fall below the UK average of 2.6%. Claimant unemployment is mainly concentrated in major urban centres and the far south west. The intra-regional range is from 2.3% in Plymouth and Torbay to 0.3%-0.8% in Purbeck and Salisbury. Average Sub-regional Claimant Count Rate (July 06)55
Legend 0.30 - 0.75 0.76 - 1.21 1.22 - 1.67 1.68 - 2.13 2.14 - 2.60
Source: ONS, © Crown Copyright Worklessness There were around 173,000 'workless' households in the South West in spring 200556. The percentage of workless households in the region (12%) was significantly lower than the England average (16%). Since 2000, this figure has reduced from 14% (188,000), the greatest decrease recorded for all the English regions57. The total number of benefits claimants stood at 320,800 in the South West in 2006, or 11% of the working age population, lower than the national proportion of claimants (13%). Claimants of sickness 54 South West data for those of Indian and Pakistani / Bangladeshi origin is suppressed due to the sample size. 55 Nomis – July 2006 56 Workless households are defined as households with at least one person of working age that contain no adults in employment according to The Labour Force Survey 57 State of the South West, 2006

44
and disability related benefits are the most significant claimant group, accounting for 7.2% of the South West working age population (217,800) or 68% of all benefits claimants. Between 2001 and 2006, the number and type of claimants as proportions of the working age population have remained relatively constant. However, while the proportions of JSA and Lone Parents have declined by small amounts, the proportion of IB Claimants increased over the period (from 6.7% to 7.2% of the working age population in the South West). The number of benefits claimants as a proportion of the working age population ranges from 16% in Torbay (12,100 people) to 7% in Wiltshire (19,700), with the proportion in Torbay, Plymouth, Bristol (and Cornwall and the Isles of Scilly) being above the national average (13%). In line with the national and regional figures, the largest claimant group is of those claiming sickness and disability related benefits, ranging from 11% of the working age population in Torbay, to 5% in Wiltshire. Deprivation Overall the South West region experiences lower level of deprivation compared to England, however the region does contain areas of severe multiple deprivation, as measured by the Index of Multiple Deprivation (IMD). Over 140,000 South West residents are located in Super Output Areas (SOAs) ranked among the 10% most deprived in England. In line with the nation trends, multiple deprivation is concentrated in the urban areas of the region, particularly Bristol and Plymouth, which account for 57% of the region’s most deprived SOAs. Rural areas do not generally suffer from multiple deprivation to the extend witnessed in urban areas, however many rural areas exhibit particular elements of deprivation; notably barriers to housing and services.
Across the region, Super Output Areas (SOAs) ranked among the most deprived 10% nationally are found in the urban areas of Bristol (35 SOAs), Plymouth (19), Swindon (7), Bournemouth (6), Gloucester (5), Torbay (4) and Exeter (2). Deprived SOAs are also located in some other rural parts of the region, including parts of Cornwall (7), North Somerset (5), and North Devon (2). Bristol is most affected by multiple deprivation and has the highest proportion of residents (14%) living in SOAs ranked among the 10% most deprived nationally. Bristol is most affected in the four domains (income; employment; education, skills and training; and crime). Deprivation issues are most acute for crime where over 40% of its population reside in SOAs ranked among the bottom 10% nationally, and education, where the figure is 25%.
Almost 25% of the population of Plymouth are resident of SOAs ranked among the worst 10% nationally for living environments, and the city is also the poorest performer in the region with regard to the health, deprivation, and disability domain, which affects over 16% of its population. Plymouth also performs poorly in the crime domain, where over 15% of its residents are within 10% worst SOAs nationally. The consultation document on the Local Enterprise Growth Initiative published by the Treasury and Small Business Service highlighted the link between multiple deprivation and low business start up. It quoted a recent Bank of England58 report which concluded that “the negative relationship between deprivation and entrepreneurial activity appears clear cut in the case of the 50 most deprived local authorities”. There is also a much lower survival rate in deprived area, compared to more affluent areas. The rural areas are generally less deprived, although both Devon and Cornwall and the Isles of Scilly perform badly in the Living Environment domain. In addition to these two areas Wiltshire, Somerset, and Dorset perform poorly in the Barriers to Housing and Services domain. Over 18% of the population were resident of the 10% most deprived SOAs in this domain, with the figure for Cornwall standing at almost 40%. 58 Bank of England (2000): Finance for small businesses in deprived communities – a first report.

45
Conclusions The South West has consistently experienced low levels of unemployment and now has the lowest level of ILO unemployment in England. Claimant unemployment is very low in some parts of the region, although there remain pockets of unemployment in other areas, particularly the west of the region and the urban areas. There is a need to reduce the number of workless households – some 173,000 in spring 2005 – and support those on sickness and incapacity benefit to re-enter the labour market. This group – some 7.2% of the working age population – potentially represents a valuable resource for the labour market given the current lack of capacity to increase employment levels from within the existing economically active population. Unemployment and worklessness affect different groups within the labour market to different degrees. The region’s BME population experiences a higher unemployment rate than the white population. Those living in the urban areas of Torbay, Plymouth and Bristol experience higher rates of benefit dependency than residents in the remainder of the region. Although the South West experiences lower levels of deprivation than nationally, there are areas of severe deprivation across the region, primarily in the urban areas. Plymouth and Bristol have the largest concentrations of severe disadvantage, although other centres are also affected. The term ‘multiple deprivation’ suggests that many of the issues of deprivation are related and inter-linked (such as low levels of educational attainment, low incomes, and high crime in Bristol).
3.10 Spatial Characteristics Rural The South West is a relatively rural region, with 64% of land classified as “undeveloped uses” in comparison to an average of 48% throughout England. More specifically, 50% of land in the region is classified as agricultural compared to 35% in England59. “Rurality” is also reflected in the geographical location of the population: 34.1% of people are classed as living in rural areas – the highest proportion of any region in England and significantly higher than the national average of 19.3%60 (see Figure 8). Recent changes to Defra definitions61 differentiate between different types of rural area: “town and fringe”, “village” and “hamlet and isolated dwelling”. On these measures, in the South West 13.9% of the population live in town and fringe areas, 13.8% in villages and 6.4% in hamlets and isolated dwellings, compared with 9.4%, 7.5% and 3.3% respectively for the United Kingdom as a whole. Within the region, there are clear differences in the proportion of residents living in rural areas. Cornwall has the highest proportion of the population living in rural areas, with 25.4% in town and fringe areas, 23.7% in villages and 13.0% in hamlets and isolated dwellings.
59 ODPM 60 Census 2001 - ONS 61 Rural and Urban Classification 2004 & Key Statistics for the Rural and Urban Classification 2004 – ONS, 2004

46
Regional Populations Living in Rural Areas, 2001
0
5
10
15
20
25
30
35
40
L NW WM NE ENG YH SE EM E SWRegion
% o
f pop
ulat
ion
Source: Census 2001, ONS
The rural population is typically older than average. Rural areas have a lower proportion of their population aged under 45 and a higher proportion amongst the older age groups. The age structure figures confirm the widely held perception that younger people leave rural areas, primarily for education and employment purposes. This has an impact on the shape of the labour force – for example, rural areas have a significantly lower proportion of their population in the 25-34 age group, which might suggest differences in terms of new skills acquisition and entrepreneurship.
The geographical spread of businesses broadly reflects the population spread. In 2003, the South West had the highest proportion of its businesses in rural areas of all the English regions, although the figure was exceeded by Wales: 36.2% of businesses in the region were located in rural areas in 200462.
A Defra report on rural productivity recognises that the differences between rural and urban areas with regard to productivity are matters of degree rather than substantial differences, and shows a strong relationship in the region between productivity and peripherality63. It also highlights the region’s rural migration characteristics – “old in, young out”. Poor productivity in rural areas is attributed generally to low educational attainment. In the South West, however, relatively high education levels in rural areas are accompanied by low rural productivity. This may well reflect workplace and residence differences and resulting commuter flows, with economic activity in rural areas not utilising the skills and qualifications of rural residents. Typically, businesses in rural areas are smaller than in urban areas – in 2004, 75.8% of businesses in rural areas employed fewer than four employees in comparison to 64.9% in urban areas. This may be a result of the higher proportion of rural businesses in the agricultural and tourism sectors, which typically have a smaller business size profile. However, the proportion of businesses involved in tourism – as measured by hotels and restaurants – is broadly similar for urban and rural areas – at 8.0% and 8.5% respectively. The smaller typical business size in rural areas may therefore be due more to the businesses themselves than to differences in industrial structure. The industrial structure for rural and urban areas (excluding agriculture) is broadly similar, although it is interesting to note that rural areas have a slightly higher representation in both the manufacturing and construction industries. There are over 47,000 agriculture businesses in the region, of which about 80% are classified as rural. Going forward, it will be important to distinguish the development prospects,
62 Annual Business Enquiry – Office of National Statistics 63 Productivity in Rural England, ONS

47
patterns and requirements of new land-based activities in rural areas from other new activities with dynamic, networking characteristics for which urban/rural location is more of a “free” choice.
Further structural changes are expected in the rural areas as a consequence of the reforms to the EU’s Common Agricultural Policy. The de-coupling of subsidy payments from production is expected to reduce the amount of land used purely for agricultural production purposes and this may potentially reduce the number of businesses (though not necessarily the scale of total activity) involved in agriculture and its support sectors. Ownership and use of land may become less connected. The total area farmed may only decline slightly whilst total output gets more concentrated.
This could have a significant effect in some of the more peripheral and rural areas where agriculture has a significant, yet marginally profitable, presence – for example, in Torridge in 2004/05, 9.7% of workers were directly employed in the agricultural sector and areas such as Caradon, West Dorset and West Somerset all still had a significant agricultural sector64. Expected structural changes will not necessarily have a uniform impact across the region but do have the potential to affect specific rural areas to a greater degree. Conclusions The rural areas account for a large proportion of the South West’s land area – nearly two-thirds compared to less than half in England as a whole. As a result the proportion of the region’s population living in areas classed as rural is higher than in any other English region – 34.1% - and one third of businesses in the region are in rural areas. There are some differences between the industrial structures of the urban and rural parts of the region. Rural businesses tend to be smaller on average than their urban counterparts, which may limit their potential to invest in training and business development. There are also a higher proportion of businesses in the rural areas in the manufacturing and construction industries and, as would be expected, in agriculture. . Rural areas will face particular potential pressures arising as a consequence of the CAP reforms. These are likely to affect the amount of land used for agricultural purposes, and are occurring in the context of declining traditional rural industries. Additional challenges are related to poor access to jobs and services, notably in the more peripheral areas of the region. These issues, highlighted by the IMD, present a challenge to the achievement of balanced, sustainable and inclusive economic development. Urban Although some analysis suggests that new technologies will encourage the geographical spread of economic activity, evidence on agglomeration effects disputes this, suggesting urban concentrations and “city-region” flexible networks of business clusters and labour markets remain the engine of economic growth and development. This analysis suggests that “proximity” factors will drive innovation and the knowledge economy and the creation of productive businesses. Research supporting the development of the RES supports the argument that the South West’s major urban centres will remain the focus of economic development and growth over the next twenty years.
Other recent research has shown that productivity is affected by proximity to economic mass / urban areas. These findings suggest that doubling mass raises productivity in a given area by 3.5%. Research finds that just over a third (34%) of the predicted spatial variation in UK productivity is attributable to variance in economic mass65.
64 Annual Population Survey, ONS 65 Spatial determinants of productivity analysis for the regions of Great Britain – Rice and Venables, LSE – 2004.

48
In addition, cultural aspects of urban life have been found to contribute to urban dynamism and productivity66. This research suggests that economically successful international cities have vibrant music scenes, diverse ethnic and orientation communities and other cultural factors that encourage networking, entrepreneurship and innovation. This is likely to reflect age distribution factors, links with educational centres of excellence and other factors that encourage multiplier effects to be strong and positive. In some parts of the country, urban development and land use patterns are mutually reinforcing: availability of land for re-development within existing urban areas is significant. Apart from some areas of Bristol and Plymouth, this is less prevalent in the South West. There have been cases of firms looking to expand being constrained by land designations in Poole, Yeovil and other manufacturing-orientated areas. There is an ongoing need for the region to be sensitive in the way it handles issues of a lack of brown-field sites, the preservation of green-belt and environmentally distinct areas whilst accommodating the business and sector aspiration for growth and development.
The urban landscape of the region is broader than the main “city-regions.” There are important connections – physical, cultural, economic, knowledge – between the cities, towns and rural areas. A number of towns in the South West – within and outside defined city-regions – perform valuable regional and sub-regional functions in the economy. They have some potential to increase this contribution and strengthen links between cities and rural areas. Conclusions The region’s urban areas act as the key drivers of economic growth and in future years are likely to attract the largest share of business investment, population and household growth. This will present challenges in terms of sustainability and the capacity of the urban infrastructure. Ensuring that economic development within the urban areas is inclusive will be of particular importance, given the concentrations of multiple deprivation found in some urban parts of the region. Urban development presents a number of additional challenges, including the lack of brownfield land available for development in some urban parts of the region and the suitability of that which is available. A further issue is to ensure that functional links between the urban areas and the rest of the region reflect the physical and economic roles that each area performs in the regional economy. Intra-regional Disparities A key feature of the South West is the intra-regional disparities that exist within the region. The urban and rural sections above highlighted the key disparities that exist between these distinct parts of the region. The peninsular nature of the region has led to disparities between the well connected and generally prosperous north eastern parts of the region and the more peripheral west. This pattern is clearly illustrated by the following figure which illustrates GVA per head by local authority. The four unitary authorities that outperform the English average are located to the north east of the region. To some extent the disparities are attributable to the more rural nature of the south and west of the region, however both Plymouth and Torbay experience low levels of GVA per head, despite their urban nature. Of particular concern is the fact that GVA per head in Torbay lies below that for the Cornwall and Isles of Scilly Convergence Area.
66 The RISE of the Creative Class – Richard Florida, 2002

49
Total GVA per Head, by NUTs3 Area, 2004
0
5,000
10,000
15,000
20,000
25,000
30,000
Swind
on
Brist
ol Ci
ty of
Glou
ceste
rshir
e
North
and
Nor
thEa
st So
mers
et,
Engla
nd
Bour
nemo
uthan
d Poo
le
South
Wes
t
Wilts
hire
CC
Plymo
uth
Some
rset
Devo
n CC
Dorse
t CC
Corn
wall a
ndIsl
es of
Scill
y
Torb
ay
£ millio
n
Source: Office for National Statistics Levels of GVA are only available to the County or Unitary level. Workplace earnings are often given as a useful proxy measure for economic performance at a lower geographic area. This measure shows some of the differences within counties, showing for instance that Torridge, North Devon, Mid Devon, and Torbay all hove some of the lowest workplace based earnings in the UK. The map of median residents’ wages below provides a further illustration of intra-regional disparity across the region. In Devon, only West Devon residents have a median gross weekly pay above the regional average (£433 compared to £406 for the South West), and the lowest wage in the region (excluding Cornwall is Torridge (£316 per week), followed by Torbay (£342). This compares to the North East of the region, where the median resident wage in the Cotswolds is £473 per week. Median Gross Weekly Pay of Full-Time Workers (Resident Analysis), 2005
£443 - £475 £412 - £442 £380 - £411 £349 - £379 £317 - £348
Source: Annual Survey of Hours and Earnings (Crown Copyright)

50
It is important to note that while the broad disparities between the north east and west of the region can be easily identified, this broad approach excludes areas within the north and east that suffer from deprivation, low wages and above average worklessness. For example, Weymouth and Portland, to the east of the region, has a median full-time wage of only £354, and the figures for Gloucester (£373) and Bournemouth (£376) are also below the regional average. Furthermore, while the relatively prosperous North East of the region acts as the powerhouse of the region, its prosperity does not extend to all of its residents. The performance of Bristol has been highlighted throughout the baseline. However it is also important to note that there are deprived communities within Swindon, Gloucester, and North Somerset. Conclusions There is a clear and significant disparity between the east and west of the region. This has been identified at the European level, through the Convergence status provided to Cornwall and the Isles of Scilly for 2007-13. However, parts of the competitiveness area suffer from similar levels of disadvantage to Cornwall; in particular North Devon, Torridge, and Torbay. A major challenge for the region will be to narrow the east-west gap by promoting enterprise and competitiveness in the east of the region and where possible creating economic linkages with the north east of the region. The issues facing particular communities in the north east of the region are also challenging, and this is highlighted by the concentrations of deprivation in Bristol and Swindon and the poor economic performance of the Forest of Dean. In such areas, there is a need to tackle the barriers that restrict the communities from participating in the activities to promote economic growth.
3.11 Functional Zones The RES identifies seven overlapping economic zones which each display consistent economic and social functions (See Figure 9). Functional zones have been defined following an analysis of data about flows of people, goods and communications, in addition to the provision of health and retail services. South West Functional Zones
Source: Regional Economic Strategy, 2006-16 Spatial Implications

51
The North East Triangle is the largest zone in the region, containing almost 44% of the region’s population and has significant potential for further growth. It is the most prosperous, economically diverse and accessible part of the region and has been described as the region’s economic powerhouse. The zone boasts the highest skills and income levels; and has the most significant HEI presence of any in the region. Key sectors include High-Tech Manufacturing and ICT industries. Deprivation tends to be concentrated in urban areas, although the Forest of Dean also suffers economic problems. The A303 Corridor zone contains about 10% of the region’s population. The A303 Corridor is not a particularly distinct or economically coherent zone, and its defining features are the A303, the Exeter/Waterloo rail corridor and the activity in and around key market towns near the A303 and A30. The potential exists to further develop the role of this corridor through the growth of the strategic settlements. Business formation rates range from average to low, but employment and economic activity rates are relatively high. A number of priority sectors are represented in the zone, including Advanced Engineering, Food and Drink, Biotechnology and Environmental Technology. Advanced Manufacturing, the primary industry sector and traditional manufacturing also stand out as key sectors in the zone. There is also a valuable Ministry of Defence presence in this zone, with strong links to research establishments. The South East Coastal zone contains about 13% of the region’s population, concentrated in two economic centres. The focus of the zone is the Bournemouth–Poole–Christchurch conurbation and this economic centre has a stronger connection with Southampton than with Salisbury or Bristol. In 2005 the conurbation accounted for 9.2% of the region’s GVA and 9.5% of regional jobs. This is a zone of contrast – dominated by the prosperous, successful Bournemouth/Poole conurbation and including rural Dorset. The zone is characterised by large areas of AONB designation and World Heritage status coastline. Culturally, the zone is very close to the South East region, reflecting transport linkages. New business formation is strong in Bournemouth and Poole, where there is also high employment in the knowledge economy and the zone is a popular inward investment destination. Three of the region’s priority sectors (Tourism (including Leisure), Marine Technology, and Advanced Engineering / Aerospace) are significantly represented in the zone. The M5 Corridor zone contains approximately 13% of the region’s population and includes the strategic settlements of Exeter, Weston-super-Mare and Taunton. The M5 corridor zone overlaps with other functional zones including the North East Triangle, with the consequence that there is a strong relationship with Weston-super-Mare and Bristol to the north and Exeter, Newton Abbot and Torbay to the south of the zone. The zone is very much defined by flows along the north-south transport routes and forms the link between the ‘prosperous north’ of the region and ‘less prosperous’ peninsula. The zone exhibits a variety of socio-economic needs (e.g. educational performance; deprivation; housing affordability). Consequently, there needs to be a close working relationship with other zones as many of the major issues are shared with them. Growth appears to have largely been due to distribution and logistics related to consumer service provision, there are, however, ‘hot spots’ of strategic locations for high-tech and high value adding businesses. Priority sectors particularly represented in the zone include Aerospace (considerably higher than in the region as a whole) and Biotechnology. The South Central zone consists of three main centres, Exeter, Plymouth, and Torbay. Although there are good transport links within the zone and to other zones, parts of the South Central zone are considered to be relatively remote. Plymouth and Torbay are economies in transition, while the economy in Exeter has experienced strong growth in recent years.

52
Employment in this zone has grown slowly relative to the regional average, unemployment has fallen slowly and manufacturing productivity has not changed. There are relatively high levels of unemployment in the main centres, consisting of a high proportion of long term unemployment and seasonal unemployment. In addition, educational levels and wages are generally low. There is relatively low employment in the knowledge-based sectors and the key industries of tourism and manufacturing are struggling to adapt to changing or declining markets. Priority sectors in the zone include marine technology, advanced engineering, tourism and food and drink. The North Peninsula zone is sparsely populated, containing just 3% of the region’s population and containing no major urban areas. It is also a significant distance from any major urban area and has poor transport links. The zone has an older than average population and is characterised by a relatively poor performing economy with fairly high levels of deprivation. There are small clusters of high-tech lifestyle companies and employment in the biotechnology, marine technology and tourism sectors is strong. The zone also has some strength in the food and drink sector. The majority of the zone is currently designated as a structural area of need. It exhibits a low rate of business formation and there is low employment in the knowledge sectors. The Western Peninsula economy provides employment for over 180,000 people with a GVA of more than £800m. Approximately 30% of the jobs are located in the three main “towns” of Truro, Falmouth-Penryn and Camborne-Pool-Redruth. The economy of these centres reflects the general characteristics of the Cornish economy, including the issue of peripherality. There is an emphasis on low value added sectors, such as food and drink, tourism and leisure and creative industries, and recent strong growth in manufacturing. The zone has, in the past, been one of the poorest performing in the region and is designated as a structural area of need. Relative peripherality, physical boundaries and poor infrastructure links make the zone’s issues more difficult to deal with. The industrial and economic structures are predicated on smaller businesses, which tend to be less productive than average. The zone generally exhibits low economic activity and employment rates, low business formation rates and seasonal employment, as well as low qualification levels, wage rates and knowledge-based activities. A key strength of the zone is its environment and quality of life. In more recent years the economy has shown signs of recovery and the economy in this functional zone has performed well in GVA terms, compared to the UK. Conclusions The analysis of the functional zones clearly demonstrates that the South West is not one homogeneous economy, and further illustrates the intra-regional disparities. The region is made up of a series of inter-related economies defined by flows of people, goods and communications, which play a variety of economic roles, have different strengths and weaknesses and face varying opportunities and challenges. The North East Triangle, accounting for 44% of the region’s population and close connections to the South East economy, is clearly the economic powerhouse of the region. There are opportunities for developing the roles of areas such as the A303 Corridor through the further development of strategic settlements, as well as accelerating the economic renaissance of Plymouth in the west of the region. In the North and Western Peninsulas and parts of the South Central zone, the remoteness of settlements is a key consideration when developing economic activity. There is a clear east west divide in the region, with the three western zones, including Cornwall and the Isles of Scilly characterised by lower employment rates and higher levels of worklessness, lower levels of productivity and a business base with lower proportions of growth and higher skilled sectors, and a workforce profile with high numbers with basic and low level skills.

53
3.12 Environment The region’s high quality of life and high quality environment are central elements of the region’s ‘brand’. In addition to generating tourism, they make a significant contribution to both inward investment and the retention of businesses and skills within the region. Both the Regional Spatial Strategy and the Regional Economic Strategy recognise the importance of the environment as a key economic driver. Further mechanisms through which environmental considerations may contribute to economic growth include the development of more efficient business practices and the retention of skills in the region in the emerging environmental sectors. Quality of life influences the decisions of economic migrants and entrepreneurs alike, and the growth of e-business and the ability for many businesses to operate effectively without close physical links to markets and customers make the region well placed for using its environmental strengths to attract new businesses and retain businesses that are growing. Additional economic benefits may be achieved through the promotion of ‘green tourism’ and geographically specific food products, including agricultural products that are locally sourced. These latter two issues are strongly reflected in the regional implementation plan for EARDF.
Environment as an economic driver
Use of environment in branding and niche
marketing
Conserving environmental assets whilst delivering
economic gain
Attracting and retaining skills, business and investment
Environmentas an
economicdriver
Environmental Management skills for business
Environment sector business development
Resource efficiency for competitiveness
Source: SWRDA RES Evidence Base
Underpinning the environment driver agenda is the need to ensure that the quality of the region’s environmental assets is maintained. These assets are the amenity value of both the natural (landscape, biodiversity) and the built and historic environment. Coastline and bathing waters are vital to the region’s economy, in particular contributing to tourism and leisure. The State of the South West Report 200767 highlights the following key facts concerning the environmental and historic environment of the South West:
• There are almost 6060km of Environment Agency monitored rivers in the South west, 97% of which had good or fair chemical water quality and 99% had good or fair biological quality in 2005;
67 South West Regional Observatory, 2007
54
• In 2006, 100% of the 191 bathing waters in the South West were clean enough to meet minimum mandatory European standards, however only 89% met the more stringent Guideline Standards (still above the English and Wales average of 81%);
• There are 212,000 ha of woodland in the South West, covering 9% of the region’s land area, in the past 10 years over 10,000 ha of new woodland has been planted in the region;
• Over 91% of the region’s land was green space in 2001, the highest proportion in any English region;
• The Encams Local Environmental Quality Survey for 2005/06 ranked the South West as having the 2nd highest local environmental quality in England, behind the West Midlands and the region was awarded 8% (27) of the Green Flag Awards in England, which recognise the best green spaces in the country; and
• Concerning the historic environment, the South West has a wealth of historic heritage and a large proportion of the nation’s historic resources may be found in the region. In 2006 there were 160 Grade 1 and II* listed buildings on the South West Buildings At Risk Register, down by three from 2005. The ‘conservation deficit’68 in the South West has also reduced from £35.5 million in 2004 to £30 million in 2006.
With regard to the ecological footprint of the region, the region has the second lowest total carbon dioxide emissions in England and is seeing the results of increased drives to reduce waste and increase recycling. However, there are a number of environmental challenges facing the region, which include:
• The average person in the South West produces 8.2 tonnes of carbon dioxide a year and 25% of carbon dioxide comes from energy use in the home;
• Households in the region consumed 5,019 kWh of electricity in 2004, the second highest rate in Great Britain;
• Landfill remains the principal method of waste disposal, with almost 2 million tonnes (67%) of municipal waste being sent to landfill in 2005/06 and household waste accounted for 89% of all municipal waste (over 2.6 million tonnes) in 2005/06;
• Despite an increase of 16 percentage points in the number of households recycling between 2000/1 and 2005/6, the figure is still only 31% Despite declining industrial and commercial demand for water, water demand overall is increasing as the region’s population grows and more smaller households are formed;
• While air quality has generally improved in urban areas since 1993, due to improved technology and regulation resulting in reduced industrial and traffic pollution, hot dry summers encourage the production of air pollutants, ground level ozone and fine particles and can lead to a higher number of poor air quality days; and
• The region is making slow progress towards its renewable energy target (15% or 597 megawatts of electricity to be produced by renewable sources by 2010), with only 3% of the South West’s electricity consumption being produced by renewables in 2006.
The increasing focus on environmental issues is driving the adoption of more efficient business practices across the economy. Within the South West, businesses will increase their competitiveness by taking steps to improve efficiency and minimise wastage. Recent research69 has predicted that environmental issues will be the most important issue for which companies will seek outside assistance / business advice over the next five years, and the UK is committed to cutting greenhouse gas emissions by 12.5% below 1990 levels by 2012, which will have significant implications for businesses. As the environmental regulatory framework becomes more robust, there will be an increasing need for the provision of business-focused environmental management training. This is likely to require some intervention to promote skills acquisition in addition to other investments. In conjunction with the
68 When the cost of repair exceed the value after repair. 69 Review of Business Support in the South West – DTZ Pieda for the South West RDA, 2003.

55
emerging technologies sector, this may also provide additional opportunities for graduates and other skilled individuals, further increasing the skills base of the region. The environmental goods and services sector (including environmental technologies and renewables) has been identified as a priority sector for the region, and has a potentially large global market in which South West firms could develop leadership. The sector covers a broad range of activity, the common thread being providing solutions to environmental problems or providing environmentally based products or services, such as renewable energy or waste disposal and recycling. It is predicted that a number of new jobs could be created in this sector, with investment in boosting capacity and expertise and stimulating demand for specific and generic technologies and skills. A study by GOSW in 2001 found that the region could achieve 11 to 15% of its electricity needs by 2010 and, as highlighted above, the region has adopted 15% (597MW) as its target within regional planning guidance. Currently, approximately 3% of the region’s electricity consumption is from renewable sources and the region will miss its 2010 target unless its rate of renewable energy generation increases.70 The impacts of environmental considerations are provided in the Cross Cutting Themes section. This also provides details of how environmental sustainability will be integrated into activities, assisted by the Environmental Policy and Data Annex produced as part of the Strategic Environmental Assessment. Conclusions The South West has an outstanding and varied environment with over 90% of the region’s land classed as green space, the highest proportion in any English region. The region’s natural environment, both its coastline and other features such as Dartmoor and Exmoor, are recognised internationally. A large proportion of the nation’s heritage and historic resources are also located in the region. The environment is a key contributor to the economic success of the South West and provides residents with a high quality of life and sense of well-being. The environment has been recognised as a key economic driver for the region. The region faces a number of challenges in relation to the environment, particularly given the recent and forecast growth in population. This will continue to place additional demands on the region’s environment, through demand for housing development, increased levels of transport and traffic congestion and rising levels of water and energy usage. The existing strengths of the environmental technology and renewable energy sectors in the South West provide an important economic opportunity as attention to environmental issues increases. The development of the sectors foreseen through this Programme is also a key part of a broader commitment to invest in the drivers of a low carbon economy and deliver economic growth within environmental limits.
70 State of the Environment for the South West 2006

56
4 Strengths, Weaknesses, Opportunities and Threats The South West has a number of strengths and weaknesses, as well as facing opportunities and threats. The strengths include a number of long term assets, including the quality of environment and life that attract a large number of in-migrants over the past twenty years. The weaknesses represent some fundamental issues which have the potential to undermine the on-going growth of the region’s economy, and exacerbate existing intra-regional disparities. The opportunities and threats are pre-dominantly external and forward-looking and based on the South West’s position in a global economy. Strengths 1. Good enterprise culture and business start up
rate 2. Strong presence of some growth sectors –
including ICT, creative industries and biotechnology
3. Higher than average business investment in R&D and large number of high technology patent applications (from small number of sectors)
4. Relatively good qualifications of young people and a well qualified workforce
5. Environmental technologies base distributed across the region
6. Quality of the natural environment which attracts residents and investment
7. Connectivity of the north east of the region to London and South East based markets.
8. Understanding of the environment as an economic driver
Weaknesses 1. Low productivity levels generated by the
region’s business base and under-representation of knowledge intensive growth sectors
2. Low levels of exporting and concentration in small number of sectors and companies
3. Peripherality of the west of the region and structural bias towards low value added and seasonal economic activity , coupled with other rural isolation elsewhere in the region
4. Concentrated areas of deprivation (notably Bristol, Torbay and Plymouth) and economic and social exclusion
5. Basic skills issues in terms of numeracy and ICT
6. A large number of very small businesses 7. Concentration of R&D in a small number of
large businesses in aerospace and defence and communication technologies
Opportunities 1. The potential for SMEs in certain sectors to take
advantage of growing national and international markets
2. Demand for environmental goods and services – further promoted through by the Stern Report
3. Higher Education Institutes and opportunities for knowledge transfer
4. Opportunities arising from digital applications, more widespread broadband and ICT adoption and applications resulting in new business opportunities
5. Export potential and further trade opportunities in markets of Asia, Oceania and Eastern Europe, generated through increasing globalisation.
6. Addressing the challenge of delivering a low carbon economy.
Threats 1. Trajectory of employment in the west of the
region, notably Torbay, Plymouth and parts of rural Devon
2. Growing international competition for jobs in manufacturing and service industries leading to outsourcing and offshoring
3. Structural adjustment in more remote rural areas
4. Increasing energy prices and uncertainty of supply
5. Climate change resulting in adverse weather, flooding and sea level rise
6. Carbon emissions and the potential impact of legislation on businesses.

57
4.1 Business In the past five years the output of the South West’s economy has grown faster than any other part of the UK with the exception of the East of England. Growth of GVA is forecast to continue above the UK average with the region’s output expected to exceed £100bn before 2010. Despite this, GVA levels per head are still some 7.1% below the UK average and vary considerably across the region. This largely reflects the industrial structure with some parts of the region, particularly the west which is more heavily dependent on lower value added sectors. In contrast, the north and east of the region has a higher proportion employed in faster growing sectors such as business services. The divide in economic performance between the north and east of the region and the south and west is the most fundamental regional weakness. This situation is reflected in the SWOT, where low productivity, industrial structure, and intra regional disparities are highlighted. More positively, the region’s priority sectors present considerable growth opportunities, with ICT, Creative Industries, Advanced Engineering, Environmental Technologies, and Biotechnology all performing better than average in the region, in terms of productivity. To achieve the forecast growth, the region will need to capitalise on the global trade opportunities highlighted in the opportunities, and this will involve addressing some of the weaknesses identified, notably with regard to innovation and exporting. The region’s record with regard to high growth business starts and new starts in high growth sectors is moderate. The result, as noted in the weaknesses, is a large number of very small businesses, particularly in the rural areas, and a mature business base with low levels of competitive pressures in some sectors. This will increasingly change as globalisation introduces competition into a broader range of sectors, including both low cost and higher value added activities. As noted in the evidence base, despite recent improvements, the region’s businesses generate an extremely low level of exports per employee, with only a very small proportion of companies from a narrow sector base trading in international markets.
4.2 People The population of the South West has increased considerably, by over 6% between 1995 and 2005. With the exception of Plymouth, all parts of the region have experienced this growth, with many rural areas seeing the resident population increase by over 10%. The greatest net in-flows into the South West are of people moving from London, the South East and East of England, and the majority are children or young to middle aged adults. This migration trend is likely to increase the skills base of the region and there is an opportunity to use the well qualified workforce (noted in the strengths) to improve productivity. Currently the presence of a highly qualified workforce and low levels of productivity in some parts of the region suggests that the skills of the existing workforce are not being fully utilised. Employment in the region is forecast to become more concentrated in higher level occupations, including managerial, professional and associate professional jobs and the numbers employed in elementary occupations will decline. While the majority of the workforce in the region is already relatively well qualified and educational attainment by young people is above the national average, rural areas and west of the region will face a major challenge in addressing basic and low skills levels in the workforce, and there is a danger than intra regional disparities will widen. This structural change in employment also presents challenges for the 53% of the workforce who hold qualifications at level 2 and below. These people are unlikely to be able to access occupations where growth is forecast, and will need support to increase their skills whilst in employment. In addition, a substantial proportion of the working age population has basic skills needs, particularly in relation to numeracy and ICT. Tackling these issues will enable these people to play a full role in the growing economy and increase the skilled labour supply available to the region’s employers. This will be important in ensuring that employers can take advantage of new opportunities arising in relation to a number of key sectors and new and developing markets.

58
4.3 Place As noted in the evidence base, there are clear intra-regional disparities in economic performance, with the well connected north and east of the region out-performing the more peripheral south and west. Trends in sector growth, demand for skills and qualifications and R&D activity suggest that these disparities are likely widen rather than narrow as the South West’s economy grows. A failure to address the economic under-performance of large parts of the region will significantly reduce the region’s contribution to national competitiveness. As highlighted in the weaknesses, there are a number of areas where the quality of life is much poorer, and where the neighbourhood environment is unattractive. These are primarily located in the main urban centres, where there are high concentrations of multiple deprivation and a range of social issues. While the greatest concentrations are in Bristol and Plymouth there are a number of other centres where particular neighbourhoods are severely disadvantaged. The problems facing the most disadvantaged urban areas are deep seated and have persisted through a period of sustained employment growth. In some centres, such as Torbay, neighbourhood issues have been exacerbated by an under-performing local economy and substantial job losses. Although in investment terms the most disadvantaged neighbourhoods are in urban areas, there are smaller pockets of disadvantage in rural communities and market and coastal towns. Substantial resources have been focussed on connecting people to employment opportunities and it is clear than a wider variety of actions are required to support those more distant from the labour market. The environment is a key asset to the region and one of its major economic drivers. The attractiveness of the natural environment provides quality of life advantages, acts to attract in-migrants and inward investment and retain skills. For some sub sectors, the natural environment allows the region a competitive advantage; while in others highly qualified people have been attracted to the region as a place to live. The growth in demand for solutions to climate change and other environmental issues means that the region has an opportunity to develop new products and processes.
4.4 Conclusions The balance of the SWOT reflects the South West’s position as a mid ranking English region. The strengths are reasonable – enterprise culture, some strong sectors, reasonably qualified workforce – while the weaknesses, at the regional level, are challenging, without being threatening. The SWOT indicates a region which has not fulfilled its potential, and the threats identified suggests that it will become increasingly difficult for the region to improve its relative position unless some of the underlying weaknesses are addressed, and the new market opportunities pursued more vigorously. The exception is the disparity between north and the east and south and west, particularly the far west; and the gap between the parts of the urban and rural economies which have not enjoyed the benefits of the economic growth of the past ten years. There are very real prospect that the gap will widen, given the industrial structure in the west of the region. The evidence base indicates that there is a much sharper contrast within the region, than between the region and nationally. The opportunities identified are adequate, although more relevant to the more prosperous parts of the region, with the possible exception of environmental goods and services. Many of the opportunities such as growing national and international markets are in theory open to all companies, although larger companies in the high performing sectors may more readily take advantage of these opportunities. The threat of growing international competition, along with structural adjustments in rural areas, suggests that while all sectors will be under threat, the west of the region is likely to be most affected, or is in the weakest position to respond. It is likely that assisting companies to address new markets for the first time will be as important as supporting those companies in national and international markets to improve their performance.

59
5 Strategy for the Programme This Chapter sets out the strategy for the Operational Programme and how it contributes to both European and national policy and regional policy. It is presented in six sub sections. These are:
Process for choosing the strategy Strategic Context: Economic, Policy and Resources Programme Strategy and Priority Axes Contribution to European Policy Fit with Regional Policy Meeting European requirements
5.1 Process for Chosen Strategy The development of the Operational Programme has been overseen by the South West Cohesion Group, made up of senior stakeholders covering the key public sector agencies and groups, including the voluntary sector. This Group was established in 2004, and has reviewed each stage of the process, including the development process which engaged a wide range of stakeholders. The South West Cohesion Framework was agreed in April 2006 as a regional document demonstrating how European policy and funding can help to deliver regional priorities and similarly how the region can help deliver the EU Lisbon and Gothenburg competitiveness and sustainability agendas. Partnership groups worked on eleven key thematic areas to identify priority areas where European policy can best support established and emerging regional aims and objectives as identified in the Integrated Regional Strategy (IRS), the Regional Economic Strategy (RES) and the Regional Spatial Strategy (RSS). The Cohesion Framework placed an emphasis on reducing intra regional disparities and addressing low wages. The Competitiveness Operational Programme has been developed through an extensive process of consultation with regional and local stakeholders. Emerging priorities were developed through two initial Task and Finish Groups: Innovation and Competitiveness and Sustainable Communities. These groups were tasked with developing the focus on the priorities within the context of ERDF funding; how cross cutting themes might be incorporated; and any spatial priorities.
The Sustainable Communities Task and Finish Groups met three times and the Innovation and Competitiveness group twice during August/September 2006. Following this work two regional consultation events were held; the first in Exeter on the 25th September, the second in Bristol on the 26th September 2006. These events obtained input from key stakeholders with regard to the overall direction of the Programme. Both events were successful with 47 and 36 people in attendance respectively. Three sets of Task and Finish Groups were then established to further refine the Operational Programme. These were Innovation and Knowledge, Enterprise and Growth and Sustainable Communities (which became Urban Enterprise). These Groups took forward the conclusions of the early consultation events and were tasked with producing more focused Priorities which took account of the very limited resources available in the South West. The Groups met several times in January and February and helped further refine Priorities. Two further regional events were held to review progress in January 2007, both of which were well attended. The work of the Task and Finish Groups and subsequent consultation events led to a number of important conclusions with regard to the Operational Programme. These were:
A consensus that it would be important to do a few things well, rather than a lot of things in a superficial manner;

60
There should not be targeting which excluded parts of the regions or types of business un-necessarily;
It was important to take account of the needs of rural businesses; Environmental technologies and renewable energy were a specific and important opportunity
which the Programme could take forward; and Sustainable Communities should focus on a few locations and on local enterprise as a theme.
The Programme was then further refined in the light of the 30 formal responses to the consultation. The formal feedback resulted in written responses from a broad range of stakeholders, including Local Authorities, Universities, Business Support Agencies and social partners. The main changes to the Operational Programme arising from the various consultative processes are as follows:
• a greater sensitivity for rural proofing taking account of the higher costs of delivery
and the dispersed nature of disadvantage in rural areas compared with urban areas. • The need for a recognition of the east west disparity in the prioritisation of activities. • the merger of business start-up and business support strands in Priority 1. • adjustment to the approach to environmental technologies and renewable energy to
reflect a low carbon approach as opposed to a carbon-neutral approach. • Support for the focusing of Urban Enterprise in a few locations only.
5.2 Strategy Context for the Strategy: Economic, Policy and Resources Economic The economic context for the Strategy was drawn from the socio economic review and the SWOT. At the regional level the South West performs relativity well on many socio-economic indicators, when compared to those regions lagging behind UK and EU averages. In spite of recent employment growth and the presence of a very strong economic base in the east, the region underperforms in relation to two key indicators: productivity and wages. As with Cornwall and Isles of Scilly, the evidence suggests there is a need in the west of the region to accelerate the re-structuring process, creating jobs and businesses in new, higher skilled sectors. The continuing re-structuring of the industrial base in the west, along with a similar situation in rural areas, has exacerbated intra regional disparities. The need to develop higher value added jobs in sectors where there are long term growth prospects applies across the whole region. As well as restructuring, there is a need to focus on increasing productivity of the business base as a means of maintaining employment levels and increasing wages. Innovation has an important role to play in helping businesses improve their competitiveness. Fundamental to improving productivity is the development of ideas and creativity, as well as the application of knowledge and skills. The evidence also indicates that the region’s average performance at a national level hides significant, long standing sub-regional disparities. This points towards interventions which will be effective at improving the performance of the poorer performing sub-regions, as well as the region as a whole. There is a need to address challenges as well as pursuing growth opportunities. While growth opportunities are a key means of transforming the economy, challenges often relate to issues which need to be addressed to accelerate progress. There are a number of constraints which could slow down the move to a more dynamic economy, with a broader range of opportunities. These include:
• Low level of productivity across the business base is the fundamental weakness of the South West economy. The development of knowledge as the key competitive asset is crucial to raising productivity of the business base.
• In spite of a growing global market, the region has a poor track record in terms of international trade, and is heavily dependent on a few major companies and sectors.

61
• The region’s innovation and research and development performance is variable and needs to improve to match the best in Europe.
• There is an ongoing challenge to develop further an enterprising and innovative culture which allows people to realise their full potential, especially in the more deprived neighbourhoods in the region.
• The region has significant issues in its urban areas with regards to concentrations of multiple deprivation.
The economic challenges are set within the context of increasing concerns about climate change, and the need to reduce carbon emissions. With an outstanding environment, the South West has an interest in protecting and enhancing its environment. In addition, it has emerging strengths with regard to the environmental goods and services sector and has the opportunity to both help develop solutions to carbon and environmental issues and develop competitive and sustainable businesses. Policy The strategy has taken full account of the EU and national policies, and the contribution of the Programme is set out in detail later in this Chapter. It also takes account of the Regional Economic Strategy and again, the contribution is outlined in detail. These high level polices pointed the strategy towards productivity and enterprise, research and knowledge, and sustainable communities. The additional policy developments which have had a major impact on the strategy are:
The Stern Report and the implications of climate change for every day activity by business and communities, and in terms of opportunities arising from the need to reduce carbon emissions.
The emergence of the Local Enterprise Growth Initiative, which has added a new dimension to addressing the difficulties facing disadvantaged communities, by developing locally based enterprise support.
Informal operational advice from DG Regio, which suggested that the separation of innovation and research and development from emprise activities would help to ensure that the research agenda was effectively and transparently prioritised.
All three of these developments were tested with the broader partnership at consultation events and endorsed as fitting within a strategy which met the needs of the region. Funding As resources are very limited, the need to set objectives which are both realistic and achievable becomes more important, and the very limited budget has an influence in terms of the finalisation of the strategy. With ERDF support of circa €18m per annum, the scope for major or transformational change is limited. This is particularly relevant to taking forward the conclusions of the analysis and the SWOT, where it is not realistic to expect ERDF funding to solve all of the issues identified. Resources need to be targeted at tightly defined priorities in order to affect significant change. The need to focus resources was the focus of all of the Task and Finish Group work and the consultation events. Stakeholders took account of both the Regional Economic Strategy and the very limited funding to agree a strategic approach which emphasises doing a limited number of things well. The focus set by the consultation process was:
The need to address intra regional disparities and ensure that the interventions were appropriate to rural economies.
Innovation should focus on product and process development and engagement with business, rather than on fundamental or distant from the market research.
Enterprise should focus on a few activities which clearly add value and is additional to generic business support; with strong support for internationalisation.
With substantial funds, including ESF, targeting worklessness and neighbourhood renewal, Sustainable Communities should be targeted on a few locations, focusing on local enterprise,

62
with a LEGI type approach offering a locally based delivery style. There was strong support for separating out this strand from the Enterprise Priority.
The combination of the analysis and SWOT, EU, national and regional policy and other policy developments, and the very limited resources led to the strategy and priorities set out in the subsequent pages. Programme Objectives The Programme has a single objective, supported by four operational objectives. The Programme objective is:
To increase the prosperity of the region through supporting enterprises and individuals to develop ideas and plans which contribute to increased productivity and competitiveness.
The South West’s financial allocation for the Competitiveness Operational Programme is amongst the smallest in England. As a consequence, the need to focus and prioritise is of particular importance to the region. Within the framework of the Programme’s objectives, further prioritisation will be required to ensure the most effective use of scarce resources. Within this constraint, Programme objectives have been developed which focus on innovation and research and development, intra regional disparities, disadvantaged communities and carbon emissions. The operational objectives for the Programme are to:
• Increase the productivity of the region’s business base, through the promotion and support of innovation, research and development and the application of knowledge.
• Reduce intra regional disparities through stimulating enterprise and accelerating business growth in those parts of the region lagging behind.
• Increase employment and enterprise in the region’s most disadvantaged communities. • Protect and enhance the region’s environmental assets and work towards developing a low
carbon economy. Protecting and enhancing the region’s environmental assets and work towards developing a low carbon economy are particularly high priorities in a region where these assets are recognised as so important. The Competitiveness Programme, as with the Convergence Programme for Cornwall and the Isles of Scilly, will set a European exemplar by supporting economic growth in a manner which takes account of its environmental consequences. This will include working with the business community and wider population to both raise awareness of and develop responses which reduce greenhouse gases and demonstrate how low carbon economic development might be achieved. In addition to economic development issues, the demonstration of environmental management considerations will be an important criterion against which Programme activities will be selected. The South West Competitiveness Programme will make a direct contribution to the use of knowledge as a key driver of business success. The Programme will also seek to combine current strengths with regard to environmental technologies and renewable energy with the skills and knowledge in the research and higher education sector to accelerate the development of business sub sector of European significance. This focus on environmental technologies and renewable energy is a key distinguishing feature of the South West Programme and an important aspect of a wider aspiration of working towards a low carbon economy. In taking forward the Operational Programme there will be close collaboration with the Cornwall and the Isles of Scilly Convergence Programme. This will be an important element in addressing intra regional disparities in the west of the region. This approach of increased collaboration will be important with

63
regard to environmental technologies and renewable energy and efforts to increase the number of business trading nationally and internationally. There will also be scope for developing networks and groups across administrative boundaries and to increase company collaboration and joints ventures.
Addressing Intra Regional Disparities
The Regional Spatial Strategy identifies an area including Devon, Torbay and Plymouth and parts of Dorset and Somerset where proactive policies need to be put in place to address failures in the market place. These areas are relatively more peripheral in accessibility terms than adjoining areas and also further from key markets. These geographical factors then lead to a further set of problems to do with low investment in capital and labour, lack of venture capital, low aspirations of employers and employees and under exposure to competitive processes.
The western peninsula area consists of Devon, Plymouth, Torbay, West Dorset, Weymouth and Portland, Taunton Deane and West Somerset. This area account for 31% of population, 29.4% of employment and 29.6% of registered businesses in the Programme Area. The employment and business numbers reflect the high level of part time and low paid jobs, while the business numbers reflect the very high numbers of micro and self employed people typical of rural areas.
It is important that the Competitiveness Operational Programme takes account of these factors and the intra regional differences within the South West. While crude geographical targeting is inappropriate, there is a need for a clear commitment to an additional weighting of resources to the areas lagging behind, while still supporting sub regional and regional actions to take place. This will be implemented by:
For Priority 1: Innovation and Knowledge, where many of the regional strengths are in the east of the region, a minimum of 35% of the results will be achieved through supporting delivery in the western peninsula. This target will apply to all relevant sub-targets including sectoral activities in areas such as environmental technologies, renewable energy, marine, manufacturing, and creative.
For Priority 2: Enterprise and Growth, a minimum of 45% of the results will be achieved through delivery in the western peninsula. This target will apply to all relevant sub-targets including sectoral activities in areas such as environmental technologies, renewable energy, marine, manufacturing, and creative.
The western peninsula has had difficulties in fully committing ERDF support in previous Programmes. The proposed increase in intensity of support from Priority 2 in the western peninsula from a pro-rata share of 30% (of business and employment) to 45% is effectively a 50% increase. As such this sets a challenging target for stakeholders.
With regard to Priority 1, a review of assets and distribution of research intensive businesses suggests that the western peninsula accounts for between 15%-20% of regional activity. The proposed target of 35% of results therefore requires an increase in activity of around 100%, an even more ambitious target than Priority 2.
The focus of ambition relates to the beneficiaries, rather than to project sponsors. This reflects two aspects. First, restricting project sponsors by location would limit innovation activity to those sectors where HEIs in the western peninsula had research strengths; this would only allow for a very narrow set of activities to be provided to SMEs, compared to an approach where the range of HEIs strengths across the region was targeted at supporting business in the western peninsula. The second factors is that in terms of reducing intra regional disparities, it is the scale of results i.e. increased employment and turnover, that will narrow the gap, rather than the location of the project sponsors or providers of services.

64
The development of Community Strategies and Local Area Agreements provides an opportunity to work closely with sub-regional partners. Where appropriate, the Competitiveness Operational Programme will prioritise the key issues identified in sub regional strategies and ensure that funding and interventions are aligned.
This provision will be reviewed on a regular basis by the PMC to ensure that it does not restrict the successful implementation of the Operational Programme. Strategic Objectives and Priority Axes In order to take forward the Programme and operational objectives outlined earlier, a three Priority approach has been developed. These take account of the need to both take advantage of new opportunities and to address some of the long standing weaknesses in the regional economy. The three ERDF Priorities which have been agreed are:
• Innovation and Knowledge • Enterprise and Growth • Urban Enterprise
Innovation and Knowledge – This Priority will contribute to increased productivity and reducing intra regional disparities. Through support for environmental technologies, it will also contribute to a low carbon economy. The focus of activities is on maximising opportunities arising from the region’s knowledge base and intellectual property held within existing businesses. It will seek to increase the rate of innovation and the benefits arising from the exploitation of R&D and other intellectual assets. This Priority will also focus on developing innovation and research and development related to the environmental goods and services sector with particular emphasis on environmental technologies and renewable energy and priority will be given to accelerating the commercial development of innovative new products and processes through encouraging R&D and bringing environmental innovation to the market more quickly. Enterprise and Growth – This Priority will contribute to increased productivity and reducing intra regional disparities. Through support for environmental technologies, it will also contribute to a low carbon economy. The Priority will focus on accelerating the growth of high value added companies, on the quality of opportunities, rather than magnitude, with an emphasis on the use of knowledge, networking and collaboration. There will be a strong theme based around encouraging companies to operate in a global market, using partnerships and collaboration arrangements. Although a wholly sectoral approach is not suitable for the region, as part of the Programme’s objective in relation to investing in the drivers of a low carbon economy, investment will be focused on the growth of the environmental goods and services sector. This will include complementing the support for R&D and commercialisation in the Innovation and Knowledge Priority, through activities aimed at demand stimulation to grow the market for innovative products and services and developing regional supply chains (including through public procurement). Urban Enterprise – This Priority will contribute to reducing worklessness in the most disadvantaged communities, and also to reducing intra regional disparities. The Priority will focus on activities to encourage enterprise creation in some of the most deprived areas of the region. Given the limited resources available, resources will be focussed on activities to benefit the deprived neighbourhoods of Bristol, Plymouth and Torbay. These three were chosen based on their performance on the employment and income domains of the index of multiple deprivation. ERDF will be used to complement investment by ESF to reduce the level of worklessness in the most deprived communities and increase access to employment.

65
These Priorities will be supported by the other European Funds available in the region. There are strong linkages between the ERDF Operational Programme and:
• The Regional ESF Framework, which has a major focus on addressing worklessness and improving workforce skills.
• The Regional Implementation Plan for EAFRD, which includes support for agri-environment and rural business.
Full details of the other Funds and delivery plans are set out in a later Chapter. The European and National Policy Context The ERDF Regulation The ERDF Regulation, published in July 2006, states that the European Regional Development Fund should primarily focus on three priorities:
1. Innovation and the Knowledge Economy; 2. Environment and risk prevention; 3. Access to transport and telecommunication services of general economic interest.
There are an additional two priorities, which, according to the ERDF regulation, may be taken up by programmes under the Regional competitiveness and employment objective. These are:
4. Interregional co-operation; and 5. Sustainable urban development.
Lisbon Agenda In March 2000 the Lisbon Council established the Lisbon Strategy with the aim of making Europe ‘the world’s most dynamic and competitive knowledge-based economy’, capable of sustainable economic growth with more and better jobs and greater social cohesion by 2010. Due to slow progress made, the Strategy was re-launched in March 2005 with a sharper focus on the key priorities of jobs and growth. The reform programme aims to provide a stable macroeconomic environment whilst making markets work more efficiently. The Gothenburg Agenda In 2001 the Gothenburg European Council added an environmental dimension to the Lisbon Strategy. It agreed a sustainable development strategy, which completes the European Union's political commitment to economic and social renewal. Priority areas include managing natural resources more responsibly, addressing threats to public health, ensuring sustainable transport and combating climate change. The Community Strategic Guidelines In July 2006 the European Commission adopted the Community Strategic Guidelines which establish the areas important for the realisation of community priorities, in particular in relation to sustainability goals and to the renewed Lisbon Strategy for growth and jobs. The Guidelines provide a framework for delivering the Structural Funds and identify three main priorities for future spending. The Community Strategic Guidelines are used as the basis for drafting the UK strategic priorities that are outlined in the National Strategic Reference Framework.
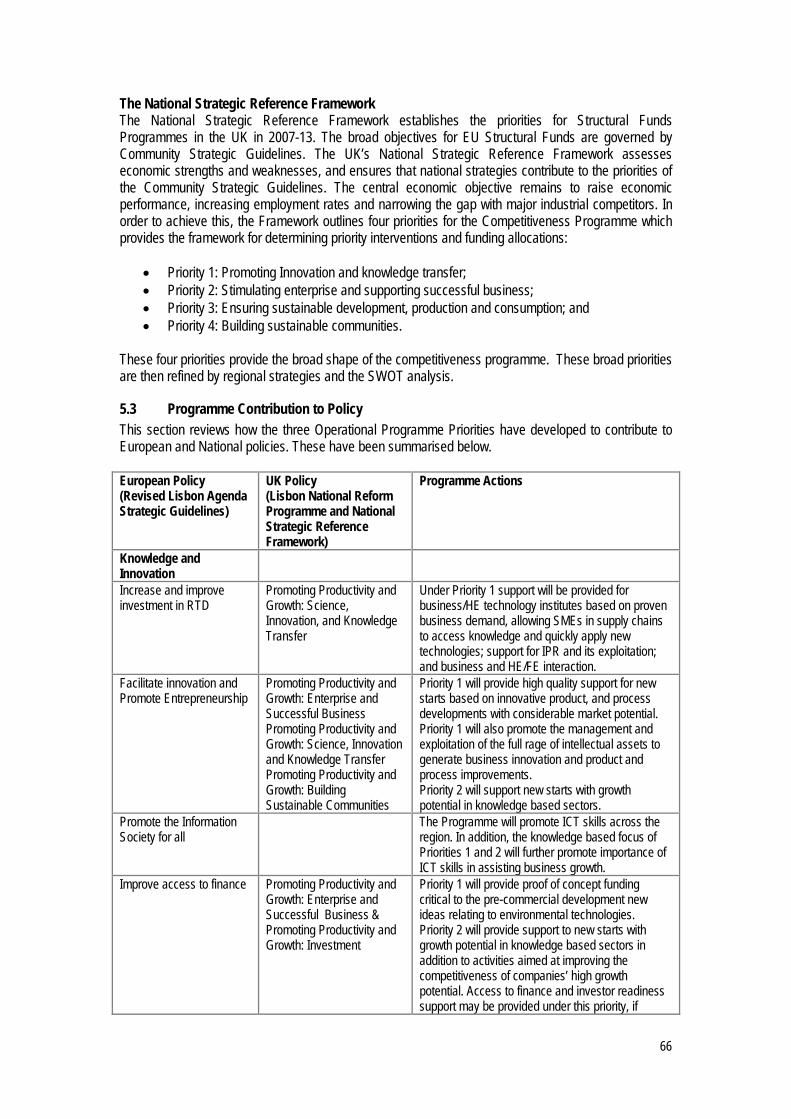
66
The National Strategic Reference Framework The National Strategic Reference Framework establishes the priorities for Structural Funds Programmes in the UK in 2007-13. The broad objectives for EU Structural Funds are governed by Community Strategic Guidelines. The UK’s National Strategic Reference Framework assesses economic strengths and weaknesses, and ensures that national strategies contribute to the priorities of the Community Strategic Guidelines. The central economic objective remains to raise economic performance, increasing employment rates and narrowing the gap with major industrial competitors. In order to achieve this, the Framework outlines four priorities for the Competitiveness Programme which provides the framework for determining priority interventions and funding allocations:
• Priority 1: Promoting Innovation and knowledge transfer; • Priority 2: Stimulating enterprise and supporting successful business; • Priority 3: Ensuring sustainable development, production and consumption; and • Priority 4: Building sustainable communities.
These four priorities provide the broad shape of the competitiveness programme. These broad priorities are then refined by regional strategies and the SWOT analysis.
5.3 Programme Contribution to Policy This section reviews how the three Operational Programme Priorities have developed to contribute to European and National policies. These have been summarised below. European Policy (Revised Lisbon Agenda Strategic Guidelines)
UK Policy (Lisbon National Reform Programme and National Strategic Reference Framework)
Programme Actions
Knowledge and Innovation
Increase and improve investment in RTD
Promoting Productivity and Growth: Science, Innovation, and Knowledge Transfer
Under Priority 1 support will be provided for business/HE technology institutes based on proven business demand, allowing SMEs in supply chains to access knowledge and quickly apply new technologies; support for IPR and its exploitation; and business and HE/FE interaction.
Facilitate innovation and Promote Entrepreneurship
Promoting Productivity and Growth: Enterprise and Successful Business Promoting Productivity and Growth: Science, Innovation and Knowledge Transfer Promoting Productivity and Growth: Building Sustainable Communities
Priority 1 will provide high quality support for new starts based on innovative product, and process developments with considerable market potential. Priority 1 will also promote the management and exploitation of the full rage of intellectual assets to generate business innovation and product and process improvements. Priority 2 will support new starts with growth potential in knowledge based sectors.
Promote the Information Society for all
The Programme will promote ICT skills across the region. In addition, the knowledge based focus of Priorities 1 and 2 will further promote importance of ICT skills in assisting business growth.
Improve access to finance Promoting Productivity and Growth: Enterprise and Successful Business & Promoting Productivity and Growth: Investment
Priority 1 will provide proof of concept funding critical to the pre-commercial development new ideas relating to environmental technologies. Priority 2 will provide support to new starts with growth potential in knowledge based sectors in addition to activities aimed at improving the competitiveness of companies’ high growth potential. Access to finance and investor readiness support may be provided under this priority, if

67
European Policy (Revised Lisbon Agenda Strategic Guidelines)
UK Policy (Lisbon National Reform Programme and National Strategic Reference Framework)
Programme Actions
appropriate. Priority 3 will provide micro-finance initiatives, including small scale loans, where there is a clear market failure.
An attractive area in which to invest and work
To strengthen the synergies between environmental protection and growth.
Promoting Productivity and Growth: Sustainable development, production and consumption and related innovation: Promoting Productivity and Growth: Building Sustainable Communities
Sustainable development underpins all Programme activities. More specifically, Priorities 1 and 2 will promote the development of the Environmental goods and services sectors. Priority 2 will also promote activities to promote the environmental performance of businesses in the region. Priority 3 will stimulate local people, businesses, and social enterprises to develop commercial opportunities with regard to environmental opportunities, such as energy efficiency and renewable energy.
Address Europe’s intensive use of traditional energy sources
Promoting Productivity and Growth: Sustainable development, production and consumption and related innovation
Priorities 1 and 2 will promote the development of the Environmental Technologies and Renewable Energies sectors. Priority 3 will stimulate local people, businesses, and social enterprises to develop commercial opportunities with regard to environmental opportunities, such as energy efficiency and renewable energy.
Attract and retain more people in employment and modernise social protection systems
Employment Opportunity for All: Extending Working Lives
Activities under ERDF Priorities 1 and 2 will provide higher quality and more sustainable employment opportunities.
Improve adaptability of workers and enterprises and the flexibility of the labour market
Promoting Productivity and Growth: Skills & Employment Opportunity for All: Developing a Skilled and Adaptable Workforce
Activities under ERDF Priorities 1 and 2 will indirectly stimulate demand from employers to raise skills within the workforce.
Increase investment in human capital through better education and skills
Promoting Productivity and Growth: Skills & Employment Opportunity for All: Equipping People to Realise their Potential Employment Opportunity for All: Developing a Skilled and Adaptable Workforce
Activities under ERDF Priorities 1 and 2 will assist the development of knowledge based firms within the region, further promoting demand for higher level skills within the region.
Gothenburg Agenda Combating climate change Promoting Productivity and
Growth: Sustainable development, production and consumption and related innovation
Priorities 1 and 2 will promote the development of the environmental technologies and renewable energy sectors within the region. Priority 3 will highlight the opportunities relating to environmental improvements to individuals, businesses, and social enterprises. The environmental sustainability cross cutting theme will ensure that environmental considerations are integrated into all Programme supported activities and that all partners are aware of these environmental considerations.

68
European Policy (Revised Lisbon Agenda Strategic Guidelines)
UK Policy (Lisbon National Reform Programme and National Strategic Reference Framework)
Programme Actions
Managing natural resources more responsibly
Promoting Productivity and Growth: Sustainable development, production and consumption and related innovation
Priorities 1 and 2 will promote the environmental technologies and renewable energy sectors. This will also be addressed by the Sustainable Development CCT.
Treaty of Amsterdam Equality of opportunity for men and women. Combat discrimination based on sex, racial or ethnic origin, religion or belief, disability, age or sexual orientation.
Employment Opportunity for All: Addressing Obstacles to Labour Participation
Priority 3 will offer support to disadvantaged groups in the most deprived neighbourhoods, to help start up and enterprise or pursue self employment opportunities. The Equality and Diversity cross cutting theme will ensure equality of opportunity across all Programme Activities.
5.4 Contributing to the Regional Economic Strategy Regional Economic Strategy The Regional Economic Strategy (RES) provides a shared vision for the development of the region’s economy; “South West England will have an economy where the aspirations and skills of our people combine with the quality of our physical and cultural environment to provide a high quality of life and sustainable prosperity for everyone”. This vision will be realised when the South West has developed an economy where:
• Prosperity is measured by well-being as well as economic wealth; • Knowledge, service quality and performance are key to business success; • More people can find jobs which fully utilise and reward their skills; and • The region respects the environment as the foundation of people’s quality of life and as a
business opportunity. The RES sets out three economic drivers central to the continued development of a successful and competitive economy in the South West: Innovation; Skills and Environment. In order to achieve this vision the RES sets out three strategic objectives and priority actions. The contribution which the Operational Priorities will make to the Regional Economic Strategy is set out below. Strategic Objective Contribution of the Competitiveness ERDF Priorities Successful and Competitive Businesses Support business productivity Encourage new enterprise Deliver skills for the economy Compete in the global economy Promote innovation
Priority 1 will support business productivity and competitiveness through a range of activities that assist companies to fully exploit the knowledge within their business to generate product and process innovations. It will also provide support for innovative new starts based on innovative products and process developments. Priority 2 will support new starts with growth potential, with the aim of improving competitiveness. It will provide further support to established businesses with growth potential in higher value added sectors. Businesses will be encouraged to compete internationally by reducing barriers to international trading through supporting international collaborations and joint ventures and raising awareness of the opportunities for trade in the emerging markets. Priority 3 will support the establishment of new enterprises and social enterprises within under-represented groups.

69
Strong and Inclusive Communities Improve participation in the economy Regenerate the most disadvantaged areas Plan sustainable and successful communities
Indirectly, through improving business competitiveness the whole programme will improve participation in the economy through creating opportunities. More specifically, Priority 3 will establish small scale enterprise facilities linked to Enterprise and Innovation Hubs elsewhere, benefiting local neighbourhoods. Further activities under Priority 3 include access to finance initiatives’ to encourage entrepreneurial activities where there is a clear market failure and activities to promote the creation of new enterprises and social enterprises within under-represented groups.
An Effective and Confident Region Improve transport networks Promote and enhance what is best about the region Improve leadership, influence and partnership
Concerning the promotion of what is best about the region; the region has a number of distinctive strengths, as highlighted in the SWOT analysis, and the Programme indents to promote and exploit these strengths in order that its actions have the greatest impact. An example is the promotion of the Environmental Goods and Services sector within the region. The quality of the region’s natural environment is another major strength of the region, and can act as a catalyst to attracting new investment into the region. The Programme has developed through extensive consultation and partnership working. This will continue as the Programme moves into its operational phase.
Regional Spatial Strategy The Draft Regional Spatial Strategy sets the regional context for planning in the South West until 2026. The Regional Economic Strategy has been developed in tandem with the Regional Economic Strategy. The Strategy recognises the diverse needs and potential of different places and parts of the region. Development is planned to meet the needs of all communities and to realise their potential. To deliver more sustainable communities and a more sustainable region, there will be:
• Significant change at a small number of strategically significant cities and towns; and • Smaller scale change outside of those places to achieve more balanced communities and a
better local environment. Importantly the strategy recognises the diversity of the region and breaks down the region into three broad sub-regional areas with different strategic emphasis:
• Managing Growth within environmental limits in the south east of the region and south east Dorset where development pressures are high;
• Realising potential to add to economic prosperity in the north and the centre of the region; and
• Stimulating the economy in order to reduce disparities, particularly in the western part of the peninsular and the Forest of Dean.
The South West Competitiveness Operational Programme will contribute to realising the potential in the north and centre of the region though the Innovation and Knowledge Priority, while support under Urban Enterprise will indirectly contribute to growth through targeted support at disadvantaged communities in Bristol. The Operational Programme has identified intra regional disparities as a major issue, and Priorities 1 and 2 will be used to focus resources on the west of the region. This will be supplemented by the targeted support provided under the Urban Enterprise Priority on disadvantaged communities in Torbay and Plymouth. Just Connect – Integrated Regional Strategy for the South West Just connect is the over-arching strategy for the South West expressing the overall needs of the region by setting out the region’s key aims and objectives. Just Connect identifies five headline aims for the region. The table shows how the SW Competitiveness Programme contributes to these.

70
Alignment between the IRS and SW Competitiveness Programme Just Connect Objectives Contribution of SW Competitiveness
Programme To enhance our economic prosperity and quality of employment and opportunity
Priorities 1 and 2 will support the further development of a knowledge based economy, providing support for innovation and product development, assisting high growth companies in new and expanding markets.
To make sure that people are treated fairly and can participate fully in society
Equality and Diversity is a cross cutting theme.
To address deprivation and disadvantage to reduce intra-regional inequalities
Priorities 1 and 2 whilst being region wide in scope will have significant emphasis on reducing intra-regional inequalities. Priority 3 (Urban Enterprise) will specifically target areas of deprivation.
To enhance our distinctive environments and the quality and diversity of our cultural life
The programme has been developed with the environment as a cross cutting theme.
To harness the benefits of population growth and manage the implications of population change.
Not addressed specifically.
Business Support Simplification Programme
UK Government expects ERDF to be aligned with and support the emerging strategy for the simplification of business support - the Business Support Simplification Programme (BSSP). The BSSP has agreed a broad definition of business support:
Any publicly funded activity that benefits a business or potential business through grant, subsidy, advice or other service.
The definition includes support to businesses designed to achieve wider economic, environmental, regulatory, social or cultural objectives.
All levels of government are working together to develop a flexible, comprehensive and shared portfolio of business support products deployable across the public sector, to meet business needs and deliver policy aims. Standard descriptions will provide assurance of the quality of a product’s design and rationale. ERDF funding can be used to extend the scope of these products and improve access to priority groups. Genuinely innovative products will eventually become part of the shared portfolio. A standard approach to branding these products will allow for shared branding across funding streams. Where ERDF proposals impact on business, they must be clear how they plan to use the Business Link information, diagnosis and brokerage model to best effect. Simply duplicating this activity may not represent an effective use of funds. ERDF activity will add value to domestic funding and procurement will comply with EU and national guidelines on open and competitive tendering arrangements.
5.5 Meeting European Requirements This section describes how various European requirements have been met including:
• Strategic Environmental Assessment. • Concentration and Spatial Issues. • Lisbon Earmarking. • Territorial Cohesion. • Additionality • Ex Ante Evaluation.

71
Strategic Environmental Assessment A Strategic Environmental Assessment was undertaken for the programme. With respect to the impact of the programme, the SEA concluded that the nature of impacts will depend on the detail at the point of implementation. For example, there is a strong focus on the development and commercialisation of new products and technologies in the Programme, under the broad heading of innovation. The associated environmental impacts could be positive or negative, depending on the types of energy and resource use. The assessment of the programme as a whole found that environmental issues were consistently highlighted at strategic level. The Environment report and partnerships response to its recommendations are attached to the OP as an annex. Knowledge and Innovation – Whilst recognising the opportunities associated with developing new products associated with environmental change, there is a need to ensure that new products and services supported by the priority are assessed and if necessary assisted to improve their likely environmental impacts. Enterprise and Growth – There is already a strong focus on business efficiency and the development of the environmental sector under this heading, which reflects the focus of the SEA. The key point here is to ensure that the expansion of business efficiency services are:
• Targeted at those sectors which will benefit to the greatest extent, such as those with higher energy requirements, or which depend on large volumes of water, for example those in the food and drink sector, and, in a related point;
• Integrated within mainstream services, so that all business advisors are aware of both issues and solutions, and, in line with the above, able to recommend their use as appropriate.
Concentration and Spatial Issues All priorities (except Urban Enterprise) are available across the whole of the region. Urban Enterprise is targeted at the most deprived communities of Bristol, Plymouth and Torbay. The decision to target wards in these cities was based on their performance in terms of IMD sub-domains of employment and income. However the emphasis is on the people within communities, rather than geography, and if necessary activity may occur outside the IMD deprived wards, on the basis that people work away from where they live. The England Rural Development Programme funded by EARDF will provide funds under Axis 3 Rural Development to rural areas in the South West. This is in addition to other support aimed at farm businesses and agri-enterprises. Lisbon Earmarking It is a regulatory requirement that the Competitiveness Operational Programme should ensure that at least 75% of competitiveness spending is focused on activities to support the Lisbon agenda. It is expected that 100% of Priority 1, at least 90% of Priority 2 and at least 80% of Priority 3 will be Lisbon Compliant. This Operational Programme exceeds the 75% level, and is expected to be in excess of 90% Lisbon compliant. Territorial Cohesion Regions have the option to include Territorial Cohesion, which will address areas with issues related to their remoteness, sparse population, or mountain character in programmes. In the South West, it is not considered necessary to identify a specific area for a territorial cohesion priority. All parts of the eligible area will be eligible for support, and both rural and rural towns will be targeted for support. Additionality All UK Structural Fund programmes take into account the principle of additionality. The Competitiveness Operational Programme observes the current procedure for additionality as set out in Article 15 of the General Regulations 1083/2006.

72
Ex Ante Evaluation The Ex Ante Evaluator made comments at a number of stages of the development of the Operational Programme. As a result of these comments substantial changes were made to the analysis. These included a greater emphasis on trend as well as benchmark data and much more information on sectors. The Ex Ante Evaluator concluded that the draft Programme Document and its process of preparation and concluded that:
• “it is well grounded in the relevant UK and UK policy contexts. • it is predisposed towards innovation. • there has been an effort to make choices, reflecting the limited resources that are
available. • there has been a very full consultation process the results of which have influenced
the detail of the Document. • there has been a substantive and participative SEA process.”
The work of the Ex Ante Evaluator helped to shape the overall Programme and the influence on each of the Priorities is set out in the Lesson learnt section of each of the Priorities. There were three substantive points raised by the Ex Ante Evaluator in the final report. These are detailed below, along with the Partnership view.
Ex Ante Evaluation Response The potential for take-up of actions to address weakness in innovation and business development in the west of the region.
The Partnership has prioritised the west of the region, accounting for 30% of the business base, to receive a higher share of the resources. This comprises a significant business base, along with two major Universities. Given the modest level of resources available to the Programme, the Partnership is confident there is sufficient potential to ensure the take up of resources.
The capacity in technology institutions and the business base to realise opportunities from growth in environmental technology and renewable energy markets.
The Operational Programme allocates between 10% and 25% of resources in Priorities 1 and 2 will be focussed on environmental technology and renewable energy. This equates to ERDF support of €2m per annum. The Partnership foresees no difficulties in investing this level of ERDF each year.
the targeting of actions to strengthen enterprise in deprived areas.
The Partnership has considered the Urban Enterprise Priority is some detail. The approach is based on the successful LEGI model, and offers a new and innovative response to economic inclusion. The Partnership is content that the proposed approach is robust.
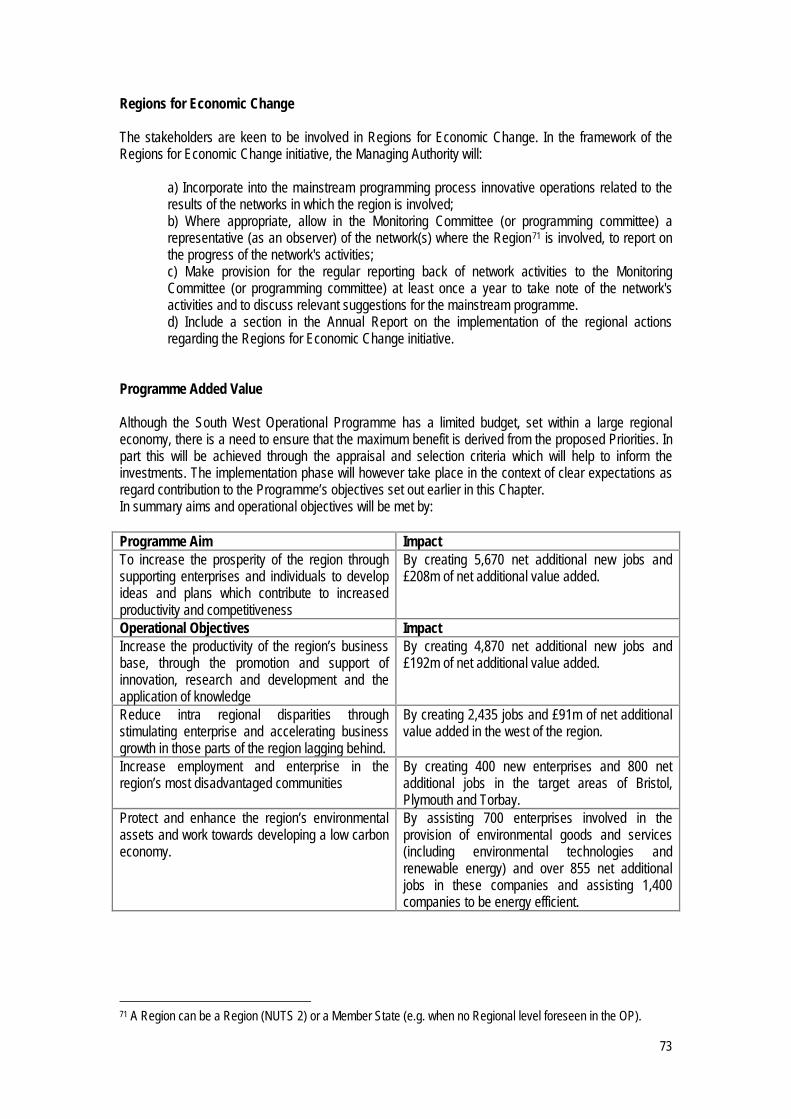
73
Regions for Economic Change The stakeholders are keen to be involved in Regions for Economic Change. In the framework of the Regions for Economic Change initiative, the Managing Authority will:
a) Incorporate into the mainstream programming process innovative operations related to the results of the networks in which the region is involved; b) Where appropriate, allow in the Monitoring Committee (or programming committee) a representative (as an observer) of the network(s) where the Region71 is involved, to report on the progress of the network's activities; c) Make provision for the regular reporting back of network activities to the Monitoring Committee (or programming committee) at least once a year to take note of the network's activities and to discuss relevant suggestions for the mainstream programme. d) Include a section in the Annual Report on the implementation of the regional actions regarding the Regions for Economic Change initiative.
Programme Added Value Although the South West Operational Programme has a limited budget, set within a large regional economy, there is a need to ensure that the maximum benefit is derived from the proposed Priorities. In part this will be achieved through the appraisal and selection criteria which will help to inform the investments. The implementation phase will however take place in the context of clear expectations as regard contribution to the Programme’s objectives set out earlier in this Chapter. In summary aims and operational objectives will be met by: Programme Aim Impact To increase the prosperity of the region through supporting enterprises and individuals to develop ideas and plans which contribute to increased productivity and competitiveness
By creating 5,670 net additional new jobs and £208m of net additional value added.
Operational Objectives Impact Increase the productivity of the region’s business base, through the promotion and support of innovation, research and development and the application of knowledge
By creating 4,870 net additional new jobs and £192m of net additional value added.
Reduce intra regional disparities through stimulating enterprise and accelerating business growth in those parts of the region lagging behind.
By creating 2,435 jobs and £91m of net additional value added in the west of the region.
Increase employment and enterprise in the region’s most disadvantaged communities
By creating 400 new enterprises and 800 net additional jobs in the target areas of Bristol, Plymouth and Torbay.
Protect and enhance the region’s environmental assets and work towards developing a low carbon economy.
By assisting 700 enterprises involved in the provision of environmental goods and services (including environmental technologies and renewable energy) and over 855 net additional jobs in these companies and assisting 1,400 companies to be energy efficient.
71 A Region can be a Region (NUTS 2) or a Member State (e.g. when no Regional level foreseen in the OP).

74
Community Added Value The availability of additional ERDF monies increases the scale of interventions available over the period 2007-20103 in the key areas of innovation and enterprise. While the additional funds will generate considerable impacts, there is considerable added value in terms of the key elements of the Programme Strategy. These are:
The introduction of Urban Enterprise into the region, with the potential to use the lessons learnt from this approach in other disadvantaged areas in due course.
A focus on environmental technologies and renewable energy enterprises at a time when opportunities are increasing and where the business potential is evident in all parts of the region, including rural areas.
An increased focus on intra regional disparities and rural areas at a time when many aspects of national policy has limited spatial focus per se.
The opportunity to pursue the benefits of a moving towards a low carbon economy Increased incentive to work with Cornwall and the Isles of Scilly, with a number of shared
themes, notably on environmental technologies and carbon. An increased focus on linking higher education and Further Education to the needs of
businesses. Other Community Added Value benefits will emerge as the Programme proceeds to the implementation phase, particularly around linking in to national and international knowledge networks, both at Priority level and through Regions for Economic Change.
The Community Added Value is considerable, and will have a significant effect on the west and rural parts of the region. There is potential for both direct impact on companies and communities as well as the legacy arising from work with the environmental technologies sectors and in stimulating enterprises in disadvantaged neighbourhoods.
75
6 Priorities
6.1 Introduction This chapter provides a detailed description of the activities of the three ERDF Priority Axes including specific actions, outputs and results indicators, financial resources and likely categories of expenditure. The Priority Axes are:
Innovation and Knowledge Enterprise and Growth Urban Enterprise Technical Assistance
The ERDF Priorities will be taken forward in an integrated manner to ensure that there is complementary and synergy between actions and with other funds, notably the Regional ESF Framework, the new Rural Development Programme and the Fisheries Programme. The details of alignment are outlined in a later Chapter. There are two cross cutting themes which will influence the type of activities being supported and especially how actions are implemented. These are Equality of Opportunity and Diversity and the Environment. While these are dealt with in a later section, each Priority will take into account relevant issues in terms of target groups and the types of activities to be supported. Although there will be no spatial targeting of resources for Priorities 1 and 2, it is expected that the Programme will invest a higher proportionate share of funding, compared to the proportion of employment, in the west of the region. This will help to ensure that progress is made towards meeting the core objective of reducing intra regional disparities. This is not a prescriptive or geographical allocation and many key actions will be taken forward through regional initiatives and programmes. Large enterprises In the case of ERDF assistance granted to large enterprises, the Managing Authority undertakes to request an assurance from the enterprise concerned that the assistance will not be used in support of investment that concerns the relocation of its production or service facilities from another Member State of the European Union.
6.2 Summary Financial Allocations The table below sets out the summary financial allocations for Competitiveness Programme. The resources focussed on a knowledge based economy are considerable, including all of Priority 1 and large parts of Priorities 2. In terms of competitiveness and productivity, significant resources are devoted to this element of the Lisbon agenda, with all of Priorities 1 and 2. Priority 3 addresses the enterprise in disadvantaged communities, and is also fully compliant with The Lisbon Agenda. The financial allocations took account of:
The underlying weaknesses with regard to innovation, and its importance in addressing low productivity and in assisting companies to develop new predicts and enter new markets.
The importance of improving productivity across the business base and the need for communities to access new markets; and
The need to provide a budget which allows for a significant impact to be made in developing enterprise in disadvantaged communities.

76
These factors led to the following allocations being agreed. Financial Allocations By Priority, 2007-2013 € ERDF National Public Total Priority 1 45,000,000 45,000,000 90,000,000 Priority 2 45,000,000 45,000,000 90,000,000 Priority 3 30,000,000 30,000,000 60,000,000 Technical Assistance 4,658,086 4,658,086 9,316.172 Total ERDF 124,658,086 124,658,086 249,316,172

77
6.3 Priority Axis 1: Innovation and Knowledge Context and Rationale As highlighted in the SWOT, the South West performs well against a number of innovation measures; it has a higher than average investment in R&D and generates significant numbers of high tech patent applications in a number of sectors (the South West accounted for a over 15% of the UK’s total patent applications in the following sectors in 2002: Computer and automated business equipment (16%); Aviation (37%), Communication technology (18%). These statistics mask significant variations in regional performance however, with the bulk of R&D and patenting activity accounted for by a small proportion of the business base. There is significant scope to improve the innovative capacity of the region. The 2001 Innovation survey judged the South West to be ‘average’ in relation to innovative activity, with 46% of firms judged to be ‘innovation active’, compared to 47% nationally. Furthermore, the region performs below average for patent applications generally. While there is a high-technology sectoral presence within the region, this is largely due to a small number of large businesses that operate in the aerospace and defence and communications technologies, which in turn are clustered to the north-east of the region. The region’s dependence on a small number of large firms represents a structural weakness of the regional economy, in addition to highlighting the relative absence of high technology businesses in much of the rest of the region, particularly among the knowledge intensive growth sectors. Within the South West, the intra-regional disparities extend beyond the location of high-technology businesses, with the north-east leading the field in innovative activities generally. Gloucestershire, Wiltshire and North Somerset (GWNS) is the only (NUTs 2 level) area of the South West to generate patent applications above the regional average, and the Bath and Bristol area benefits from a higher concentration HEIs and, consequently, graduates in its workforce. Across the whole of the South West, the ‘full-spectrum’ universities are restricted to the areas of Bath / Bristol, Exeter, and Plymouth. A readily available pool of local graduates contributes to the skilled labour on which the high-tech industries depend, ultimately affecting their relocation decisions and / or their ability to expand without relying on the relocation of suitably qualified individuals. The intra regional disparity in graduate numbers presents a particular challenge in improving the performance of poorer performing areas. The region has a number of 5 and 5* rated HE departments and research strengths relevant to priority sectors but low levels of contact with regional businesses. The South West has the lowest proportion of industrial case collaborations where HE and businesses are in the same region and there is significant scope to improve the degree of interaction between the region’s businesses and HEIs. While all 13 HEI institutions within the region have a central enquiry point for SMEs, only 12% of staff engage with commercial partners (compared to 18% nationally) and only three institutions have the capability to seek out licensing opportunities for their Intellectual Property. Research carried out to explain the productivity gap between the South West and the London economy identified a 33% productivity gap, of which 6% (twenty per cent of the gap) was a result of industrial structure. There is a need to diversify from the current structure, and this is likely to include both new companies in high value added sectors, and helping existing companies to move in to new markets through product innovation.

78
Opportunities There are two major opportunities which the Programme can help companies to take advantage of. These are:
Linked to new market opportunities, increasing the level of engagement between HEIs and external partners will potentially promote both the level and take-up of innovation within business. This is of particular relevance to those businesses located outside the GWNS area and the promotion of HE-FE-Business links will seek to widen further the potential coverage of such collaborations, with FE institutions located throughout the region
A key opportunity moving forwards identified in the SWOT is the increasing demand for
environmental goods and services, further promoted by the Stern Report, which provides significant scope for innovation. The sector covers a broad range of activity and has been identified as a regional priority. The sector represents a potentially large global market in which South West firms may develop leadership. The innovation challenge regarding the environmental challenges is not limited to the generation of ideas to meet environmental objectives, but to also identify where existing and emerging technologies may be adapted to deliver environmental benefits.
Lessons Learnt: Innovation and Knowledge The ex-ante evaluation identified that Past programmes have not had a strong focus on supporting innovation and technology. It was included within the SME support priority and was viewed as a means of increasing business competitiveness. However, specific objectives in relation to innovation were, on the whole, fairly vague. The ex-ante evaluators identified that there was a prevailing wisdom that the benefits to SMEs from technology and innovation support are medium to long term. They argue that whilst this may be true for interventions that involve early investment in technology and science, the commercial application of technology should produce business outcomes – enhanced GVA, turnover, and employment fairly quickly. This is in line with current thinking within the region that places an emphasis on product and process development. The Good Practice Guide presents 3 key messages in this area:
• The need for a strategic and coherent approach – the body of learning accumulated around KT in recent years now needs to be placed on a clearer strategic footing. It needs to set out: the role of knowledge transfer in regional economic development; identify priority areas for investment where maximum economic change can be affected; build on existing assets and opportunities within the higher education and business base; and be driven from a more sophisticated understanding of market failures which constrain effective knowledge transfer. Future programmes of KT investment must be built upon a clear framework of investment priorities (rather than an experimental or competitive approach) which encourages long-term and intensive support to initiatives;
• Accepting Risk though a Portfolio Approach. The HEI and business interface has to be a developmental one which is able to take risks and adopt a commercial, almost speculative mindset. The ERDF focus on output driven activity and its complex accounting requirements for match funding and use of income (particularly from the private sector) runs against the grain of these objectives. The pressure to generate outputs from activity militates against important developmental, market-making and culture change activities and this should be reflected in the Portfolio approach.
• Outputs. The output framework of ERDF Programmes, although flexible (there are a number of instances where new outputs have been agreed with the Commission) is still a source of frustration for delivery agencies. Knowledge Transfer impacts take a long time to manifest themselves on the bottom line of businesses and can come in many different forms. The downstream impacts on turnover and GVA are extremely hard to predict and the causal link becomes more tenuous the longer the time horizon involved. The focus on a number of SMEs

79
assisted has had a particularly pernicious impact in some programmes as it has encouraged quantity over quality.
This analysis provided by the Ex Ante Evaluator, along with other comments received on the draft version of the Operational Programme suggest a need to be clear about the parameters of support provided under this Priority. This has led to a focus on HEI and business links, rather than research in HEIs per se, even where it might ultimately have commercial applications, and on product and process development most likely to have an impact on company performance. Focusing Resources Given the need to use innovation as a means of improving the productivity across the business base, and the need for new product and process developments in a wide range of companies, this Priority will not have an exclusively sectoral focus, although it is expected that some sectors which feature more prominently than others. A sectorally exclusive approach would run the danger of excluding certain geographies, notably rural areas. It is important to take account of limited resources and in order to focus resources, an appraisal and selection process will be agreed which will incorporate a number of key criteria. This will include:
Services which incorporate measures to ensure penetration in the rural areas and west of the region.
Services which ensure penetration in the RES priority sectors. Services which seek to encourage innovation and product development with regard to
environmental goods and services (with a particular focus on renewable energy and environmental technologies).
Services which have an educational, advocacy and cultural change dimension. Services with a clear evidence of market failure, target sectors and companies. Services which conform to the business simplification agenda.
This approach will help to ensure that the limited resources available are focussed in a way which ensures the maximum impact in relation to the strategic objectives of the Programme and adding value to existing provision. Support will not be available for generic business support for innovation. Priority will be given to sector clusters and niches relevant to the RES Priority Sectors – Advanced engineering (including aerospace);Bio-technologies; Creative industries (media and non-media); Environmental technologies; Food and drink (; Information and communication technologies (ICT); Marine (including manufacturing and leisure); and Tourism – where research and development and innovation support can promote the development high value added business activity, although a strict sector approach will not be pursued. The Technology Strategy Board (TSB) is an Executive Non-Departmental Public Body set up to develop a coherent UK-wide strategy for technological innovation and to deliver a programme of Government financial support to encourage business investment in, and use of, technology across all sectors of the UK economy. Where Structural Funds interventions aim to promote innovation and knowledge transfer, they will seek to achieve alignment with national priorities and maximise the benefits from collaborating with TSB supported programmes. Aims and Objectives The aim of this Priority is to improve the regions overall performance with regard to innovation and close the intra-regional gap in innovation performance, bringing the rest of the region closer to the high performing Gloucestershire, Wiltshire and North Somerset area. The Priority has a key role to play in maximising the economic contribution from the region’s HE/FE institutions and helping companies exploit their own ideas and innovations.

80
The strategic objectives are to:
Increase the sales and productivity of companies through increasing the rate of innovation and the economic benefits from the of knowledge and product and process improvements.
Increase the number of high value added, innovative new start businesses. These objectives will be achieved through actions which will assist some 4,000 businesses to improve their performance, support the creation of 210 new enterprise leading to 2,330 net additional jobs and £92m of net additional value added. There are strong linkages between this Priority and Priority Axis 2 Enterprise and Growth. It is expected that some businesses and new starts supported under this Priority will migrate to Priority Axis 2 support as ideas and innovations move to full scale production, and businesses seek additional access to finance and to develop in to national and international markets. Likewise, new starts and businesses supported under Priority 2 will migrate to this Priority as their demand for knowledge grows. Overall description of activities to be supported There are a number of actions which will increase the level of innovation and stimulate business growth through the exploitation of knowledge, research and development and intellectual property. A key activity will be linking the HEIs and research institutions in the region and nationally to businesses with the ambition and potential to develop new products and services. Activities under this Priority will address both supply and demand sides of the knowledge equation. In terms of supply, activities will focus on improving knowledge transfer from the region’s knowledge base and teaching companies how to utilise their own knowledge and intellectual property. On the demand side, activities will focus on stimulating the demand for knowledge and how to access it, and business pull-through of technology, linked to enterprise and growth activities under Priority Axis 2. The provision of generic advice to businesses to improve processes and systems through innovation has not been included within this Priority. This activity falls within existing business support structures. Key strands of activity within Priority Axis 1 Strands Focus and Activity Supporting ideas, innovation and knowledge
This strand focuses on company led innovation, product and process improvements. This will include innovation diagnostic services, access to innovation centres, support for the management and development of Intellectual Property Rights and its exploitation. A major theme will be the use of knowledge within businesses with a focus on management and exploitation of a full range of intellectual assets to generate business led innovations, product and process improvements will encompass a full range of intellectual property rights issues. Support will also be provided to inventors. This will include the provision of high quality support for new starts based on innovative developments, products and process developments, with considerable market potential.
Improving FE/HE interactions with SMEs
This strand will support new dissemination methods and routes to businesses through the use of Further Education institutions and increasing collaboration between HEI and HE/FE. This will include network facilitation to enhance co-operation and collaboration between the business base and HEI/FE expertise.
Business/HE Technology Initiatives
This strand is technology led, and will provide a series of technology initiatives based on proven business demand and expertise within HEIs. Focus will be on technologies where there are clear opportunities for pull through into business and where appropriate, link to sector/niches of strategic importance to the regional economy. Support will also be aimed at SMEs in supply chains to access knowledge and quickly apply new technologies to increase innovation and build competitiveness; increase business-HE collaboration; and increase commercial

81
Strands Focus and Activity exploitation of the knowledge base.
Environmental goods and services (including environmental technologies and renewable energy)
The focus of this priority is to develop an emerging sector which has long term growth prospects and where competitiveness is based on innovation and a highly skilled workforce. Activities will focus on sub-sectors where the South West has a competitive advantage and to develop actions to accelerate growth. In keeping with the objective of developing a low carbon economy, support will be provided to increase business expenditure on research and development through providing grants and small funds for exploring potential of new ideas relating to the environmental technologies and renewable energy. This will enable SMEs to access knowledge and take the first step towards accessing other funding sources; building business demand for services. This will also include support for the development of business networks, licensing and trade agreements. Proof of concept funding, critical to the pre-commercial development of new ideas.
Complementarity with the Competitiveness Regional ESF Framework Priority Axis 2: Developing a Skilled and Adaptable Workforce of the Regional ESF Framework will seek to develop a skilled and adaptable workforce by: reducing the number of people without basic skills; increasing the number of people qualified to level 2 and, where justified, to level 3; reducing gender segregation in the workforce; and developing managers and workers in small enterprises. Priority 2 includes a proportion of the support targeted at Level 3 and above, likely to be relevant to this Priority and the Framework identifies a number of other relevant priorities which will influence investment: improving productivity of businesses in the west of the region; improving productivity of businesses in rural areas; priority and key sectors identified by the RES and Regional Skills Partnership; developing a low carbon economy, training will be supported to help address specific skills gaps in relation to environmental management skills for businesses, particularly to help businesses achieve relevant environmental standards (BS 8555 for instance).; environmental technology and renewables sectors will also be a priority; including training that enables businesses to diversify into this sector, where there is evidence of need; and companies involved in business growth, innovation and research and development through the Competitiveness (ERDF) Programme Final Beneficiaries Final beneficiaries will include business development agencies, higher and further education institutions, local authorities and other bodies in the public, private and third sector. Target beneficiaries Target beneficiaries will include inventors, prospective entrepreneurs, new and existing business, and inward locating businesses. Demarcation Priority 1 will focus on the development of ideas, research, product and process development where support is required to reach a fully commercial stage (this will include all pre-production work, including test marketing and prototype development). Priority 2 will focus on working with business where new products and processes are fully developed, and support is needed for business activities such as marketing, to allow the company to increase sales.
82
Intra Regional Disparities Rural: in order to ensure that rural businesses are able to access services and facilities, the process of appraising and selecting projects will incorporate the need to ensure that a significant proportion of beneficiaries are located in rural areas. This is likely to include the use of Further Education facilities as out-reach services, the promotion of service in rural areas, and allowing for higher costs of delivering to rural businesses. The appraisal process will include an assessment of the extent to which adequate provision is included for advisors and other facilities in rural areas. West of the region: in order to close intra regional disparities, the process of appraising and selecting projects will incorporate the need to ensure that a significant proportion of beneficiaries are located in the west of the region. This is likely to include the use of Further Education facilities as out-reach services (for the rural west and Torbay) and the promotion of service in the west of the region. The appraisal process will include an assessment of the extent to which adequate provision is included for advisors and other facilities in the west of the region to help ensure that the Priority contributes to the reduction of intra-regional disparities ( 35% of Priority 1results, as a minimum, are expected to be achieved through delivery in the western peninsula). Environment There is a clear link between innovation and the need to address the issue of climate change (both in terms of eco-innovation activities that are aimed at reduction in greenhouse gas emissions and innovative ways of climate change adaptation). Innovation may also contribute to broader environmental activities, such as more efficient production processes which minimise environmental impact and reduce the costs of production, and more effective means of achieving environmental sustainability. The focus above on environmental technologies and renewable energy is expected to deliver innovative actions that help the region meet its environmental challenges, while delivering economic benefit. Wider activities supported under this Priority will also be expected to show how the cross cutting theme has been reflected in project design and delivery and how any specific recommendations made have been addressed. In particular support for start-ups and product and process improvements will be conditional on an assessment of the environmental impacts of the proposed activities, with evidence provided on how environmental impacts have been minimised. Equal Opportunities and Diversity There is considerable evidence that diversity makes a vital contribution to innovative thinking within businesses. With an emphasis on using intellectual assets to innovate and improve competitiveness it is important that businesses recognise and make full use of their human capital. This programme will work to ensure that businesses recognise the value of diversity and the benefits of a diverse workforce to their innovative capacity. Many areas of innovation and product and process development are dominated by men, a function of an emphasis on scientific and technical skills and a strong interest from manufacturing companies, where employment is predominantly male. In order to reduce any possible bias, service providers will be required to develop an access plan which anticipates and takes account of the possible barriers to the take up of services by any of the key targets groups identified under the Equality and Diversity theme. Particular attention will be paid to barriers facing women and people with disabilities. It is anticipated that the following types of support will be made available: childcare and care support for those seeking to take up opportunities; and service provision outside of the working day, including early evenings and week-ends.

83
Financial Resources The financial resources are set out below. Financial Resources Priority 1: Innovation and Knowledge EU UK Total Innovation and Knowledge 45.000 45.000 90.000
Indicative Range of Support by Intervention Supporting ideas, innovation and knowledge 25%- 45% Improving FE/HE interactions with SMEs 25%-40% Business/HE Technology Initiatives 20%-30% Environmental technologies and renewable energy 10%- 25%
Priority Axis 1 – Outputs and Results Indicators
Outputs Target
Number
Number of businesses assisted to improve their performance 3,990 Number of new businesses assisted (subset of businesses assisted) 210 Number of environmental technologies and renewable energy enterprises assisted (subset of businesses assisted)
350
Number of firms involved in collaborative research & development projects (subset of businesses assisted)
210
Results Gross new jobs created** 3,200 Gross jobs safeguarded** 1,000 Gross research jobs created (subset of jobs created)** 640 Gross Research jobs safeguarded (subset of jobs safeguarded)** 200 Number of additional firms involved in business/cluster networks 1,400 Number of patents, other IPRs and other IPR devices used (e.g. trademarks copyrights) 140 Number of SMEs launching new or improved products 4,500 Gross increase in GVA £126.4m Gross safeguarded GVA £165,9m Gross jobs created in environmental sectors 700
Impacts Net additional GVA £92.0m Net safeguarded GVA £128.0m Net additional employment 2,330
* A range of cross cutting indicators will also be developed and quantified at an early stage, once the cross cutting themes managers are in post ** Eligible jobs created are those created within five years of the initial investment.

84
The table below sets out the categories of expenditure and identifies those which contribute to the Lisbon Agenda. For Priority 1, it is expected that 100% of funds will focus on Lisbon compliant activities. Priority 1 Categories of Intervention Lisbon 01:R&TD activities in research centres X 02: R&TD infrastructure and centres of competence in a specific technology X 03: Technology transfer and improvement of cooperation networks between small businesses (SMEs), between these and other businesses and universities, post-secondary education establishments of all kinds, regional authorities, research centres and scientific and technological poles
X
04: Assistance to R&TD, particularly in SMEs (including access to R&TD services in research centres)
X
05: Advanced support services for firms and groups of firms X 07: Investment in firms directly linked to research and innovation (innovative technologies, establishment of new firms by universities, existing R&TD centres and firms, etc.)
X
08: Other investment in firms X 09: Other measures to stimulate research and innovation and entrepreneurship in SMEs X 39: Renewable energy: wind X 40: Renewable energy: solar X 41: Renewable energy: biomass X 42: Renewable energy: hydroelectric, geothermal and other X 43: Energy efficiency, co-generation, energy management X 68 Support for self employment and business start up X 74 Developing human potential in the field of research and innovation, in particular through post graduate studies and training of researchers, and networking activities between universities, research centres and businesses.
X
Codes for the form of Finance Dimension
Code Form of finance 01 Non-repayable aid 02 Aid (loan, interest subsidy, guarantees) 03 Venture capital (participation, venture-capital fund) 04 Other forms of finance
85
6.4 Priority Axis 2: Enterprise and Growth Context and Rationale The baseline and SWOT has highlighted that the South West has enjoyed a period of strong economic performance, with sustained employment growth, low unemployment, and GVA growth that outperforms the UK. The region has a strong enterprise and business start-up rates, in addition to good levels of investment in business R&D. The north east of the region experiences high levels of connectivity with the markets of London and the South East and a number of growth sectors (including ICT, creative industries, and biotechnology) are present in the region. The region suffers from significant underlying structural weaknesses and wide disparities exist between the sub-regions. Between 1997 and 2003 the average annual rate of GVA growth ranged between 2% in Devon and 3.2% in the GWNS area and this persistent east-west disparity is set to continue. One of the key challenges facing the region is improve the low productivity base of its businesses, driven largely by the region’s industrial structure, and identified as a weakness in the regional SWOT. The region is heavily dependent on low value added sectors, including tourism and agriculture, which is reflected in the high levels of part-time working. The region has a shortfall of good quality full-time positions. The level of business start-ups in the region is inversely related to GVA per head. While this may point to entrepreneurial strengths among some of sub regions lagging behind, it also suggests that many business start-ups are due to a lack of suitable employment alternatives, and are in effect self employment businesses. This argument is strengthened by the high level of lifestyle businesses operating in the South West. In order to improve competitiveness and employment opportunities, there needs to be a shift towards high-quality business generating high value added activity, that are able to grow beyond their initial micro-businesses scale. The region’s favourable business density in part reflects its industrial structure, which exhibits a larger number of smaller businesses. The region also exhibits high survival rates, and while this may represent a strength of the regional economy, coupled with the low levels of productivity it may also signify an absence of competitive pressures within the region. Technological advances in communication technology and increasing globalisation will increase the competitive pressures on South West firms, providing both significant opportunities and threats for the region’s business base. The region has a poor record on exporting. It generates the lowest proportion of exports per employee of the UK regions and exporting activity is concentrated in a small number of sectors and companies. The regional SWOT highlights the potential of the region to increase trade with the markets of Asia, Oceania and Eastern Europe and through the development of sectors such as the environmental technologies. Opportunities There are two major opportunities which the Programme can help companies to take advantage of. These are:
Forecast growth in national and international markets through the process of globalisation of trade, with increased opportunities for collaborative activities as well as increased exports.
The potential market for environmental technologies and renewable energies, particularly those
sub sectors where the region has an advantage and enterprises have the potential to grow quickly and/or trade nationally and internationally. This focus will take forward some of the new products and processes developed under Priority Axis 1, and subsequent development will also link to up-skilling company workforces.

86
Lessons Learnt: Enterprise and Growth Past programmes have provided significant support to SMEs. Key lessons from this area are:
• Supporting new businesses under an overall SME priority was more effective than having a separate priority for new businesses;
• A large proportion of business support has centred on low intensity, short term activities that previous evaluations have shown to produce limited outcomes. Mainstream and technology related business support should place greater emphasis on more intensive interventions which have long been shown to be more effective in producing tangible results. Economy and effectiveness can be enhanced through the use of brokerage and demand led models of business support.
• There was a lack of alignment with RDA led cluster development and LSC led workforce development activities;
• Business competitiveness actions with the most added value – such as mentoring/training of managers and support for introducing quality systems are rarely on offer;
• There has been limited take-up of business support services in rural areas for the following reasons:
o Smaller SMEs having less capacity to absorb support. o Enterprise policy has not come to terms with providing an appropriate level of support
for rural economies where there is limited growth potential. o Lack of match funding for activities that will not contribute substantially to Structural
fund targets. • There is increasing demand for ‘follow-on’ space for micro-businesses in some regions. But
there continues to be a market failure as the private sector is reluctant to get involved with this segment of the market. PPP type investments have helped draw in private sector investment.
These conclusions reflect experience in the South West and have influenced the development of this Priority. In particular, the emphasis is on the quality of the support, and the ambition and potential of the business requiring support. As a result of this analysis and other commentary provided by the Ex Ante Evaluator, this Priority will focus on more substantive interventions, rather than low intensity support. The Priority includes a combined new start and existing business with growth potential, rather than separating these out in to separate strands. The Task and Finish Group also identified the importance of mentoring as a means of accelerating business growth, with an emphasis on mentors with a limited portfolio, with more time to make a contribution to company development. Focusing Resources Given the need to improve productivity across the business base, this Priority will not have an exclusively sectoral focus, although it is expected that some sectors will feature more prominently than others. A sectorally exclusive approach would run the danger of excluding certain geographies, notably rural areas. Nevertheless, priority will be given to sector clusters and niches relevant to the RES Priority Sectors – Advanced engineering (including aerospace);Bio-technologies; Creative industries (media and non-media); Environmental technologies; Food and drink; Information and communication technologies (ICT); Marine (including manufacturing and leisure); and Tourism – where support can assist the development high value added business activity, although a strict sector focus will not be pursued. It is important to take account of limited resources and in order to focus resources, an appraisal and selection process will be agreed which will incorporate a number of key criteria. This will include:
Services which incorporate measures to ensure penetration in the rural areas and west of the region, and explicitly take account of the higher costs of delivering services in rural areas.
Services which ensure penetration in the RES priority sectors. Services which have robust mechanisms for identifying and supporting higher growth
companies. Services with a clear evidence of market failure, target sectors and companies.

87
Services which provided a qualitative improvement in support to companies, based on company needs.
Services which conform to the business simplification agenda. This approach will help to ensure that the limited resources available are focussed in a way which ensures the maximum impact in relation to the strategic objectives of the Programme and adding value to existing provision. Support will not be available for generic business support. Aims and Objectives The aim of this Priority is to increase the contribution that high value added businesses make to the economy and reduce intra-regional disparities. This Priority has a key role to play in addressing the low earnings, low skilled nature of the economy. The strategic objectives are to:
Increase the proportion of businesses and employment in high value added business activities. Increase the quality of new starts through supporting high growth and high value added new
starts. Increase the sales and productivity of businesses through the provision of high quality business
support in key areas including internationalisation and investment support. These objectives will be achieved through actions which will assist over 5,800 businesses to improve their performance, support the creation of 490 new enterprise leading to 2,543 net additional jobs and £100.5m of net additional value added. There are strong links between this priority and Priority Axis 1 – Innovation and Knowledge. It is also expected that businesses that are supported under this priority will also access projects to improve the skills of their staff through the South West Regional ESF Framework. This Priority Axis will focus on the process of increasing the contribution that new businesses make to the economy, and will not fund generic new start and business support, but will focus on high growth businesses, companies in high value added sectors, and those requiring a highly skilled workforce. Overall Description of Activities to be Supported Activities under this Priority will be closely targeted at generating growth in higher added value sectors in the South West through both new starts and existing businesses. Activity will include action to increase participation in international markets, improve competitiveness through improved environmental performance. Linking into Priority Axis 1 will be activity to support the emerging businesses in the new environmental technology sector. Table 5: Key Strands of activity within Priority Axis 2
Strands Focus and activity High growth new starts and accelerating business growth
The intention is now to focus on the quality of new starts and supporting business with growth potential and in knowledge based sectors. This will involve targeted assistance for business propositions or individual entrepreneurs with the potential to create new high value added businesses This strand will provide targeted business support, aimed at key sectors, networks, business clusters and niches (as set out in the earlier analysis), and actions to address weaknesses which inhibit growth. Actions to address weaknesses which inhibit growth in targeted business will include market development; improving business productivity through improving environmental performance, mentoring to strengthening internal capacity. If appropriate access to finance and investor readiness support will be provided, although limited funding will require a much targeted approach.
Internationalisation Focussed on increasing capacity of businesses to participate fully in international markets through reducing barriers to international trading; supporting international collaborations, alliances and joint ventures; raising awareness to emerging opportunities in overseas markets. Objective of building

88
Strands Focus and activity more outward facing SME community and significantly increasing turnover from exports.
Environmental performance in business
Activities to provide advice and support to companies to save costs and improve competitiveness through real increased environmental performance and credibility. Developing new business opportunities relating to changing environmental standards.
Environmental goods and services
Linked to Priority Axis 1. This activity will focus on activities to support new and existing businesses in the environmental technologies sector through developing markets through demand stimulation, providing access to finance, new markets and specialist business support.
Complementarity with the Competitiveness Regional ESF Framework Priority Axis 2: Developing a Skilled and Adaptable Workforce of the Regional ESF Framework will seek to develop a skilled and adaptable workforce by: reducing the number of people without basic skills; increasing the number of people qualified to level 2 and, where justified, to level 3; reducing gender segregation in the workforce; and developing managers and workers in small enterprises. Priority 2 includes a proportion of the support targeted at Level 3 and above, likely to be relevant to this Priority and the Framework identifies a number of other relevant priorities which will influence investment: improving productivity of businesses in the west of the region; improving productivity of businesses in rural areas; priority and key sectors identified by the RES and Regional Skills Partnership; developing a low carbon economy, training will be supported to help address specific skills gaps in relation to environmental management skills for businesses, particularly to help businesses achieve relevant environmental standards (BS 8555 for instance).; environmental technology and renewables sectors will also be a priority; including training that enables businesses to diversify into this sector, where there is evidence of need; and companies involved in business growth, innovation and research and development through the Competitiveness (ERDF) Programme. Final Beneficiaries Final beneficiaries will include business development agencies, higher and further education institutions, local authorities and other bodies in the public, private and third sector. Target beneficiaries Target beneficiaries will include prospective entrepreneurs, new and existing business, and inward locating businesses. Demarcation Priority 2 will focus on working with businesses do accelerate the growth of high value added business. This will include working with companies which have developed new products and processes with Priority 1 support. Priority 2 will focus on business support for activities such as marketing, to allow the company to increase sales. Priority 1 will focus on the development of ideas, research, product and process development where support is required to reach a fully commercial stage (this will include all pre-production work, including test marketing and prototype development

89
Rural: in order to ensure that rural businesses are able to access services and facilities, the process of appraising and selecting projects will incorporate the need to ensure that a significant proportion of beneficiaries are located in rural areas. This is likely to include ensuring that services are effectively promoted in rural areas, and allowing for higher costs of delivering to rural businesses. The appraisal process will include an assessment of the extent to which adequate provision is included for advisors and other facilities in rural areas. West of the region: in order to close intra regional disparities, the process of appraising and selecting projects will incorporate the need to ensure that a significant proportion of beneficiaries are located in the west of the region. This is likely to include the use of Further Education facilities as out-reach services (for the rural west and Torbay), and the promotion of service in the west of the region. The appraisal process will include an assessment of the extent to which adequate provision is included for advisors and other facilities in the west of the region to help ensure that the Priority contributes to the reduction of intra-regional disparities. (45% of Priority 2 results, as a minimum, are expected to be achieved through delivery in the western peninsula) Environment There are specific opportunities within Priority 2 for support for activities aimed at increasing the competitiveness and productivity of businesses through resource and energy efficiency measures and the implementation of environmental management systems. This is seen as a priority for the Programme, building on the work that has already been undertaken in the region. Particular consideration will be given to those sectors with a high carbon emission / GVA ratio and/or the largest environmental impact, as intervention in these sectors may generate the most significant environmental improvements and deliver the most significant business savings. In addition the region has recognised the importance of the environmental goods and services sector as one that could have significant growth potential, while also building on the region’s commitment to economic growth within environmental limits and delivery of a low carbon Programme. In addition the UK government has stated that the “environmental industry is a dynamic and growing sector which makes an important - and increasing - contribution to the economy"72. The Programme will therefore make significant investment to encourage both business start-ups and business growth in key sectors such as renewables. While the Programme will make specific investments as above, it is also important in the implementation of the cross cutting theme that all projects funded through this Priority seek to minimise environmental impact and maximise their exploitation of environmental opportunities. While capital expenditure is limited, any capital investment will be conditional on exceeding BREEAM ratings or equivalent, based on the Future Foundations sustainable construction charter. Equal Opportunities and Diversity Although the South West have higher rates of engagement in business ownership and management for Equality and Diversity target groups than other regions, there remains an under-representation of many groups. In order to reduce any possible bias, service providers will be required to develop an access plan which anticipates and takes account of the possible barriers to the take up of services by any of the key targets groups identified under the Equality and Diversity theme. Particular attention will be paid to barriers facing women, people with disabilities and people from black and minority ethnic groups. It is anticipated that the following types of support will be made available: childcare and care support for those seeking to take up opportunities; and service provision outside of the working day, including early evenings and week-ends.
72 Securing the Future, The UK Government Sustainable Development Strategy, DEFRA, 2005

90
Financial Resources The financial resources are set out below. Priority 2: Enterprise and Growth EU UK Total Enterprise and Growth 45.000 45.000 90.000 Indicative Range of Support by Intervention High growth new starts and accelerating business growth 30%-60% Internationalisation 20%-25% Environmental performance in business 10%-15% Environmental Technologies and Renewable Energy 10%-25% Priority Axis 2 - Outputs and Results
Indicators Outputs
Target Number
Number of businesses assisted to improve their performance 5,810 Number of new enterprises assisted (subset of businesses assisted) 490 Number of environmental technologies and renewable energy enterprises assisted (subset of businesses assisted)
350
Number of SMEs advised or assisted to improve their environmental performance (subset of businesses assisted)
1,400
Number of businesses within the region engaged in new collaboration with UK knowledge base (subset of businesses assisted)
300
Results Gross new jobs created** 4,300 Gross jobs safeguarded** 2,000 Gross increase in GVA £169.9m Gross safeguarded GVA £248.9m Number of additional firms involved in business/cluster networks 1,200 Gross jobs created in environmental sectors 750
Impacts Net additional GVA £100.5m Net safeguarded GVA £167.2m Net additional employment 2,543
* A range of cross cutting indicators will also be developed and quantified at an early stage, once the cross cutting themes managers are in post ** Eligible jobs created are those created within five years of the initial investment.

91
The table below sets out the categories of expenditure and identifies those which contribute to the Lisbon Agenda. It is expected that at least 90% of funds will focus on Lisbon compliant activities.
Priority 2 Categories of Intervention Lisbon 05: Advanced support services for firms and groups of firms X 06 Assistance to SMEs for the promotion of environmentally friendly products and production processes
X
07: Investment in firms directly linked to research and innovation X 08: Other investment in firms X 09: Other measures to stimulate research and innovation and entrepreneurship in SMEs X 14: Services and applications for SMEs (e-commerce, education and training, networking, etc.) X 15: Other measures for improving access to and efficient use of ICT by SMEs X 39: Renewable energy: wind X 40: Renewable energy: solar X 41: Renewable energy: biomass X 42: Renewable energy: hydroelectric, geothermal and other X 43: Energy efficiency, co-generation, energy management X 63: Design and dissemination of innovative and more productive ways of organising work X 68 Support for self employment and business start up X 74 Developing human potential in the field of research and innovation. X
Codes for the form of finance dimension
Code Form of finance 01 Non-repayable aid 02 Aid (loan, interest subsidy, guarantees) 03 Venture capital (participation, venture-capital fund) 04 Other forms of finance
92
6.5 Priority Axis 3: Urban Enterprise Context and Rationale In the UK, poverty and disadvantage are increasingly focussed in urban areas, and in many cases, within discrete parts of City and town economies. This concentration of disadvantage in particular neighbourhoods identified in the SWOT has a circular effect, with those in employment or training often choosing to leave, often replaced by workless households. The result is communities characterised by high levels of worklessness and very low household incomes. There is a clear link between deprivation and low levels of enterprise, and is supported by work carried out by the Bank of England73, which found that high levels of deprivation are associated with a low business formation rates. Individuals in deprived areas may face a range of barriers to entrepreneurial activity, including poor access to finance, a lack of business support and advice, and a lack of experience, skills or training. Furthermore, the absence of an enterprising culture with deprived areas may act as a significant barrier to potential entrepreneurs. There are a number of routes through which the promotion of an enterprise culture may tackle deprivation and some examples are provided below:
• Enterprise in deprived areas will raise the productivity of the local economy with new firms driving product market competition and generating innovations in technology and organisations.
• Employment benefits, initially felt by owner managers will spread to the wider community as the business grows and the demand for labour increases.
• New businesses and the growth of existing businesses will stimulate and grow the local tax base which may be reinvested in the local economy.
• The retention of money flows within a local economy will promote increased service provision by locally owned businesses, such as retail.
• Enterprise development will create a multiplier effect which will create further demand for other businesses.
• The promotion of social capital which is important to enterprise – providing links between existing and aspiring entrepreneurs.
• Physical renewal through the reclamation of derelict buildings and brownfield land, attracting other businesses and residents.
However, the development of an enterprise culture is not a simple task, especially in the most deprived communities, and the national strategy focuses on the development of local solutions that are integrated with other local efforts. It also highlights the long-term nature of enterprise development. In line with the national trends, multiple deprivation in the South West is concentrated in the region’s urban areas; notably Bristol and Plymouth where over 10% of the population reside in SOAs ranked among the 10% most deprived nationally. This represents a total population of 82,000, or 57% all those South West residents of SOAs ranked among the 10% most deprived nationally. Multiple Deprivation is less severe in Torbay, where almost 5% (6,000 individuals) are resident of SOAs ranked among the 10% most deprived nationally. However, in Torbay this multiple deprivation is coupled with very low levels of prosperity, measured by GVA per head. In 2004, total output per head stood at £10,600 in Torbay; only 60% of the English figure and below that of the Cornwall and Isles of Scilly Convergence Area (at 63% of the English figure).
73 Bank of England (2000): Finance for small businesses in deprived communities – a first report.

93
The Opportunity In spite of concentred efforts over many years, worklessness has persisted in the most deprived neighbourhoods. While efforts to improve schools performance and support residents’ access training and employment opportunities have brought some gains, the rate of worklessness has not been significantly reduced. There is now recognition of the need to deploy a wider range of new and innovative responses, and this includes focussing on enterprise in disadvantaged communities. This approach sits alongside and complements other neighbourhood and people focused strategies. It differs from conventional business support where the focus is on economic benefit and increasingly on higher growth and high value added businesses. While a number of other locations also face challenging local conditions, there are a number of factors which have led to the selection of three areas for initial support. These are:
The very limited finance available, the scale and intensity of disadvantage in Bristol, The scale of disadvantage in Plymouth and its location in the underperforming west of the
region, and The lack of employment opportunities and the scale of disadvantage in Torbay, also located in
the under performing west of the region. Bristol is located in the north east of the region, and is part of a sub region outperforms the region against a range of key indicators. However, whilst generating significant levels of output and employment, the performance of Bristol’s residents is often poorer than the headline figures suggest. Bristol faces low levels of employment and economic activity, and has seen a significant increase (20%, 2001-2006) in the number of Incapacity Benefit claimants. Bristol lags behind the region in terms of business density, with the gap being wider still for its most deprived communities. Bristol accounted for 37% of the regions Super Output Areas ranked among the 10% most deprived nationally in 2004, covering over 50,000 residents. This rises to 60% of the region’s SOAs ranked among the 5% most deprived nationally, accounting for 33,000 residents. In the disadvantaged neighbourhoods, high levels of worklessness are closely associated with educational under-achievement, low skills and the decline of traditional local industries. The second largest city in the South West, Plymouth shares a number of problems with Bristol. In 2004 12% (or 28,000) of its population were residents of SOAs ranked among the 10% most deprived nationally. The city has the lowest level of business density across the region and faces a substantial GVA output gap compared to other key UK cities. In addition, activity rates are significantly lower than the regional averages. Being located at the western edge of the Competitiveness Programme Area, the city also faces issues concerning connectivity, given its peripherality to much of the rest of England. Plymouth is also the only local authority area in the South West to experience population decline over the period 1995 to 2005 (of 1.7%). Multiple deprivation in Torbay is less severe than in Plymouth and Bristol, with 4.6% of its population (6,000 individuals) resident of SOAs ranked among the 10% most deprived nationally; however this still places Torbay among the bottom five South West local authority areas for IMD. One of the greatest weaknesses of the Torbay economy is its low level of GVA per head. At £10,200 it lies below the corresponding figure for the Cornwall Convergence Area and has declined relative to the national figures since 1999. Between 1995 and 2003, GVA growth in Torbay was the lowest of all County and Unitary Authorities in the UK and benefits claimants make up 16% of Torbay’s working age population. Torbay also exhibits low levels of businesses density, which fall significantly below the regional average.

94
In the case of the two Cities, high levels of worklessness in the most deprived neighbourhoods persist even after a significant increase in the employment base. In effect, recent employment growth has had limited impact on these communities. In the case of Torbay, efforts to reduce neighbourhood disadvantage have been undermined by the significant loss of employment in the local economy in the past ten years. The poor school performance and high numbers in the Not in Education, Employment or Training category, suggest that without radical action, these communities will continue to suffer from social exclusion. Lessons Learnt: Disadvantaged Communities The good practice guide identifies four key messages in this area:
• Stimulating and Supporting Enterprise. Very careful consideration needs to be given towards relative resource deployment in stimulating and supporting enterprise in deprived communities as opposed to measures to help these residents access employment. In a time of tight labour markets the return on the latter in terms of improvements in incomes and life chances may be considerably higher. The capacity of an area to generate sufficient demand for the products or services of a new business should be a significant factor in determining resource deployment;
• Focus of Enterprise Development. If the objective is to encourage greater rates of entrepreneurship amongst residents of deprived communities then it is unlikely that the past Community Economic Development focus of programmes and support is the best way forward. Community economic development and associated enterprise support (social and community enterprise) has its place, but it should not be the main focus of support;
• Alignment with Mainstream Provision and Delivery Structures. There is a strong national push towards reducing the number of schemes, projects and organisations involved with business (and enterprise) support. The role of Structural Fund programmes in the past has been to encourage a proliferation of additional or parallel support to the mainstream (although in some areas, such as the North East, strenuous efforts have been made to reverse this). The design of programmes needs to work with this new focus on slimmer delivery structures and the co-ordination of provision;
• Role of Structural Funds. The role of structural Fund programmes in relation to enterprise support could have two explicit main foci: Supporting the ‘outreach’ role of enterprise support through projects and organisations that are effective in helping residents of deprived communities access mainstream support; and supporting larger projects that focus on stimulating and supporting enterprise targeted on particular groups facing common issues.
These points have been incorporated in to the development of this Priority; in particular the proposed approach is a major change in direction compared to the Community Economic Development approach used in previous Programmes. Given the comments of the Ex Ante Evaluator, particular attention will be paid to assessing and developing local demand in neighbourhoods, and to working closely with access to employment actions focussed on improving employability. Other features of the Priority which take account of previous experience are: the need for quality control when supporting neighbourhood focussed initiatives, the importance of track record when commissioning local agencies and the need to focus on sustainable opportunities, not subsidy driven services. Allocation of Resources Resources will be allocated to ensure that substantive plans can be taken forward in each of the designated areas. This will include taking account of the need for a minimum scale of operation, the scale of demand, the opportunity to make a significant impact, and the quality of proposals. Account will also be taken of the need to build capacity and initial allocations will be reviewed at the mid point of the Programme.

95
Bristol, Plymouth and Torbay have a combined population in excess of 600,000. Given the limited funds available and the need to focus resources to ensure a sustainable impact, the PMC will approve plans for the implementation of the Urban Enterprise Priority in each area which will include spatial targeting at the sub Local Authority level. Key stakeholders, including the Local Authorities, Government Office and South West RDA will agree geographical targeting which takes account of: need in terms of economic exclusion; opportunity in terms of effective economies; existing economic inclusion initiatives; and delivery capacity within the designated boundaries. Focusing Resources In addition to spatial targeting, and to focus resources further, an appraisal and selection process will be agreed which will incorporate a number of key criteria. These criteria reflect the need for integrated projects for urban regeneration and will include:
Services which are planned and delivered through a neighbourhood focused partnership approach.
Services which have close links to other neighbourhood based services aimed at assisting local residents take up employment opportunities.
Services which incorporate measures to provide appropriate levels of support to new start ups in disadvantaged neighbourhoods and which offer tailored support clearly designed to meet the specific needs of local residents and target groups.
Services which seek to encourage social and community responses to environmental opportunities and the provision of neighbourhood services.
Services which have an educational, advocacy and cultural change dimension. Services which conform to the business simplification agenda.
This approach will help to ensure that the limited resources available are focussed in a way which ensures the maximum impact in relation to the strategic objectives of the Programme and adding value to existing provision. Support will not be available for generic business support.
Aims and Objectives The aim of this priority is to find new approaches to addressing the problems in the region’s most deprived neighbourhoods through enterprise creation. This priority has a key role to play in testing new ideas to stimulate enterprise amongst people from all backgrounds in the region’s most deprived neighbourhoods. The strategic objective is to:
Increase the level of enterprise / social enterprise activity in the region’s most deprived neighbourhoods.
This will be achieved through actions which lead to the creation and survival of 400 new enterprises and 809 net additional jobs and £16.2m of net additional value added. This Priority will also seek to develop new and innovative models that enable people from all backgrounds to participate in enterprise, employment and training initiatives. An additional objective is to use environmental opportunities to inspire local people and social enterprises to develop new local enterprise opportunities. It is anticipated that as new businesses are supported within deprived areas, they will gain enough confidence to access mainstream support and Priority Axis 2 services.

96
Overall Description of Activities to be Supported Activities supported under this priority will link together to form a package of actions focusing on access to business support as a theme. This theme has been chosen as evidence suggests that:
Residents of these areas are less likely to access mainstream support services; Low aspirations, ambitions and a lack of a ‘can do’ culture require coaching and mentoring; Lack of access to personal and business finance and a lack of appropriate workspace make a
bespoke, neighbourhood focussed response essential; The use of intermediary organisations is most effective at helping people access these
services; and Small scale enterprise, self employment enterprise, and the stimulation of neighbourhood
based economic activity are relevant routes to re-connect some excluded groups and individuals.
This Priority includes strands relating to community based infrastructure and facilities as well as community based provision that meets the needs of residents. Given the limited resources available, resources will be focused on activities to benefit the deprived neighbourhoods of Bristol, Plymouth and Torbay. These three were chosen based on their performance on the employment and income domains of the index of multiple deprivation. The geographical demarcation of funding will be soft in relation to these areas. Funds will be invested in the effective local economy, and this may include some adjacent locations outside ward boundaries. Delivery will be devolved to the relevant partnership in each area in order to prioritise activities. Key Strands of activity within Priority Axis 3 Strands Focus and Activity Small scale infrastructure and facilities
Small scale enterprise facilities that benefit local neighbourhoods linked into Enterprise/Innovation hubs elsewhere. Refurbishment of premises to create a multi-use/local enterprise facility with potential links to ESF delivery.
Promoting and encouraging the creation of new enterprises/social enterprises within under-represented groups
Support focussed on working with local people with enterprise and social enterprise aspirations. Support will include mentoring, support in the pre-start phase, access to finance and investor readiness support, and on-going coaching. Management and leadership training will also be provided where appropriate. Promotion and advocacy actions will work with young people and other groups.
Access to finance Innovative micro finance initiatives, including small scale loans and community finance type initiatives, where there is a clear market failure.
Access to targeted business support services in the community
Ensuring that businesses and social enterprise operating within deprived communities can access business support services. Likely to be delivered through locally based intermediary organisations. Will include assisting local businesses to access local procurement opportunities and recruit local people. Will incorporate dynamic networking of aspiring entrepreneurs and local businesses
Enterprise opportunities from environmental improvements
Stimulating local people, businesses and social enterprises to develop commercial opportunities with regard to environmental opportunities such as energy efficiency, waste minimisation and renewable energy.

97
Complementarity with the Competitiveness Regional ESF Framework Priority 1 Extending Employment Opportunities of the Regional ESF Framework will target unemployed and inactive people, improving the employability of participants by assisting them in gaining skills relevant for employment. Support will also be provided to individuals who have moved into employment, from unemployment or inactivity, regardless of size or sector of their employer, to sustain their employment and progress in the workplace. The Framework has prioritised both workless households and areas with significant workless and claimant households. These priorities are directly relevant to the targeted areas for Priority 3 Urban Enterprise support. ESF will be focussed on basic and employability skills, while ERDF will focus on those with the required level of basic skills, but with limited experience of running and managing a business. ESF support will include support for childcare costs, transport support and other factors which act as a barrier for key target groups seeking to return to the labour market. Priority Axis 2: Developing a Skilled and Adaptable Workforce will seek to develop a skilled and adaptable workforce by: reducing the number of people without basic skills; increasing the number of people qualified to level 2 and, where justified, to level 3; reducing gender segregation in the workforce; and developing managers and workers in small enterprises. There will be a particular focus on the low skilled. This priority will be important to many of the existing business working in the targeted Urban Enterprise areas. Final Beneficiaries Final beneficiaries will include business development agencies, higher and further education institutions, local authorities and other bodies in the public, private and third sector. Target beneficiaries Target beneficiaries will include local residents, prospective entrepreneurs, new and existing business, and inward locating businesses. Demarcation Priority 3 will focus on working with micro and local business requiring support which falls outside of the type of targeted support provided under Priority 2. The focus of Priority 3 on small local businesses, with the focus determined by the targeted geographies, rather than high value added or sectorally specific initiatives. Environment While physical environmental improvements are an important part of the urban regeneration jigsaw, the level of funds available for this Priority precludes the sort of investment that might be required to deliver significant neighbourhood transformation. It is intended that investment in small scale enterprise and multi use facilities within local neighbourhoods will ensure that environmental good practice is followed in design and operation, including the use of micro-renewables. Existing good practice and lessons learnt from the South West and other regions will inform the potential activities. These centres should be environmental exemplars both in physical development and in the activities that are delivered. There is an emphasis within this Priority on supporting social enterprise. Social enterprises focused on community based environmental activity will be especially encouraged including recycling projects that benefit local people

98
In addition it is also important in the implementation of the cross cutting theme that all projects funded through this Priority will be expected to seek to minimise environmental impact and maximise their exploitation of environmental opportunities. Equal Opportunities and Diversity Many of the target groups identified under the Equality and Diversity are strongly represented in the targeted neighbourhoods. This includes BME communities, older people, and lone parents. In order to ensure access by all sections of the communities, local partnerships will be required to develop an access plan which anticipates and takes account of the possible barriers to the take up of services by any of the key targets groups identified under the Equality and Diversity theme. Particular attention will be paid to barriers facing women, black and minority ethnic residents and people with disabilities. It is anticipated that the following types of support will be made available: childcare and care support for those seeking to take up opportunities; service provision outside of the working day, including early evenings and week-ends; mentoring and other support to beneficiaries with low levels of self confidence; access to finance. Financial Resources Priority Axis 3: Urban Enterprise EU UK Total Urban Enterprise 30.000 30.000 60.000
Indicative Range of Support by Intervention Small scale infrastructure and facilities 10%-25% Promoting and encouraging the creation of new enterprises/social enterprises within under-represented groups
20%-35%
Access to finance 10%-20% Access to targeted business support services in the community 20%-35% Enterprise opportunities from environmental improvements 10%-20% Priority Axis 3 - Outputs and Results
Indicators Target Number
Outputs Number of individuals assisted in starting business 900 Number of businesses assisted to improve their performance 1200 Number of social enterprises assisted 80 Square metres of new or upgraded floor space - non specialist 1,000 Square metres of new or upgraded floor space - specialist 1,000 Number of people assisted to get a job 700 Number of SMEs assisted to improve their environmental performance 100
Results Number of businesses started 600 Number of businesses still trading one year after commencing trading (subset of businesses started)
550
Number of businesses still trading three years after commencing trading (subset of businesses started)
400
Gross new jobs created** 1,500 Gross jobs safeguarded** 1,000 Gross increase in GVA £30.0m Gross safeguarded GVA £50.0m

99
Impacts Net additional GVA £16.2m Net safeguarded GVA £29.6m Net additional employment 809
* A range of cross cutting indicators will also be developed and quantified at an early stage, once the cross cutting themes managers are in post ** Eligible jobs created are those created within five years of the initial investment. Categories of Assistance The table below sets out the categories of expenditure and identifies those which contribute to the Lisbon Agenda. In the case of Priority 3, it is expected that 80% of funds will focus on The Lisbon Agenda compliant activities.
Priority 3 Categories of Intervention Lisbon 05: Advanced support services for firms and groups of firms X 06 Assistance to SMEs for the promotion of environmentally friendly products and production processes
X
08: Other investment in firms X 09: Other measures to stimulate research and innovation and entrepreneurship in SMEs X 14: Services and applications for SMEs (e-commerce, education and training, networking, etc.) X 15: Other measures for improving access to and efficient use of ICT by SMEs X 39: Renewable energy: wind X 40: Renewable energy: solar X 41: Renewable energy: biomass X 42: Renewable energy: hydroelectric, geothermal and other X 43: Energy efficiency, co-generation, energy management X 63: Design and dissemination of innovative and more productive ways of organising work X 61: Integrated projects for urban and rural regeneration 68 Support for self employment and business start up X
Codes for the form of finance dimension
Code Form of finance 01 Non-repayable aid 02 Aid (loan, interest subsidy, guarantees) 03 Venture capital (participation, venture-capital fund) 04 Other forms of finance

100
6.6 Priority Axis 4: Technical Assistance Context and Rationale Partnership working, developmental work, publicity, monitoring and evaluation have been critical to the success of the previous Objective Two Programme and it is intended to carry forward best practice to the South West Employment and Competitiveness ERDF Programme. Partners have high expectations as to the quality of ERDF investments and Technical Assistance (TA) will need to be used in a focused way so that it supports the development of these investments. Description of Activities to be Supported Any use of Technical Assistance will be within the context of Article 45 of the EC Regulation 1083/2006 and will be applied to the following activities: Strands Focus and Activity Developmental Technical Assistance will support Programme development and capacity building
through: Support for investment preparation and appraisal, including delivery through
a commissioning approach. Support for project development activity to ensure that the requirements of
the Regulations are incorporated into the projects. Development and provision of training, guidance, and advisory and
information services for successful applicants to ensure a controlled start to projects.
Management information
Support for the provision of management and monitoring information to ensure effective Programme management. Specifically, the Management Information strand will support:
The employment of suitable expertise where necessary, potentially the secondment of staff to the Programme Secretariat.
Training and development of officials involved in the delivery of the Programme.
Embedding the Cross Cutting Themes; The production of good quality Programme management information to
facilitate decision making and Programme operation. Evaluation Programme related analysis, monitoring, and evaluation forms an integral part of
Programme delivery. Performance analysis and evaluation will help ensure focused and effective application of ERDF resources within the Programme. Specifically, Technical Assistance will support:
Development of the baseline data to measure programme performance, particularly results, impacts and value for money.
Provision of required policy and socio-economic analysis updates to facilitate production of the Annual Implementation Reports.
Commissioning evaluation studies and implementing the relevant findings at suitable intervals, including the mid-term and programme completion.
Commissioning an independent impact assessment of the Programme Cross Cutting Themes.
Partnership Delivery of the Competitiveness Programme will require successful collaborative and joint working across a range of partners. Activity under this strand will include:
Support for partnership working and the bringing together of potential beneficiaries.
The co-ordination of the PMC and other Partnership Group.

101
Strands Focus and Activity Communications The role of the Publicity and Communications strand is to ensure that
communications are managed in an effective manner, assistance received from European funds is accurate, transparent, and highly visible and public awareness of the positive impact of the Competitiveness Programme is maximised. Specific supported activities will include:
Establishing and maintenance of effective channels for communication and publicity.
Guidance and pro-active monitoring to ensure all projects adhere to the publicity requirements applied to all grant offers.
Execution of promotional events such as seminars and annual conferences. Technical assistance will be used to produce a monitoring and evaluation plan for approval by the PMC within the first 12 months of the Programme. The monitoring and evaluation plan will include:
Definitions of all of the indicators, guidance on the collection of data by project sponsors and intermediary organisations, and reporting procedures in relation to the governance arrangements of the Programme. It will also include proposals for any guidance and advice services needed to ensure appropriate monitoring.
Arrangements for interim evaluations, both at the programme and Priority level where appropriate. This will include the timing and coverage of evaluation, the use of independent evaluators; quality assurance procedures, oversight by the PMC;
Both the monitoring and evaluation proposals will include, where appropriate, arrangements to review the types of companies being supported and the jobs being created, with a view to understanding progress towards developing a knowledge based economy.
Technical Assistance may be accessed by national, regional, and local authorities, bodies or individuals, including economic and social partners, who are preparing or involved in the implementation of the programme. The match funding for Technical Assistance will be provided from other public regional organisations. External applications for technical assistance, i.e. those outside of the operation of the Programme Secretariat function will be expected to be submitted with the public sector match funding secured. Any Technical Assistance projects required funding providing suitable expertise for the Programme Secretariat function and support for programme and project management will be commissioned by the South West Regional Development Agency. Final Beneficiaries Final beneficiaries will include business development agencies, higher and further education institutions, local authorities and other bodies in the public, private and third sector. Financial Resources Priority 4: Technical Assistance EU UK Total Technical Assistance 4,658,086 4,658,086 9,316,172 Codes Technical assistance 85 Preparation, implementation, monitoring and inspection 86 Evaluation and studies; information and communication

102
7 Cross-Cutting Themes
7.1 Equality and Diversity Introduction In 2000, the Government gave most public authorities in Britain a legal duty to promote race equality. The gender and disability duties will become statutory later this year and in early 2007 respectively. The UK Government has made a commitment in the NSRF to treating environmental sustainability and equality as cross-cutting themes for all future Structural Fund programmes. The framework states that ‘all structural fund programmes will respect the principles of non-discrimination and equal opportunities. Projects will be encouraged to take account of the needs of the local communities they serve, and where appropriate take account of good practice developed within the Equal Community Initiative.’ This chapter outlines the key quality and diversity issues facing the region, the objectives for the Programme in terms of addressing these issues, how equality will be monitored and key actions by Priority needed to address these issues. Key Data Gender Employment – Women accounted for 46% of the total working age population, a slight
increase since 2000, narrowing the employment gap regionally. In four local authorities the employment gap widened (North Somerset, Devon, Torbay and Plymouth). Women are more likely to work in part-time jobs than their male counterparts. Unemployment – Female unemployment was 3.1% in 2005, compared to 3.8% for men. Women have a lower average duration of unemployment. Economic Activity – In 2005, women of working age had a lower economic activity rate (78%) than their male counterparts (86%); Average Earnings – Female full time earnings are increasing faster than the male equivalent, although they are still lagging in absolute terms. Occupational Profile: Women are under-represented in some higher level occupations and in technical occupations including smile crafts. Men are under-represented in administrative occupations and in personal services.
Age Employment – The over-50s have lower rates of employment (38.5%) than other age groups, however, this has grown from a rate of 36.3% in 2000. Unemployment – Unemployment is highest (9.6%) amongst the 16-24 age group. In rate terms, this compares well to 14.3% in 2000. However, in absolute terms, there has been an increase of 5,000 individuals. Economic activity – The over 50s have the lowest economic activity rates at 39.4%, however this has increased significantly since 2000 (34.3%).
Ethnicity Population – 2.3% of the population of the South West are from BME backgrounds compared to 9.1% nationally. However, wide disparities exist between local authority areas ranging from 1% in Cornwall and the Isles of Scilly to 8.2% in Bristol. All local authorities with a concentration higher than the SW average are located in the North East Triangle Functional Zone. Employment – The employment rate is 70% for BME individuals compared to 78% for all people. This performance is better than that of England, with 59% and 75% respectively. Only 51% of the region’s Pakistani and Bangladeshi population are in employment.
Disabilities Population – 18% of the working age population are classified as disabled and 14% have a disability that impacts on their ability to work. Employment and Economic Activity – 61% of working age disabled people in the South West were classified as economically active, compared to 55% nationally and 80% for all people. There are sub-regional differences in economic activity rates ranging from 74% in South Gloucestershire to 49% in Torbay. In addition to Torbay the three local authorities with the lowest level of economic activity for working age disabled people are

103
the urban areas of Plymouth (51%), Bournemouth (52%) and Bristol (53%). Sexual Orientation
Limited data is available outside of the Stonewall and treasury nationally agreed estimate that 5% to 7% of the UK population is gay or lesbian. This figure does not include bisexual and transgender people.
Religion/ belief
Data collected by the 2001 Census indicates that the South West has a higher proportion of Christians than England (74% of all people compared to 72% for England) and a lower proportion of people from other religions (1.5% in the South compared to 6% across England). It is not possible to make a clear distinction between those identifying themselves as Christian and members of other religions. Against some indicators some religious groups outperform their Christian and non-religious counterparts (such as the proportion employed in senior positions).
Gender Across many of the indicators, the women within the South West are performing comparatively well compared to the performance of women nationally. However, the performance of women within the region still lags, sometimes significantly, behind that of men, and these headline figures hide wide intra-regional disparities. Closing this gender gap across the South West and beyond will generate significant capacity related benefits to the national and regional economies. The Women and Work Commission was set up in 2004 to examine the issues surrounding the gender pay gap. It found that the pay gap within Britain is among the worst in Europe, with full time women earning 17% less than men, and the figure falling to 38% for part-time employees. The Commission estimate that the national economy loses £23bn per annum due to women’s skills being lost or under utilised74. Employment The level of participation within the South West is higher for both male and females, however the region still exhibits an employment gender gap, with only 74% of working age females being employed, compared to 81% of males. Since 2001, the gender gap has narrowed with female employment increasing at a faster than average rate, and this pace of change is faster than that seen nationally; however this is due to a lower rate of employment growth for men, compared to nationally, rather than a faster than average female employment growth in the South West. In addition to the gap in overall employment figures, female employees are far more likely to work part-time; with almost 50% of female employees in the South West working part-time, compared to 10% of male employees. The incidence of part-time working among females is more common across the South West, compared to England as a whole; however this reflects a higher incidence of part-time working in the region generally. If it is the case that improvements to the female employment rate are achieved through employment growth in the low paid, low value added sectors of the economy, then this presents significant challenges moving forward. Closing the gender gap requires female representation to increase in higher valued added positions. These issues are further discussed in the wage and industrial structure sections below.
74 Equality South West, http://www.equalitysouthwest.org.uk/our-networks/gender/women-and-work-commission-work.html

104
Total Employment by Part Time / Full Time Employees and Gender (000s), 2006
Males Females Total FT (%) PT (%) Total FT (%) PT (%) Total FT (%) PT (%) Total England 90.70% 9.30% 12,384 58.40% 41.50% 10,357 76.00% 23.90% 22,741 South West 89.80% 10.20% 1,246 51.90% 48.10% 1,060 72.40% 27.60% 2,307 Cornwall IoS 88.40% 11.40% 120 47.70% 52.30% 100 69.90% 30.00% 220 Devon 87.30% 12.70% 258 48.10% 51.90% 224 69.10% 30.90% 482 Dorset & Somerset 89.50% 10.50% 292 51.50% 48.50% 247 72.10% 27.90% 539 GWNS 91.30% 8.70% 576 54.80% 45.20% 490 74.50% 25.50% 1,066
Source: Annual Population Survey
Employment Structure Female employees are most heavily represented in the service sector, accounting for more than 60% of total employment in the ‘health and social work’, education, and ‘hotels and restaurants’ sectors. In line with the findings above, females are over-represented in part-time positions across all sectors, in particular the education, ‘hotels and restaurants’, and the ‘wholesale and retail trade…’ sectors. South West Employment by Gender and Sector, 2005
% of All Employees % of Full-Time Employees Male Female Males Female N: Health and social work 16.3% 83.7% 25.0% 75.0% M: Education 28.4% 71.6% 42.1% 57.9% H: Hotels and restaurants 39.8% 60.2% 52.3% 47.7% J: Financial intermediation 42.7% 57.3% 48.7% 51.3% G: Wholesale and retail trade… 45.6% 54.4% 64.4% 35.6% O: Other community, social, personal… 47.7% 52.3% 58.9% 41.1% K: Real estate, renting & bus’ act’ 50.9% 49.1% 60.2% 39.8% L: Public admin and defence… 55.2% 44.8% 62.4% 37.6% E: Electricity, gas and water supply 72.2% 27.8% 74.9% 25.1% A: Agriculture, hunting and forestry 73.2% 26.8% 78.5% 21.5% D: Manufacturing 74.4% 25.6% 78.9% 21.1% I: Transport, storage, communication 74.7% 25.3% 80.7% 19.3% B: Fishing 75.1% 24.6% 92.8% 7.2% F: Construction 87.1% 12.9% 93.0% 7.0% C: Mining and quarrying 89.0% 11.0% 91.6% 8.4%
Source: Annual Business Enquiry
Occupational Structure The patterns of employment by occupation are provided in the table below. At this headline level, a number of the patterns fall in line with the general gender stereotypes, for example:
• Female employment is over-represented in ‘sales and customer service’ and ‘administrative and secretarial’ occupations; and
• Male employment is over-represented in skilled trades occupations and ‘process, place and machine operatives’.
These patterns provide examples of broad sections of the economy where employment is associated with gender and may highlight areas in which participation among males or females may be promoted.
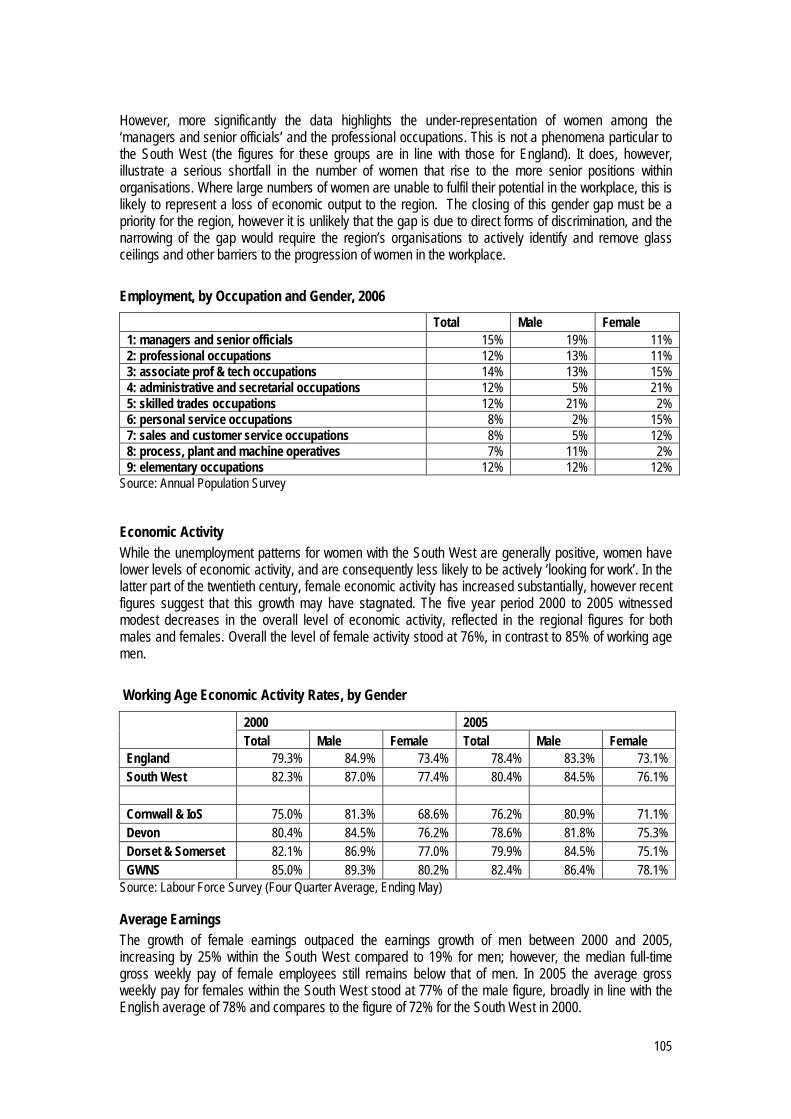
105
However, more significantly the data highlights the under-representation of women among the ‘managers and senior officials’ and the professional occupations. This is not a phenomena particular to the South West (the figures for these groups are in line with those for England). It does, however, illustrate a serious shortfall in the number of women that rise to the more senior positions within organisations. Where large numbers of women are unable to fulfil their potential in the workplace, this is likely to represent a loss of economic output to the region. The closing of this gender gap must be a priority for the region, however it is unlikely that the gap is due to direct forms of discrimination, and the narrowing of the gap would require the region’s organisations to actively identify and remove glass ceilings and other barriers to the progression of women in the workplace. Employment, by Occupation and Gender, 2006
Total Male Female 1: managers and senior officials 15% 19% 11% 2: professional occupations 12% 13% 11% 3: associate prof & tech occupations 14% 13% 15% 4: administrative and secretarial occupations 12% 5% 21% 5: skilled trades occupations 12% 21% 2% 6: personal service occupations 8% 2% 15% 7: sales and customer service occupations 8% 5% 12% 8: process, plant and machine operatives 7% 11% 2% 9: elementary occupations 12% 12% 12%
Source: Annual Population Survey
Economic Activity While the unemployment patterns for women with the South West are generally positive, women have lower levels of economic activity, and are consequently less likely to be actively ‘looking for work’. In the latter part of the twentieth century, female economic activity has increased substantially, however recent figures suggest that this growth may have stagnated. The five year period 2000 to 2005 witnessed modest decreases in the overall level of economic activity, reflected in the regional figures for both males and females. Overall the level of female activity stood at 76%, in contrast to 85% of working age men. Working Age Economic Activity Rates, by Gender
2000 2005 Total Male Female Total Male Female England 79.3% 84.9% 73.4% 78.4% 83.3% 73.1% South West 82.3% 87.0% 77.4% 80.4% 84.5% 76.1% Cornwall & IoS 75.0% 81.3% 68.6% 76.2% 80.9% 71.1% Devon 80.4% 84.5% 76.2% 78.6% 81.8% 75.3% Dorset & Somerset 82.1% 86.9% 77.0% 79.9% 84.5% 75.1% GWNS 85.0% 89.3% 80.2% 82.4% 86.4% 78.1%
Source: Labour Force Survey (Four Quarter Average, Ending May)
Average Earnings The growth of female earnings outpaced the earnings growth of men between 2000 and 2005, increasing by 25% within the South West compared to 19% for men; however, the median full-time gross weekly pay of female employees still remains below that of men. In 2005 the average gross weekly pay for females within the South West stood at 77% of the male figure, broadly in line with the English average of 78% and compares to the figure of 72% for the South West in 2000.
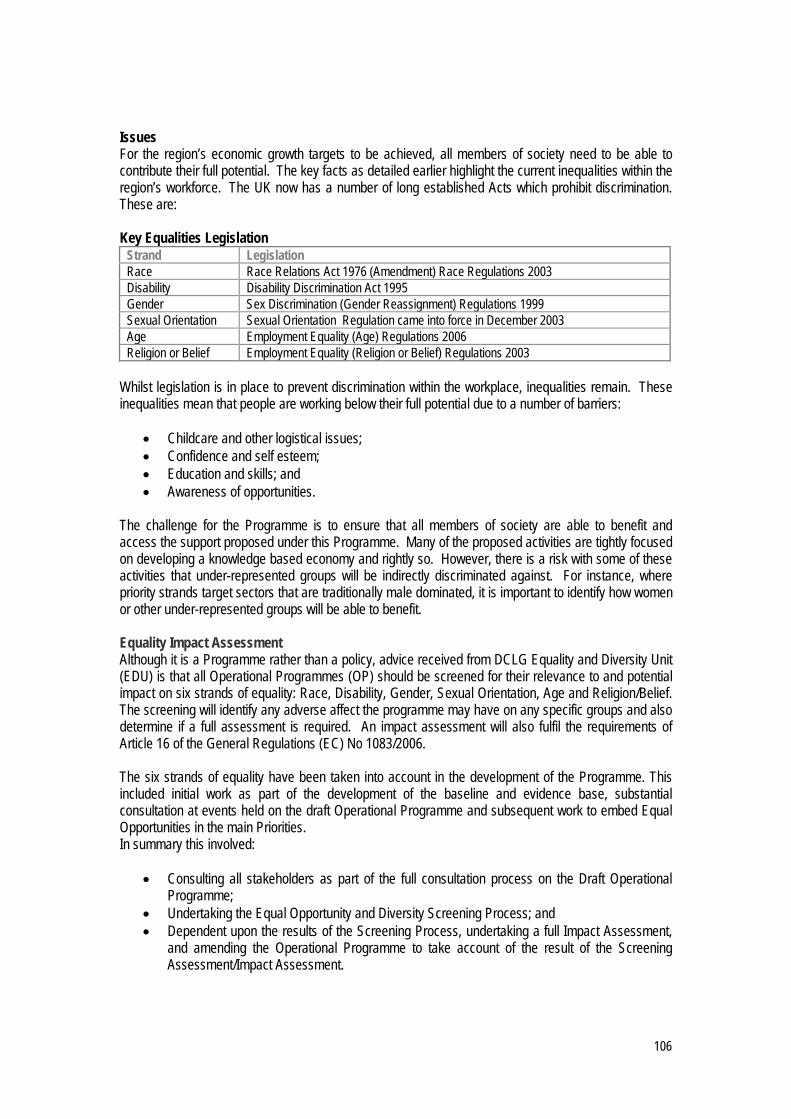
106
Issues For the region’s economic growth targets to be achieved, all members of society need to be able to contribute their full potential. The key facts as detailed earlier highlight the current inequalities within the region’s workforce. The UK now has a number of long established Acts which prohibit discrimination. These are: Key Equalities Legislation
Strand Legislation Race Race Relations Act 1976 (Amendment) Race Regulations 2003 Disability Disability Discrimination Act 1995 Gender Sex Discrimination (Gender Reassignment) Regulations 1999 Sexual Orientation Sexual Orientation Regulation came into force in December 2003 Age Employment Equality (Age) Regulations 2006 Religion or Belief Employment Equality (Religion or Belief) Regulations 2003
Whilst legislation is in place to prevent discrimination within the workplace, inequalities remain. These inequalities mean that people are working below their full potential due to a number of barriers:
• Childcare and other logistical issues; • Confidence and self esteem; • Education and skills; and • Awareness of opportunities.
The challenge for the Programme is to ensure that all members of society are able to benefit and access the support proposed under this Programme. Many of the proposed activities are tightly focused on developing a knowledge based economy and rightly so. However, there is a risk with some of these activities that under-represented groups will be indirectly discriminated against. For instance, where priority strands target sectors that are traditionally male dominated, it is important to identify how women or other under-represented groups will be able to benefit. Equality Impact Assessment Although it is a Programme rather than a policy, advice received from DCLG Equality and Diversity Unit (EDU) is that all Operational Programmes (OP) should be screened for their relevance to and potential impact on six strands of equality: Race, Disability, Gender, Sexual Orientation, Age and Religion/Belief. The screening will identify any adverse affect the programme may have on any specific groups and also determine if a full assessment is required. An impact assessment will also fulfil the requirements of Article 16 of the General Regulations (EC) No 1083/2006. The six strands of equality have been taken into account in the development of the Programme. This included initial work as part of the development of the baseline and evidence base, substantial consultation at events held on the draft Operational Programme and subsequent work to embed Equal Opportunities in the main Priorities. In summary this involved:
• Consulting all stakeholders as part of the full consultation process on the Draft Operational Programme;
• Undertaking the Equal Opportunity and Diversity Screening Process; and • Dependent upon the results of the Screening Process, undertaking a full Impact Assessment,
and amending the Operational Programme to take account of the result of the Screening Assessment/Impact Assessment.

107
The results of this work are included in a technical annex to the Operational Programme. The results of the Screening Process have been fully incorporated into this cross cutting theme and to each of the Priorities and can be summarised as:
The Programme is unlikely to have any negative impacts on any of the target groups; benefits are likely to be neutral or positive, with the focus of Priority 3 enterprise in disadvantaged communities likely to provide support to a number of groups identified in the earlier analysis.
Positive benefits are not automatic in terms of Priority 1 and 2. To ensure the maximum benefits, steps are required to ensure the take up of key services, requiring a pro-active approach.
While Priority 3 has considerable potential with regard to women and black and minority ethnic communities, concerted action will be needed to raise confidence, increase take up of services and provide on-going support.
Barriers faced by groups included childcare and logistical issues of accessing services, low levels of confidence and self esteem amongst some groups; and lack of awareness of opportunities.
These factors have influenced the development of objectives and targets set for the Cross Cutting Theme. Objectives The objectives for the Programme will be to:
Increase the number of people from under-represented groups owning their own business. Increase the take-up of employment by under-represented target groups. Increase the number of people in under-represented groups accessing employment in higher
skilled occupations and sectors where they are currently under-represented. Ensure that business support is inclusive and responsive to the needs of all communities and
under-represented groups. Increase the participation of people from under-represented groups in the management and
implementation structures of the programme. It is important that partnerships, selection panels and other administrative groups are representative at all levels and positive steps are taken to gain the active involvement of under-represented groups.
In order to ensure that the Cross Cutting Theme is implemented successfully, the fowling arrangements will be put in place: an Equality and Diversity Advisor in place at the beginning of the programme; an Equalities Advisory Group to provide specialist support; a comprehensive and robust data collection system; specific equalities training for everyone involved with the management and implementation process, including partners and project appraisers and robust and inclusive monitoring and evaluation systems. In addition stakeholders will work with the Regional Equalities Networks and Equality South West to continually improve the evidence base, identify best practice and where necessary introduce new actions to ensure that the Cross Cutting Theme is successfully intergraded in to the implementation of the Operational Programme. Monitoring Monitoring will be an important tool in delivering the equality objectives. The programme monitoring strategy will include a section on cross cutting theme evaluation and training by specialist advisors will be provided to ensure that monitoring officers have the capacity to effectively monitor and record cross cutting theme activity and data. This will include the collation of best practice case studies. Actions by Priority Axis The table below highlights the key equality issues identified under each Priority Axes and the proposed response to these actions.

108
Key Issues and Response by Priority Axis
Priority Axis
Issue Response
There is a risk that supporting ideas, innovation and knowledge activity will be interpreted as only applying to the technical/engineering type companies which are traditionally male dominated.
Activities must encompass the whole intellectual property spectrum. Promotional and marketing needs to target knowledge based service enterprises, and a broad range of occupations, not just those with technical skills. Emphasis on creativity as well as technology.
Innovation and Knowledge
Inventors, entrepreneurs and other target groups have a lower proportion of women and other under-represented groups.
Need to ensure all marketing is inclusive, and explicitly address reaching target groups. Accessibility of services and support needs to be addressed by project sponsors, in terms of physical access, facilities and support for childcare, and reducing any impression that services are for a limited group of companies or people.
Women and disadvantaged groups are less likely to start their own business.
Target activities at women and under-represented groups taking account of specific barriers to the take up of opportunities.
New starts in the knowledge intensive and high-growth areas are more likely to be male dominated.
Ensure opportunities are focussed on knowledge based businesses, not just productive business based on technology. Promote factors such as creativity. Target activities at women and under-represented groups taking account of specific barriers to the take up of opportunities.
Some of the environmental technologies sectors are male dominated.
Target activities at women and under-represented groups taking account of specific barriers to the take up of opportunities.
Enterprise and Growth
Some groups may have barriers to the take up of new employment opportunities.
Promote the benefits of under represented groups to business beneficiaries. Assist those employers who want to help groups access employment opportunities. Link companies to ESF support to help groups take up opportunities.
Access to facilities Facilities need to be in the right location, fully accessible and community driven. Services need to be available at times which suit the needs of local residents, including those with care responsibilities.
Urban Enterprise
Overcoming barriers to accessing business support by disadvantaged groups
Target activities at women and under-represented groups taking account of specific barriers to the take up of opportunities, including mentoring support which addresses issue of low confidence and self esteem. Develop services which take account of specific issues such as access to finance for those on low incomes, particularly single parent households.
The following indicative targets have been set for Equal Opportunities and Diversity, taking account of provisional indicators set out in the draft Quantification Framework for ERDF prepared by CLG. These are likely to be further revised and the Programme will develop additional indicators where appropriate.

109
ERDF Indicators Target Number Number of persons from under represented groups1 assisted in starting a business 20% of all persons assisted Number of women assisted in starting a business2 40% of all persons assisted Proportion of Programme Committee and sub committee members who are women 50% of Committee members 1Defined as people from a black and minority ethnic background, people with a disability, residents of disadvantaged communities. 2 Women are under-represented in business ownership, in terms of owning a majority of the business

110
7.2 Environment Introduction The UK Government has made a commitment in the NSRF to treating environmental sustainability as a cross-cutting theme for all future Structural Funds Programmes. This will include integrated strategies for addressing environmental concerns and respecting the principles of sustainable development. In line with the Government’s sustainable development strategy, the programme will address this cross cutting theme through two perspectives:
1. Recognising the potential impact of economic policies on the environment - In the context of the Structural Funds Programmes, environmental sustainability means that whilst achieving their social and economic goals, projects should minimise their environmental impact and enhance environmental opportunities and benefits.
2. Recognising the potential economic benefit that environmental policies can bring - The effective integration of cross cutting themes into the programmes can help deliver a more competitive, dynamic and innovative regional economy by embracing and responding to the economic opportunities that environmental integration and social inclusion provide. Experience gained from such integration in the current Objective 2 programme has shown what the concept of the environment as a key driver of economic growth looks like in practice, this being a primary reference point in the development of the environment driver concept (discussed in the Socio-Economic Baseline). The Competitiveness Programme will continue to place the environment as an economic driver at the centre of its strategy. The role of the environment as a key economic driver is illustrated below.
Driving a low carbon economy
Increase Carbon literacy
Overcome market failure
Accelerate technological change
This chapter outlines the key environment issues facing the region, the objectives for the Programme in addressing these issues, how they will be monitored and key actions by Priority needed to address these issues. Key Facts The South West has one of the highest quality and most varied environments in the United Kingdom, and is the largest and most rural region in England, with many diverse and special landscapes. As noted earlier, the State of the Environment in the South West 2006 report shows that, although much of the region’s environment shows steady improvement, there are many pressures on the environment

111
that are cause for concern. The South West faces a number of threats to its environment. These include:
The South West could potentially have the highest increase in sea level rise in Great Britain as a result of climate change
The South West has the highest number of journeys made by car, the 2nd highest increase in traffic volume and some of the least accessible bus services in England;
Annual population growth is above the English average. The majority of the region’s environment remains in good quality, although under pressure. Over the last decade, there have been significant improvements in water quality as well as in the condition of some of the region’s key wildlife sites. In terms of impact on the global atmosphere, the South West has the second lowest total carbon dioxide emissions in England. The results of increased drives to reduce, re-use and recycle waste in the region are beginning to be seen, with a continued reduction in the amount of waste being sent to landfill and the second highest recycling rate in England. Lifestyles and livelihoods depend on reducing the pressures on the region’s environment as well as maintaining the existing high quality. Issues The Regional Economic Strategy outlines a vision setting out where the South West wants to go. This vision recognises that the quality of the region’s physical and cultural environment is central to providing a high quality of life for everyone. One of the region’s aims is to show that economic growth can be secured within environmental limits to bring prosperity to the region. Many enterprises and organisations in the region are already demonstrating how this can be achieved. They are showing the profitability and efficiency gains to be made through more sustainable business practices. This approach is consistent with the national Sustainable Development Strategy and the regional Sustainable Development Framework. It is recognised that more work will need to be done to define what this means for regional businesses and the regional economy as a whole. Over the next three years, the region will research and debate key issues around sustainable development so that the next RES can set clear objectives and targets in terms of operating within environmental limits. In the meantime, the region is committed to meeting, and if possible exceeding, the national targets for CO2 emissions and renewable energy generation. The South West Competitiveness Programme will both build on the foundations created by the Objective 2 Programme and reflect the commitment above. A study undertaken for Defra 75 found that the approach taken to environmental integration in the Objective 2 Programme was one of the more successful in the country. As such it is the intention to remain at the forefront and the South West Competitiveness Programme will seek to demonstrate best practice in delivery and reflect the commitment in the RES in relation to environmental limits. The Programme will be a pilot for a low carbon approach to regional development and will invest in the drivers of a low carbon economy. The delivery of this Programme provides an opportunity to show how this might be achieved, through testing methodologies for reducing carbon emissions at both a project and Programme level. Objectives The South West Competitiveness Programme shares the regional environmental objectives identified in the Integrated Regional Strategy76, namely:
To maintain and enhance the region’s high quality environments and cultural activity, and access to them;
75 The Effectiveness of EU Structural Funds in Delivering the Government’s Environmental Objectives; Fraser Associates for DEFRA, October 2005 76 Just Connect, An Integrated Regional Strategy for the South West 2004-2026
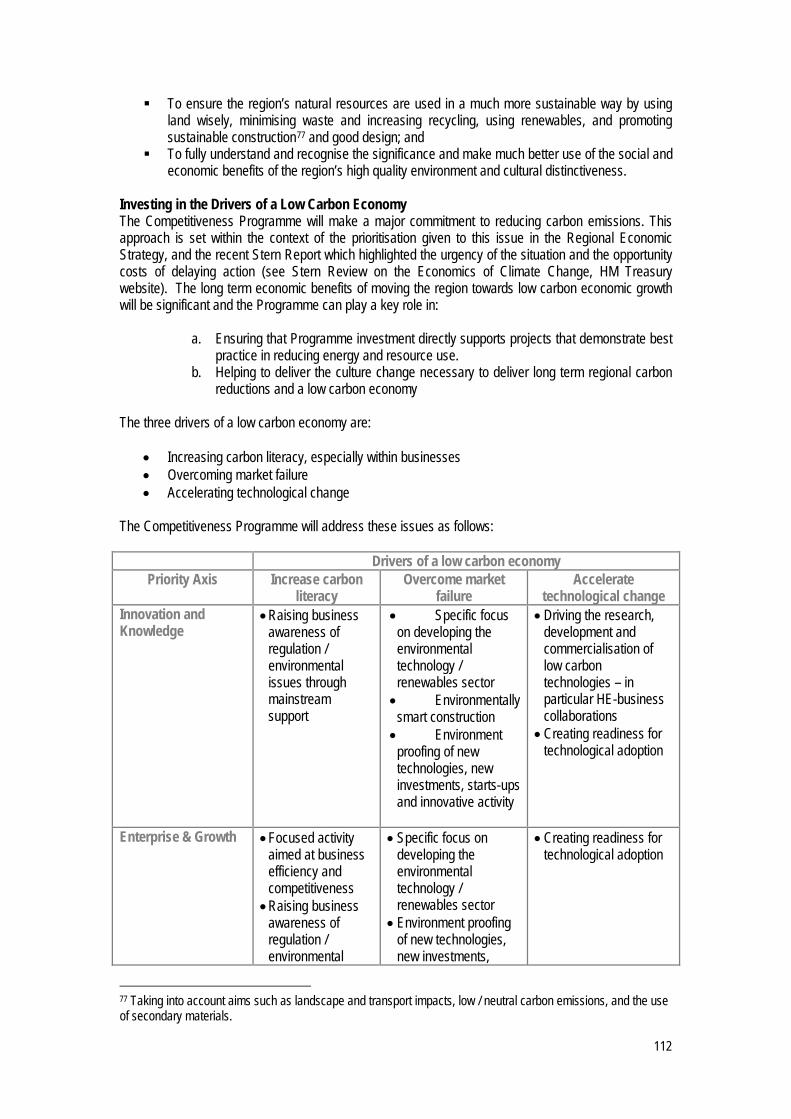
112
To ensure the region’s natural resources are used in a much more sustainable way by using land wisely, minimising waste and increasing recycling, using renewables, and promoting sustainable construction77 and good design; and
To fully understand and recognise the significance and make much better use of the social and economic benefits of the region’s high quality environment and cultural distinctiveness.
Investing in the Drivers of a Low Carbon Economy The Competitiveness Programme will make a major commitment to reducing carbon emissions. This approach is set within the context of the prioritisation given to this issue in the Regional Economic Strategy, and the recent Stern Report which highlighted the urgency of the situation and the opportunity costs of delaying action (see Stern Review on the Economics of Climate Change, HM Treasury website). The long term economic benefits of moving the region towards low carbon economic growth will be significant and the Programme can play a key role in:
a. Ensuring that Programme investment directly supports projects that demonstrate best practice in reducing energy and resource use.
b. Helping to deliver the culture change necessary to deliver long term regional carbon reductions and a low carbon economy
The three drivers of a low carbon economy are:
• Increasing carbon literacy, especially within businesses • Overcoming market failure • Accelerating technological change
The Competitiveness Programme will address these issues as follows:
Drivers of a low carbon economy Priority Axis Increase carbon
literacy Overcome market
failure Accelerate
technological change Innovation and Knowledge
• Raising business awareness of regulation / environmental issues through mainstream support
• Specific focus on developing the environmental technology / renewables sector • Environmentally
smart construction • Environment
proofing of new technologies, new investments, starts-ups and innovative activity
• Driving the research, development and commercialisation of low carbon technologies – in particular HE-business collaborations
• Creating readiness for technological adoption
Enterprise & Growth • Focused activity aimed at business efficiency and competitiveness • Raising business
awareness of regulation / environmental
• Specific focus on developing the environmental technology / renewables sector
• Environment proofing of new technologies, new investments,
• Creating readiness for technological adoption
77 Taking into account aims such as landscape and transport impacts, low / neutral carbon emissions, and the use of secondary materials.
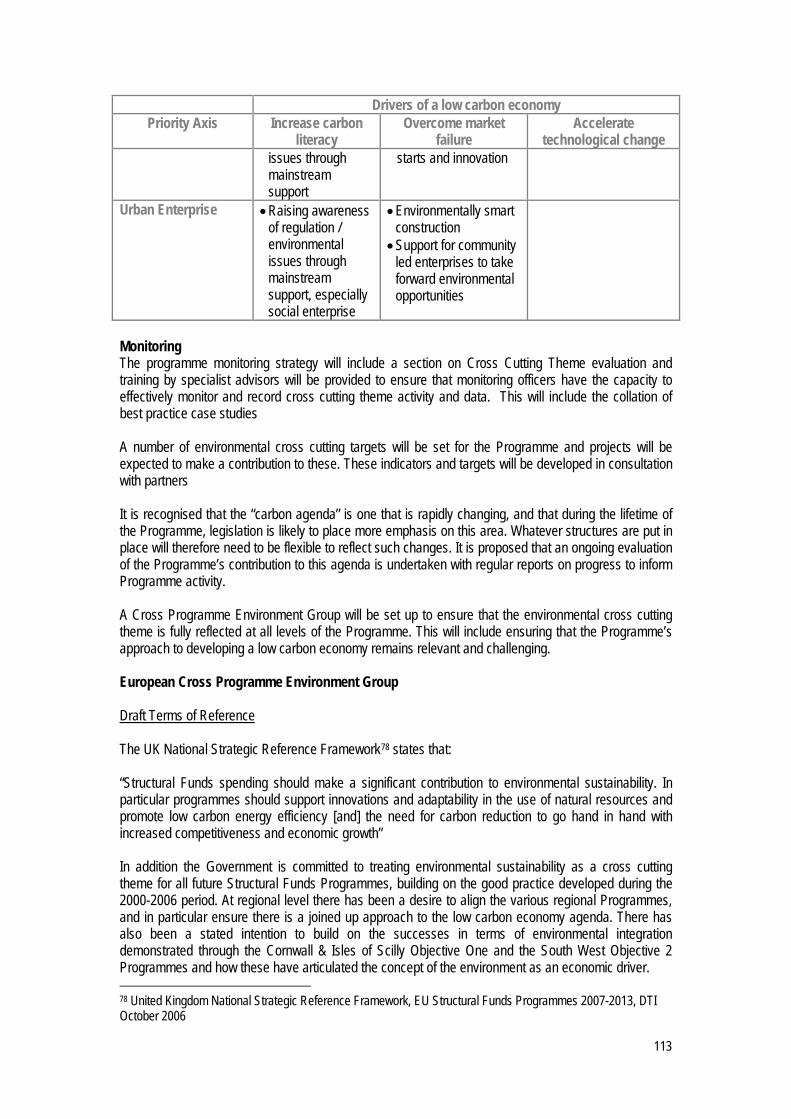
113
Drivers of a low carbon economy Priority Axis Increase carbon
literacy Overcome market
failure Accelerate
technological change issues through mainstream support
starts and innovation
Urban Enterprise • Raising awareness of regulation / environmental issues through mainstream support, especially social enterprise
• Environmentally smart construction • Support for community
led enterprises to take forward environmental opportunities
Monitoring The programme monitoring strategy will include a section on Cross Cutting Theme evaluation and training by specialist advisors will be provided to ensure that monitoring officers have the capacity to effectively monitor and record cross cutting theme activity and data. This will include the collation of best practice case studies A number of environmental cross cutting targets will be set for the Programme and projects will be expected to make a contribution to these. These indicators and targets will be developed in consultation with partners It is recognised that the “carbon agenda” is one that is rapidly changing, and that during the lifetime of the Programme, legislation is likely to place more emphasis on this area. Whatever structures are put in place will therefore need to be flexible to reflect such changes. It is proposed that an ongoing evaluation of the Programme’s contribution to this agenda is undertaken with regular reports on progress to inform Programme activity. A Cross Programme Environment Group will be set up to ensure that the environmental cross cutting theme is fully reflected at all levels of the Programme. This will include ensuring that the Programme’s approach to developing a low carbon economy remains relevant and challenging. European Cross Programme Environment Group Draft Terms of Reference The UK National Strategic Reference Framework78 states that: “Structural Funds spending should make a significant contribution to environmental sustainability. In particular programmes should support innovations and adaptability in the use of natural resources and promote low carbon energy efficiency [and] the need for carbon reduction to go hand in hand with increased competitiveness and economic growth” In addition the Government is committed to treating environmental sustainability as a cross cutting theme for all future Structural Funds Programmes, building on the good practice developed during the 2000-2006 period. At regional level there has been a desire to align the various regional Programmes, and in particular ensure there is a joined up approach to the low carbon economy agenda. There has also been a stated intention to build on the successes in terms of environmental integration demonstrated through the Cornwall & Isles of Scilly Objective One and the South West Objective 2 Programmes and how these have articulated the concept of the environment as an economic driver. 78 United Kingdom National Strategic Reference Framework, EU Structural Funds Programmes 2007-2013, DTI October 2006

114
In response to the above, the Terms of Reference have been drawn up to cover the role and remit of the European Cross Programmes Environment Group.
Membership Membership of the Group will comprise the following: SWERDA (chair) Natural England Environment Agency English Heritage GOSW SWRA The Met Office And appropriate environmental champions from the Programmes. In addition other organisations may be asked to contribute to the work of the group as and when required. Remit The group will provide both strategic and practical support and advice to the Managing Authority on all aspects of the development and delivery of the 2007-13 European Programmes. This will include (not exclusively):
• Imbedding environmental representation / expertise into EU Programmes • Integration of environmental sustainability principles into any Commissioning framework • The strategic development of a support / championing role • Development of appropriate environmental targets and indicators • Ensuring that strategic links between environmental integration and economic development are
consistently made • Ensuring appraisal and selection criteria incorporate the Programmes’ environmental
objectives • Ongoing strategic and operational advice
The group’s remit will cover the following:
Cornwall and Isles of Scilly Convergence Programme South West Competitiveness Programme South West RDPE Regional ESF Programmes
The group will also maintain links with EFF and the Regional Territorial Co-operation Group, and provide advice as appropriate. The group will also seek to share best practice in relation to both EU & non EU funded regional activity. Where appropriate specific specialist groups may be set up at Programme level. The Sustainable Development Strategy adopted by the European Council in June 2006 sets a policy framework for the work of the group, notably where it states that “in order to ensure that EU funding is used and channelled in the optimum way to promote sustainable development, Member States and the Commission should co-ordinate to enhance complementarities and synergies between various strands of Community and other co-financing mechanises, such as cohesion policy, rural development, Life+, Research and Technological Development (RTD) the Competitiveness and Innovation Programme, and the European Fisheries Fund” (Point 25).

115
SEA Statement Summary Table This table is also included in the updated Environmental Report which is submitted, together with the OP, to the European Commission.
Issue Raised by the SEA and Consultation
Response
Emphasise in the programme strategy that an important criteria in selection of activities will be the demonstration value of the activities proposed, in relation to environmental management as well as economic development.
The Commissioning approach will ensure that projects are delivered in the most efficient manner both through value for money etc criteria as well as ensuring positive or at a minimum mitigated environmental impacts. It is unlikely that EMS will be a prerequisite for funding but are likely to ensure that an EMS is developed as the project is implemented.
Adopt an overall aim of a moving towards a low carbon economy, rather than emphasising carbon neutrality.
This has been adopted this in the text of the Operational Programmes.
Improve the baseline understanding of the environmental sector as a priority.
Work has been commissioned to evaluate the support given to the environmental sector in the SW Objective 2 Programme, and to develop a greater understanding of the nature of the sector in the region. Target: Final report to be completed by June 2007 A small focus group will be convened to provide further advice on the specific needs of the environment sector Target: Group convened by June 2007
Put in place mechanisms to include an assessment of (and assistance with improving) environmental impacts in new products and in start-up and expanding businesses, as part of mainstream processes.
This will be considered when developing Innovation, FE/HE projects and proof of concept funding so that environmental implications of a process or product will be assessed alongside the concept development phase. Target: Project assessment / evaluation criteria to include this by autumn 2007.
Consider the opportunity to widen the focus of environmental management on sectors with the largest environmental impact, including those with higher ratios of carbon emissions to GVA.
An integrated business support service will be developed in the first year of the Programme. The targets for businesses undertaking environmental management will be developed on receipt of guidance from CLG. The intention is to set challenging targets.
Re-visit the targets for businesses undertaking environmental management so that they better reflect the aspirations set out in the text of the programme.
Targets have been revised.
Ensure that business efficiency services are developed early in the life of the Programme, seek to promote their integration into mainstream service delivery, and ensure flexibility of approach
Yes, this is envisaged an early project for the programme delivering in 2008, brokered through mainstream business support services.
Adopt BREEAM excellent as a minimum standard for new buildings, as proposed in the draft Programme
– All Construction projects should be carried out in accordance with the best practice principles set out in the OGC Achieving Excellence in Construction initiative. 2.5 – The appraisal of procurement options and the selection of the preferred project scheme must take into account of whole life value for money. 2.9 – Clients are to pay all monies due promptly and in

116
Issue Raised by the SEA and Consultation
Response
any event within the contractually required timescales. 3.2 – Clients are to have in place systems to collect and analyse health and safety performance data for all projects on which they have a duty of responsibility. 3.4 – Clients are to include within all their contracts involving construction that their scheme is registered with a suitable site management scheme such as the Considerate Constructors Scheme and to comply with the appropriate Code of Practice. 3.5 – Clients are required to include a contract clause requiring that all members of their supply teams who are workers or regular visitors to a construction site are registered on the Construction Skills Certification Scheme (CSCS) or are able to prove competence in some other appropriate way. 6.2 – An appropriate environmental assessment process such as BREEAM or CEEQUAL appropriate to the size, nature and impact of the project must be carried out on all projects with an excellent rating being the minimum acceptable standard. 6.4 – All timber or timber products including timber used for temporary works are to be purchased in accordance with the Governments timber policy. 6.5 – Any new procurement project must fall into the upper quartile of energy performance for the building type, except where specific operational requirements prevent this.
Consider specification of individual buildings in ways which increase the market for environmental technologies, taking into account aims such as landscape and transport impacts, low / neutral carbon, and use of secondary materials.
This will be achieved through ensuring BREEAM or equivalent compliance and will be part of the commissioning and appraisal of all build projects
Emphasise the opportunity for target regeneration areas to deliver social and economic benefits through environmental activity, particularly where linked to addressing the worklessness agenda.
The Urban Enterprise theme has a specific focus on stimulating local people, businesses and social enterprises to develop commercial opportunities with regard to environmental opportunities such as energy efficiency, waste minimisation and renewable energy. The ESF Framework will also promote such activity linked to worklessness.
Consider gathering and promoting examples of good practice from other regions to widen the range of activity in the SW
This will be done through transnational contacts, through Regions for Economic Change and between Regions in the UK and perhaps as importantly between Convergence and Competitiveness, and those funded through Domestic and other European Funds such as EAFRD. This will be one of the roles of a cross fund regional structure in the SW.
Include references in the Programme to the environmental benefits of local sourcing, particularly in relation to food and drink
Local sourcing is a regional priority outside of Competitiveness, but goes far beyond Food and Drink, to other sectors such as construction materials. This is
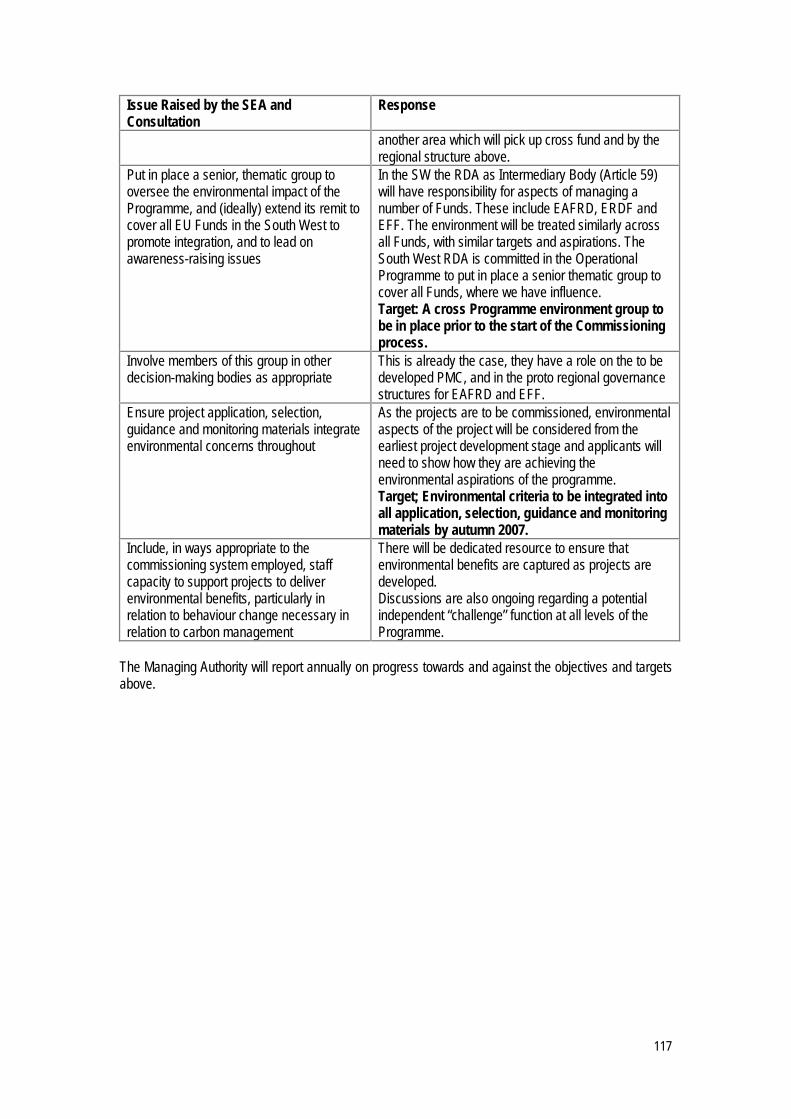
117
Issue Raised by the SEA and Consultation
Response
another area which will pick up cross fund and by the regional structure above.
Put in place a senior, thematic group to oversee the environmental impact of the Programme, and (ideally) extend its remit to cover all EU Funds in the South West to promote integration, and to lead on awareness-raising issues
In the SW the RDA as Intermediary Body (Article 59) will have responsibility for aspects of managing a number of Funds. These include EAFRD, ERDF and EFF. The environment will be treated similarly across all Funds, with similar targets and aspirations. The South West RDA is committed in the Operational Programme to put in place a senior thematic group to cover all Funds, where we have influence. Target: A cross Programme environment group to be in place prior to the start of the Commissioning process.
Involve members of this group in other decision-making bodies as appropriate
This is already the case, they have a role on the to be developed PMC, and in the proto regional governance structures for EAFRD and EFF.
Ensure project application, selection, guidance and monitoring materials integrate environmental concerns throughout
As the projects are to be commissioned, environmental aspects of the project will be considered from the earliest project development stage and applicants will need to show how they are achieving the environmental aspirations of the programme. Target; Environmental criteria to be integrated into all application, selection, guidance and monitoring materials by autumn 2007.
Include, in ways appropriate to the commissioning system employed, staff capacity to support projects to deliver environmental benefits, particularly in relation to behaviour change necessary in relation to carbon management
There will be dedicated resource to ensure that environmental benefits are captured as projects are developed. Discussions are also ongoing regarding a potential independent “challenge” function at all levels of the Programme.
The Managing Authority will report annually on progress towards and against the objectives and targets above.
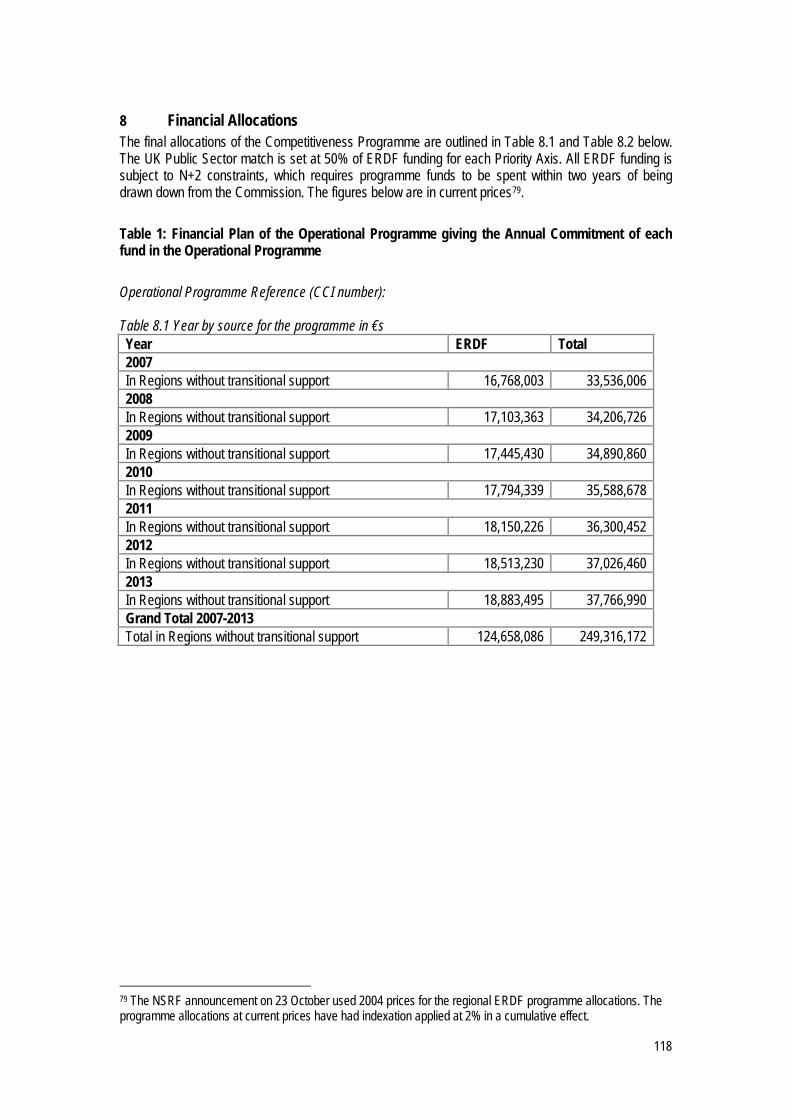
118
8 Financial Allocations The final allocations of the Competitiveness Programme are outlined in Table 8.1 and Table 8.2 below. The UK Public Sector match is set at 50% of ERDF funding for each Priority Axis. All ERDF funding is subject to N+2 constraints, which requires programme funds to be spent within two years of being drawn down from the Commission. The figures below are in current prices79. Table 1: Financial Plan of the Operational Programme giving the Annual Commitment of each fund in the Operational Programme Operational Programme Reference (CCI number): Table 8.1 Year by source for the programme in €s Year ERDF Total 2007 In Regions without transitional support 16,768,003 33,536,006 2008 In Regions without transitional support 17,103,363 34,206,726 2009 In Regions without transitional support 17,445,430 34,890,860 2010 In Regions without transitional support 17,794,339 35,588,678 2011 In Regions without transitional support 18,150,226 36,300,452 2012 In Regions without transitional support 18,513,230 37,026,460 2013 In Regions without transitional support 18,883,495 37,766,990 Grand Total 2007-2013 Total in Regions without transitional support 124,658,086 249,316,172
79 The NSRF announcement on 23 October used 2004 prices for the regional ERDF programme allocations. The programme allocations at current prices have had indexation applied at 2% in a cumulative effect.

119
Table 8.2: Financial Plan of the Operational Programme giving, for the whole programming period, the amount of the total financial allocation of each fund in the Operational Programme, the national counterpart and the rate of reimbursement by priority Axis Payments are made as reimbursements of expenditure actually paid out according to the following plan. Operational programme reference (CCI number): Priority axes by source of funding (in €000s)
Indicative Breakdown of the National Counterpart
For information
Community Funding (a)
National Counterpart (b) (=(c)+(d))
National Public Funding (c)
National Private Funding (d)
Total funding (e) (=(a)+(b))
Co-Financing rate (f) (=(a)/(e)) EIB
Contributors Other Funding
Priority Axis 1: Innovation and Research & Development 45,000,000 45,000,000 45,000,000 0 90,000,000 0.5 Priority Axis 2 Enterprise and Growth 45,000,000 45,000,000 45,000,000 0 90,000,000 0.5 Priority Axis 3 Urban Enterprise 30,000, 000 30,000,000 30,000,000 0 60,000,000 0.5 Priority Axis 4: Technical Assistance 4,658,086 4,658,086 4,658,086 9,316,172 0.5 Total 124,658,086 124,658,086 124,658,086 0 249,316,172 0.5

120
9 Co-ordination Complementarity with other Funds ERDF is one of four Funds which will operate in the South West during the 2007-2013 period. The other Funds are:
European Social Fund (ESF) European Agricultural Guidance and Guarantee Fund (EAFRD) European Fisheries Fund (EFF).
The use of resources from the European Regional Development Funds in England will need to be carefully managed, to prevent any overlap or duplication of funding, and to ensure complementarity and optimal value for money. It is essential that we avoid any double funding. Equally, we must avoid a situation in which a high quality project is unable to attract funding. This applies both to other domestic funding streams, and to the closely linked European funding streams. The ESF Framework for the South West The England and Gibraltar European Social Fund (ESF) Programme will contribute to the sustainable economic growth and social inclusions by extending employment opportunities and developing a skilled and adaptable workforce. The Operational Programme for England and Gibraltar establishes the national priorities for the programme period (2007-2013) in line with the Lisbon Agenda and the Government’s employment and skills strategies. Within these priorities the Regional ESF Framework for the South West sets out how ESF spending will support the region’s employment and skills priorities. There are three ESF Priorities relevant to the South West Competitiveness Areas80:
• Priority 1: Extending Employment Opportunities – through tackling barriers to work faced by disadvantaged groups, this priority will seek to increase employment, and reduce unemployment and inactivity;
• Priority 2: Developing a Skilled and Adaptable Workforce – will aim to develop a skilled and adaptable workforce by reducing the number of people without basic skills, increasing the number of people qualified to level 2 (and where justified, to level 3), reducing gender segregation in the workforce, and developing managers and workers in small enterprises; and
• Priority 3: Technical Assistance – funding under this priority will be available to finance the preparatory, management, monitoring, evaluation, information and control activities of the Operational Programme.
ESF Funds will target in particular:
• People who are unemployed or economically inactive, especially people with disabilities or health conditions, lone parents, older workers, and ethnic minorities;
• Young people Not in Education, Employment, and Training (NEETS) and at risk of becoming NEET; • People without a full, relevant level 2 qualification; • People without a full, relevant level 3 qualification in sectors where there are skills shortages at this
level, in small and medium sized enterprises (up to 250 employees), and for women and ethnic minorities in sectors and occupational areas where they are under-represented;
• Women and men who want training to enter non-traditional occupations and sectors; and • Managers and workers in small enterprises (up to 50 employees).
In addition there will be scope for:
• Supporting some higher level skills (above level 3), where there is market failure, in order to support the skills strategy; and
80 A separate ESF Framework has been developed for the Cornwall and Isles of Scilly Convergence Area.
121
• Training provision to address skills gaps and the current and future skills needs of business. The support made available under ESF Priority 2 includes management and leadership training for companies with less than 50 employees, addressing skills shortages, and up-skilling of the workforce. This ESF funded activity will complement the Enterprise and Growth Priority where support will be provided to help companies grow their businesses. Many growth plans will include a skills dimension, and ERDF and ESF will work together to accelerate business plans. There are likely to be close links between targeted support under ESF Priority 1, aimed at disadvantaged groups, and Priority 3 Urban Enterprises. ESF support will be targeted at those distant from the labour market, seeking to make individuals more employment ready, with improved basic skills. This is likely to increase the pool of potential residents able to take up self employment and enterprise opportunities. European Agricultural Fund for Rural Development (EAFRD) and the European Fisheries Fund (EFF) The National Strategic Reference Framework set out the European Agricultural Fund for Rural Development (EAFRD) and the European Fisheries Fund (EFF):
• EAFRD will focus on supporting diversification of rural economies at the local level. This will include interventions which support farm diversification and woodland enterprises; supporting the growth of micro enterprises, and improving skills and employment opportunities, where support is not available from elsewhere.
• The European Fisheries Fund will support the overall aims of fisheries management – a fishing
sector that is sustainable, supports strong local communities, and managed as part of a set of coherent policies for the marine environment. This will include promoting investment in innovation, ensuring environmental best practice and developing supply chains.
The European Regional Development Fund (ERDF), and European Fisheries Fund (EFF) all share common objectives with the European Agricultural Fund for Rural Development (EAFRD). Each fund is guided by the cross cutting principles of Lisbon and Gothenburg agendas of strong economic growth coupled with the sustainable use of natural resources. To ensure all European Programmes are aligned and delivery is better co-ordinated there will be a move towards a more strategic investment approach within the region, with a more proactive approach to the development of projects to deliver Programme objectives. The South West principles for aligning European funding are as follows:
• Measurable added value: resources do not replace mainstream funding, or support activity for which other sources of funding are more appropriate.
• Transparency: duplication of funding is avoided. Systems can guide the beneficiary to the most appropriate source of funding
• Co-ordination: funding is coordinated at a regional, sub-regional and local level to provide maximum impact.
The following table summarises the priorities for the different European funding streams available in rural areas in England over the 2007-2013 Programming period:

122
ERDF (Competitiveness and Employment Regions)
EAFRD ESF EFF
To promote innovation and knowledge transfer To stimulate enterprise and support successful business To ensure sustainable development, production and consumption To build sustainable communities
To build profitable, innovative and competitive farming, food and forestry sectors, that meet the needs of consumers and make a net positive contribution to the environment To improve the environment and countryside To enhance opportunity in rural areas, in a way that harnesses and builds upon environmental quality To mobilise the development potential of rural areas in a way that stimulates innovation to the benefit of the local area
Extending employment opportunities by tackling barriers to work faced by people who are unemployed or disadvantaged in the labour market Developing a skilled and adaptable workforce by training people who lack basic skills and good qualifications
To provide a long-term sustainable future for the fishing industry through promoting investment in innovation and technology To promote environmental best practice in the fisheries sector To tackle social exclusion and promote long-term prosperity in communities traditionally dependent on the fishing industry where this support cannot be provided elsewhere
Complementarity and demarcation between ERDF, EAFRD and EFF England’s Regional Development Agencies will deliver the ERDF, and the socio-economic elements of the RDPE (with the exception of the Regional Development Agency for London, which does not receive any EAFRD support). The Regional Development Agencies will ensure coherence in the day to day management of the socio-economic support under the RDPE and the ERDF. They will ensure that work carried out at the regional level under the two funds is complementary, and robust project development and selection processes will ensure that any duplication is avoided. Administrative arrangements are in place to ensure complementarity and co-ordination, for example, common secretariats; exchange of personnel on regional management committees; exchange of information from databases. The RDAs will also be required to work closely with the Leader groups to ensure demarcation on the ground. These processes begin with the clear establishment of demarcation criteria at the regional level. In the South West region we are considering an overarching body with representatives of all the Funds Governance Structures whose role will be to ensure alignment and demarcation. Project applications and local development strategies will be required to demonstrate how proposals align with other programmes and funding within a given area. This includes implementing provisions to ensure that measures supported under Competitiveness do not duplicate those funded by EAFRD and ESF in particular. The table below sets out the way in which this will be delivered in the South West.

123
Complementarities and proposed demarcation criteria Field of activity ERDF focus EAFRD focus EFF focus Priority Axis 1: Innovation and Knowledge Supporting ideas, innovation and knowledge
This strand focuses on company led innovation, product and process improvements. This will include innovation diagnostic services, access to innovation centres, support for the management and development of Intellectual Property Rights and its exploitation. Support will not be provided on specialist and technical subjects specific to agriculture, food and drink linked to primary food and drink producers, forestry and the fisheries sectors.
Focus on specialist and technical subjects specific to agriculture, food and drink linked to primary food and drink producers and the forestry sectors Targeting skills and knowledge transfer which are needed to grow or re-structure the business, operate best practice in environmental and resource management, and vocational skills
Focus on specialist and technical subjects specific to the fisheries sector Focused on businesses employing less than 50 people
Improving FE/HE interactions with SMEs
This strand will support new dissemination methods and routes to businesses through the use of Further Education institutions and increasing collaboration between HEI and HE/FE. Support will not be provided on specialist and technical subjects specific to agriculture, food and drink linked to primary food and drink producers, forestry and the fisheries sectors.
Focus on specialist and technical subjects specific to agriculture, food and drink linked to primary food and drink producers and the forestry sectors Targeting skills and knowledge transfer which are needed to grow or re-structure the business, operate best practice in environmental and resource management, and vocational skills
Focus on specialist and technical subjects specific to the fisheries sector Focused on businesses employing less than 50 people
Developing specialist infrastructure for innovation and research and development
This strand is technology led, and will provide a series of technology initiatives based on proven business demand and expertise within HEIs. Focus will be on technologies where there are clear opportunities for pull through into businesses and on SMEs in supply chains to access knowledge and quickly apply new technologies to increase innovation and build competitiveness, increase business-HE collaboration; and increase commercial exploitation of the knowledge base. Support will not be provided on specialist and technical
Focused on collaborative groups of land based businesses Innovations and the adoption of new technologies focused on the agricultural, forestry and food and drink business sectors linked to primary production
Focus on specialist and technical subjects specific to the fisheries sector Focused on businesses employing less than 50 people

124
Field of activity ERDF focus EAFRD focus EFF focus subjects specific to agriculture, food and drink linked to primary food and drink producers, forestry and the fisheries sectors.
Environmental Goods and Services
Activities will focus on sub-sectors where the South West has a competitive advantage and to develop actions to accelerate growth. Support will be provided to increase business expenditure on research and development through providing grants and small funds for exploring potential of new ideas relating to the environmental technologies and renewable energy. Support will not be provided on specialist and technical subjects specific to agriculture, food and drink linked to primary food and drink producers, forestry and the fisheries sectors.
Adding value and developing the supply chain for the forestry sector Focused on sector needs which drive growth, re-structuring and environmental good practice for the following sectors
• Land based • Forestry • Food and drink • Non food crops
linked to primary production
Focus on specialist and technical subjects specific to the fisheries sector Focused on businesses employing less than 50 people
Priority Axis 2: Enterprise and Growth High Growth Businesses and Accelerating Business Growth
Focus on the quality of new starts and supporting business with growth potential and in knowledge based sectors. This strand will provide targeted business support, aimed at key sectors, networks, business clusters and niches, and actions to address weaknesses which inhibit growth. Support will not be provided on specialist and technical subjects specific to land based businesses. No support will be provided for rural diversification
Focused on rural social enterprises Focused on business support for diversifying land based businesses (agriculture, horticulture and forestry) to broaden the economic base (Generally not High Growth)
Focus on specialist and technical subjects specific to the fisheries sector Focused on businesses employing less than 50 people
Internationalisation Focussed on increasing capacity of businesses to participate fully in international markets, with the objective of building a more outward facing SME community and significantly increasing turnover from exports.
No EAFRD activity envisaged
Focus on specialist and technical subjects specific to the fisheries sector Focused on businesses employing less than 50 people

125
Field of activity ERDF focus EAFRD focus EFF focus Support will not be provided on specialist and technical subjects specific to land based businesses
Environmental performance in business and Environmental Efficiency
Focus on advice and support to companies to save costs and improve competitiveness through increased environmental performance and developing new business opportunities relating to changing environmental standards. Support will not be provided on specialist and technical subjects specific to agriculture or other land based businesses
Focused on improving the resource efficiency of agricultural businesses. No activity beyond land based businesses
Focus on specialist and technical subjects specific to the fisheries sector Focused on businesses employing less than 50 people
Environmental Goods and Services
Focus on activities to support new and existing businesses in the environmental technologies sector by developing markets through demand stimulation, providing access to finance, and specialist business support beyond land based businesses. Support will not be provided on specialist and technical subjects specific to land based businesses
Adding value and developing the supply chain for the forestry sector Focused on sector needs which drive growth, re-structuring and environmental good practice for land based businesses in the agriculture, horticulture and forestry sectors
Focus on specialist and technical subjects specific to the fisheries sector Focused on businesses employing less than 50 people
Priority Axis 3: Urban Enterprise Small scale infrastructure and facilities
Activity limited to specific urban areas – parts of Bristol, Plymouth and Torbay
N/A – geographical demarcation with no EAFRD activity in the urban areas
Consideration on demarcation with EFF will take place alongside consultation on the national EFF Operational Programme.
Promoting and encouraging the creation of new enterprises/social enterprises within under-represented groups
Activity limited to specific urban areas – parts of Bristol, Plymouth and Torbay
N/A – geographical demarcation with no EAFRD activity in the urban areas
Consideration on demarcation with EFF will take place alongside consultation on the national EFF Operational Programme.
Access to targeted business support services in the community
Activity limited to specific urban areas – parts of Bristol, Plymouth and Torbay
N/A – geographical demarcation with no EAFRD activity in the urban areas
Consideration on demarcation with EFF will take place alongside consultation on the national EFF Operational Programme.
Innovative models Activity limited to specific N/A – geographical Consideration on

126
Field of activity ERDF focus EAFRD focus EFF focus for access to employment, enterprise and training initiatives
urban areas – parts of Bristol, Plymouth and Torbay
demarcation with no EAFRD activity in the urban areas
demarcation with EFF will take place alongside consultation on the national EFF Operational Programme.
EAFRD, EFF and ERDF will be segregated by type of business and type of support, in line with the above table. Companies eligible for business support activities through EAFRD and EFF will not be allowed to access similar types of support under ERDF; for example farm and forestry and fisheries businesses will not be eligible for certain services especially under the Priority Axis 1: Innovation and Knowledge as they already have this provided by Axis 1: Competitive Farming and Forestry in the EAFRD, and by Axis 2 of EFF. Axis 3 of EAFRD on Rural development, works with geographically targeted Community Led Development and will target traditionally low performing sectors such as food and drink and tourism. These are not the target groups for Axis 2 of Competitiveness which will target high growth businesses, and Axis 3 which is aimed at the urban communities of Bristol, Plymouth and Torquay. Mechanisms The region may use the mechanism JEREMIE (Joint European Resources for Micro to Medium Enterprises) - using resources from the Operational Programme and if appropriate the European Investment Fund (EIF). JESSICA (Joint European Support for Sustainable Investment in City Areas) is an optional facility offering Member States and Managing Authorities the possibility to allocate funds from Operational Programmes to Urban Development Funds or Holding Funds. This approach may be adopted in the UK and the South West. Links between the Competitiveness and Convergence Programmes Cornwall and the Isles of Scilly, in the far west of the region, has benefited from an Objective One Programme, which in spite of significant investment and some notable successes, continues to lag behind other regions. A Convergence Programme funded by ERDF will operate between 2007 and 2013. There are close links between the west of Devon and east Cornwall and south east Cornwall and Plymouth. There are a number of strands of activity which are relevant to the two Programmes, including renewable energy and environmental technologies, innovation and enterprise. It will be important that businesses in Cornwall and the Isles of Scilly are part of regional networks and collaborative activities. There is a strong commitment to ensuring complementarity and the alignment of activities across the Programmes. There are considerable opportunities for collaboration between the two Programmes. These are summarised below: Innovation Encouraging participation in regional knowledge and innovation networks.
Developing joint ventures and partnerships across the region. Promoting knowledge assets in Cornwall to businesses in the wider region. Environmental technologies and renewable energy – developing region wide networks.
Enterprise Encouraging participation in regional business and trade groups. Developing joint ventures and partnerships across the region, particularly with regard to internationalisation of trade. Environmental technologies and renewable energy – developing collaborative ventures, shared market research.
Procedures will be put in place to ensure that there is an awareness of planned interventions, and the potential for collaborative and complementary actions are prioritised in the delivery phase.
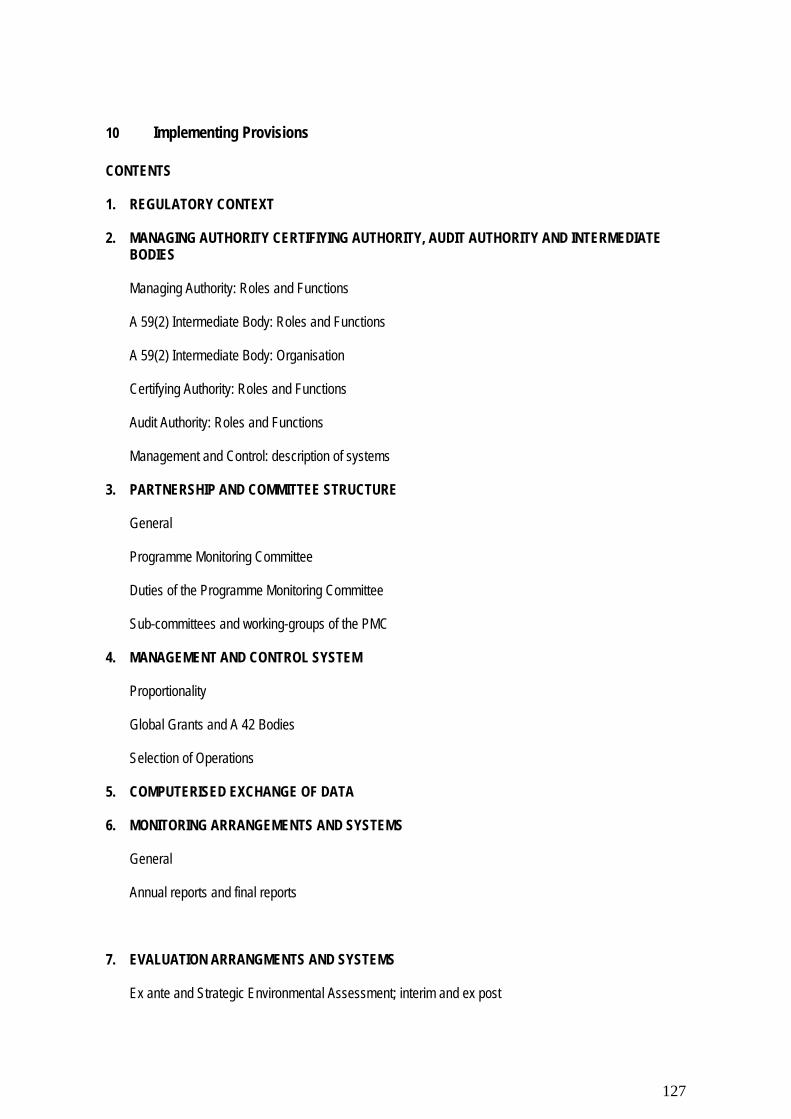
127
10 Implementing Provisions CONTENTS 1. REGULATORY CONTEXT 2. MANAGING AUTHORITY CERTIFIYING AUTHORITY, AUDIT AUTHORITY AND INTERMEDIATE
BODIES Managing Authority: Roles and Functions A 59(2) Intermediate Body: Roles and Functions A 59(2) Intermediate Body: Organisation Certifying Authority: Roles and Functions Audit Authority: Roles and Functions Management and Control: description of systems
3. PARTNERSHIP AND COMMITTEE STRUCTURE
General Programme Monitoring Committee Duties of the Programme Monitoring Committee Sub-committees and working-groups of the PMC
4. MANAGEMENT AND CONTROL SYSTEM
Proportionality Global Grants and A 42 Bodies Selection of Operations
5. COMPUTERISED EXCHANGE OF DATA 6. MONITORING ARRANGEMENTS AND SYSTEMS
General Annual reports and final reports
7. EVALUATION ARRANGMENTS AND SYSTEMS
Ex ante and Strategic Environmental Assessment; interim and ex post

128
8. FINANCIAL IMPLEMENTATION
Financial contributions by the Funds Differentiation of rates of contribution Technical Assistance Community budget commitments De-commitments
9. FINANCIAL FLOWS AND PAYMENTS
General Financial Flows Payments Use of Euro and conversion rates
10. FINANCIAL MANAGEMENT AND CONTROL ARRANGEMENTS
General Organisation Accounting Systems Documentation Audit Irregularities and Financial Corrections
11. INFORMATION AND PUBLICITY 12. SUPPLEMENTARY OBJECTIVES
Sustainable Development Gender equality and equal opportunities Major projects Complementarity with other Funds European Social Fund European Agricultural Fund for Rural Development

129
13. USE OF RESERVES
National Performance Reserve National Contingency Reserve
14. FINANCIAL ENGINEERING 15. STATE AID

130
SOUTH WEST ENGLAND ERDF REGIONAL COMPETITIVENESS AND EMPLOYMENT OPERATIONAL PROGRAMME - 2007/13
IMPLEMENTING PROVISIONS
1. REGULATORY CONTEXT In accordance with the requirements of Article 37(1)(g) of Council Regulation (EC) No 1083/06 of 11 July 2006, this chapter sets out the implementation provisions for South West European Regional Development Fund Regional Competitiveness and Employment Operational Programme (“the OP”).
These have been developed taking into account the requirements of Council Regulation (EC) No 1083/06, which lays down general provisions about the Structural Funds; Council Regulation (EC) No 1080/06, which lays down specific provisions about the types of activity that may be financed by the European Regional Development Fund; and Commission Regulation (EC) No 1828/2006, which sets out rules for the implementation of the Council Regulations. The implementing provisions will be subject to revision where necessary to reflect any subsequent regulations adopted by the Council or the Commission concerning the ERDF. All articles quoted in the text are those of Council Regulation (EC) No. 1083/06, except where otherwise stated. In the event that the implementing provisions are found on any point to be inconsistent with any provision of the Structural Funds Regulations, the meaning or effect of the Regulations shall prevail.
2. MANAGING AUTHORITY, CERTIFYING AUTHORITY, AUDIT AUTHORITY, AND INTERMEDIATE BODIES Managing Authority: Role and Functions A system of management and control of the implementation of the OP will be set up in accordance with Article 58.
The Managing Authority (MA), whose functions are set out in Article 60, is responsible for managing and implementing the OP in accordance with the principle of sound financial management and the requirements of the Structural Funds Regulations.
The MA for the OP is the Secretary of State for Communities and Local Government (SSCLG). The address is Eland House, Bressenden Place, London SW1E 5DU, England, United Kingdom. The functions of the MA not entrusted to an intermediate body will be carried out by officials of the Department of State headed by SSCLG (the Department for Communities and Local Government) who administer European policy and programmes, presently entitled European Policy and Programmes Division, under the responsibility of SSCLG.
A 59(2) Intermediate Body: Roles and Functions Article 59(2) authorises the Member State to designate one or more intermediate bodies to carry out some or all of the tasks of the managing or certifying authority under the responsibility of that authority. The Secretary of State, for the UK Government, proposes to designate a single intermediate body (hereafter referred to as the A 59(2) body) for the OP. The A 59(2) body is South West of England Regional Development Agency which is a regional development agency established and regulated by the Regional Development Agencies Act 1998.
The tasks of the MA to be entrusted to the A 59(2) body are, subject to the reservation of specified functions for performance by the MA (as set out on page 7), all of the functions specified in Article 60, namely:

131
(a) ensuring that operations are selected for funding in accordance with the criteria applicable to the OP and that they comply with applicable Community and national rules for the whole of their implementation period;
(b) verifying that the co-financed products and services are delivered and that the expenditure declared by the beneficiaries for operations has actually been incurred and complies with Community and national rules; verifications on-the-spot of individual operations may be carried out on a sample basis in accordance with the detailed rules to be adopted by the Commission in accordance with the procedure referred to in Article 103(3);
(c) ensuring that there is a system for recording and storing in computerised form accounting records for each operation under the OP and that the data on implementation necessary for financial management, monitoring, verifications, audits and evaluation are collected;
(d) ensuring that beneficiaries and other bodies involved in the implementation of operations maintain either a separate accounting system or an adequate accounting code for all transactions relating to the operation without prejudice to national accounting rules;
(e) ensuring that the evaluations of OPs referred to in Article 48(3) are carried out in accordance with Article 47;
(f) setting up procedures to ensure that all documents regarding expenditure and audits required to ensure an adequate audit trail are held in accordance with the requirements of Article 90;
(g) ensuring that the certifying authority receives all necessary information on the procedures and verifications carried out in relation to expenditure for the purpose of certification;
(h) guiding the work of the monitoring committee and providing it with the documents required to permit the quality of the implementation of the OP to be monitored in the light of its specific goals
(i) drawing up and, after approval by the monitoring committee, submitting to the Commission the annual and final reports on implementation;
(j) ensuring compliance with the information and publicity requirements laid down in Article 69;
(k) providing the Commission with information to allow it to appraise major projects.
The A 59(2) body will be responsible for providing a secretariat function to make administrative arrangements for the performance of the MA tasks and to assist the PMC. The A 59(2) body will carry out MA tasks in accordance with the management and control system established under Article 58 and guidance and directions issued by the MA. The MA will provide suitable training to the A 59(2) body. The A 59(2) body will also be responsible for ensuring that revenue generating projects are supported in accordance with Art 55.
Concerns about the performance of functions by the A 59(2) body, whether relating to the standard of performance or other matters, may be addressed in various ways. The MA will be empowered to issue directions relating to the exercise of the MA functions. Directions may require functions to be exercised in a specified manner or place restrictions on the way in which they are carried out.

132
The Secretary of State, for the UK Government, may withdraw the A 59(2) body’s designation as an intermediate body, taking back full responsibility for the performance of MA tasks, or may vary the allocation of tasks (taking back or changing the scope of specified tasks). The Secretary of State may entrust tasks to a different body designated under Article 59(2). The Secretary of State will consult the A 59(2) body before deciding to take such steps and will inform the Commission of the action that has been taken. The UK Government will ensure that the system of management and control and all other management and control documents, which govern the relationship between the MA and the A 59(2) body, are amended as appropriate to reflect any changes to the role of the A 59(2) body and that the Commission is notified of the amendments. The MA will consult the A 59(2) body before issuing directions and guidance on matters relating to the performance of intermediate body functions. The MA tasks not entrusted to the A 59(2) body (reserved by the Member State for performance by the MA) are tasks that can only be carried out by a national authority or on an inter-regional (England only) basis, particularly because they involve the coordination of matters requiring uniform practice for OPs or communication at national level with the Commission. The reserved tasks include:
i. providing guidance and instruction, as appropriate, on the interpretation of the rules and criteria contained in the Structural Funds Regulations and in documents issued by the Commission over the programming period in relation to the ERDF;
ii. providing the contractual terms on which ERDF support is to be given, including, where relevant,
state aid advice;
iii. determining and issuing national eligibility rules;
iv. providing guidance and instruction, as appropriate, on the management and control framework, accountancy rules to be followed by grant beneficiaries and others involved in with the implementation of operations, systems to be used for the maintenance of accounts and the other records, information and publicity requirements, including monitoring, and any other matters relating to the management and of the OP as necessary;
v. establishing written standards and procedures for verifications undertaken by the A 59(2) body in
compliance with Article 13.2 of Commission Regulation 1828/2006, and ensuring that the A 59(2) body keeps records for each verification, stating the work performed, the date and the results of the verification, and the measures taken in respect of the irregularities detected thereby, and obtaining assurance that the monitoring and verification activities are adequately carried out in accordance with that Regulation;
vi. prescribing the information to be provided to the Certifying Authority in relation to expenditure
verification and verification procedures, the form in which this information is to be provided and how frequently it is to be provided;
vii. appointing the Chair of the Programme Monitoring Committee (PMC) and being a member of the
PMC; viii. receiving evaluations, annual and final implementation reports and submitting them to the
Commission;

133
ix. assisting as necessary with policy and technical support for the appraisal of major projects and the notification required for appraisal by the Commission;
x. laying down and operating a mechanism for the payment of ERDF resources;
xi. ensuring that where, in the exercise of functions entrusted to it as an intermediate body, the A59(2)
body has awarded grant for one of its own projects, resulting in the RDA becoming the final beneficiary, ensuring that the A59(2) body takes such steps to cease, suspend, reduce or recover ERDF funding as it would be expected to take if the grant beneficiary were a separate third party.
A description of the systems covering in particular the organisation and procedures of the MA, Certifying Authority and the A 59(2) body as well as the Audit Authority will submitted in accordance with Article 71 using Annex XII to Commission Regulation 1828/2006. A 59(2) Intermediate Body: Organisation The A 59(2) body will make its own administrative arrangements for the performance of the MA tasks, taking account of guidance issued by the MA. The principle of separation of functions will be adhered to in accordance with Article 58(b). In managing the OP, the A 59(2) body will be required to have due regard to potential conflicts of interest and a procedure for ensuring that they are avoided. The procedure will be detailed in the management and control system which will be submitted to the Commission in accordance with Article 71 of Council Regulation 1083/2006 and Article 21 of Commission Regulation 1828/2006 using the model template set out in Annex XII to Commission Regulation 1828/2006. The A 59(2) Body may exercise the functions entrusted to it by awarding funding to itself, as final beneficiary. The principle of separation of functions, in accordance with Article 58, will be adhered at each stage of the procedure as in the case of any other applicant for funding. Certifying Authority: Role and Functions The Certifying Authority (CA) for the OP is the Secretary of State for Communities and Local Government. The address is Eland House, Bressenden Place, London SW1E 5DU, England, United Kingdom. The functions of the CA will be carried out by officials of the Department of State headed by SSCLG (the Department for Communities and Local Government), who work in the Department’s Finance Directorate. These administrative arrangements for the performance of the CA tasks will ensure that the principle of separation of functions is adhered to in accordance with Article 58(b).
The CA is responsible for certifying the accuracy of statements of expenditure and applications for payment presented to the Commission in accordance with the procedures set out in Article 78. The specific tasks of the CA are as follows:
a) drawing up and submitting to the Commission certified statements of expenditure and applications for payment;
b) certifying that:
i) the statement of expenditure is accurate, results from reliable accounting systems and is based on verifiable supporting documents;
ii) the expenditure declared complies with applicable Community and national rules and has been
incurred in respect of operations selected for funding in accordance with the criteria applicable to the OP and complying with Community and National rules;
c) ensuring for the purposes of certification that it has received adequate information from the MA on the
procedures and verifications carried in relation to expenditure included in statements of expenditure;

134
d) taking account for certification purposes of the results of all audits carried out by or under the responsibility of the Audit Authority;
e) maintaining accounting records in computerised form of expenditure declared to the Commission; f) keeping an account of amounts recoverable and of amounts withdrawn following cancellation of all or part
of the contribution for an operation. Amounts recovered will be repaid to the general budget of the EU, prior to closure of the OP by deducting them from the next statement of expenditure.
Audit Authority: Roles and Functions The Audit Authority (AA) for the OP is the Secretary of State for Communities and Local Government. The address is Eland House, Bressenden Place, London SW1E 5DU, England, United Kingdom. The functions of the AA will be carried out by officials of the Department of State headed by SSCLG (the Department for Communities and Local Government) who audit the public expenditure of the Department under the responsibility of SSCLG and who work in a separate unit within the Department’s finance directorate from those performing CA tasks. The functional independence of the audit services will ensure that the principle of separation of functions is adhered to in accordance with Article 58(b). The AA is responsible for verifying the effective functioning of the management and control system. The specific tasks of the AA are as follows:
a) ensuring that audits are carried out to verify the effective functioning of the management and control system of the OP;
b) ensuring audits are carried out on operations on the basis of an appropriate sample to verify
expenditure declared; c) presenting to the Commission within 9 months of the approval of the OP an audit strategy
covering the bodies who will perform the audits referred to under points a) and b), the method to be used, the sampling method for audits on operations and the indicative planning of audits to ensure that the main bodies are audited and that audits are spread evenly throughout the programming period; [note: where a common system applies to several OPs, a single audit strategy may be submitted ];
d) by 31 December each year from 2008 to 2015:
i) submitting to the Commission an annual control report setting out the findings of audits carried out during the previous 12 month period ending on 30 June of the year concerned in accordance with the audit strategy of the OP and reporting any shortcomings found in the systems for management and control of the programme. The first report to be submitted by 31 December 2008 will cover the period from 1 January 2007 to 30 June 2008. The information concerning the audits carried out after 1 July 2015 will be included in the final control report supporting the closure declaration referred to in point (e);
ii) issuing an opinion, on the basis of the controls and audits that have been carried out
under its responsibility, as to whether the management and control system functions effectively, so as to provide a reasonable assurance that statements of expenditure presented to the Commission are correct and as a consequence reasonable assurances that the underlying transactions are legal and regular.
iii) submitting, where applicable under Article 88, a declaration for partial closure assessing
the legality and regularity of the expenditure concerned;

135
[ Note: when a common system applies to several OPs, the information referred to in point (i) may be grouped in a single report, and the opinion and declaration issued under points (ii) and (iii) may cover all the OPs concerned ];
e) submitting to the Commission at the latest by 31 March 2017 a closure declaration assessing the validity of the application for payment of the final balance and the legality and regularity of the underlying transactions covered by the final statement of expenditure, which will be supported by a final control report.
Where audits and controls are carried out by a body other than the AA, the AA will ensure that such bodies have the necessary functional independence from the Article 59(2) body. The AA may choose to employ private sector auditors to carry out system and operation audits under its responsibility. Management and Control: description of systems The AA will be responsible for drawing up the report and the opinion referred to in Article 71(2), describing and assessing the management and control systems and giving an opinion on their compliance with Article 58 to 62. 3. PARTNERSHIP AND COMMITTEE STRUCTURE General The OP has been developed and will be implemented in accordance with the principles of partnership set out in Article 11 and national rules and practice. The partnership principle will be operated throughout the lifetime of the OP. The Secretary of State, for the UK Government, has organised a partnership to cover the preparation of the OP with a wide variety of national, regional and local authorities and bodies, which are competent to contribute towards the aims, objectives and contents of the OP. Competent authorities and bodies include: (a) regional, local, urban and other public authorities; (b) economic and social partners; (c) any other suitable bodies representing civil society, environmental partners, non-governmental organisations; (d) bodies responsible for promoting equality between men and women. Programme Monitoring Committee (PMC) In accordance with Article 63, the Member State will set up a PMC within three months from the date of the notification to the Member State of the Commission decision approving the OP. The membership and role of the PMC will reflect the strategic nature of the prescribed tasks of the PMC set out in Article 65. Reflecting the principle of partnership, the membership of the PMC will be drawn from representatives of the bodies of the regional partnership organised under Article 11. It will, therefore, reflect national, regional, local and sectoral interests in the OP, and will aim to be balanced in terms of gender. On its own initiative, or at the request of the PMC, the Commission may participate in an advisory capacity. Where the European Investment Bank or the European Investment Fund are contributing to the OP, they may be represented in an advisory capacity. The MA will have a representative as a member of the PMC. A particular role of the MA representative will be to advise and guide the PMC on compliance with the regulatory requirements in delivering the OP and on any other aspects of implementing the programme.

136
The MA representative will also have a role in informing the PMC about relevant Government Policy and in reporting to Ministers as appropriate on how the strategy, priorities and activities of the OP are contributing to wider Government policies. The chairperson of the PMC will be the Regional Director of the Government Office for the South West. The Chair will approve all PMC minutes and papers before they are distributed to the PMC members for agreement. Duties of the Programme Monitoring Committee The PMC will draw up and agree its own Rules of Procedure. These procedures will be publicised and made available on the programme website. The MA will issue guidance to Article 59(2) bodies on governance issues, including drawing up rules of procedure. The MA representative, as a member of the PMC, will have a role in ensuring that the rules of procedure are robust, are designed to ensure delivery and contain all appropriate checks and balances.
At its first meeting the PMC will approve detailed provision for the proper and efficient discharge of the duties assigned to it, including, the frequency of its meetings and procedures to deal with conflicts of interest. This will be contained within the PMC’s Rules of Procedure. The PMC will satisfy itself as to the effectiveness and the quality of the implementation of the OP. To this end the PMC will carry out the tasks set out in Article 65.
The MA will approve the rules of procedure in accordance with Article 63(2).
Sub-committees and working groups of the PMC Reflecting its agreed terms of reference and rules of procedure, the PMC may at any time set up such sub-committees or working groups or other groups as it thinks appropriate to enable it to fulfil its responsibilities (e.g. geographically, sectorally or thematically based). The PMC may delegate any of its tasks to a sub-committee or working group. The membership of sub-committees and groups will be agreed by the PMC, reflecting the partnership principle set out in Article 11. The terms of reference and rules of regional sub-committees and groups will be approved by the PMC in accordance with Article 63(2). The use of sub-committees does not absolve the PMC from its responsibility for the proper performance of its tasks as set out in Article 65. 4. MANAGEMENT AND CONTROL SYSTEM The Secretary of State, for the UK Government, will establish management and control arrangements for the OP in accordance with Article 58. This will ensure that Community funds are used efficiently and correctly and that assistance is managed in accordance with all applicable Community rules and in accordance with the principles of sound financial management. The detailed requirements set out in the Structural Funds Regulations will be observed throughout the period of the OP. The Secretary of State will consult the A 59(2) body about the details of the management and control system, which will meet the requirements of Article 58. The AA will assess the system and give an opinion on compliance with Articles 58, 59 and 60 prior to its submission to the Commission in accordance with Article 71. The organisation structures for ensuring sound management and control are set out below. Diagram 1 illustrates the structure at a global level. Diagram 2 illustrates the separation of functions with the Department for Communities and Local Government. Diagram 3 illustrates the separation of functions with the Regional Development Agency.
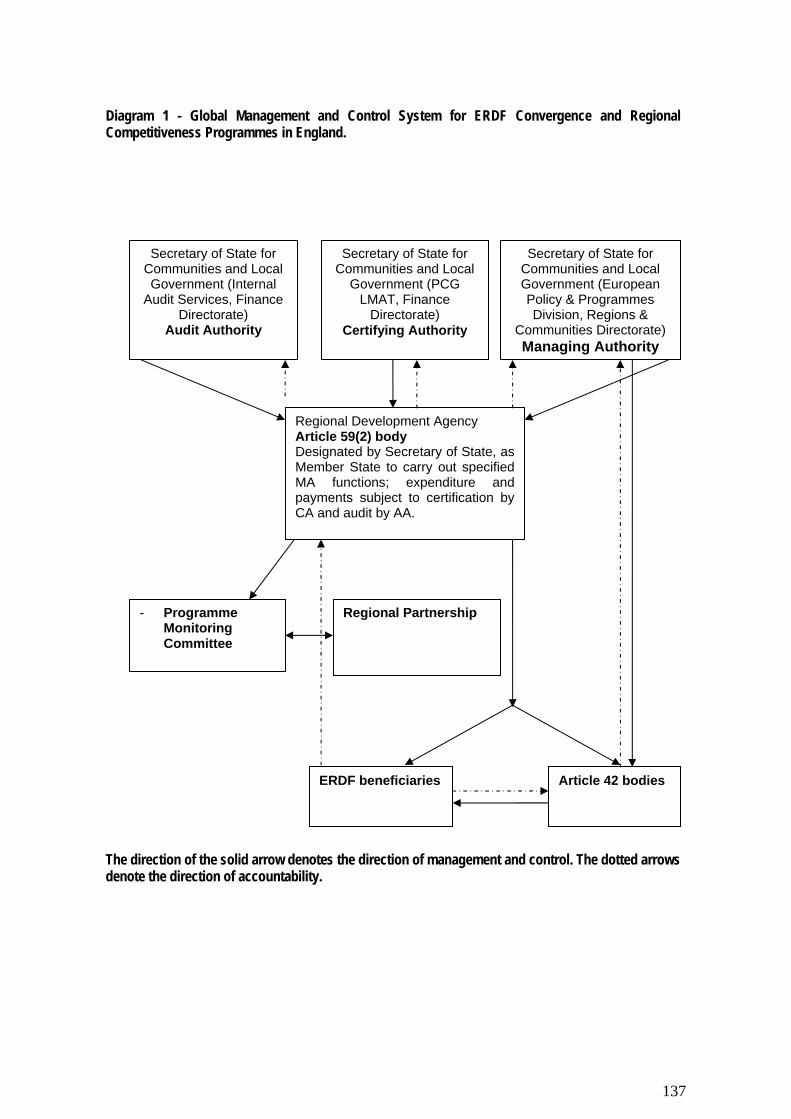
137
Diagram 1 - Global Management and Control System for ERDF Convergence and Regional Competitiveness Programmes in England.
The direction of the solid arrow denotes the direction of management and control. The dotted arrows denote the direction of accountability.
Secretary of State for Communities and Local Government (Internal
Audit Services, Finance Directorate)
Audit Authority
Secretary of State for Communities and Local Government (European Policy & Programmes Division, Regions &
Communities Directorate) Managing Authority
Regional Development Agency Article 59(2) body Designated by Secretary of State, as Member State to carry out specified MA functions; expenditure and payments subject to certification by CA and audit by AA.
Regional Partnership
- Programme Monitoring Committee
Secretary of State for Communities and Local
Government (PCG LMAT, Finance
Directorate) Certifying Authority
Article 42 bodies ERDF beneficiaries

138
Diagram 2 - Separation of functions with the Department for Communities and Local Government (The direction of the arrows denotes reporting lines) THE SECRETARY OF STATE, FOR THE
UK GOVERNMENT, DEPARTMENT FOR COMMUNITIES & LOCAL GOVERNMENT
MANAGEMENT BOARD
MANAGING AUTHORITY
European Policy and Programmes Division (EPPD), Regions &
Communities Directorate (RCD)
Regional
Development Agencies
RDAs
CERTIFYING AUTHORITY
Places & Communities Group Local Management
Accounting Team (PCG LMAT), Finance Directorate (FD)
AUDIT AUTHORITY Internal Audit Service (IAS),
Finance Directorate (FD)

139
Diagram 3 - Separation of functions within the South West Regional Development Agency.
Director of Performance & Planning
Paying Beneficiaries
Verification ofBeneficiary Claims
Authorisation ofBeneficiary Claims
of Offer Letters
Director of
Monitoring
Head of CorporateProgrammes
Registering &
Declarationof Expenditure
Head of Finance
of Offer LettersReview
& Prog. SecretariatProject Development,
Proposal, DeliveryHead of
Monitoring
Article 13
Finance
Head of BusinessExcellence
Communicatons
Executive Director
Resourcesof
ChiefExecutive
of Operations & of Enterprise &Executive Director Executive Director Executive Director
of Strategy &
Preparationof Offer Letters Appraisal
Development Innovation
Director of European Programmes
Project
Cross Cutting themes
Signing

140
Proportionality The proportional control arrangements set down in Article 74 will not apply to the OP. Global Grants The Member State or the MA may entrust the management and implementation of a part of an OP to one or more intermediate bodies (A 42 bodies), designated by the Member State or the MA, including local authorities, regional development bodies or non-governmental organisations, in accordance with the provisions of an agreement concluded between the Member State or the MA and that body. The Secretary of State, for the UK Government, does not have any intention, at present, to designate any A 42 body for the OP. Such a designation will be without prejudice to the financial responsibility of the MA and of the Member State. The MA may consider designating an A 42 body on its own initiative, but would not make a designation without first consulting the A 59(2) body. Otherwise, a body will be considered by the MA for designation under Article 42 on the recommendation of the A 59(2) body and the PMC. If the A 59(2) body wishes to recommend any such designation, it will first:
(a) assess the following matters for each body or organisation proposed for the management of a global grant:
its solvency;
its competence in selecting and monitoring operations of the types to be covered by the global grant;
the robustness of its management and control arrangements and its competence in financial and administrative management;
(b) propose text for the agreement to be concluded by the MA with each A 42 body, making the designation and detailing the matters specified in Article 43 (which include the types of operation covered by the global grant; the outcomes and outputs to be achieved by the global grant; and management and financial controls set within the overall management and control system for the OP).
In considering whether to designate a body under Article 42, the MA will take account of all such matters and the guarantees about solvency and competence provided by the body or organisation itself to demonstrate compliance with Article 42(2). The MA will provide reasons for a decision not to designate a body or organisation proposed for the management of a global grant. If the MA decides to designate a body under Article 42, it will conclude an agreement with that body. The provisions of the agreement will detail the matters specified in Article 43. They will be finalised after full consideration of the text prepared by the A 59(2) body and after consultation with the A 59(2) body about any points that arise from that text or any other matters arising. The MA may revoke the designation of an A 42 body according to the terms of the agreement. As the designation of an A 42 body is the responsibility of the MA, it will not involve any sub-delegation of responsibility by the A 59(2) body. The functions entrusted to the A 59(2) body for the delivery of the OP will exclude functions relating to operations so far as they are entrusted to a body under Article 42. Instead, the A 59(2) body will exercise some or all of the tasks of the MA in relation to global grants, which will be detailed in the Article 42 agreement and will relate, in particular, to monitoring, evaluating and ensuring financial control of the global grant. For these purposes, it may be appropriate for the A 59(2) body to record and regulate administrative matters relating to its conduct of MA tasks by provisions in the Article 42
141
agreement or in a separate agreement, and in particular to make clear that the A 42 bodies will report to the MA via the A 59 body (see diagram 1 above). The A 59(2) body cannot become an A 42 body, as conflict of interest. The selection of projects under the global grant will be made through an advisory group, comprising the appropriate regional and local partners. If any designations are made under Article 42, the bodies most likely to be designated include universities and local authorities, which already have and appropriate range of public responsibilities or functions, and are likely to be competent for designation. Selection of operations for ERDF support The PMC is responsible for considering and approving the criteria for selecting the operations financed under the OP. The A 59(2) body will be responsible for putting forward proposals to the PMC for selection criteria. The role of the PMC is outlined in section 3 of these Implementing Provisions. On behalf of the PMC, the A 59(2) body may set out an Investment Framework which sets the activities and operations that the PMC have agreed they wish to see delivered under the OP. The Investment Framework must be approved by the PMC. It may identify bodies or organisations that it believes are competent to deliver operations in line with the framework. Any framework will comply with Public Procurement Regulations (which implement EC public procurement directives), so far as they are applicable. The procedure for selecting operations may take a variety of forms. For example: Open bidding: where an open invitation is published for applications for the support of operations that meet a specified priority or objective of the OP; Limited bidding: where a limited number of project sponsors is identified and invited to bid for the support of operations or sets of targets or outputs that meet a specified priority or objective of the OP; Non-competitive selection: where a single project sponsor (or perhaps two or more) is either selected as appearing to be the only suitable and capable vehicle for delivering a specific operation or set of programme targets or outputs and invited to submit an application for financial assistance; or applies for financial assistance on its own initiative for the support of an operation or a set of targets or outputs that appears to meet a priority or objective of the OP. The MA, in deciding in broad terms the nature and scope of the criteria and processes for the selection and appraisal of projects, and the A 59(2) body in putting forward proposals to the PMC for such criteria, will ensure that all processes and criteria take full account of the need to secure compliance with the requirements of the Public Procurement Regulations (which implement EC Public Procurement Directives) or the need for suitable competitive tendering where the Regulations do not apply. Once the criteria and investment strategy have been adopted by the PMC, the A 59(2) body will be responsible for managing the processes of developing operations, appraising proposals for operations, and making recommendations to the PMC or its appropriate sub-committees or groups.

142
5. COMPUTERISED EXCHANGE OF DATA
The MA, in collaboration with the A 59(2) body, will develop and maintain appropriate data exchange systems to support the provision of information to the Commission and the efficient and effective management of the OP. The MA will ensure that the system allows data to be exchanged electronically with the system used by the Commission. The system will be accessible for use by the MA, the Article 59(2) body, the CA and the AA. The system will record and monitor operation outputs and the results of monitoring, verifications and audits undertaken in relation to programme operations. Such systems will be in place for the OP before the MA makes the first interim application for payment.
6. MONITORING ARRANGEMENTS AND SYSTEMS General The Secretary of State, for the UK Government, will ensure that the management and control system for the OP sets up an efficient system for monitoring the programme and individual operations supported by the programme, and requires the MA and the PMC to ensure the quality of the implementation of the programme.
Monitoring tasks of the MA both in relation to the OP as a whole and to individual operations will be carried out by the A 59(2) body, which will work with the PMC. In order to assist the PMC to discharge the tasks set out in Article 65, the A 59(2) body will provide updates on the progress of the OP in meeting its targets. Within this update, the A 59(2) body will specifically identify the progress of projects where the A 59(2) body is a beneficiary. Monitoring of operations where the A 59(2) body is a beneficiary will be sample checked and verified by an external body. If, as planned by the UK Government, the A 59(2) body is a regional development agency, the external body will be the National Audit Office, which will undertake this work as part of its annual external financial audit.
Monitoring by the MA and the A 59(2) body under Article 60(b) will be carried out in accordance with Article 13 of Commission Regulation 1828/2006. In the case of A 42 bodies, they will be required to monitor projects which they support. The A 59(2) body will be responsible for quality assuring and verifying the monitoring activity of any A 42 body.
Monitoring will be conducted by reference to the financial indicators and the indicators referred to in Article 37(1)(c) which are specified for the OP and set out in the Indicators section of the programme.
Monitoring will also cover the effectiveness of financial controls and compliance with the Structural Funds Regulations and national rules that regulate matters of finance or propriety. Monitoring will be conducted in line with any guidance or instructions issued by the Commission. The A 59(2) body will also have regard to guidance issued by the MA concerning monitoring and the performance of verification function set out in Article 60(b).
Annual reports and final reports In accordance with Article 67(1), by 30 June 2008 and by 30 June in each subsequent year the MA will send the Commission an annual report. The MA will send the Commission a final report on the implementation of the OP by 31 March 2017.
Each report will be examined and approved in plenary by the PMC before it is sent to the Commission. The Managing Authority will review the report before it is sent to the Commission. The reports will contain the information set out in Article 67(2).
In accordance with Article 68, every year, when the annual report on implementation referred to in Article 67 is submitted, the Commission and the MA will examine the progress in implementing the OP, the principal results achieved over the previous year, the financial implementation and other factors with a view to improving implementation.
The operation of the management and control system raised in the last annual control report, referred to in Article 62(1)(d)(i), may also be examined.
143
7. EVALUATION ARRANGEMENTS AND SYSTEMS
The Secretary of State, for the UK Government, will carry out evaluations in relation to the OP in accordance with Articles 47 and 48, and the MA will have a role under Article 60(e) in ensuring that evaluations are carried out.
An ex ante evaluation for the OP has been carried out in accordance with Article 48(2) by an independent consultant. Alongside the ex ante evaluation, a Strategic Environmental Assessment was carried out in accordance with the requirements of Directive 2001/42/EC, also by an independent consultant. Both documents are annexed to the OP.
In accordance with Article 48(3), during the programme period, the Secretary of State, for the UK Government, will carry out evaluations linked to the monitoring of the OP, in particular where that monitoring reveals a significant departure from the goals initially set or where proposals are made for the revision of OPs, as referred to in Article 33. The results will be sent to the PMC and to the Commission.
The Commission may carry out strategic evaluations. Under Article 49(2) the Commission may carry out, on its own initiative and in partnership with the UK Government evaluations linked to the monitoring of the OP where monitoring has revealed a significant departure from the goals initially set. The results will be sent to the PMC.
In accordance with Article 49(3), the Commission will carry out an ex post evaluation for each objective in close co-operation with the Secretary of State, for the UK Government, and the MA. The ex post evaluation will cover the elements required by Article 49(3). It will be carried out by independent assessors and will be completed not later than three years after the end of the programming period.
8. FINANCIAL IMPLEMENTATION
Financial contributions by the Funds Article 34 provides that operational programmes shall receive financing from only one Fund, save as otherwise provided in paragraph 3 (which is not relevant for the UK). Accordingly, the OP will receive funding only from the European Regional Development Fund.
This programme will be seeking to use the derogation set out in Article 34(2), whereby the ERDF and the ESF may finance, in a complementary manner and subject to a limit of 10% of community funding for each priority axis of an operational programme, actions falling within the scope of assistance from the other fund, provided that they are necessary for the satisfactory implementation of the operation and are directly linked to it.
The MA will carry out an ongoing assessment of risk that the OP will fail to meet its financial and other targets, in particular the N+2 spend targets, as will the A 59(2) body, in line with guidance issued by the MA.
The MA will require regular updates from the A 59(2) body, increasing in frequency towards the end of the year, on the progress of the OP in meeting its N+2 targets. In consultation with the A 59(2) body, it will take the necessary course of action where the achievement of these targets is under threat.
At project level, risk will be assessed on the track record of the applicant, the nature of the project, the amount of the ERDF intervention and the total cost of the operation. It will take into account the opinion of the A 59(2) body’s appraisal, payment and inspection unit who have knowledge of both the projects and beneficiaries.

144
Differentiation of rates of contribution In accordance with Article 53(1), the contribution from the Fund at the level of the OP will be calculated with reference to:
(a) total eligible expenditure including public and private expenditure; or
(b) public eligible expenditure
and will be subject to the ceilings set out in Annex III to Council Regulation 1083/2006.
The ERDF contribution for the OP will be subject to a maximum of 50% of the total eligible cost of the OP. This will be co-financed by public expenditure only from a variety of sources. Any private sector contributions will be used as leverage and not included within the OP Financial Table.
It will be a requirement of the OP that the provision of co-financing for operations is secured prior to the issue of the formal approval of the operation.
Technical Assistance
Under Article 46 the Fund may, at the initiative of the Secretary of State, for the UK Government, finance the preparatory, management, monitoring, evaluation, information and control activities of the OP, together with activities to reinforce the administrative capacity for implementing the Fund within the limit of 4% of the total amount allocated for the OP (the limit for the Convergence and Regional competitiveness and employment objectives). As a matter of best practice, co-financing of Technical Assistance operations will be secured prior to formal approval of the individual operation.
The PMC will be invited to approve a plan for the use of Technical Assistance during the lifetime of the OP. This will be sent to the Commission for information. The Technical Assistance plan will be kept under review and may be changed, subject to the agreement of the PMC. However, the amount allocated will not exceed the 4% limit set down in Article 46.
Community budget commitments Article 75 provides that the Community budget commitments in respect of operational programmes shall be effected annually for each Fund and objective during the period between 1 January 2007 and 31 December 2013. The first budget commitment shall be made before the adoption by the Commission of the decision approving the OP. Each subsequent commitment shall be made, as a general rule, by 30 April each year.
De-commitments
Provisions and procedures relating to de-commitment are laid down in Articles 93, 94, 95 and 96.
9. FINANCIAL FLOWS AND PAYMENTS
General
In setting up the system for managing and controlling the payment and expenditure of the ERDF contribution, the Secretary of State, as Member State, will: (a) observe all relevant requirements of the Structural Funds Regulations and these Implementing Provisions; (b) apply the standards of management and control generally applicable to the handling and expenditure of UK public funds; and (c) follow such general guidance and instructions as the UK Government and the Commission may provide from time to time on the management of European Community funds. The MA and the CA will operate the system according to the same requirements and standards, and the A 59(2) body and all A 42 bodies will be required to do so, so far as relevant.

145
Financial Flows
Financial flows will operate in accordance with the Structural Funds Regulations and the following procedures:
The A 59(2) body will be responsible for making offers of ERDF grant to persons responsible for selected operations, except operations supported by global grants. A 42 bodies will be responsible for making offers of ERDF grants to persons responsible for global grant operations. Offers of ERDF support will require grant recipients to comply with EC and national rules on eligibility of expenditure and with the requirements of the Public Procurement Regulations (which implement EC Directives on public procurement) or the need for suitable competitive tendering where the Directives do not apply. Operations and A 42 bodies will make declarations of interim claims expenditure to the A 59(2) body. The A 59(2) body will be responsible for verifying the validity of declared expenditure against the offer of grant and the eligibility conditions and other conditions set out in the grant offer. Global grant operations will make declarations of interim claims expenditure to the A 42 body, which will verify them before incorporating them within a global declaration to the A 59(2) body.
The A 59(2) body will make payments for operations and to A 42 bodies subject to verifying declarations of eligible expenditure. No amount will be deducted or withheld; no charges will be levied; and no steps will be taken that have the effect of reducing indirectly the amounts that beneficiaries receive.

146
Financial flows overview for 2007-13 ERDF OP – South West Competitiveness and Employment Programme
claim reimbursement to CLG
EC CLG PROJECT
AccountsPayable Claim registered
Team
Head Of Claims Programme Verification Claim checked for
Team eligibility & verified
Claim authorised for payment
European Accounts ERDF GrantProgramme Payable Payment
Manager Team From BankClaim paid
CLG forwards to SWRDA
Quarterly claims
Project ERDF ClaimSWRDA
EC pays advance & quarterly
Declaration of Expenditure Sign-Off
Payment processedPreparation of ExpenditureDeclaration to CLG
Head of Finance
147
In any instances where the A 59(2) body is a direct applicant for ERDF support (i.e. wishes to use ERDF resources to support an operation for which it is directly responsible), it will use a separate unit within its organisation to act as the grant recipient or project sponsor, except where Technical Assistance is being used to support the programme management tasks. This unit will not have any responsibilities in relation to the management and control of the OP. It will be functionally independent from the unit undertaking MA functions and will be required to maintain such functional independence. It will be accountable for the expenditure of the grant to the unit undertaking MA functions as though it were a separate organisation. The A 59(2) body will submit to the CA declarations of interim expenditure. These declarations will cover the aggregate of eligible payments claimed by operations, including global grant applications. Submissions will usually be made quarterly and will be accompanied by all the necessary supporting information required to demonstrate the eligibility of expenditure under the Structural Funds Regulations, national eligibility rules, UK financial management requirements and any additional requirements of the CA. The submissions will be copied to the MA. The submission from the A 59(2) body will be signed by a senior manager of the A 59(2) body, who will be distinct and independent from any unit of the A 59(2) body acting as a beneficiary of ERDF support.
The CA will draw up and submit to the Commission certificates of expenditure and applications for payment, in accordance with Article 78 and in the form prescribed in Annex X to Commission Regulation 1828/2006. The CA will review all information received from the MA and the A 59(2) body under Article 61(c) (concerning procedures and verifications carried out in relation to expenditure) and from the AA under Article 61(d) (results of audits, including the annual control report). It will carry out such checks as it thinks are necessary and appropriate to satisfy itself as to the eligibility of expenditure claimed.
Payments
Payments from the Commission will take the form of: pre-financing; interim payments; and payments of the final balance. Payments will be made to the UK Government and received in a Treasury Account at the Bank of England. The MA will be authorised to draw down amounts from the account for the financing of the OP.
The UK Government will make appropriate arrangements to ensure that sufficient funds are available to enable the MA to meet the A 59(2) body’s declarations of eligible expenditure in advance of receiving interim payments from the Commission. Such arrangements will comply with UK Government Accounting and Budgeting requirements.
Use of Euro and conversion rates In accordance with Article 81, all Statements of Expenditure and applications to the Commission for payment will be made in euros. Annual and final implementation reports will use the euro to report on expenditure. Amounts of expenditure incurred in sterling, in delivering operations, will be converted into euros using the monthly accounting exchange rate of the EC in the month during which the expenditure was registered in the accounts of the CA. This rate will be published electronically by the Commission each month.
148
10. FINANCIAL MANAGEMENT AND CONTROL ARRANGEMENTS General provisions Responsibility for providing an effective system of management and control of the OP lies with the Member State. The management and control system will comply with the requirements of Article 58 and will be subject to the reporting requirements laid down in Article 71.
Organisation The A 59(2) body will ensure that there is an appropriate separation of functions within its organisation between the units which are responsible for the functions of the MA falling within the flowing broad categories:
• appraising operations and issuing and varying offers of ERDF grant; • verification of payment claims and monitoring operations; and • financial matters, including making payments for operations and submitting declarations of
expenditure to the CA. The MA and CA will ensure that this separation of functions within the A 59(2) body is maintained throughout the lifetime of the OP. Accounting Systems In order to facilitate the verification of expenditure by Community and national authorities, the MA, in exercising the function in Article 60(c), will ensure that all bodies involved in the management and implementation of the OP maintain either a separate accounting system or an adequate accounting codification capable of providing detailed and complete summaries of all transactions involving Community assistance.
Documentation
The MA and the A 59(2) body will ensure that the requirements of Article 90 regarding the keeping of available documents are complied with.
Audit Besides being subject to the activities of the AA, audit by the Commission and audit by the European Court of Auditors, the financial control and management system will be subject to audit by the UK domestic audit authorities (the National Audit Office) Irregularities and financial corrections The management and control system of the OP and steps taken by the MA to ensure that it is properly adhered to by all bodies concerned in the management and control of the programme will guard against irregularities while securing that any that do occur are detected, investigated and corrected. The A 59(2) body will have a primary role in the detection, investigation and correction of irregularities (particularly by virtue of its responsibility for monitoring and verification), and will be responsible for recovering grant in appropriate cases. The Secretary of State, as Member State, will be responsible under Article 98 for investigating irregularities and making financial corrections. The A 59(2) body will notify the MA about irregularities and steps taken or proposed to resolve them. The MA will notify irregularities to the Department for

149
Business Enterprise and Regulatory Reform (BERR), which is the central co-ordinating Department for the Member State with respect to the Structural Funds programmes. BERR, acting for the Member State, will communicate with the Commission about irregularities and corrections. The MA will report to the AA any cases involving fraud. BERR will report them to the Commission’s OLAF service. The MA will ensure that the A 59(2) body fulfils its responsibilities for the prevention, detection and investigation of irregularities and that it acts on reports prepared by the AA on any suspicion of irregularity. 11. INFORMATION AND PUBLICITY The MA and the A 59(2) body will ensure that information and publicity measures conform to the provisions of Article 69 of Council Regulation 1083/2006 and Articles 2 to 10 of Commission Regulation 1828/2006, to ensure the full visibility of the funds throughout the programming area.
Publicity forms an integral part of the programme strategy and the MA will work with the A 59(2) body to ensure that the benefits of the ERDF is communicated to the wider public.
Innovative publicity activities and campaigns using print, broadcast and creative media will help the Managing Authority to clearly promote and position the ERDF brand. These activities will be developed proactively and implemented in collaboration with the European Commission in Brussels, the Representation Office in London and Information relays and networks in the UK, which will ensure the visibility and transparency of the funds at a local, regional and national level. Potential project sponsors and final beneficiaries/fund recipients will be informed of funding opportunities and also the publicity requirements linked to receiving ERDF funding during the programming period. To this end, the A 59(2) body will draw up a budgeted communication plan, which must be agreed by the PMC and submitted through the MA to the Commission within four months of the adoption of the OP. The Communication plan will set out:
• the objectives of the plan and the target groups; • activities in support of publicity and information including events, seminars and project
launches, for potential applicants, partners and the wider public • bodies or persons responsible for the implementation of the plan; • the budget for implementing the plan; and • evaluation frameworks for the plan.
The A 59(2) body will report on progress in implementing the plan (including examples of publicity activities) to the PMC and also in the annual implementation report. The communication plan will be easily accessible and will be published on the A 59(2) body’s website. Information will be provided by the A 59(2) body to potential beneficiaries in accordance with Article 5 of Commission Regulation 1828/2006, including the publicity and information measures that they are required to undertake to comply with Articles 8 and 9 of that Regulation. Project sponsors will be required to observe the publicity elements of Commission Regulation 1828/2006, especially with regard to signage, including billboards, plaques and promotional material.
150
Funding for publicity and communications will be provided through the Technical Assistance budget for the OP. The financial table for the OP will specify the amounts dedicated to the Technical Assistance Priority Axis. 12. SUPPLEMENTARY OBJECTIVES Sustainable Development
The OP will promote the objectives of sustainable development as required by Article 17.
These objectives have been reflected in the programme strategy and objectives. The programme has been subject of a Strategic Environmental Assessment as required under Directive 2001/42/EC.
The Managing Authority will, in accordance with Article 10 of (EC) Directive 2001/42/EC, monitor the significant environmental effects of the OP in order, inter alia, to identify unforeseen adverse effects and be in a position to undertake appropriate remedial action. This monitoring will be undertaken at three levels:- First, the Environmental Report has suggested a selection of tracking indicators that can be used to monitor the environmental performance of the area. The Managing Authority will monitor against these indicators, where appropriate, to determine changes that occur and potential relationships with programme activities. As stated in the SEA, data for the majority of these indicators can be obtained from readily available sources. Performance against these indicators will be reported in the Annual Implementation Reports. Secondly, the effectiveness of mainstreaming Environmental Sustainability as a Cross Cutting Theme will be assessed through the relevant Priority level indicators. Progress against the Priority level indicators will be reported in the Annual Implementation Reports and discussed at meetings of the PMC. Thirdly, the Environmental Report proposes checking criteria to appraise the appropriateness of individual supported activities where they would result in a physical development. These criteria will be used, where appropriate, at project development stage so that potential adverse effects of supported activities are appropriately managed. Projects that have significant negative effects that can not be mitigated and outweigh positive benefits will not be supported by the OP. Procedures will be in place to detect any project with a potentially negative effect on Natura 2000 sites and other sites designated for nature conservation. These will be scrutinized by the A 59(2) body in consultation with the Competent Environmental Authorities to ensure that no activities will be supported that will cause damage to designated sites. The appraisal process will also cover opportunities to strengthen the environmental aspects of projects and the guidance that is being developed will advise on how this is to be done and how it will be monitored. The MA, PMC, A 59(2) body and all A 42 bodies will be required to implement the OP having regard to the objectives of sustainable development. In particular, the selection criteria for operations, outputs and indicators will take account of the need to protect and promote environmental sustainability. This will also involve assessing the impact of operations on these objectives, on appraisal and during the course of project monitoring and evaluation.

151
Gender equality and equal opportunities
The OP will promote the objectives of equal opportunities and non-discrimination on the basis of race, ethnic origin, religion or belief, disability age or sexual orientation, as required by Article 16.
These objectives have been reflected in the programme strategy and priorities. The programme has been subject to an Equality Impact Screening as required by UK legislation, which is an Annex to the OP.
The MA, the PMC, the A 59(2) body and all A 42 bodies will be required to implement the OP having regard to the objectives of equal opportunities and non-discrimination. This will involve assessing the impact of operations on these objectives, on appraisal and during the course of project monitoring and evaluation.
Major projects Financial assistance may be given under the OP for the support of major projects. A major project is defined in Article 39 as an operation: – which comprises an series of works, activities or services intended in itself to accomplish an
indivisible task of a precise economic or technical nature;
– which has clearly identified goals; and
– whose total cost exceeds €25 million in the case of the environment and €50 million in other fields.
When the A 59(2) body appraises a major project, it will inform the Commission before deciding to approve support under the OP and provide the information necessary for appraisal of the project by the Commission as set out in Article 40 using Annex XXI to Commission Regulation 1828/2006). Complementarity with the European Social Fund
The MA and A 59(2) body will work with the MA for the national ESF programme (the Department for Work and Pensions) to ensure effective co-ordination of decisions taken in the implementation of the OP and the national ESF programme. The A 59(2) body will be responsible for advising the PMC on what co-ordination with the ESF programme is necessary for meeting the objectives of the OP. The A 59(2) body will put in place appropriate communication and liaison arrangements with the MA for the ESF programme. The A 59(2) body and regional partners will consider whether a joint ERDF and ESF monitoring committee to aid co-ordination would benefit the OP. The PMC may at any time meet jointly with any committee or group set up by the MA of the national ESF programme to discuss matters of mutual interest and to ensure effective co-ordination.

152
Complementarity with the European Agricultural Fund for Rural Development and the European Fisheries Fund The MA and A 59(2) body will work with the MA for the EAFRD and EFF programmes (the Department for Environment, Food and Rural Affairs) to ensure effective co-ordination of decisions taken in the implementation of the OP and the national EAFRD and EFF programmes. The A 59(2) body will be responsible for advising the PMC what co-ordination with the EAFRD and EFF programmes is necessary for meeting the objectives of the OP. The A 59(2) body will put in place appropriate communication and liaison arrangements with the MA for the EAFRD and EFF programmes. The PMC may at any time meet jointly with any committee or group set up by the MA of the EAFRD and EFF programmes to discuss matters of mutual interest and to ensure effective co-ordination. 13. USE OF RESERVES
National Performance Reserve
A Member State may establish a National Performance Reserve for each of the Convergence or Regional Competitiveness objectives, consisting 3% of its total allocation for each objective. The UK Government has decided not to operate a national performance reserve for the OP.
National Contingency Reserve
A Member State may reserve an amount of 1% of the annual Convergence allocation and 3% of the annual Regional Competitiveness allocation to cover unforeseen local or sectoral crises linked to economic and social restructuring. The UK Government has decided not to operate a National Contingency Reserve for the OP.
14. FINANCIAL ENGINEERING In accordance with Article 44 of 1083/06, the ERDF may be used to co-finance financial engineering schemes for enterprises, primarily small and medium enterprises. The A 59(2) body will ensure that financial engineering operations supported by the ERDF are set up and implemented in compliance with Articles 43, 44 and 45 of Commission Regulation 1828/06. Any proposal to set up financial engineering instruments will have to be agreed by the MA. 15. STATE AID
Any public support under this programme must comply with the procedural and material rules applicable at the point in time when the public support is granted. The Member State, and in particular the MA of each OP, is fully responsible for compliance of the Structural Funds operations within the programme with the EC state aid rules.
The Member State, the MA and the A 59(2) body are responsible for ensuring that operations and activities supported under the OP are compatible with the common market.