ERDC/CRREL TR-08-12, A Field Guide to the Identification ...
84
ERDC/CRREL TR-08-12 A Field Guide to the Identification of the Ordinary High Water Mark (OHWM) in the Arid West Region of the Western United States A Delineation Manual Robert W. Lichvar and Shawn M. McColley August 2008 Cold Regions Research and Engineering Laboratory Approved for public release; distribution is unlimited.
Transcript of ERDC/CRREL TR-08-12, A Field Guide to the Identification ...

ER
DC
/CR
RE
L TR
-08
-12
A Field Guide to the Identification of the Ordinary High Water Mark (OHWM) in the Arid West Region of the Western United States A Delineation Manual
Robert W. Lichvar and Shawn M. McColley August 2008
Co
ld R
eg
ion
s R
es
ea
rch
a
nd
En
gin
ee
rin
g L
ab
ora
tory
Approved for public release; distribution is unlimited.

ERDC/CRREL TR-08-12 August 2008
A Field Guide to the Identification of the Ordinary High Water Mark (OHWM) in the Arid West Region of the Western United States A Delineation Manual
Robert W. Lichvar and Shawn M. McColley
Cold Regions Research and Engineering Laboratory
U.S. Army Engineer Research and Development Center
72 Lyme Road
Hanover, NH 03755-1290
Approved for public release; distribution is unlimited.
Prepared for U.S. Army Corps of Engineers Wetland Regulatory Assistance Program
ii ERDC/CRREL TR-08-12
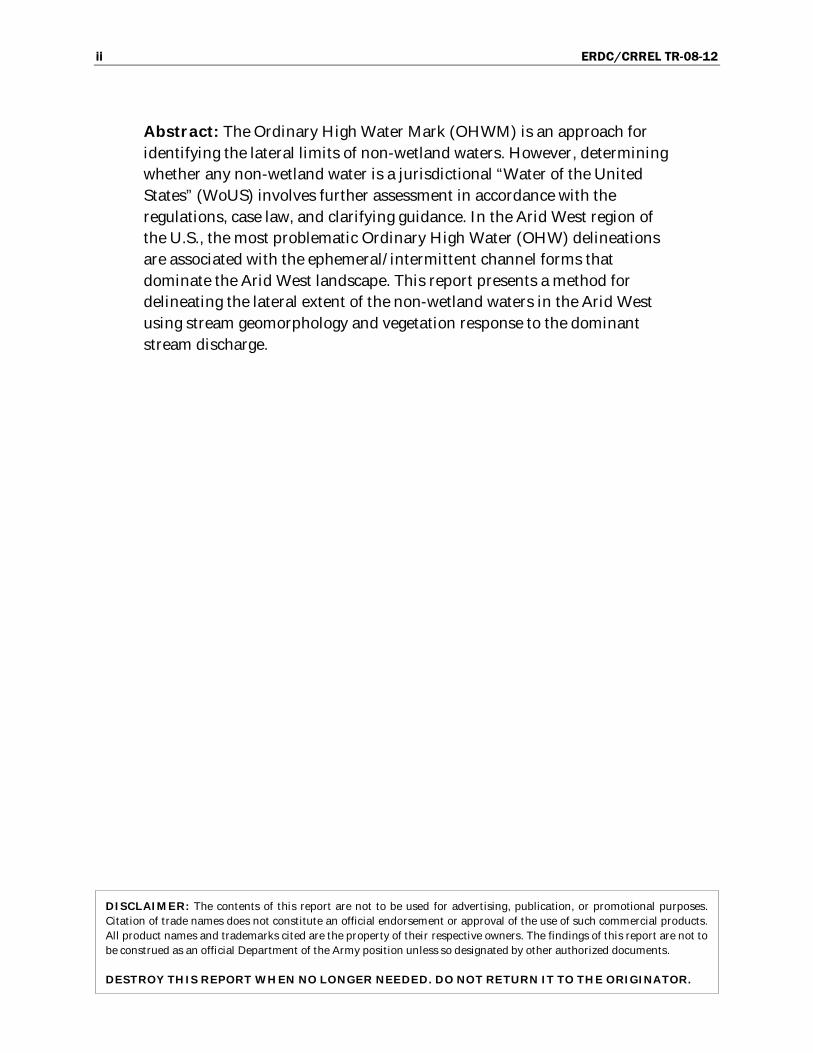
Abstract: The Ordinary High Water Mark (OHWM) is an approach for
identifying the lateral limits of non-wetland waters. However, determining
whether any non-wetland water is a jurisdictional “Water of the United
States” (WoUS) involves further assessment in accordance with the
regulations, case law, and clarifying guidance. In the Arid West region of
the U.S., the most problematic Ordinary High Water (OHW) delineations
are associated with the ephemeral/intermittent channel forms that
dominate the Arid West landscape. This report presents a method for
delineating the lateral extent of the non-wetland waters in the Arid West
using stream geomorphology and vegetation response to the dominant
stream discharge.
DISCLAIMER: The contents of this report are not to be used for advertising, publication, or promotional purposes.
Citation of trade names does not constitute an official endorsement or approval of the use of such commercial products.
All product names and trademarks cited are the property of their respective owners. The findings of this report are not to
be construed as an official Department of the Army position unless so designated by other authorized documents.
DESTROY THIS REPORT WHEN NO LONGER NEEDED. DO NOT RETURN IT TO THE ORIGINATOR.
ERDC/CRREL TR-08-12 iii
Contents
Preface ................................................................................................................................................... vi
1 Introduction .....................................................................................................................................1
1.1 Ordinary High Water (OHW) in the Arid West Region ..........................................................1
1.2 Scope of Manual ......................................................................................................................2
1.3 Stream Geomorphology ..........................................................................................................3
1.4 Hydrology ..................................................................................................................................5
1.5 Arid West Channel Forms of Interest ....................................................................................6
1.5.1 Alluvial Fans ..............................................................................................................................7
1.5.2 Compound Channels................................................................................................................8
1.5.3 Discontinuous Ephemeral Channels......................................................................................9
1.5.4 Single-Thread Channels with Adjacent Floodplains...........................................................10
1.5.5 Anastomosing Channels........................................................................................................10
1.6 Flood Cycles and Effective Discharge ................................................................................ 12
1.7 Human Disturbance ............................................................................................................. 18
2 OHWM Delineation Background ................................................................................................ 20
2.1 OHWM Indicators .................................................................................................................. 20
2.2 OHWM Indicator Distribution............................................................................................... 28
2.3 Identification of the Active Floodplain................................................................................ 31
2.4 Arid West OHW – Active Floodplain .................................................................................... 33
3 OHWM Identification Method..................................................................................................... 35
3.1 Resources Needed ............................................................................................................... 35
3.1.1 Aerial Photography and Other Imagery ...............................................................................35
3.1.2 Topographic Maps ..................................................................................................................37
3.1.3 Other Maps..............................................................................................................................38
3.1.4 Rainfall Data............................................................................................................................41
3.1.5 Stream Gage Data ..................................................................................................................42
3.1.6 Existing Delineations..............................................................................................................43
3.2 Preliminary Delineation Procedure..................................................................................... 43
3.3 Field Verification of the Preliminary Delineation .............................................................. 49
3.4 Problematic Boundaries ...................................................................................................... 60
3.5 Examples of Delineations by Channel Form...................................................................... 61
3.5.1 Alluvial Fans ............................................................................................................................61
3.5.2 Compound Channels..............................................................................................................62
3.5.3 Discontinuous Ephemeral Streams .....................................................................................63
3.5.4 Single-Thread Channels with Adjacent Floodplains...........................................................64
3.5.5 Anastomosing Rivers .............................................................................................................64
References........................................................................................................................................... 66
Report Documentation Page ............................................................................................................. 77

iv ERDC/CRREL TR-08-12
Figures and Tables
Figures
Figure 1. Geographic extent of the Arid West region ....................................................................................2
Figure 2. Representative cross sections depicting hydrogeomorphic floodplain units for perennial channel forms and intermittent/ephemeral channel forms ....................................................3
Figure 3. Shift in the low-flow channel following a 5- to 10- year discharge event at Mission Creek, CA .................................................................................................................................................5
Figure 4. Alluvial fan with distributary channels at the confluence of the Colorado River and Bright Angel Creek, Grand Canyon, AZ .....................................................................................................7
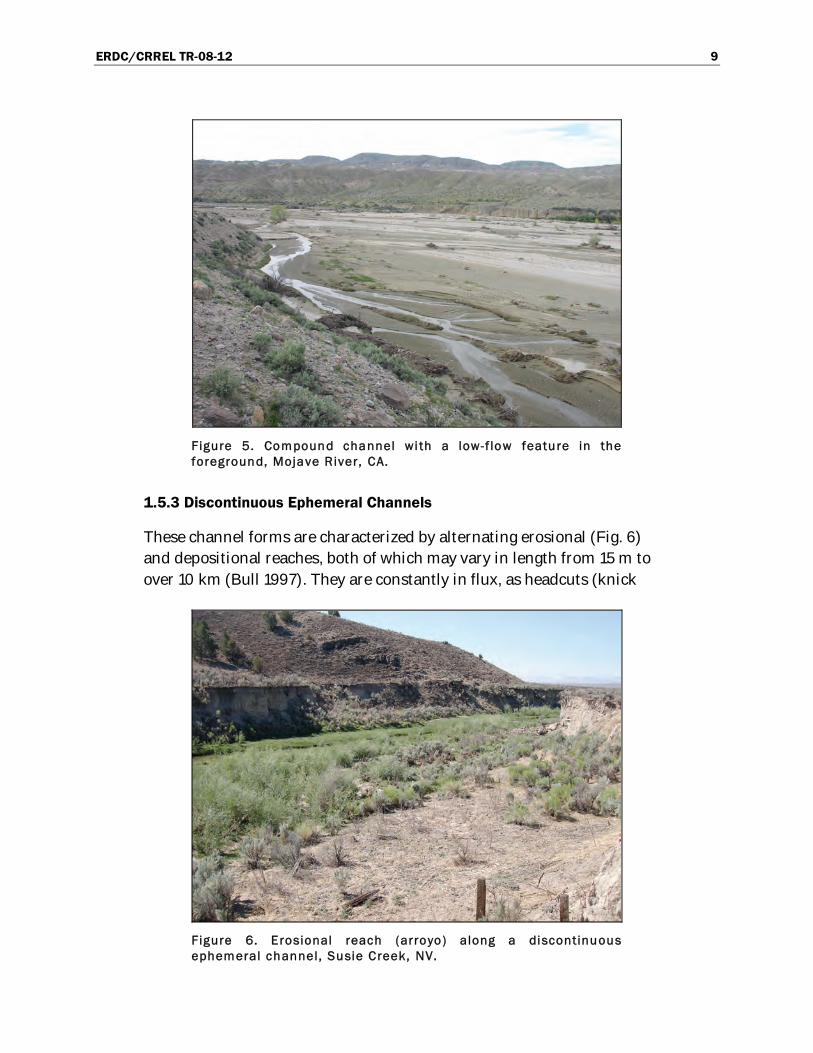
Figure 5. Compound channel with a low-flow feature in the foreground, Mojave River, CA ................9
Figure 6. Erosional reach (arroyo) along a discontinuous ephemeral channel, Susie Creek, NV ......9
Figure 7. Single-thread channel with adjacent floodplain, Alter Wash, NV ........................................... 10
Figure 8. Anastomosing channels along Cooper Creek, Australia .......................................................... 11
Figure 9. Changes in channel form along an ephemeral stream channel ........................................... 12
Figure 10. Model of changes within the active floodplain and low-flow channel associated with discharge events ....................................................................................................................................... 13
Figure 11. Pre-effective discharge and post-effective discharge on the Mojave River at Afton Canyon ....................................................................................................................................................... 14
Figure 12. Aerial photo time-series acquired over a section of the San Carlos River, AZ, and their corresponding annual peak-flow hydrograph .......................................................................... 17
Figure 13. Lateral and longitudinal variability of geomorphic indicator position along a hypothetical Arid West channel form ............................................................................................................. 22
Figure 14. Hydrogeomorphic units and OHWM indicator positions within the Mission Creek study reach .............................................................................................................................................. 29
Figure 15. Mean ± one standard deviation for each indicator type identified within the Mission Creek study reach ...............................................................................................................................29
Figure 16. Conceptual model showing the locations of OHW indicators .............................................. 30
Figure 17. Active floodplain/low terrace boundary in an Arid West channel ....................................... 32
Figure 18. Vegetative shift at the active floodplain/low terrace boundary in an Arid West channel ................................................................................................................................................................. 32
Figure 19. Examples of changes in vegetative cover and species between the active floodplain and the low terrace ........................................................................................................................ 34
Figure 20. Aerial photograph acquired over Chinle Creek, AZ ................................................................. 36
Figure 21. Section of a topographic map of the Fried Liver Wash Quadrangle, CA ........................... 38
Figure 22. Section of a geologic/topographic map of the Frazier Creek Quadrangle, NV ................ 39
Figure 23. General vegetation map of New Mexico ................................................................................... 40
Figure 24. Section of a soils map of the Frasier Flat Quadrangle, NV ................................................... 41
Figure 25. Distribution of precipitation over a portion of northern California ...................................... 42

ERDC/CRREL TR-08-12 v
Figure 26. Flood frequency analysis results produced by HEC-SSP in accordance with Bulletin 17B for the Puerco River, near Chambers, AZ, and for the Mojave River at Afton Canyon, CA ........................................................................................................................................................... 45
Figure 27. Discharge values associated with 2-, 5-, 10-, and 25-year events for gage 09396100 on the Puerco River near, Chambers, AZ, and for gage 10263000 on the Mojave River at Afton Canyon, CA .................................................................................................................. 46
Figure 28. Discharge history for the Puerco River near Chambers, AZ, and for the Mojave River at Afton Canyon, CA ................................................................................................................................. 47
Figure 29. Shift-adjusted rating curve for gage 09396100 on the Puerco River, near Chambers, AZ, and for gage 10263000 on the Mojave River at Afton Canyon, CA .......................... 48
Figure 30. Step 1 of the field verification procedure ................................................................................. 49
Figure 31. Step 2 of the field verification procedure ................................................................................. 50
Figure 32. Step 3 of the field verification procedure ................................................................................. 51
Figure 33. Step 4 of the field verification procedure ................................................................................. 52
Figure 34. Step 5 of the field verification procedure ................................................................................. 53
Figure 35. Step 6 of the field verification procedure ................................................................................. 54
Figure 36. Step 7 of the field verification procedure ................................................................................. 55
Figure 37. Step 8 of the field verification procedure ................................................................................. 55
Figure 38. Staff used to determine stage height for Chinle Creek, AZ .................................................. 56
Figure 39. Projection onto the landscape of the stage height associated with the most recent effective discharge that exceeded a 5-year event.......................................................................... 57
Figure 40. Example geomorphic mapping of a compound channel showing a mosaic of terraces within the active floodplain, Caruthers Creek, CA ...................................................................... 62
Figure 41. Example geomorphic mapping of a discontinuous ephemeral stream in an erosional reach (arroyo), Susie Creek, NV .................................................................................................... 63
Figure 42. Example geomorphic mapping in a straight reach of a single-thread channel with an adjacent floodplain, Alter Wash, AZ ................................................................................................. 64
Tables
Table 1. Comparison by stream type of flood return interval and features associated with hydrogeomorphic position ...................................................................................................................................4
Table 2. Primary measurable alluvial fan characteristics ............................................................................8
Table 3. Natural controls on fluvial processes ............................................................................................15
Table 4. Human controls on fluvial processes ............................................................................................19
Table 5. Potential geomorphic OHWM indicators categorized by location below, at, and above ordinary high water ................................................................................................................................21
Table 6. Potential vegetation OHWM indicators categorized by location below, at, and above ordinary high water ................................................................................................................................21
Table 7. Select geomorphic OHWM indicators that may be present below, at, and above the OHW boundary ............................................................................................................................................. 23
Table 8. Select vegetative OHWM indicators that may be present below, at, and above the OHW boundary .................................................................................................................................................... 27
Table 9. Websites with access to digital imagery ....................................................................................... 37
vi ERDC/CRREL TR-08-12
Preface
This manual was prepared by Robert W. Lichvar and Shawn M. McColley,
both of the Remote Sensing/GIS and Water Resources Branch, Cold
Regions Research and Engineering Laboratory (CRREL), U.S. Army
Engineer Research and Development Center (ERDC), Hanover, NH.
Support and funding for this manual was provided by the U.S. Army Corps
of Engineers (USACE), Headquarters (HQ) through the Wetland Regula-
tory Assistance Program (WRAP). Their support is acknowledged and
appreciated. Dr. Mark Sudol and Katherine Trott (HQ) are acknowledged
for their continued interest and support for this Arid West initiative, which
addresses questions unique to this region of the country.
Peer reviews, both external and internal, were provided by Dr. Yong
Chung, USACE, Los Angeles District; Dr. Steven Daly, CRREL; Dr. John
Field, Field Geologic Services; Dr. Richard French, University of Texas at
San Antonio, San Antonio, TX; Dr. David Goldman, CRREL; and Dr. Eric
Stein, Southern California Coastal Research Project, Westminster, CA.
In addition, technical reviews of various drafts of this manual were
provided by Dr. Aaron Allen, USACE, Los Angeles District; Marjorie
Blaine, USACE, Los Angeles District; Ann Campbell, U.S. Environmental
Protection Agency (EPA); Donna Downing, EPA; Michael Finan, USACE,
Sacramento District; Dan Martel, USACE, San Francisco District; Jennifer
McCarthy, USACE HQ, Regulatory Community of Practice; Nita Tallent-
Halsell, EPA; Brian Topping, EPA; Michael R Turaski, USACE, Portland
District; R. Dan Smith, Environmental Laboratory (EL), ERDC; Dr. James
Wakeley, EL, ERDC; and James Wood, USACE, Albuquerque District.
Technical support was provided by Michael Ericsson, Dave Finnegan, and
Walter Ochs, all of the RS/GIS and Water Resources Branch, CRREL.
The report was prepared under the general supervision of Timothy
Pangburn, Chief, RS/GIS and Water Resources Branch; Dr. Lance Hansen,
Deputy Director; and Dr. Robert E. Davis, Director, CRREL.
The Commander and Executive Director of ERDC is COL Gary E.
Johnston. The Director is Dr. James R. Houston.

ERDC/CRREL TR-08-12 1
1 Introduction
1.1 Ordinary High Water (OHW) in the Arid West Region
The Ordinary High Water Mark (OHWM) is a defining element for
identifying the lateral limits of non-wetland waters. However, determining
whether any non-wetland water is a jurisdictional “Water of the United
States” (WoUS) involves further assessment in accordance with the
regulations, case law, and clarifying guidance. Federal jurisdiction over a
non-wetland WoUS extends to the OHWM, defined in 33 CFR Part 328.3
as the line on the shore established by fluctuations of water and indicated
by physical characteristics such as a clear, natural line impressed on the
bank, shelving, changes in the character of the soil, destruction of
terrestrial vegetation, or the presence of litter and debris. In the Arid West
region of the United States (Fig. 1), waters are variable and include
ephemeral/intermittent and perennial channel forms. The most
problematic ordinary high water (OHW) delineations are associated with
the commonly occurring ephemeral/intermittent channel forms that
dominate the Arid West landscape. The climate of the region drastically
influences the hydrology, channel-forming processes, and distribution of
OHWM indicators such that delineations can be inconsistent (over space
and time) and problematic. Based on recent research and testing, coupled
with years of observations and data gathering, we present here a method
for delineating non-wetland waters in the Arid West. This method uses
stream geomorphology and vegetation response to the dominant stream
discharge and represents the most consistent and repeating pattern
associated with “ordinary” events representing OHW.
The geographic extent of this manual is the Arid West region, as defined
by Land Resource Regions (LRR) B, C, and D (USDA Natural Resources
Conservation Service 2006) (Fig. 1).

2 ERDC/CRREL TR-08-12
Figure 1. Geographic extent of the Arid West region. (Modif ied from U.S. Army Corps of Engineers 2006.)
1.2 Scope of Manual
The methodology presented in this manual is limited to one element of the
delineation procedure for non-wetland waters in the Arid West region.
Specifically, this manual addresses the identification of the OHWM in low-
gradient, alluvial ephemeral/intermittent channel forms in the Arid West
for use in the delineation of non-wetland waters. Although there may be
some commonality in OHWM indicators observed in alluvial channel
forms and other channel forms (e.g., bedrock) found in arid climates, the
procedures presented in this manual are not intended for use in those
settings.

ERDC/CRREL TR-08-12 3
1.3 Stream Geomorphology
Watershed characteristics and the local hydrologic regime influence the
geometry of the channel and the surrounding floodplain by dictating the
amount of sediment deposited and eroded in the channel. Whether in
flashy (episodic) arid environments or humid regions with more evenly
distributed channel discharges, several common fluvial features are
associated with perennial channels. These features, typical of the channel
and floodplain, include bankfull, active floodplain, and low terrace zones
(Fig. 2). In perennial channels the bankfull zone is where the majority of
the impact (via erosion and sedimentation) takes place owing to the
presence of the dominant channel-forming discharge. The active
floodplain zone receives frequent overbank flood flow. The terrace zone
ranges from paleo surfaces that are completely abandoned to modern
surfaces that infrequently receive flood waters, typically referred to as the
100-year floodplain.
Figure 2. Representative cross sections depict ing hydrogeomorphic f loodpla in units for perennial channel forms (top) and iintermittent/ ephemeral channel forms (bot tom).

4 ERDC/CRREL TR-08-12
The geometry of ephemeral/intermittent channels differs from that of
perennial channels (Fig. 2). The bankfull zone in a perennial channel is a
product of conveying the dominant channel-forming discharge. In
ephemeral/intermittent channels, the bankfull zone is potentially a more
transient, less discernable feature, and the dominant channel-forming
discharge, which is similar in concept to the bankfull event of a perennial
channel form, is conveyed by one or more low-flow features in the active
floodplain zone. Although there are similarities (Table 1) between the
bankfull zone of a perennial channel and the low-flow features of
ephemeral/intermittent channels, two critical differences exist: 1) the low-
flow features tend to be formed and may be relocated (Fig. 3) during low-
to moderate-discharge events (5–10 yr), owing to the immature and poorly
formed/consolidated soils typically found in arid systems, and 2) the low-
flow features are very dynamic due to a lack of stabilizing vegetation cover
and flashy (episodic) discharge patterns.
Table 1. Comparison by stream type of f lood return interval and features associated with hydrogeomorphic position.
Perennial Channel Forms Ephemeral/Intermittent
Channel Forms
Bankfull/Low f low channel
Return interval Low (1.4–1.6 yr) (Leopold et al. 1964, Rosgen 1996) 2 yr (Lichvar et al. 2006)
Features – Well-defined bed and bank – Stable over time – Where majority of the impact (erosion/deposition)
occurs – Distinct vegetation
– Unstable over time – Well-defined to absent bed and
bank – Shifts during low to moderate
events (Fig. 3)
Active f loodplain
Return interval Moderate (2–10 yr) (Riggs 1985) 5–10 yr (Lichvar et al. 2006)
Features – Overflow from bankfull channel – High-flow channels – Break in slope at margin common – Distinct vegetation
– Break in slope at margin common – Stable over time – Where majority of the impact
(erosion/deposition) occurs – Distinct vegetation
Low terrace
Return interval Infrequent (> 10 yr) > 10 yr
Features – Isolated depressions – Overbank flow during extreme events – Paleo-channels – Distinct vegetation
– Isolated depressions – Overbank flow during extreme
events – Paleo-channels

ERDC/CRREL TR-08-12 5
Figure 3. Shif t in the low-f low channel fol lowing a 5- to 10- year discharge event at Mission Creek, CA.
1.4 Hydrology
Channel morphology is driven in large part by the discharge patterns
associated with the local hydrologic regime. In the Arid West, stream
discharges are driven by three large-scale weather patterns (Lichvar and
Wakeley 2004): winter North Pacific frontal storms, summer convective
thunderstorms, and late-summer eastern North Pacific tropical storms
(Ely 1997). These weather patterns produce different types of precipitation
events: winter storms are typically of long duration (several days) and low
intensity, whereas summer storms are brief but potentially very intense.
Precipitation produced by these weather patterns varies greatly on an
6 ERDC/CRREL TR-08-12
annual and interannual basis for any given locality, but generally, the
season of peak precipitation shifts from winter in the north to summer in
the south. The variation of precipitation in time, coupled with the
orographic effect of highly variable topography across the Arid West,
results in spatially variable precipitation patterns (Reid and Frostick 1977,
Graf 1988a).
Typically, higher elevations tend to receive greater precipitation than low-
lying areas (Lichvar and Wakeley 2004). Snowpack in mountainous
regions may act as a buffer for mountain channel forms through
moderating the release of runoff supplying more-consistent, lower-energy
flow in the spring and early summer months. Alternatively, rainfall on a
deep snowpack, which accumulated during a colder period, could result in
high-energy flow and flooding of mountain channel forms while adjacent
lower elevation channel forms remain dry (Lichvar and Wakeley 2004).
Extreme weather events (e.g., summer thunderstorms) may produce
locally intense precipitation over an entire watershed or perhaps just a
portion of a watershed producing short-duration, potentially high-energy
(depending on watershed size, relief, and soil conditions) flow in these
areas and a complete lack of flow in others. The spotty, episodic
precipitation patterns often lead to a lack of base flow (unless groundwater
influences are present) and, as a result, decreased incision of Arid West
channel forms. The lack of consistent flow in conjunction with the
immature and poorly formed/consolidated soils typically found in arid
systems make both the channel morphology and the channel position
highly variable and generally reduce the growth of channel-armoring
vegetation (Reid and Laronne 1995, Millar 2000, Lichvar and Wakeley
2004).
1.5 Arid West Channel Forms of Interest
Five major ephemeral/intermittent channel forms occur within the Arid
West: (1) alluvial fans, (2) compound channels, (3) discontinuous
ephemeral channels, (4) single-thread channels with associated
floodplains, and (5) anastomosing channels. Each channel form may
transition from one to another through space and time. At a delineation
site, the current channel type can be determined through the use of a
formal channel classification scheme (e.g., Rosgen 1996); however,
classification is not required to perform delineations because all five
channel forms are delineated in the same manner. Thus, a brief,
ERDC/CRREL TR-08-12 7
descriptive overview of each channel form is provided below for
background purposes only.
1.5.1 Alluvial Fans
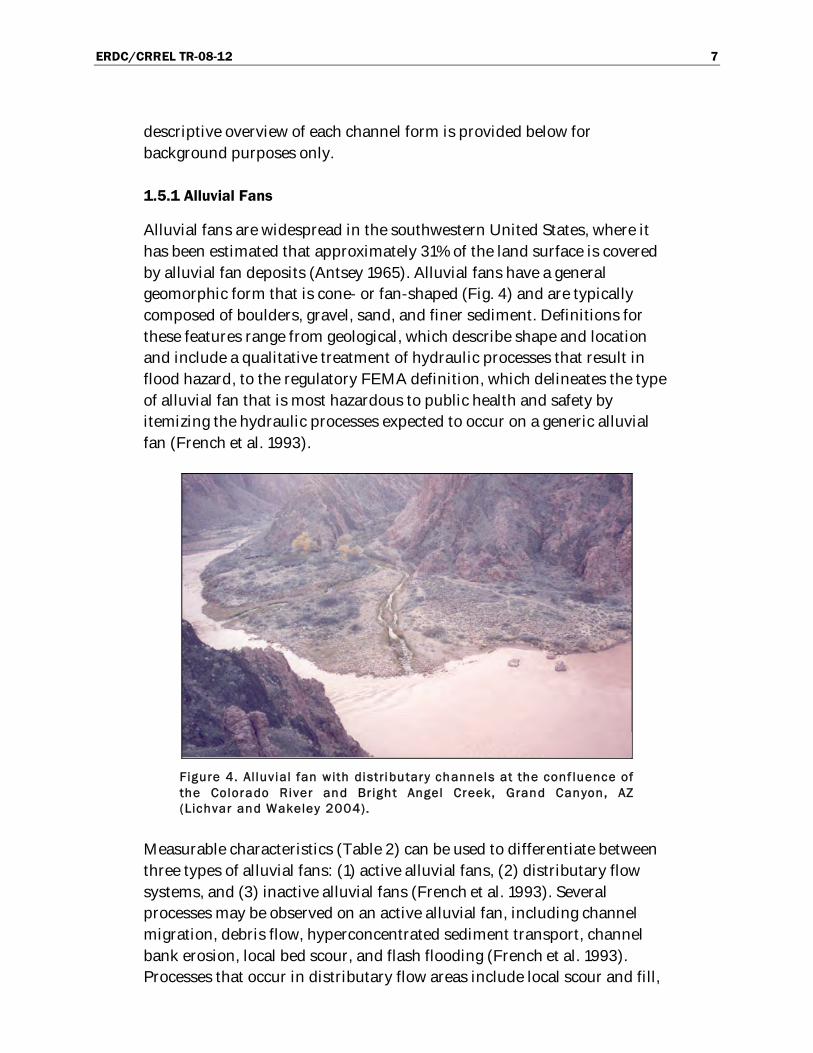
Alluvial fans are widespread in the southwestern United States, where it
has been estimated that approximately 31% of the land surface is covered
by alluvial fan deposits (Antsey 1965). Alluvial fans have a general
geomorphic form that is cone- or fan-shaped (Fig. 4) and are typically
composed of boulders, gravel, sand, and finer sediment. Definitions for
these features range from geological, which describe shape and location
and include a qualitative treatment of hydraulic processes that result in
flood hazard, to the regulatory FEMA definition, which delineates the type
of alluvial fan that is most hazardous to public health and safety by
itemizing the hydraulic processes expected to occur on a generic alluvial
fan (French et al. 1993).
Figure 4. Al luvial fan with distributary channels at the conf luence of the Colorado River and Brigh t Angel Creek, Grand Canyon, AZ (Lichvar and Wakeley 2004).
Measurable characteristics (Table 2) can be used to differentiate between
three types of alluvial fans: (1) active alluvial fans, (2) distributary flow
systems, and (3) inactive alluvial fans (French et al. 1993). Several
processes may be observed on an active alluvial fan, including channel
migration, debris flow, hyperconcentrated sediment transport, channel
bank erosion, local bed scour, and flash flooding (French et al. 1993).
Processes that occur in distributary flow areas include local scour and fill,

8 ERDC/CRREL TR-08-12
divergent flow, stream capture, flash flooding, hyperconcentrated
sediment transport, and shifting of runoff among existing channels due to
vegetative and/or sediment debris dams (French et al. 1993). Inactive
alluvial fans experience sheetflow, channel bank erosion, local deposition
or scour, flash flooding, and hyperconcentrated sediment transport
(French et al. 1993).
Table 2. Primary measurable al luvial fan characteristics. (Modif ied from the CH2M Hil l and French 1992. )
Active Al luvial Fan (1) Distributary Flow System (2) Inactive Al luvial Fan (3)
Abandoned/discontinuous channels
Discontinuous channels Continuous channels
Channel capacity decreases downstream
No definite trend in channel capacity
Channel capacity increases downstream
Channel flow changes to sheetflow Channel and sheetflow Channelized flow (overbank flow possible)
Debris flow possible Minor (or no) debris flow No debris flow
Frequent channel movement Rare channel movement Stable channels
Low channel capacity Variable channel capacity High channel capacity
No calcrete Calcrete horizons possible Calcrete horizons
No (or buried) desert varnish Varnished surfaces possible Varnished surfaces possible
No surface reddening of soils Minor reddening of soils Surface reddening of soils
Overall deposition Local erosion and deposition Overall erosion
Radiating channel pattern changes to sheetflow area
Radiating changes to tributary Tributary drainage pattern
Slope decrease downstream Slope increase at apex Slope variable
Stream capture or avulsions? Channel movement by stream capture
No channel movement
Uniform topography (low crenulation index)
Medium to low topographic relief (medium to low crenulation index)
Topographic relief (high crenulation index)
Uniform vegetation in floodplain Diverse vegetative community Diverse vegetative community
Variable channel geometry Variable channel geometry Regular channel geometry
Weak soil development Variable soil development Strong soil development
1.5.2 Compound Channels
Often considered the most common channel type in dry regions (Tooth
2000), compound channels are characterized by a single, low-flow
meandering channel inset into a wider braided channel network (Fig. 5)
(Graf 1988a). These channels are highly susceptible to widening and
avulsions (channel relocation) during moderate to high discharges, re-
establishing a low-flow channel during subsequent low flows.
ERDC/CRREL TR-08-12 9
Figure 5. Compound channel wi th a low-f low feature in the foreground, Mojave River, CA.
1.5.3 Discontinuous Ephemeral Channels
These channel forms are characterized by alternating erosional (Fig. 6)
and depositional reaches, both of which may vary in length from 15 m to
over 10 km (Bull 1997). They are constantly in flux, as headcuts (knick
Figure 6. Erosional reach (arroyo) along a discontinuous ephemeral channel, Susie Creek, NV.

10 ERDC/CRREL TR-08-12
points) originating at the downstream end of the sheetflood zone migrate
upstream, causing dramatic temporal and spatial changes in channel
morphology for any given location.
1.5.4 Single-Thread Channels with Adjacent Floodplains
In the Arid West, occurrences of single-thread channels are often limited
to perennial streams and rivers with origins extending into more humid
regions, or small streams sourced by local springs. In either case, a more
continuous supply of water is present. These streams and rivers consist of
a single-thread channel with lateral adjacent floodplains that are either
continuous or intermittent along the course of the channel (Fig. 7). In
general, the morphologies of arid- and humid-region single-thread
channels with adjacent floodplains are similar; however, transmission
losses (Reid and Frostick 1997) and debris inputs from tributaries (Graf
1979, Webb et al. 1988), which may alter the form of the channel, are
limited to arid-region examples.
Figure 7. Single-thread channel with adjacent f loodpla in, Al ter Wash, NV.
1.5.5 Anastomosing Channels
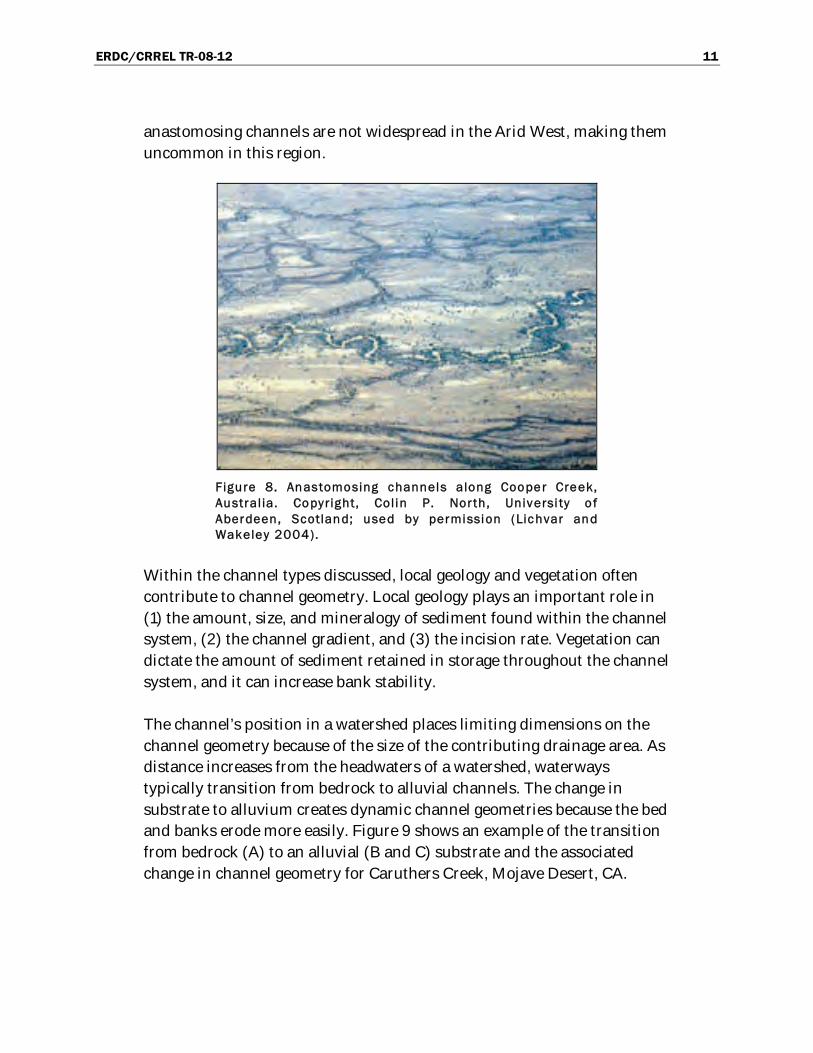
Anastomosing channel forms (Fig. 8) are multi-thread channels with
stable, fine-grained banks, transporting a suspended or mixed load
(Schumann 1989). The characteristics necessary for the development of
ERDC/CRREL TR-08-12 11
anastomosing channels are not widespread in the Arid West, making them
uncommon in this region.
Figure 8. Anastomosing channels along Cooper Creek, Austral ia. Copyright, Colin P. Nor th, Universi ty o f Aberdeen, Scotland; used by permission (Lichvar and Wakeley 2004).
Within the channel types discussed, local geology and vegetation often
contribute to channel geometry. Local geology plays an important role in
(1) the amount, size, and mineralogy of sediment found within the channel
system, (2) the channel gradient, and (3) the incision rate. Vegetation can
dictate the amount of sediment retained in storage throughout the channel
system, and it can increase bank stability.
The channel’s position in a watershed places limiting dimensions on the
channel geometry because of the size of the contributing drainage area. As
distance increases from the headwaters of a watershed, waterways
typically transition from bedrock to alluvial channels. The change in
substrate to alluvium creates dynamic channel geometries because the bed
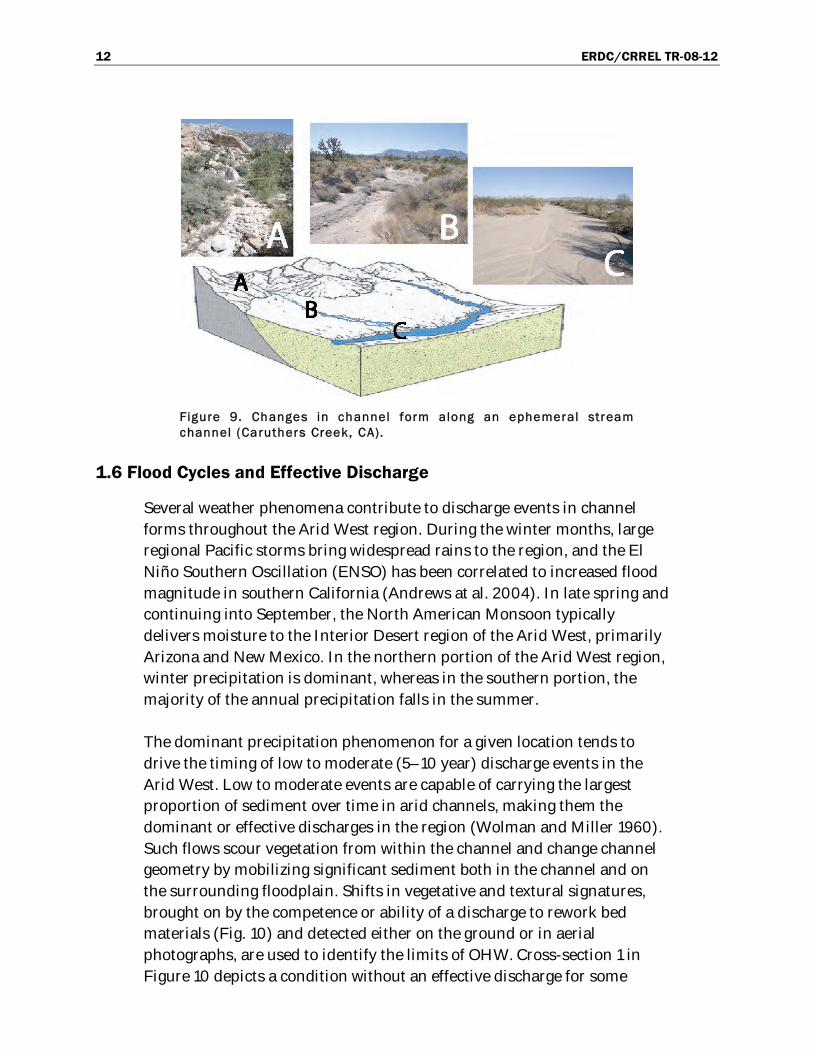
and banks erode more easily. Figure 9 shows an example of the transition
from bedrock (A) to an alluvial (B and C) substrate and the associated
change in channel geometry for Caruthers Creek, Mojave Desert, CA.
12 ERDC/CRREL TR-08-12
Figure 9. Changes in channel form along an ephemeral stream channel (Caruthers Creek, CA).
1.6 Flood Cycles and Effective Discharge
Several weather phenomena contribute to discharge events in channel
forms throughout the Arid West region. During the winter months, large
regional Pacific storms bring widespread rains to the region, and the El
Niño Southern Oscillation (ENSO) has been correlated to increased flood
magnitude in southern California (Andrews at al. 2004). In late spring and
continuing into September, the North American Monsoon typically
delivers moisture to the Interior Desert region of the Arid West, primarily
Arizona and New Mexico. In the northern portion of the Arid West region,
winter precipitation is dominant, whereas in the southern portion, the
majority of the annual precipitation falls in the summer.
The dominant precipitation phenomenon for a given location tends to
drive the timing of low to moderate (5–10 year) discharge events in the
Arid West. Low to moderate events are capable of carrying the largest
proportion of sediment over time in arid channels, making them the
dominant or effective discharges in the region (Wolman and Miller 1960).
Such flows scour vegetation from within the channel and change channel
geometry by mobilizing significant sediment both in the channel and on
the surrounding floodplain. Shifts in vegetative and textural signatures,
brought on by the competence or ability of a discharge to rework bed
materials (Fig. 10) and detected either on the ground or in aerial
photographs, are used to identify the limits of OHW. Cross-section 1 in
Figure 10 depicts a condition without an effective discharge for some

ERDC/CRREL TR-08-12 13
period of time. The low-flow channel is incised into the active floodplain,
where abundant vegetation growth is present. Cross-section 2 depicts
potential changes resulting from an effective discharge, with removal of
vegetation within the active floodplain and in-filling of the low-flow
channel. Cross-section 3 shows a potential intermediate condition
following the effective discharge and after a number of low-flow events
have occurred, resulting in the formation of a low-flow channel and
revegetation of the active floodplain. However, another effective discharge
could reset the channel back to conditions depicted in Cross-section 2.
Knowing the timing of recent effective discharges helps in interpreting
channel conditions. The physical characteristics of vegetation maturity,
cover, and species; sediment texture; and potential presence of a bank at
the active floodplain/low terrace boundary remain throughout the cycle.
Figure 10. Model of changes within the active f loodpla in and low-f low channel associated with discharge events. (Note: There may be aggradation or degradation after step 2. )
14 ERDC/CRREL TR-08-12
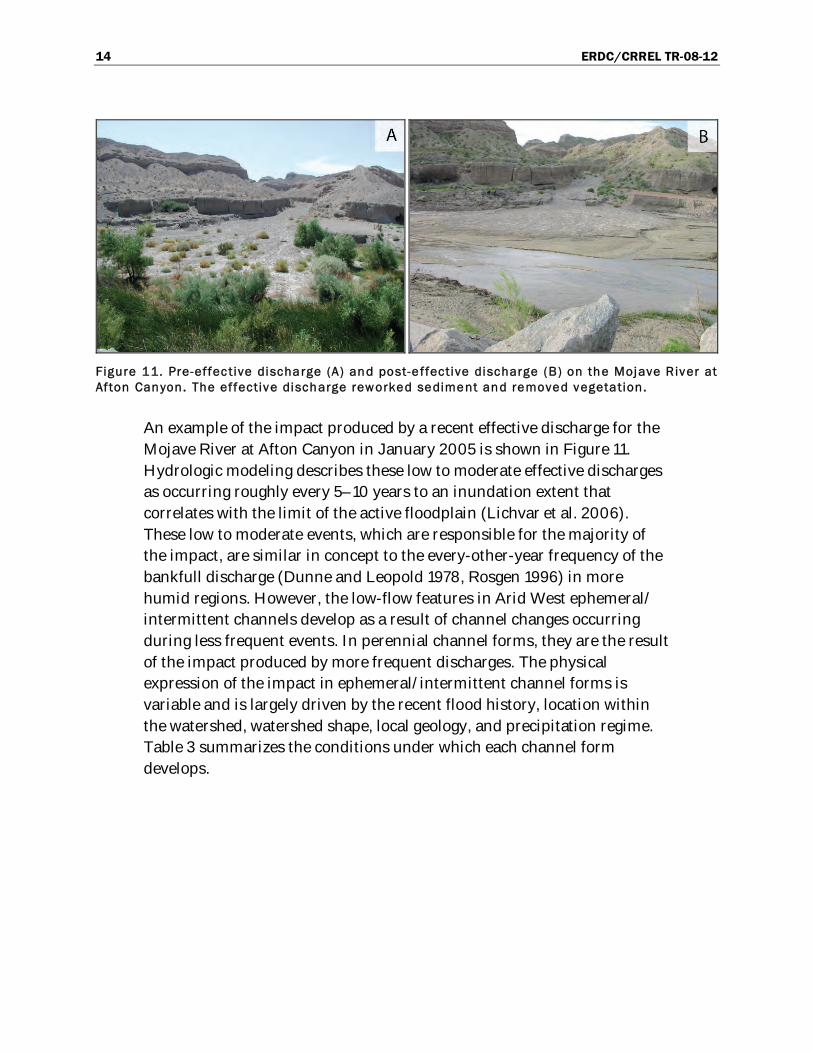
Figure 11. Pre-effec tive discharge (A) and post-e ffective discharge (B) on the Mojave River at Afton Canyon. The effective discharge reworked sediment and removed vegetation.
An example of the impact produced by a recent effective discharge for the
Mojave River at Afton Canyon in January 2005 is shown in Figure 11.
Hydrologic modeling describes these low to moderate effective discharges
as occurring roughly every 5–10 years to an inundation extent that
correlates with the limit of the active floodplain (Lichvar et al. 2006).
These low to moderate events, which are responsible for the majority of
the impact, are similar in concept to the every-other-year frequency of the
bankfull discharge (Dunne and Leopold 1978, Rosgen 1996) in more
humid regions. However, the low-flow features in Arid West ephemeral/
intermittent channels develop as a result of channel changes occurring
during less frequent events. In perennial channel forms, they are the result
of the impact produced by more frequent discharges. The physical
expression of the impact in ephemeral/intermittent channel forms is
variable and is largely driven by the recent flood history, location within
the watershed, watershed shape, local geology, and precipitation regime.
Table 3 summarizes the conditions under which each channel form
develops.

ERDC/CRREL TR-08-12 15
Table 3. Natural controls on f luvial processes.
Stream Type Photograph Natural Processes
Discontinuous ephemeral streams
– Alternating erosional and depositional reaches
– Headcuts that form at downstream end of sheet flood zones and migrate upstream
– Cycle of arroyo formation, widening, and backfilling into the valley floors
– System in equilibrium as long as length of channelized areas relative to sheet flood zones remains constant
Compound channels
– Rapid widening in response to increase in sediment transport capacity during extreme, brief, discharge
– Activation of braided channels after extreme flow events
– Meandering form that develops after long sequence of low to moderate discharges
Alluvial fans
– Fans that emerge from upland areas into zones of reduced stream power and are maintained by distributary flow
– Enhanced deposition because of decreased stream power from headwaters to valley bottom, loss in flow confinement, and loss of discharge
– Channel avulsions resulting from overbank flows emanating from channels on fan surface
Anastamosing rivers
(Copyright, Colin P. North, University of Aberdeen, Scotland; used by permission)
– Frequent channel avulsions – Smaller anabranch channels that
grow headward towards the main channel in response to overbank flows emanating from aggrading main channel
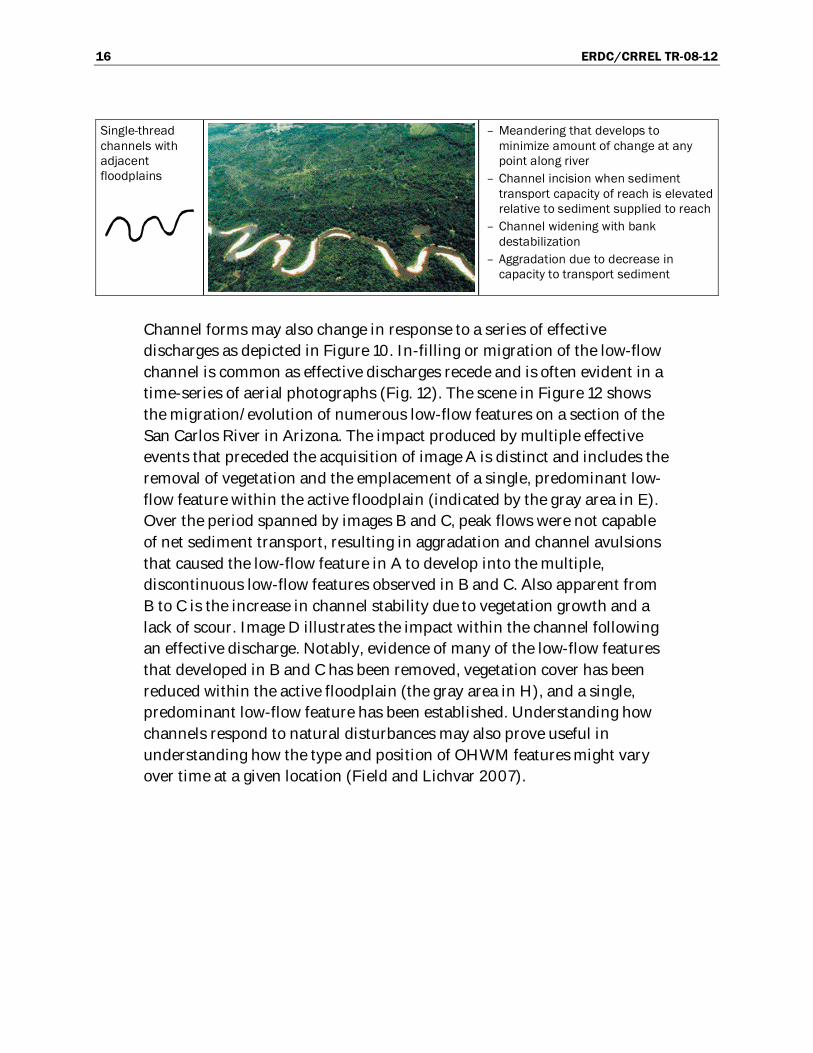
16 ERDC/CRREL TR-08-12
Single-thread channels with adjacent floodplains
– Meandering that develops to minimize amount of change at any point along river
– Channel incision when sediment transport capacity of reach is elevated relative to sediment supplied to reach
– Channel widening with bank destabilization
– Aggradation due to decrease in capacity to transport sediment
Channel forms may also change in response to a series of effective
discharges as depicted in Figure 10. In-filling or migration of the low-flow
channel is common as effective discharges recede and is often evident in a
time-series of aerial photographs (Fig. 12). The scene in Figure 12 shows
the migration/evolution of numerous low-flow features on a section of the
San Carlos River in Arizona. The impact produced by multiple effective
events that preceded the acquisition of image A is distinct and includes the
removal of vegetation and the emplacement of a single, predominant low-
flow feature within the active floodplain (indicated by the gray area in E).
Over the period spanned by images B and C, peak flows were not capable
of net sediment transport, resulting in aggradation and channel avulsions
that caused the low-flow feature in A to develop into the multiple,
discontinuous low-flow features observed in B and C. Also apparent from
B to C is the increase in channel stability due to vegetation growth and a
lack of scour. Image D illustrates the impact within the channel following
an effective discharge. Notably, evidence of many of the low-flow features
that developed in B and C has been removed, vegetation cover has been
reduced within the active floodplain (the gray area in H), and a single,
predominant low-flow feature has been established. Understanding how
channels respond to natural disturbances may also prove useful in
understanding how the type and position of OHWM features might vary
over time at a given location (Field and Lichvar 2007).

ERDC/CRREL TR-08-12 17
Figure 12. Aerial photo time-series acquired over a section of the San Carlos River, AZ, and their corresponding annual peak-f low hydrograph. The red dashed l ines on the hydrograph indicate the time of acquisition for each photo: (A) ~1971, (B) 06/08/1984, (C) 10/11/1992, and (D) 05/15/1998. The second set of images (E, F, G, and H) is a duplicate of the top set except that the active f loodplain zone is designated by l ight gray. The active f loodplain zone is only indicated for the area to the north of the bridge running diagonally across the bottom of each image.
18 ERDC/CRREL TR-08-12
1.7 Human Disturbance
Human impact can alter the type, distribution, and distinctiveness of the
physical features developed at a particular location and therefore affects
the OHWM determination. Although an almost limitless number of
combinations of human land uses can precipitate a channel response, six
human activities have generally been responsible for significant channel
adjustments in the Arid West, in terms of both magnitude of change on a
particular stream and their widespread occurrence throughout the region:
1) land clearing for agriculture or grazing; 2) urbanization; 3) gravel
mining; 4) channelization; 5) dam construction; and 6) flow modification.
Common channel responses to each of these activities, at least when
occurring in isolation, are fairly well understood and are summarized in
Table 4 (Field and Lichvar 2007). The responses may or may not occur
together, and their magnitudes may vary greatly. Ultimately, the
magnitude of a stream’s response to anthropogenic alteration is largely
controlled by the complex combination of disturbance intensity, proximity
to the stream, and soil and vegetation cover.

ERDC/CRREL TR-08-12 19
Table 4. Human controls on f luvial processes.
Human Processes Common Responses
Land clearing for agriculture or grazing
– Overgrazing, resulting in exposed soils that are less resistant to the erosive forces of floods ultimately leading to channel incision
– Increased stream power – Arroyo cutting on valley-bottom floors into confined steep-walled
arroyos – Lower water table from groundwater pumping – Increased streamflow from irrigation runoff – Slope reduction due to incision and stream power lost from
widening – Increased sediment-to-water ratio of the flow and beginning of
aggradation
Urbanization – Channel incision and enlargement – Increased peak discharge due to an increase in impermeable
surfaces – Lower water table causing dieback of stabilizing plants – Reduced flood flow due to increased flow and plant cover – Constrained flow and increased incision cause by erosion and
flood control efforts – Decreased sediment-to-water ratio of floodwaters
Gravel mining – Deposition caused by reduced gradient and flow expansion – Upstream erosion at the vertical headwall of the site – Increased sediment delivery downstream – Decreased sediment-to-water ratio downstream, causing erosion
until enough sediment is recruited from the bed and banks to offset the deficit
– Eventual widening of the incised arroyo and backfilling to the original bed elevation
Channelization
– Increased stream velocity and slope – Reduced hydraulic roughness – Increased sediment transport and capacity, resulting in channel
incision – Transport of excess sediment to unaltered reaches downstream,
causing aggradation and increased flooding
Dam construction
– Decreased peak flows downstream, sediment transport capacity, and sediment-to-water ratio
– Loss of bank soil composition – Channel incision downstream of dam – Channel narrowing – Sediment accumulation behind dam, raising channel’s bed
elevation and potentially causing aggradation upstream
Flow modifications – Increased base flow and channel vegetation caused by effluent discharge
– Aggradation caused by surface water diversion or withdrawal – Loss of riparian vegetation and channel instability caused by
groundwater extraction

20 ERDC/CRREL TR-08-12
2 OHWM Delineation Background
The OHWM is a defining element used to identify the lateral limits of non-
wetland waters under Section 404 of the Clean Water Act (33 U.S.C. 1344).
However, determining whether any particular water is a jurisdictional
WoUS involves further assessment in accordance with the regulations,
case law, and clarifying guidance. This manual addresses the identification
of the OHWM in low-gradient, alluvial ephemeral/intermittent channels
forms in the Arid West for use in the delineation of non-wetland waters.
2.1 OHWM Indicators
In dry-land fluvial systems typical of the Arid West, a clear natural scour
line impressed on the bank, recent bank erosion, destruction of native
terrestrial vegetation, and the presence of litter and debris are the most
commonly used physical characteristics to indicate the OHWM (U.S. Army
Corps of Engineers, South Pacific Division 2001). As part of an ongoing
effort to refine OHWM indicators and delineation methods for
ephemeral/intermittent channel forms, a list of potential OHWM
indicators typically found below, at, and above the OHW boundary was
developed by Lichvar and Wakeley (2004). The list includes both
geomorphic (Table 5) and vegetation (Table 6) indicators, which are sorted
by riparian wetness class. The geomorphic indicators listed in Table 5 are
produced by a range of flow events and variable watershed conditions; not
all indicators will be present in every channel. In addition to variation in
indicator presence or absence from one channel to the next, there is also
spatial and temporal variability of indicator position over the length of an
individual channel and/or laterally within the three zones (Fig. 13)
identified by Lichvar and Wakeley (2004). Over the length of the channel
and spanning the zones from below to above the OHW boundary, the
geomorphic indicators themselves vary from weathering-related
phenomena to relatively small-scale sedimentary structures to large-scale
depositional/erosional features (see Table 7 for examples). Correct
delineation of OHW in Arid West channel forms depends on the proper
identification of multiple geomorphic indicators when present and, when
possible, the recognition of vegetative patterns and the distribution of
specific species.
ERDC/CRREL TR-08-12 21
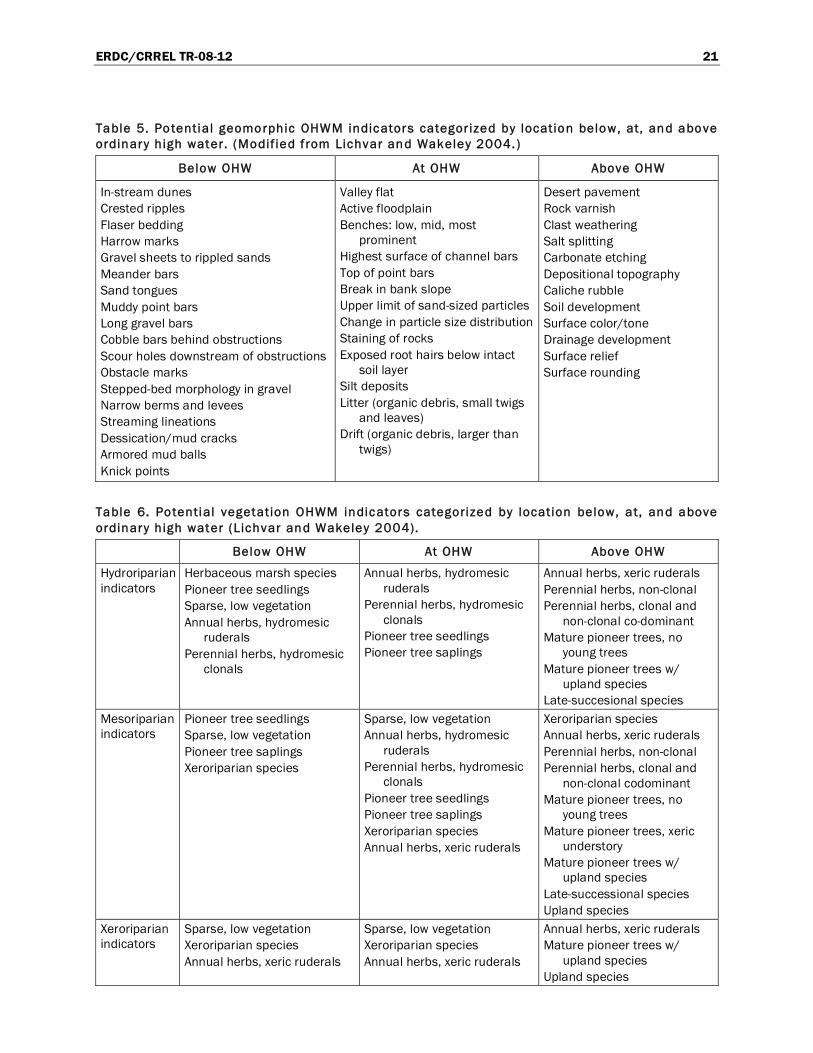
Table 5. Potential geomorphic OHWM indicators categorized by location below, at, and above ordinary high water. (Modif ied from Lichvar and Wakeley 2004. )
Below OHW At OHW Above OHW
In-stream dunes Crested ripples Flaser bedding Harrow marks Gravel sheets to rippled sands Meander bars Sand tongues Muddy point bars Long gravel bars Cobble bars behind obstructions Scour holes downstream of obstructions Obstacle marks Stepped-bed morphology in gravel Narrow berms and levees Streaming lineations Dessication/mud cracks Armored mud balls Knick points
Valley flat Active floodplain Benches: low, mid, most
prominent Highest surface of channel bars Top of point bars Break in bank slope Upper limit of sand-sized particles Change in particle size distribution Staining of rocks Exposed root hairs below intact
soil layer Silt deposits Litter (organic debris, small twigs
and leaves) Drift (organic debris, larger than
twigs)
Desert pavement Rock varnish Clast weathering Salt splitting Carbonate etching Depositional topography Caliche rubble Soil development Surface color/tone Drainage development Surface relief Surface rounding
Table 6. Potential vegetation OHWM indicators categorized by location below, at, and above ordinary high water (Lichvar and Wakeley 2004).
Below OHW At OHW Above OHW
Hydroriparian indicators
Herbaceous marsh species Pioneer tree seedlings Sparse, low vegetation Annual herbs, hydromesic
ruderals Perennial herbs, hydromesic
clonals
Annual herbs, hydromesic ruderals
Perennial herbs, hydromesic clonals
Pioneer tree seedlings Pioneer tree saplings
Annual herbs, xeric ruderals Perennial herbs, non-clonal Perennial herbs, clonal and
non-clonal co-dominant Mature pioneer trees, no
young trees Mature pioneer trees w/
upland species Late-succesional species
Mesoriparian indicators
Pioneer tree seedlings Sparse, low vegetation Pioneer tree saplings Xeroriparian species
Sparse, low vegetation Annual herbs, hydromesic
ruderals Perennial herbs, hydromesic
clonals Pioneer tree seedlings Pioneer tree saplings Xeroriparian species Annual herbs, xeric ruderals
Xeroriparian species Annual herbs, xeric ruderals Perennial herbs, non-clonal Perennial herbs, clonal and
non-clonal codominant Mature pioneer trees, no
young trees Mature pioneer trees, xeric
understory Mature pioneer trees w/
upland species Late-successional species Upland species
Xeroriparian indicators
Sparse, low vegetation Xeroriparian species Annual herbs, xeric ruderals
Sparse, low vegetation Xeroriparian species Annual herbs, xeric ruderals
Annual herbs, xeric ruderals Mature pioneer trees w/
upland species Upland species
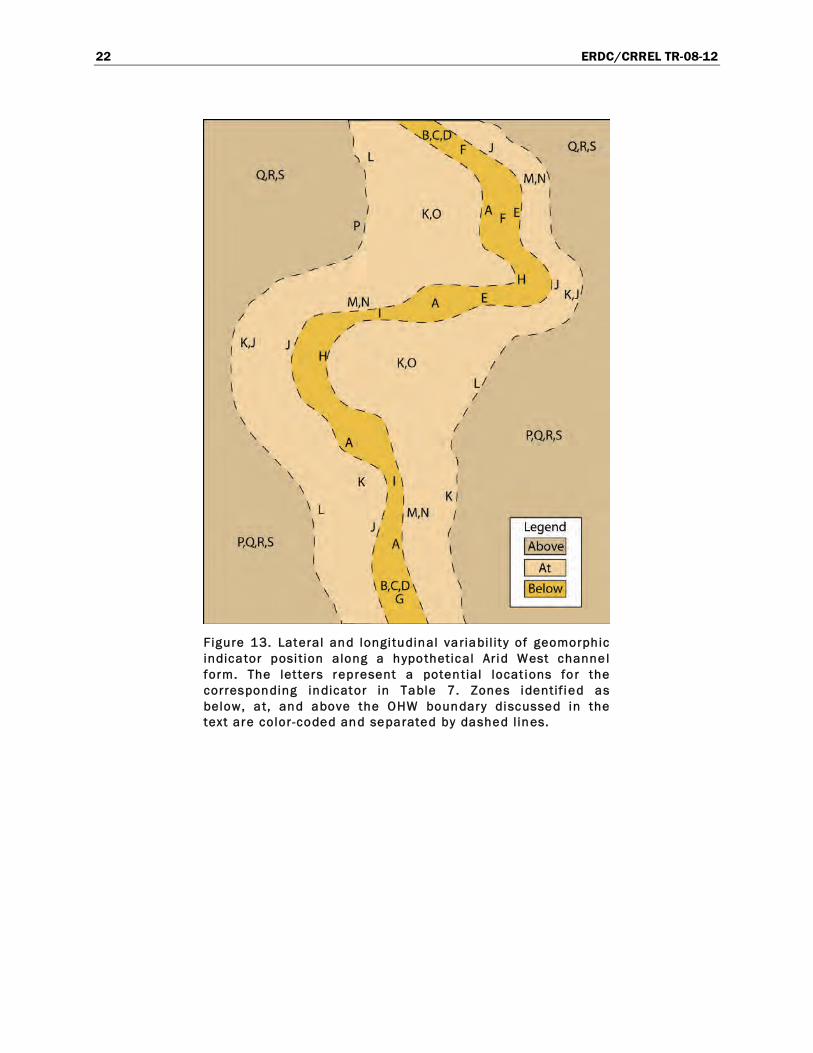
22 ERDC/CRREL TR-08-12
Figure 13. Lateral and longitudinal variabi l i t y of geomorphic indicator posi tion along a hypothetical Arid West channel form. The let ters represent a potential locat ions fo r the corresponding indicator in Table 7. Zones identif ied as below, at, and above the OHW boundary discussed in the text are color-coded and separated by dashed l ines.

ERDC/CRREL TR-08-12 23
Table 7. Select geomorphic OHWM indicators that may be present below, at, and above the OHW boundary.
Locationn Picture Description
Mudcracks – Formed by drying of fine-grained sediment – May be localized in depressions within low-flow feature(s) or near
the boundaries of the below/at OHW zones (Fig. 13)
Crested ripples – Formed by lower-intensity fluid movement over particles smaller
than 0.7 mm (Schindler and Robert 2004) – May be localized within or extend laterally across low-flow
feature(s) (Fig. 13)
Dunes – Formed by higher-intensity fluid movement over previously
formed ripples (Schindler and Robert 2004) – May be localized within or extend laterally across low-flow
feature(s) (Fig. 13)
Gravel sheets – Harrow marks (sand ridges aligned in flow direction) – Deposited due to reduced flow competence – May be localized within or extend laterally across low-flow
feature(s)
Levees and narrow berms – Sediments deposited due to decreased flow competence – May be present in the transition area between the below/at OHW
zones (Fig. 13) and/or within low-flow feature(s)
Below OHW
Long gravel bars – Litter (twigs/leaves) (Lichvar et al. 2006) – Deposited due to reduced flow competence and may be located
anywhere below the OHW boundary (Fig. 13) – Litter tends to be oriented in the direction of flow (Lichvar et al.
2006) and often collects behind/in obstructions

24 ERDC/CRREL TR-08-12
Cobble bar behind obstruction – Formation depends on flow competence/cobble availability – Obstruction determines location below the OHW boundary (Fig.
13)
Muddy point bars – Form due to reduced flow velocity – Located on the inside bend of low-flow feature(s)
Knickpoint (abrupt change in channel slope) – Formed by differential erosion above/below change in slope – May extend partially or entirely across low-flow feature(s) (Fig. 13)
Benches – Formed by the removal of previously aggraded sediment – Located near the below/at OHW boundary and potentially near
the at/above boundary (Fig. 13)
Drift (organic debris larger than twigs) – Tends to be oriented in the direction of flow (Lichvar et al. 2006) – Often collects behind/in obstructions or is simply deposited by
receding flow
Exposed root hairs below in tact soi l layer – Exposed by erosion of sediment – Tend to be located along the above/at OHW boundary or where
benches have formed
At OHW
Change in partic le size distribution – Transition from coarser to finer sediment common – Likely to occur near the at/below OHW boundary (Fig. 13)
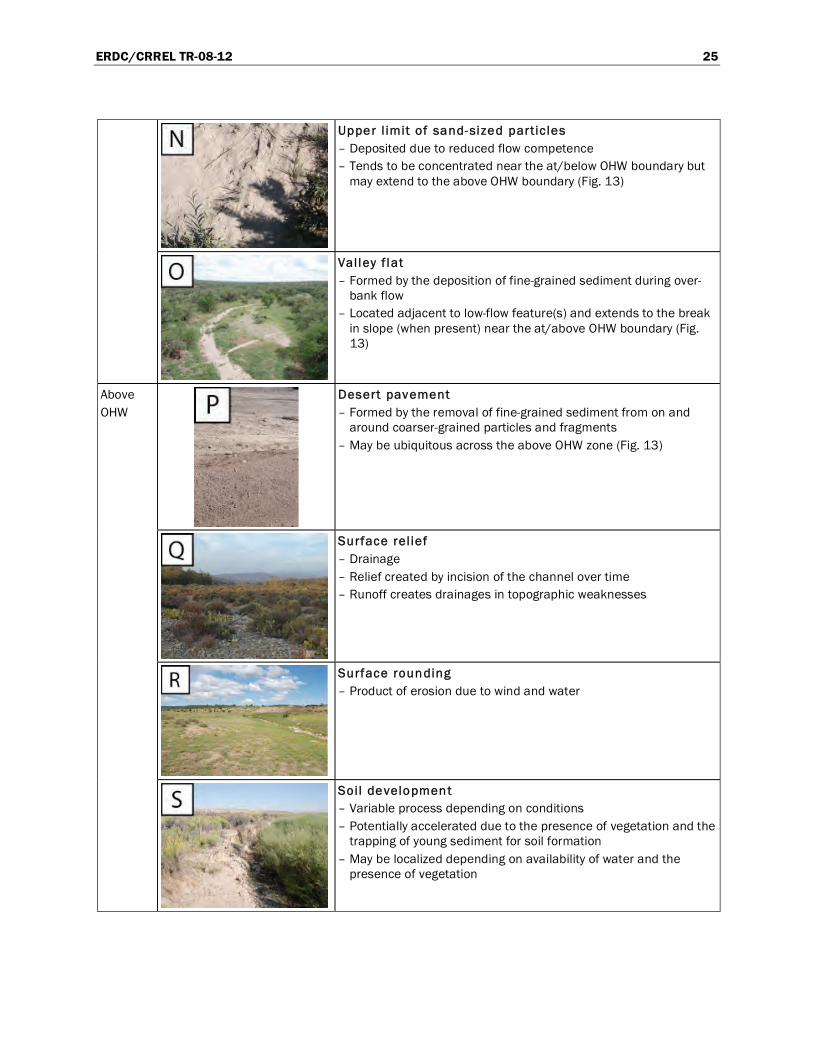
ERDC/CRREL TR-08-12 25
Upper l imit of sand-sized partic les – Deposited due to reduced flow competence – Tends to be concentrated near the at/below OHW boundary but
may extend to the above OHW boundary (Fig. 13)
Val ley f lat – Formed by the deposition of fine-grained sediment during over-
bank flow – Located adjacent to low-flow feature(s) and extends to the break
in slope (when present) near the at/above OHW boundary (Fig. 13)
Desert pavement – Formed by the removal of fine-grained sediment from on and
around coarser-grained particles and fragments – May be ubiquitous across the above OHW zone (Fig. 13)
Surface rel ief – Drainage – Relief created by incision of the channel over time – Runoff creates drainages in topographic weaknesses
Surface rounding – Product of erosion due to wind and water
Above OHW
Soil development – Variable process depending on conditions – Potentially accelerated due to the presence of vegetation and the
trapping of young sediment for soil formation – May be localized depending on availability of water and the
presence of vegetation
26 ERDC/CRREL TR-08-12
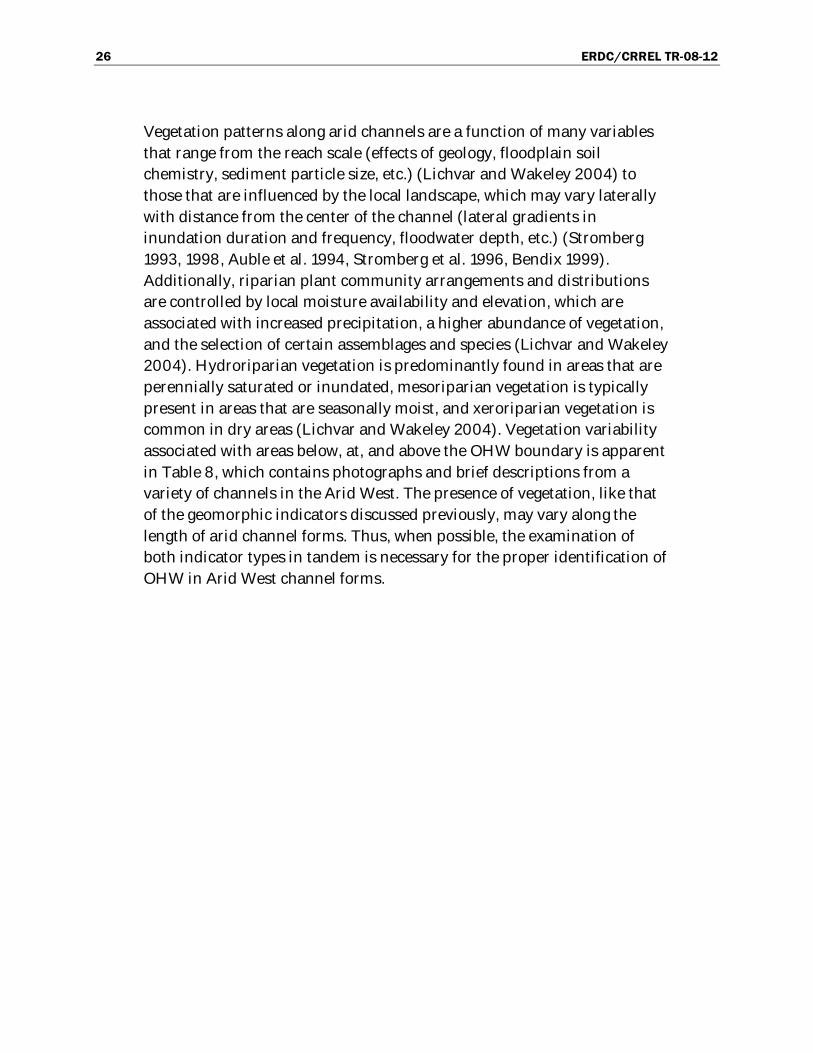
Vegetation patterns along arid channels are a function of many variables
that range from the reach scale (effects of geology, floodplain soil
chemistry, sediment particle size, etc.) (Lichvar and Wakeley 2004) to
those that are influenced by the local landscape, which may vary laterally
with distance from the center of the channel (lateral gradients in
inundation duration and frequency, floodwater depth, etc.) (Stromberg
1993, 1998, Auble et al. 1994, Stromberg et al. 1996, Bendix 1999).
Additionally, riparian plant community arrangements and distributions
are controlled by local moisture availability and elevation, which are
associated with increased precipitation, a higher abundance of vegetation,
and the selection of certain assemblages and species (Lichvar and Wakeley
2004). Hydroriparian vegetation is predominantly found in areas that are
perennially saturated or inundated, mesoriparian vegetation is typically
present in areas that are seasonally moist, and xeroriparian vegetation is
common in dry areas (Lichvar and Wakeley 2004). Vegetation variability
associated with areas below, at, and above the OHW boundary is apparent
in Table 8, which contains photographs and brief descriptions from a
variety of channels in the Arid West. The presence of vegetation, like that
of the geomorphic indicators discussed previously, may vary along the
length of arid channel forms. Thus, when possible, the examination of
both indicator types in tandem is necessary for the proper identification of
OHW in Arid West channel forms.
ERDC/CRREL TR-08-12 27
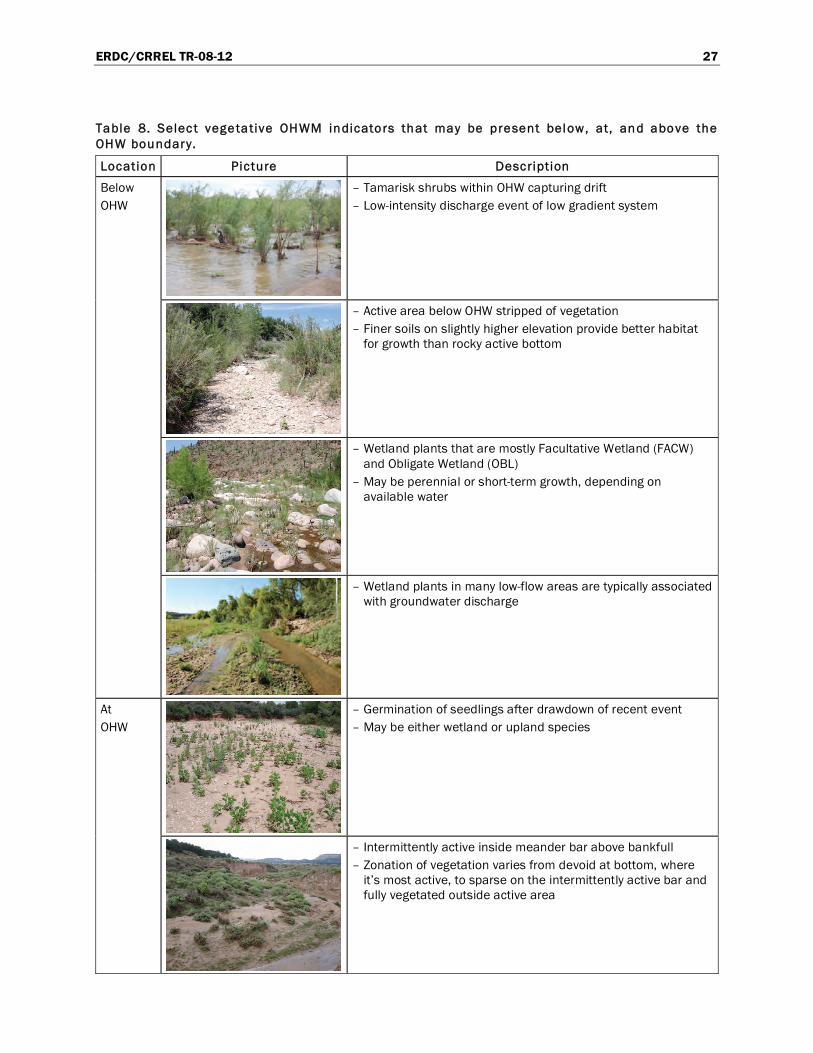
Table 8. Selec t vegetative OHWM indicators that may be present below, at, and above the OHW boundary.
Location Picture Description
– Tamarisk shrubs within OHW capturing drift – Low-intensity discharge event of low gradient system
– Active area below OHW stripped of vegetation – Finer soils on slightly higher elevation provide better habitat
for growth than rocky active bottom
– Wetland plants that are mostly Facultative Wetland (FACW) and Obligate Wetland (OBL)
– May be perennial or short-term growth, depending on available water
Below OHW
– Wetland plants in many low-flow areas are typically associated with groundwater discharge
– Germination of seedlings after drawdown of recent event – May be either wetland or upland species
At OHW
– Intermittently active inside meander bar above bankfull – Zonation of vegetation varies from devoid at bottom, where
it’s most active, to sparse on the intermittently active bar and fully vegetated outside active area

28 ERDC/CRREL TR-08-12
– Most active area is barren in foreground – Above OHW is a thick shrub zone in background lacking
physical removal from higher discharge events
– Vegetation thickens above OHW zone due to lack of disturbance from moderate events
Above OHW
– Old incised channel with active and bankfull zones – Light green shrubs located on upper active zone – Upper active zone maintained as evidenced by exposed soil
surfaces – Majority of all events sizes retained within the incised
channel walls
2.2 OHWM Indicator Distribution
The traditional use of OHWM indicators to identify the limits of non-
wetland waters is confounded in the Arid West by highly variable flow
pathways within the channel. In an attempt to correlate OHWM indicators
with flood return inundation levels, Lichvar et al. (2006) analyzed the
distribution of indicators in several Arid West channels selected from a
variety of test reaches. Long-term, continuous gage data and minimal
anthropogenic influence were required for each watershed, and each test
reach was mapped and divided into bankfull, active floodplain, and terrace
floodplain hydrogeomorphic units to provide a means for the analysis of
the distribution of the indicators (Lichvar et al. 2006). The mapped
distribution of indicators for the Mission Creek study reach is shown in
Figure 14, and the results of the statistical analysis of the indicators are
shown in Figure 15. Contrary to expectations, the positions of the OHWM
indicators are random, due to the coupling of variable pathways and
repeating effective discharges. Driven by the lack of correlation between
the distribution of OHWM indicators and flood return intervals (Fig. 15),
Lichvar et al. (2006) proposed a conceptual model (Fig. 16, top)
highlighting the influence of low to moderate events on the geometry of
Arid West channel forms and the distribution of OHWM indicators.

ERDC/CRREL TR-08-12 29
Figure 14. Hydrogeomorphic units and OHWM indicator posi tions within the Mission Creek study reach (Lichvar et al . 2006).
Figure 15. Mean ± one standard deviation for each indicator type identif ied within the Mission Creek study reach.
30 ERDC/CRREL TR-08-12
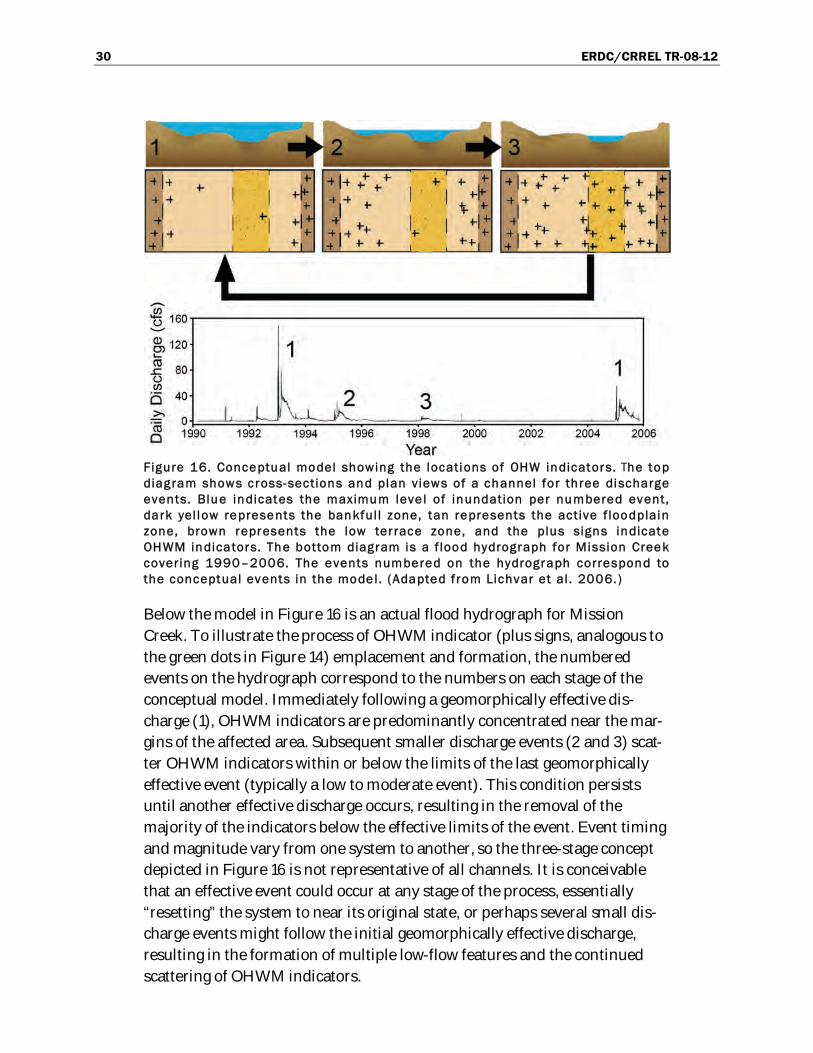
Figure 16. Conceptual model showing the locations of OHW indicators. Thhe top diag ram shows cross-sections and plan views of a channel for three discharge events. Blue indicates the maximum leve l of inundation per numbered event, dark yel low represents the bankfull zone, tan represents the active f loodplain zone, brown represents the low ter race zone, and the plus signs indicate OHWM indicators. The bottom diagram is a f lood hydrograph for Mission Creek covering 1990–2006. The events numbered on the hydrograph correspond to the conceptual events in the model. (Adapted from Lichvar et al . 2006. )
Below the model in Figure 16 is an actual flood hydrograph for Mission
Creek. To illustrate the process of OHWM indicator (plus signs, analogous to
the green dots in Figure 14) emplacement and formation, the numbered
events on the hydrograph correspond to the numbers on each stage of the
conceptual model. Immediately following a geomorphically effective dis-
charge (1), OHWM indicators are predominantly concentrated near the mar-
gins of the affected area. Subsequent smaller discharge events (2 and 3) scat-
ter OHWM indicators within or below the limits of the last geomorphically
effective event (typically a low to moderate event). This condition persists
until another effective discharge occurs, resulting in the removal of the
majority of the indicators below the effective limits of the event. Event timing
and magnitude vary from one system to another, so the three-stage concept
depicted in Figure 16 is not representative of all channels. It is conceivable
that an effective event could occur at any stage of the process, essentially
“resetting” the system to near its original state, or perhaps several small dis-
charge events might follow the initial geomorphically effective discharge,
resulting in the formation of multiple low-flow features and the continued
scattering of OHWM indicators.
ERDC/CRREL TR-08-12 31
The model suggests that the location of traditional OHWM indicators is
transitory, which is problematic for use in a regulatory program. Due to
the inherent problems using OHWM indicators for delineating the
boundaries of a non-wetland water, Lichvar et al. (2006) proposed using
other features associated with the limits of the active floodplain to support
the traditional OHWM indicators. The impact produced by geomorphically
effective events renders the limit of the active floodplain the only
repeatable feature that can be reliably used to delineate the position of a
non-wetland water’s OHWM. The active floodplain is easily identified in
the field, less variable over time, and statistically linked to the hydrologic
and hydraulic parameters of ephemeral/intermittent arid channel forms.
2.3 Identification of the Active Floodplain
As depicted in Figure 2, the active floodplain is the surface adjacent to and
receiving frequent over-bank flow from the low-flow channel (Williams
1978, Rosgen 1996). In humid regions, the active floodplain is typically
inundated during low to moderate (2- to 10-year recurrence) events (Riggs
1985) and is characterized by high-flow channels, generally unvegetated
surfaces, and frequently a break in slope at either margin (Lichvar et al.
2006). However, modeling has shown that slightly larger events (5- to 10-
year recurrence) may be necessary to engage the active floodplain in arid
systems (Lichvar et al. 2006). Areas within the active floodplain in low-
gradient, alluvial ephemeral/intermittent channel forms typically have a
reworked (naturally disturbed) appearance due to the impact of effective
flood events, so proper identification of the active floodplain includes an
awareness or knowledge of the timing of the most recent effective event.
The frequent reworking of sediments within the active floodplain during
such events often creates a contrast between areas within the active
floodplain and the adjacent low terrace. The reworked appearance may be
evident across the entire active floodplain, or it may be distributed among
features that were not affected by the most recent effective event.
The limit of the active floodplain is indicated by textural and vegetative
changes relative to the low terrace (Lichvar et al. 2006). The texture of the
active floodplain is generally coarser than that of the low terrace (Fig. 17).
The change in texture typically occurs as either a shift from sand in the
active floodplain to a predominantly cobble matrix in the low terrace, or
from a predominantly sand matrix in the active floodplain to silt in the low
terrace. Vegetative changes include a shift in the dominant species,
increasing or decreasing overall vegetative cover from the active floodplain

32 ERDC/CRREL TR-08-12
Figure 17. Active f loodplain/low ter race boundary in an Arid West channel. Note the break in slope, the textural change from sand-cobble in the low terrace to a f iner-grained matrix within the ac tive f loodpla in, and the increase in vegetative cover and maturi ty within the low terrace.
Figure 18. Vegetative shift at the ac tive f loodplain/low ter race boundary in an Arid West channel.

ERDC/CRREL TR-08-12 33
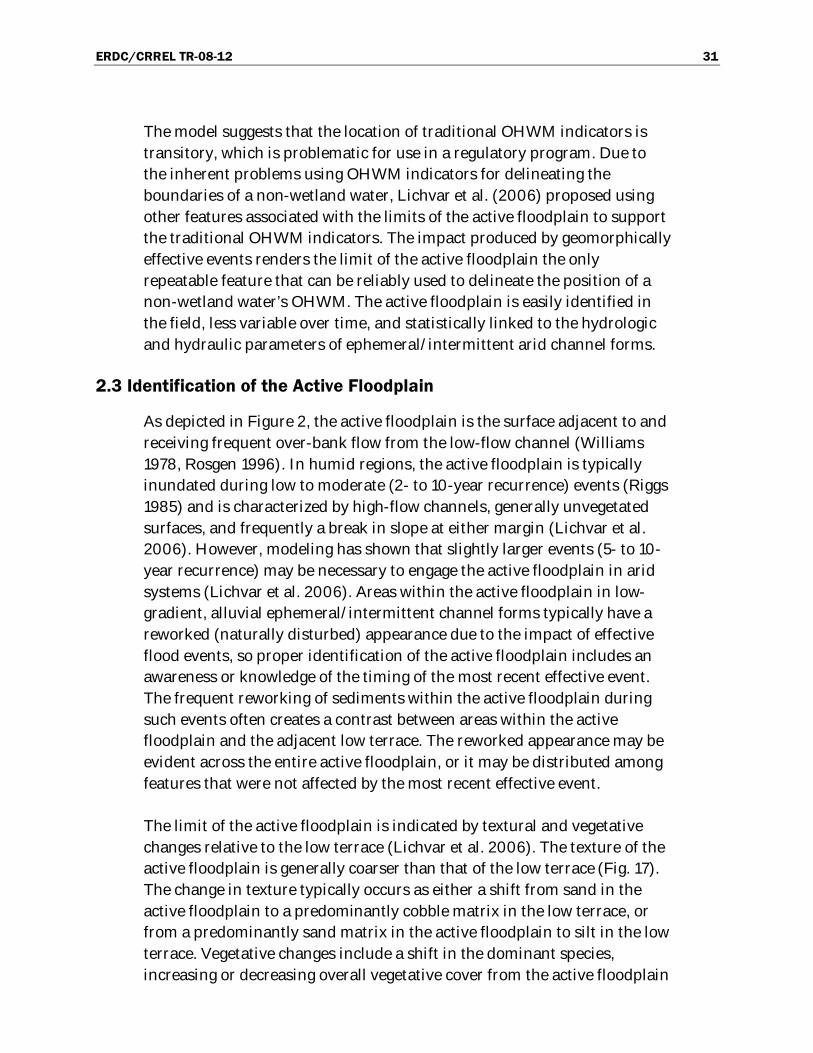
The contrast between the active floodplain and adjacent terraces and
uplands can vary depending on the influence of ground water on
vegetation density. The examples shown in Figure 19 from Caruthers
Creek, CA, and Deer Creek, CA, illustrate the potential lateral variability in
vegetation density, which can be used as an aid in the identification of the
active floodplain. At Caruthers Creek the active floodplain is much less
vegetated than the surrounding, sparsely vegetated low terrace. At Deer
Creek the circumstances are reversed; the vegetation density is highest in
the active floodplain and decreases dramatically within the low terrace. In
the examples from Figure 19, both the density and the distribution of
vegetation across the channel may be controlled by the average annual
precipitation. Deer Creek receives approximately 75% more precipitation
annually than Caruthers Creek. Also, Deer Creek is supported by ground
water and is typically dry for only one month per year, while Caruthers
Creek only flows in response to rainfall events.
2.4 Arid West OHW – Active Floodplain
The OHW zone in low-gradient, alluvial ephemeral/intermittent channel
forms in the Arid West is the active floodplain. The dynamics of arid
channel forms and the transitory nature of traditional OHWM indicators
in arid environments render the limit of the active floodplain the only
reliable and repeatable feature in terms of OHW delineation (Lichvar et al.
2006). In arid channel systems, the active floodplain functions in the same
manner as the bankfull channel within a perennial channel form, in that
most of the hydrological and fluvial dynamics produced by repeating
effective discharges is confined within its boundaries. Also, the extent of
flood model outputs for effective discharges—5- t0 10-year events in arid
channels—aligns well with the boundaries of the active floodplain, and the
characteristic vegetative behavior and sediment texture associated with
the active floodplain/low terrace transition are readily observable in aerial
photographs and in the field (Lichvar et al. 2006).
34 ERDC/CRREL TR-08-12
Figure 19. Examples of changes in vegetative cover and species between the active f loodpla in and the low terrace.
ERDC/CRREL TR-08-12 35
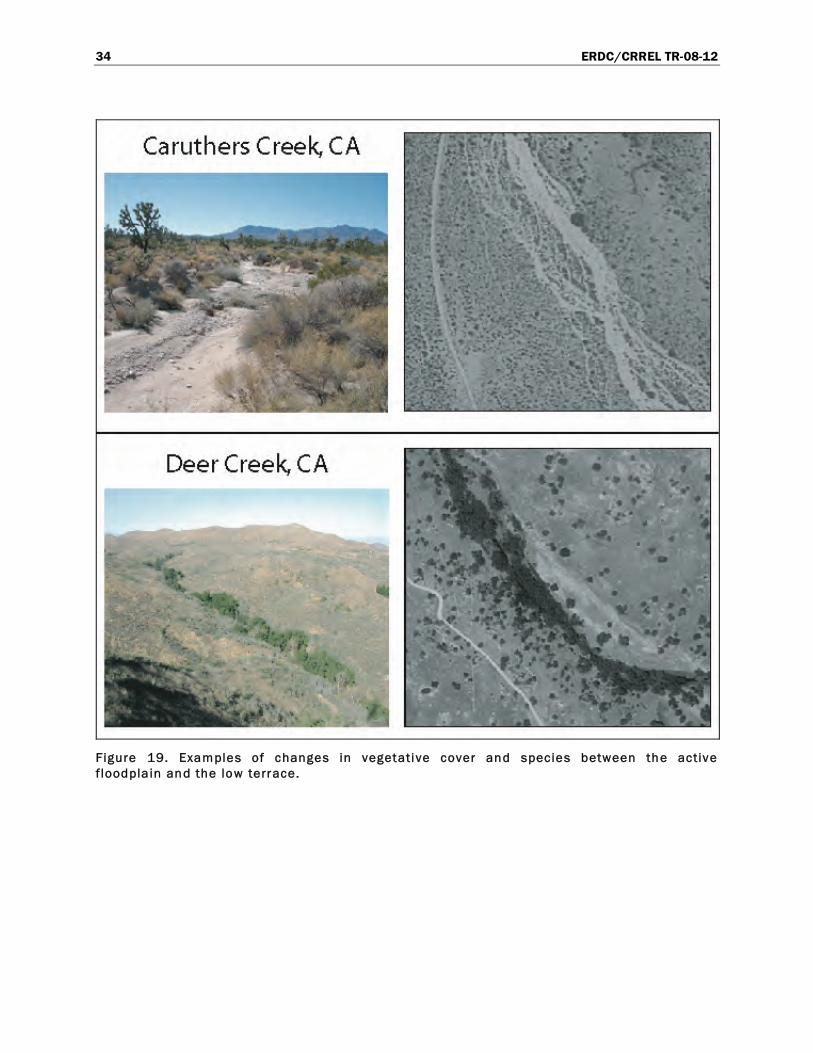
3 OHWM Identification Method
The general approach discussed below is suggested for identifying the
OHWM in low-gradient, alluvial ephemeral/intermittent channel forms in
the Arid West for use in delineating the limits of non-wetland waters.
Determining whether a water is a jurisdictional WoUS involves further
assessment in accordance with the regulations, case law, and clarifying
guidance. An identification occurs in two stages: (1) a preliminary
delineation is made based on aerial photos, gage data (if available), and
any other supporting information (e.g., topographic, soil, vegetation, and
geologic maps; false color IR images; and rainfall data) that might be
available for the area of interest, and (2) the limit of OHW is identified in
the field using OHWM indicators and verified based on the preliminary
delineation results.
3.1 Resources Needed
3.1.1 Aerial Photography and Other Imagery
Preferably, the delineation of the OHWM begins with an interpretation of
aerial photographs of the area of interest (e.g., Fig. 20). Aerial photograph
interpretation is suggested regardless of the size of the site.
The timing of the acquisition of the aerial photographs is important, so if a
discharge history is available for the delineation site, aerial photographs
should be obtained that were acquired following the most recent low to
moderate (5–10 yr) event if they are available. If not, photographs that
were acquired following an older low to moderate event should be
obtained, in addition to any more recent photographs that are available.
Also, false color infrared images acquired over the area of interest may be
used as a supplement to aerial photograph interpretations.
Contrasting patterns of vegetation and geomorphic features that are
related to breaks in slope and are associated with the active floodplain and
low terrace zones of a channel cross-section can typically be interpreted
directly from aerial photographs and other types of remotely sensed
imagery. Textural changes associated with the reworked appearance of the
active floodplain must be inferred based on lateral variability in color
(tone) and brightness within the channel cross-section. It is these three

36 ERDC/CRREL TR-08-12
Figure 20. Aerial photograph acquired over Chin le Creek, AZ.
variables—vegetation density, breaks in slope, and texture associated with
reworked materials—that are used to make a preliminary identification of
the limits of the active floodplain.
Preliminary mapping can be done either on paper using the photographs
as a base or on a digital file using GIS software. When available, stereo
pairs should be utilized to determine subtle topographic variation within
the area of interest. The photograph resolution should be sufficient to
detect the smallest feature of interest; a minimum mapping scale of
1:24,000 is suggested to retain the necessary information for a preliminary
delineation. Aerial photography, which may be obtained from in-house
holdings, local governments, various federal agencies, and the Internet
(Table 9), can also be used to establish the types of features that are
present, both upstream and downstream of the site, that may influence
interpretation of the site dynamics.

ERDC/CRREL TR-08-12 37
Table 9. Websi tes with access to digital imagery.
Coverage Website
AZ http://aria.arizona.edu/
CA http://gis.ca.gov/data.epl
ID http://giscenter.isu.edu/data/index.htm
NM http://rgis.unm.edu/intro.cfm
NV http://keck.library.unr.edu/datawarehouse.html
OR http://www.oregon.gov/DAS/EISPD/GEO/data/doq.shtml
TX http://www.tnris.state.tx.us/stratmap/doq.htm
UT http://agrc.utah.gov/agrc_sgid/sgidintro.html
WA http://gis.ess.washington.edu/data/raster/index.html
WY http://wgiac.state.wy.us/html/aboutDoqq2002.asp
National http://datagateway.nrcs.usda.gov/
National http://worldwind.arc.nasa.gov/index.html
National http://www.terraserver.com/
National http://store.usgs.gov/
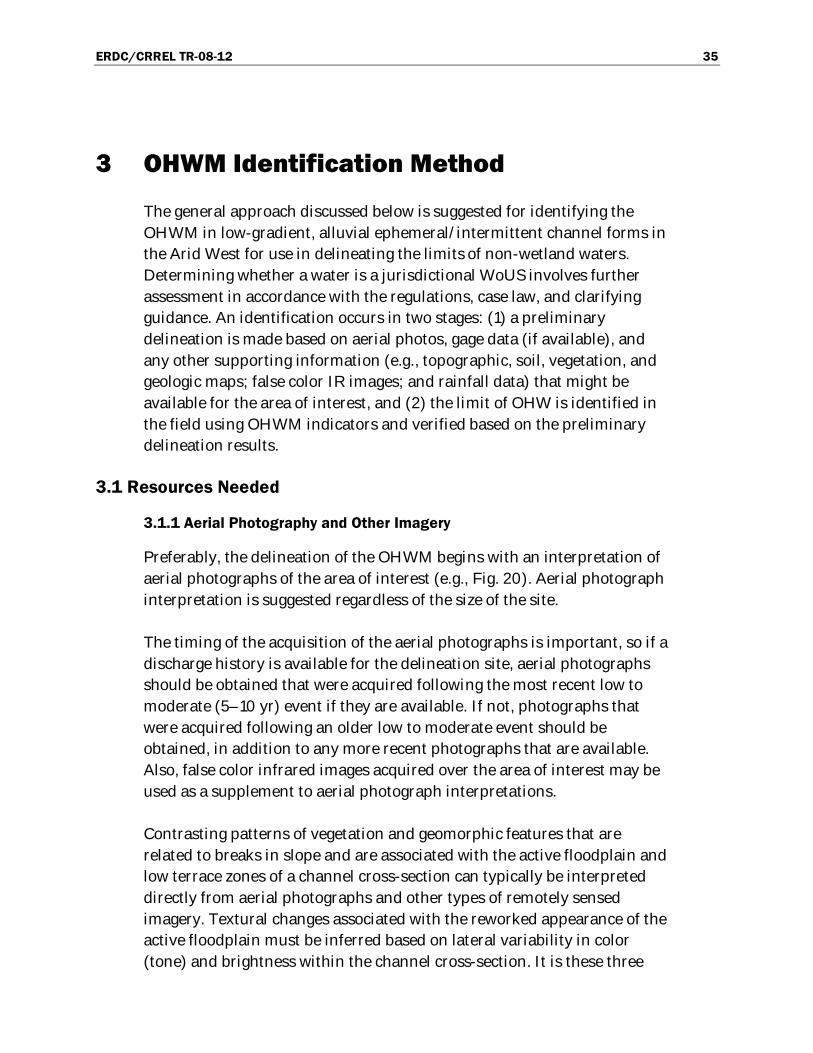
3.1.2 Topographic Maps
Topographic maps (e.g., Fig. 21) are useful in interpreting the influence of
the surrounding landscape on the delineation location. They show both
natural and anthropogenic influences on the area and can also be used as a
guide for orientation within the area. Topographic maps, like aerial
photographs, can be obtained from in-house holdings, local governments,
various federal agencies, and the Internet. Many are available digitally at
no cost at the websites listed in Table 9.
38 ERDC/CRREL TR-08-12
Figure 21. Section of a topographic map of the Fried Liver Wash Quadrangle, CA. The map scale is 1:24,000, and the topographic contour in terval is 40 ft.
3.1.3 Other Maps
Geologic, vegetation, and soils maps, when available, provide an
opportunity to gain a deeper understanding of not only the delineation
site, but also the watershed that influences it. Although supplemental
maps are not required for a preliminary delineation, preliminary
interpretations may be more precise and the potential complexity of field
delineations can be reduced if all available resources are utilized.
Geologic maps (e.g., Fig. 22) provide information regarding geologic
controls and alluvial materials present at the delineation site, and, based
on the broader geology of the watershed, inferences can be made regarding
the availability and types of sediment that may be transported within the
channel during flow events. Based on the geologic map interpretations, it
may be possible to draw conclusions regarding geomorphic features of
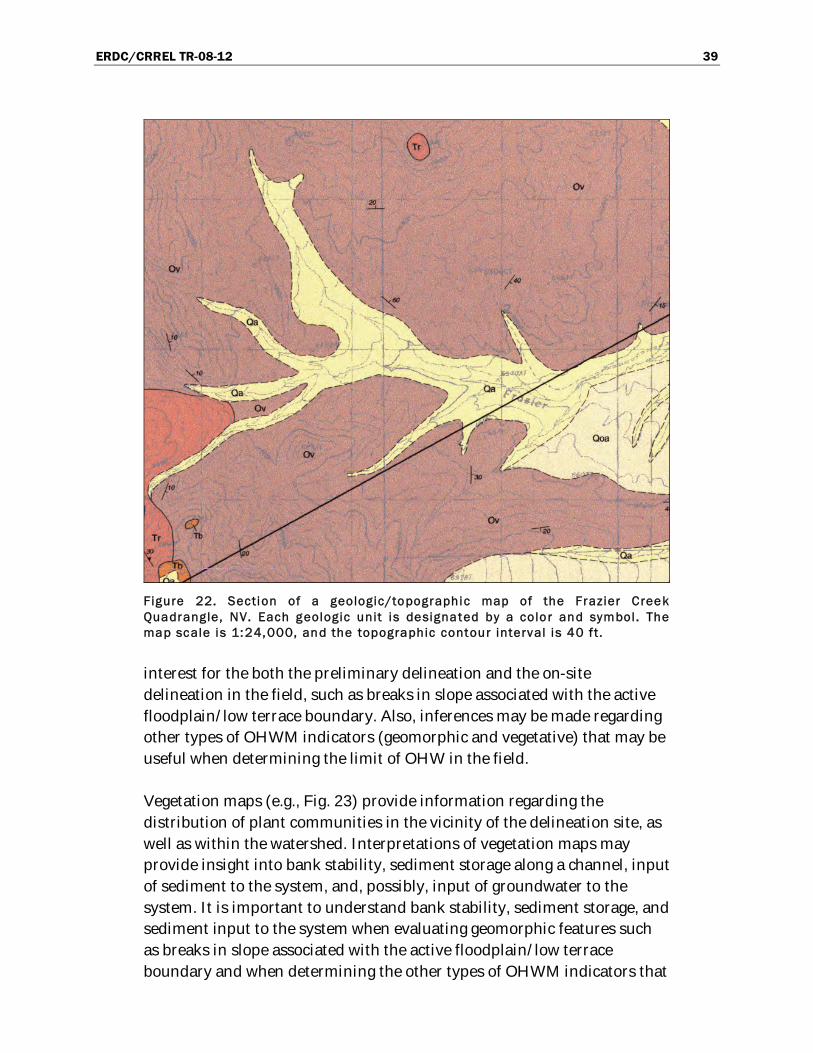
ERDC/CRREL TR-08-12 39
Figure 22. Section of a geologic/topographic map of the Frazier Creek Quadrangle, NV. Each geologic unit i s designated by a color and symbol. The map scale is 1:24,000, and the topographic contour interval i s 40 ft.
interest for the both the preliminary delineation and the on-site
delineation in the field, such as breaks in slope associated with the active
floodplain/low terrace boundary. Also, inferences may be made regarding
other types of OHWM indicators (geomorphic and vegetative) that may be
useful when determining the limit of OHW in the field.
Vegetation maps (e.g., Fig. 23) provide information regarding the
distribution of plant communities in the vicinity of the delineation site, as
well as within the watershed. Interpretations of vegetation maps may
provide insight into bank stability, sediment storage along a channel, input
of sediment to the system, and, possibly, input of groundwater to the
system. It is important to understand bank stability, sediment storage, and
sediment input to the system when evaluating geomorphic features such
as breaks in slope associated with the active floodplain/low terrace
boundary and when determining the other types of OHWM indicators that

40 ERDC/CRREL TR-08-12
Figure 23. General vegetation map of New Mexico. The map i l lust rates the distribut ion of plant communities across the enti re state.
may be present at the site. Groundwater input to the system is pertinent
when interpreting vegetation density associated with a particular zone of a
channel cross-section in both the preliminary procedure and during the
on-site procedure in the field.
Soils maps (e.g., Fig. 24) provide information regarding the distribution of
soil types within the area of interest. Typically, Arid West stream channels
lack soil profile features associated with hydric soils. Preliminary
interpretations of the soil types present at a delineation site may reveal
areas of relative stability (mature soils) within the channel cross-section,
which often indicate the repeated or long-term presence of water. Both
factors—mature soil and the presence of water—contribute to the density
and distribution of vegetation, which is often related to bank stability, and
therefore, the potential presence of a break in slope. Also, an understand-
ing of the distribution of soils within the area of interest may reduce the
complexity of textural interpretations based on aerial photograph analysis.
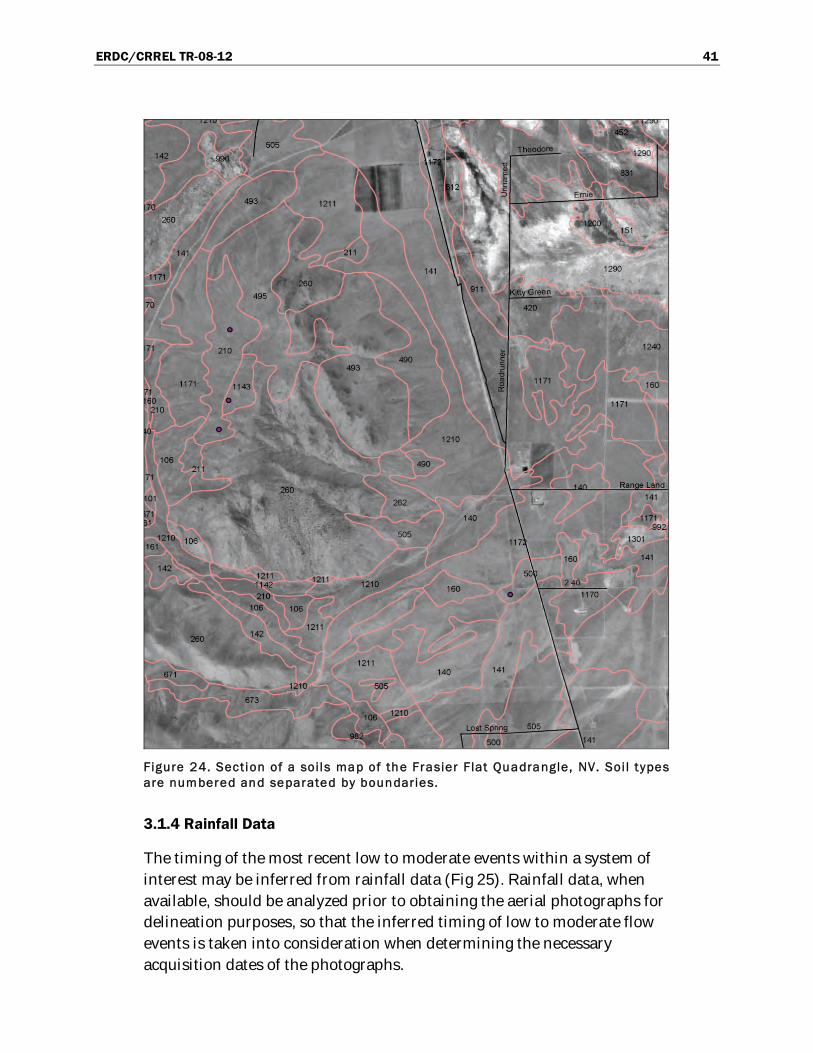
ERDC/CRREL TR-08-12 41
Figure 24. Section of a soi ls map of the Frasier Flat Quadrangle, NV. Soi l t ypes are numbered and separated by boundaries.
3.1.4 Rainfall Data
The timing of the most recent low to moderate events within a system of
interest may be inferred from rainfall data (Fig 25). Rainfall data, when
available, should be analyzed prior to obtaining the aerial photographs for
delineation purposes, so that the inferred timing of low to moderate flow
events is taken into consideration when determining the necessary
acquisition dates of the photographs.
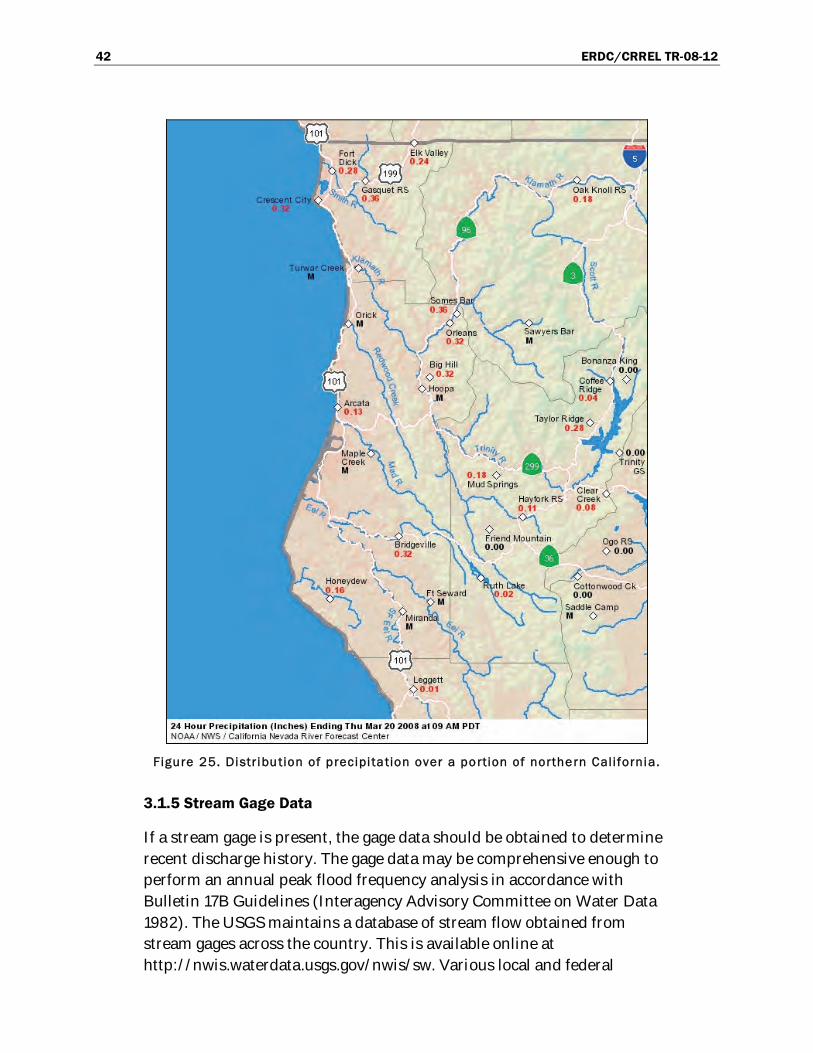
42 ERDC/CRREL TR-08-12
Figure 25. Distribution of precipi tation over a portion of northern California.
3.1.5 Stream Gage Data
If a stream gage is present, the gage data should be obtained to determine
recent discharge history. The gage data may be comprehensive enough to
perform an annual peak flood frequency analysis in accordance with
Bulletin 17B Guidelines (Interagency Advisory Committee on Water Data
1982). The USGS maintains a database of stream flow obtained from
stream gages across the country. This is available online at
http://nwis.waterdata.usgs.gov/nwis/sw. Various local and federal
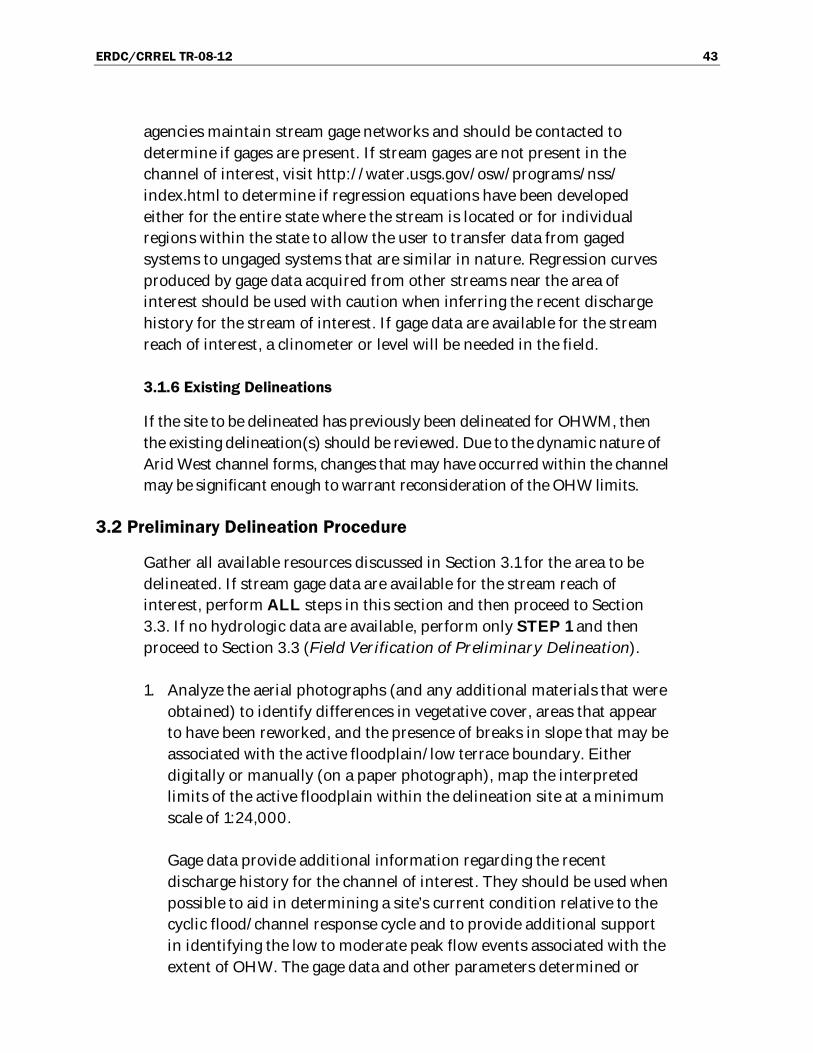
ERDC/CRREL TR-08-12 43
agencies maintain stream gage networks and should be contacted to
determine if gages are present. If stream gages are not present in the
channel of interest, visit http://water.usgs.gov/osw/programs/nss/
index.html to determine if regression equations have been developed
either for the entire state where the stream is located or for individual
regions within the state to allow the user to transfer data from gaged
systems to ungaged systems that are similar in nature. Regression curves
produced by gage data acquired from other streams near the area of
interest should be used with caution when inferring the recent discharge
history for the stream of interest. If gage data are available for the stream
reach of interest, a clinometer or level will be needed in the field.
3.1.6 Existing Delineations
If the site to be delineated has previously been delineated for OHWM, then
the existing delineation(s) should be reviewed. Due to the dynamic nature of
Arid West channel forms, changes that may have occurred within the channel
may be significant enough to warrant reconsideration of the OHW limits.
3.2 Preliminary Delineation Procedure
Gather all available resources discussed in Section 3.1 for the area to be
delineated. If stream gage data are available for the stream reach of
interest, perform ALL steps in this section and then proceed to Section
3.3. If no hydrologic data are available, perform only STEP 1 and then
proceed to Section 3.3 (Field Verification of Preliminary Delineation).
1. Analyze the aerial photographs (and any additional materials that were
obtained) to identify differences in vegetative cover, areas that appear
to have been reworked, and the presence of breaks in slope that may be
associated with the active floodplain/low terrace boundary. Either
digitally or manually (on a paper photograph), map the interpreted
limits of the active floodplain within the delineation site at a minimum
scale of 1:24,000.
Gage data provide additional information regarding the recent
discharge history for the channel of interest. They should be used when
possible to aid in determining a site’s current condition relative to the
cyclic flood/channel response cycle and to provide additional support
in identifying the low to moderate peak flow events associated with the
extent of OHW. The gage data and other parameters determined or

44 ERDC/CRREL TR-08-12
inferred from them will be most accurate near the gage where they
were collected. As distance increases either above or below the gage
location, the use of physical evidence to identify the limit of OHW is
emphasized. In some cases, as distance increases from the gage, the
nature of the channel may not change and the physical evidence
associated with the limit of OHW identified near the gage will be
representative of the limit identified either below or above the gage
location. However, it should never be assumed that the relationships
determined at the gage will be valid at other positions along the
channel.
2. Download and use a software package (e.g., HEC-SSP) to perform an
annual peak flood frequency analysis (FFA) following Bulletin 17B
guidelines (Interagency Advisory Committee on Water Data 1982) (Fig.
26). Please note that a user’s manual containing all of the pertinent
information for the HEC-SSP software is downloaded at the time of the
software acquisition (http://www.hec.usace.army.mil/ software/hec-
ssp/index.html).
3. From the FFA results, determine the discharge (cfs) for 2-, 5-, 10-, and
25-year events at the gage of interest. The probability of each event is
0.5, 0.2, 0.1, and 0.04, respectively (Fig. 27).
4. For real-time gages (those accessible via http://waterdata.usgs.gov/
nwis/rt) within CA, CO, NV, OR, or ID, download and save the most
current shift-adjusted rating curve from the station’s real-time data
webpage. For real-time gages elsewhere, or for non-real-time gages,
contact the state USGS Water Resources district and request the gage
station’s most current shift-adjusted rating.
5. Examine the recent discharge history including annual peak flow records
obtained via the Internet (http://waterdata.usgs.gov/nwis/sw) and
determine the discharge value that is associated with the most recent event
exceeding a 5-year event, as well as the amount of time that has elapsed
since the most recent event exceeding a 5-year event (Fig. 28).
6. Using the most recent shift-adjusted rating curve, determine the stage
heights (see note below) associated with discharges for the 2-, 5-, 10-,
and 25-year events and the most recent event that exceeds a 5-year
event (Fig. 29).
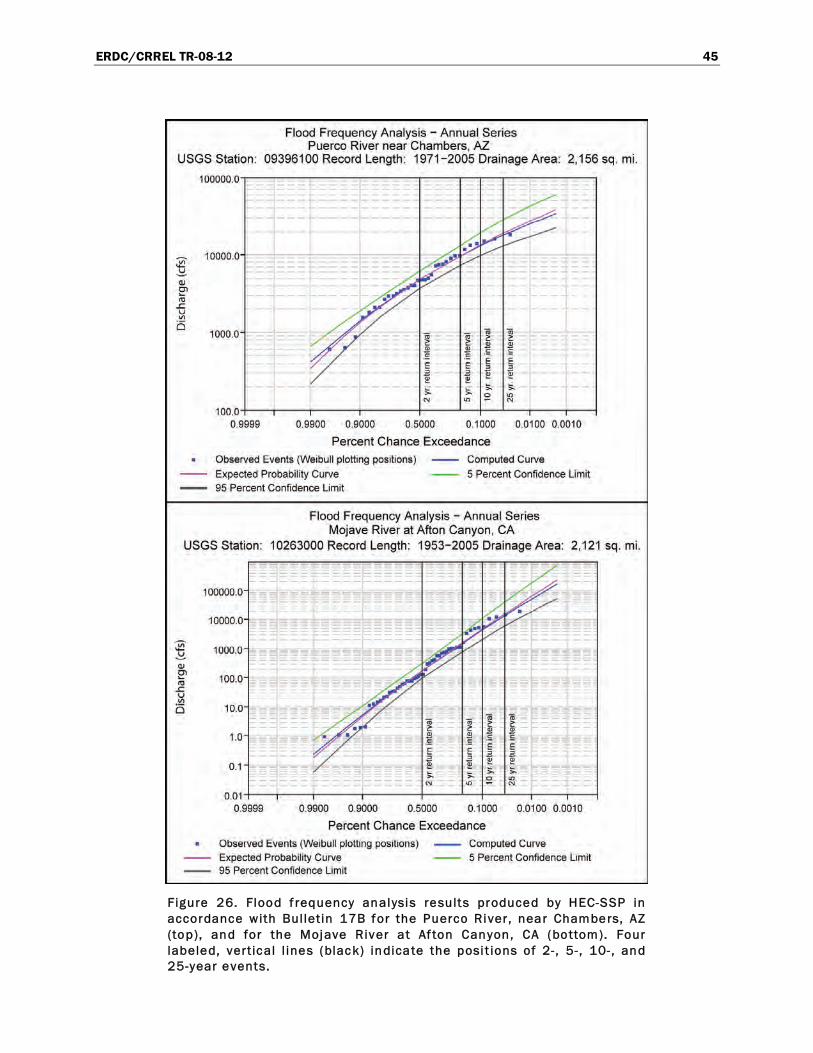
ERDC/CRREL TR-08-12 45
Figure 26. Flood f requency analysis results produced by HEC-SSP in accordance with Bulletin 17B for the Puerco River, near Chambers, AZ (top), and for the Mojave River at Af ton Canyon, CA (bottom). Four labeled, vertical l ines (black) indicate the posi t ions of 2- , 5- , 10-, and 25-year events.
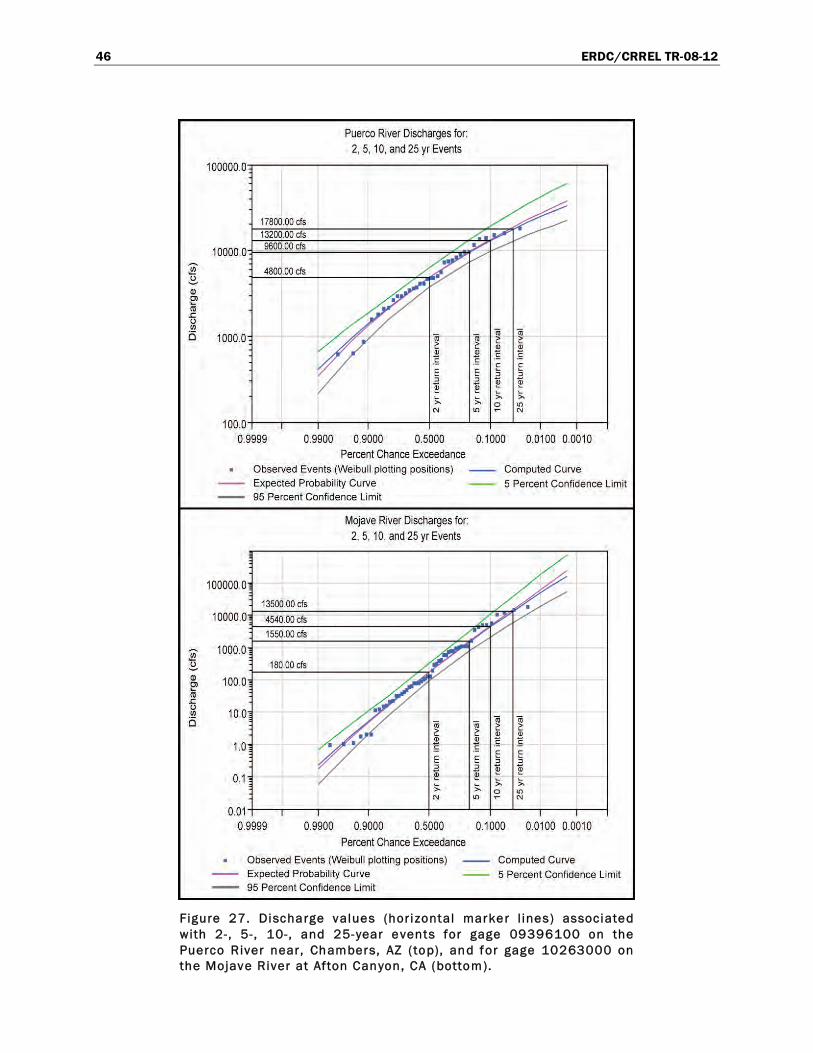
46 ERDC/CRREL TR-08-12
Figure 27. Discharge values (hori zontal marker l ines) associated with 2-, 5- , 10-, and 25-year events for gage 09396100 on the Puerco River near, Chambers, AZ ( top), and for gage 10263000 on the Mojave River at Afton Canyon, CA (bottom).
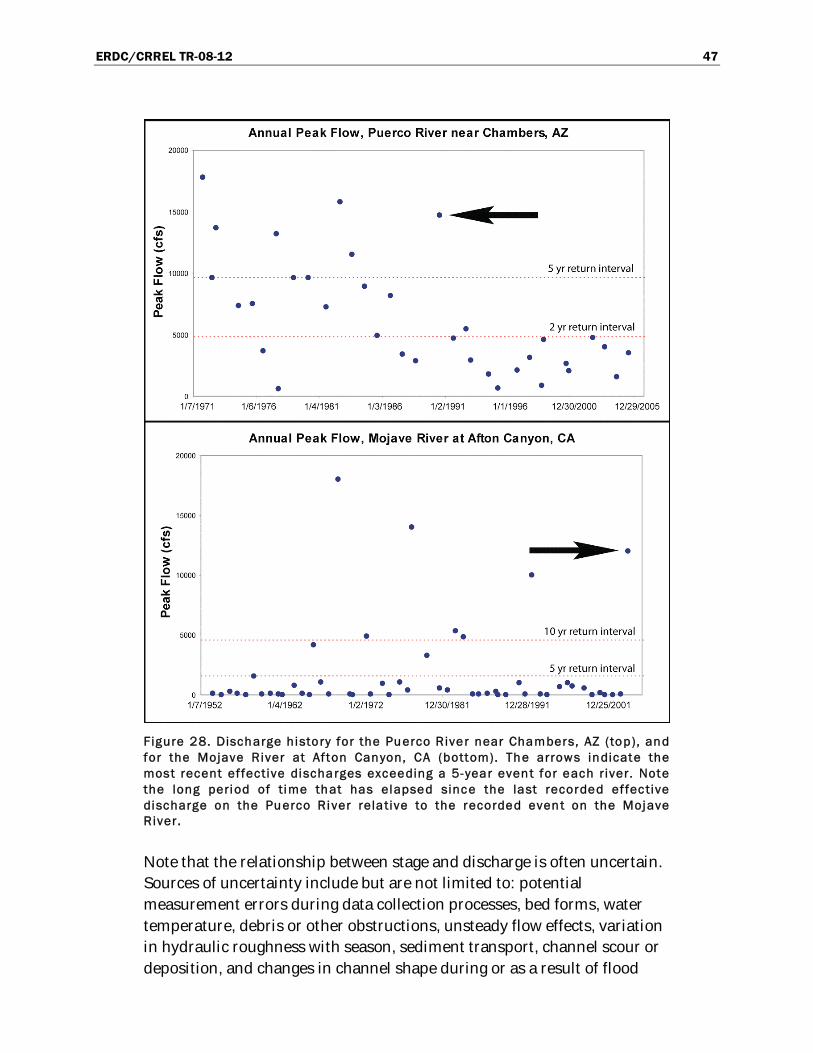
ERDC/CRREL TR-08-12 47
Figure 28. Discharge history for the Puerco River near Chambers, AZ (top), and for the Mojave River at Afton Canyon, CA (bottom). The arrows indicate the most recent effective discharges exceeding a 5-year event for each river. Note the long period of t ime that has elapsed since the last recorded effec tive discharge on the Puerco River relative to the recorded event on the Mojave River.
Note that the relationship between stage and discharge is often uncertain.
Sources of uncertainty include but are not limited to: potential
measurement errors during data collection processes, bed forms, water
temperature, debris or other obstructions, unsteady flow effects, variation
in hydraulic roughness with season, sediment transport, channel scour or
deposition, and changes in channel shape during or as a result of flood
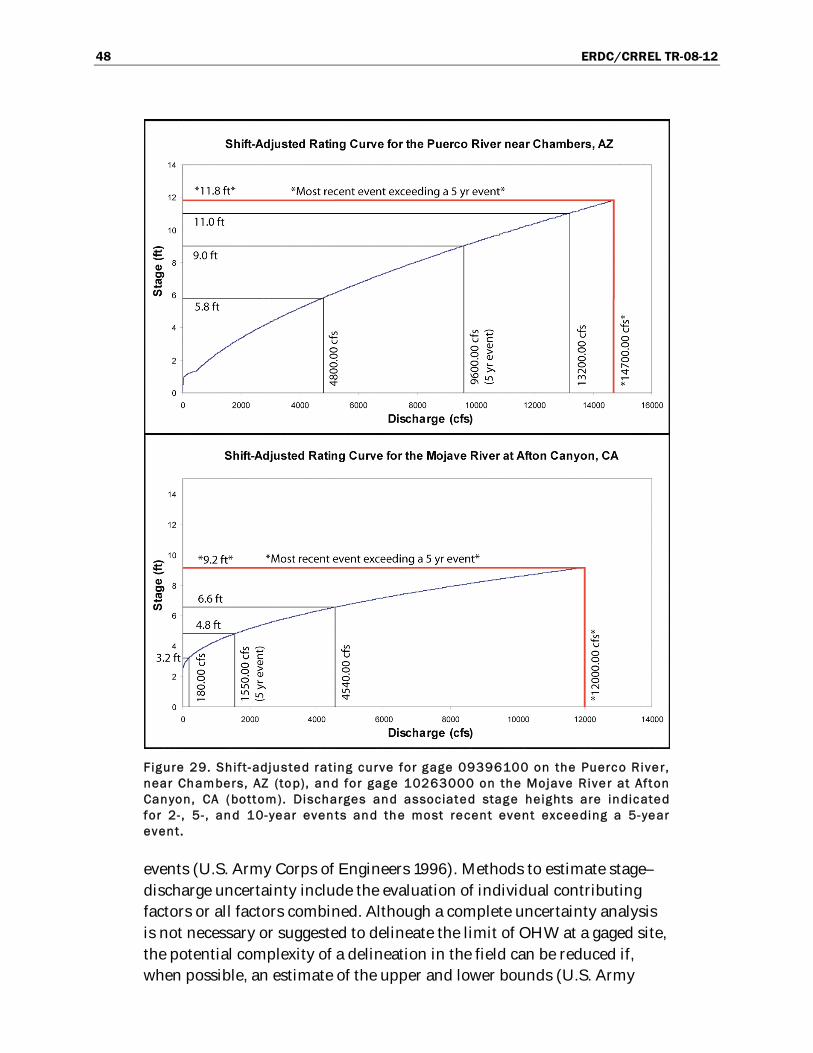
48 ERDC/CRREL TR-08-12
Figure 29. Shift-adjusted rating curve for gage 09396100 on the Puerco River, near Chambers, AZ (top), and for gage 10263000 on the Mojave River at Afton Canyon, CA (bottom). Discharges and associated stage heights are indicated for 2- , 5- , and 10-year events and the most recent event exceeding a 5-year event.
events (U.S. Army Corps of Engineers 1996). Methods to estimate stage–
discharge uncertainty include the evaluation of individual contributing
factors or all factors combined. Although a complete uncertainty analysis
is not necessary or suggested to delineate the limit of OHW at a gaged site,
the potential complexity of a delineation in the field can be reduced if,
when possible, an estimate of the upper and lower bounds (U.S. Army

ERDC/CRREL TR-08-12 49
Corps of Engineers 1996) on stage for discharge values of interest (e.g., 2-,
5-, 10-, and 25-year events and the most recent event exceeding a 5-year
event) is obtained, during the Preliminary Delineation Procedure.
Once the Preliminary Delineation Procedure is complete, proceed to
Section 3.3 (Field Verification of the Preliminary Delineation).
3.3 Field Verification of the Preliminary Delineation
Appendix A contains a datasheet that is designed to be used with the steps
of the procedure described below. It functions as a checklist to ensure that
all appropriate resources and information have been collected and
analyzed prior to going into the field, and it is used to document all on-site
observations that are relevant to accurately and reliably identifying the
limits of non-wetland waters.
1. Walk the channel and one side of the surrounding floodplain (Fig. 30) to
get a general impression of the distribution of vegetation, as well as the
variety of species that are present within that portion of the study area.
Also, note the geomorphic features that will be useful in determining the
limit of OHW, such as breaks in slope (see Tables 5 and 7 for other
examples). Identify and record surrounding upland land use and
hydrologic alteration, as well as structures, both in-stream and on the
floodplain (see Table 4 for specific examples).
Figure 30. Step 1 of the f ield verif ication procedure. The arrows indicate a potential foot path that would provide an overal l impression of the vegetation, geomorphology, upland land use, and hydrologic alteration w ithin the area of in terest.

50 ERDC/CRREL TR-08-12
2. When present, locate the low-flow channel (Fig. 31). In some systems the
low-flow channel may be obscured, as in cross-section 2 in Figure 10. If a
low-flow channel is not apparent, proceed to step 4. If the low-flow
channel is visible, or if there are multiple low-flow channels, observe and
record the percent vegetation cover by strata within the feature(s) and
approximate the stand age (early successional to mature) based on general
size, growth form, and height or thickness of stems or trunks. Finally, note
the species composition and, using the scale on the datasheet, determine
and record the dominant particle size in the sediment that imparts a
general texture to the low-flow channel.
Figure 31. Step 2 of the f ield verif ication procedure. The arrows indicate a potentia l foot path within the low-f low channel along which percent vegetation cover, stand age, species composit ion, and dominant sediment texture should be observed and documented.
3. Identify the transition area between the low-flow channel(s) and the active
floodplain (the blue line in Fig. 32). Frequently the transition area is
defined by a change in vegetation age class or growth form and/or species
composition. Also, there is often a change in sediment texture and a break
in slope coupled with the presence of previously deposited organic debris.
While walking in a direction perpendicular to and away from the low-flow
channel(s) (along the channel cross-section), track and record changes in
percent cover of vegetation and species composition. Also, approximate
the stand age (early successional to mature) based on general size, growth
form, and height or thickness of stems or trunks. In some systems there
may be multiple low-flow channels separated by islands (e.g., green
features in the low-flow channel in Fig. 32) that are defined more by
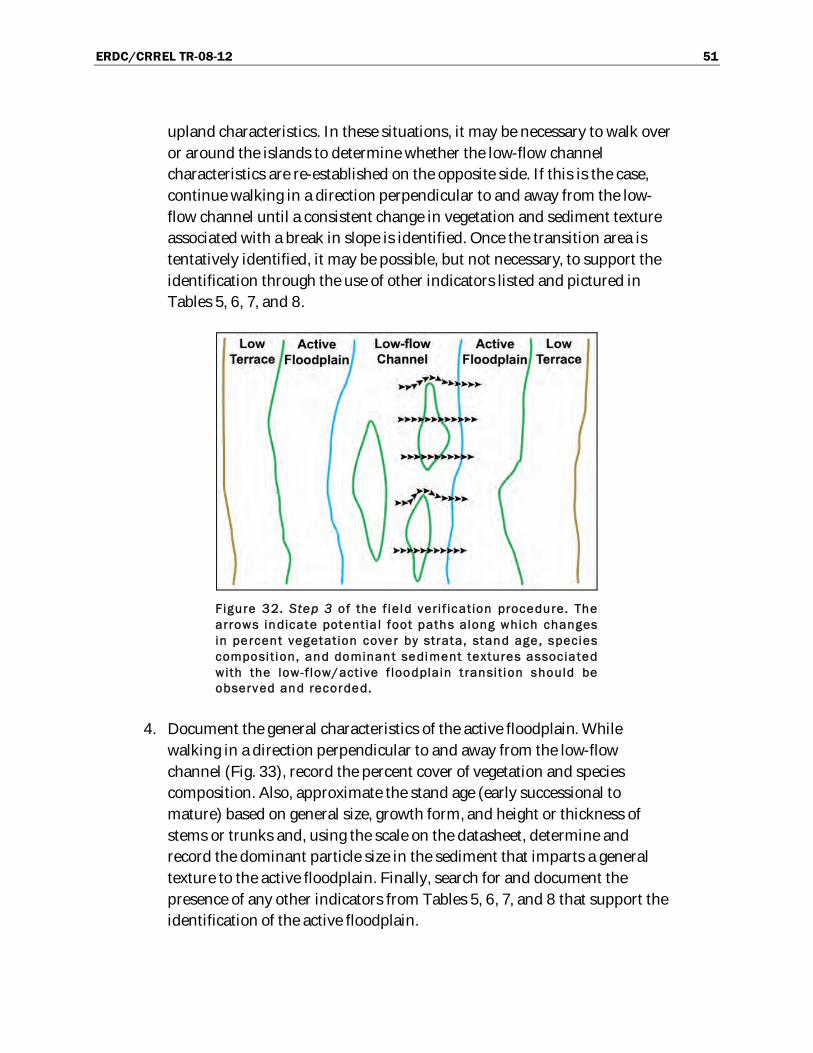
ERDC/CRREL TR-08-12 51
upland characteristics. In these situations, it may be necessary to walk over
or around the islands to determine whether the low-flow channel
characteristics are re-established on the opposite side. If this is the case,
continue walking in a direction perpendicular to and away from the low-
flow channel until a consistent change in vegetation and sediment texture
associated with a break in slope is identified. Once the transition area is
tentatively identified, it may be possible, but not necessary, to support the
identification through the use of other indicators listed and pictured in
Tables 5, 6, 7, and 8.
Figure 32. Step 3 of the f ield verif ication procedure. The arrows indicate potentia l foot paths along which changes in percent vegetation cover by strata, stand age , species composition, and dominant sediment textures associated with the low-f low/active f loodplain t ransition should be observed and recorded.
4. Document the general characteristics of the active floodplain. While
walking in a direction perpendicular to and away from the low-flow
channel (Fig. 33), record the percent cover of vegetation and species
composition. Also, approximate the stand age (early successional to
mature) based on general size, growth form, and height or thickness of
stems or trunks and, using the scale on the datasheet, determine and
record the dominant particle size in the sediment that imparts a general
texture to the active floodplain. Finally, search for and document the
presence of any other indicators from Tables 5, 6, 7, and 8 that support the
identification of the active floodplain.
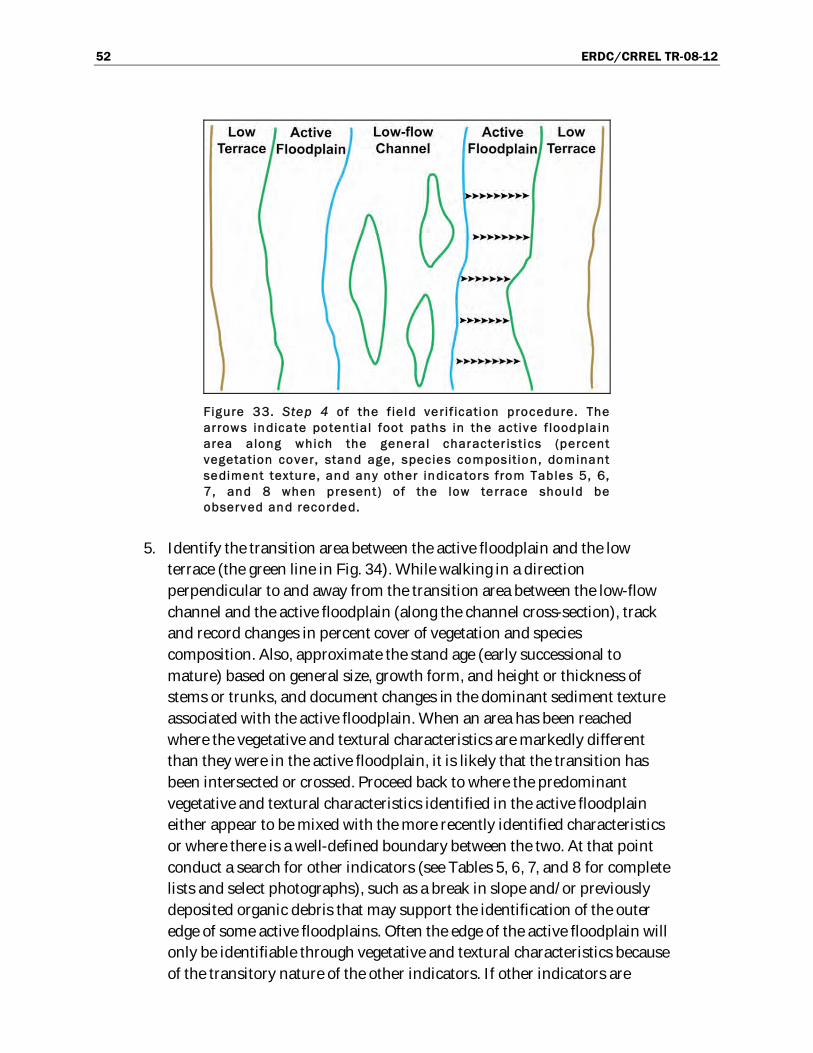
52 ERDC/CRREL TR-08-12
Figure 33. Step 4 of the f ield verif ication procedure. The arrows indicate potential foot paths in the active f loodpla in area along which the general character istics (percent vegetation cover, stand age, species composition, dominant sediment texture, and any other indicators from Tables 5, 6, 7, and 8 when present ) of the low terrace should be observed and recorded.
5. Identify the transition area between the active floodplain and the low
terrace (the green line in Fig. 34). While walking in a direction
perpendicular to and away from the transition area between the low-flow
channel and the active floodplain (along the channel cross-section), track
and record changes in percent cover of vegetation and species
composition. Also, approximate the stand age (early successional to
mature) based on general size, growth form, and height or thickness of
stems or trunks, and document changes in the dominant sediment texture
associated with the active floodplain. When an area has been reached
where the vegetative and textural characteristics are markedly different
than they were in the active floodplain, it is likely that the transition has
been intersected or crossed. Proceed back to where the predominant
vegetative and textural characteristics identified in the active floodplain
either appear to be mixed with the more recently identified characteristics
or where there is a well-defined boundary between the two. At that point
conduct a search for other indicators (see Tables 5, 6, 7, and 8 for complete
lists and select photographs), such as a break in slope and/or previously
deposited organic debris that may support the identification of the outer
edge of some active floodplains. Often the edge of the active floodplain will
only be identifiable through vegetative and textural characteristics because
of the transitory nature of the other indicators. If other indicators are

ERDC/CRREL TR-08-12 53
consistently observed along with the vegetative and textural
characteristics, the transition area between the active floodplain and the
low terrace is located along the outer edge (relative to the active floodplain)
of all of the indicators. If only the vegetative and textural characteristics
are present, the transition area is located along the outer edge of the
predominant active floodplain characteristics (i.e., where the predominant
vegetative and textural characteristics of the low terrace become
prevalent).
Figure 34. Step 5 of the f ield verif ication procedure. The arrows indicate potentia l foot paths along which changes in percent vegetation cover by strata, stand age , species composition, and dominant sediment textures associated with the active f loodplain/low terrace transition should be observed and recorded.
6. Along the outer edge of the predominant active floodplain vegetative and
textural characteristics, and, if present, other indicators (see Tables 5, 6, 7,
and 8), mark the presumptive transition area between the active floodplain
and the low terrace. Attempt to walk along the transition in both the
upstream and downstream directions over the entire length of the study
area (Fig. 35). While making the bi-directional (longitudinal) traverse,
verify that the primary indicators used to identify the transition when it
was first intersected are consistently associated with the transition in both
directions. Because of the manner in which the transition typically forms,
it may be diffuse in areas and it may not be perfectly aligned with the
transition area identified between the low-flow channel and the active
floodplain. If the transition appears to be lost during the traverse, it may be
necessary to backtrack to the last known position and widen the search in
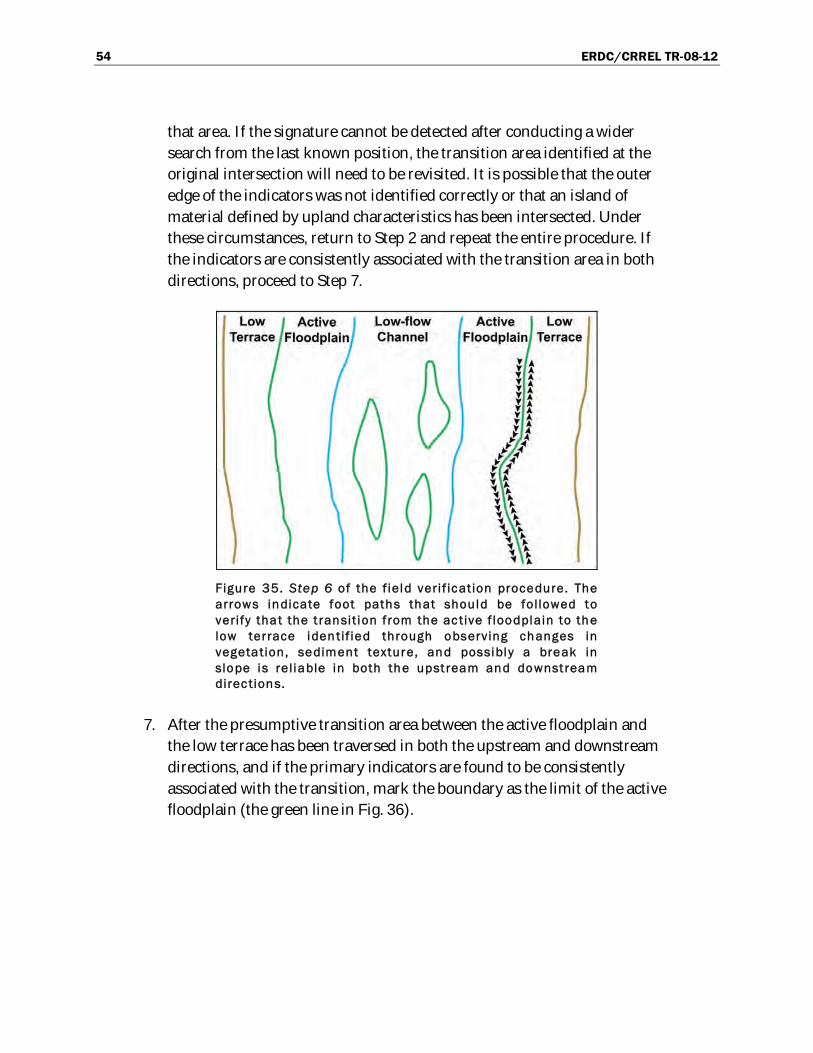
54 ERDC/CRREL TR-08-12
that area. If the signature cannot be detected after conducting a wider
search from the last known position, the transition area identified at the
original intersection will need to be revisited. It is possible that the outer
edge of the indicators was not identified correctly or that an island of
material defined by upland characteristics has been intersected. Under
these circumstances, return to Step 2 and repeat the entire procedure. If
the indicators are consistently associated with the transition area in both
directions, proceed to Step 7.
Figure 35. Step 6 of the f ield verif ication procedure. The arrows indicate foot paths that should be fol lowed to verify that the t ransition from the ac tive f loodplain to the low terrace identif ied through observing changes in vegetation, sediment texture, and possibly a break in slope is rel iable in both the upstream and downstream direc tions.
7. After the presumptive transition area between the active floodplain and
the low terrace has been traversed in both the upstream and downstream
directions, and if the primary indicators are found to be consistently
associated with the transition, mark the boundary as the limit of the active
floodplain (the green line in Fig. 36).

ERDC/CRREL TR-08-12 55
Figure 36. Step 7 of the f ield verification procedure. The the primary indicators were found to be consistently associated with the transition in both the upstream and downstream directions. Thus the transition marks the limit of the active floodplain in that portion of the study area.
8. Document the general characteristics of the low terrace. While walking in a
direction perpendicular to and away from the active floodplain (Fig. 37),
record the percent cover of vegetation and species composition. Also,
approximate the stand age (early successional to mature) based on general
Figure 37. Step 8 of the f ield verif ication procedure. The arrows indicate potential foot paths in the low terrace area along which the general charac teristics (percent vegetation cover, stand age, species composition, dominant sediment texture, and any other indicators from Tables 5, 6, 7, and 8 when present) of the low terrace should be observed and recorded.

56 ERDC/CRREL TR-08-12
size, growth form, and height or thickness of stems or trunks and,
using the scale on the datasheet, determine and record the dominant
particle size in the sediment that imparts a general texture to the low
terrace. Finally, search for and document the presence of any other
indicators from Tables 5, 6, 7, and 8 that support the identification of
the low terrace. To determine the limit of the active floodplain on the
other side of the channel, repeat Steps 2-8 walking in the opposite
direction perpendicular to and away from a particular feature.
9. If stream gage data are available for the stream reach of interest, proceed
through steps a-e. If not, proceed to Step 10.
(a) Locate the staff gage used to determine water height within the
channel. The staff gage should be proximal to, or within, the gage
housing (Fig. 38).
Figure 38. Staff used to determine stage height for Chinle Creek, AZ.
(b) Using a clinometer or level, align the staff gage to the stage height
associated with the most recent discharge EXCEEDING A 5-
YEAR event that was determined in Step 6 of the Preliminary
Delineation Procedure.

ERDC/CRREL TR-08-12 57
(c) Determine the spatial relationship between the limit of the active
floodplain marked in Step 7 and the stage height associated with
the most recent discharge EXCEEDING A 5-YEAR event that was
determined in Step 6 of the Preliminary Delineation Procedure.
Looking upstream (< 50 yards), project the staff elevation for the
event onto the landscape (Fig. 39). It is important to remember
that the stage value determined from the best-fit stage–discharge
function in Step 6 of the Preliminary Delineation Procedure
contains a level of uncertainty. Thus, the spatial relationship
between the projected point on the landscape and the limit of the
active floodplain, which was identified through the use of physical
indicators, may not be exact.
Figure 39. Projection onto the landscape of the stage height associated with the most recent effective discharge that exceeded a 5-year event. The spat ial relationship between the location of the point on the landscape and the l imit of the active f loodplain , indicated by the red X, may not be exac t due to uncertainty in the stage–discharge relationship.
i. If the projected point on the landscape CORRESPONDS
exactly (falls onto or within the transition marked in Step 7)
with the identified limit of the active floodplain, proceed to
Step 10.
ii. If the projected point on the landscape DOES NOT
CORRESPOND exactly with the identified limit of the active
floodplain, and if the upper and lower bounds on the stage

58 ERDC/CRREL TR-08-12
height WERE estimated during the Preliminary Delineation
Procedure, determine if the identified limit of the active
floodplain falls within the range of stage heights defined by the
upper and lower bounds.
– If the limit falls within the range, proceed to Step 10.
– If the limit falls below the range, proceed to Step d.
– If the limit falls above the range, proceed to Step e.
iii. If the projected point on the landscape DOES NOT
CORRESPOND exactly with the identified limit of the active
floodplain, and if the upper and lower bounds on the stage
height are UNKNOWN, determine if the identified limit falls
below or above the projected point.
– If the limit falls below the point, proceed to Step d.
– If the limit falls above the point, proceed to Step e.
(d) Determine the spatial relationship between the identified limit of
the active floodplain and the stage height associated with THE
MOST RECENT 5-YEAR event determined in Step 6 of the
Preliminary Delineation Procedure. Project the stage height for
the 5-year event onto the landscape.
i. If the projected point CORRESPONDS exactly with the limit of
the active floodplain marked in Step 7, repeat Steps 5–7,
starting from that boundary, crossing and examining all
transitions until the active floodplain/low terrace transition is
reached. If only the transition between the active floodplain
and low terrace is identified after repeating the procedure, the
boundary marked in Step 7 is the limit of OHW; proceed to
Step 10. If other transitions are crossed between the boundary
marked in Step 7 and the low terrace, the outermost transition
(inside the active floodplain/low terrace transition) that is
consistently characterized in both the upstream and
downstream directions by physical indicators is the limit of
OHW. Mark the boundary and proceed to Step 10.
ERDC/CRREL TR-08-12 59
ii. If the projected point DOES NOT CORRESPOND exactly with
the identified limit of the active floodplain, and if the upper
and lower bounds on the stage height WERE estimated during
the Preliminary Delineation Procedure, determine if the limit
of the active floodplain falls within the range of stage heights
defined by the upper and lower bounds.
– If the limit falls within or below the range, repeat Steps 5–
7, starting from that boundary, crossing and examining all
transitions until the active floodplain/low terrace
transition is reached. If only the transition between the
active floodplain and low terrace is identified after
repeating the procedure, the boundary marked in Step 7 is
the limit of OHW; proceed to Step 10. If other transitions
are crossed between the boundary marked in Step 7 and
the low terrace, the outermost transition (inside the active
floodplain/low terrace transition) that is consistently
characterized in both the upstream and downstream
directions by physical indicators is the limit of OHW. Mark
the boundary and proceed to Step 10.
– If the limit falls above the range, repeat Steps 5–7 starting
from that boundary, crossing and examining all transitions
until the active floodplain/low terrace transition is reached.
If only the transition between the active floodplain and low
terrace is identified after repeating the procedure, the
boundary marked in Step 7 is the limit of OHW; proceed to
Step 10. If other transitions are crossed between the
boundary marked in Step 7 and the low terrace, the
outermost transition (inside the active floodplain/low
terrace transition) that is consistently characterized in both
the upstream and downstream directions by physical
indicators is the limit of OHW. Mark the boundary and
proceed to Step 10.
iii. If the projected point on the landscape DOES NOT
CORRESPOND exactly with the identified limit of the active
floodplain, and if the upper and lower bounds on the stage
height are UNKNOWN, repeat Steps 5–7 starting from that
boundary, crossing and examining all transitions until the
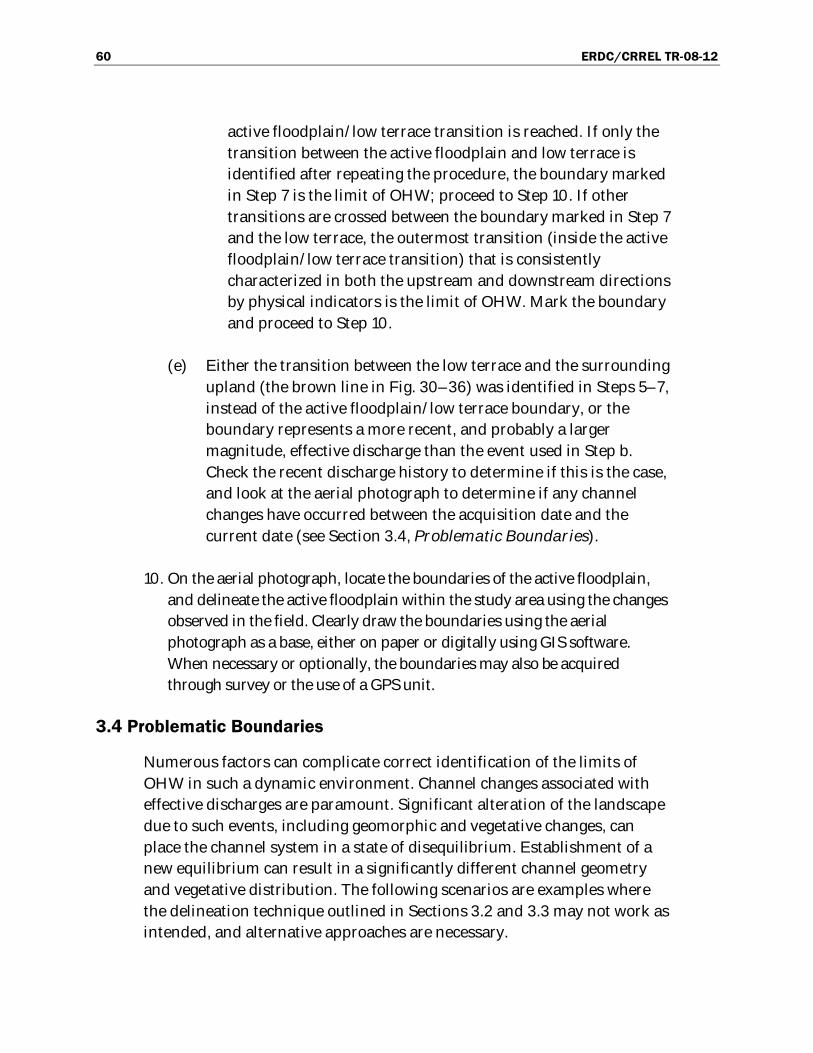
60 ERDC/CRREL TR-08-12
active floodplain/low terrace transition is reached. If only the
transition between the active floodplain and low terrace is
identified after repeating the procedure, the boundary marked
in Step 7 is the limit of OHW; proceed to Step 10. If other
transitions are crossed between the boundary marked in Step 7
and the low terrace, the outermost transition (inside the active
floodplain/low terrace transition) that is consistently
characterized in both the upstream and downstream directions
by physical indicators is the limit of OHW. Mark the boundary
and proceed to Step 10.
(e) Either the transition between the low terrace and the surrounding
upland (the brown line in Fig. 30–36) was identified in Steps 5–7,
instead of the active floodplain/low terrace boundary, or the
boundary represents a more recent, and probably a larger
magnitude, effective discharge than the event used in Step b.
Check the recent discharge history to determine if this is the case,
and look at the aerial photograph to determine if any channel
changes have occurred between the acquisition date and the
current date (see Section 3.4, Problematic Boundaries).
10. On the aerial photograph, locate the boundaries of the active floodplain,
and delineate the active floodplain within the study area using the changes
observed in the field. Clearly draw the boundaries using the aerial
photograph as a base, either on paper or digitally using GIS software.
When necessary or optionally, the boundaries may also be acquired
through survey or the use of a GPS unit.
3.4 Problematic Boundaries
Numerous factors can complicate correct identification of the limits of
OHW in such a dynamic environment. Channel changes associated with
effective discharges are paramount. Significant alteration of the landscape
due to such events, including geomorphic and vegetative changes, can
place the channel system in a state of disequilibrium. Establishment of a
new equilibrium can result in a significantly different channel geometry
and vegetative distribution. The following scenarios are examples where
the delineation technique outlined in Sections 3.2 and 3.3 may not work as
intended, and alternative approaches are necessary.

ERDC/CRREL TR-08-12 61
1. Because aerial photograph interpretation is used in the delineation
procedure, channel changes can be a source of confusion. The ground
conditions may have changed between the acquisition date of the
photograph and the date of the attempted delineation. When this happens,
care must be taken to identify reference points within the study area that
have not changed, as well as the parts of the channel that have. In these
situations, a GPS unit may substantially reduce the complexity of acquiring
the boundary of OHW. Once the boundary has been identified through the
use of physical indicators in the field, and the corresponding GPS data
have been obtained, they can be accurately overlain on a geo-rectified
aerial photograph regardless of discrepancies between the scene in the
photograph and the on-site conditions. When GPS is not available, the
observations of current site conditions must be combined with aerial
photograph interpretations to best identify the boundary of OHW in the
study area.
2. In gaged systems, stage heights may not be associated with features in the
field due to the impact of recent effective discharges. If there has been one
or more recent effective discharge within the system of interest, the
channel geometry may have changed due to bed scour and deposition. In
situations where the stage heights determined from the best-fit stage–
discharge function do not appear to be associated with channel features,
the spatial relationships should be documented, and the limit of OHW is
delineated through the use of physical indicators only.
3.5 Examples of Delineations by Channel Form
The observed patterns used to delineate the OHWM vary between
different types of channel forms. An example delineation of geomorphic
features and extent of OHW (the active floodplain/low terrace boundary)
is provided for each of the channel forms discussed in Section 1.5.
3.5.1 Alluvial Fans
Alluvial fans present unique difficulties in identifying hydrogeomorphic
floodplain units. As the main stem travels downstream on the alluvial fan,
it begins to become distributary, branching out over a large area.
Determining which branches are currently active can be difficult, but with
careful observation, proper identification of the low-flow channel and
active and terrace floodplain is achievable. Delineating the OHW on a fan
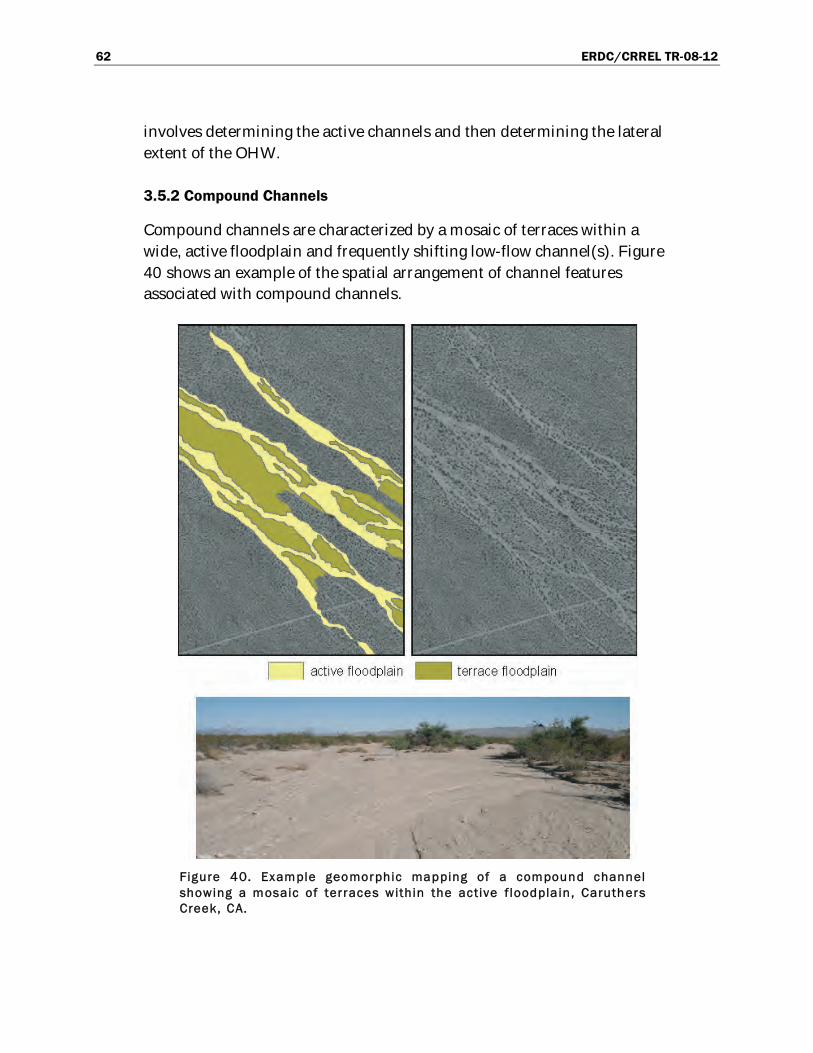
62 ERDC/CRREL TR-08-12
involves determining the active channels and then determining the lateral
extent of the OHW.
3.5.2 Compound Channels
Compound channels are characterized by a mosaic of terraces within a
wide, active floodplain and frequently shifting low-flow channel(s). Figure
40 shows an example of the spatial arrangement of channel features
associated with compound channels.
Figure 40. Example geomorphic mapping of a compound channel showing a mosaic of terraces within the active f loodpla in, Caruthers Creek, CA.
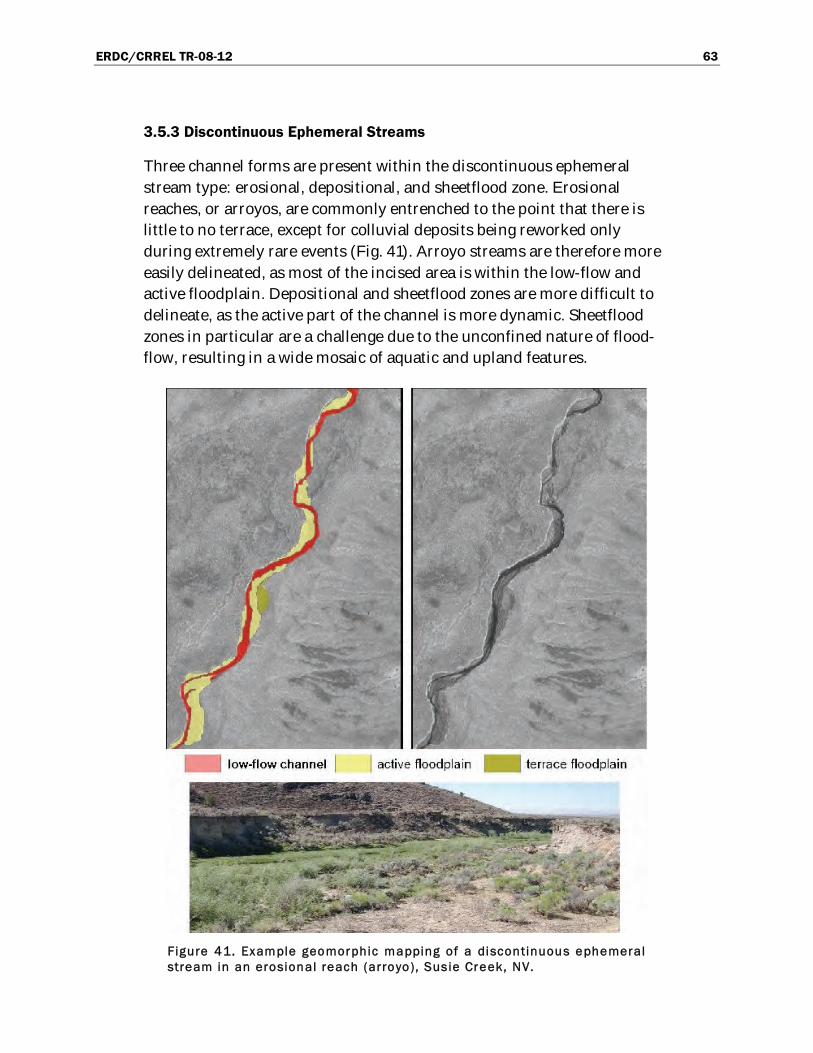
ERDC/CRREL TR-08-12 63
3.5.3 Discontinuous Ephemeral Streams
Three channel forms are present within the discontinuous ephemeral
stream type: erosional, depositional, and sheetflood zone. Erosional
reaches, or arroyos, are commonly entrenched to the point that there is
little to no terrace, except for colluvial deposits being reworked only
during extremely rare events (Fig. 41). Arroyo streams are therefore more
easily delineated, as most of the incised area is within the low-flow and
active floodplain. Depositional and sheetflood zones are more difficult to
delineate, as the active part of the channel is more dynamic. Sheetflood
zones in particular are a challenge due to the unconfined nature of flood-
flow, resulting in a wide mosaic of aquatic and upland features.
Figure 41. Example geomorphic mapping of a discontinuous ephemeral stream in an erosional reach (arroyo), Susie Creek, NV.
64 ERDC/CRREL TR-08-12
3.5.4 Single-Thread Channels with Adjacent Floodplains
Typified by meandering and straight channel forms, single-thread
channels refer to stream systems with typically one low-flow channel. An
active floodplain is normally present on the inside of meandering bends
and along one or both banks along straight reaches. Figure 42 shows an
example of the distribution of geomorphic features within a straight reach
of single-thread channel with an adjacent floodplain.
Figure 42. Example geomorphic mapping in a straight reach of a single-thread channel with an adjacent f loodplain, Alter Wash, AZ.
3.5.5 Anastomosing Rivers
These rivers have much more stable channel geometries than other types
due to the fine matrix of bank material and the abundance of stabilizing

ERDC/CRREL TR-08-12 65
vegetation. Although uncommon in the Arid West region, anastomosing
rivers do occur where conditions are present for their formation. Levees
form naturally on these channels, making a very narrow active floodplain.
Overbank flooding occurs during levee breaches, but the location of these
breaches is unpredictable. Due to the scarcity of these channel types, an
example is not provided.
66 ERDC/CRREL TR-08-12
References
Andrews, E.D., R.C. Antweiler, P.J. Neiman, and F.M. Ralph. 2004. Influence of ENSO on
flood frequency along the California coast. Journal of Climate 17(2): 337–348.
Antsey, R.L. 1965. Physical characteristics of alluvial fans. Technical Report ES-20.
Natick, MA: U.S. Army Laboratories.
Auble, G.T., J.M. Friedman, and M.L. Scott. 1994. Relating riparian vegetation to present
and future streamflows. Ecological Applications 4: 544–554.
Bendix, J. 1999. Stream power influence on southern Californian riparian vegetation.
Journal of Vegetation Science 10: 243–252.
Bull, W.B. 1997. Discontinuous ephemeral streams. Geomorphology 19: 227–276.
CH2M Hill and French, R.H. 1992. Alluvial fan data collection and monitoring study
[Flood Control District of Maricopa County, Phoenix, AZ]. CH2M Hill, Tempe,
AZ, and R.H. French, Las Vegas, NV.
Dunne, T., and L.B. Leopold. 1978. Water in environmental planning. San Francisco:
W.H. Freeman.
Ely, L.L. 1997. Response of extreme floods in the southwestern United States to climatic
variations in the Holocene. Geomorphology 19: 175–201.
Field, J.J., and R.W. Lichvar. 2007. Review and synopsis of natural and human controls
on fluvial channel processes in the arid west. ERDC/CRREL TR-07-16. Hanover,
NH: U.S. Army Engineer Research and Development Center, Cold Regions
Research and Engineering Laboratory.
French, R.H., J.E. Fuller, and S. Waters. 1993. Alluvial fan: Proposed new process-
oriented definitions for arid southwest. Journal of Water Resources Planning
and Management 119: 4785.
Graf, W.L. 1979. Rapids in canyon rivers. Journal of Geology 87: 533–551.
Graf, W.L. (1988a) Definition of floodplains along arid-region rivers. In Flood
geomorphology. V.R. Baker, R.C. Kochel, P.C. Patton, ed. New York: Springer-
Verlag.
Interagency Advisory Committee on Water Data. 1982. Guidelines for determining flood
flow frequency. Bulletin 17B. Reston, VA: Hydrology Subcommittee, Office of
Water Data Coordination, U.S. Geological Survey.
Leopold, L., M.G. Wolman, and J.P. Miller. 1964. Fluvial processes in geomorphology.
San Francisco and London: W.H. Freeman and Co.

ERDC/CRREL TR-08-12 67
Lichvar, R.W., and J.S. Wakeley, ed. 2004. Review of Ordinary High Water Mark
indicators for delineating arid streams in the southwestern United States.
ERDC/CRREL TR-04-1. Hanover, NH: U.S. Army Engineer Research and
Development Center, Cold Regions Research and Engineering Laboratory.
(http://www.crrel.usace.army.mil/techpub/CRREL_Reports/reports/TR04-
21.pdf).
Lichvar, R.W., D. Finnegan, M. Ericsson, and W. Ochs. 2006. Distribution of Ordinary
High Water Mark (OHWM) indicators and their reliability in identifying the
limits of “Waters of the United States” in arid southwestern channels.
ERDC/CRREL TR-06-5. Hanover, NH: U.S. Army Engineer Research and
Development Center, Cold Regions Research and Engineering Laboratory.
(http://www.crrel.usace.army.mil/techpub/CRREL_Reports/reports/TR06-
5.pdf).
Millar, R.G. 2000. Influence of bank vegetation on alluvial channel patterns. Water
Resources Journal 205: 59–75.
Reid, I., and L.E. Frostick. 1997. Channel form, flow and sediments in deserts. In Arid
zone geomorphology: Process, form and change in drylands. D.S.G. Thomas, ed.
Second edition. P. 205–229. Chicester, England: John Wiley & Sons.
Reid, I., and J.B. Laronne. 1995. Bedload sediment transport in an ephemeral stream and
a comparison with seasonal and perennial counterparts. Water Resources
Research 31: 773–781.
Riggs, H.C. 1985. Streamflow characteristics. Amsterdam, The Netherlands, and New
York, NY: Elsevier.
Rosgen, D. 1996. Applied river morphology. Pagosa Springs, CO: Wildland Hydrology.
Schindler, R.J., and A. Robert. 2004. Suspended sediment concentration and the ripple-
dune transition. Hydrological Processes 18: 3215–3227.
Schumann, R.R. 1989. Morphology of Red Creek, Wyoming, An arid-region anastomosing
channel system. Earth Surface Processes and Landforms 14: 277–288.
Stromberg, J.C. 1993. Instream flow models for mixed deciduous riparian vegetation
within a semiarid region. Regulated Rivers 8: 225–235.
Stromberg, J.C., R. Tiller, and B.D. Richter. 1996. Effects of groundwater decline on
riparian vegetation of semiarid regions: The San Pedro, Arizona. Ecological
Applications 6: 113–131.
Stromberg, J.C. 1998. Dynamics of Fremont cottonwood (Populus fremontii) and
saltcedar (Tamarix chinensis) populations along the San Pedro River, Arizona.
Journal of Arid Environments 40: 133–155.
Tooth, S. 2000. Process, form and change in dryland rivers: A review of recent research.
Earth-Science Reviews 51: 67–107.

68 ERDC/CRREL TR-08-12
U.S. Army Corps of Engineers. 1996. Engineering and Design, Risk-based analysis for
flood damage reduction studies. EM 1110-2-1619. Washington, DC: U.S. Army
Corps of Engineers. (http://www.usace.army.mil/publications/eng-manuals/
em1110-2-1619/).
U.S. Army Corps of Engineers. 2006. Interim regional supplement to the Corps of
Engineers Wetland Delineation Manual: Arid West Region. J.S. Wakeley, R.W.
Lichvar, and C.V. Noble, ed. ERDC/EL TR-06-16. Vicksburg, MS: U.S. Army
Engineer Research and Development Center, Environmental Laboratory.
U.S. Army Corps of Engineers, South Pacific Division. 2001. Final summary report:
Guidelines for jurisdictional determinations for water of the United States in the
arid Southwest. San Francisco, CA: U.S. Army Corps of Engineers, South Pacific
Division. (http://www.spl.usace.army.mil/regulatory/lad.htm).
USDA Natural Resources Conservation Service. 2006. Land resource regions and major
land resource areas of the United States, the Caribbean, and the Pacific Basin.
Agriculture Handbook 296. Washington DC: U.S. Department of Agriculture.
(http://soils.usda.gov/survey/geography/mlra/index.html).
Webb, R.H., P.T. Pringle, S.L. Reneau, and G.R. Rink (1988) Monument Creek debris
flow, 1984, Implications for formation of rapids on the Colorado River in Grand
Canyon National Park. Geology 16: 50–54.
Williams, G.P. 1978. Bank-full discharges of rivers. Water Resources Research 14(6):
1141–1153.
Wolman, M.G., and J.P. Miller. 1960. Magnitude and frequency of forces in geomorphic
processes. Journal of Geology 68: 54–74.
ERDC/CRREL TR-08-12 69
Appendix A: Glossary
Aggradation. An increase in the channel bed elevation through
deposition of sediment.
Arroyo. Entrenched ephemeral streams with vertical walls that form in
desert environments.
Assemblage. A collection of individual plant species.
Avulsion. The rapid diversion of flow from one channel into another due
to blockage of the channel by sediment or debris.
Calcrete. A conglomerate consisting of surficial sand and gravel
cemented into a hard mass by calcium carbonate.
Caliche rubble. Fragments of a sedimentary rock formed by evaporation
and precipitation of calcite (CaCO3) in soil, sediments, or preexisting
rock.
Clonal species. A group of genetically identical individuals growing in a
given location, all originating vegetatively (not sexually) from a single
ancestor.
Debris flow. A moving mass of rock fragments, soil, and mud where
more than 50% of the particles are larger than sand-sized.
Desert pavement. Tightly interlocking gravel at the surface formed after
years of surface exposure in the absence of active streamflow over the
surface.
Desert varnish. A thin, dark, shiny film, composed of iron oxide with
traces of manganese oxide and silica, formed on the surface of pebbles,
boulders, and rock outcrops in desert regions after long exposure.
Divide. High ground that forms the boundary of a watershed.
70 ERDC/CRREL TR-08-12
Drift. Organic debris oriented to flow direction(s) (larger than small
twigs).
Effective discharge. Discharge that is capable of carrying a large
proportion of sediment over time.
Facultative wetland (FACW). Wetland indicator category; species
usually occurs in wetlands (estimated probability 67–99%) but
occasionally found in non-wetlands.
Flashy discharge pattern. Periods of no flow or low-magnitude, high-
frequency events separated by short-duration, high-magnitude, low-
frequency events.
Floodplain. That portion of a drainage basin (see watershed), adjacent to
the channel, that is covered by sediments deposited during overbank
flood flow.
Headcut. An abrupt vertical drop in the bed of a stream channel that is
an active erosion feature.
Herbaceous. Pertaining to plants with little or no woody tissue.
Hydraulic parameters. Slope, roughness, channel geometry, discharge,
velocity, turbulence, fluid properties, sediment size, etc.
Hydraulic roughness. Channel boundary characteristic contributing to
energy losses, commonly described by Manning’s roughness coefficient
(n).
Hydric soil. A soil that formed under conditions of saturation, flooding,
or ponding long enough during the growing season to develop
anaerobic conditions in the upper part.
Hydrologic regime. Characteristic pattern of precipitation, runoff,
infiltration, and evaporation affecting a water body.
Hydromesic. Physiographic class; soil retains water for long periods of
time, will drain.
ERDC/CRREL TR-08-12 71
Hyperconcentrated flow. Suspension flow with large suspended
sediment concentrations (i.e., greater than 1–3%).
Litter. Organic debris oriented to flow direction(s) (small twigs and
leaves).
Reach. A segment of a stream channel.
Ruderals. Disturbance-adapted herbaceous plant.
Obligate wetland (OBL). Wetland indicator category; species occurs
almost always (estimated probability 99%) under natural conditions in
wetlands.
Pioneer species. A species that colonizes a previously uncolonized area.
Rating curve. A curve that illustrates the relationship between depth
(stage) and the amount of flow (discharge) in a channel.
Scour. Soil and debris movement.
Sheetflood. Sheet of unconfined floodwater moving down a slope; a
relatively low-frequency, high-magnitude event.
Sheetflow. Overland flow occurring in a continuous sheet; a relatively
high-frequency, low-magnitude event.
Shift-adjusted rating curve. A curve that reflects changes (shifts) in
the rating for a gage. Ratings may change due to erosion or deposition
within the streambed or growth of riparian vegetation.
Stream power. The rate of doing work, or a measure of the energy
available for moving rock, sediment, or woody or other debris in a
stream channel, as determined by discharge, water surface slope, and
the specific weight of water.
Succession. Changes in the composition or structure of an ecological
community.

72 ERDC/CRREL TR-08-12
Transmission loss. Loss of discharge due to infiltration of flow into the
channel bed and banks.
Wash. Broad gravelly dry bed of an intermittent stream.
Watershed (drainage basin). An area of land that drains to a single
outlet and is separated from other watersheds by a divide.
Xeric. Relating or adapted to an extremely dry habitat.

ERDC/CRREL TR-08-12 73
Appendix B: Datasheet

Project: Date: Time:
Project Number: Town: State:
Stream: Photo begin file# Photo end file#
Investigator(s):
Location Details:
Projection: Datum:
Y / N Do normal circumstances exist on the site?
Y / N Is the site significantly disturbed? Coordinates:
Notes:
Brief site description:
Checklist of resources (if available):
Aerial photography
Dates:
Topographic maps
Scale:
Geologic maps
Vegetation maps
Soils maps
Rainfall/precipitation maps
Existing delineation(s) for site
Global positioning system (GPS)
Other studies
Stream gage data
Gage number:
Period of record:
Clinometer / level
History of recent effective discharges
Results of flood frequency analysis
Most recent shift-adjusted rating
Gage heights for 2-, 5-, 10-, and 25-year events and the
most recent event exceeding a 5-year event
The dominant Wentworth size class that imparts a characteristic texture to each zone of a channel cross-section
is recorded in the average sediment texture field under the characteristics section for the zone of interest.

Walk the channel and floodplain within the study area to get an impression of the vegetation and
geomorphology present at the site. Record any potential anthropogenic influences on the channel
system in “Notes” above.
Locate the low-flow channel (lowest part of the channel). Record observations.
Characteristics of the low-flow channel:
Average sediment texture: __________________
Total veg cover: _____ % Tree: _____% Shrub: _____% Herb: _____%
Community successional stage:
NA Mid (herbaceous, shrubs, saplings)
Early (herbaceous & seedlings) Late (herbaceous, shrubs, mature trees)
Dominant species present: _____________________________________________________________
______________________________________________________________________
______________________________________________________________________
______________________________________________________________________
______________________________________________________________________
______________________________________________________________________
Other:
______________________________________________________________________
Walk away from the low-flow channel along cross-section. Record characteristics of the low-
flow/active floodplain boundary.
Characteristics used to delineate the low-flow/active floodplain boundary:
Change in total veg cover Tree Shrub Herb
Change in overall vegetation maturity
Change in dominant species present
Presence of bed and bank
Drift and/or debris
Other: _______________________________
Other
Other: _______________________________
Continue walking the channel cross-section. Record observations below.
Characteristics of the active floodplain:
Average sediment texture: __________________
Total veg cover: _____ % Tree: _____% Shrub: _____% Herb: _____%
Community successional stage:
NA Mid (herbaceous, shrubs, saplings)
Early (herbaceous & seedlings) Late (herbaceous, shrubs, mature trees)
Dominant species present: _____________________________________________________________
______________________________________________________________________
______________________________________________________________________
______________________________________________________________________
______________________________________________________________________
______________________________________________________________________
Other:
______________________________________________________________________

Continue walking the channel cross-section. Record indicators of the active floodplain/low
terrace boundary.
Characteristics used to delineate the active floodplain/ low terrace boundary:
Change in average sediment texture
Change in total veg cover Tree Shrub Herb
Change in overall vegetation maturity
Change in dominant species present
Other Presence of bed and bank
Drift and/or debris
Other: _______________________________
Other: _______________________________
Walk the active floodplain/low terrace boundary both upstream and downstream of the cross-
section to verify that the indicators used to identify the transition are consistently associated the
transition in both directions.
Consistency of indicators used to delineate the active floodplain/low terrace boundary:
Y N Change in average sediment texture
Y N Change in total veg cover Tree Shrub Herb
Y N Change in overall vegetation maturity
Y N Change in dominant species present
Y N Other: Y N Presence of bed and bank
Y N Drift and/or debris
Y N Other: ___________________
Y N Other: ___________________
If the characteristics used to delineate the active floodplain/low terrace boundary were NOT
consistently associated with the transition in both the upstream and downstream directions,
repeat all steps above.
Continue walking the channel cross-section. Record characteristics of the low terrace.
Characteristics of the low terrace:
Average sediment texture: __________________
Total veg cover: _____ % Tree: _____% Shrub: _____% Herb: _____%
Community successional stage:
NA Mid (herbaceous, shrubs, saplings)
Early (herbaceous & seedlings) Late (herbaceous, shrubs, mature trees)
Dominant species present: _____________________________________________________________
______________________________________________________________________
______________________________________________________________________
______________________________________________________________________
______________________________________________________________________
______________________________________________________________________
Other:
______________________________________________________________________
If characteristics used to delineate the active floodplain/low terrace boundary were deemed
reliable, acquire boundary.
Active floodplain/low terrace boundary acquired via:
Mapping on aerial photograph GPS
Digitized on computer Other: _________________________________
REPORT DOCUMENTATION PAGE Form Approved
OMB No. 0704-0188 Public reporting burden for this collection of information is estimated to average 1 hour per response, including the time for reviewing instructions, searching existing data sources, gathering and maintaining
the data needed, and completing and reviewing this collection of information. Send comments regarding this burden estimate or any other aspect of this collection of information, including suggestions for
reducing this burden to Department of Defense, Washington Headquarters Services, Directorate for Information Operations and Reports (0704-0188), 1215 Jefferson Davis Highway, Suite 1204, Arlington,
VA 22202-4302. Respondents should be aware that notwithstanding any other provision of law, no person shall be subject to any penalty for failing to comply with a collection of information if it does not
display a currently valid OMB control number. PLEASE DO NOT RETURN YOUR FORM TO THE ABOVE ADDRESS.
1. REPORT DATE (DD-MM-YYYY)
August 2008
2. REPORT TYPE
Technical Report
3. DATES COVERED (From - To)
5a. CONTRACT NUMBER
5b. GRANT NUMBER
4. TITLE AND SUBTITLE
A Field Guide to the Identification of the Ordinary High Water Mark (OHWM) in
the Arid West Region of the Western United States: A Delineation Manual
5c. PROGRAM ELEMENT NUMBER
5d. PROJECT NUMBER
5e. TASK NUMBER
6. AUTHOR(S)
Robert W. Lichvar and Shawn M. McColley
5f. WORK UNIT NUMBER
7. PERFORMING ORGANIZATION NAME(S) AND ADDRESS(ES) 8. PERFORMING ORGANIZATION REPORT
NUMBER U.S. Army Engineer Research and Development Center
Cold Regions Research and Engineering Laboratory
72 Lyme Road
Hanover, NH 03755-1290
ERDC/CRREL TR-08-12
9. SPONSORING / MONITORING AGENCY NAME(S) AND ADDRESS(ES) 10. SPONSOR/MONITOR’S ACRONYM(S)
11. SPONSOR/MONITOR’S REPORT
NUMBER(S)
12. DISTRIBUTION / AVAILABILITY STATEMENT
Approved for public release; distribution is unlimited.
Available from NTIS, Springfield, Virginia 22161.
13. SUPPLEMENTARY NOTES
14. ABSTRACT
The Ordinary High Water Mark (OHWM) is an approach for identifying the lateral limits of non-wetland waters. However, determining
whether any non-wetland water is a jurisdictional “Water of the United States” (WoUS) involves further assessment in accordance with
the regulations, case law, and clarifying guidance. In the Arid West region of the U.S., the most problematic Ordinary High Water
(OHW) delineations are associated with the ephemeral/intermittent channel forms that dominate the Arid West landscape. This report
presents a method for delineating the lateral extent of the non-wetland waters in the Arid West using stream geomorphology and
vegetation response to the dominant stream discharge.
15. SUBJECT TERMS
Arid West
Clean Water Act
Ordinary High Water
Wetland delineation
Waters of the United States
16. SECURITY CLASSIFICATION OF: 17. LIMITATION
OF ABSTRACT
18. NUMBER
OF PAGES
19a. NAME OF RESPONSIBLE
PERSON
a. REPORT
U
b. ABSTRACT
U
c. THIS PAGE
U U 87
19b. TELEPHONE NUMBER (include area code)
Standard Form 298 (Rev. 8-98) Prescribed by ANSI Std. 239.18