ERC LEP-Growth-Dashboard
48
LEP Growth Dashboard Published June 2014
-
Upload
enterpriseresearchcentre -
Category
Business
-
view
55 -
download
0
Transcript of ERC LEP-Growth-Dashboard

LEP Growth Dashboard
Published June 2014

2 LEP Growth Dashboard
Introduction
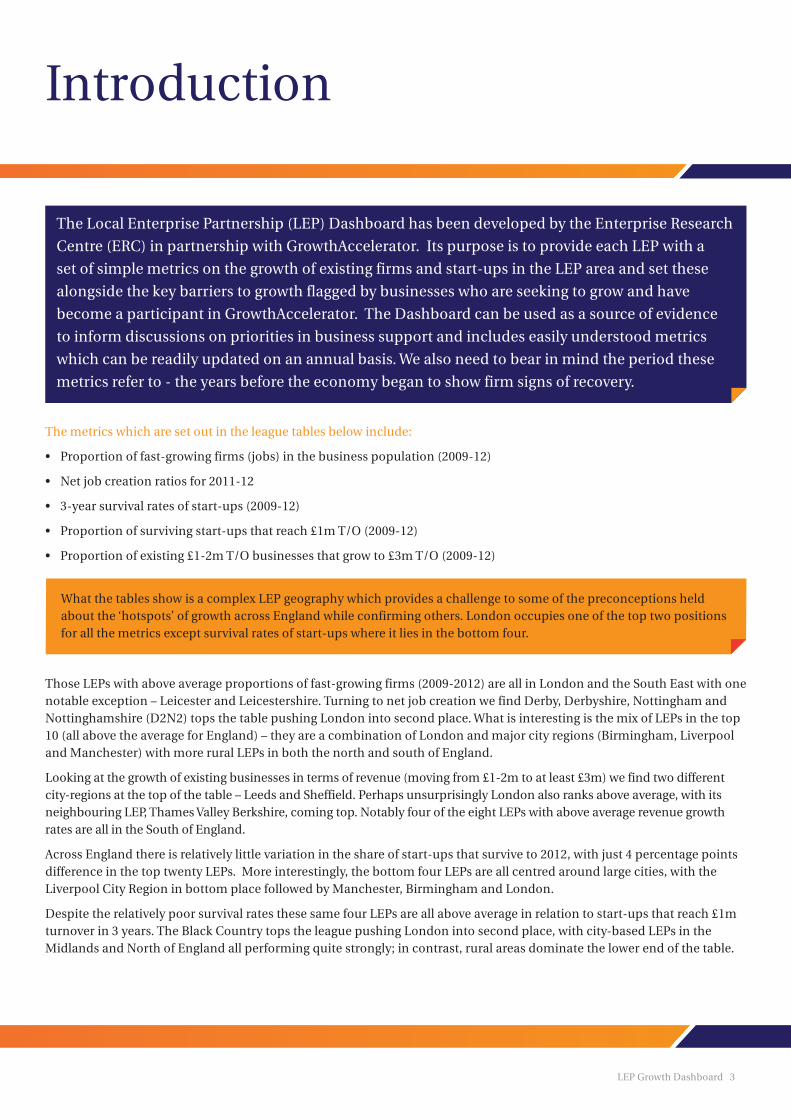
The metrics which are set out in the league tables below include:
• Proportion of fast-growing firms (jobs) in the business population (2009-12)
• Net job creation ratios for 2011-12
• 3-year survival rates of start-ups (2009-12)
• Proportion of surviving start-ups that reach £1m T/O (2009-12)
• Proportion of existing £1-2m T/O businesses that grow to £3m T/O (2009-12)
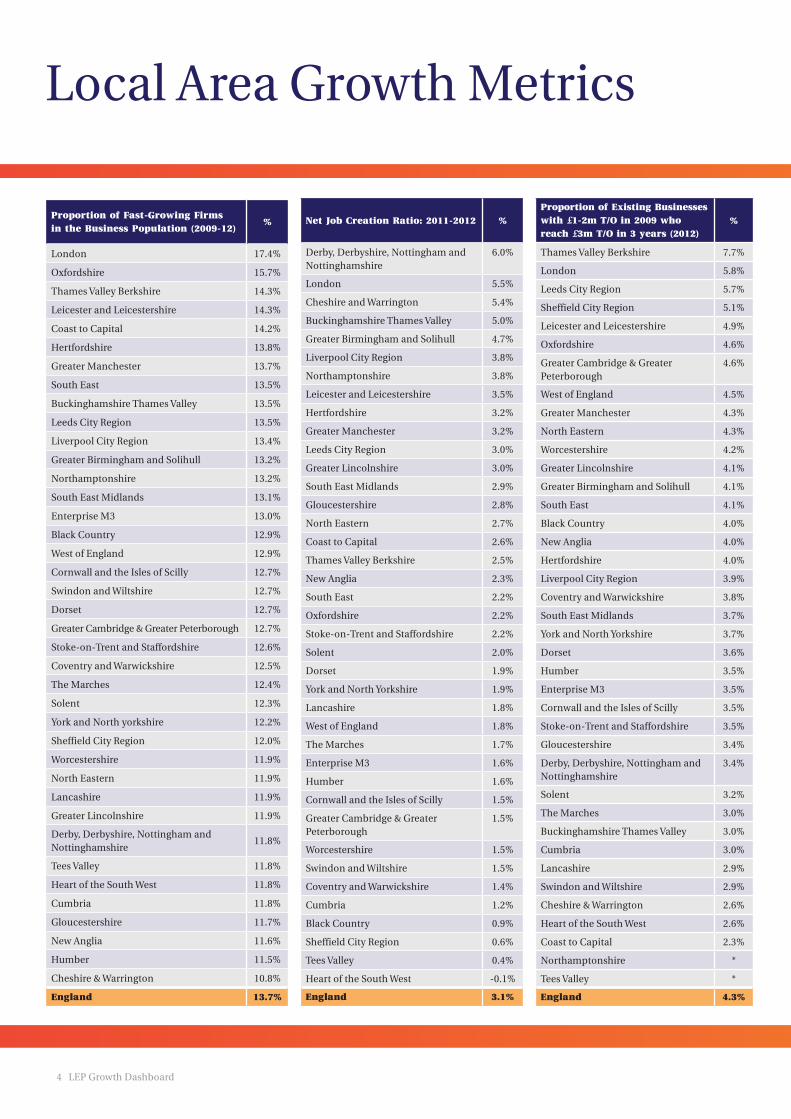
Those LEPs with above average proportions of fast-growing firms (2009-2012) are all in London and the South East with one notable exception – Leicester and Leicestershire. Turning to net job creation we find Derby, Derbyshire, Nottingham and Nottinghamshire (D2N2) tops the table pushing London into second place. What is interesting is the mix of LEPs in the top 10 (all above the average for England) – they are a combination of London and major city regions (Birmingham, Liverpool and Manchester) with more rural LEPs in both the north and south of England.
Looking at the growth of existing businesses in terms of revenue (moving from £1-2m to at least £3m) we find two different city-regions at the top of the table – Leeds and Sheffield. Perhaps unsurprisingly London also ranks above average, with its neighbouring LEP, Thames Valley Berkshire, coming top. Notably four of the eight LEPs with above average revenue growth rates are all in the South of England.
Across England there is relatively little variation in the share of start-ups that survive to 2012, with just 4 percentage points difference in the top twenty LEPs. More interestingly, the bottom four LEPs are all centred around large cities, with the Liverpool City Region in bottom place followed by Manchester, Birmingham and London.
Despite the relatively poor survival rates these same four LEPs are all above average in relation to start-ups that reach £1m turnover in 3 years. The Black Country tops the league pushing London into second place, with city-based LEPs in the Midlands and North of England all performing quite strongly; in contrast, rural areas dominate the lower end of the table.
The Local Enterprise Partnership (LEP) Dashboard has been developed by the Enterprise Research
Centre (ERC) in partnership with GrowthAccelerator. Its purpose is to provide each LEP with a
set of simple metrics on the growth of existing firms and start-ups in the LEP area and set these
alongside the key barriers to growth flagged by businesses who are seeking to grow and have
become a participant in GrowthAccelerator. The Dashboard can be used as a source of evidence
to inform discussions on priorities in business support and includes easily understood metrics
which can be readily updated on an annual basis. We also need to bear in mind the period these
metrics refer to - the years before the economy began to show firm signs of recovery.
LEP Growth Dashboard 3
What the tables show is a complex LEP geography which provides a challenge to some of the preconceptions held about the ‘hotspots’ of growth across England while confirming others. London occupies one of the top two positions for all the metrics except survival rates of start-ups where it lies in the bottom four.
4 LEP Growth Dashboard
Local Area Growth Metrics
Proportion of Fast-Growing Firms in the Business Population (2009-12)
%
London 17.4%
Oxfordshire 15.7%
Thames Valley Berkshire 14.3%
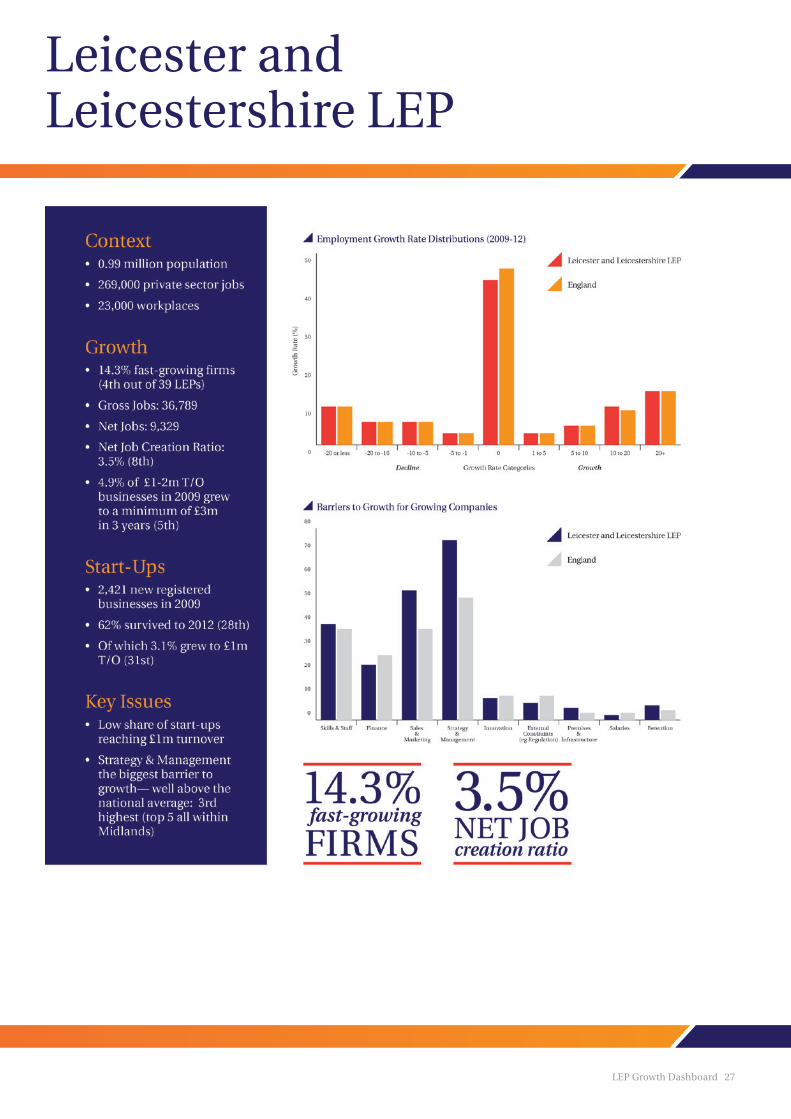
Leicester and Leicestershire 14.3%
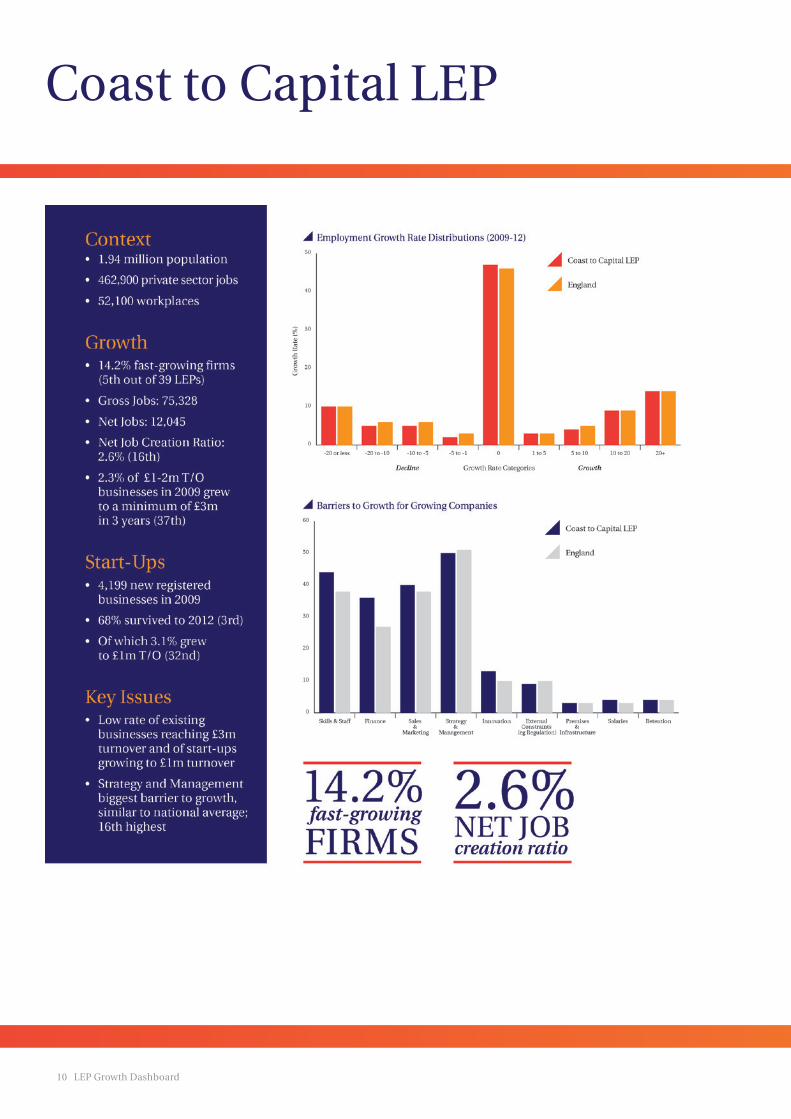
Coast to Capital 14.2%
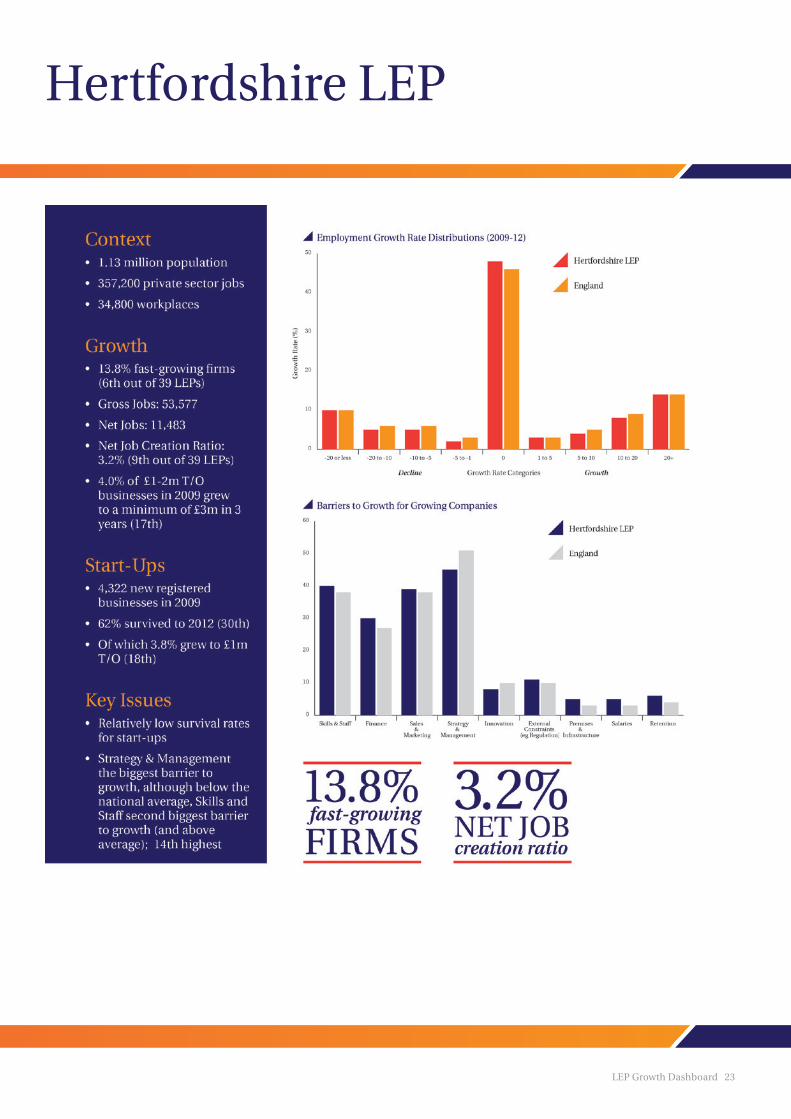
Hertfordshire 13.8%
Greater Manchester 13.7%
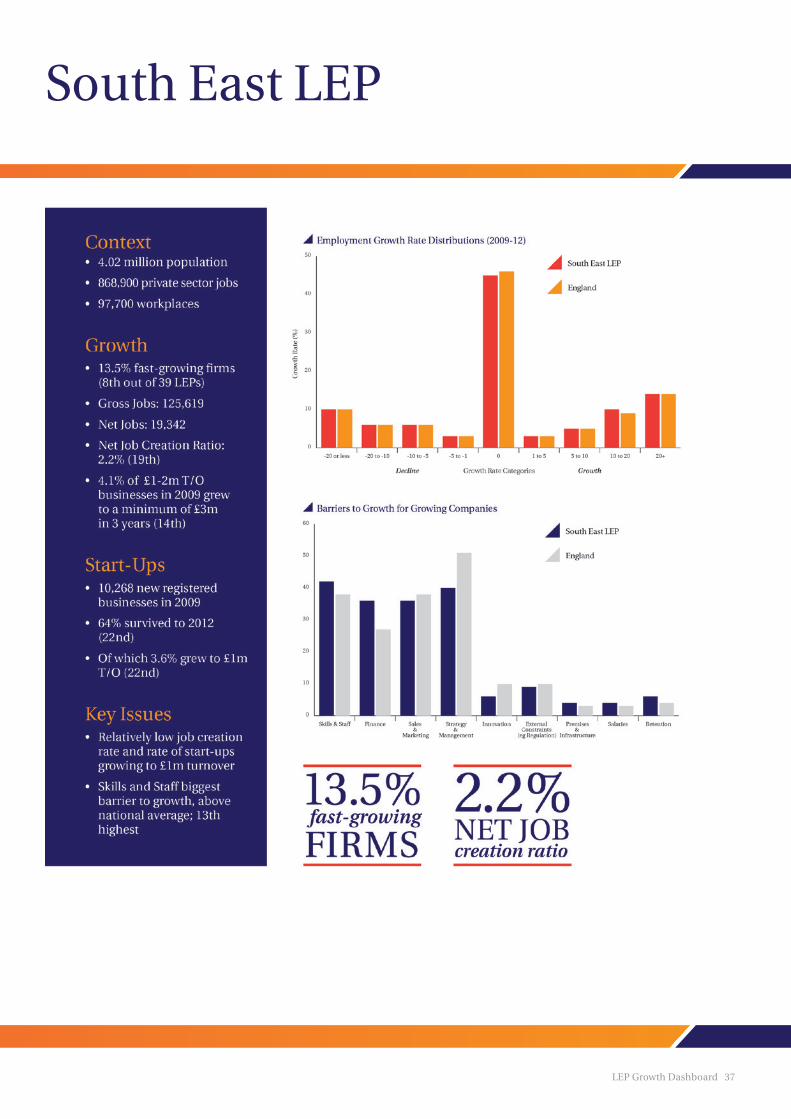
South East 13.5%
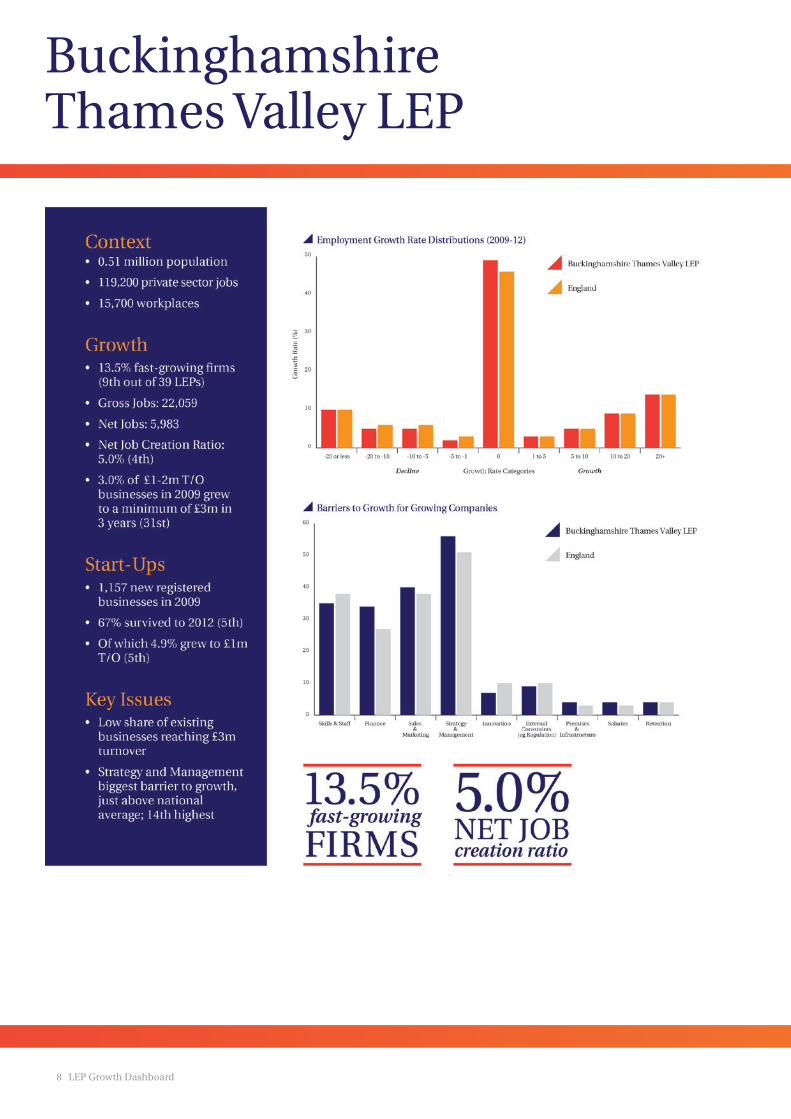
Buckinghamshire Thames Valley 13.5%
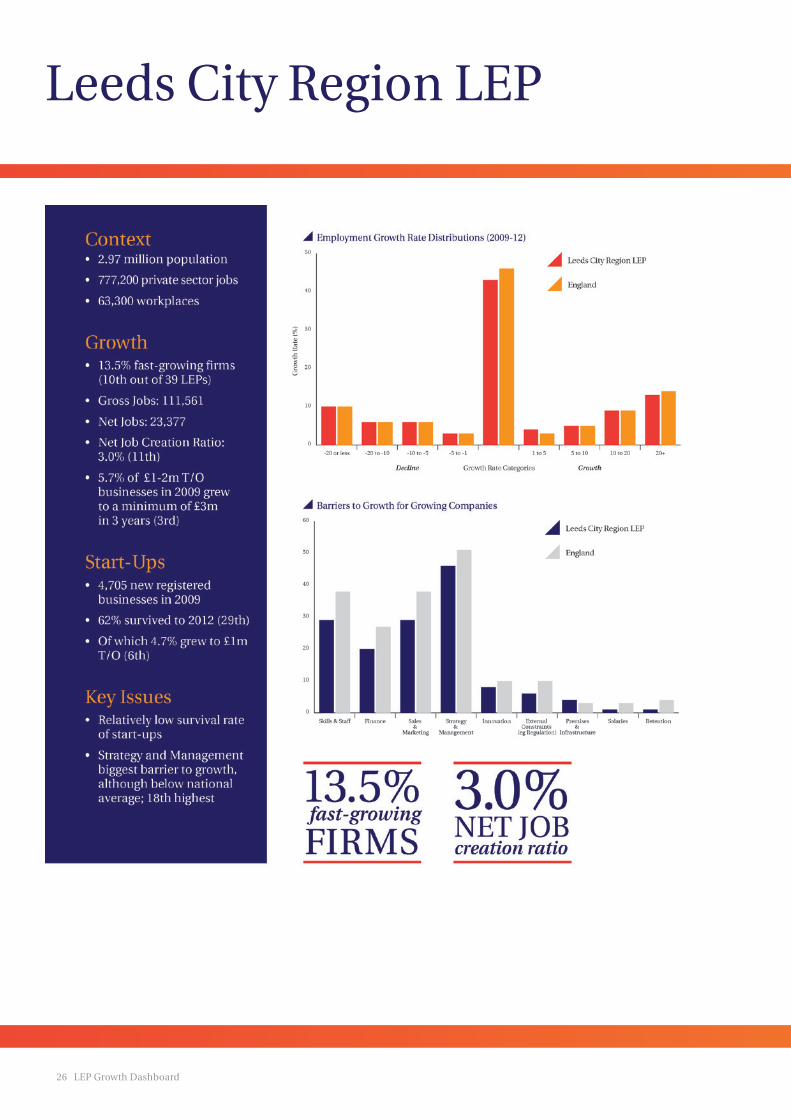
Leeds City Region 13.5%
Liverpool City Region 13.4%
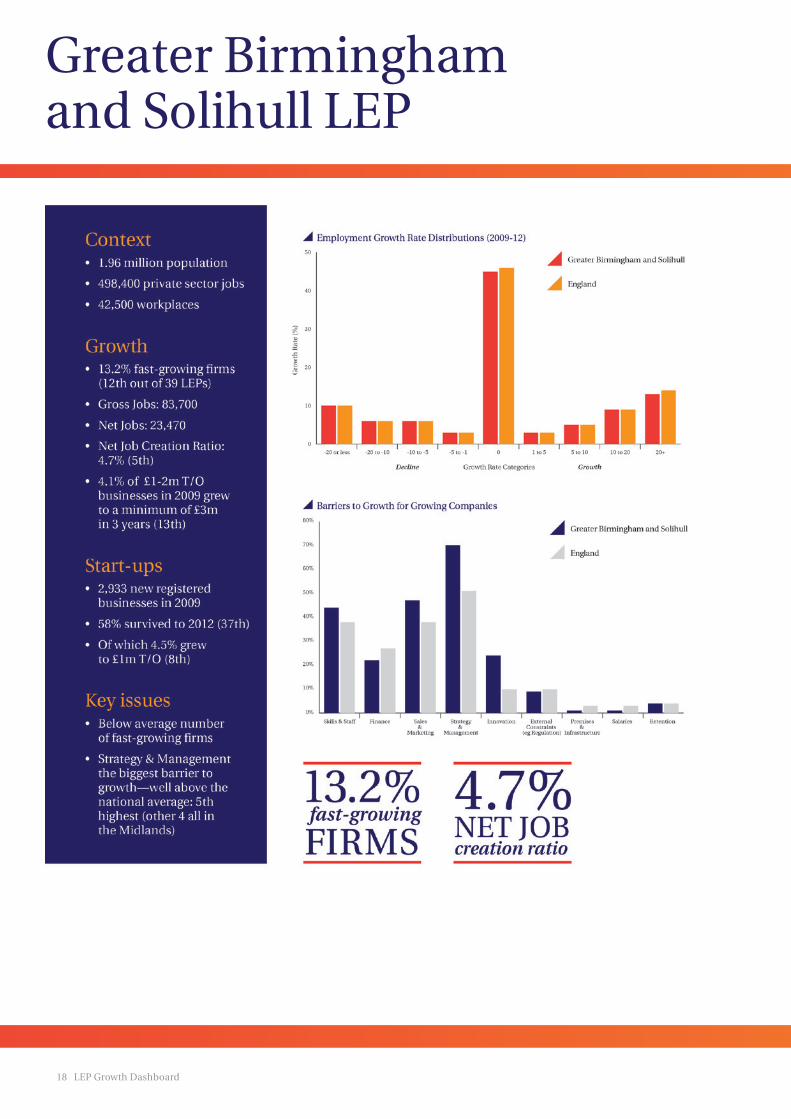
Greater Birmingham and Solihull 13.2%
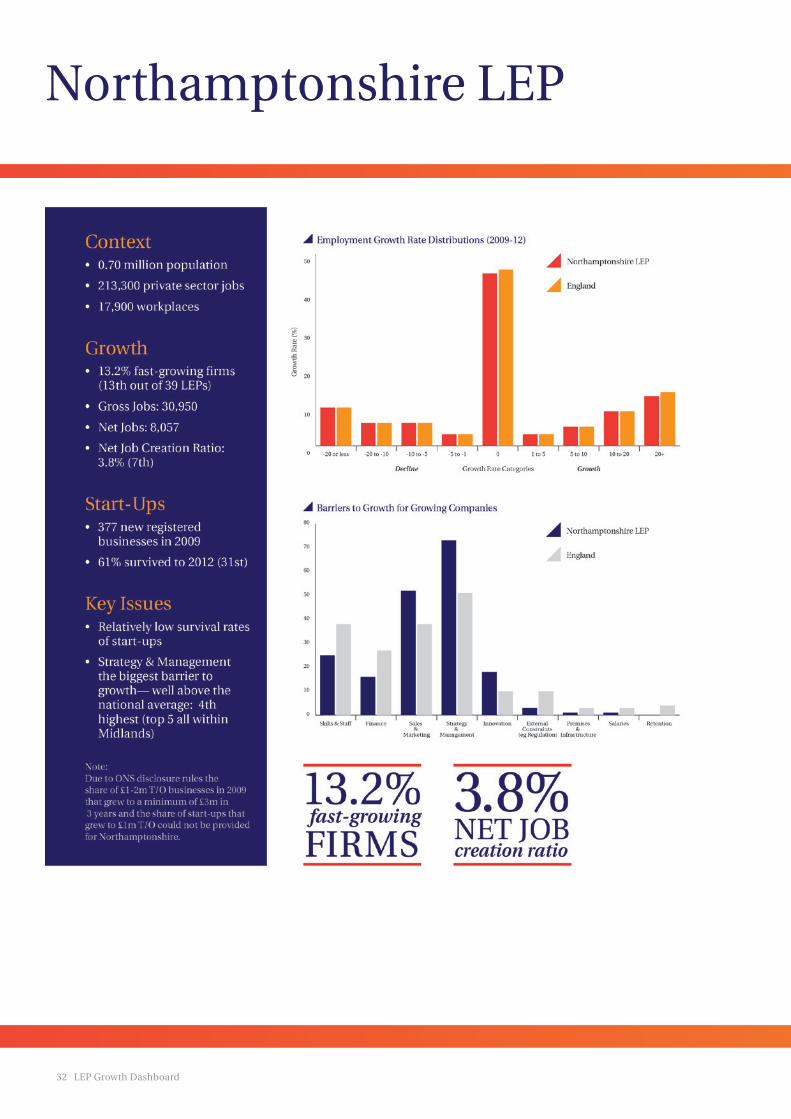
Northamptonshire 13.2%
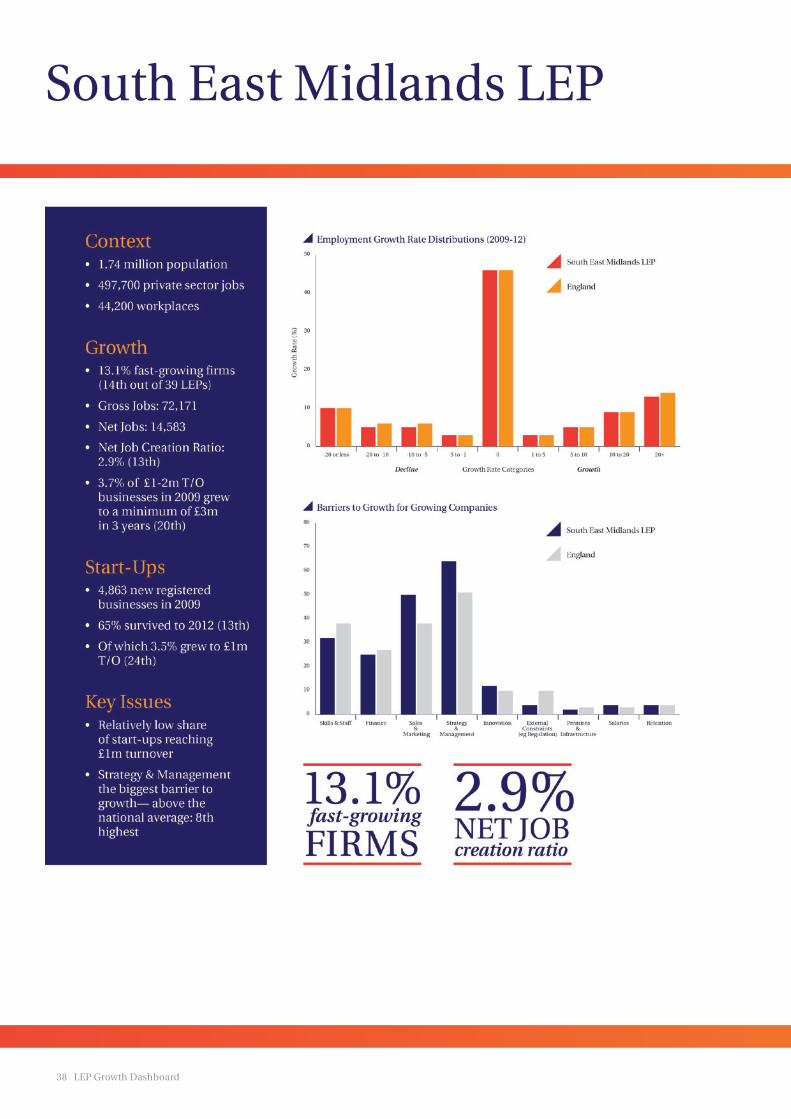
South East Midlands 13.1%
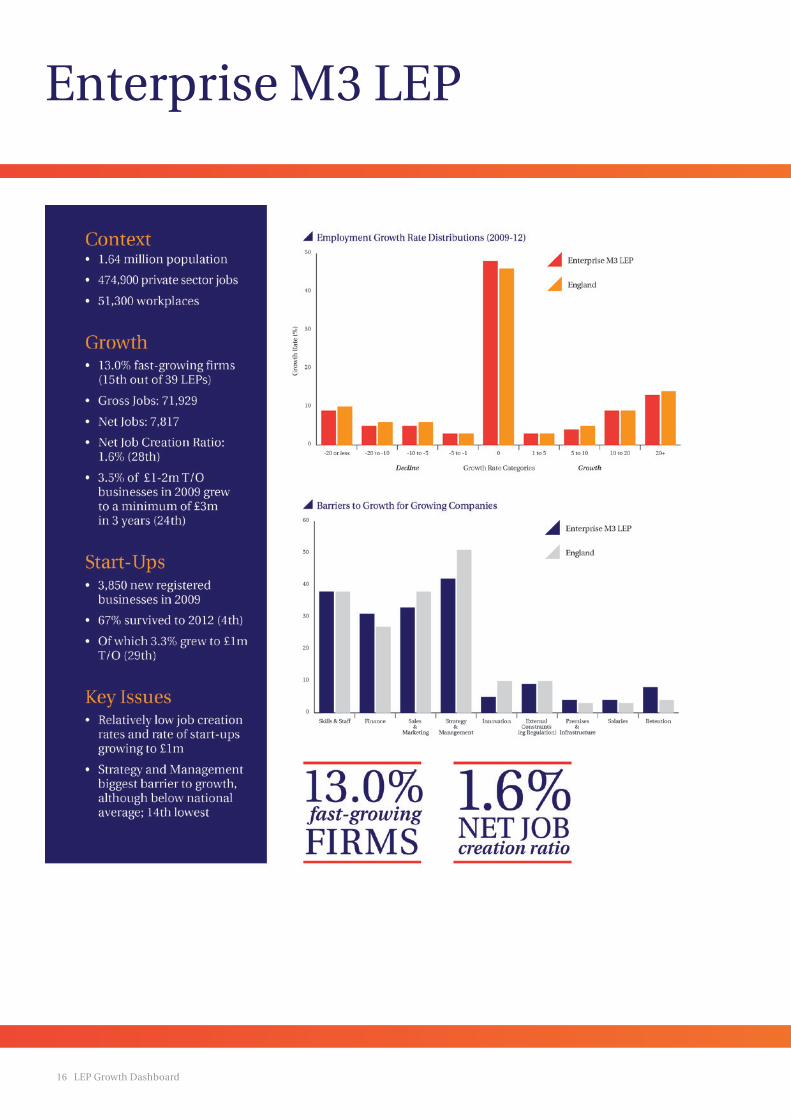
Enterprise M3 13.0%
Black Country 12.9%
West of England 12.9%
Cornwall and the Isles of Scilly 12.7%
Swindon and Wiltshire 12.7%
Dorset 12.7%
Greater Cambridge & Greater Peterborough 12.7%
Stoke-on-Trent and Staffordshire 12.6%
Coventry and Warwickshire 12.5%
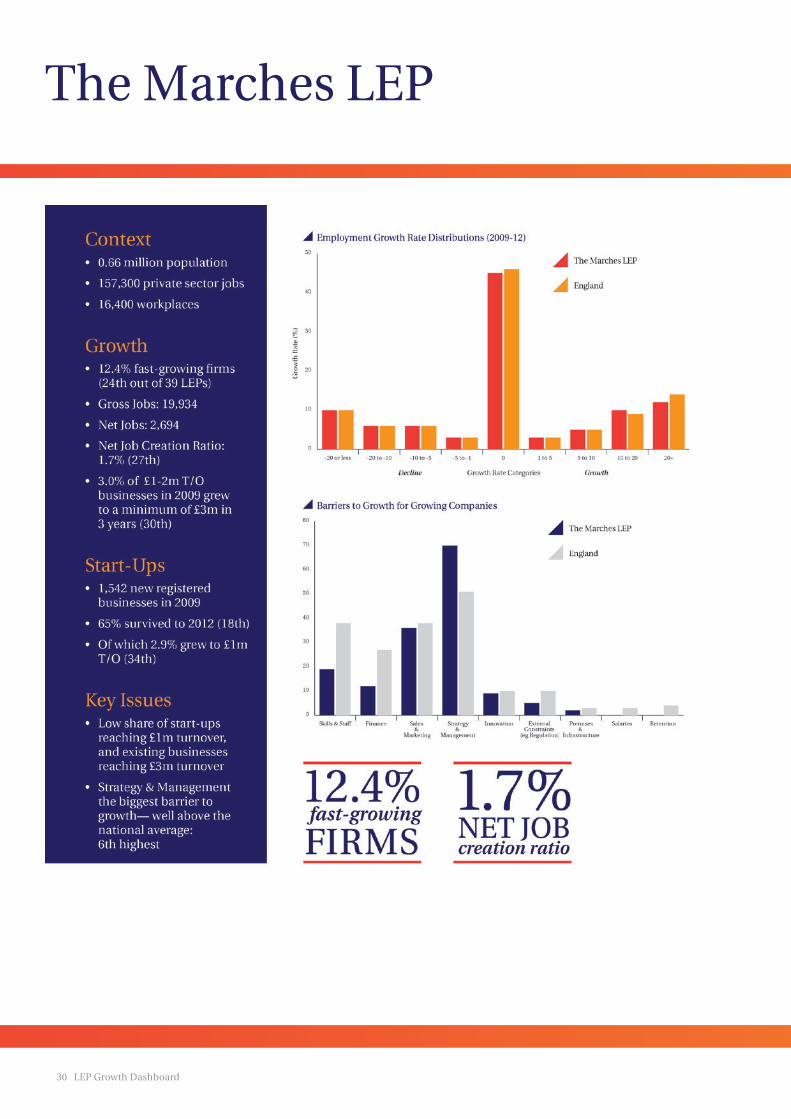
The Marches 12.4%
Solent 12.3%
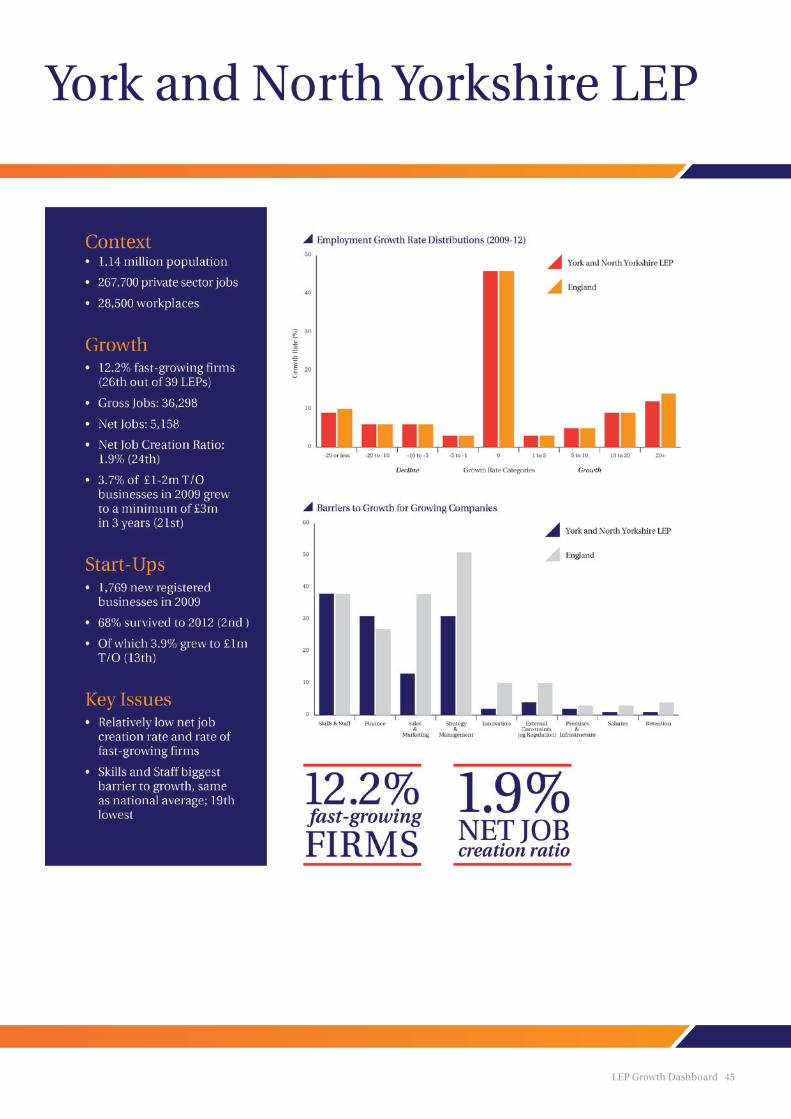
York and North yorkshire 12.2%
Sheffield City Region 12.0%
Worcestershire 11.9%
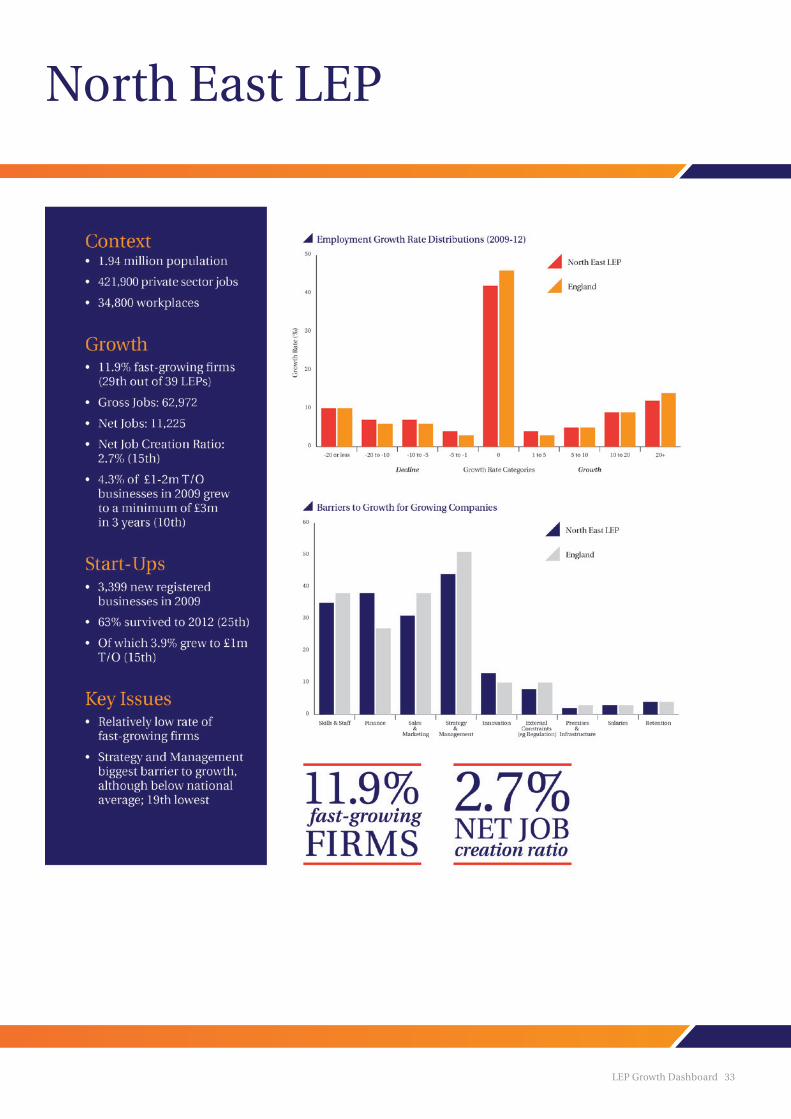
North Eastern 11.9%
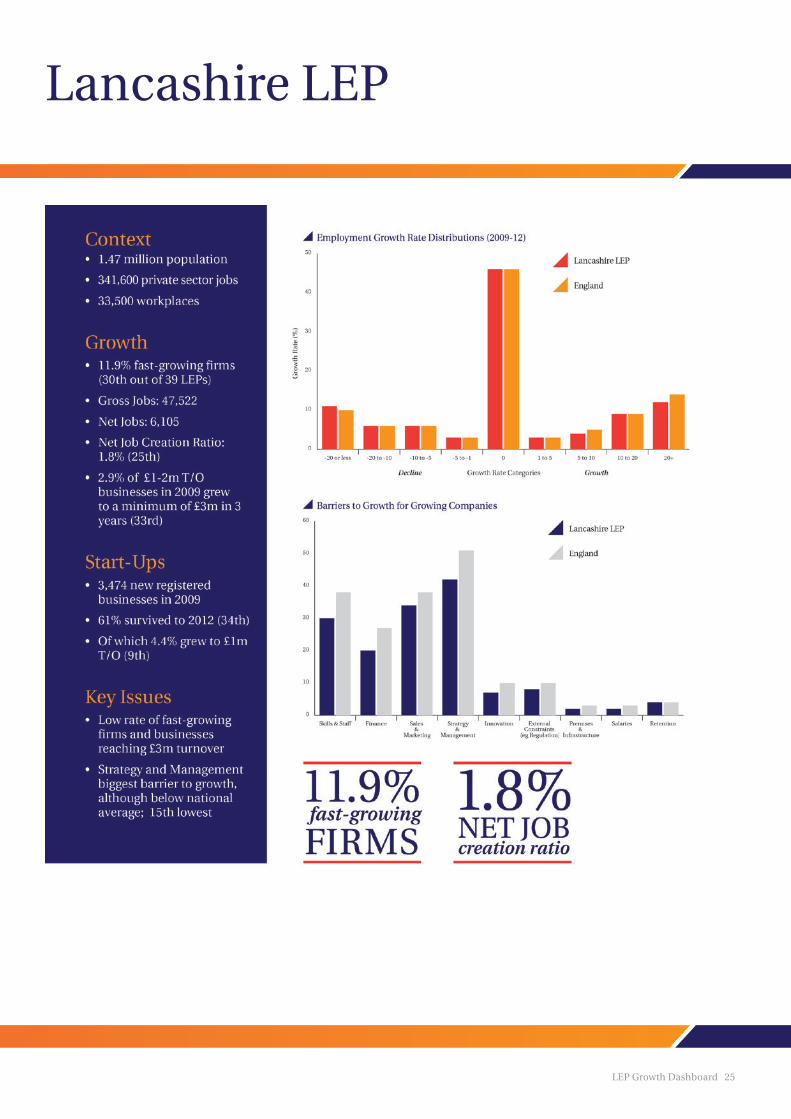
Lancashire 11.9%
Greater Lincolnshire 11.9%
Derby, Derbyshire, Nottingham and Nottinghamshire
11.8%
Tees Valley 11.8%
Heart of the South West 11.8%
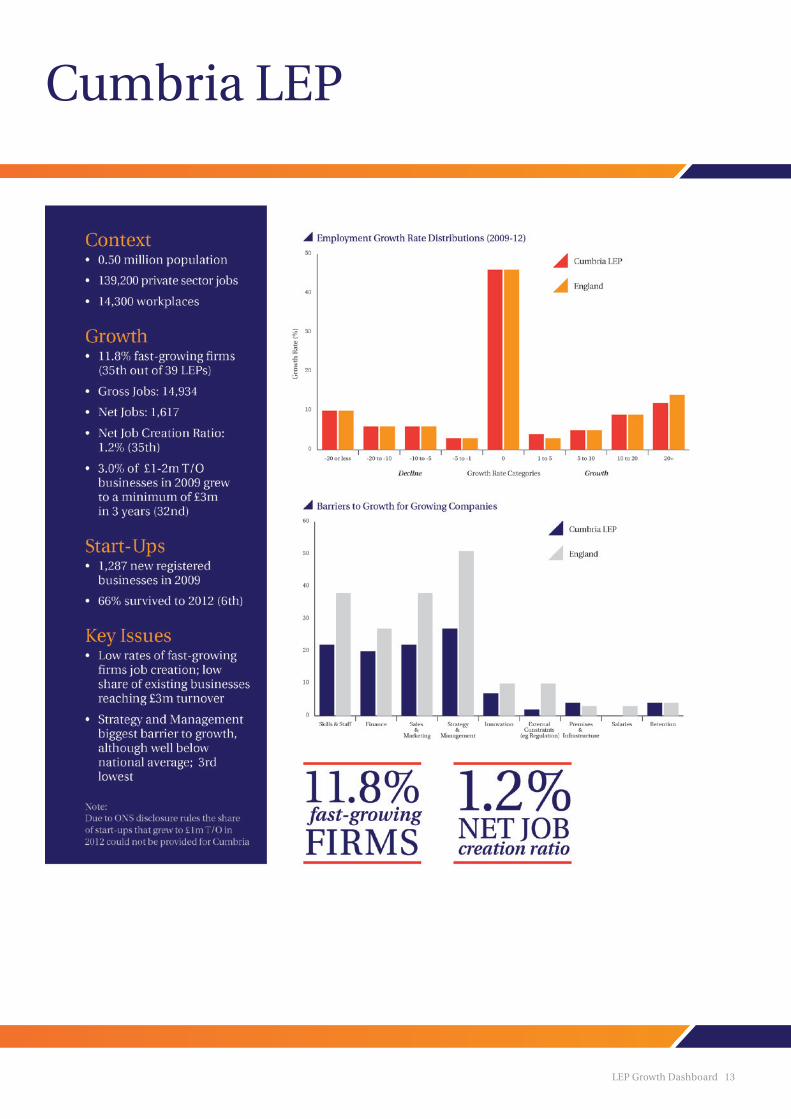
Cumbria 11.8%
Gloucestershire 11.7%
New Anglia 11.6%
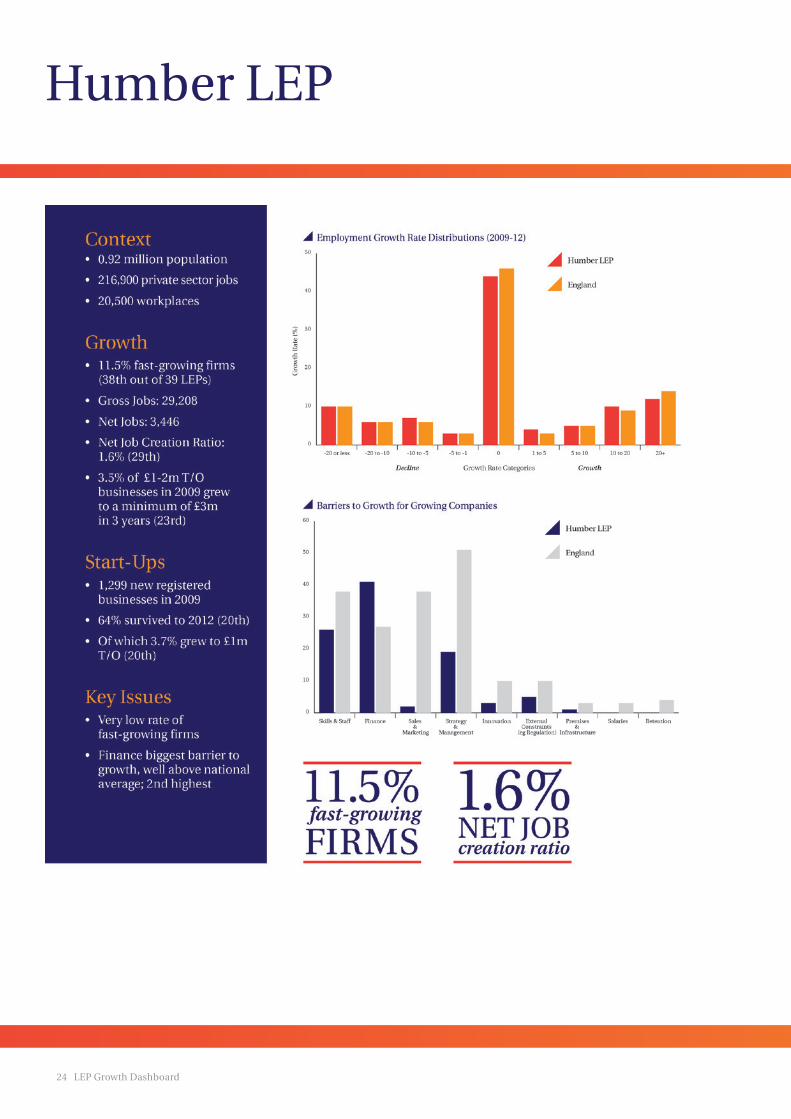
Humber 11.5%
Cheshire & Warrington 10.8%
England 13.7%
Proportion of Existing Businesses with £1-2m T/O in 2009 who reach £3m T/O in 3 years (2012)
%
Thames Valley Berkshire 7.7%
London 5.8%
Leeds City Region 5.7%
Sheffield City Region 5.1%
Leicester and Leicestershire 4.9%
Oxfordshire 4.6%
Greater Cambridge & Greater Peterborough
4.6%
West of England 4.5%
Greater Manchester 4.3%
North Eastern 4.3%
Worcestershire 4.2%
Greater Lincolnshire 4.1%
Greater Birmingham and Solihull 4.1%
South East 4.1%
Black Country 4.0%
New Anglia 4.0%
Hertfordshire 4.0%
Liverpool City Region 3.9%
Coventry and Warwickshire 3.8%
South East Midlands 3.7%
York and North Yorkshire 3.7%
Dorset 3.6%
Humber 3.5%
Enterprise M3 3.5%
Cornwall and the Isles of Scilly 3.5%
Stoke-on-Trent and Staffordshire 3.5%
Gloucestershire 3.4%
Derby, Derbyshire, Nottingham and Nottinghamshire
3.4%
Solent 3.2%
The Marches 3.0%
Buckinghamshire Thames Valley 3.0%
Cumbria 3.0%
Lancashire 2.9%
Swindon and Wiltshire 2.9%
Cheshire & Warrington 2.6%
Heart of the South West 2.6%
Coast to Capital 2.3%
Northamptonshire *
Tees Valley *
England 4.3%
Net Job Creation Ratio: 2011-2012 %
Derby, Derbyshire, Nottingham and Nottinghamshire
6.0%
London 5.5%
Cheshire and Warrington 5.4%
Buckinghamshire Thames Valley 5.0%
Greater Birmingham and Solihull 4.7%
Liverpool City Region 3.8%
Northamptonshire 3.8%
Leicester and Leicestershire 3.5%
Hertfordshire 3.2%
Greater Manchester 3.2%
Leeds City Region 3.0%
Greater Lincolnshire 3.0%
South East Midlands 2.9%
Gloucestershire 2.8%
North Eastern 2.7%
Coast to Capital 2.6%
Thames Valley Berkshire 2.5%
New Anglia 2.3%
South East 2.2%
Oxfordshire 2.2%
Stoke-on-Trent and Staffordshire 2.2%
Solent 2.0%
Dorset 1.9%
York and North Yorkshire 1.9%
Lancashire 1.8%
West of England 1.8%
The Marches 1.7%
Enterprise M3 1.6%
Humber 1.6%
Cornwall and the Isles of Scilly 1.5%
Greater Cambridge & Greater Peterborough
1.5%
Worcestershire 1.5%
Swindon and Wiltshire 1.5%
Coventry and Warwickshire 1.4%
Cumbria 1.2%
Black Country 0.9%
Sheffield City Region 0.6%
Tees Valley 0.4%
Heart of the South West -0.1%
England 3.1%

LEP Growth Dashboard 5
Proportion of 2009 start-ups that survive to 2012
%
Oxfordshire 68.4%
York and North Yorkshire 68.1%
Coast to Capital 67.8%
Enterprise M3 66.8%
Buckinghamshire Thames Valley 66.5%
Cumbria 66.4%
Dorset 66.4%
Thames Valley Berkshire 66.3%
New Anglia 66.1%
Gloucestershire 65.7%
Heart of the South West 65.6%
Solent 65.4%
South East Midlands 65.3%
Derby, Derbyshire, Nottingham and Nottinghamshire
65.3%
Cornwall and the Isles of Scilly 65.3%
Greater Cambridge & Greater Peterborough 65.0%
West of England 64.9%
The Marches 64.5%
Cheshire & Warrington 64.4%
Humber 64.2%
Stoke-on-Trent and Staffordshire 63.7%
South East 63.6%
Greater Lincolnshire 63.6%
Coventry and Warwickshire 63.3%
North Eastern 63.2%
Tees Valley 62.7%
Swindon and Wiltshire 62.3%
Leicester and Leicestershire 61.9%
Leeds City Region 61.8%
Hertfordshire 61.8%
Northamptonshire 61.0%
Sheffield City Region 60.9%
Worcestershire 60.9%
Lancashire 60.7%
Black Country 60.5%
London 59.7%
Greater Birmingham and Solihull 58.0%
Greater Manchester 57.8%
Liverpool City Region 53.3%
England 62.5%
Proportion of 2009 start-ups which survive and grow to £1m T/O in 3 years (2012)
%
Black Country 5.7%
London 5.2%
Greater Manchester 5.1%
Liverpool City Region 5.0%
Buckinghamshire Thames Valley 4.9%
Leeds City Region 4.7%
Derby, Derbyshire, Nottingham and Nottinghamshire 4.6%
Greater Birmingham and Solihull 4.5%
Lancashire 4.4%
Greater Lincolnshire 4.1%
Thames Valley Berkshire 4.0%
Cornwall and the Isles of Scilly 4.0%
York and North Yorkshire 3.9%
Stoke-on-Trent and Staffordshire 3.9%
North Eastern 3.9%
Sheffield City Region 3.9%
Worcestershire 3.8%
Hertfordshire 3.8%
Tees Valley 3.8%
Humber 3.7%
Dorset 3.7%
South East 3.6%
Coventry and Warwickshire 3.6%
South East Midlands 3.5%
Heart of the South West 3.5%
Cheshire & Warrington 3.4%
Solent 3.4%
West of England 3.3%
Enterprise M3 3.3%
Oxfordshire 3.3%
Leicester and Leicestershire 3.1%
Coast to Capital 3.1%
New Anglia 3.1%
The Marches 2.9%
Greater Cambridge & Greater Peterborough 2.7%
Gloucestershire 2.5%
Swindon and Wiltshire 2.2%
Cumbria *
Northamptonshire *
England 4.1%
*indicates that the number had to be suppressed to comply with ONS statistical disclosure protocols
6 LEP Growth Dashboard
The dataset used in the production of the growth and start-up data is the Business Structure Database (BSD). This is a dataset produced by the Office of National Statistics (ONS) and is an annual snapshot of the Inter-Departmental Business Register (IDBR) which is a live register of data collected by HM Revenue and Customs via VAT and Pay As You Earn (PAYE) records. The IDBR data are complemented with data from ONS business surveys. If a business is liable for VAT (turnover exceeds the VAT threshold) and/or has at least one member of staff registered for the PAYE tax collection system, then the business will appear on the IDBR (and hence in the BSD). We use the firm-level BSD for firm growth rates and start-ups and the site-level BSD for the calculation of new and gross new jobs.
The dataset used in the production of the barriers to growth data has been provided by GrowthAccelerator based on their diagnostics of participant needs at the start of their customer journey with the service.
Time periods
• The number of private sector jobs, workplaces and population estimates refer to 2012. Employment growth rates, survival rates and growth of start-ups refer to the period 2009-12. Data on job creation refers to the 12 months prior to March 2012.
• The GrowthAccelerator data on barriers to growth was extracted for c14,000 clients in May 2014 and covers the period May 2012 – May 2014.
Metric Definitions
• Fast Growth is defined as annualised average growth in employment of 20% or more over a three year period (2009-2012)
• Gross Jobs refers to the total number of jobs created in a one year period (2011-2012).
• Net Jobs refers to the total number of jobs created in the one year period (2011-2012) minus the total number of jobs destroyed in the one year period (2011-2012).
• Net Job Creation Ratio is defined as net jobs (2011-2012)/opening year jobs (2011-2012)
• Start-up is defined as a UK-owned firm born in 2009
• Start-ups growing to £1m turnover refer to UK-owned firms born in 2009 whose turnover reached at least £1m in 2012
• Firms growing to £3m turnover refer to UK-owned firms born prior to 2009 that survived to 2012, whose turnover grew from £1-2m in 2009 to at least £3m in 2012
Note: some of the UK statistical data used in this LEP Dashboard is from the ONS and is Crown copyright and reproduced with the permission of the controller of HMSO and the Queen’s Printer for Scotland. The use of the ONS statistical data in this work does not imply the endorsement of the ONS in relation to the interpretation or analysis of the statistical data.
Data Sources

LEP Growth Dashboard 7
Black Country LEP
8 LEP Growth Dashboard
Buckinghamshire Thames Valley LEP

LEP Growth Dashboard 9
Cheshire and Warrington LEP
10 LEP Growth Dashboard
Coast to Capital LEP

LEP Growth Dashboard 11
Cornwall and the Isles of Scilly LEP

12 LEP Growth Dashboard
Coventry and Warwickshire LEP
LEP Growth Dashboard 13
Cumbria LEP

14 LEP Growth Dashboard
Derby, Derbyshire, Nottingham and Nottinghamshire LEP

LEP Growth Dashboard 15
Dorset LEP
16 LEP Growth Dashboard
Enterprise M3 LEP

LEP Growth Dashboard 17
Gloucestershire LEP
18 LEP Growth Dashboard
Greater Birmingham and Solihull LEP

LEP Growth Dashboard 19
Greater Cambridge and Greater Peterborough LEP

20 LEP Growth Dashboard
Greater Lincolnshire LEP

LEP Growth Dashboard 21
Greater Manchester LEP

22 LEP Growth Dashboard
Heart of the South West LEP
LEP Growth Dashboard 23
Hertfordshire LEP
24 LEP Growth Dashboard
Humber LEP
LEP Growth Dashboard 25
Lancashire LEP
26 LEP Growth Dashboard
Leeds City Region LEP
LEP Growth Dashboard 27
Leicester and Leicestershire LEP

28 LEP Growth Dashboard
Liverpool City Region LEP

LEP Growth Dashboard 29
London LEP
30 LEP Growth Dashboard
The Marches LEP

LEP Growth Dashboard 31
New Anglia LEP
32 LEP Growth Dashboard
Northamptonshire LEP
LEP Growth Dashboard 33
North East LEP

34 LEP Growth Dashboard
Oxfordshire LEP

LEP Growth Dashboard 35
Sheffield City Region LEP

36 LEP Growth Dashboard
Solent LEP
LEP Growth Dashboard 37
South East LEP
38 LEP Growth Dashboard
South East Midlands LEP

LEP Growth Dashboard 39
Stoke-on-Trent and Staffordshire LEP

40 LEP Growth Dashboard
Swindon and Wiltshire LEP

LEP Growth Dashboard 41
Tees Valley LEP

42 LEP Growth Dashboard
Thames Valley Berkshire LEP

LEP Growth Dashboard 43
West of England LEP

44 LEP Growth Dashboard
Worcestershire LEP
LEP Growth Dashboard 45
York and North Yorkshire LEP

46 LEP Growth Dashboard

LEP Growth Dashboard 47
The Enterprise Research Centre (ERC) was established in February 2013 to answer one central question ‘What drives SME Growth?’
Our mission is to become a focal point internationally for research, knowledge and expertise on SME growth and entrepreneurship. ERC brings the evidence base on SMEs and enterprise together, drives out new research insights and works with policy makers and practitioners to ensure research shapes better policies and practices to help SMEs to grow.
The Enterprise Research Centre is a collaboration of 5 University Business Schools: Warwick, Aston, Birmingham, Strathclyde and Imperial College and is funded by the Economic & Social Research Council, the British Bankers’ Association, the Department for Business, Innovation & Skills and the Technology Strategy Board.
See more at: www.enterpriseresearch.ac.uk
A partnership between leading private sector business growth experts, Grant Thornton, Pera, Oxford Innovation and Winning Pitch and backed by Government, GrowthAccelerator is a unique service that will get businesses where they want to be – faster.
GrowthAccelerator exclusively targets high growth potential businesses who want to enter their next phase of growth and have the determination to get there. GrowthAccelerator gives businesses the framework to:
• build a successful growth strategy
• discover new routes to funding and investment
• unlock their capacity for innovation
• build on the power of their people
• unite and inspire their leadership team
Businesses also have exclusive access to up to £2,000 match funding for senior managers to hone their leadership and management skills.
Find out more at www.growthaccelerator.com and join the high growth conversation @GrowthAccel #highgrowth
GrowthAccelerator and Enterprise Research Centre both have access to rich sources of data which
enable us to look not only at where growth is happening but also what growing businesses say acts
as a barrier to growth. This report is the first of many opportunities to jointly mine this data.