
ERAMON Performance-Management (EPM) · ERAMON Performance Management (EPM) 7 7 The following...
11
© b y ERAMON AG | Welserstraße 11 | 86368 Gersthofen | Germany | Tel. +49-|821-2498-200 | Fax +49-821-2498-299 | [email protected] THE POWER OF BUILDING AND MANAGING NETWORKS ERAMON Performance-Management (EPM)
Transcript of ERAMON Performance-Management (EPM) · ERAMON Performance Management (EPM) 7 7 The following...

© b y ERAMON AG | Welserstraße 11 | 86368 Gersthofen | Germany | Tel. +49-|821-2498-200 | Fax +49-821-2498-299 | [email protected]
T H E P O W E R O F B U I L D I N G A N D
M A N A G I N G N E T W O R K S
ERAMON Performance-Management (EPM)

ERAMON Performance Management (EPM) 2
2
Contents
1 General ............................................................................................................................................................... 3
2 Realization in ERAMON ..................................................................................................................................... 3
3 Display in ERAMON ........................................................................................................................................... 5

ERAMON Performance Management (EPM) 3
3
1 General
ERAMON’s Performance Management Module (EPM) collects data from different from network com-
ponents or servers, and their ports. The data is then being prepared graphically for information and
analysis purposes.
The aim is to improve performance and status assessments of devices and to display any relevant infor-
mation relating to these errors and their interfaces clearly. Thus EPM supports tasks such as the planning
of WAN-connections or file server capacities by recording traffic flow and storage volume values and
reporting any violations of threshold levels predefined in ERAMON’s event system. This enables the relia-
ble recording of short-term capacity patterns and an identification of long-term trends, which in turn
allows expansion measures to be carried out in good time.
In addition to this, the quality of services rendered may be monitored and documented. EPM provides a
considerable extension of the possibilities to display operational data currently available in the market.
Scalability to the granularity level required by the user allows better handling as well as more accurate
analysis.
2 Realization in ERAMON
EPM can be set up independent of manufacturer for any device of a device type, for ERAMON device
groups or individual devices, e.g. all switches of type Cisco Catalyst 4506. The required information is
polled in pre-defined intervals through satellites via SNMP variables of manufacturer MIBs. A large num-
ber of MIBs are already integrated in ERAMON. New MIBs can be added at any time though. A sepa-
rate data base is available for storage as well as archiving of the collected data.
EPM information can be retrieved from two different locations within the device overview (for devices
and ports) on the systems:

ERAMON Performance Management (EPM) 4
4
Depending on the number of active satellites (SATs) installed, ERAMON’s scalable client/server architec-
ture (SAT/CENTER) allows an almost infinite amount of systems data to be accessed. The type of data to
be monitored depends on the MIBs of the device manufacturers and spans from ATM Soft-PVCs to
switch buffers. Depending on operating system used by the devices, 32-bit- or 64-bit-information can be
polled.
EPM is configured using templates which can be rolled out accordingly. The requested information is
either displayed historically in a graph or as the actual current value. It is also possible to specify thresh-
old values for alerts, as well as minimum/maximum values to improve the clarity of the display.
For templates and measurements we differentiate between device and port monitoring:
Graphs with identical graph numbers are displayed in one window.
In the graph administration you can collate several measurements. This allows the pooling of port statis-
tics for IN/OUT-octets for several devices.

ERAMON Performance Management (EPM) 5
5
3 Display in ERAMON
The display of EPM information happens primarily on the device overview page. Depending on what
was selected – device or port-statistics – a popup opens showing the corresponding statistics. All re-
quested data will be shown grouped together in miniature graphs. Any time periods can be displayed.
The mouseover function shows individual values immediately. It goes without saying that the graphs can
be exported in a variety of formats (e.g. CSV, pdf, png).

ERAMON Performance Management (EPM) 6
6
Should you want to view particular values in more detail, you can view the graph in question in its own
window by clicking on the EPM icon.
ERAMON Performance Management (EPM) 7
7
The following functions are available via the detailed view:
95% Rule
The 95% average is shown.
Trend Analysis
The trend analysis applies the exponential smoothing method with a smoothing factor of 0.3 to
approximate the curve. The curve is then displayed using linear regression.
Forecast Value
The forecast extrapolates the values from the linear regression to the selected time period. The
system uses data from the measurements during the displayed time period as the basis for these
calculations.
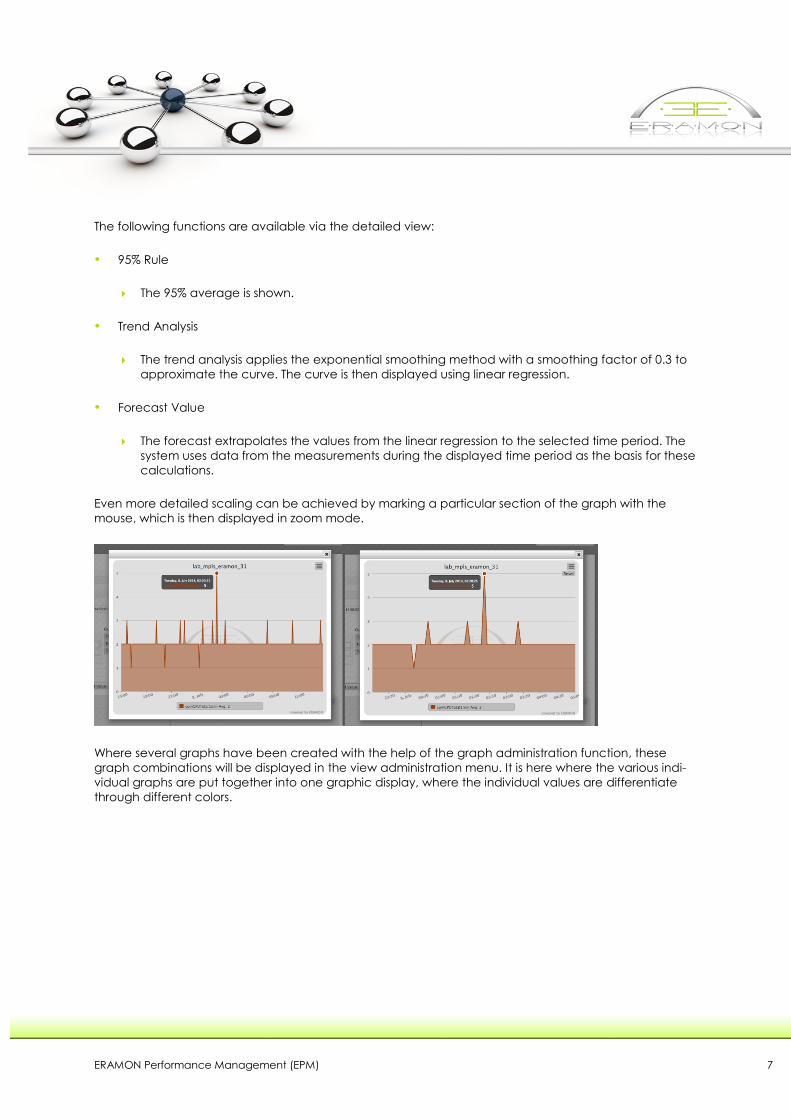
Even more detailed scaling can be achieved by marking a particular section of the graph with the
mouse, which is then displayed in zoom mode.
Where several graphs have been created with the help of the graph administration function, these
graph combinations will be displayed in the view administration menu. It is here where the various indi-
vidual graphs are put together into one graphic display, where the individual values are differentiate
through different colors.

ERAMON Performance Management (EPM) 8
8
If you would like to view a particular value in more detail, you can view it in full-screen mode.
Here also, even more detailed scaling is possible by using your mouse to mark the required area of the
graph’s data which will then be enlarged.

ERAMON Performance Management (EPM) 9
9
In special circumstances it is possible to overwrite the settings of an individual measurement. This applies
to device as well as port statistics, enabling the setting of a threshold level different to the one specified
in the original template for a particular device/port.
As you can see in the graphic display above, based on a device or port, individual measurements can
be edited separately.

ERAMON Performance Management (EPM) 10
10

ERAMON Performance Management (EPM) 11
11
The following EPM measurements are possible:
EPM:SNMP:Polling OID polling
EPM:SNMP:List List request
EPM:Ping fPing test
EPM:Script Measurements polled via external script
EPM:QOS Polling of Cisco QOS table
EPM:BGP:IN Polling of Cisco BGP router
For Cisco:
EPM:SAA:JIT:RTT RoundTripTime
EPM:SAA:JIT:SD+DS Positive Jitter Source:Destination + Destination:Source
EPM:SAA:JIT:SD Source:Destination Jitter
EPM:SAA:JIT:SD- Negative Jitter Source->Destination
EPM:SAA:JIT:DS+ Positive Jitter Destination->Source
EPM:SAA:JIT:DS- Negative Jitter Destination->Source
EPM:SAA:JIT:DS Destination:Source Jitter
EPM:SAA:JIT:PLSD Packet Lost Source:Destination
EPM:SAA:JIT:PLDS Packet Lost Destination:Source
EPM:SAA:SD+ Positive Jitter Source->Destination
EPM:SAA:JIT:LATE Packets late arrival
EPM:SAA:JIT:MIA Packets missing in action
EPM:SAA:JIT:SEQ Packets out of Sequence
EPM:SAA:JIT:COMPL Number of successful polls
EPM:SAA:JIT:ERROR Number of internal errors
EPM:SAA:JIT:MOSMIN Jitter minimum of MOS
EPM:SAA:JIT:MOSMAX Jitter maximum of MOS
EPM:SAA:ECHO Echo measurement
EPM:SAA: ECHO2
For Juniper
EPM:RPM:RTT RoundTripTime
EPM:RPM:RTT_JIT rttJitter
EPM:RPM:RTT_IJIT rttInterarrivalJitter
EPM:RPM:EGRESS egress
EPM:RPM:EGRESS_JIT egressJitter
EPM:RPM:EGRESS_IJIT egressInterarrivalJitter
EPM:RPM:INGRESS ingress
EPM:RPM:INGRESS_JIT ingressJitter
EPM:RPM:INGRESS_IJIT ingressInterarrivalJitter
For Huawei:
EPM:NQA:JIT:RTT_AVG RoundTripTime (AVG)
EPM:NQA:JIT:RTT_MIN RoundTripTime (min.)
EPM:NQA:JIT:RTT_MAX RoundTripTime (max.)
EPM:NQA:JIT:PL Packet Loss
EPM:NQA:JIT:OUT OUT
EPM:NQA:JIT:IN IN
EPM:NQA:JIT:MOS MOS
® ERAMON is the registered trademark of ERAMON GmbH.