ERA Railway Safety Performance 2011
76
2011 Railway safety performance in the European Union
-
Upload
bruno-thieme -
Category
Documents
-
view
17 -
download
1
description
railway safety in Europe
Transcript of ERA Railway Safety Performance 2011
Headquarters in Valenciennes:
120, Rue Marc Lefrancq59300 Valenciennes FRANCE
Tel. +33 327096-500
Conference centre in Lille:
Espace International299, Boulevard de Leeds59777 LilleFRANCE
www.era.europa.eu
ISBN 978-92-9205-014-6
TR-AB-11-001-EN
-C
2011
Railway safety performance in the European Union


Railway safety performance in the European Union
2011
European Railway Agency

2

3
Contents
6 Foreword8 Summary 12 Reporting on serious and signifi cant accidents 14 Reporting by safety authorities 14 Reporting by investigation bodies 16 Safety Performance 17 Railway accidents 18 Fatalities and serious injuries 20 Suicides 21 Precursors to accidents 22 Accident costs and other CSIs 24 Infrastructure 26 Traffi c volumes28 Reporting accidents by the investigation bodies32 Major EU rail accidents in 201040 Managing safety 41 Assessing safety management systems 42 Safety certifi cation 43 Safety regulation 44 Common safety targets46 Economic evaluation of safety48 Looking forward
51 Annex 1 — Common safety indicators70 Annex 2 — List of national safety authorities and national investigation bodies

4
List of abbreviations

5
ATP Automatic train protection
CSI Common safety indicator
CSM CA Common safety method on conformity assessment
CSTs Common safety targets
ECM Entity in charge of maintenance
ERA European Railway Agency
ERADIS European Railway Agency Database of Interoperability and Safety
ERTMS European Rail Traffi c Management System
ETCS European Train Control System
GDP Gross domestic product
IM Infrastructure manager
NIB National investigation body
NRV National reference value
NSA National safety authority
RISC Railway Interoperability and Safety Committee
RU Railway undertaking
SMS Safety management system
TSI Technical specifi cation for interoperability
VPC Value of preventing a casualty
WTP Willingness to pay

6
Foreword

7
This is the fourth annual report by the Agency on the development of railway safety in the European Union. According to the reported data, the year 2009 was the safest year on the EU’s railways for both passengers and rail staff since 2006.
However, the shadows of two major accidents remain in the minds of people in Europe: the fi re caused by the derailment of the freight train in Viareggio (Italy) in June 2009 and the head-on collision of two passenger trains in Buizingen (Belgium) in February 2010. Common to both, we still do not know the real causes of these two accidents, almost two years after Viareggio and more than a year after Buizingen. As the national investigation bodies, which are required by the railway
safety directive to carry out independent investigations, have not yet published their fi nal reports, the implementation of comprehensive improvement measures is in jeopardy. The reasons for this may be different in the two countries, but both cases indicate that in practice the safety regulatory framework, as set out in the railway safety directive, is not working well.
After the Buizingen accident the Agency carried out an assessment of the activities of the national safety authority (NSA) and the national investigation body (NIB) at the request of the Belgian Special Parliamentary Commission. The Agency is now seeking to build a framework for assessing both NSAs and NIBs, ultimately leading to the improvement of the organisational process and working practices that are crucial for assuring the high level of safety of European railways.
In addition to the accidents mentioned above and despite a positive trend in most safety indicators, there are some areas of railway safety which do not show improvements in the short term. Among them, fatalities of unauthorised persons and persons on level crossings may require additional attention by all relevant authorities.
The Agency has been working with national authorities to improve the quality of reporting on common safety indicators (CSIs). For the last time, the authorities could report CSI data to the Agency using their national defi nitions. This practice makes it impossible for the Agency to draw major conclusions from the data that have been available since 2006. The four-year time series is proof of the improvement in data quality achieved in cooperation with the Agency, and provides an indication of the positive development of railway safety in Europe.
In 2011, the second set of common safety targets (CSTs) will be proposed by the Agency, providing a new yardstick for the achievement of stringent safety objectives on European railways. New targets may be challenging given the continual changes on European railways; however, the Agency will be there to support Member States in meeting their safety goals.
Monitoring and analysing the safety of EU railways is a fundamental task for the Agency, providing feedback on the effectiveness of safety regulations in rail transport. Only by permanently evaluating management processes and safety outcomes, is it possible to maintain a high level of safety on European railways. Economic diffi culties, which the EU has experienced in the last years, together with the continuous opening of the EU railway market bring additional pressure to bear on the assurance of safety in railway operations. The railway safety directive has brought to each Member State an institutional and regulatory framework which, if properly applied, will prevent safety from being jeopardised in turbulent times like these. Yet, many Member States are still not making use of the practical benefi ts of these frameworks, but see them only as formal requirements. The correct implementation of the existing regulatory frameworks is equally as important as their correct transposition. The Agency, as a guardian of railway safety in the EU, will therefore continue its work together with the NSAs and NIBs in this area.
Anders LundströmHead of Safety Unit

Summary
8

9
Railways remain one of the safest modes of transport in the European Union (EU). Yet, some 1 400 people still die on EU railways each year; most of the fatalities are unauthorised persons and level-crossing users. Trends derived from the common safety indicators (CSIs) indicate an overall improvement in railway safety since 2006. Both the number of people killed and the number of seriously injured persons fell in 2009.
According to the CSI data provided by the national safety authorities (NSAs) to the Agency, 1 391 people were killed and 1 114 people were seriously injured in 3 073 railway accidents in 2009. These fi gures are by far the lowest among fi gures recorded since 2006.
The national investigation bodies (NIBs) notifi ed the Agency of 197 opened investigations of accidents and incidents that occurred during 2010. The Agency also received 210 investigation reports during 2009 covering accidents dating from 2006 and onwards.
The review of the NSA annual reports for 2009 shows that the number of safety certifi cates issued by NSAs to railway undertakings (RUs) has slightly increased. However, from the current status in the Agency’s database, it appears that there are still a number of countries which have not yet issued any safety certifi cates, while in some other Member States a combination of new and old legislation is still being used. This is alarming, since from 1 January 2011 all RUs are required to have a safety certifi cate issued according to the railway safety directive (1).
Safety of railway users
Passenger and employee fatalities make up 5 % of all persons killed on European railways, suicides excluded. Single fatality accidents, such as unauthorised persons on railway premises being hit by rolling stock in motion or level-crossing accidents, form the major part of the fatalities. Collisions of trains, derailments and fi res cause less than 3 % of the fatalities.
Figure 1: Number of fatalities for different categories of railway user (2007-2009)
1 000
900
800
700
600
500
400
300
200
100
0Passengers Employees Level-crossing
usersUnauthorised
personsOthers
• 2007 • 2008 • 2009
(1) COM(2004) 49.
70 89
37 38 38 29
504
380
50 4473
857
929
852
400

10
Suicides on railway premises
The majority of fatalities on the EU railways are suicides. Over 2 700 suicides were recorded in 2009; more than seven per day on average. The consequences are not only trauma for all parties involved, but also signifi cant costs because of delays, rescue services, police investigations, etc. There are now innovative countermeasures available. Fencing in urban and other strategic places is proving effective.
Unauthorised persons
The majority of the 852 unauthorised persons killed in 2009 were trespassers. These persons fail to realise the risk they are taking and the likelihood of fatal injury. Over 60 % of fatalities and 40 % of serious injuries happened to persons crossing or walking along tracks in unauthorised places; these numbers have not decreased over time. It can be diffi cult for the relevant authorities to determine whether the victim was a suicide or not; therefore these data need to be interpreted with caution.
Other accident victims
The Agency has noticed an increase in the number of accident victims classifi ed as others in 2009. We consider that this is partly the result of improved reporting as well as an improved understanding of the complexity of accidents.
The total number of passengers killed for the period from 2007 to 2009 is 196, a small fi gure compared with the total number of 4 390 persons killed on the railways. Some passenger fatalities occurred when passengers tried to embark or disembark from moving trains. The fl uctuations in the number of reported fatalities of level-crossing users and unauthorised persons can be explained by changes in how the Member States classify these victims. Taken together, the reported numbers are stable during the period mentioned.
Level-crossing accidents
The number of level-crossing accidents constitutes a substantial share of the total number of accidents. Member States reported 1 284 level-crossing users killed in a total of 3 063 level-crossing accidents during the three years 2007–2009.
There are about 124 000 level crossings in the EU, so that on average there are 4 level crossings in each 10 km section of track. Only 41 % are equipped with either manual or automatic protection systems. The costs associated with upgrading level crossings are substantial, so that it will take some time for these fi gures to show signifi cant improvement, unless more priority is given to reducing this risk.
11

Reporting on serious and signifi cant accidents
12
13
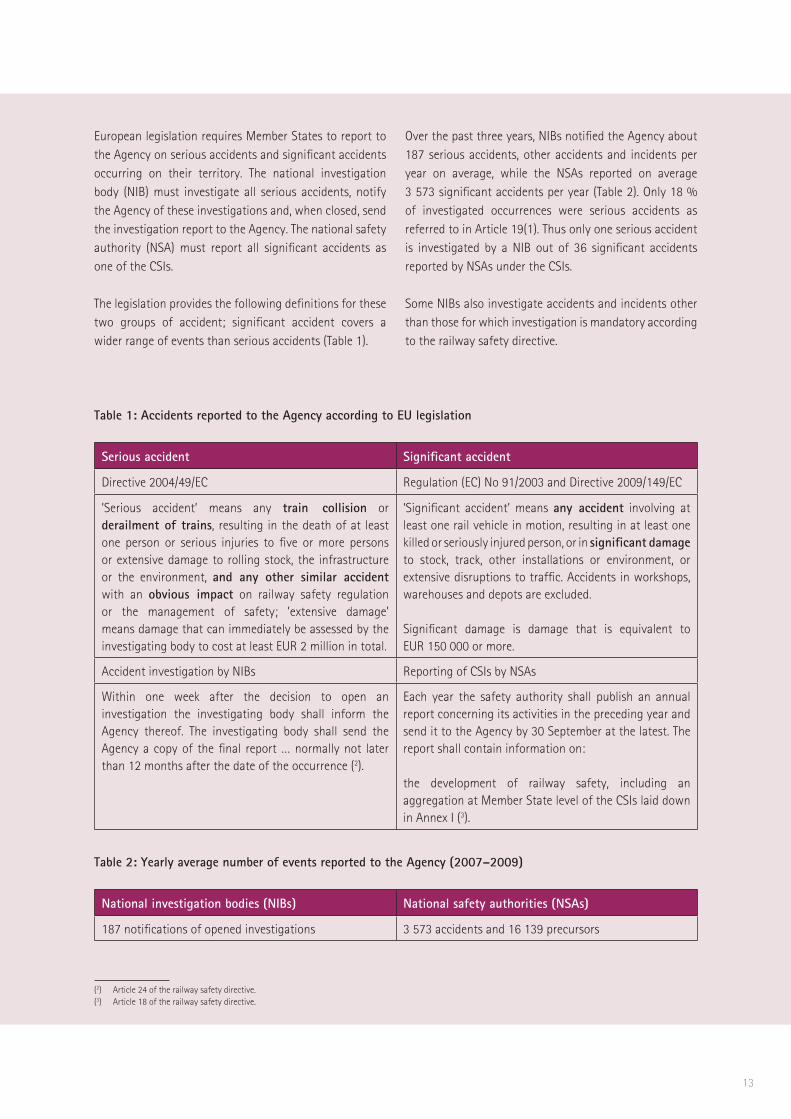
European legislation requires Member States to report to the Agency on serious accidents and signifi cant accidents occurring on their territory. The national investigation body (NIB) must investigate all serious accidents, notify the Agency of these investigations and, when closed, send the investigation report to the Agency. The national safety authority (NSA) must report all signifi cant accidents as one of the CSIs.
The legislation provides the following defi nitions for these two groups of accident; signifi cant accident covers a wider range of events than serious accidents (Table 1).
Over the past three years, NIBs notifi ed the Agency about 187 serious accidents, other accidents and incidents per year on average, while the NSAs reported on average 3 573 signifi cant accidents per year (Table 2). Only 18 % of investigated occurrences were serious accidents as referred to in Article 19(1). Thus only one serious accident is investigated by a NIB out of 36 signifi cant accidents reported by NSAs under the CSIs.
Some NIBs also investigate accidents and incidents other than those for which investigation is mandatory according to the railway safety directive.
Table 1: Accidents reported to the Agency according to EU legislation
Serious accident Signifi cant accident
Directive 2004/49/EC Regulation (EC) No 91/2003 and Directive 2009/149/EC
’Serious accident’ means any train collision or derailment of trains, resulting in the death of at least one person or serious injuries to fi ve or more persons or extensive damage to rolling stock, the infrastructure or the environment, and any other similar accident with an obvious impact on railway safety regulation or the management of safety; ’extensive damage’ means damage that can immediately be assessed by the investigating body to cost at least EUR 2 million in total.
‘Signifi cant accident’ means any accident involving at least one rail vehicle in motion, resulting in at least one killed or seriously injured person, or in signifi cant damage to stock, track, other installations or environment, or extensive disruptions to traffi c. Accidents in workshops, warehouses and depots are excluded.
Signifi cant damage is damage that is equivalent to EUR 150 000 or more.
Accident investigation by NIBs Reporting of CSIs by NSAs
Within one week after the decision to open an investigation the investigating body shall inform the Agency thereof. The investigating body shall send the Agency a copy of the fi nal report … normally not later than 12 months after the date of the occurrence (2).
Each year the safety authority shall publish an annual report concerning its activities in the preceding year and send it to the Agency by 30 September at the latest. The report shall contain information on:
the development of railway safety, including an aggregation at Member State level of the CSIs laid down in Annex I (3).
Table 2: Yearly average number of events reported to the Agency (2007–2009)
National investigation bodies (NIBs) National safety authorities (NSAs)
187 notifi cations of opened investigations 3 573 accidents and 16 139 precursors
(2) Article 24 of the railway safety directive.(3) Article 18 of the railway safety directive.

14
Reporting by safety authorities
Reporting of accident statistics and indicators
The fourth set of common safety indicators (CSIs) was largely reported on time and with less need for correction than in previous years. The CSIs to be reported to the Agency are laid down and defi ned in Annex 1 of the railway safety directive. Member States are also required to report accident data to Eurostat. The revised Annex 1 of the railway safety directive was published on 27 November 2009 (4) and provides, for the fi rst time, a set of safety indicators to be reported according to common defi nitions and calculation methods. The fi rst reporting period has been specifi ed as 2010; these CSI defi nitions will be applied when the NSAs report the 2010 CSI data to the Agency in 2011.
The work on improving data quality has continued in 2010 using a similar approach as developed in previous years and applied to the data reported for 2009. All the indicators have been checked for consistency and fl uctuation, and a comparison with the Eurostat data has been carried out. For the fi rst time a statistical test was applied to the data to determine whether the variations in the fi gures for 2006–2009 exceeded natural variation or not.
Data quality continues to improve; this year it has been possible to update some data reported in previous years; the CSI tables in the annex to this report replace the tables published in previous reports.
At the same time, the Agency has seen that the collection of CSI data has become more complicated in those countries where there are a large number of railway undertakings (RUs) and infrastructure managers (IMs). The NSAs in these countries may have limited control over the quality of data provided by the RUs and IMs.
Reporting by investigation bodies
Reporting of serious accidents and accident investigations
Independent accident investigation is a key element of learning lessons from accidents and incidents. Although all Member States established an investigation body, the Agency still has concerns as to whether the organisation and the procedures of the NIBs in some Member States comply with the requirements of the railway safety directive.
The directive requires the Member States to set up an independent accident investigation body that shall notify the Agency of any investigations opened, and to submit the full investigation report to the Agency when the investigation is closed. In 2010, the NIBs notifi ed the Agency of 197 investigations opened and submitted 210 fi nal investigation reports. The information is publicly available on the Agency’s ERADIS database.
(4) COM(2009) 149.

15
Platja de Castelldefels station in SpainSource: Spanish NIB.

Safety performance
16

17
Railway accidents
More than 3 000 accidents are reported each year by the NSAs of EU Member States. Accidents to persons caused by rolling stock in motion and level-crossing accidents constitute around 75 % of the total number of accidents on the railways, suicides excluded. Figure 2 shows the number of signifi cant accidents per accident type in the period from 2007 to 2009. For all accident types, the number of accidents in 2009 was lower than reported in the two preceding years. A clear downward trend over the period 2007–2009 can be observed for derailments of trains, level-crossing accidents and fi res in rolling stock. The numbers of accidents to persons caused by rolling stock in motion and other accidents have been more stable over time. The reason for this could be that these types of accidents are less easy to prevent.
In 2009, 142 collisions of trains were reported, representing a signifi cant drop in this type of accident in comparison with the two preceding years. Similarly the number of train derailments dropped signifi cantly in 2009, to 177 reported events. The main reason is that in several countries shunting movements were previously reported under this category. Nevertheless, on average a derailment is reported every second day in the EU, causing signifi cant traffi c disruptions.
Over the past four years, there has been a sound reduction in the number of rail accidents in Europe, which could most likely be attributed to the systematic work of railway authorities, RUs and IMs in the fi eld of safety. Even taking into account the 3 % drop in train-km as a result of the economic crisis hitting the EU in late 2008, the improvements in safety over the past years remain clearly visible. But vigilance is necessary, as an economic recession together with the market opening may have jeopardised safety investments.
Figure 2: Reported number of signifi cant accidents per accident category (2007–2009)
4 000
3 500
3 000
2 500
2 000
1 500
1 000
500
0
• 2007 • 2008 • 2009
249 269142
346 319177
1 1961 034
833
1 6741 713
1 605
107 88 66
259 321250249 269
142
346 319177
1 1961 031 4
833
1 674441 713
1 601 5
107 88 66
259 321321250
3 8313 744
3 073
Collisions of trains
Derailmentsof trains
Level-crossingaccidents
Accidents to persons caused by rolling stock in motion
Fires in rolling stock
Other accidents Total accidents

Figure 3: Reported number of fatalities per victim category (2007–2009)
18
Fatalities and serious injuries
In parallel with the fall in railway accidents, the total number of fatalities, excluding suicides, has been decreasing steadily in recent years. There were slightly less than 1 400 fatalities in 2009. However, the seriousness of accidents seems to have worsened, since on average there were 45 fatalities per 100 accidents in 2009, compared with 40 fatalities per 100 accidents registered in the two previous years. It is not possible to say whether this is a trend or if it is a result of natural variation. A signifi cant drop in casualties (fatalities and injuries together) has been registered in 2009. While the number of accidents decreased by 18 %, the number of fatalities fell by 6 % and the number of seriously injured persons dropped by 20 %. It has not been possible to establish why fatalities decreased to a lesser extent than serious accidents and serious injuries.
In Figure 3, showing the reported number of fatalities per victim type and year, there are big fl uctuations in the reported numbers of fatalities among level-crossing users and unauthorised persons. However, by adding together the number of level-crossing fatalities and the fatalities of unauthorised persons, year by year, we obtain a series of 1 361, 1 309 and 1 252, which is a stable series of data. This may indicate that Member States are still in a learning process for classifying fatalities, and it is probable that this also applies for other indicators.
The total number of employee fatalities decreased from 38 in the three preceding years to 29 in 2009. The number of passenger fatalities dropped to 37. So, for the fi rst time, the number of employee fatalities was below 30, and the number of passenger fatalities was less than 40 in one year. Although 400 level-crossing users died in level-crossing accidents in 2009 (29 % of all railway accident fatalities), this represented only 1.2 % of all road user fatalities. Level-crossing safety might therefore be perceived as a marginal problem by the road sector, while it is a key problem for the railway — also because of its impact on railway operation.
1 600
1 400
1 200
1 000
800
600
400
200
0
• 2007 • 2008 • 2009
70 8937 38 38 29
504
380400
857
929
852
50 4473
1 519 1 480
1 391
70 8937 38 38 29
504
380380400
857
929929
852
50 4473
11 391
•
Passengers Employees Level-crossing users Unauthorised persons
Other persons Total persons

Figure 4. Fatalities per victim type (2007–2009)
• Passengers 5 %
• Employees 2 %
• Level-crossing users 29 %
• Unauthorised persons 60 %
• Others 4 %
Breakdown of fatalities
(2007–2009)
19
The majority of the reported fatalities are unauthorised persons and level-crossing users. This is shown in Figure 4, which also reveals that the most common accident is that of an unauthorised person hit by rolling stock in motion. Passenger fatalities account for less than 5 % of the total number of deaths on railways. Some 2 % of all fatalities on railways are employees.
In addition to persons killed on railways, a large number of persons are seriously injured each year. In 2009, 1 114 persons were seriously injured, a 20 % drop in comparison with the two previous years (Figure 5). This drop is mainly driven by signifi cant decreases in injury to employees and level-crossing users. The reported number of other persons seriously injured increased substantially in 2009, refl ecting one single accident at Viareggio that led to 32 fatalities and 27 serious injuries among the population living in the vicinity of the crash site.
1 600
1 400
1 200
1 000
800
600
400
200
0
• 2007 • 2008 • 2009
270 282235
111131
71
485
408
285
451518
454
58 4469
1 375 1 383
1 114
270 282235
111131
71
485
408
285
451518
454
58 4469
1 114
Figure 5: Reported number of serious injuries per victim category (2007–2009)
Passengers Employees Level-crossing users Unauthorised persons
Other persons Total persons

20
Similarly, as in previous years, a number of NSAs have reported changes in their reporting procedures or the defi nitions applied in the data collection. These are refl ected in several fi gures such as Figure 5. For serious injuries, the reported numbers of injured passengers and unauthorised persons for the period from 2007 to 2009 show large variations beyond what might be expected from natural fl uctuation.
Over the period 2007–2009 there were four seriously injured passengers per one killed passenger while the numbers of all seriously and fatally injured persons were on equal level. At the same time, there were two fatally injured unauthorised persons per one seriously injured person in the same category of victims. This refl ects the vulnerability of persons when hit by a train, on the one hand, and the difference in the chance of survival for passengers and trespassers on the other hand.
The slight decrease in the number of victims in recent years, rail passengers in particular, is promising. The corresponding risk level for passengers in terms of victims per passenger-km has been decreasing at the same pace, as the volume of passengers has not changed over time.
Suicides
Suicides are reported separately from accident fatalities. Suicides represent 66 % of all fatalities and, together with the unauthorised person fatalities, constitute 72 % of all fatalities occurring within the railway system. No trend can be derived from the available data, but as it appears, the number of suicides registered in 2009 is the highest value reported to the Agency (Figure 6).
The Member States use different methods for establishing whether a fatality is a suicide or not. The revised Annex 1 and its guidance will lead to a more harmonised approach to classifying suicides.
Figure 6. Suicides and other fatalities (2007–2009)
4 500
4 000
3 500
3 000
2 500
2 000
1 500
1 000
500
02007 2008 2009
• Suicides • Other persons
1 5191 480
1 391
2 630 2 4292 719
21
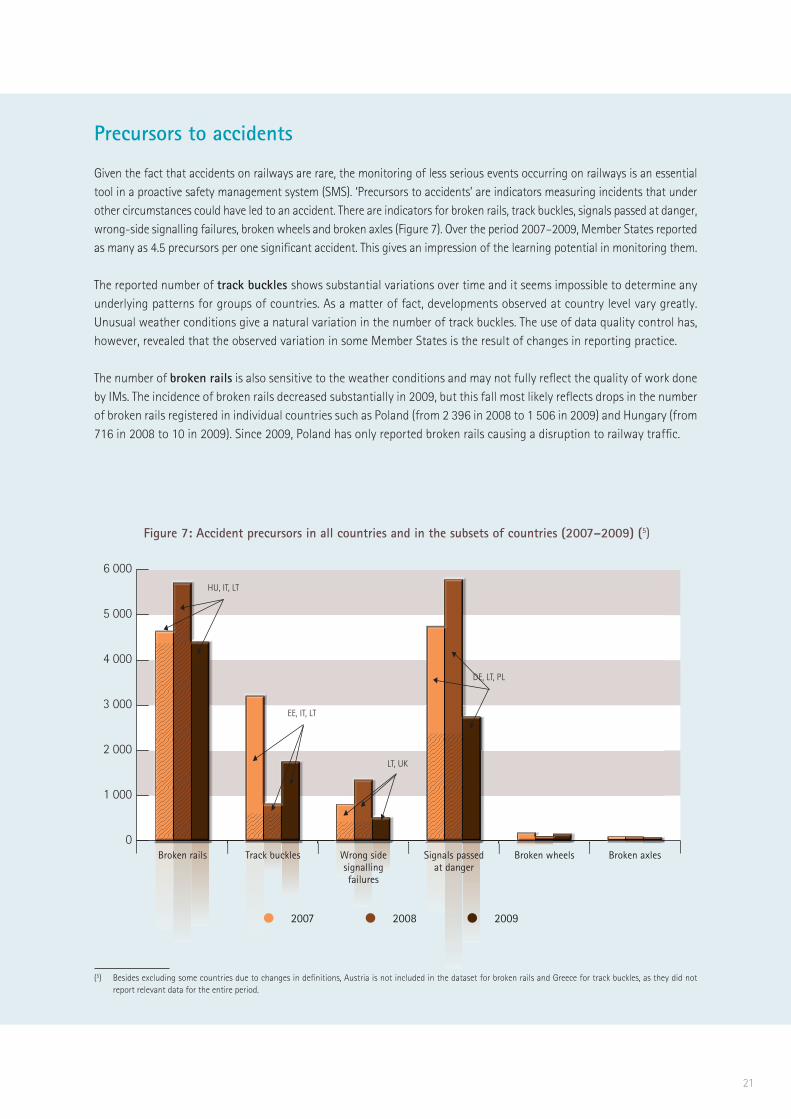
Precursors to accidents
Given the fact that accidents on railways are rare, the monitoring of less serious events occurring on railways is an essential tool in a proactive safety management system (SMS). ‘Precursors to accidents’ are indicators measuring incidents that under other circumstances could have led to an accident. There are indicators for broken rails, track buckles, signals passed at danger, wrong-side signalling failures, broken wheels and broken axles (Figure 7). Over the period 2007–2009, Member States reported as many as 4.5 precursors per one signifi cant accident. This gives an impression of the learning potential in monitoring them.
The reported number of track buckles shows substantial variations over time and it seems impossible to determine any underlying patterns for groups of countries. As a matter of fact, developments observed at country level vary greatly. Unusual weather conditions give a natural variation in the number of track buckles. The use of data quality control has, however, revealed that the observed variation in some Member States is the result of changes in reporting practice.
The number of broken rails is also sensitive to the weather conditions and may not fully refl ect the quality of work done by IMs. The incidence of broken rails decreased substantially in 2009, but this fall most likely refl ects drops in the number of broken rails registered in individual countries such as Poland (from 2 396 in 2008 to 1 506 in 2009) and Hungary (from 716 in 2008 to 10 in 2009). Since 2009, Poland has only reported broken rails causing a disruption to railway traffi c.
(5) Besides excluding some countries due to changes in defi nitions, Austria is not included in the dataset for broken rails and Greece for track buckles, as they did not report relevant data for the entire period.
Figure 7: Accident precursors in all countries and in the subsets of countries (2007–2009) (5)
6 000
5 000
4 000
3 000
2 000
1 000
0
HU, IT, LT
EE, IT, LT
LT, UK
DE, LT, PL
Broken rails Track buckles Wrong side signalling failures
Signals passed at danger
Broken wheels Broken axles
• 2007 • 2008 • 2009

22
The drop in the number of wrong-side signalling failures from 1 458 in 2008 to 514 in 2009 is driven by the data for the UK, which contained only 6 events in 2009, compared with 901 events in 2008. The UK decided to apply predefi ned thresholds for certain precursors to avoid reporting less serious incidents. For example, the UK fi gures for signals passed at danger only refer to those cases when an infrastructure fault led to a signal displaying an aspect less restrictive than it should. This excludes all cases resulting from wrong-side track circuit, point, level-crossing and other failures.
To conclude, reporting of precursors remains a diffi cult task for Member States for two major reasons: legal defi nitions in force leave a relatively large space for interpretation and NSAs have diffi culties in obtaining data from relevant stakeholders. When aggregating data only for those countries which have not changed their scope of reporting, a stable series can be seen (Figure 7). Given the learning potential of a regular analysis of precursors, the Agency will also in the future focus attention on the correct reporting of these events.
The survey on national defi nitions of broken wheels and axles, performed by the Agency in 2009, showed that most NSAs only reported cracks in wheels and axles that led to accidents. Only one country, Germany, included cracks detected during regular maintenance, which is in accordance with the guidance for the revised Annex 1 of the railway safety directive. Germany reported three cracks that led to accidents in 2008, and a total of 752 cracks detected. This means that the fi gures reported for broken wheels and axles, displayed in Figure 7, only reveal part of the situation. The survey also showed that problems with hot boxes are of more concern than cracks in wheels and axles.

23
Accident costs and other CSIs
The data on the cost of accidents show wide variation and it is evident to the Agency that the Member States have problems in establishing reporting regimes for accident cost data. The revised Annex 1 of the railway safety directive will require the NSAs to use the willingness-to-pay approach based on estimates of the ‘value of preventing a casualty’ (VPC). They can either estimate a national value or use the reference values given in the Agency’s guidance. It is believed that this will simplify the work for the Member States and will lead to a consistent and harmonised approach. Using the CSI data for 2007–2009 and fall-back values of costs for fatality and serious injury updated with GDP data, the Agency has made a calculation of accident costs.
Costs for preventing casualties (fatalities and serious injuries) were calculated for the past years as shown in Figure 8. By adding the national values together, we obtain a value of EUR 2 billion representing the economic burden of rail casualties in 2009 for all Member States.
Figure 8: Values of preventing casualties in euros (2007–2009)
2 000 000 000
1 800 000 000
1 600 000 000
1 400 000 000
1 200 000 000
1 000 000 000
800 000 000
600 000 000
400 000 000
200 000 000
02007 2008 2009
The value of preventing a casualty (VPC) is composed of:
(1) value of safety per se: willingness-to-pay (WTP) values based on stated preference studies carried out in the Member State for which they are applied;
(2) direct and indirect economic costs: cost values appraised in the Member State, composed of medical and rehabilitation cost; legal court cost, cost for police, private crash investigations, the emergency service and administrative costs of insurance; production losses: value to society of goods and services that could have been produced by the person if the accident had not occurred.
• Killed • Seriously injured

24
Infrastructure
Three CSIs concern railway infrastructure: one is a measure of the coverage of automatic train protection (ATP) systems on the lines; the second is the number of level crossings, normalised by the length of the network expressed in track-km; and the third gives information on the level of protection at level crossings.
Automatic train protection
Defi nitionAutomatic train protection (ATP) means a system that enforces obedience to signals and speed restrictions by speed supervision, including automatic stop at signals.
GuidanceSystems where track signalling information is substituted and/or supplemented by cab signalling are included. The part of the defi nition relating to ‘automatic stop at signals’ is intended to include also automatic stops at confl ict points between clearance gauges.
In 2008 (the data are more complete for this year), 58 % of tracks were fi tted with ATP in the EU (7). A relatively high density of protection is typical in countries with extensive track usage such as the Netherlands, Italy and Germany. This can be seen in Figure 9.
In order to overcome the slow process towards interoperability, a new ATP system has been promoted by the European Commission. The European Train Control System (ETCS) is based on cab signalling together with spot and/or continuous track to train data transmission. It ensures trains operate safely at all times by providing a safe movement authority directly to the driver through the on-board driver’s display and by continuously monitoring train speed.
(6) CT is the abbreviation for Channel Tunnel(7) Exact value 57.7 % for EU-27 excluding Greece, Hungary, Luxembourg, Poland.
Figure 9: Percentage of tracks equipped with automatic train protection (2007–2009) (6)
100 %
90 %
80 %
70 %
60 %
50 %
40 %
30 %
20 %
10 %
0 %
0.0
8
0.2
4
0.0
7
0.6
6
0.2
3
0.1
1
0.6
8
0.2
3
0.1
4 0.1
7
0.8
8
0.1
1
0.1
7
0.9
0.1
1
0.1
7
0.9
0.5
30.5
3
0.8
7
0.5
9
0.8
7
0.4
6
0.8
7
0.4
7
0.7
5 0.7
70.8
3
0.0
50.0
50.0
5
0.9 0.9
10.9
2
0.2
50.2
50.3
5
0.4
40.3
90.4
6
0.9
90.9
90.9
9
0.7
0.7
40.7
4
0.5
10.5
10.5
1
0.5 0
.52
0.4
8
0.6
60.7
20.6
4
0.5
40.6
70.6
7
0.1
50.1
90.1
9
0.0
40.0
40.0
4
0.4
400000
39
039
0.3
90.4
66
07777777
0.77
07777
0.7
40.7
4
0.5
10.5
10.5
1
0.5.5.5
0.
0.
0.
0.
0.
0.
0..
0. 0
.52
0.4
8848
066
066
0.6
60.6
666660.7
20.6
4
054
0.5
40.5
40.6
70.6
7
01555
0.1
50.1
555555550.1
90.1
9
0.0
40.0
40.0
4
0039
0.2
40.2
30.2
3
0.1
7
00..
0..8
8888.8.8.888888
0.1
7
0.9
0.1
7
0.9
0.5
30.5
3
0..8
7
0.5
9
0..8
70..8
7
0.7
5.
0.
0.
0.
0.
0.
0.
0.
0077
77
77
07
07
0.7
0.8
3
0.0
50.0
50.0
5
0.9
00000 0.9
10000000000 0
.92
0.2
50
25
025
025
0.2
50.3
5
0.0
80
00
00.0
0.0
000000777070707777777
0.6
6.6.6
0.6
0.6
0.6
0.6
0.6.
0.
0.
6
0.1
1
00.6
8
0.1
40.1
1111111110
00
0.1
10
0.2
5
000 0
AT BE BG CT CZ DE DK EE EL ES FI FR HU IE IT LT LU LV NL NO PL PT RO SE SI SK UK
• 2007 • 2008 • 2009
0.4
60.
0.
00.
0.
0.
0.
0.
0066
0.44
700000000

25
The ETCS together with GSM-R, a GSM mobile communications standard for railway operations, are the two main components of the European Rail Traffi c Management System (ERTMS). The ERTMS has been a success worldwide, but its implementation on EU railways is a lengthy process because of the high cost.
On average, there are 4 level crossings per 10 track-km in the EU (8); only 31 % are equipped with some form of manual or automatic protection (9). The highest density of level crossings can be found in Scandinavian countries and in some central European countries (Figure 10). The lowest density is seen in east European countries and Spain. The proportion of level crossings equipped with automatic or manual protection varies greatly between countries (Figure 11). Only in four countries (Belgium, Luxembourg, Norway and the Netherlands) are more than three quarters of all level crossings equipped with manual or automatic protection. In six countries (Bulgaria, Estonia, Spain, Lithuania, Latvia and the United Kingdom) less than 25 % of level crossings are protected.
(8) Exact fi gure for 2009 is 0.392 level crossings per track-km in EU countries excluding Romania and Luxembourg.(9) Exact fi gure for 2009 is 0.413 (41.3 %) for EU countries excluding France, Italy and Portugal.
Figure 10: Number of level crossings per track-km (2007–2009)
1.000
0.900
0.800
0.700
0.600
0.500
0.400
0.300
0.200
0.100
0.000
0.3
5
0.8
3
0.1
5
0.3
4
0.8
2
0.1
5
0.3
0.8
0.1
5
0.1
6
0.7
5
0.3
9
0.3
7
0.4
1
0.5
6
0.1
6
0.7
4
0.4
1
0.3
5
0.4
1
0.5
6
0.1
6
0.7
4
0.3
7
0.3
4
0.4
3
0.5
6
0.1
6
0.4
9
0.5
0.1
5
0.4
0.5
0.1
5
0.4
0.4
9
0.4
10.4
0.4
6
0.5
30.5
20.5
0.4
0.3
0.2
9
0.2
40.2
40.2
4
0.3
4
0.1
50.1
40.1
9
0.4
10.4
0.3
9
0.9
20.9
8
0.3
60.3
50.3
4
0.2
80.2
8
0.7 0.7
1 0.7
4
0.4
30.4
40.4
3
0.5
0.4
90.4
8
0.2
40.2
10.2
2
0.3
5
0.8
3
0.1
5
0.3
400000000000
0.8
200000000
0.1
5
0.333333333
03
0.8
00000000
0.1
5
0.1
66
50.7
5
0.3
9
0.3
7
0.4
1
0.5
66
0.1
66
0.7
40000000000
0.4
1
0.3
53333333
0
0.4
1.4
0.4
04
0.4
0.4
0.4
00.
0.
0.
0.5
66
0.1
66
0.7
4
0.33
7
0.3
400000
0.4
3
0.5
66
0.1
6
0.4
9
0.5
0.1
50000000000
0.4
0.5
0.1
5
0.4
00.4
900000000
0.4
10
40
40.4
0.4
0.4
66
0.5
30.5
2000000000 0.5
000000
0.4
03
0.3
000.2
900000000
0.2
40.2
40.2
4
0.3
4
0.1
50
14
014
0.1
40.1
4000000000
0.1
9
0.4
10.4
000000.3
90000000
092
092
0.9
20.9
2
0.3
660.3
500000000
0.3
40000000
00.2
800.2
8
0.7
000000 0.7
1710.7
10.7
10.7
171711777770.7
4
0.4
3000000000
0.4
40.4
30000000
0.5
0.4
9000000000 000000000.4
8
0.2
40.2
10.2
0.2
0.2
0.2
0.2
0.2
0.2
0.2
000 0.2
2
000000
00000
0
0000
03
0000
220
000000
7770.77
04
.0... 777000000000
03
037
370000000
AT BE BG CT CZ DE DK EE EL ES FI FR HU IE IT LT LU LV NL NO PL PT RO SE SI SK UK
• 2007 • 2008 • 2009

26
Traffi c volumes
There are two measures of rail traffi c performance that are available for statistical purposes. The number of passenger-kilometres and the number of train-kilometres. While the number of passenger-km at the EU level has remained constant over the past three years, the number of train-km dropped by 3 % in 2009 in comparison with 2008, most likely as a result of the economic crisis.
Four countries with the highest passenger volumes (Germany, France, Italy and the UK) alone account for two thirds of all passenger-km (10). Only Belgium, France, the Netherlands and Portugal managed to sustain growth in rail passenger volume over the past three years. In Figure 13, the total number of train-km — both freight and passenger train-km combined — is shown. This should be kept in mind when comparing values shown in Figures 12 and 13.
(10) Exact value for 2009 is 67 % (excluding Channel Tunnel).
Figure 11: Percentage of level crossings with automatic or manual protection (2007–2009)
100 %
90 %
80 %
70 %
60 %
50 %
40 %
30 %
20 %
10 %
0 %
0.8
1
0.2
8
0.4
7
0.8
1
0.2
9
0.4
9
0.3
0.5
0.4
2
0.2
5
0.5
7
0.5
7
0.6
6
0.5
9
0.5
7
0.2
5
0.5
5
0.5
9
0.7
2
0.5
9
0.5
8
0.2
5
0.5
6
0.5
8
0.5
6
0.5
9
0.3
5
0.3
4
0.3
5
0.7
3
0.3
4
0.3
9
0.3
9
0.1
90.2 0.2
1
0.1
90.2 0.2
1
0.8
20.8
3
0.7
40.7
50.7
3 0.7
5
0.6
40.6
0.6
0.6
80.7
60.7
7
0.3
80.3
7 0.4
0.3
10.2
9
0.3
30.3
10.2
2
0.3
50.3
30.3
8
0.4
70.4
90.4
8
0.2
40.2
50.2
4
0.8
1
000000000000.2
8
0..4
7
081
081
0.8
10.8
1
0.2
900000000000
0.4
9
0.3
0.5
042
042
0.4
2
0.2
5
0.55
7
0.55.5
0.5
0.5.5.5.
0....5
7
066
066
0.6
60.6
66666
0.5
9
0.5
00000000057
0.2
5
0.5
5
00.5
9
0.7
2
0.5
9
0.5
8
0.2
5
0.5
66
0.
000000058
056
0.5
66
0.5
9
0.3
5
0.3
4
0.3
5550
35
0.3
5555550.3
55
0.7
3
034
034
0.3
4
00.3
9
0.3
9
0.1
90000000000.2
00000000 0.2
1
0.1
9000000000
0.2
0000000 0.2
1
0.8
200000000000.8
3
0.7
400000000000
50.7
50.7
3000000
50.7
5
0.6
4666
0.66
0.6
000068
068
0.6
86
0.7
600000000000
77
0.7
00.3
8000.
0.
0..
0.
000.3
73.33.3.3.33.3.3
0.4
0.3
10.2
922222222
0
0.3
30.3
13333333330
30.2
2
0.3
50
33
033
0.3
30.3
30.3
300000
00.3
8
000000000000.4
70.4
9000000000.4
8
0.2
40000000000.2
550.2
40000000
660
6
000
3330
3
000000.3
4
0.3
33
000000000000000000000000000000000000000000000000
00000000000000000000000000000000000000000000
AT BE BG CT CZ DE DK EE EL ES FI FR HU IE IT LT LU LV NL NO PL PT RO SE SI SK UK
• 2007 • 2008 • 2009

27
Figure 13: Number of million train-km (2007–2009)
1 200
1 000
800
600
400
200
0
AT BE BG CT CZ DE DK EE EL ES FI FR HU IE IT LT LU LV NL NO PL PT RO SE SI SK UK
• 2007 • 2008 • 2009
152
158
155
104
92.9
91.9
36
35.1
5.5
46.5
3
31.5
5.6
5
153
163
175
1 0
44
1 0
49
1 0
03
78.7
19.9
82
21.2
82.2
19.6
7.1
37.5
5
6.8
2
186
193
188
52.6
53.3
50
530
114
541
109
504
106
16.8
370
367
351
15
15.8
14.1
8.0
6
18.6
19.5
18.7
140
223
139
224
132
209
47.4
46.8
43.3
41 41.8
40.6
96.3
96.1
88.5 1
34
138
132
19.2
20.1
18.2
51 49.3
45
521 5
49 569
DD FF UUDEDE FRFRFFF UKUKUUUEEEEEE RRRRRR KKKKKK
111 0
1522
1588
1555
104
92.9
91.9
36
35.1
5.5
46.5
3
31.5
5.6
5
153
1111111113
1663
1175
1 0
000
00
00000001
0
78.7
19.9
82
21.2
82.2
19.6
7.1
37.5
5
6.8
2
186
193
188
52.6
53.3
50
530
114
541
109
504
04
04
04
04
04
04
04
106
16.8
370
3 67
36 1
35
15
15.8
14.1
8.0
6
18.6
19.5
18.7
140
223
139
224
132
209
47.4
46.8
43.3
41 41.8
40.6
96.3
96.1
88.5 1
34
138
132
19.2
20.1
18.2
51 49.3
45
521
555549
555555559 5669
Figure 12: Number of million passenger-km (2007–2009)
100 000
90 000
80 000
70 000
60 000
50 000
40 000
30 000
20 000
10 000
0
9 9
32
9 1
49
274
10 4
03
10 6
00
10 4
93
10 5
00
232
2 4
23 6 9
07
6 3
53
79 1
00
1 9
30
10 0
80
2 3
34 6 6
59
6 4
74
82 5
00
1 6
57
8 2
88
2 1
44
1
1 4
146
472
6 3
89
81 6
12
7 9
45
20 5
84
78 7
40
19 3
74
22 0
74
87 0
00
20 1
44
21 7
29
95 0
00
18 5
77
3 7
78
4 0
52
3 8
76
2 0
071 9
76
1 6
81
49 0
90
49 4
08
46 4
26
409
397
357
333
6 1
77
2 9
96
983
951
747
16 4
00
16 5
00
16 8
00
2 8
60
2 8
60
3 9
90
4 1
54
4 1
52
6 7
24
6 9
56 10
296
10 8
38
11 2
16
812
834
840
2 1
48
2 2
79
2 2
47
50 4
74
53 0
02
52 7
65
111111 888 8888 7
10 0
80
8 2
8888888
87 9
45
19 3
111111111174
20 1
222244
1118 5
888888877
2 0
022
71 9
711111111
61 6
8111111
1
444444444449 0
44444490
49 4
408
46 4
466
46
44444422222222226
2222222
409
397
357
333
6 1
766666
77
2 9
96
983
951
747
16 4
000
16 5
1111000
16 88
00
2 8
60
2 8
60
3 9
9333333333
04 1
54
4 1
52
6 7
26666666666
24
6 9
56
56 10
211111111
96
10 8
1111111111138
11 2
16
812
834
840
2 1
48
2 2
79
2 2
47
50 44
50 4
50
450
40 4
0
50
74
53 0
02
52 7
65
44444444
9 9
3999
2
99999 1
411
91
9 1
9 1111
9
274
10 4
03
10 6
00
10 4
93
10 5
00
232
2 4
222222
3 6 9
007
6 3
553
79
79
79
79
79
79
79
79
777777
1 9
30
2 3
3222
4 6 6
559
6 4
74
8
1 6
57
2 1
42222
4
1
1 4
146
4772
6 3
889
888888888
20 5
00200
20
200
20
20
84
78
22 0
2274
21 7
222222229
3 7
78
4 0
52
3 8
76
8877740
40
40
77778
78
78
08
87
87
87
00000
00
00
8888887
87 00
00
00
88
666666666666666 66
AT BE BG CT CZ DE DK EE EL ES FI FR HU IE IT LT LU LV NL NO PL PT RO SE SI SK UK
• 2007 • 2008 • 2009
Reporting accidents by the investigation bodies
28

29
National investigation bodies have a legal obligation to report the investigation of serious railway accidents to the Agency. Each accident is reported twice: as a notifi cation of the opening of an investigation and when the fi nal report is sent to the Agency. Both records are available to the public in the Agency’s public database of safety documents, ERADIS.
The Agency receives notifi cations for a majority of the serious accidents, although the notifi cation of their occurrence is not always sent within one week after the decision to investigate. The compliance of Member States with the requirements for the notifi cation and submission of fi nal reports has been improving over time. In 2010, just over one third of notifi cations to investigate were in fact submitted within one week after the occurrence of the accident; an improvement compared with 18 % in 2008. As the Agency does not yet systematically receive information on the starting date of the investigations, the date of the accident occurrence is used as a reference. It should be noted that the time between the occurrence and the decision to investigate can, in certain cases, be longer than a week.
The average number of days between the accident occurrence and the notifi cation to investigate to the Agency has been decreasing over time: in 2008, it was 82 days, in 2009, 51 days, and in 2010, 37 days. This is a promising trend that will hopefully be sustained.
The fi nal investigation reports should be made public as soon as possible, and normally not later than one year after the date of the occurrence. The average number of months before the fi nal report is submitted to the Agency has also been decreasing over time, from more than 17 months for accidents occurring in 2007, to less than 10 months for accidents occurring in 2009. This signifi cant progress made by NIBs is illustrated in Figure 14.
For some 5 % of notifi ed accidents, the Agency did not receive the fi nal investigation report by the end of 2010. Some Member States report that this is due to a lack of resources. The average number of days between the accident occurrence and the submission of the fi nal report was 325 days for accidents that occurred in 2009. Figure 15 summarises the progress in timely reporting that has been achieved by NIBs.
Legal obligation to report serious accidents to ERA
The railway safety directive contains the requirement on Member States to report on accident investigations to the European Railway Agency.
Within one week after the decision to open an investigation the investigation body shall inform the Agency thereof.
The investigation body shall send the Agency a copy of the fi nal investigation report.
Article 24(1)(2) of Directive 2004/49/EC
Figure 14: Average number of months for submission of fi nal report (2007–2009)
18
12
6
02007 2008 2009

30
Table 3: Average time span between accident notifi cation and the submission of the fi nal investigation report to the Agency (in days) (2008–2010)
Average number of days between occurrence and … 2008 2009 2010
… notifi cation 82 51 37
… fi nal investigation report 571 428 325
Accidents and incidents have been reported to the Agency since 2006. Each year the Agency has received notifi cations of at least 150 occurrences investigated by NIBs. Around 15 % of the fi nal investigation reports reached the Agency by the end of the year in which the accident occurred. An overwhelming majority of fi nal reports are submitted to the Agency in the year following the occurrence of the accident. For example, for occurrences in 2009, 24 were closed and the report submitted to the Agency by the end of 2009. During 2010, the fi nal investigation report was received for 117 out of the 170 occurrences in 2009 (red bars in Figure 15). By the end of 2010, 28 out of 197 investigations opened during the year were closed, i.e. 14 % of investigations; this is similar to previous years.
Figure 15: Overview of reporting of accidents and incidents by NIBs to the Agency
200
180
160
140
120
100
80
60
40
20
0
2006 2007 2008 2009 2010Occurrences during
Status of investigation by year of occurrence:
Status end of
•• 2006 Open •• 2007 Open •• 2008 Open •• 2009 Open •• 2010 Open
•• 2006 Completed •• 2007 Completed •• 2008 Completed •• 2009 Completed •• 2010 Completed
2007 2008 2009 2010
106
4228
23
56
128
143148
2007 2008 2009 2010
137
78
5349
22
103
136140
2008 2009 2010
146
4431
15
153168
2009 2010 2010
122
53
169
24
117
28

31
NIB annual reports
The NIBs are required to send an annual report to the Agency. In the course of 2010, the Agency received 23 annual reports for the year 2009. The reports show large variation in the number of investigations opened by NIBs; during 2009, the numbers ranged from 0 to more than 15, and the number of recommendations issued following the investigation ranged from 0 to over 20.

32
Major EU rail accidentsin 2010

33
There have been more than 100 serious rail accidents on European railways over the past three years. Accidents in which people die do not usually escape the attention of the national media; this acts as a warning to both the authorities and the public about the potential vulnerability of the railway transport system. In the following section we summarise some of the serious rail accidents reported to the Agency by the NIBs that occurred in the EU Member States during 2010. The criteria for inclusion in this section are: seriousness of outcomes, date of occurrence (between 1 January 2010 and 31 December 2010) and relevance to EU regulations. Single accidents are ordered according to the number of casualties.
Only a short summary of the information available is presented. More information about the accidents can be found in the Agency’s database of rail accidents, ERADIS (http://pdb.era.europa.eu).
Event:Date, time and location:
Head-on collision between trains15 February 2010, 08:28, Buizingen (Belgium)
Outcome: 18 fatalities, 83 serious injuries
In the morning rush hour of 15 February 2010, two passenger trains collided at Buizingen station, 2 km north of Halle in Belgium. The accident forced one train to plough deep into the front carriage of the other, ripping open and totally destroying another carriage. There were some 300 passengers on the two trains and the accident caused the death of 18 people and a total of 171 injured (11).
The devastation at the accident scene was enormous and there was also substantial damage to the overhead power lines, as two of the carriages were forced up into the air by the collision.
(11) These fi gures differ slightly from the initial values, which were also given in the Agency’s 2010 Safety Performance Report. The fi nal fi gures were communicated to the Agency in late 2010.
Image 1. Train collision at Buizingen station, Belgium
Source : Belgian NIB.

Event:Date, time and location:
Accident to unauthorised persons23 June 2010, 23:23, Platja de Castelldefels (Spain)
Outcome: 12 fatalities, 10 serious injuries
A long-distance passenger train travelling at a speed of 140 km/h hit people crossing the tracks at the Platja de Castelldefels station on the outskirts of Barcelona, causing 12 fatalities, 10 serious injuries and 7 slight injuries. The people hit were passengers who had got off the commuter train and were heading for the beach. The commuter train had been delayed by 10 minutes — had it been running on schedule, the accident would most likely not have happened. Many people had been expected to gather on the beach nearby to celebrate St John’s Eve (mid-summer), particularly as there was a public holiday the following day.
Police offi cers were present at the station as a planned measure. The disembarking passengers started to cross the double tracks from behind the end of the train. The investigation has not found any failure relating to the infrastructure, the rolling stock or the train driver’s behaviour. The layout of the station had been redesigned in November 2009; two weeks earlier the existing footbridge over the tracks was closed and replaced with an underpass. Presumably, some people had not known that the footbridge had been replaced by the underpass, or had not noticed the exit signs, so they crossed the tracks.
Event:Date, time and location:
Train collision13 July 2010, 09:12, Kępice–Korzybie (Poland)
Outcome: 13 serious injuries, considerable material damage
A head-on collision between a passenger train and a freight train occurred on a single-track non-electrifi ed line between Kępice and Korzybie. According to the initial results of the investigation, the passenger train left Korzybie station without permission, which led to a head-on collision with the freight train approaching the station. As a consequence of the accident, 13 persons were seriously injured, and 2 locomotives and 4 wagons were damaged. The collision took place about 500 m from Korzybie station, so fortunately the speed of both trains was below the speed permitted at the section. After the accident, railway traffi c was stopped for 16 hours.
Taking into account the seriousness of the accident and the fact that the safety systems were not working correctly on the line, the head of NIB Poland decided to investigate this serious accident using a team of independent investigators. Shortly after the accident, some provisional safety recommendations were issued by NIB Poland concerning the organisation of railway traffi c on the line in order to improve safety.
34
Image 2. Accident to unauthorised persons at Castelldefels station
Source: Spanish NIB.
Image 3. Collision of trains close to Kępice
Source: Polish NIB.

Event:Date, time and location:
Train derailment with consequent collision with obstacle28 June 2010, 16:43, Ustí nad Labem (Czech Republic)
Outcome: 1 fatality, 7 serious injuries
Three carriages of passenger train No 2316 derailed on the switch at the approach to Ustí nad Labem station and hit a concrete wall. The accident occurred on the main transit line between the Prague and Decín stations.
The train driver did not reduce speed according to the entry signal and passed over the switch at a speed of 117 km/h instead of 50 km/h.
The whole electric unit derailed and crashed into a concrete wall. The train driver died in the crash and seven passengers were seriously injured.
The total material damage was CZK 70 914 339 (over EUR 2.8 million).
Event:Date, time and location:
Train collision1 April 2010, 11:34, Spišská Nová Ves (Slovakia)
Outcome: 3 fatalities, 1 serious injury
A shunting locomotive hit the last, empty wagon of a passenger train ready for departure at Spišská Nová Ves station. Preliminary investigation fi ndings indicate that the shunting locomotive was at this time performing a dynamic braking test and should have been running at a maximum speed of 40 km/h. At a switch, it unexpectedly changed direction, but surprisingly did not derail, despite running at a much higher speed than permitted.
There were six persons in the cab, possibly obstructing the view of the driver and reducing his ability to react. The cab occupants may also have fallen to the fl oor as the train passed over the switch, further adding to the reaction time of the driver.
Image 5. Train collision in Spišská Nová Ves station
Source: Slovakian NIB.
35
Image 4. Train collision at Ustí nad Labem station, Czech Republic
Source: Czech NIB.

Event:Date, time and location:
Train collision with a mechanical digger12 September 2010, Kimstad (Sweden)
Outcome: 1 fatality, 2 serious injuries, major damage to train
A high-speed X2000 train collided with a mechanical digger which was on a track undergoing maintenance works. The collision occurred at a speed of 129 km/h.
The investigation of the accident by the NIB is still under way; the fi rst indications show that the cause of the accident was insuffi cient planning and risk analysis of the maintenance works involving the use of the digger on the track.
Event:Date, time and location:
Level-crossing accident15 April 2010, 11:32, Chintulovo (Bulgaria)
Outcome: 2 fatalities, 1 serious injury
A rather frequent type of level-crossing accident occurred involving a taxi and a passenger train travelling from Karlovo to Burgas. Despite the red-light signals, the car did not stop before the crossing and was hit by the oncoming train. All car passengers were injured, two of them fatally.
Some 400 level-crossing users are killed each year in the EU and it is quite common to register level-crossing accidents involving a large number of passengers in buses. In 2009, however, no such accident was reported.
According to the requirements of the railway safety directive, level-crossing accidents do not have to be investigated by NIBs, but a large number of them investigate and report them to the Agency, as in total they often lead to a relatively high number of casualties at national level.
36
Image 6. Train collision with a mechanical digger in Kimstad station
Source: Swedish NIB.
Image 7. Level-crossing accident by Chintulovo
Source: Bulgarian NIB.

Event:Date, time and location:
Derailment of a freight train16 June 2010, 03:07, Braz (Austria)
Outcome: 1 serious injury, damage estimated at EUR 6.5 million
On the late spring night of 16 June a runaway freight train passing through the Braz railway station derailed. The locomotive and 13 carriages crashed into the nearby gardens. The train consisted of 16 cars owned by a French operator and transported newly-assembled passenger cars from Romania to France. The cause of this accident was a failure in the braking system resulting from the loss of a rope, which ensures the safe positioning of the brake air-line. The safety rope had fallen off, because it had not been attached properly.
While this accident only resulted in a slight injury to the train driver, its toll could have been much higher under slightly different circumstances.
Event:Date, time and location:
Freight train collision and fi re8 November 2010, 05:30, Białystok (Poland)
Outcome: No personal injuries, considerable material damage
A spectacular collision of two freight trains transporting petroleum products occurred at Białystok railway station, resulting in a massive explosion. According to the initial results of the investigation, the fi rst train passed the stop signal when it entered the station, and hit the second train, which was leaving the station. The collision occurred on a switch and led to the derailment of both trains. There were no injuries, despite the fact that the fi re also engulfed one of the locomotives. The material damage was considerable and the explosion was truly spectacular and visible from afar.
This accident was a reminder of the derailment of the freight train in Viareggio in 2009 that resulted in an explosion of a liquid gas and cost the lives of 32 people living in the vicinity of the track.
37
Image 8. Derailment of a freight train in Braz station
Source: Austrian NIB.
Image 9. Collision of freight trains at Białystok station
Source: Polish NIB.

Event:Date, time and location:
Train collision25 July 2010, Stavoren (Netherlands)
Outcome: No injuries, considerable damage
An Italian grinding train ran through the buffer stop at Stavoren station and caused substantial damage to a store; however, there were no serious injuries. The train belonged to a Swiss operator; it was being driven by an Italian driver, who was piloted by a local Dutch train driver. A third person was also in the cab. The ATP system on the track did not intervene as the on-board system was not compatible with the track-side system. As the Italian driver was not familiar with the route, he was accompanied by the Dutch driver, who was distracted as he was talking with the third person and did not notice the trackside signs.
An investigation by the Dutch NIB is under way and involves fi ve parties. It is looking into both organisational aspects and human factors.
Image 10. Train collision in Stavoren
Source: Dutch NIB.
38

39
Managing safety
40

Safety management system
A safety management system (SMS) is a documented process for managing risks, integrating the operation of the railway, the vehicles and the infrastructure. It helps to ensure that railway undertakings and infrastructure managers are operating safely and maintaining their part of the railway systems.
Harmonisation of the assessment of the SMS ensures that the market is open and competitive because each Member State will be adopting a consistent and transparent process for managing safety. The Agency has recently developed, together with the NSAs, guidance for SMSs. It is available on the Agency’s website.
41
Assessing safety management systems
The railway safety directive requires national safety authorities to assess the safety management systems (SMSs) of railway undertakings (RUs) and infrastructure managers (IMs). If the SMS meets requirements set out in the railway safety directive the NSA can issue a safety certifi cate to an RU or an authorisation to an IM. This is known as Part A certifi cation. The Part B certifi cate relates to the network specifi cs for the infrastructure and/or the vehicles used and operated. Part A certifi cates for RUs are valid throughout the EU, whereas the RUs will need to obtain a Part B certifi cate for each Member State in which they operate.
The Agency issued draft assessment criteria in 2007 for NSAs to use when assessing the SMS relevant for the Part A certifi cate. The criteria, that together with a set of principles for both the assessment process and the supervision regime, form the common safety method on conformity assessment (CSM CA), became regulation in 2010.

42
Safety certifi cation
Railway safety within the EU is built on the mutual acceptance of certifi cates and authorisations for RUs/entities in charge of maintenance (ECM) and IMs issued in individual Member States. This requires a similar approach to certifi cation and regulation, an equal level of performance and a high degree of mutual trust among NSAs and between other certifi cation bodies. However, recent fi ndings show a great variety in approaches and different levels of organisational maturity of NSAs in different Member States, which is hindering further development of an open European railway market.
A prime objective for the Agency is therefore to promote and support an accelerated harmonisation of the core certifi cation and regulation processes that form part of the safety regulatory framework. There are a number of activities in the existing and future work programme of the Agency which will help to reach this objective.
In 2010, the common safety method on conformity assessment (CSM CA) was published (12), providing a clear process that NSAs can use to assess applications for certifi cates. It sets out specifi c criteria for the various components of an SMS and also establishes for the fi rst time the principles of a supervision scheme that NSAs should have in place. In addition, it strengthens the requirements for NSAs to cooperate and coordinate their activities, which is particularly crucial for RUs operating in different Member States.
As a second important building block towards safe, European-wide transport of freight, the Agency has also drafted an ECM certifi cation scheme that provides a harmonised framework for the mandatory certifi cation of ECMs. This should help ECMs, RUs, certifi cation bodies, as well as NSAs, to understand and accept their roles and responsibilities in the railway system.
The task force on freight wagon maintenance, which was a prompt response to the Viareggio accident in 2009, generated an unforeseen impetus within the railway sector. It established a platform for discussion and growing mutual understanding that all concerned parties — the railway sector, the NSAs as well as the Agency — would like to maintain and expand beyond the issue of broken axles.
(12) Commission Regulation (EU) No 1169/2010 on a common safety method for assessing conformity with the requirements for obtaining a railway safety authorisation and Commission Regulation (EU) No 1158/2010 on a common safety method for assessing conformity with the requirements for obtaining railway safety certifi cates.
Entity in charge of maintenance
The ‘entity in charge of maintenance’, or ECM, means the organisation that is responsible for ensuring that all applicable maintenance requirements are met for any freight wagon for which it is in charge.
ECM certifi cation
The certifi cation of ECM will provide evidence of responsibility and traceability of the maintenance undertaken on freight wagons. The ECM could be the railway undertaking or the keeper. If it is the railway undertaking the certifi cation process will be included in their assessment of their SMS.
The certifi cation of maintenance workshops sets out a self-certifi ed process that ensures a transparent and structured management system for all workshops and will help to reduce the burden and duplication of controls and/or audits across the rail sector.

43
Safety certifi cates issued
In 2009, 20 NSAs awarded certifi cates based on the requirements set out in the railway safety directive. The remaining NSAs either continued to issue certifi cates using the provisions of previous legislation (Directive 2001/14/EC) or a combination of both. Three NSAs have not yet issued any Part A/B certifi cates under the railway safety directive and have no applications pending.
Table 4: Safety certifi cates issued and pending by 18 February 2011
NoPart A certifi cates Part B (*) certifi cates
Issued Pending Issued Pending
20 NSAs have used Directive 2004/49/EC to issue certifi cates 252 26 486 (**) 497
1 NSAs have applications for Part A certifi cates but not issued any 0 6 1
Total 252 32 487 (*) 497
Source: ERA ERADIS database and NSA annual reports.
(*) The Agency has no reliable information in its database on the number of Part B certifi cates issued. There is no requirement to notify the Agency when a Part B certifi cate is issued. The data here are taken from the NSA annual reports.
(**) One Member State issued 215 Part B certifi cates during 2009. This may include a number of certifi cates for shunting only.
Safety regulation
In several Member States, the safety regulatory framework is still undergoing signifi cant development. During 2010, the Agency continued the evaluation of the national measures implementing the railway safety directive in the Member States that it started in 2009 at the request of the Commission. The evaluation is expected to fi nish at the beginning of 2012, when the Agency will deliver a report to the Commission on its fi ndings.
The Agency also evaluates the notifi cations of the national safety rules notifi ed by the Member States in the Commission’s public database NOTIF-IT (13). This database includes rules previously registered in the Agency’s ERADIS database and new national safety rules for most Member States.
The transparency and availability of the national safety rules that should be used by the RUs operating on the railway network and by the IMs is a necessary step towards the opening up of the market without creating safety barriers. The railway safety directive requires Member States to notify the Commission of new and amended rules (14). The Commission monitors the introduction of new national rules in order to prevent new barriers. The long-term objective of the railway safety directive is the gradual reduction of national rules in order to move to a more harmonised European approach to safety.
(13) https://webgate.ec.europa.eu/risdb(14) Article 8(2) and (4) of Directive 2004/49/EC.

44
In 2009, the Agency published a report on the evaluation of the way in which national safety rules are published and made available in the Member States (15), as well as recommendations (16) to make these rules more easily accessible for all stakeholders, particularly applicants for safety certifi cation. Improvements in this respect are expected from all Member States. In 2010 the Agency issued detailed advice for individual Member States (17). In December 2010, the Railway Interoperability and Safety Committee (RISC) agreed to set up a dedicated task force to facilitate a common approach and clarify systems of national safety rules and better practice of their management.
In 2010, the Agency delivered several technical opinions to the Commission in relation to some national rules adopted in consequence of an incorrect interpretation of the roles of different parties and of the tasks of the NSAs, as set by the railway safety directive. Moreover, transparency was missing when introducing these national rules. The Agency provided comments on the relevant fi ndings to the NSAs.
Common safety targets
CSTs are quantitative tools intended to monitor that current safety levels of the railways in the Member States are at least maintained. In the long term, they are also intended to help reduce the current differences in safety performance. Railway transport is the only mode of transport for which the framework of targets has been prescribed by European legislation.
In 2010, the Agency carried out the fi rst assessment of the achievement of the fi rst set of CSTs, based on a four-year time series of Eurostat data on railway accidents, covering the period from 2005 to 2008.
In 2011, the second set of CSTs and national reference values (NRVs) will be prepared by the Agency. They will be based on the six years of data, from 2004 to 2009, that were delivered to Eurostat by Member States according to Annex H of Regulation (EC) No 91/2003 on rail transport statistics. The second set of CSTs will be calculated using the method defi ned in the CSM on the assessment of the achievement of CSTs (18). The revisions the Member States have made to Eurostat data will be taken into account. The next Safety Performance Report will contain a more detailed analysis of the results of these assessments.
(15) ‘Evaluation of the way in which national safety rules are published and made available’, supporting paper to fi nal report (ERA/INF/02-2009/SAF).(16) ‘Recommendation to the Commission for the publication of national safety rules in order to make the relevant information more easily accessible’ (ERA/REC/04-2009/SAF).(17) ‘Evaluation of the way in which national safety rules are published and made available’, fi nal report (ERA/REP/04-2009/SAF).(18) Regulation (EC) No 352/2009 on a common safety method on risk evaluation and assessment.

45

Economic evaluation of safety
46

47
Framework and perspectives
When proposing new safety regulations, the Agency has to evaluate the consequences of mandating safety measures under European law. Since the Agency was established, many safety-related recommendations have been passed and a harmonised approach to safety is gradually being developed. The Economic Evaluation Unit provides the Agency with appraisals and evaluations of recommendations and the technical specifi cation for interoperability (TSI). It works closely with the Safety Unit in the development of its work and the methodologies that back up the conclusions.
Scarce resources
A critical issue that is commonly addressed within the work of the Agency is the appropriate and economic use of scarce resources. The recent history and emerging revised structure of the railway sector mean that there inevitably will be trade-offs that need to be analysed. The techniques employed in economic analysis show where trade-offs exist. Examples concerning the use of scarce resources include train protection systems and passive safety provisions (crashworthiness, safe interiors). Calculating the cost of such safety measures and balancing them against the ‘value of human life’ or variants thereof is an approach that has been used in the past. While there are methodological and moral diffi culties in determining the ‘value of human life’, it is an approach that has been used for more than 50 years in transport appraisal, and for more than 40 years in the railway sector. The Agency has found the use of variants, e.g. costs of avoiding fatalities, to be a useful indicator that can help in the justifi cation of new systems, e.g. train protection systems. Using such approaches enables the correct ‘economic signals’ to be given and ensures that the safety recommendations are grounded in sound economic thinking.
Better regulation
Systematic examination of Agency recommendations through impact assessment is in accordance with the
European Commission’s strategy on better regulation. Indeed, impact assessment should contribute towards ensuring that new legislative initiatives are evidence-based and well-understood. In particular, impact assessment performed by the Agency describes the problems at stake for a given recommendation and identifi es the aims to be achieved. It also sets out relevant options or variants that could meet those objectives. Subsequently, the impacts of the different options are analysed. The approach is consistent with the European Commission’s impact assessment guidelines.
Overview of activities
Over the past fi ve years of activities a number of impact assessments have already been completed for different recommendations submitted to the Commission. In the safety area these have included (amongst others): common safety method for risk assessment, common safety method for conformity assessment, CSTs, certifi cation for ECM and the derailment detection device. All the impact assessments performed to date are so-called ex-ante analyses that look at the possible future consequences of a given recommendation. The Agency is now starting so-called ex-post evaluation, where the focus is on examining the actual results. External consultants are currently performing such a study for the Agency on the results linked to the passengers with reduced mobility TSI.
Studies in 2010
In October 2010, a major study was started to identify and categorise the key factors that have contributed to the decrease of the railway risk level over the last 25 years. Working closely with the Agency during the next 12 months, the contractor will examine empirically all of the relevant factors that have impacted upon safety over the last 25 years, in order to understand their relative effi ciency and importance. Through better understanding and learning from the past, the Agency hopes to provide an improved basis for recommendations in the future. The fi ndings of the study will be included in the next Safety Performance Report.

48
Looking forward

49
The development of the safety performance of European railways is progressing well. The number of accidents and fatalities has continued to decrease. From 2011, the Member States are required to report safety indicator data according to common defi nitions, as laid down in the revised Annex 1 to the railway safety directive. This will give a better understanding of safety performance across the EU. The revised Annex 1 also provides a new set of indicators, with a comprehensive set of reference data that will enable more accurate analysis of safety performance in different Member States.
The use of common defi nitions will lay the foundation for the evaluation of performance against CSTs. During 2011, there will be a second assessment of the achievement of the fi rst set of CSTs. Further, a second set of safety targets will be developed, using six years of Eurostat data. This work will also improve our understanding of the development of safety on European railways.
Although the correct transposition of the railway safety directive and the interoperability directive in national legislation is a fundamental prerequisite for the safety regulatory framework to work, it is increasingly clear
that the proper application of this framework is equally important. To address this issue, a framework for the cross-audit of NSA activities has been proposed, which combines an immediate acceleration of the harmonisation of NSA decision-making, including an opportunity for sharing good practice and lessons learned, with an overview of all NSA activities in the short to mid term. During 2011, we will see the development of this framework, initial training of cross-auditors as well as the organisation of pilot cross-audits. In 2012 this will be followed by further development and evaluation of the framework and the organisation of pilot cross-audits.
The investigation of accidents and incidents in the railway system is key to understanding and learning how to maintain and improve safety performance. The NIBs have been developing since the entry into force of the railway safety directive. Today investigation bodies are well established in almost all countries. Although the quality of the investigations is improving, there is still some way to go. During 2011, the survey of the organisation of the NIBs in practice will continue. This work will bring new knowledge and contribute to improving accident investigations and the learning process.
49

50
51 Annex 1 — Common safety indicators
51 List of tables
52 CSI data tables
68 Comments on CSI data tables
70 Annex 2 — List of national safety authorities and national investigation bodies
Annexes

51
Anne
x 1
— C
omm
on s
afet
y in
dica
tors
List
of
tabl
es
Tabl
e N
oN
ame
1Fa
talit
ies
by c
ateg
ory
of p
erso
n
2Se
rious
inju
ries
by c
ateg
ory
of p
erso
n
3AFa
talit
ies
by ty
pe o
f acc
iden
t and
per
son
cate
gory
— 2
006
3BFa
talit
ies
by ty
pe o
f acc
iden
t and
per
son
cate
gory
— 2
007
3CFa
talit
ies
by ty
pe o
f acc
iden
t and
per
son
cate
gory
— 2
008
3DFa
talit
ies
by ty
pe o
f acc
iden
t and
per
son
cate
gory
— 2
009
4ASe
rious
inju
ries
by ty
pe o
f acc
iden
t and
per
son
cate
gory
— 2
006
4BSe
rious
inju
ries
by ty
pe o
f acc
iden
t and
per
son
cate
gory
— 2
007
4CSe
rious
inju
ries
by ty
pe o
f acc
iden
t and
per
son
cate
gory
— 2
008
4DSe
rious
inju
ries
by ty
pe o
f acc
iden
t and
per
son
cate
gory
— 2
009
5To
tal a
nd re
lativ
e nu
mbe
r of s
uici
des
6N
umbe
r of a
ccid
ents
by
type
of a
ccid
ent
7N
umbe
r of p
recu
rsor
s to
acc
iden
ts
8Co
sts
of a
ll ac
cide
nts
9H
ours
lost
due
to a
ccid
ents
10Te
chni
cal s
afet
y of
infr
astr
uctu
re a
nd it
s im
plem
enta
tion
11M
anag
emen
t of s
afet
y —
num
ber o
f aud
its p
lann
ed a
nd c
ondu
cted
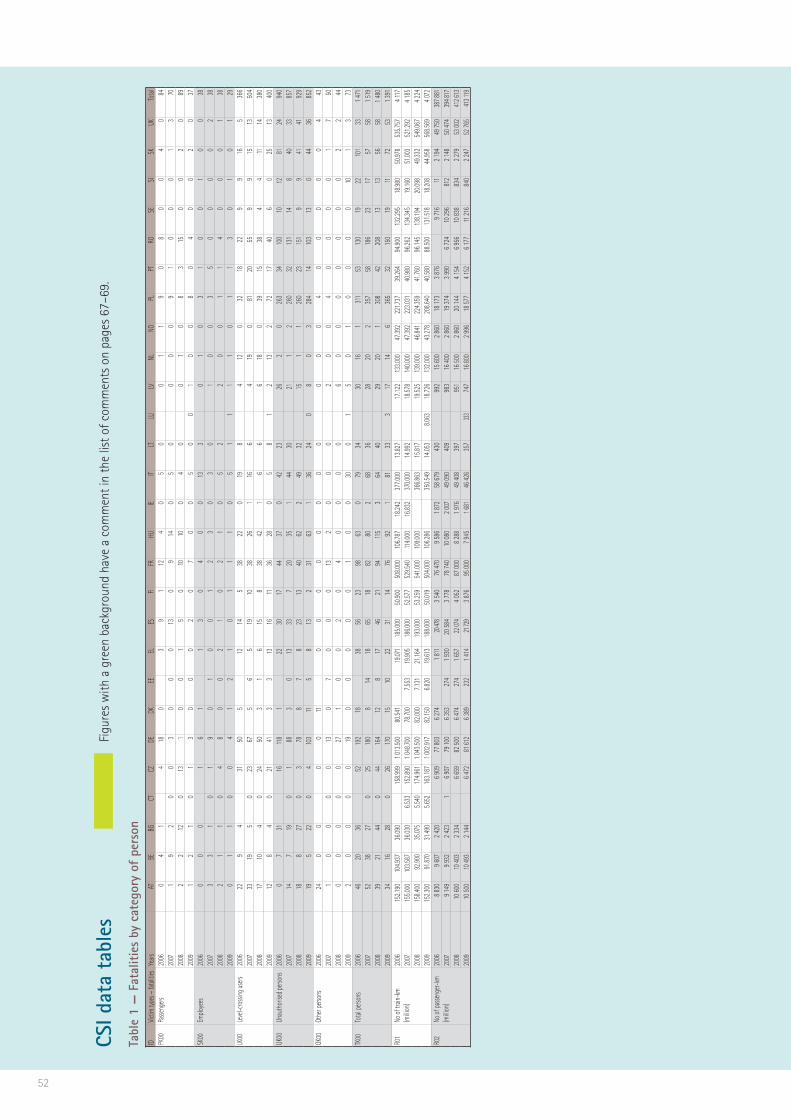
52
CSI d
ata
tabl
esTa
ble
1 —
Fat
aliti
es b
y ca
tego
ry o
f pe
rson
IDVic
tim ty
pes —
fatal
ities
Years
ATBE
BGCT
CZDE
DKEE
ELES
FIFR
HUIE
ITLT
LULV
NLNO
PLPT
ROSE
SISK
UKTo
talPK
00Pa
sseng
ers20
060
41
418
03
91
124
05
00
11
90
80
04
084
2007
19
20
03
00
013
09
140
50
00
09
10
00
13
7020
082
212
013
10
01
50
1010
04
00
10
83
150
02
089
2009
12
10
13
00
02
07
00
50
01
00
80
40
02
037
SK00
Emplo
yees
2006
00
01
61
13
04
00
133
01
03
10
01
00
3820
073
31
01
90
10
01
23
03
01
00
35
00
00
238
2008
21
10
48
00
21
02
10
52
20
01
14
00
01
3820
090
11
00
41
21
01
11
05
11
11
01
13
01
01
29LK
00Le
vel-c
rossi
ng us
ers20
0622
94
3150
512
145
3822
019
84
120
3218
229
916
536
620
0733
195
023
675
65
1910
3826
116
64
190
8120
559
915
1350
420
0817
104
024
503
16
158
3842
16
66
180
3915
384
411
1438
020
0912
84
021
413
313
1611
3628
05
81
213
272
1740
60
2513
400
UK00
Unau
thor
ised p
erson
s20
060
731
1611
81
2230
1744
370
4223
262
026
334
100
1012
8124
940
2007
147
190
188
30
1333
720
351
4430
211
226
032
131
148
4033
857
2008
188
270
378
87
823
1340
622
4932
151
126
023
151
99
4141
929
2009
195
220
410
311
58
132
3163
136
240
80
328
414
103
130
4436
852
OK00
Othe
r pers
ons
2006
240
00
011
00
00
00
00
00
04
00
00
04
4320
071
00
00
130
70
00
132
00
02
00
40
00
01
750
2008
00
00
027
10
02
04
00
00
60
00
00
00
22
4420
092
00
00
190
00
00
10
030
01
50
10
00
010
13
73TK
00To
tal pe
rsons
2006
4620
3652
192
1838
5623
9863
079
3430
161
311
5313
019
2210
133
1 471
2007
5238
270
2518
08
1418
6518
8280
268
3628
202
357
5818
623
1757
581 5
1920
0839
2144
044
164
128
1746
2194
115
364
4029
201
308
4220
813
1356
581 4
8020
0934
1628
026
170
1510
2231
1476
921
8133
317
146
365
3215
019
1172
531 3
91R0
1No
of tr
ain-k
m (m
illion
)20
0615
2.190
104.9
3736
.090
158.9
991 0
13.50
080
.541
19.07
118
5.000
50.90
050
8.000
106.7
8718
.242
377.0
0013
.827
17.12
213
3.000
47.39
222
1.737
39.26
494
.900
132.2
9518
.980
50.97
853
5.757
4 117
2007
155.0
0010
3.587
36.03
06.5
3315
2.890
1 048
.700
78.70
07.5
5319
.905
186.0
0052
.577
529.5
4011
4.000
16.83
237
0.000
14.99
218
.578
140.0
0047
.392
223.0
3140
.980
96.26
213
4.345
19.16
051
.003
521.2
924 1
8520
0815
8.400
92.90
035
.075
5.540
174.9
611 0
43.50
082
.000
7.131
21.16
419
3.000
53.25
954
1.000
109.0
0036
6.863
15.81
719
.525
139.0
0046
.841
224.3
5941
.760
96.14
513
8.194
20.09
849
.332
549.0
674 2
2420
0915
2.300
91.87
031
.490
5.652
163.1
871 0
02.91
782
.150
6.820
19.61
318
8.000
50.01
950
4.000
106.2
8635
0.549
14.05
38.0
6318
.726
132.0
0043
.278
208.6
4040
.580
88.50
013
1.518
18.20
844
.958
568.5
694 0
72R0
2No
of pa
sseng
er-km
(m
illion
)20
068 8
309 6
072 4
206 9
0977
803
6 274
1 811
20 47
83 5
4076
470
9 586
1 872
58 67
943
099
215
600
2 860
18 17
33 8
769 7
1611
2 194
49 75
038
7 881
2007
9 149
9 932
2 423
16 9
0779
100
6 353
274
1 930
20 58
43 7
7878
740
10 08
02 0
0749
090
409
983
16 40
02 8
6019
374
3 990
6 724
10 29
681
22 1
4850
474
394 8
1720
0810
600
10 40
32 3
346 6
5982
500
6 474
274
1 657
22 07
44 0
5287
000
8 288
1 976
49 40
839
795
116
500
2 860
20 14
44 1
546 9
5610
838
834
2 279
53 00
241
2 613
2009
10 50
010
493
2 144
6 472
81 61
26 3
8923
21 4
1421
729
3 876
95 00
07 9
451 6
8146
426
357
333
747
16 80
02 9
9618
577
4 152
6 177
11 21
684
02 2
4752
765
413 1
19
Figu
res
with
a g
reen
bac
kgro
und
have
a c
omm
ent i
n th
e lis
t of c
omm
ents
on
page
s 67
–69.

53
Tabl
e 2
— S
erio
us in
jurie
s by
cat
egor
y of
per
son
IDVic
tim typ
es — s
erious
injuries
Years
ATBE
BGCT
CZDE
DKEE
ELES
FIFR
HUIE
ITLT
LULV
NLNO
PLPT
ROSE
SISK
UKTo
talPS
00Pa
sseng
ers20
0612
6329
1265
414
221
1726
039
00
81
638
281
06
142
020
078
416
018
203
05
110
1037
010
01
21
675
61
14
1327
020
086
368
140
303
09
30
1428
05
02
01
446
263
115
128
220
099
1010
19
135
00
20
1443
135
00
21
149
420
22
02
235
SS00
Emplo
yees
2006
1914
22
183
71
310
31
43
11
25
28
19
34
126
2007
927
20
025
10
22
05
30
50
01
19
23
36
23
11120
0812
282
04
332
02
13
41
04
12
10
52
71
101
513
120
099
10
02
182
03
00
30
07
00
21
19
22
42
03
71LS
00Le
vel-c
rossi
ng us
ers20
0626
147
4939
320
15
1323
016
87
21
879
08
1012
336
320
0734
258
041
552
1322
42
727
04
74
72
107
869
815
131
485
2008
2316
60
4232
20
122
114
160
84
75
011
310
741
015
540
820
0927
61
033
220
116
43
2211
00
30
44
050
550
70
142
285
US00
Unau
thor
ised p
erson
s20
060
623
2527
110
114
6022
016
1425
20
7512
144
44
1314
512
2007
54
170
4234
50
79
112
251
216
100
193
1810
62
817
745
120
0812
222
052
382
56
132
615
021
815
00
11120
126
120
156
518
2009
91
110
4839
76
35
721
300
169
01
01
897
115
20
207
454
OS00
Othe
r pers
ons
2006
199
01
01
00
00
10
00
00
00
20
20
03
3820
074
10
00
230
60
00
120
10
02
00
01
10
00
758
2008
01
00
123
00
00
02
01
00
50
04
10
00
24
4420
096
00
00
261
00
10
10
013
00
33
12
00
010
11
69TS
00To
tal pe
rsons
2006
7610
661
8914
912
5135
1310
075
175
2533
134
230
3318
016
2334
251 4
5920
0760
9833
010
115
711
1936
263
4692
240
1317
105
276
3418
514
3036
311 3
7520
0853
8338
113
915
69
529
196
4060
138
1331
61
277
3923
36
4138
211 3
8320
0960
1822
192
118
157
2212
1061
841
7112
012
94
199
1818
715
1435
151 1
14R0
1No
of tr
ain-k
m (m
illion
)20
0615
2.190
104.9
3736
.090
158.9
991 0
13.50
080
.541
19.07
118
5.000
50.90
050
8.000
106.7
8718
.242
377.0
0013
.827
17.12
213
3.000
47.39
222
1.737
39.26
494
.900
132.2
9518
.980
50.97
853
5.757
4 117
2007
155.0
0010
3.587
36.03
06.5
3315
2.890
1 048
.700
78.70
07.5
5319
.905
186.0
0052
.577
529.5
4011
4.000
16.83
237
0.000
14.99
218
.578
140.0
0047
.392
223.0
3140
.980
96.26
213
4.345
19.16
051
.003
521.2
924 1
8520
0815
8.400
92.90
035
.075
5.540
174.9
611 0
43.50
082
.000
7.131
21.16
419
3.000
53.25
954
1.000
109.0
0036
6.863
15.81
719
.525
139.0
0046
.841
224.3
5941
.760
96.14
513
8.194
20.09
849
.332
549.0
674 2
2420
0915
2.300
91.87
031
.490
5.652
163.1
871 0
02.91
782
.150
6.820
19.61
318
8.000
50.01
950
4.000
106.2
8635
0.549
14.05
38.0
6318
.726
132.0
0043
.278
208.6
4040
.580
88.50
013
1.518
18.20
844
.958
568.5
694 0
72R0
2No
of pa
sseng
er-km
(m
illion
)20
068 8
309 6
072 4
206 9
0977
803
6 274
1 811
2 047
83 5
4076
470
9 586
1 872
58 67
943
099
215
600
2 860
18 17
33 8
769 7
1611
2 194
49 75
038
7 881
2007
9 149
9 932
2 423
16 9
0779
100
6 353
274
1 930
20 58
43 7
7878
740
10 08
02 0
0749
090
409
983
16 40
02 8
6019
374
3 990
6 724
10 29
681
22 1
4850
474
394 8
1720
0810
600
10 40
32 3
346 6
5982
500
6 474
274
1 657
22 07
44 0
5287
000
8 288
1 976
49 40
839
795
116
500
2 860
20 14
44 1
546 9
5610
838
834
2 279
53 00
241
2 613
2009
10 50
010
493
2 144
6 472
81 61
26 3
8923
21 4
1421
729
3 876
95 00
07 9
451 6
8146
426
357
333
747
16 80
02 9
9618
577
4 152
6 177
11 21
684
02 2
4752
765
413 1
19

54
Tabl
e 3A
— 2
006
— F
atal
ities
by
type
of
acci
dent
and
vic
tim c
ateg
ory
IDAc
ciden
t typ
esVic
tim ty
pes
ATBE
BGCT
CZDE
DKEE
ELES
FIFR
HUIE
ITLT
LULV
NLNO
PLPT
ROSE
SISK
UKTo
tal
TK01
Collis
ions o
f trai
nsTo
tal0
00
00
04
00
90
03
00
00
10
00
10
119
PK01
Passe
ngers
00
00
01
00
40
00
00
00
00
5
SK01
Emplo
yees
00
00
01
00
20
30
00
01
01
08
LK01
Leve
l-cro
ssing
users
00
00
00
00
00
00
00
00
0
UK01
Unau
thor
ised p
erson
s0
00
02
00
30
00
00
00
00
5
OK01
Othe
r pers
ons
00
00
00
00
00
00
00
00
11
TK02
Derai
lmen
ts of
train
sTo
tal0
00
00
00
70
00
00
00
00
00
00
00
07
PK02
Passe
ngers
00
00
00
70
00
00
00
00
07
SK02
Emplo
yees
00
00
00
00
00
00
00
00
00
LK02
Leve
l-cro
ssing
users
00
00
00
00
00
00
00
00
0
UK02
Unau
thor
ised p
erson
s0
00
00
00
00
00
00
00
00
OK02
Othe
r pers
ons
00
00
00
00
00
00
00
00
00
TK03
Leve
l-cro
ssing
ac
ciden
tsTo
tal22
104
3150
614
145
4022
019
84
120
3518
229
017
536
7
PK03
Passe
ngers
01
00
02
00
00
00
00
10
10
5
SK03
Emplo
yees
00
00
00
00
20
00
00
02
00
4
LK03
Leve
l-cro
ssing
users
229
431
505
1214
538
220
198
412
032
1822
916
535
7
UK03
Unau
thor
ised p
erson
s0
00
00
00
00
00
00
00
0
OK03
Othe
r pers
ons
00
00
10
00
00
00
00
00
01
TK04
Accid
ents
to pe
rsons
ca
used
by ro
lling s
tock
in
motio
n
Total
2210
3221
142
1220
3318
3741
055
2626
40
257
3510
810
2135
2799
2
PK04
Passe
ngers
03
14
180
02
18
40
50
01
00
83
058
SK04
Emplo
yees
00
16
10
10
08
30
10
01
00
22
LK04
Leve
l-cro
ssing
users
00
00
00
00
00
00
00
09
09
UK04
Unau
thor
ised p
erson
s7
3116
118
120
3017
2937
042
2326
20
253
3410
010
1232
2486
4
OK04
Othe
r pers
ons
220
00
100
00
00
00
00
40
03
39
TK05
Fires
in ro
lling s
tock
Total
00
00
00
00
00
00
00
00
00
00
00
00
0
PK05
Passe
ngers
00
00
00
00
00
00
00
00
00
SK05
Emplo
yees
00
00
00
00
00
00
00
00
00
LK05
Leve
l-cro
ssing
users
00
00
00
00
00
00
00
00
0
UK05
Unau
thor
ised p
erson
s0
00
00
00
00
00
00
00
00
OK05
Othe
r pers
ons
00
00
00
00
00
00
00
00
00
TK06
Othe
r acc
ident
sTo
tal2
00
00
00
20
120
02
00
01
180
00
049
086
PK06
Passe
ngers
00
00
00
00
00
00
01
80
09
SK06
Emplo
yees
00
00
00
20
02
00
00
00
04
LK06
Leve
l-cro
ssing
users
00
00
00
00
00
00
00
00
0
UK06
Unau
thor
ised p
erson
s0
00
00
00
120
00
00
010
049
071
OK06
Othe
r pers
ons
20
00
00
00
00
00
00
00
02

55
Tabl
e 3B
— 2
007
— F
atal
ities
by
type
of
acci
dent
and
vic
tim c
ateg
ory
IDAc
ciden
t typ
esVic
tim ty
pes
ATBE
BGCT
CZDE
DKEE
ELES
FIFR
HUIE
ITLT
LULV
NLNO
PLPT
ROSE
SISK
UKTo
tal
TK01
Collis
ions o
f trai
nsTo
tal0
00
01
10
02
00
22
01
00
00
10
00
00
010
PK01
Passe
ngers
00
00
00
00
00
00
00
00
00
00
00
00
00
0
SK01
Emplo
yees
00
00
10
00
00
00
10
00
00
01
00
00
00
3
LK01
Leve
l-cro
ssing
users
00
00
01
00
00
00
00
00
00
00
00
00
01
UK01
Unau
thor
ised p
erson
s0
00
00
00
02
00
00
01
00
00
00
00
00
03
OK01
Othe
r pers
ons
00
00
00
00
00
02
10
00
00
00
00
00
00
3
TK02
Derai
lmen
ts of
train
sTo
tal0
00
00
00
00
00
00
00
00
00
03
00
00
14
PK02
Passe
ngers
00
00
00
00
00
00
00
00
00
00
10
00
01
2
SK02
Emplo
yees
00
00
00
00
00
00
00
00
00
00
20
00
00
2
LK02
Leve
l-cro
ssing
users
00
00
00
00
00
00
00
00
00
00
00
00
00
UK02
Unau
thor
ised p
erson
s0
00
00
00
00
00
00
00
00
00
00
00
00
00
OK02
Othe
r pers
ons
00
00
00
00
00
00
00
00
00
00
00
00
00
0
TK03
Leve
l-cro
ssing
ac
ciden
tsTo
tal33
205
023
665
65
1910
3963
116
64
190
8420
559
915
1354
5
PK03
Passe
ngers
01
00
00
00
00
00
60
00
00
01
00
00
00
8
SK03
Emplo
yees
00
00
00
00
00
01
00
00
00
02
00
00
00
3
LK03
Leve
l-cro
ssing
users
3319
50
2366
56
519
1038
241
166
419
081
2055
99
1513
501
UK03
Unau
thor
ised p
erson
s0
00
00
00
00
00
320
00
00
00
00
00
00
32
OK03
Othe
r pers
ons
00
00
00
00
00
00
10
00
00
00
00
00
00
1
TK04
Accid
ents
to pe
rsons
ca
used
by ro
lling s
tock
in
motio
n
Total
1618
220
1111
28
1146
838
91
5130
241
226
435
131
148
4244
937
PK04
Passe
ngers
18
20
03
00
013
09
80
50
00
00
00
00
12
52
SK04
Emplo
yees
33
10
07
01
00
11
10
30
10
00
30
00
02
27
LK04
Leve
l-cro
ssing
users
00
00
00
00
00
00
00
00
00
00
00
00
00
UK04
Unau
thor
ised p
erson
s12
719
01
882
011
337
200
143
3021
12
260
3213
114
840
3381
6
OK04
Othe
r pers
ons
00
00
013
07
00
08
00
00
20
04
00
00
17
42
TK05
Fires
in ro
lling s
tock
Total
00
00
00
00
00
00
00
00
00
00
00
00
00
0
PK05
Passe
ngers
00
00
00
00
00
00
00
00
00
00
00
00
00
0
SK05
Emplo
yees
00
00
00
00
00
00
00
00
00
00
00
00
00
0
LK05
Leve
l-cro
ssing
users
00
00
00
00
00
00
00
00
00
00
00
00
00
UK05
Unau
thor
ised p
erson
s0
00
00
00
00
00
00
00
00
00
00
00
00
00
OK05
Othe
r pers
ons
00
00
00
00
00
00
00
00
00
00
00
00
00
0
TK06
Othe
r acc
ident
sTo
tal3
00
00
21
00
00
36
00
00
00
80
00
00
023
PK06
Passe
ngers
00
00
00
00
00
00
00
00
00
08
00
00
00
8
SK06
Emplo
yees
00
00
02
00
00
00
10
00
00
00
00
00
00
3
LK06
Leve
l-cro
ssing
users
00
00
00
00
00
02
00
00
00
00
00
00
02
UK06
Unau
thor
ised p
erson
s2
00
00
01
00
00
03
00
00
00
00
00
00
06
OK06
Othe
r pers
ons
10
00
00
00
00
03
00
00
00
00
00
00
00
4
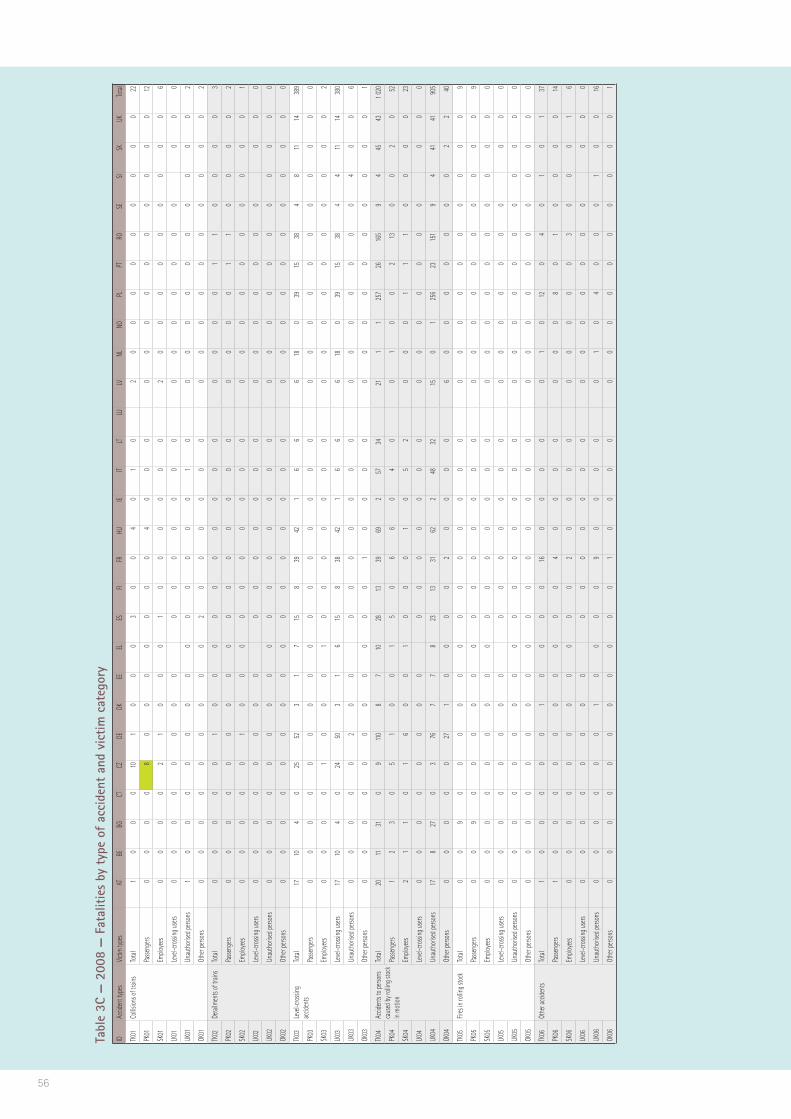
56
Tabl
e 3C
— 2
008
— F
atal
ities
by
type
of
acci
dent
and
vic
tim c
ateg
ory
IDAc
ciden
t typ
esVic
tim ty
pes
ATBE
BGCT
CZDE
DKEE
ELES
FIFR
HUIE
ITLT
LULV
NLNO
PLPT
ROSE
SISK
UKTo
tal
TK01
Collis
ions o
f trai
nsTo
tal1
00
010
10
00
30
04
01
02
00
00
00
00
022
PK01
Passe
ngers
00
00
80
00
00
00
40
00
00
00
00
00
00
12
SK01
Emplo
yees
00
00
21
00
01
00
00
00
20
00
00
00
00
6
LK01
Leve
l-cro
ssing
users
00
00
00
00
00
00
00
00
00
00
00
00
0
UK01
Unau
thor
ised p
erson
s1
00
00
00
00
00
00
01
00
00
00
00
00
02
OK01
Othe
r pers
ons
00
00
00
00
02
00
00
00
00
00
00
00
00
2
TK02
Derai
lmen
ts of
train
sTo
tal0
00
00
10
00
00
00
00
00
00
01
10
00
03
PK02
Passe
ngers
00
00
00
00
00
00
00
00
00
00
11
00
00
2
SK02
Emplo
yees
00
00
01
00
00
00
00
00
00
00
00
00
00
1
LK02
Leve
l-cro
ssing
users
00
00
00
00
00
00
00
00
00
00
00
00
0
UK02
Unau
thor
ised p
erson
s0
00
00
00
00
00
00
00
00
00
00
00
00
00
OK02
Othe
r pers
ons
00
00
00
00
00
00
00
00
00
00
00
00
00
0
TK03
Leve
l-cro
ssing
ac
ciden
tsTo
tal17
104
025
523
17
158
3942
16
66
180
3915
384
811
1438
9
PK03
Passe
ngers
00
00
00
00
00
00
00
00
00
00
00
00
00
0
SK03
Emplo
yees
00
00
10
00
10
00
00
00
00
00
00
00
00
2
LK03
Leve
l-cro
ssing
users
1710
40
2450
31
615
838
421
66
618
039
1538
44
1114
380
UK03
Unau
thor
ised p
erson
s0
00
00
20
00
00
00
00
00
00
00
04
00
6
OK03
Othe
r pers
ons
00
00
00
00
00
01
00
00
00
00
00
00
00
1
TK04
Accid
ents
to pe
rsons
ca
used
by ro
lling s
tock
in
motio
n
Total
2011
310
911
08
710
2813
3969
257
3421
11
257
2616
59
445
431 0
20
PK04
Passe
ngers
12
30
51
00
15
06
60
40
01
00
213
00
20
52
SK04
Emplo
yees
21
10
16
00
10
00
10
52
00
01
11
00
00
23
LK04
Leve
l-cro
ssing
users
00
00
00
00
00
00
00
00
00
00
00
00
0
UK04
Unau
thor
ised p
erson
s17
827
03
767
78
2313
3162
248
3215
01
256
2315
19
441
4190
5
OK04
Othe
r pers
ons
00
00
027
10
00
02
00
00
60
00
00
00
22
40
TK05
Fires
in ro
lling s
tock
Total
00
90
00
00
00
00
00
00
00
00
00
00
00
9
PK05
Passe
ngers
00
90
00
00
00
00
00
00
00
00
00
00
00
9
SK05
Emplo
yees
00
00
00
00
00
00
00
00
00
00
00
00
00
0
LK05
Leve
l-cro
ssing
users
00
00
00
00
00
00
00
00
00
00
00
00
0
UK05
Unau
thor
ised p
erson
s0
00
00
00
00
00
00
00
00
00
00
00
00
00
OK05
Othe
r pers
ons
00
00
00
00
00
00
00
00
00
00
00
00
00
0
TK06
Othe
r acc
ident
sTo
tal1
00
00
01
00
00
160
00
00
10
120
40
10
137
PK06
Passe
ngers
10
00
00
00
00
04
00
00
00
08
01
00
00
14
SK06
Emplo
yees
00
00
00
00
00
02
00
00
00
00
03
00
01
6
LK06
Leve
l-cro
ssing
users
00
00
00
00
00
00
00
00
00
00
00
00
0
UK06
Unau
thor
ised p
erson
s0
00
00
01
00
00
90
00
00
10
40
00
10
016
OK06
Othe
r pers
ons
00
00
00
00
00
01
00
00
00
00
00
00
00
1

57
Tabl
e 3D
— 2
009
— F
atal
ities
by
type
of
acci
dent
and
vic
tim c
ateg
ory
IDAc
ciden
t typ
esVic
tim ty
pes
ATBE
BGCT
CZDE
DKEE
ELES
FIFR
HUIE
ITLT
LULV
NLNO
PLPT
ROSE
SISK
UKTo
tal
TK01
Collis
ions o
f trai
nsTo
tal0
00
00
10
02
00
00
01
00
01
00
00
00
02
7
PK01
Passe
ngers
00
00
00
00
00
00
00
00
00
00
00
00
00
00
SK01
Emplo
yees
00
00
01
00
00
00
00
10
00
10
00
00
00
03
LK01
Leve
l-cro
ssing
users
00
00
00
00
00
00
00
00
00
00
00
00
00
0
UK01
Unau
thor
ised p
erson
s0
00
00
00
02
00
00
00
00
00
00
00
00
02
4
OK01
Othe
r pers
ons
00
00
00
00
00
00
00
00
00
00
00
00
00
00
TK02
Derai
lmen
ts of
train
sTo
tal0
00
00
00
00
00
00
030
00
00
00
00
00
00
30
PK02
Passe
ngers
00
00
00
00
00
00
00
00
00
00
00
00
00
00
SK02
Emplo
yees
00
00
00
00
00
00
00
00
00
00
00
00
00
00
LK02
Leve
l-cro
ssing
users
00
00
00
00
00
00
00
00
00
00
00
00
00
0
UK02
Unau
thor
ised p
erson
s0
00
00
00
00
00
00
00
00
00
00
00
00
00
0
OK02
Othe
r pers
ons
00
00
00
00
00
00
00
300
00
00
00
00
00
030
TK03
Leve
l-cro
ssing
ac
ciden
tsTo
tal12
84
021
414
313
1611
3629
05
81
413
273
1740
67
2513
412
PK03
Passe
ngers
00
00
00
00
00
00
00
00
01
00
10
00
00
02
SK03
Emplo
yees
00
00
00
10
00
00
10
00
01
00
00
00
00
03
LK03
Leve
l-cro
ssing
users
128
40
2141
33
1316
1136
280
58
12
132
7217
406
025
1340
0
UK03
Unau
thor
ised p
erson
s0
00
00
00
00
00
00
00
00
00
00
00
00
00
OK03
Othe
r pers
ons
00
00
00
00
00
00
00
00
00
00
00
00
70
07
TK04
Accid
ents
to pe
rsons
ca
used
by ro
lling s
tock
in
motio
n
Total
218
240
512
79
77
153
3863
145
252
130
429
215
107
134
4738
933
PK04
Passe
ngers
12
10
12
00
02
07
00
50
00
00
70
40
02
034
SK04
Emplo
yees
01
10
03
02
10
11
00
41
10
00
11
30
10
123
LK04
Leve
l-cro
ssing
users
00
00
00
00
00
00
00
00
00
00
00
00
00
0
UK04
Unau
thor
ised p
erson
s19
522
04
103
95
613
229
631
3624
08
03
284
1410
013
044
3484
1
OK04
Othe
r pers
ons
10
00
019
00
00
01
00
00
15
01
00
00
31
335
TK05
Fires
in ro
lling s
tock
Total
00
00
00
00
00
00
00
00
00
00
00
00
00
00
PK05
Passe
ngers
00
00
00
00
00
00
00
00
00
00
00
00
00
00
SK05
Emplo
yees
00
00
00
00
00
00
00
00
00
00
00
00
00
00
LK05
Leve
l-cro
ssing
users
00
00
00
00
00
00
00
00
00
00
00
00
00
0
UK05
Unau
thor
ised p
erson
s0
00
00
00
00
00
00
00
00
00
00
00
00
00
OK05
Othe
r pers
ons
00
00
00
00
00
00
00
00
00
00
00
00
00
00
TK06
Othe
r acc
ident
sTo
tal1
00
00
12
00
00
20
00
00
00
00
03
00
00
9
PK06
Passe
ngers
00
00
01
00
00
00
00
00
00
00
00
00
00
01
SK06
Emplo
yees
00
00
00
00
00
00
00
00
00
00
00
00
00
00
LK06
Leve
l-cro
ssing
users
00
00
00
00
00
00
00
00
00
00
00
00
00
0
UK06
Unau
thor
ised p
erson
s0
00
00
02
00
00
20
00
00
00
-0
03
00
00
7
OK06
Othe
r pers
ons
10
00
00
00
00
00
00
00
00
00
00
00
00
01

58
Tabl
e 4A
— 2
006
— S
erio
us in
jurie
s by
typ
e of
acc
iden
t an
d vi
ctim
cat
egor
yID
Accid
ent t
ypes
Victim
type
s AT
BEBG
CTCZ
DEDK
EEEL
ESFI
FRHU
IEIT
LTLU
LVNL
NOPL
PTRO
SESI
SKUK
Total
TS01
Collis
ions o
f trai
nsTo
tal5
00
410
05
00
32
015
00
40
21
00
00
152
PS01
Passe
ngers
10
-1
20
20
02
20
150
04
00
-0
--
-0
29
SS01
Emplo
yees
40
-2
80
30
0-
-0
00
00
02
10
--
-1
21
LS01
Leve
l-cro
ssing
users
00
-0
00
-0
0-
-0
00
00
00
-0
--
-0
0
US01
Unau
thor
ised p
erson
s-
0-
00
00
00
1-
00
00
00
0-
0-
--
01
OS01
Othe
r pers
ons
00
-1
00
00
0-
-0
00
00
00
-0
--
-0
1
TS02
Derai
lmen
ts of
train
sTo
tal1
00
00
00
140
00
00
00
10
01
00
00
017
PS02
Passe
ngers
00
-0
00
014
0-
-0
00
01
00
-0
--
-0
15
SS02
Emplo
yees
10
-0
00
00
0-
-0
00
00
00
10
--
-0
2
LS02
Leve
l-cro
ssing
users
00
-0
00
-0
0-
-0
00
00
00
-0
--
-0
0
US02
Unau
thor
ised p
erson
s-
0-
00
00
00
--
00
00
00
0-
0-
--
00
OS02
Othe
r pers
ons
00
-0
00
00
0-
-0
00
00
00
-0
--
-0
0
TS03
Leve
l-cro
ssing
ac
ciden
tsTo
tal26
197
4945
232
16
1325
017
87
21
979
08
1014
340
1
PS03
Passe
ngers
02
-0
10
110
0-
20
10
00
08
-0
--
-0
25
SS03
Emplo
yees
03
-0
40
10
1-
-0
00
00
02
-0
--
20
13
LS03
Leve
l-cro
ssing
users
2614
749
392
201
513
230
168
72
187
90
810
123
362
US03
Unau
thor
ised p
erson
s-
0-
01
0-
00
--
00
00
00
0-
0-
--
01
OS03
Othe
r pers
ons
00
-0
00
-0
0-
-0
00
00
00
-0
--
-0
0
TS04
Accid
ents
to pe
rsons
ca
used
by ro
lling s
tock
in
motio
n
Total
388
5236
396
1420
639
390
3817
264
175
2218
07
1320
1971
9
PS04
Passe
ngers
102
2911
144
18
112
170
200
02
10
828
1-
61
176
SS04
Emplo
yees
140
-0
51
31
15
10
23
10
00
-8
-9
11
56
LS04
Leve
l-cro
ssing
users
00
-0
00
-0
0-
-0
00
00
00
-0
--
-0
0
US04
Unau
thor
ised p
erson
s-
623
2520
010
114
2220
016
1425
20
7512
144
44
1314
464
OS04
Othe
r pers
ons
140
-0
01
00
0-
10
00
00
00
20
2-
-3
23
TS05
Fires
in ro
lling s
tock
Total
10
20
00
00
01
00
30
00
20
00
00
00
9
PS05
Passe
ngers
00
-0
00
00
0-
-0
30
00
00
-0
--
-0
3
SS05
Emplo
yees
00
20
00
00
01
-0
00
00
20
-0
--
-0
5
LS05
Leve
l-cro
ssing
users
00
-0
00
-0
0-
-0
00
00
00
-0
--
-0
0
US05
Unau
thor
ised p
erson
s-
0-
00
00
00
--
00
00
00
0-
0-
--
00
OS05
Othe
r pers
ons
10
-0
00
00
0-
-0
00
00
00
-0
--
-0
1
TS06
Othe
r acc
ident
sTo
tal5
790
055
40
01
449
12
00
20
560
01
00
226
1
PS06
Passe
ngers
159
-0
480
00
03
50
00
01
055
-0
--
-0
172
SS06
Emplo
yees
011
-0
12
00
14
21
20
01
01
-0
1-
-2
29
LS06
Leve
l-cro
ssing
users
00
-0
01
-0
0-
-0
00
00
00
-0
--
-0
1
US06
Unau
thor
ised p
erson
s-
0-
06
10
00
372
00
00
00
0-
0-
--
046
OS06
Othe
r pers
ons
49
-0
00
00
0-
-0
00
00
00
-0
--
-0
13

59
Tabl
e 4B
— 2
007
— S
erio
us in
jurie
s by
typ
e of
acc
iden
t an
d vi
ctim
cat
egor
yID
Accid
ent t
ypes
Victim
type
s AT
BEBG
CTCZ
DEDK
EEEL
ESFI
FRHU
IEIT
LTLU
LVNL
NOPL
PTRO
SESI
SKUK
Total
TS01
Collis
ions o
f trai
nsTo
tal4
34
01
80
02
00
24
01
00
10
10
00
00
031
PS01
Passe
ngers
12
00
13
00
20
00
30
00
00
00
00
00
00
12
SS01
Emplo
yees
21
20
04
00
00
00
10
10
01
01
00
00
00
13
LS01
Leve
l-cro
ssing
users
00
00
01
00
00
00
00
00
00
00
00
00
01
US01
Unau
thor
ised p
erson
s0
02
00
00
00
00
00
00
00
00
00
00
00
02
OS01
Othe
r pers
ons
10
00
00
00
00
02
00
00
00
00
00
00
00
3
TS02
Derai
lmen
ts of
train
sTo
tal0
00
00
00
01
00
00
00
00
00
12
00
00
1216
PS02
Passe
ngers
00
00
00
00
10
00
00
00
00
00
20
00
011
14
SS02
Emplo
yees
00
00
00
00
00
00
00
00
00
01
00
00
01
2
LS02
Leve
l-cro
ssing
users
00
00
00
00
00
00
00
00
00
00
00
00
00
US02
Unau
thor
ised p
erson
s0
00
00
00
00
00
00
00
00
00
00
00
00
00
OS02
Othe
r pers
ons
00
00
00
00
00
00
00
00
00
00
00
00
00
0
TS03
Leve
l-cro
ssing
ac
ciden
tsTo
tal34
538
042
632
1324
42
935
04
74
72
120
870
816
161
552
PS03
Passe
ngers
025
00
14
00
10
01
80
00
00
011
00
00
20
53
SS03
Emplo
yees
04
00
05
00
10
01
00
00
00
02
01
01
10
16
LS03
Leve
l-cro
ssing
users
3424
80
4154
213
224
27
270
47
47
210
78
698
1513
148
3
US03
Unau
thor
ised p
erson
s0
00
00
00
00
00
00
00
00
00
00
00
00
0
OS03
Othe
r pers
ons
00
00
00
00
00
00
00
00
00
00
00
00
00
TS04
Accid
ents
to pe
rsons
ca
used
by ro
lling s
tock
in
motio
n
Total
1520
210
5883
86
920
128
521
346
132
095
2311
46
920
1866
2
PS04
Passe
ngers
714
60
1613
30
110
09
260
100
12
00
26
11
22
132
SS04
Emplo
yees
21
00
014
00
11
01
10
30
00
04
22
30
12
38
LS04
Leve
l-cro
ssing
users
00
00
00
00
00
00
00
00
00
00
00
00
00
US04
Unau
thor
ised p
erson
s4
415
042
335
07
91
1025
121
610
00
9118
106
28
177
442
OS04
Othe
r pers
ons
21
00
023
06
00
08
00
00
20
00
10
00
07
50
TS05
Fires
in ro
lling s
tock
Total
00
00
00
00
00
00
00
00
00
00
00
00
00
0
PS05
Passe
ngers
00
00
00
00
00
00
00
00
00
00
00
00
00
0
SS05
Emplo
yees
00
00
00
00
00
00
00
00
00
00
00
00
00
0
LS05
Leve
l-cro
ssing
users
00
00
00
00
00
00
00
00
00
00
00
00
00
US05
Unau
thor
ised p
erson
s0
00
00
00
00
00
00
00
00
00
00
00
00
00
OS05
Othe
r pers
ons
00
00
00
00
00
00
00
00
00
00
00
00
00
0
TS06
Othe
r acc
ident
sTo
tal7
220
00
31
00
20
71
11
00
03
591
10
50
011
4
PS06
Passe
ngers
00
00
00
00
01
00
00
00
00
156
10
00
00
59
SS06
Emplo
yees
521
00
02
10
01
03
10
10
00
11
00
05
00
42
LS06
Leve
l-cro
ssing
users
01
00
00
00
00
00
00
00
00
00
00
00
01
US06
Unau
thor
ised p
erson
s1
00
00
10
00
00
20
00
00
01
20
00
00
07
OS06
Othe
r pers
ons
10
00
00
00
00
02
01
00
00
00
01
00
00
5

Tabl
e 4C
— 2
008
— S
erio
us in
jurie
s by
typ
e of
acc
iden
t an
d vi
ctim
cat
egor
yID
Accid
ent t
ypes
Victim
type
s AT
BEBG
CTCZ
DEDK
EEEL
ESFI
FRHU
IEIT
LTLU
LVNL
NOPL
PTRO
SESI
SKUK
Total
TS01
Collis
ions o
f trai
nsTo
tal0
155
030
280
00
02
23
00
00
00
60
00
71
099
PS01
Passe
ngers
010
00
2821
00
00
00
30
00
00
03
00
04
00
69
SS01
Emplo
yees
04
00
15
00
00
22
00
00
00
03
00
03
00
20
LS01
Leve
l-cro
ssing
users
00
00
00
00
00
00
00
00
00
00
00
00
0
US01
Unau
thor
ised p
erson
s0
05
00
00
00
00
00
00
00
00
00
00
01
06
OS01
Othe
r pers
ons
01
00
12
00
00
00
00
00
00
00
00
00
00
4
TS02
Derai
lmen
ts of
train
sTo
tal0
00
00
10
04
10
01
00
00
00
04
40
00
015
PS02
Passe
ngers
00
00
00
00
40
00
10
00
00
00
43
00
00
12
SS02
Emplo
yees
00
00
01
00
01
00
00
00
00
00
01
00
00
3
LS02
Leve
l-cro
ssing
users
00
00
00
00
00
00
00
00
00
00
00
00
0
US02
Unau
thor
ised p
erson
s0
00
00
00
00
00
00
00
00
00
00
00
00
00
OS02
Othe
r pers
ons
00
00
00
00
00
00
00
00
00
00
00
00
00
0
TS03
Leve
l-cro
ssing
ac
ciden
tsTo
tal23
287
043
353
016
22
1516
08
47
60
104
1074
120
175
446
PS03
Passe
ngers
014
00
00
00
20
01
00
00
00
02
00
04
00
23
SS03
Emplo
yees
00
10
13
10
20
10
00
00
01
00
00
02
10
13
LS03
Leve
l-cro
ssing
users
2314
60
4232
20
122
114
160
84
75
010
210
741
155
395
US03
Unau
thor
ised p
erson
s0
00
00
00
00
00
00
00
00
00
00
014
00
14
OS03
Othe
r pers
ons
00
00
00
00
00
00
00
00
00
00
00
01
01
TS04
Accid
ents
to pe
rsons
ca
used
by ro
lling s
tock
in
motio
n
Total
1515
211
6686
55
916
218
401
309
240
110
523
149
410
2015
690
PS04
Passe
ngers
212
31
129
30
33
013
240
50
20
10
218
31
51
123
SS04
Emplo
yees
41
10
219
00
00
00
10
41
20
00
05
03
04
47
LS04
Leve
l-cro
ssing
users
00
00
00
00
00
00
00
00
00
00
00
00
0
US04
Unau
thor
ised p
erson
s9
217
052
372
56
132
415
021
815
00
105
2012
61
614
648
6
OS04
Othe
r pers
ons
00
00
021
00
00
01
01
00
50
00
10
00
14
34
TS05
Fires
in ro
lling s
tock
Total
00
50
00
00
00
00
00
00
00
00
00
00
00
5
PS05
Passe
ngers
00
50
00
00
00
00
00
00
00
00
00
00
00
5
SS05
Emplo
yees
00
00
00
00
00
00
00
00
00
00
00
00
00
0
LS05
Leve
l-cro
ssing
users
00
00
00
00
00
00
00
00
00
00
00
00
0
US05
Unau
thor
ised p
erson
s0
00
00
00
00
00
00
00
00
00
00
00
00
00
OS05
Othe
r pers
ons
00
00
00
00
00
00
00
00
00
00
00
00
00
0
TS06
Othe
r acc
ident
sTo
tal15
250
00
61
00
00
50
00
00
00
622
61
40
112
8
PS06
Passe
ngers
40
00
00
00
00
00
00
00
00
039
05
02
00
50
SS06
Emplo
yees
823
00
05
10
00
02
00
00
00
02
21
12
01
48
LS06
Leve
l-cro
ssing
users
02
00
00
00
-0
00
00
00
00
011
00
00
013
US06
Unau
thor
ised p
erson
s3
00
00
10
00
00
20
00
00
00
60
00
00
012
OS06
Othe
r pers
ons
00
00
00
00
00
01
00
00
00
04
00
00
00
5
60

Tabl
e 4D
— 2
009
— S
erio
us in
jurie
s by
typ
e of
acc
iden
t an
d vi
ctim
cat
egor
yID
Accid
ent t
ypes
Victim
type
sAT
BEBG
CTCZ
DEDK
EEEL
ESFI
FRHU
IEIT
LTLU
LVNL
NOPL
PTRO
SESI
SKUK
Total
TS01
Collis
ions o
f trai
nsTo
tal5
04
01
90
00
10
30
018
00
01
11
03
02
00
49
PS01
Passe
ngers
00
10
00
00
00
02
00
180
00
00
00
30
00
024
SS01
Emplo
yees
20
00
16
00
00
01
00
00
00
10
10
00
00
012
LS01
Leve
l-cro
ssing
users
00
00
00
00
-0
00
00
00
00
00
00
00
00
00
US01
Unau
thor
ised p
erson
s0
03
00
00
00
00
00
00
00
00
00
00
00
00
3
OS01
Othe
r pers
ons
30
00
03
00
01
00
00
00
00
01
00
00
20
010
TS02
Derai
lmen
ts of
train
sTo
tal1
00
00
00
01
00
00
013
00
00
00
00
00
00
15
PS02
Passe
ngers
00
00
00
00
00
00
00
00
00
00
00
00
00
00
SS02
Emplo
yees
10
00
00
00
10
00
00
00
00
00
00
00
00
02
LS02
Leve
l-cro
ssing
users
00
00
00
00
00
00
00
00
00
00
00
00
00
0
US02
Unau
thor
ised p
erson
s0
00
00
00
00
00
00
00
00
00
00
00
00
00
0
OS02
Othe
r pers
ons
00
00
00
00
00
00
00
130
00
00
00
00
00
013
TS03
Leve
l-cro
ssing
ac
ciden
tsTo
tal29
61
033
291
116
43
2211
00
30
64
076
550
79
142
332
PS03
Passe
ngers
20
00
03
00
00
00
00
00
02
00
200
00
10
028
SS03
Emplo
yees
00
00
04
10
00
00
00
00
00
00
60
00
10
012
LS03
Leve
l-cro
ssing
users
276
10
3322
01
164
322
110
03
04
40
505
507
014
228
5
US03
Unau
thor
ised p
erson
s0
00
00
00
00
00
00
00
00
00
00
00
00
00
OS03
Othe
r pers
ons
00
00
00
00
00
00
00
00
00
00
00
07
00
7
TS04
Accid
ents
to pe
rsons
ca
used
by ro
lling s
tock
in
motio
n
Total
165
171
5879
116
47
730
731
369
06
43
119
1312
87
321
1167
5
PS04
Passe
ngers
63
91
910
40
02
012
431
170
00
11
284
172
10
217
3
SS04
Emplo
yees
21
00
17
00
10
01
00
30
02
01
02
23
10
128
LS04
Leve
l-cro
ssing
users
00
00
00
00
00
00
00
00
00
00
00
00
00
0
US04
Unau
thor
ised p
erson
s6
18
048
396
63
57
1630
016
90
10
189
710
92
020
743
6
OS04
Othe
r pers
ons
20
00
023
10
00
01
00
00
03
30
20
00
11
138
TS05
Fires
in ro
lling s
tock
Total
10
00
00
00
00
00
00
00
00
00
00
00
00
12
PS05
Passe
ngers
00
00
00
00
00
00
00
00
00
00
00
00
00
00
SS05
Emplo
yees
10
00
00
00
00
00
00
00
00
00
00
00
00
12
LS05
Leve
l-cro
ssing
users
00
00
00
00
00
00
00
00
00
00
00
00
00
0
US05
Unau
thor
ised p
erson
s0
00
00
00
00
00
00
00
00
00
00
00
00
00
0
OS05
Othe
r pers
ons
00
00
00
00
00
00
00
00
00
00
00
00
00
00
TS06
Othe
r acc
ident
sTo
tal8
70
00
13
01
00
60
04
00
00
03
06
10
01
41
PS06
Passe
ngers
17
00
00
10
00
00
00
00
00
00
10
00
00
010
SS06
Emplo
yees
30
00
01
10
10
01
00
40
00
00
20
01
00
115
LS06
Leve
l-cro
ssing
users
00
00
00
00
00
00
00
00
00
00
00
00
00
0
US06
Unau
thor
ised p
erson
s3
00
00
01
00
00
50
00
00
00
00
06
00
00
15
OS06
Othe
r pers
ons
10
00
00
00
00
00
00
00
00
00
00
00
00
01
61

62
Tabl
e 5
— T
otal
and
rel
ativ
e no
of
suic
ides
IDCa
tegor
yYe
arsAT
BEBG
CTCZ
DEDK
EEEL
ESFI
FRHU
IEIT
LTLU
LVNL
NOPL
PTRO
SESI
SKUK
Total
N07
Total
no of
suici
des
2006
7897
3217
4-
211
189
4235
112
87
126
06
190
1125
4016
696
4922
71 8
85
2007
113
9439
015
070
632
04
188
5434
4111
513
80
1019
38
2852
2478
1448
197
2 630
2008
9327
016
071
424
11
174
5228
9111
713
70
916
47
2950
2971
2058
202
2 429
2009
101
6919
018
587
532
03
163
337
139
2111
24
1019
78
2569
2567
1056
210
2 719
N17
Relat
ive to
train
-km.
No
of su
icide
s20
060.5
130.9
240.8
871.0
940.2
610.0
521.0
220.8
250.6
911.1
990.3
840.3
340
0.350
1.429
0.232
0.113
1.019
0.169
0.522
0.316
0.961
0.424
13.71
9
2007
0.729
0.907
1.082
00.9
810.6
730.4
070
0.201
1.011
1.027
0.650
0.974
0.297
0.373
00.5
381.3
790.1
690.1
261.2
690.2
490.5
810.7
310.9
410.3
7815
.672
2008
0.587
0.770
00.9
140.6
840.2
930.1
400.0
470.9
020.9
760.5
341.0
180.3
730
0.461
1.180
0.149
0.129
1.197
0.302
0.514
0.995
1.176
0.368
13.71
1
2009
0.663
0.751
0.603
01.1
340.8
720.3
900
0.153
0.867
0.669
1.308
0.317
0.142
0.496
0.534
1.492
0.185
0.120
1.700
0.282
0.468
0.549
1.246
0.369
15.31
1
R01
Train-
km (m
illion
)20
0615
2.190
104.9
3736
.090
158.9
991 0
13.50
080
.541
19.07
118
5.000
50.90
050
8.000
106.7
8718
.242
377.0
0013
.827
17.12
213
3.000
47.39
222
1.737
39.26
494
.900
132.2
9518
.980
50.97
853
5.757
4 117
2007
155.0
0010
3.587
36.03
06.5
3315
2.890
1 048
.700
78.70
07.5
5319
.905
186.0
0052
.577
529.5
4011
4.000
16.83
237
0.000
14.99
218
.578
140.0
0047
.392
223.0
3140
.980
96.26
213
4.345
19.16
051
.003
521.2
924 1
85
2008
158.4
0092
.900
35.07
55.5
4017
4.961
1 043
.500
82.00
07.1
3121
.164
193.0
0053
.259
541.0
0010
9.000
366.8
6315
.817
19.52
513
9.000
46.84
122
4.359
41.76
096
.145
138.1
9420
.098
49.33
254
9.067
4 224
2009
152.3
0091
.870
31.49
05.6
5216
3.187
1 002
.917
82.15
06.8
2019
.613
188.0
0050
.019
504.0
0010
6.286
350.5
4914
.053
8.063
18.72
613
2.000
43.27
820
8.640
40.58
088
.500
131.5
1818
.208
44.95
856
8.569
4 072

63
Tabl
e 6
— N
umbe
r of
acc
iden
ts b
y ty
pe o
f ac
cide
ntID
Accid
ent t
ypes
Years
ATBE
BGCT
CZDE
DKEE
ELES
FIFR
HUIE
ITLT
LULV
NLNO
PLPT
ROSE
SISK
UKTo
tal
N01
Collis
ions o
f trai
ns20
062
8444
1342
21
40
048
41
51
04
513
32
37
467
0
2007
477
30
315
00
30
085
50
46
04
46
30
10
1412
249
2008
394
30
513
00
14
097
10
21
12
68
00
44
128
269
2009
534
30
516
10
23
07
01
74
01
26
180
21
16
1714
2
N02
Derai
lmen
ts of
train
s20
061
713
910
520
49
042
160
117
12
312
69
05
38
2247
7
2007
317
10
37
01
812
068
70
1027
00
013
23
011
511
2034
6
2008
721
00
212
02
215
197
11
101
01
310
53
114
06
1431
9
2009
141
00
37
00
27
214
10
61
00
23
631
17
03
1217
7
N03
Leve
l-cro
ssing
ac
ciden
ts20
0640
5631
104
181
825
139
140
104
038
2110
122
275
2287
1641
689
1 312
2007
5576
100
4897
733
2219
1111
554
223
139
262
325
2791
1432
7114
1 196
2008
3656
90
5376
512
1718
911
544
116
1910
210
278
2086
641
6323
1 034
2009
3631
50
4264
27
2619
1249
391
714
58
132
288
1557
1311
5116
833
N04
Accid
ents
to pe
rsons
ca
used
by ro
lling s
tock
in
motio
n
2006
5522
7210
421
618
3551
2374
244
088
3752
92
423
5529
517
2353
492 0
17
2007
2730
420
5918
410
1420
639
7792
285
3637
32
418
5624
520
1963
611 6
74
2008
3525
521
7219
313
1219
4314
5779
383
4245
12
397
4931
413
1478
571 7
13
2009
3734
401
6220
121
1211
2210
6413
62
8333
219
44
400
2723
520
274
491 6
05
N05
Fires
in ro
lling s
tock
2006
118
230
981
20
1762
10
50
01
35
03
18
024
9
2007
117
00
13
01
00
137
30
51
00
17
00
40
223
107
2008
024
11
16
00
10
024
00
25
00
39
00
30
80
88
2009
16
00
14
00
00
016
10
93
00
01
30
01
014
666
N06
Othe
r acc
ident
s20
067
016
302
144
04
365
401
50
00
186
357
255
11 9
62
2007
140
00
114
40
04
031
11
30
50
388
434
65
410
259
2008
160
00
029
40
00
363
300
30
51
092
110
66
502
321
2009
80
00
018
50
10
221
31
70
02
10
710
94
588
425
0
N00
Total
no ac
ciden
ts20
0610
618
719
3923
398
332
7077
5243
140
92
152
6663
2816
928
8941
951
7019
985
6 687
2007
104
217
560
115
320
2149
5398
2141
316
25
130
8351
3312
976
9337
056
6122
211
03 8
31
2008
9722
065
213
332
922
2640
8027
453
155
511
668
6126
1488
973
411
4665
217
104
3 744
2009
8814
648
111
331
029
1942
5126
171
180
511
955
730
2216
843
4330
446
1923
610
43 0
73
R01
No of
train
-km
(milli
on)
2006
152.1
9010
4.937
36.09
015
8.999
1 013
.500
80.54
119
.071
185.0
0050
.900
508.0
0010
6.787
18.24
237
7.000
13.82
717
.122
133.0
0047
.392
221.7
3739
.264
94.90
013
2.295
18.98
050
.978
535.7
574 1
17
2007
155.0
0010
3.587
36.03
06.5
3315
2.890
1 048
.700
78.70
07.5
5319
.905
186.0
0052
.577
529.5
4011
4.000
16.83
237
0.000
14.99
218
.578
140.0
0047
.392
223.0
3140
.980
96.26
213
4.345
19.16
051
.003
521.2
924 1
85
2008
158.4
0092
.900
35.07
55.5
4017
4.961
1 043
.500
82.00
07.1
3121
.164
193.0
0053
.259
541.0
0010
9.000
366.8
6315
.817
19.52
513
9.000
46.84
122
4.359
41.76
096
.145
138.1
9420
.098
49.33
254
9.067
4 224
2009
152.3
0091
.870
31.49
05.6
5216
3.187
1 002
.917
82.15
06.8
2019
.613
188.0
0050
.019
504.0
0010
6.286
350.5
4914
.053
8.063
18.72
613
2.000
43.27
820
8.640
40.58
088
.500
131.5
1818
.208
44.95
856
8.569
4 072

64
Tabl
e 7
— N
umbe
r of
pre
curs
ors
to a
ccid
ents
IDPr
ecur
sors
to ac
ciden
tsYe
arsAT
BEBG
CTCZ
DEDK
EEEL
ESFI
FRHU
IEIT
LTLU
LVNL
NOPL
PTRO
SESI
SKUK
Total
I01Br
oken
rails
2006
115
70
124
074
6511
768
836
11
134
5130
5445
349
256
761
232
5 633
2007
9892
1321
407
327
269
5421
323
654
143
062
531
1024
8439
319
187
575
192
5 813
2008
281
678
453
614
722
370
1930
971
63
841
431
3623
9633
380
218
7910
170
5 699
2009
3018
53
1559
140
1617
210
325
294
104
404
112
1058
441 5
0635
414
235
9415
146
4 462
I02Tra
ck bu
ckles
2006
11
721
186
1017
13
56 7
432
114
396
8095
080
261
867 8
03
2007
025
00
686
017
17
177
41
3 113
401
1314
1740
310
211
25
3 820
2008
010
00
408
011
021
83
194
80
410
38
1719
370
8716
016
835
2009
06
00
382
11189
415
116
30
367
70
74
937
2244
311
58
128
1 783
I03W
rong
-side
sign
alling
fai
lures
2006
10
054
40
629
04
44
30
08
461
71 4
85
2007
71
100
00
193
00
527
70
10
245
00
00
06
655
01 3
01
2008
31
130
00
119
00
62
277
82
239
018
152
00
122
901
1 458
2009
02
00
00
4375
04
028
70
20
442
018
021
00
91
651
4
I04Sig
nals
passe
d at
dang
er20
0615
555
6075
61
9318
358
3524
124
429
278
2442
519
415
7835
22 6
91
2007
1281
155
2672
756
82
193
2211
212
3115
602
275
734 0
1320
425
217
1679
324
7 226
2008
1697
123
2676
051
02
1111
3012
48
2220
35
240
702 6
5324
396
275
1575
316
5 814
2009
2075
34
3935
553
11
594
2013
37
1715
71
421
410
513
1243
236
212
7526
02 8
16
I05Br
oken
whe
els20
060
02
191
141
02
05
052
137
11
80
243
2007
21
170
06
220
10
20
00
09
039
660
22
01
017
0
2008
01
130
01
70
10
00
00
01
20
657
00
10
00
90
2009
00
00
12
140
00
00
10
19
01
00
105
00
00
00
134
I06Br
oken
axles
2006
00
923
00
30
222
20
03
32
101
080
2007
30
290
04
80
00
01
01
281
00
221
23
00
010
3
2008
30
70
09
90
00
01
01
20
01
267
02
10
00
105
2009
10
01
01
120
01
02
00
40
00
13
120
12
00
041
R01
No of
train
-km
(milli
on)
2006
152.1
9010
4.937
36.09
015
8.999
1 013
.500
80.54
119
.071
185.0
0050
.900
508.0
0010
6.787
18.24
237
7.000
13.82
717
.122
133.0
0047
.392
221.7
3739
.264
94.90
013
2.295
18.98
050
.978
535.7
574 1
17
2007
155.0
0010
3.587
36.03
06.5
3315
2.890
1 048
.700
78.70
07.5
5319
.905
186.0
0052
.577
529.5
4011
4.000
16.83
237
0.000
14.99
218
.578
140.0
0047
.392
223.0
3140
.980
96.26
213
4.345
19.16
051
.003
521.2
924 1
85
2008
158.4
0092
.900
35.07
55.5
4017
4.961
1 043
.500
82.00
07.1
3121
.164
193.0
0053
.259
541.0
0010
9.000
366.8
6315
.817
19.52
513
9.000
46.84
122
4.359
41.76
096
.145
138.1
9420
.098
49.33
254
9.067
4 224
2009
152.3
0091
.870
31.49
05.6
5216
3.187
1 002
.917
82.15
06.8
2019
.613
188.0
0050
.019
504.0
0010
6.286
350.5
4914
.053
8.063
18.72
613
2.000
43.27
820
8.640
40.58
088
.500
131.5
1818
.208
44.95
856
8.569
4 072

65
Tabl
e 8
— C
osts
of
all a
ccid
ents
IDCa
tegor
yYe
arsAT
BEBG
CTCZ
DEDK
EEEL
ESFI
FRHU
IEIT
LTLU
LVNL
NOPL
PTRO
SESI
SKUK
Total
C00
Costs
of al
l acc
ident
s (€
)20
060
01 0
91 61
93 0
15 48
70
00
045
366 1
030
1 873
308
750 0
000
18 03
6 842
43 42
40
34 62
5 211
4 483
573
52 11
3 923
638 6
7067
145 2
961 9
44 22
51 1
60 00
012
0 266
703
352 5
54 38
6
2007
00
674 6
230
3 844
692
013
740 7
120
2 119
403
035
316 4
350
1711
0 000
018
536 8
1433
9 309
06 3
75 00
05 3
70 07
360
250 0
0058
0 504
79 53
0 122
01 9
90 00
018
9 681
101
418 4
58 80
4
2008
00
686 3
7113
0 000
000
10 07
9 369
023
601 8
9217
9 747
2 193
186
042
242 8
590
080
0 000
020
582 7
443 5
45 66
091
900
6 975
000
2 855
166
47 69
6 000
1 541
908
55 49
0 741
301 9
872 8
06 37
512
9 256
683
480 9
27 58
9
2009
89 87
6 841
39 49
3 321
694 4
6623
4 726
304 9
010
47 29
8 709
7 114
424
2 122
359
029
818 2
2416
1 167
637
018
799 0
0012
7 238
708
20 81
8 685
8 163
330
788 5
2254
530 4
880
221 0
63 43
332
336 3
9767
8 468
59 50
3 282
13 69
2 317
2 124
167
102 2
33 13
61 0
40 095
539
C01
Costs
of de
aths (
€)
2006
945 1
1142
270 5
0433
654
16 89
6 300
00
47 24
0 000
112
35 77
5 161
750 0
0080
643 6
0022
4 554
442
2007
00
12 62
312
017 7
600
34 56
9 918
17 89
0 200
1 329
015
6 296
54 96
0 000
2 125
43 30
6 774
00
129 9
25 80
029
2 842
825
2008
16 35
30
522 2
5221
814 7
440
40 73
4 897
19 87
8 000
11 18
640
200
014
958
40 54
0 000
1 081
31 20
1 398
0114
448 8
7526
9 223
944
2009
72 42
6 273
34 08
2 952
00
31 32
538
755 8
146 3
60 70
227
292 3
8414
4 924
430
114 3
61 37
819
216 3
748 1
63 33
014
513
29 97
2 250
018
3 303
000
30 07
3 837
039
929 1
0511
742 9
020
98 86
1 059
859 5
11 62
9
C02
Costs
of in
juries
(€)
2006
474 3
733 0
95 59
955
91 1
28 10
095
131
657
3 934
062
08 7
24 08
638
7 000
5 600
250
23 37
6 637
2007
2 523
06 2
081 7
22 95
20
746 5
1758
6 612
027
5 000
24 63
94 3
10 00
07 4
12 47
30
06 9
44 31
022
031 2
34
2008
00
99 24
91 7
87 14
80
1 507
962
586 6
1274
03 1
0027
5 000
63 19
35 0
30 00
02 6
75 48
40
4 073
604
16 10
2 092
2009
17 45
0 568
5 235
170
023
4 726
81 28
54 7
96 91
358
8 184
2 525
840
16 24
3 206
12 87
7 330
634 5
080
206
2 558
238
013
627 8
822 2
62 56
00
5 856
628
1 949
415
03 0
97 93
290
020 5
90
C03
Costs
of re
place
ment
or
repa
ir of
dama
ged
RS an
d rail
way
instal
lation
s (€
)
2006
1 091
619
1 596
004
1 838
231
750 0
0012
442
40 03
716
389 4
744 4
83 57
3-
629 8
5821
078 7
271 9
44 22
520
000
16 07
1 468
65 94
5 658
2007
572 0
840
3 724
791
01 9
33 25
517
110 0
0060
002
335 2
353 0
00 00
05 0
95 91
2-
317 1
3724
775 8
430
1 890
000
44 40
6 218
86 22
0 493
2008
634 3
6160
000 0
009 4
10 33
914
6 102
618 4
4180
0 000
118 1
323 3
40 83
924
300
3 600
000
2 671
815
750 0
001 4
90 18
219
510 0
2130
1 987
2 639
224
6 228
951
112 28
4 693
2009
175 1
9855
1 005
017
7 39
3 745
982
118 3
311 9
74 94
012
699 0
0096
7 803
765 8
1222
000 0
000
24 13
2 551
064
3 897
13 71
7 550
2 124
167
83 79
3 575
C04
Costs
of de
lays (
€)
2006
864
02 4
3618
204 0
8093
9 861
8 700
1 567
322
3 000
17 95
1 385
38 67
7 649
2007
100 0
160
101 0
700
186 1
480
2 745
3 100
000
93 22
698
0 000
261 2
414 0
35 03
20
100 0
008 4
04 77
317
364 2
52
2008
35 65
770
000 0
0047
529
33 64
61 5
74 74
50
192 8
9524
300
3 100
000
105 2
011 3
76 00
050
645
2 103
839
167 1
514 5
05 25
383
316 8
60
2009
00
143 4
610
14 95
20
47 20
714
7 419
06 1
00 00
00
00
7 991
00
00
34 57
00
027
4 145
6 769
745
R01
No of
train
-km
(milli
on)
2006
152.1
9010
4.937
36.09
015
8.999
1 013
.500
80.54
119
.071
185.0
0050
.900
508.0
0010
6.787
18.24
237
7.000
13.82
717
.122
133.0
0047
.392
221.7
3739
.264
94.90
013
2.295
18.98
050
.978
535.7
574 1
17
2007
155.0
0010
3.587
36.03
06.5
3315
2.890
1 048
.700
78.70
07.5
5319
.905
186.0
0052
.577
529.5
4011
4.000
16.83
237
0.000
14.99
218
.578
140.0
0047
.392
223.0
3140
.980
96.26
213
4.345
19.16
051
.003
521.2
924 1
85
2008
158.4
0092
.900
35.07
55.5
4017
4.961
1 043
.500
82.00
07.1
3121
.164
193.0
0053
.259
541.0
0010
9.000
366.8
6315
.817
19.52
513
9.000
46.84
122
4.359
41.76
096
.145
138.1
9420
.098
49.33
254
9.067
4 224
2009
152.3
0091
.870
31.49
05.6
5216
3.187
1 002
.917
82.15
06.8
2019
.613
188.0
0050
.019
504.0
0010
6.286
350.5
4914
.053
8.063
18.72
613
2.000
43.27
820
8.640
40.58
088
.500
131.5
1818
.208
44.95
856
8.569
4 072
Tabl
e 9
— H
ours
lost
due
to
acci
dent
sID
Categ
ory
Years
ATBE
BGCT
CZDE
DKEE
ELES
FIFR
HUIE
ITLT
LULV
NLNO
PLPT
ROSE
SISK
UKTo
tal
W00
Total
no of
hour
s los
t20
0695
312
9 039
441.2
04 6
47.5
3 962
233
2 299
33 47
014
9 403
.7
2007
01 1
890
5 840
12 16
4.68 1
49.75
09 2
8325
635.7
21 1
857 1
240
021
349
91 92
0.07
2008
04 5
0020
095
104
2 572
.016
160.0
32 4
001 1
4816
625
723
1 794
038
115
163 3
41.04
6
2009
3 000
7 232
140
00
10 37
2
W10
No of
hour
s los
t rel
ative
to to
tal
numb
er of
wor
king
hour
s
2006
0.006
00.0
000
0.000
00
0.006
2007
00.0
000.0
000
0.000
00.0
010.0
000.0
000
00.0
000.0
02
2008
00.0
000.0
070
0.000
0.000
0.000
0.000
0.000
00.0
000.0
07
2009
0.000
0.000
0.000
00.0
01
R04
Total
no of
wor
king
hour
s (1 0
00 ho
urs)
2006
102 0
0016
027
837
145 7
90 32
218
689.3
4824
181
119 8
9016
239
15 16
3 144
16 85
718
4 127
400
345 39
5 586.3
48
2007
3 400
.235
87 82
2.437
015
134
131 6
20 55
418
448
22 01
012
597.7
9587
751.3
15 81
2117
578.3
6827
486 7
3916
668
018
8 623
.8159
693 1
38.935
2008
3 514
.8191
000
014
608
36 65
6128
888 7
31.27
18 82
820
947
13 21
5.047
94 46
4.212
16 00
695
972
36 07
0 744
16 78
80
235 7
96165
617 2
70.339
2009
95 00
015
048
36 34
58 4
58 12
018
263
15 42
40
8 638
200
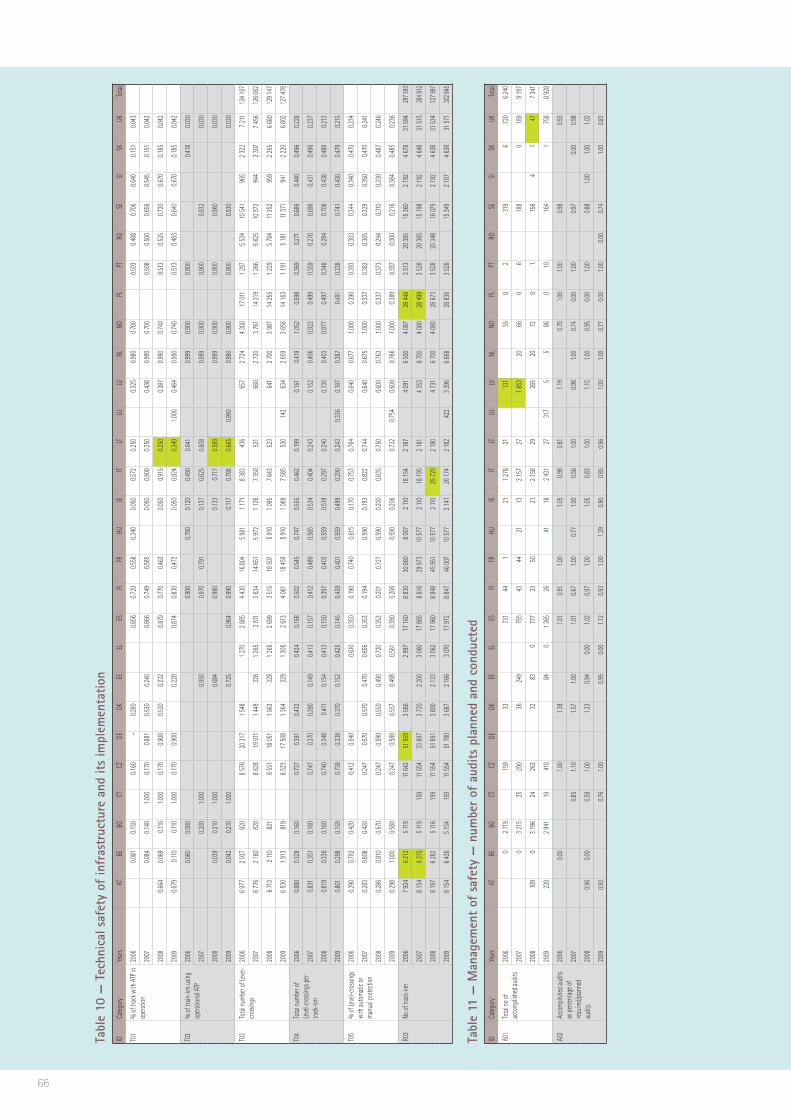
Tabl
e 10
— T
echn
ical
saf
ety
of in
fras
truc
ture
and
its
impl
emen
tatio
nID
Categ
ory
Years
ATBE
BGCT
CZDE
DKEE
ELES
FIFR
HUIE
ITLT
LULV
NLNO
PLPT
ROSE
SISK
UKTo
tal
T01
% of
trac
k with
ATP i
n op
eratio
n20
060.0
810.1
500.1
60-
0.280
0.856
0.720
0.558
0.340
0.050
0.572
0.250
0.325
0.980
0.700
0.503
0.488
0.706
0.640
0.151
0.043
2007
0.084
0.140
1.000
0.170
0.881
0.530
0.240
0.866
0.749
0.585
0.050
0.900
0.250
0.436
0.990
0.700
0.508
0.500
0.656
0.545
0.151
0.042
2008
0.664
0.069
0.110
1.000
0.170
0.900
0.530
0.232
0.870
0.770
0.463
0.050
0.915
0.250
0.387
0.990
0.740
0.513
0.525
0.720
0.670
0.185
0.042
2009
0.679
0.110
0.110
1.000
0.170
0.900
0.228
0.874
0.830
0.472
0.050
0.924
0.349
1.000
0.464
0.990
0.740
0.513
0.483
0.640
0.670
0.185
0.042
T02
% of
train
-km
using
op
eratio
nal A
TP20
060.0
600.0
800.9
000.7
800.1
200.4
900.6
410.9
990.9
000.9
000.4
180.0
30
2007
0.200
1.000
0.950
0.970
0.791
0.137
0.625
0.608
0.999
0.900
0.900
0.932
0.030
2008
0.039
0.210
1.000
0.684
0.980
0.133
0.717
0.589
0.999
0.900
0.900
0.960
0.030
2009
0.042
0.210
1.000
0.725
0.964
0.990
0.117
0.788
0.665
0.990
0.990
0.900
0.900
0.930
0.030
T03
Total
numb
er of
Leve
l-cro
ssing
s20
066 9
772 0
3782
08 5
7620
317
1 548
1 270
2 885
4 430
16 80
45 9
811 1
718 3
8343
665
72 7
244 3
0017
011
1 297
5 534
10 54
196
52 3
227 2
1113
4 197
2007
6 776
2 180
820
8 628
19 01
11 4
4932
81 2
652 8
113 6
3414
651
5 972
1 126
7 350
531
660
2 720
3 761
14 21
91 2
665 6
2510
572
944
2 307
7 456
126 0
62
2008
6 713
2 110
821
8 551
18 05
11 5
6332
91 2
652 6
993 5
1518
507
5 910
1 095
7 643
523
641
2 700
3 987
14 25
51 2
295 7
8411
352
959
2 265
6 680
129 1
47
2009
6 530
1 913
819
8 523
17 50
81 3
6432
91 3
052 6
134 0
6118
459
5 910
1 069
7 585
530
142
634
2 659
3 656
14 16
31 1
915 1
8111
371
941
2 220
6 802
127 4
78
T04
Total
numb
er of
Le
vel-c
rossi
ngs p
er tra
ck-k
m
2006
0.880
0.328
0.160
0.737
0.391
0.432
0.424
0.168
0.502
0.545
0.747
0.555
0.462
0.199
0.161
0.419
1.052
0.598
0.369
0.271
0.686
0.440
0.496
0.228
2007
0.831
0.351
0.160
0.747
0.370
0.390
0.149
0.413
0.157
0.412
0.489
0.565
0.534
0.404
0.243
0.152
0.406
0.922
0.499
0.359
0.276
0.696
0.431
0.496
0.237
2008
0.819
0.336
0.160
0.740
0.348
0.411
0.154
0.413
0.150
0.397
0.403
0.559
0.519
0.297
0.240
0.135
0.403
0.977
0.497
0.348
0.284
0.706
0.438
0.488
0.212
2009
0.801
0.298
0.159
0.738
0.338
0.370
0.152
0.425
0.145
0.459
0.401
0.559
0.499
0.290
0.243
0.336
0.187
0.387
0.491
0.338
0.741
0.430
0.479
0.215
T05
% of
Leve
l-cro
ssing
s wi
th au
toma
tic or
ma
nual
prot
ectio
n
2006
0.290
0.792
0.420
0.412
0.540
0.610
0.350
0.190
0.740
0.615
0.170
0.753
0.764
0.640
0.677
1.000
0.390
0.393
0.303
0.344
0.340
0.470
0.234
2007
0.283
0.808
0.420
0.247
0.570
0.570
0.470
0.656
0.353
0.194
0.590
0.193
0.822
0.744
0.640
0.675
1.000
0.337
0.382
0.305
0.329
0.350
0.470
0.241
2008
0.286
0.810
0.570
0.247
0.590
0.550
0.490
0.720
0.353
0.201
0.727
0.590
0.200
0.835
0.750
0.600
0.763
1.000
0.337
0.373
0.294
0.310
0.330
0.487
0.246
2009
0.298
1.000
0.580
0.247
0.580
0.557
0.498
0.561
0.390
0.206
0.590
0.206
0.732
0.754
0.600
0.766
1.000
0.389
0.397
0.000
0.216
0.384
0.485
0.236
R03
No of
trac
k-km
2006
7 924
6 212
5 119
11 64
251
959
3 586
2 997
17 16
08 8
3030
860
8 007
2 110
18 15
42 1
874 0
916 5
004 0
8728
446
3 513
20 38
515
360
2 192
4 678
31 59
429
7 593
2007
8 154
6 215
5 119
159
11 55
433
897
3 720
2 200
3 060
17 88
58 8
1629
973
10 57
72 1
1018
195
2 181
4 353
6 700
4 080
28 49
93 5
2820
385
15 19
82 1
924 6
4831
515
284 9
12
2008
8 197
6 282
5 116
159
11 55
451
851
3 800
2 133
3 062
17 96
08 8
4845
951
10 57
72 1
1025
720
2 180
4 731
6 700
4 080
28 67
33 5
2820
348
16 07
52 1
924 6
3831
534
327 9
97
2009
8 154
6 426
5 154
159
11 55
451
780
3 687
2 166
3 070
17 97
28 8
4746
007
10 57
72 1
4126
174
2 182
422
3 396
6 868
28 83
63 5
2815
349
2 187
4 638
31 57
130
2 845
Tabl
e 11
— M
anag
emen
t of
saf
ety
— n
umbe
r of
aud
its p
lann
ed a
nd c
ondu
cted
IDCa
tegor
yYe
arsAT
BEBG
CTCZ
DEDK
EEEL
ESFI
FRHU
IEIT
LTLU
LVNL
NOPL
PTRO
SESI
SKUK
Total
A01
Total
no of
ac
comp
lishe
d aud
its20
060
2 719
159
3373
144
121
1 278
2113
155
02
319
672
06 2
40
2007
03 2
1525
290
3624
975
543
4421
132 1
5727
1 853
2066
06
188
018
99 1
97
2008
109
03 1
9624
263
3283
077
733
5021
2 158
2926
520
720
115
64
147
7 341
2009
220
2 941
1941
084
01 3
6526
4118
2 431
2731
75
586
010
164
175
88 9
28
A02
Acco
mplis
hed a
udits
as
perce
ntag
e of
requir
ed/pl
anne
d au
dits
2006
0.00
1.00
1.38
1.01
0.91
1.00
1.05
0.98
0.81
1.19
0.70
1.00
1.00
0.98
0.93
2007
0.85
1.10
1.57
1.00
1.01
0.67
1.00
0.77
1.00
0.56
1.00
0.98
1.00
0.74
0.00
1.00
0.97
0.00
0.98
2008
0.96
0.00
0.59
1.00
1.33
0.94
0.00
1.02
0.97
1.00
1.05
0.83
1.00
1.15
1.00
0.95
0.00
1.00
0.88
1.00
1.00
1.02
2009
0.92
0.76
1.00
0.95
0.00
1.12
0.93
1.00
1.29
0.90
0.85
0.96
1.00
1.00
0.77
0.00
1.00
0.00
0.74
1.00
0.83
66

67
Com
men
ts o
n CS
I dat
a ta
bles
ERA
has
revi
ewed
the
repo
rted
CSI
dat
a an
d al
l lar
ge fl
uctu
atio
ns h
ave
been
che
cked
by
the
repo
rtin
g N
SA. T
he ta
ble
belo
w in
clud
es c
omm
ents
for t
he d
ata
whe
re, f
or e
xam
ple,
fl uc
tuat
ions
ar
e du
e to
cha
nges
in re
port
ing
proc
edur
es o
r whe
re th
e na
tiona
l defi
niti
on a
pplie
d gi
ves
a va
lue
that
dev
iate
s fr
om th
e Eu
rope
an a
vera
ge.
Tabl
eCo
untr
yYe
arVa
riabl
eCo
mm
ent
Tabl
e 3C
CZ20
08PK
01Th
e hi
gh n
umbe
r of p
asse
nger
s se
rious
ly in
jure
d an
d ki
lled
in 2
008
is d
ue to
one
ser
ious
acc
iden
t, a
brid
ge c
olla
pse
and
subs
eque
nt h
igh-
spee
d tr
ain
colli
sion
(8 A
ugus
t 200
8).
Tabl
e 3D
IT20
09OK
02Th
e hi
gh n
umbe
r of o
ther
per
sons
kill
ed in
der
ailm
ents
of t
rain
s in
200
9 is
due
to o
ne s
erio
us a
ccid
ent,
a de
railm
ent o
f a
trai
n w
ith d
ange
rous
goo
ds.
Tabl
e 4A
EL20
06PS
03On
e si
gnifi
cant
leve
l-cr
ossi
ng a
ccid
ent i
n 20
06 e
xpla
ins
the
larg
e nu
mbe
r of p
asse
nger
s se
rious
ly in
jure
d.
BE20
07SS
06Th
e fi g
ure
incl
udes
wor
k ac
cide
nts.
Tabl
e 4C
CZ20
08PS
01Th
e hi
gh n
umbe
r of p
asse
nger
s se
rious
ly in
jure
d an
d ki
lled
in 2
008
is d
ue to
one
ser
ious
acc
iden
t, a
brid
ge c
olla
pse
and
subs
eque
nt h
igh-
spee
d tr
ain
colli
sion
(8 A
ugus
t 200
8).
Tabl
e 4B
DE20
08PS
01Th
e la
rge
num
ber o
f pas
seng
ers
serio
usly
inju
red
is m
ainl
y du
e to
one
big
acc
iden
t.
Tabl
e 4D
BG20
09U
S01
The
high
num
ber o
f una
utho
rised
per
sons
ser
ious
ly in
jure
d in
col
lisio
ns o
f tra
ins
in 2
009
is d
ue to
one
ser
ious
acc
iden
t in
whi
ch a
car
was
hit
by a
trai
n w
hile
out
side
a le
vel c
ross
ing.
IT20
09OS
02Th
e hi
gh n
umbe
r of o
ther
per
sons
ser
ious
ly in
jure
d in
der
ailm
ents
of t
rain
s in
200
9 is
due
to o
ne s
erio
us a
ccid
ent i
n w
hich
a
dera
ilmen
t led
to a
n ex
plos
ion
of d
ange
rous
goo
ds.
LV20
09PS
03Th
e hi
gh n
umbe
r of p
asse
nger
s se
rious
ly in
jure
d in
leve
l-cr
ossi
ng a
ccid
ents
in 2
009
is d
ue to
a s
ingl
e co
llisi
on w
ith h
eavy
ro
ad-b
uild
ing
equi
pmen
t.
PL20
09PS
04Th
e hi
gh n
umbe
r of p
asse
nger
s se
rious
ly in
jure
d in
acc
iden
ts c
ause
d by
rolli
ng s
tock
in m
otio
n in
200
9 is
due
to th
e in
clus
ion
of p
erso
ns h
oppi
ng o
n or
jum
ping
out
of t
rain
s in
mot
ion,
in li
ne w
ith A
nnex
1 o
f Dire
ctiv
e 20
04/4
9/EC
, fro
m 2
009.
RO20
09U
S06
The
high
num
ber o
f oth
er u
naut
horis
ed p
erso
ns s
erio
usly
inju
red
refl e
cts
a si
ngle
eve
nt o
f a h
igh-
volta
ge a
ccid
ent t
o pe
rson
s st
ealin
g go
ods
from
a w
agon
.
Tabl
e 6
BG20
06N
01–N
06Th
e va
riabl
e in
clud
es n
on-s
igni
fi can
t acc
iden
ts.
DE20
06N
01–N
06Da
ta in
clud
e no
n-si
gnifi
cant
acc
iden
ts.
FI20
06N
04–N
05Da
ta in
clud
e no
n-si
gnifi
cant
acc
iden
ts.
FR20
06N
01–N
02Do
es n
ot in
clud
e co
llisi
ons/
dera
ilmen
ts o
n si
ding
s.
HU
2006
–08
N01
–N06
The
fl uct
uatio
n in
the
num
ber o
f occ
urre
nces
bet
wee
n 20
06 a
nd 2
008
is d
ue to
a c
ombi
natio
n of
a c
hang
e in
repo
rtin
g pr
oced
ures
and
a tr
ue c
hang
e in
num
ber o
f eve
nts.
RO20
06N
01Th
e va
riabl
e do
es n
ot in
clud
e co
llisi
ons
with
obj
ects
.

68
Tabl
eCo
untr
yYe
arVa
riabl
eCo
mm
ent
Tabl
e 7
BG20
06I0
1On
ly in
clud
es b
roke
n ra
ils th
at re
sult
in m
ore
than
30-
min
ute
traf
fi c d
elay
s.
DE20
06I0
1On
ly in
clud
es b
roke
n ra
ils w
ith a
sub
sequ
ent d
ange
rous
situ
atio
n.
DE20
08I0
1Th
e la
rge
num
ber o
f bro
ken
rails
was
due
to a
sev
ere
win
ter.
DK20
06I0
3N
atio
nal d
efi n
ition
: All
even
ts w
hen
the
sign
al c
hang
es e
xpec
tant
ly, a
lso
to a
mor
e re
stric
tive,
are
regi
ster
ed.
DK20
06I0
4N
atio
nal d
efi n
ition
: All
even
ts w
hen
a re
stric
tive
sign
al is
pas
sed
are
regi
ster
ed, a
lso
whe
n th
ere
is n
o re
al d
ange
r and
in
man
y ca
ses
just
by
a fe
w m
etre
s.
FR20
06I0
1Th
ere
was
a c
hang
e in
repo
rtin
g pr
oced
ures
bet
wee
n 20
06 a
nd 2
007.
Usi
ng 2
007
repo
rtin
g pr
oced
ures
, the
fi gu
re w
ould
ha
ve b
een
346.
FR20
06I0
4Th
ere
was
a c
hang
e in
repo
rtin
g pr
oced
ures
bet
wee
n 20
06 a
nd 2
007.
Usi
ng 2
007
repo
rtin
g pr
oced
ures
, the
fi gu
re w
ould
ha
ve b
een
110.
IT20
08I0
1Th
ere
was
a c
hang
e in
repo
rtin
g pr
oced
ures
bet
wee
n 20
07 a
nd 2
008.
IT20
06–0
8I0
2Th
ere
was
a c
hang
e in
repo
rtin
g pr
oced
ures
bet
wee
n 20
06 a
nd 2
008.
LT20
06–0
7I0
1–I0
4Th
e fl u
ctua
tion
in th
e re
port
ed n
umbe
r of o
ccur
renc
es is
the
effe
ct o
f a c
hang
e in
defi
niti
on.
NL
2006
I02
The
larg
e re
port
ed n
umbe
r of t
rack
buc
kles
is d
ue to
an
extr
emel
y ho
t sum
mer
cau
sing
a g
reat
dea
l of t
rack
buc
kles
.
NL
2009
I01
Brea
ks in
wel
ds a
nd w
ithin
poi
nts
have
not
bee
n in
clud
ed b
efor
e 20
09.
NO
2006
–07
I01–
I02
Vary
ing
wea
ther
con
ditio
ns c
ause
d la
rge
fl uct
uatio
ns in
this
var
iabl
e be
twee
n 20
06 a
nd 2
007.
NO
2008
I01,
I05
The
chan
ge in
repo
rted
num
ber o
f eve
nts
is d
ue to
an
impr
oved
impl
emen
tatio
n of
exi
stin
g re
port
ing
proc
edur
es.
PL20
06I0
3–I0
4Th
e in
fras
truc
ture
man
ager
did
not
col
lect
info
rmat
ion
on in
cide
nts
and
near
mis
ses
befo
re 2
007.
The
info
rmat
ion
is
ther
efor
e in
com
plet
e. S
igna
ls p
asse
d at
dan
ger w
ere
not c
olle
cted
.
PL20
06–0
8I0
3–I0
6Th
ere
has
been
a c
hang
e in
repo
rtin
g pr
oced
ures
, exp
lain
ing
the
fl uct
uatio
n in
the
repo
rted
num
ber o
f eve
nts.
PL20
09I0
1,I0
2,I0
6Th
ere
was
a c
hang
e in
defi
niti
on in
200
9. B
roke
n ra
ils th
at a
re n
ot c
ausi
ng d
isru
ptio
n of
traf
fi c a
re e
xclu
ded
from
repo
rtin
g.
UK
2009
I03
A ne
w c
riter
ion
for i
nclu
ding
wro
ng-s
ide
sign
allin
g fa
ilure
has
bee
n ap
plie
d si
nce
2009
. The
num
ber n
ow re
late
s on
ly to
cas
es
in w
hich
a s
igna
l has
bee
n di
spla
ying
an
aspe
ct le
ss re
stric
tive
than
it s
houl
d as
a re
sult
of a
n in
fras
truc
ture
faul
t.

69
Tabl
eCo
untr
yYe
arVa
riabl
eCo
mm
ent
Tabl
e 8
LV20
08C0
0–C0
4Th
e la
rge
num
bers
are
exp
lain
ed b
y a
smal
l num
ber o
f ser
ious
acc
iden
ts a
nd im
prov
ed re
port
ing
and
data
col
lect
ion
proc
edur
es.
Tabl
e 9
RO20
08R0
4Th
e ch
ange
is d
ue to
a c
hang
e in
defi
niti
ons
and
repo
rtin
g pr
oced
ures
UK
2007
R04
The
chan
ge in
the
repo
rted
num
ber o
f wor
king
hou
rs is
due
to a
cha
nge
in re
port
ing
proc
edur
es.
Tabl
e 10
BE20
06–0
7R0
3Th
e fi g
ure
is ta
ken
from
Eur
osta
t 200
5 da
ta.
DE20
06R0
3Th
e fi g
ure
give
n is
as
per 3
1 De
cem
ber 2
007.
IT20
08R0
3Th
e in
crea
se in
net
wor
k le
ngth
is d
ue to
a c
hang
e in
repo
rtin
g fr
om li
ne-k
m to
trac
k-km
.
LT20
08–0
9T0
1,T0
2Th
e in
crea
se in
the
num
ber o
f tra
cks
with
ATP
in o
pera
tion
is d
ue to
mod
erni
satio
n of
line
s an
d cl
osur
e of
som
e lin
es o
ver t
ime.
PL20
06–0
7R0
3Th
e fi g
ure
is e
xclu
ding
cro
ssov
ers
on m
ain
lines
and
is ta
ken
from
Eur
osta
t 200
5 da
ta.
Tabl
e 11
LV20
06A0
1Th
e fi g
ure
only
incl
udes
aud
its c
ondu
cted
by
the
Stat
e Ra
ilway
Tec
hnic
al In
spec
tora
te.
LV20
07A0
1Th
e fi g
ure
incl
udes
aud
its c
ondu
cted
by
the
IM, R
U a
nd S
tate
Rai
lway
Tec
hnic
al In
spec
tora
te.
UK
2008
A01
The
chan
ge in
the
repo
rted
num
ber o
f aud
its is
due
to a
cha
nge
in in
terp
reta
tion
of th
e de
fi niti
on.

70
Anne
x 2
— L
ist
of n
atio
nal s
afet
y au
thor
ities
an
d na
tiona
l inv
estig
atio
n bo
dies
Coun
try
Nat
iona
l saf
ety
auth
ority
Nat
iona
l inv
estig
atio
n bo
dy
Aust
riaBu
ndes
min
iste
rium
für
Ver
kehr
, Inn
ovat
ion
und
Tech
nolo
gie
Ober
ste
Eise
nbah
nbeh
örde
http
://w
ww
.bm
vit.g
v.at
Bund
esan
stal
t fü
r Ve
rkeh
r (V
ERSA
)U
nfal
lunt
ersu
chun
gste
lle d
es B
unde
s, Fa
chbe
reic
h Sc
hien
eht
tp://
vers
a.bm
vit.g
v.at
Belg
ium
Fede
rale
Ove
rhei
dsdi
enst
Mob
ilite
it en
Ver
voer
Dire
ctor
aat-
gene
raal
ver
voer
te L
and
Serv
ice
Publ
ic f
édér
al M
obili
té e
t Tr
ansp
orts
Dire
ctio
n gé
néra
le T
rans
port
terr
estr
eht
tp://
ww
w.m
obili
t.fgo
v.be
Fede
rale
Ove
rhei
dsdi
enst
Mob
ilite
it en
Ver
voer
Onde
rzoe
ksor
gaan
voo
r Ong
eval
len
en In
cide
nten
op
het S
poor
Serv
ice
Publ
ic f
édér
al M
obili
té e
t Tr
ansp
orts
Orga
nism
e d’
enqu
ête
sur l
es A
ccid
ents
et l
es In
cide
nts
ferr
ovia
ires
http
://w
ww
.mob
ilit.f
gov.
beBu
lgar
iaM
inis
try
of T
rans
port
— R
ailw
ay A
dmin
istr
atio
n Ex
ecut
ive
Agen
cyht
tp://
ww
w.ia
ja.g
over
nmen
t.bg
Min
istr
y of
Tra
nspo
rt —
Rai
lway
Acc
iden
t In
vest
igat
ion
Unit
http
://w
ww
.mtit
c.go
vern
men
t.bg
Czec
h Re
publ
icDr
azni
Ura
d —
Rai
l Aut
horit
yht
tp://
ww
w.d
ucr.c
zDr
ážní
insp
ekce
— R
ail S
afet
y In
spec
tion
Offi
ce
http
://w
ww
.dic
r.cz
Germ
any
Eise
nbah
n —
Bun
desa
mt
(EBA
)ht
tp://
ww
w.e
ba.b
und.
deBu
ndes
min
iste
rium
für
Ver
kehr
, Bau
und
Sta
dten
twic
klun
gEi
senb
ahn-
Unf
allu
nter
such
ungs
stel
leht
tp://
ww
w.b
mvb
s.de
Denm
ark
Trafi
kst
yrel
sen
http
://w
ww
.trafi
kst
yrel
sen.
dkH
avar
ikom
mis
sone
n fo
r Ci
vil L
uftf
art
og J
ernb
ane
http
://w
ww
.hav
arik
omm
issi
onen
.dk
Esto
nia
Esto
nian
Tec
hnic
al S
urve
illan
ce A
utho
rity
http
://w
ww
.tja.
eeM
inis
try
of E
cono
mic
Aff
airs
and
Com
mun
icat
ions
Emer
genc
y M
anag
emen
t Dep
artm
ent
http
://w
ww
.mkm
.ee
Gree
ceH
elle
nic
Min
istr
y of
Infr
astr
uctu
re, T
rans
port
and
Net
wor
ksSa
fety
Aut
horit
y fo
r Rai
lway
Tra
nspo
rtht
tp://
ww
w.y
me.
gr
Hel
leni
c M
inis
try
of In
fras
truc
ture
, Tra
nspo
rt a
nd N
etw
orks
Com
mitt
ee fo
r Acc
iden
t Inv
estig
atio
nht
tp://
ww
w.y
me.
grSp
ain
Agen
cia
de S
egur
idad
del
Tra
nspo
rte
Terr
estr
eht
tp://
ww
w.fo
men
to.e
sM
inis
terio
de
Fom
ento
Com
isio
n de
Inve
stig
ació
n de
Acc
iden
tes
ferr
ovia
rios
http
://w
ww
.fom
ento
.es
Finl
and
Finn
ish
Tran
spor
t Sa
fety
Age
ncy
(Tra
Fi)
http
://w
ww
.trafi
.fi
Acci
dent
Inve
stig
atio
n Bo
ard
of F
inla
ndht
tp://
ww
w.o
nnet
tom
uust
utki
nta.
fi Fr
ance
Étab
lisse
men
t Pu
blic
de
Sécu
rité
Ferr
ovia
ire (
EPSF
)ht
tp://
ww
w.se
curit
e-fe
rrov
iaire
.frBu
reau
d’E
nquê
tes
sur
les
Acci
dent
s de
Tra
nspo
rt T
erre
stre
http
://w
ww
.bea
-tt.e
quip
emen
t.gou
v.fr
Hun
gary
Nat
iona
l Tra
nspo
rt A
utho
rity
http
://w
ww
.nkh
.gov
.hu
Tran
spor
tatio
n Sa
fety
Bur
eau
http
://w
ww
.kbs
z.hu

71
Coun
try
Nat
iona
l saf
ety
auth
ority
Nat
iona
l inv
estig
atio
n bo
dy
Irela
ndRa
ilway
Saf
ety
Com
mis
sion
http
://w
ww
.rsc.
ieRa
ilway
Acc
iden
t In
vest
igat
ion
Unit
http
://w
ww
.raiu
.ieIta
lyAg
enzi
a N
azio
nale
per
la S
icur
ezza
del
le F
erro
vie
http
://w
ww
.ans
f.it
Railw
ay S
afet
y Co
mm
issi
onht
tp://
ww
w.m
it.go
v.it
Lith
uani
aVa
lsty
binė
gel
ežin
kelio
insp
ekci
jaSt
ate
Railw
ay In
spec
tora
teht
tp://
ww
w.v
gi.lt
Kata
stro
fų t
yrim
ų v
adov
asN
atio
nal I
nves
tigat
ion
Body
http
://w
ww
.tran
sp.lt
Luxe
mbo
urg
Min
istè
re d
u Dé
velo
ppem
ent
dura
ble
et d
es In
fras
truc
ture
sht
tp://
ww
w.g
ouve
rnem
ent.l
uAd
min
istr
atio
n de
s En
quêt
es T
echn
ique
sht
tp://
ww
w.m
t.pub
lic.lu
/tra
nspo
rts/
AET/
Latv
iaSt
ate
Railw
ay T
echn
ical
Insp
ecto
rate
(SR
TI)
http
://w
ww
.vdz
ti.go
v.lv
Tran
spor
t Ac
cide
nt a
nd In
cide
nt In
vest
igat
ion
Bure
au (
TAIIB
)ht
tp://
ww
w.ta
iib.g
ov.lv
Net
herla
nds
Insp
ectie
Ver
keer
en
Wat
erst
aat
http
://w
ww
.ivw
.nl
Dutc
h Sa
fety
Boa
rdht
tp://
ww
w.sa
fety
boar
d.nl
Nor
way
Nor
weg
ian
Railw
ay In
spec
tora
teht
tp://
ww
w.sj
t.no
Acci
dent
Inve
stig
atio
n Bo
ard
Nor
way
http
://w
ww
.aib
n.no
Pola
ndUr
ząd
Tran
spor
tu K
olej
oweg
oht
tp://
ww
w.u
tk.g
ov.p
lPa
ńst
wow
a Ko
mis
ja B
adan
ia W
ypad
ków
Kol
ejow
ych
(NIB
)ht
tp://
ww
w.m
i.gov
.pl
Port
ugal
Inst
ituto
da
Mob
ilida
de e
dos
Tra
nspo
rtes
Ter
rest
res
http
://w
ww
.imtt
.pt
Gabi
nete
de
Inve
stig
ação
de
Segu
ranç
a e
de A
cide
ntes
Fer
rovi
ário
s (G
ISAF
)ht
tp://
ww
w.io
t.gov
.pt
(site
und
er c
onst
ruct
ion)
Rom
ania
Auto
ritat
ea F
erov
iară
Rom
ână (
AFER
)Ro
man
ian
Railw
ay S
afet
y Au
thor
ityht
tp://
ww
w.a
fer.r
o
Auto
ritat
ea F
erov
iară
Rom
ână (
AFER
)Ro
man
ian
Railw
ay In
vest
igat
ing
Body
http
://w
ww
.afe
r.ro
Swed
enTr
ansp
orts
tyre
lsen
http
://w
ww
.tran
spor
tsty
rels
en.se
Stat
ens
have
rikom
mis
sion
http
://w
ww
.hav
kom
.seSl
oven
iaPu
blic
Age
ncy
of t
he R
epub
lic o
f Sl
oven
ia f
or R
ailw
ay T
rans
port
ht
tp://
ww
w.a
zp.si
Min
istr
y of
Tra
nspo
rtRa
ilway
Acc
iden
t and
Inci
dent
Inve
stig
atio
n Di
visi
onht
tp://
ww
w.m
zp.g
ov.si
Slov
akia
Railw
ay R
egul
ator
y Au
thor
ity (
URZD
)ht
tp://
ww
w.u
rzd.
skM
inis
try
of T
rans
port
Pos
ts a
nd T
elec
omm
unic
atio
nht
tp://
ww
w.te
leco
m.g
ov.sk
Unite
d Ki
ngdo
mO
ffi c
e of
Rai
l Reg
ulat
ion
(ORR
)ht
tp://
ww
w.ra
il-re
g.go
v.uk
Rail
Acci
dent
Inve
stig
atio
n Br
anch
http
://w
ww
.raib
.gov
.uk
Chan
nel T
unne
lCh
anne
l Tun
nel I
nter
gove
rnm
enta
l Com
mis
sion
(IG
C)Co
mm
issi
on in
terg
ouve
rnem
enta
le T
unne
l sou
s la
Man
che
http
://w
ww
.cha
nnel
tunn
elig
c.co
.uk
Assi
sted
by:
Chan
nel T
unne
l Saf
ety
Auth
ority
E-m
ail:
ctsa
@or
r.gsi
.gov
.uk
Secr
étar
iat g
énér
al a
u Tu
nnel
sou
s la
Man
che
(SG
TM)
E-m
ail:
tunn
elm
anch
e@eq
uipe
men
t.gou
v.fr
See
the
rele
vant
aut
horit
y or
bod
y in
Fra
nce
or th
e U
nite
d Ki
ngdo
m fo
r the
re
spec
tive
part
of t
he C
hann
el T
unne
l.

72
Key documents and referencesRegulation (EC) No 881/2004 of the European Parliament and Council of 29 April 2004 establishing a European railway agency amended by Regulation (EC) No 1335/2008 of the European Parliament and of the Council of 16 December 2008.
Directive 2004/49/EC of the European Parliament and of the Council of 29 April 2004 on safety on the Community’s railways and amending Council Directive 95/18/EC on the licensing of railway undertakings and Directive 2001/14/EC on the allocation of railway infrastructure capacity and the levying of charges for the use of railway infrastructure and safety certifi cation; amended by:— Directive 2008/57/EC of the European Parliament and of the Council of 17 June 2008;— Directive 2008/110/EC of the European Parliament and of the Council of 16 December 2008;— Commission Directive 2009/149/EC of 27 November 2009 as regards Common Safety Indicators and common methods to calculate
accident costs.
Regulation (EC) No 91/2003 of the European Parliament and of the Council on rail transport statistics amended by:— Commission Regulation (EC) No 1192/2003 of 3 July 2003;— Commission Regulation (EC) No 1304/2007 of 7 November 2007;— Regulation (EC) No 219/2009 of the European Parliament and of the Council of 11 March 2009.
The annual reports of all Member States’ NIBs and NSAs submitted to the Agency.
All documents can be obtained through our web pages (http://www.era.europa.eu).
Design: GELLIS Communication The Railway Safety Performance in the European UnionA report from the European Railway Agency72 pages, 21 x 29.7 cm Luxembourg: Publications Offi ce of the European Union, 2011 ISBN 978-92-9205-014-6ISSN 1831-1512doi:10.2821/13224
© European Railway Agency, 2011. Reproduction is authorised provided the source is acknowledged. European Railway Agency120, Rue Marc LefrancqBP 2039259307 Valenciennes Cedex FRANCETel. +33 327096500Fax +33 327334065www.era.europa.eu Printed on recycled paper that has been awarded the EU eco-label for graphic paper (http://ec.europa.eu/environment/ecolabel). Printed in Belgium


Headquarters in Valenciennes:
120, Rue Marc Lefrancq59300 Valenciennes FRANCE
Tel. +33 327096-500
Conference centre in Lille:
Espace International299, Boulevard de Leeds59777 LilleFRANCE
www.era.europa.eu
ISBN 978-92-9205-014-6
TR-AB-11-001-EN
-C
2011
Railway safety performance in the European Union

![National Railway Safety Regulator Act [No. 16 of 2002] · associated with the railway operation which may impact on the safety of persons ... ( AUGUST 2002 Act NATIONAL RAILWAY SAFETY](https://static.fdocuments.us/doc/165x107/5acc7e067f8b9a93268c83a5/national-railway-safety-regulator-act-no-16-of-2002-with-the-railway-operation.jpg)