Equity Valuation: Concepts and Basic Tools (Ch. 10) · CHAPTER 10 EQUITY VALUATION: CONCEPTS AND...
28
CHAPTER 10 EQUITY VALUATION: CONCEPTS AND BASIC TOOLS Presenter Venue Date
-
Upload
phungkhanh -
Category
Documents
-
view
225 -
download
1
Transcript of Equity Valuation: Concepts and Basic Tools (Ch. 10) · CHAPTER 10 EQUITY VALUATION: CONCEPTS AND...

CHAPTER 10
EQUITY VALUATION: CONCEPTS AND
BASIC TOOLS
Presenter
Venue
Date

ESTIMATED VALUE AND MARKET PRICE
Undervalued: Intrinsic value >
market price
Fairly valued: Intrinsic value =
market price
Overvalued: Intrinsic value <
market price

DEALING WITH UNCERTAINTY
Confidence in intrinsic value
estimate
Uncertainties related to model appropriateness and the correct value of inputs

MAJOR CATEGORIES OF EQUITY
VALUATION MODELS
Present value models
• Dividend discount models
• Free cash flow models
Multiplier models
• Share price multiples
• Enterprise value multiples
Asset-based valuation models
• Adjustments to book value

PRESENT VALUE MODELS
Value of an investment = present value of expected future benefits
Future benefits = dividends
Future benefits = free cash flow
1
0)1(t
t
t
r
DV
1
0)1(t
t
t
r
FCFEV

PREFERRED STOCK VALUATION (NON-
CALLABLE, NON-CONVERTIBLE SHARES)
Perpetual
Maturity at time
period n
67.91$06.0
50.5$00
r
DV
01
12
0 121
(1 ) (1 )
GBP2.00 GBP20.00GBP31.01
(1 0.041) (1 0.041)
nt
t nt
tt
D FV
r r
V
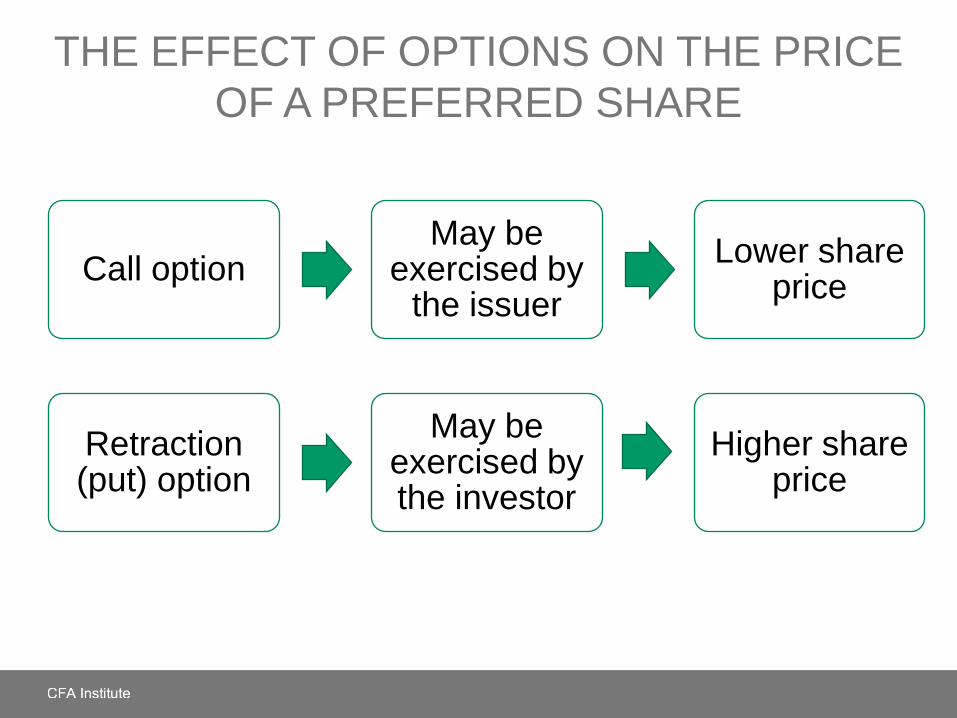
THE EFFECT OF OPTIONS ON THE PRICE
OF A PREFERRED SHARE
Call option May be
exercised by the issuer
Lower share price
Retraction (put) option
May be exercised by the investor
Higher share price

THE GORDON GROWTH MODEL
EUR13004.008.0
.04)0EUR5.00(1
)1(
)1(
)1(
0
1
1000
V
gr
D
gr
gD
r
gDV
tt
t
Assumptions:
• Dividends are the correct metric to use for valuation
purposes.
• The dividend growth rate is forever: It is perpetual and
never changes.
• The required rate of return is also constant over time.
• The dividend growth rate is strictly less than the required
rate of return.

WHEN IS THE GORDON GROWTH MODEL
MOST APPROPRIATE FOR VALUING EQUITY?
Dividend-paying
company
Insensitive to the business
cycle
Mature growth phase
Use the Gordon
growth model

ESTIMATING A LONG-TERM GROWTH
RATE
Earnings retention rate (b)
Return on equity
(ROE)
Dividend growth rate (g)
0.40 15.00% 6.00%

MULTISTAGE DIVIDEND DISCOUNT
MODEL
Use multistage dividend discount model
Rapidly growing
companies
Company will pass through
different stages of growth
Growth is expected to improve or moderate

THE TWO-STAGE DIVIDEND DISCOUNT
MODEL
L
n
Sn
L
nn
n
nn
tt
t
S
ggDD
gr
DV
r
V
r
gDV
11
)1()1(
1
01
1
1
00
Dividends grow at rate gS for n years and rate gL
thereafter:
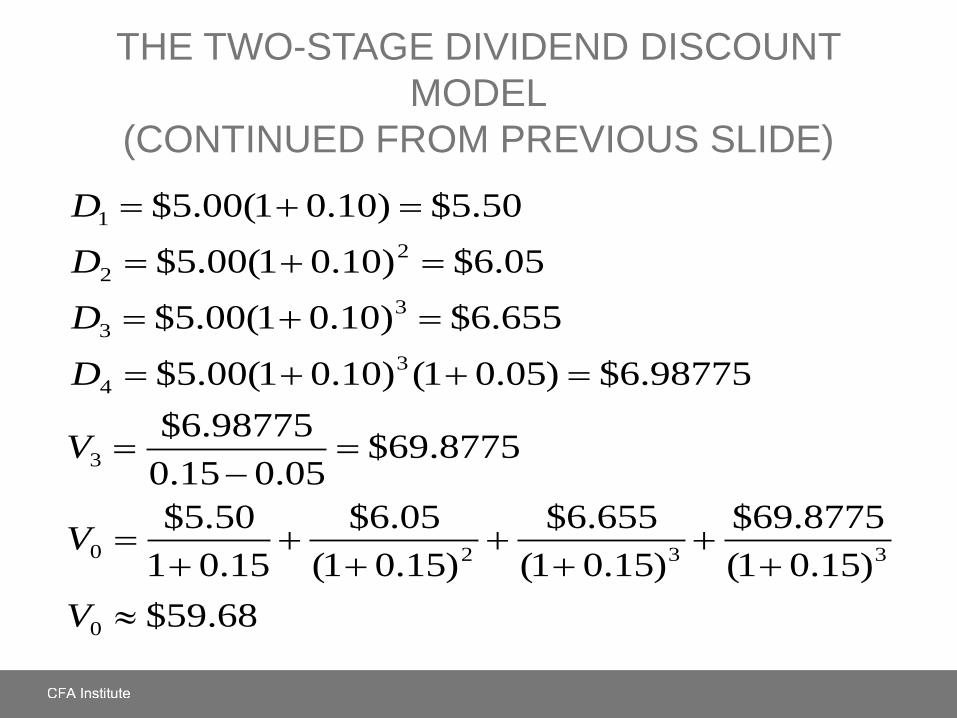
THE TWO-STAGE DIVIDEND DISCOUNT
MODEL
(CONTINUED FROM PREVIOUS SLIDE)
68.59$
)15.01(
8775.69$
)15.01(
655.6$
)15.01(
05.6$
15.01
50.5$
8775.69$05.015.0
98775.6$
98775.6$)05.01()10.01(00.5$
655.6$)10.01(00.5$
05.6$)10.01(00.5$
50.5$)10.01(00.5$
0
3320
3
3
4
3
3
2
2
1
V
V
V
D
D
D
D

PRICE MULTIPLES
Group or sector of stocks
Use price multiples as a screen
Identify overvalued and undervalued stocks

POPULAR PRICE MULTIPLES
• Stock price ÷ earnings per share Price-to-earnings
ratio (P/E)
• Stock price ÷ book value per share Price-to-book
ratio (P/B)
• Stock price ÷ sales per share Price-to-sales
ratio (P/S)
• Stock price ÷ cash flow per share Price-to-cash
flow ratio (P/CF)

PRICE MULTIPLES FOR TELEFÓNICA AND
DEUTSCHE TELEKOM Telefónica Deutsche Telekom
2008 2007 2006 2008 2007 2006
(1) Total assets (€ billions) 99.9 105.9 109.0 123.1 120.7 130.2
Asset growth −5.7% −2.8% -- 2.0% −7.3% --
(2) Net revenues (€ billions) 57.9 56.4 52.9 61.7 62.5 61.3
Revenue growth 2.7% 6.6% -- −1.3% 2.0% --
(3) Net cash flow from operating
activities (€ billions)
16.4 15.6 15.4 15.4 13.7 14.2
Cash flow growth 5.1% 1.3% -- 12.4% −3.5% --
(4) Book value of common
shareholders’ equity (€ billions)
19.6 22.9 20.0 43.1 45.2 49.7
Debt ratio:
1 – [(4) ÷ (1)]
80.4% 78.4% 81.7% 65.0% 62.6% 61.8%
(5) Net profit (€ billions) 7.8 9.1 6.6 1.5 0.6 3.2
Earnings growth −14.3% 37.9% -- 150.0% −81.3% --
(6) Weighted average number of
shares outstanding (millions)
4,646 4,759 4,779 4,340 4,339 4,353
(7) Price per share (€) 15.85 22.22 16.22 10.75 15.02 13.84
Price-to-revenue ratio (P/R):
(7) ÷ [(2) ÷ (6)] 1.3 1.9 1.5 0.8 1.0 1.0
P/CF:
(7) ÷ [(3) ÷ (6)] 4.5 6.8 5.0 3.0 4.8 4.2
P/B:
(7) ÷ [(4) ÷ (6)] 3.8 4.6 3.9 1.1 1.4 1.2
P/E:
(7) ÷ [(5) ÷ (6)] 9.4 11.6 11.7 31.1 108.6 18.8
Sources: Company websites: www.telefonica.es and www.deutschetelekom.com.
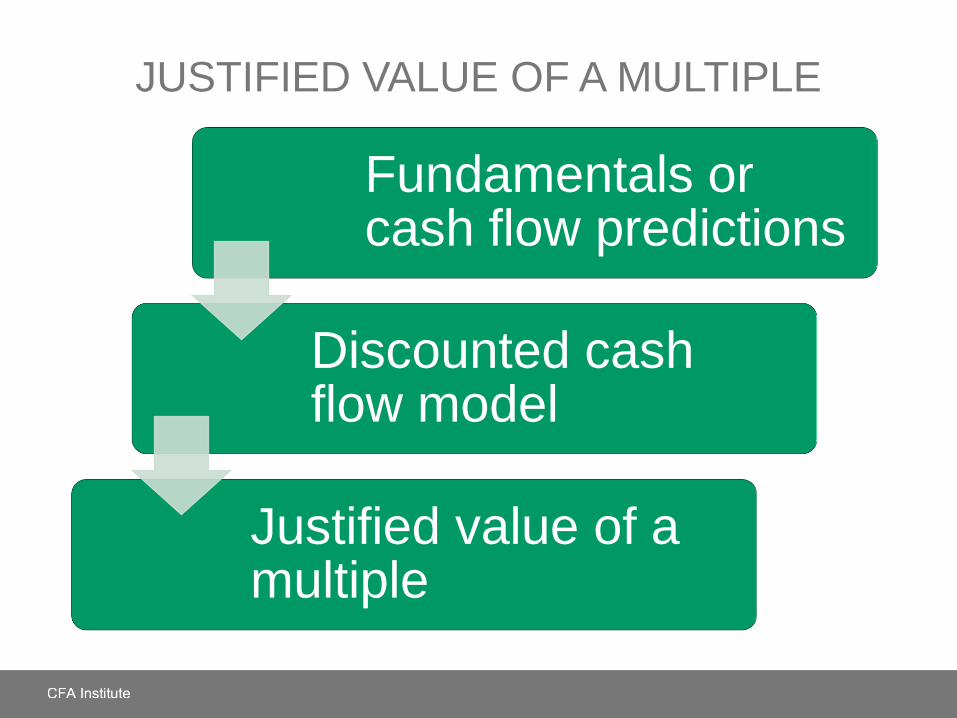
JUSTIFIED VALUE OF A MULTIPLE
Fundamentals or cash flow predictions
Discounted cash flow model
Justified value of a multiple

JUSTIFIED FORWARD P/E FOR NESTLÉ
Constant Dividend
Growth Rate
Dividend Payout Ratio
40.0% 42.5% 45.0% 47.5% 50.0%
7.0% 8.0 8.5 9.0 9.5 10.0
7.5% 8.9 9.4 10.0 10.6 11.1
8.0% 10.0 10.6 11.3 11.9 12.5
8.5% 11.4 12.1 12.9 13.6 14.3
9.0% 13.3 14.2 15.0 15.8 16.7
9.5% 16.0 17.0 18.0 19.0 20.0
10.0% 20.0 21.3 22.5 23.8 25.0
10.5% 26.7 28.3 30.0 31.7 33.3
Required Rate of Return = 12 percent
9.12085.012.0
45.0/ 11
1
0algebra
10
gr
p
gr
ED
E
P
gr
DP

THE METHOD OF COMPARABLES
Method of comparables
Time series analysis
Comparison to past or
average values
Cross-sectional analysis
Comparison to benchmark or
peer group

PRICE-TO-SALES RATIO DATA FOR MAJOR
AUTOMOBILE MANUFACTURERS (2009)
Company P/S
General Motors 0.01
Ford Motor 0.14
Daimler 0.27
Nissan Motor 0.32
Honda Motor 0.49
Toyota Motor 0.66
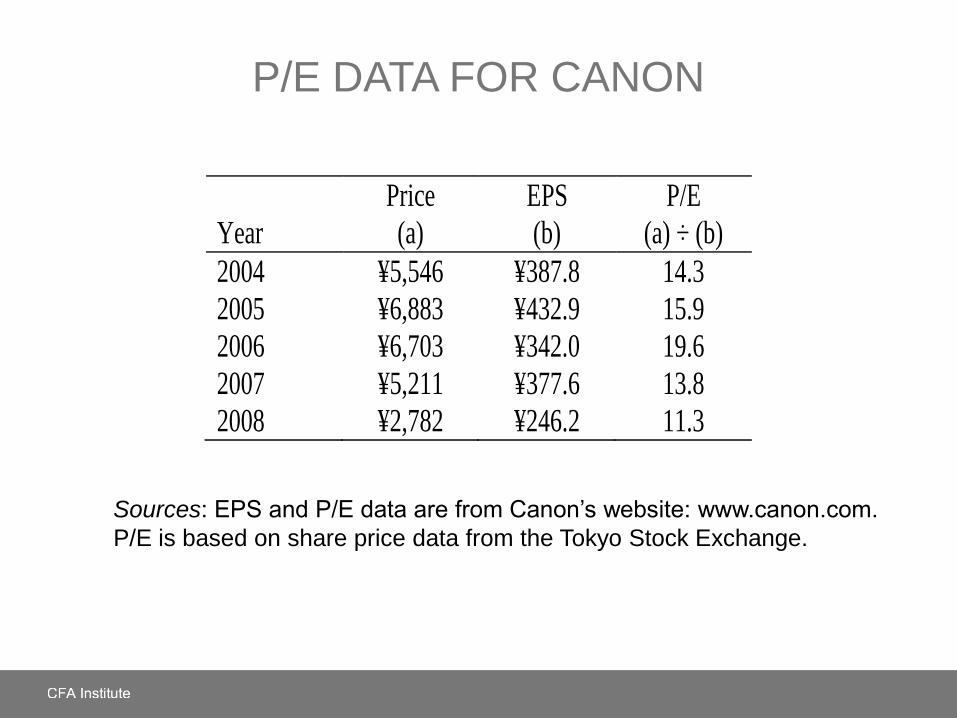
P/E DATA FOR CANON
Sources: EPS and P/E data are from Canon’s website: www.canon.com.
P/E is based on share price data from the Tokyo Stock Exchange.
Year
Price
(a)
EPS
(b)
P/E
(a) ÷ (b)
2004 ¥5,546 ¥387.8 14.3
2005 ¥6,883 ¥432.9 15.9
2006 ¥6,703 ¥342.0 19.6
2007 ¥5,211 ¥377.6 13.8
2008 ¥2,782 ¥246.2 11.3

ENTERPRISE VALUE MULTIPLES
Market capitalization
Market value of preferred
stock
Market value of debt
Cash and equivalents
Enterprise value
Enterprise value (EV)
EBITDA EV/EBITDA

EV/OPERATING INCOME DATA FOR NINE
MAJOR MINING COMPANIES
Company
Ticker
Symbol
EV
(C$ millions)
Operating
Income (OI)
(C$ millions) EV/OI
BHP Billiton BHP 197,112.00 9,794.00 20.1
Rio Tinto RIO 65,049.60 7,905.00 8.2
Anglo American AAL 48,927.30 6,208.00 7.9
Barrick Gold ABX 35,288.00 1,779.00 19.8
Goldcorp G 28,278.00 616.66 45.9
Newmont Mining NEM 22,040.80 1,385.00 15.9
AngloGold Ashanti AU 19,918.30 –362.00 –55.0
Alcoa AA 17,570.40 4,166.00 4.2
Freeport-McMoRan Copper & Gold FCX 11,168.40 2,868.75 3.9
Source: www.miningnerds.com

ASSET-BASED VALUATION
Market value of equity = market value of assets – market value of liabilities
Market value of assets and liabilities
Estimation process or processes
Book value of assets and liabilities

ASSET-BASED VALUATIONS: POTENTIAL
PROBLEMS
Difficulties determining market (fair) values
Book values differ significantly from market values
Intangible assets
Hyper- or rapidly rising inflation

ASSET-BASED VALUATION VERSUS
DISCOUNTED PRESENT VALUE APPROACHES
Valuation inputs
Valuation approaches
Company to be valued
Airline in financial distress
Present value models
Airline stopped the dividend and is
losing money and “burning” cash
Asset-based valuation
Routes, flight agreements,
equipment, and aircraft have value
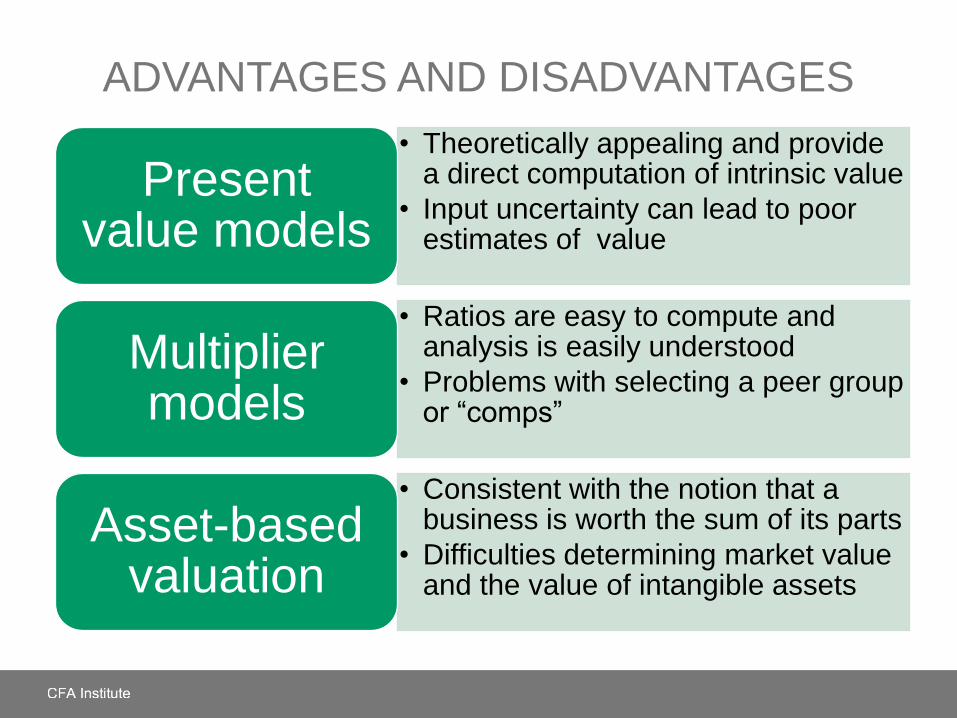
ADVANTAGES AND DISADVANTAGES
• Theoretically appealing and provide a direct computation of intrinsic value
• Input uncertainty can lead to poor estimates of value
Present value models
• Ratios are easy to compute and analysis is easily understood
• Problems with selecting a peer group or “comps”
Multiplier models
• Consistent with the notion that a business is worth the sum of its parts
• Difficulties determining market value and the value of intangible assets
Asset-based valuation

SUMMARY
• Overvalued, fairly valued, or undervalued securities
• Major categories of equity valuation models
• Present value models: dividend discount models and
free cash flow models
• Multiplier models: price ratios and enterprise value
ratios
• Asset-based valuation
• Advantages and disadvantages of equity valuation
models