Equity Tips by
9
Daily Newsle 23/06/2011 etter-Equity www.capita alheight.com
-
Upload
money-capitalheight-research-pvt-ltd -
Category
Documents
-
view
216 -
download
1
description
CapitalHeight Financial Services is a leading Stock Advisory Company, having a strong hold in providing most authentic and accurate Equity Tips as well as Commodity Tips. For 2 Days Free Trial, please visit our site at http://www.capitalheight.com or please call our 24/7 Customer Care Support us at +91 9993066624, 0731 - 4295 - 950 Or email us at: [email protected]
Transcript of Equity Tips by

Daily Newsletter23/06/2011
Daily Newsletter-Equity
www.capitalheight.com
ww.capitalheight.com
www.capitalheight.com
capitalheight.wordpress.com
Phone- (0731)4295950
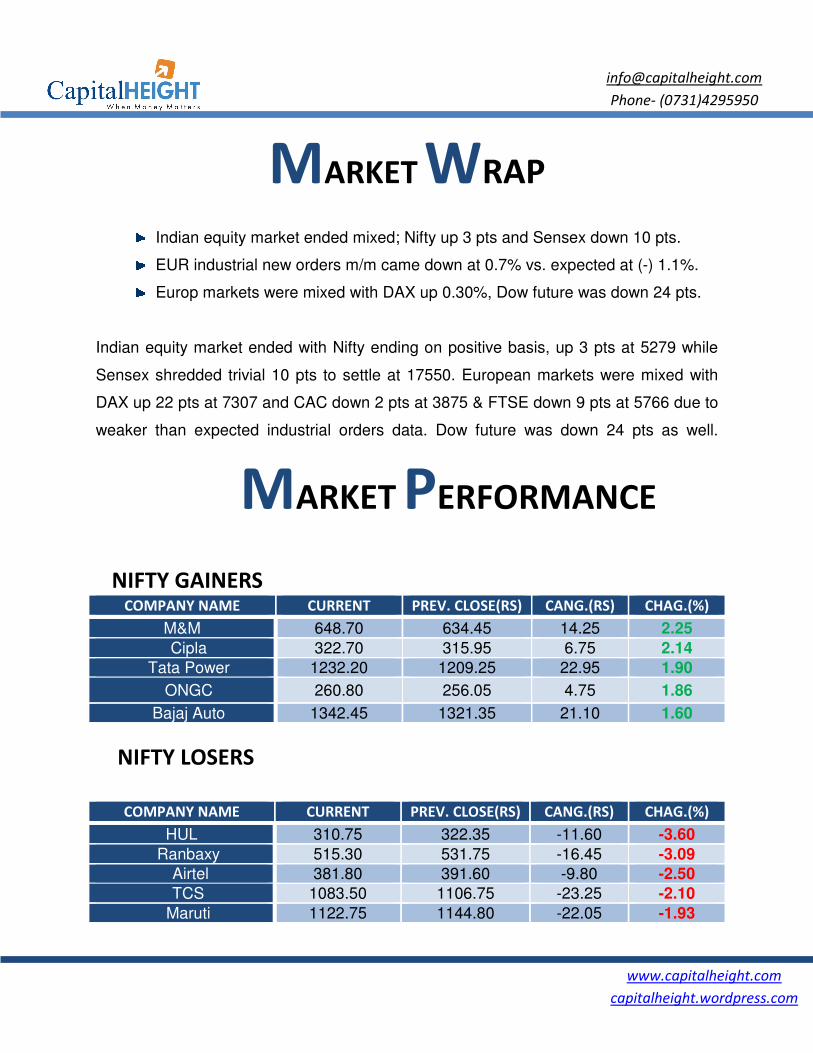
MARKET WRAP
Indian equity market ended mixed; Nifty up 3 pts and Sensex down 10 pts.
EUR industrial new orders m/m came down at 0.7% vs. expected at (-) 1.1%.
Europ markets were mixed with DAX up 0.30%, Dow future was down 24 pts.
Indian equity market ended with Nifty ending on positive basis, up 3 pts at 5279 while
Sensex shredded trivial 10 pts to settle at 17550. European markets were mixed with
DAX up 22 pts at 7307 and CAC down 2 pts at 3875 & FTSE down 9 pts at 5766 due to
weaker than expected industrial orders data. Dow future was down 24 pts as well.
MARKET PERFORMANCE
NIFTY GAINERS COMPANY NAME CURRENT PREV. CLOSE(RS) CANG.(RS) CHAG.(%)
M&M 648.70 634.45 14.25 2.25
Cipla 322.70 315.95 6.75 2.14
Tata Power 1232.20 1209.25 22.95 1.90
ONGC 260.80 256.05 4.75 1.86
Bajaj Auto 1342.45 1321.35 21.10 1.60
NIFTY LOSERS
COMPANY NAME CURRENT PREV. CLOSE(RS) CANG.(RS) CHAG.(%)
HUL 310.75 322.35 -11.60 -3.60
Ranbaxy 515.30 531.75 -16.45 -3.09
Airtel 381.80 391.60 -9.80 -2.50
TCS 1083.50 1106.75 -23.25 -2.10
Maruti 1122.75 1144.80 -22.05 -1.93
www.capitalheight.com
capitalheight.wordpress.com
Phone- (0731)4295950
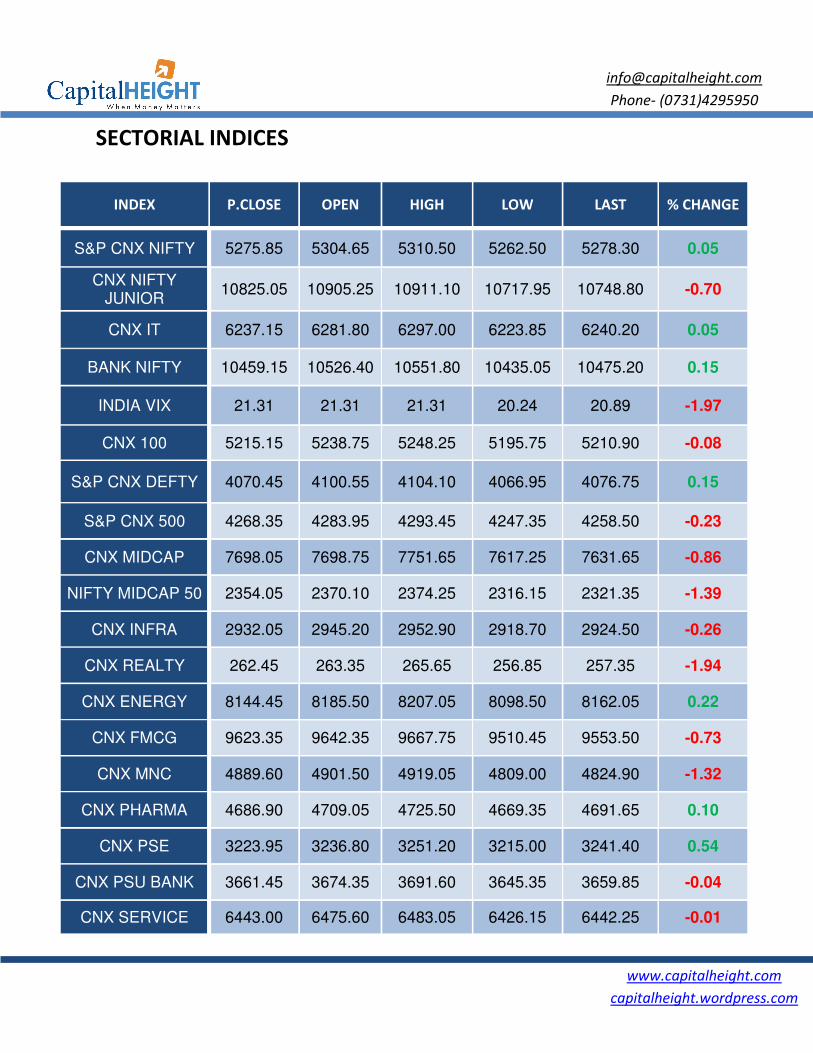
SECTORIAL INDICES
INDEX P.CLOSE OPEN HIGH LOW LAST % CHANGE
S&P CNX NIFTY 5275.85 5304.65 5310.50 5262.50 5278.30 0.05
CNX NIFTY JUNIOR
10825.05 10905.25 10911.10 10717.95 10748.80 -0.70
CNX IT 6237.15 6281.80 6297.00 6223.85 6240.20 0.05
BANK NIFTY 10459.15 10526.40 10551.80 10435.05 10475.20 0.15
INDIA VIX 21.31 21.31 21.31 20.24 20.89 -1.97
CNX 100 5215.15 5238.75 5248.25 5195.75 5210.90 -0.08
S&P CNX DEFTY 4070.45 4100.55 4104.10 4066.95 4076.75 0.15
S&P CNX 500 4268.35 4283.95 4293.45 4247.35 4258.50 -0.23
CNX MIDCAP 7698.05 7698.75 7751.65 7617.25 7631.65 -0.86
NIFTY MIDCAP 50 2354.05 2370.10 2374.25 2316.15 2321.35 -1.39
CNX INFRA 2932.05 2945.20 2952.90 2918.70 2924.50 -0.26
CNX REALTY 262.45 263.35 265.65 256.85 257.35 -1.94
CNX ENERGY 8144.45 8185.50 8207.05 8098.50 8162.05 0.22
CNX FMCG 9623.35 9642.35 9667.75 9510.45 9553.50 -0.73
CNX MNC 4889.60 4901.50 4919.05 4809.00 4824.90 -1.32
CNX PHARMA 4686.90 4709.05 4725.50 4669.35 4691.65 0.10
CNX PSE 3223.95 3236.80 3251.20 3215.00 3241.40 0.54
CNX PSU BANK 3661.45 3674.35 3691.60 3645.35 3659.85 -0.04
CNX SERVICE 6443.00 6475.60 6483.05 6426.15 6442.25 -0.01
www.capitalheight.com
capitalheight.wordpress.com
Phone- (0731)4295950
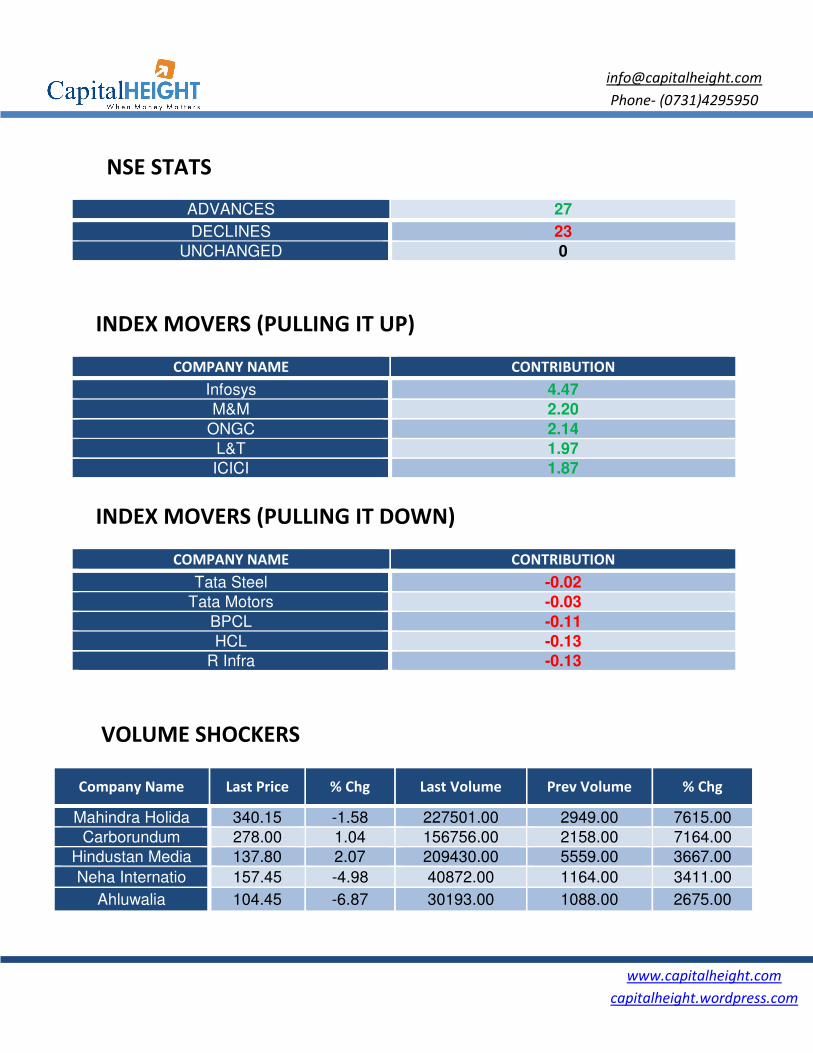
NSE STATS
ADVANCES 27
DECLINES 23
UNCHANGED 0
INDEX MOVERS (PULLING IT UP)
COMPANY NAME CONTRIBUTION
Infosys 4.47
M&M 2.20
ONGC 2.14
L&T 1.97
ICICI 1.87
INDEX MOVERS (PULLING IT DOWN)
COMPANY NAME CONTRIBUTION
Tata Steel -0.02
Tata Motors -0.03
BPCL -0.11
HCL -0.13
R Infra -0.13
VOLUME SHOCKERS
Company Name Last Price % Chg Last Volume Prev Volume % Chg
Mahindra Holida 340.15 -1.58 227501.00 2949.00 7615.00
Carborundum 278.00 1.04 156756.00 2158.00 7164.00
Hindustan Media 137.80 2.07 209430.00 5559.00 3667.00
Neha Internatio 157.45 -4.98 40872.00 1164.00 3411.00
Ahluwalia 104.45 -6.87 30193.00 1088.00 2675.00
www.capitalheight.com
capitalheight.wordpress.com
Phone- (0731)4295950
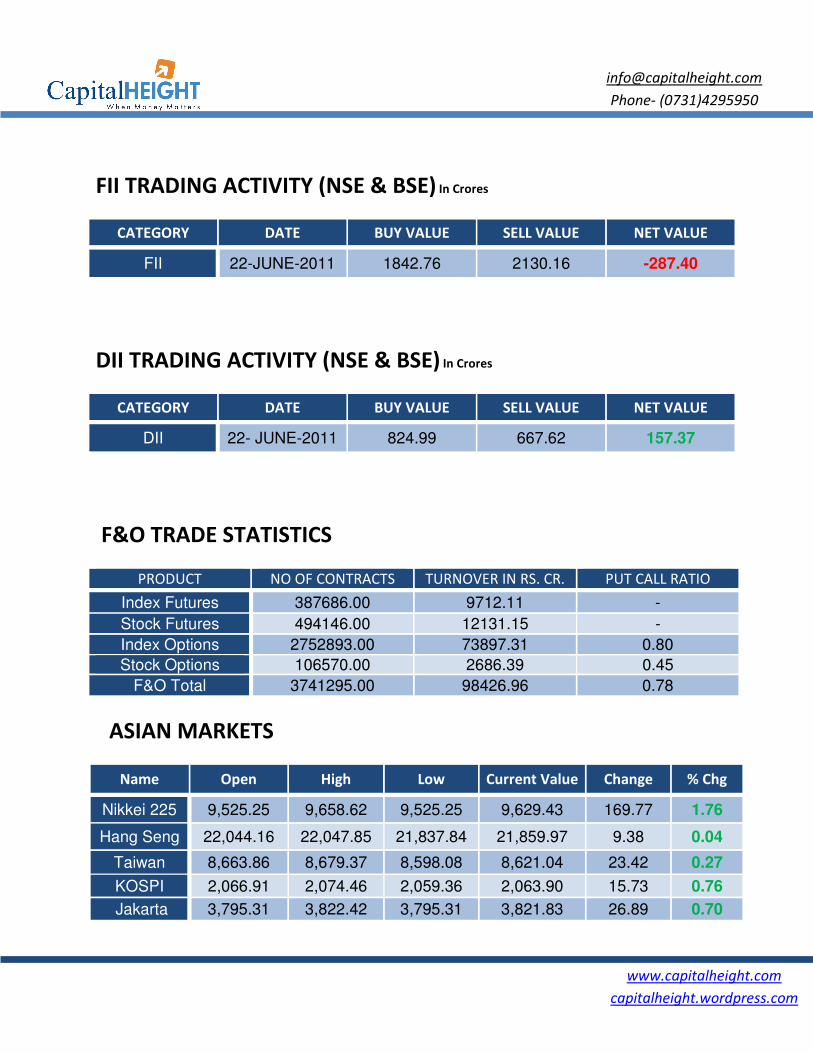
FII TRADING ACTIVITY (NSE & BSE) In Crores
CATEGORY DATE BUY VALUE SELL VALUE NET VALUE
FII 22-JUNE-2011 1842.76 2130.16 -287.40
DII TRADING ACTIVITY (NSE & BSE) In Crores
CATEGORY DATE BUY VALUE SELL VALUE NET VALUE
DII 22- JUNE-2011 824.99 667.62 157.37
F&O TRADE STATISTICS
PRODUCT NO OF CONTRACTS TURNOVER IN RS. CR. PUT CALL RATIO
Index Futures 387686.00 9712.11 -
Stock Futures 494146.00 12131.15 -
Index Options 2752893.00 73897.31 0.80
Stock Options 106570.00 2686.39 0.45
F&O Total 3741295.00 98426.96 0.78
ASIAN MARKETS
Name Open High Low Current Value Change % Chg
Nikkei 225 9,525.25 9,658.62 9,525.25 9,629.43 169.77 1.76
Hang Seng 22,044.16 22,047.85 21,837.84 21,859.97 9.38 0.04
Taiwan 8,663.86 8,679.37 8,598.08 8,621.04 23.42 0.27
KOSPI 2,066.91 2,074.46 2,059.36 2,063.90 15.73 0.76
Jakarta 3,795.31 3,822.42 3,795.31 3,821.83 26.89 0.70
TECHNICAL
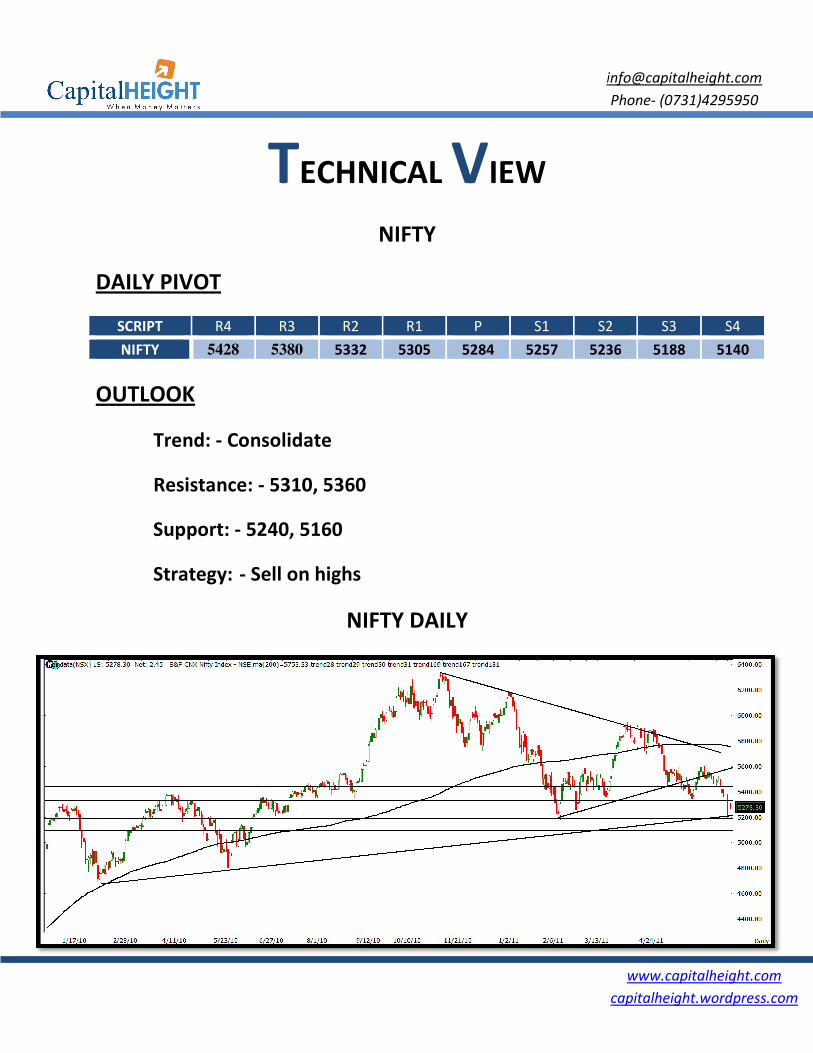
DAILY PIVOT
SCRIPT R4 R3
NIFTY 5428 5380
OUTLOOK
Trend: - Consolidate
Resistance: - 5310, 5360
Support: - 5240, 5160
Strategy: - Sell on highs
ECHNICAL VIEW
NIFTY
R2 R1 P S1 S2
5332 5305 5284 5257 5236
Consolidate
5310, 5360
5240, 5160
ell on highs
NIFTY DAILY
www.capitalheight.com
capitalheight.wordpress.com
Phone- (0731)4295950
S2 S3 S4
5236 5188 5140
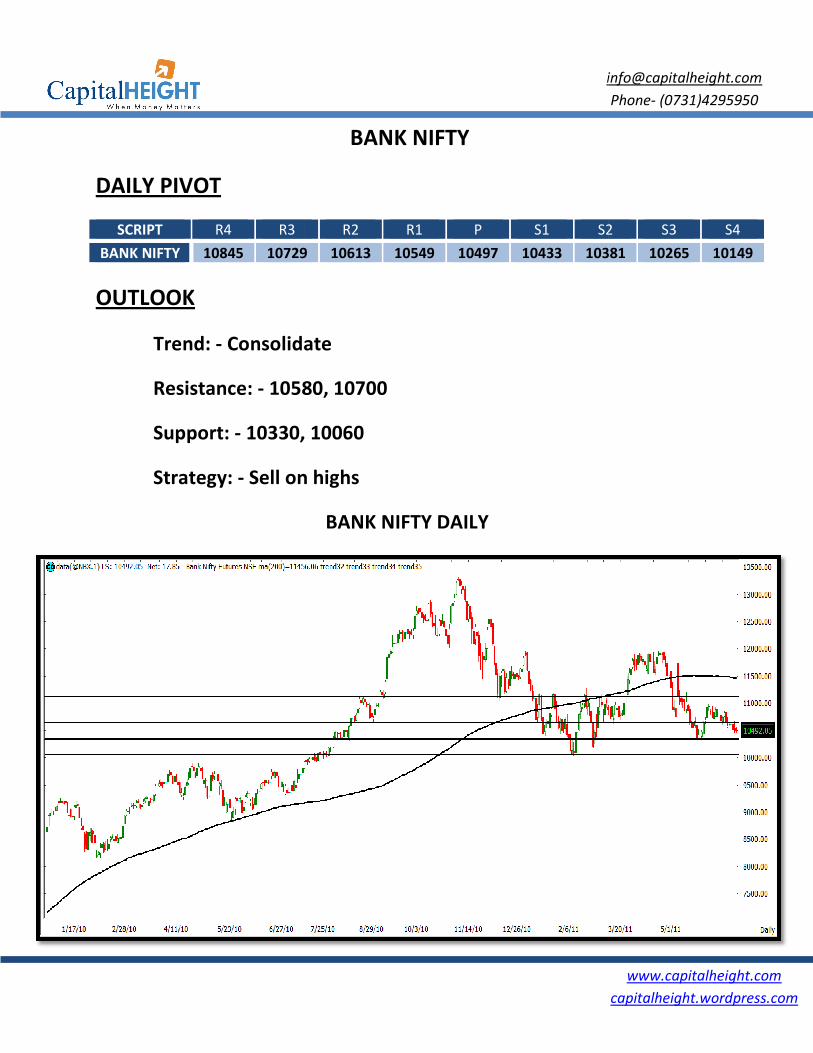
DAILY PIVOT
SCRIPT R4 R3
BANK NIFTY 10845 10729
OUTLOOK
Trend: - Consolidate
Resistance: - 10580, 10700
Support: - 10330, 10060
Strategy: - Sell on highs
BANK NIFTY
R2 R1 P S1 S2
10729 10613 10549 10497 10433 10381
Consolidate
0580, 10700
10330, 10060
ell on highs
BANK NIFTY DAILY
www.capitalheight.com
capitalheight.wordpress.com
Phone- (0731)4295950
S2 S3 S4
10381 10265 10149
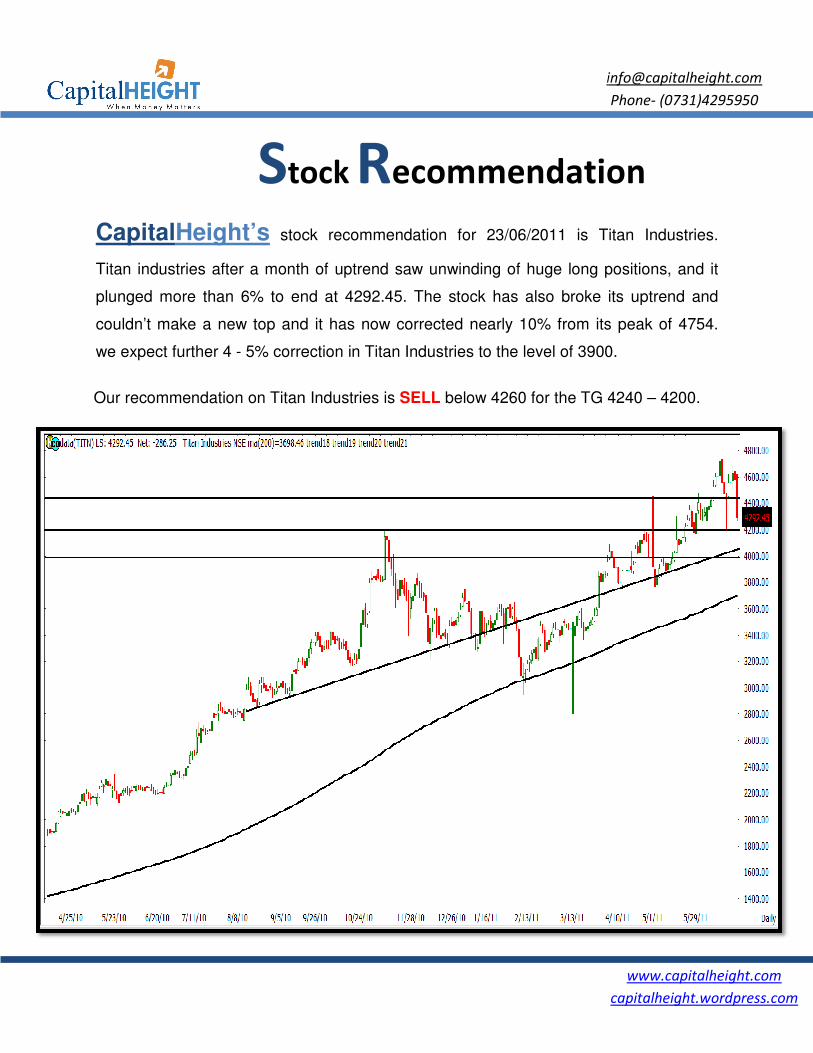
Stock
CapitalHeight’s stock recommendation for
Titan industries after a month of uptrend saw
plunged more than 6% to end at 4292.45
couldn’t make a new top and it has
we expect further 4 - 5% correction in
Our recommendation on Titan Industries
tock Recommendation
stock recommendation for 23/06/2011 is Titan Industries.
Titan industries after a month of uptrend saw unwinding of huge long positions, and it
more than 6% to end at 4292.45. The stock has also broke its uptrend and
make a new top and it has now corrected nearly 10% from its peak of 4754
5% correction in Titan Industries to the level of 3900.
Titan Industries is SELL below 4260 for the TG 4
www.capitalheight.com
capitalheight.wordpress.com
Phone- (0731)4295950
ecommendation
Titan Industries.
nwinding of huge long positions, and it
has also broke its uptrend and
corrected nearly 10% from its peak of 4754.
to the level of 3900.
4240 – 4200.
www.capitalheight.com
capitalheight.wordpress.com
Phone- (0731)4295950
Disclaimer
The information and views in this report, our website & all the service we provide are believed to be reliable, but we do not
accept any responsibility (or liability) for errors of fact or opinion. Users have the right to choose the product/s that suits
them the most.
Sincere efforts have been made to present the right investment perspective. The information contained herein is based on
analysis and up on sources that we consider reliable.
This material is for personal information and based upon it & takes no responsibility
The information given herein should be treated as only factor, while making investment decision. The report does not
provide individually tailor-made investment advice. Capitalheight recommends that investors independently evaluate
particular investments and strategies, and encourages investors to seek the advice of a financial adviser. Capitalheight shall
not be responsible for any transaction conducted based on the information given in this report, which is in violation of rules
and regulations of NSE and BSE.
The share price projections shown are not necessarily indicative of future price performance. The information herein,
together with all estimates and forecasts, can change without notice. Analyst or any person related to Capitalheight might be
holding positions in the stocks recommended. It is understood that anyone who is browsing through the site has done so at
his free will and does not read any views expressed as a recommendation for which either the site or its owners or
anyone can be held responsible for . Any surfing and reading of the information is the acceptance of this disclaimer.
All Rights Reserved.
Investment in Commodity and equity market has its own risks.
We, however, do not vouch for the accuracy or the completeness thereof. we are not responsible for any loss incurred
whatsoever for any financial profits or loss which may arise from the recommendations above. Capital height does not
purport to be an invitation or an offer to buy or sell any financial instrument. Our Clients (Paid Or Unpaid), Any third party or
anyone else have no rights to forward or share our calls or SMS or Report or Any Information Provided by us to/with anyone
which is received directly or indirectly by them. If found so then Serious Legal Actions can be taken.