Equity Schemes EQUITY SCHEMES Classic - IDFC MF · fund launched three open ended equity schemes...
42
EQUITY SCHEMES STANDARD CHARTERED CLASSIC EQUITY FUND (An Open Ended Equity Scheme) STANDARD CHARTERED PREMIER EQUITY FUND (An Open Ended Equity Scheme) STANDARD CHARTERED IMPERIAL EQUITY FUND (An Open Ended Equity Scheme) STANDARD CHARTERED CLASSIC EQUITY FUND STANDARD CHARTERED PREMIER EQUITY FUND STANDARD CHARTERED IMPERIAL EQUITY FUND Standard Chartered Asset Management Company Pvt. Ltd. ANNUAL REPORT 2 0 0 6
Transcript of Equity Schemes EQUITY SCHEMES Classic - IDFC MF · fund launched three open ended equity schemes...
EQUITY SCHEMES
STANDARD CHARTERED CLASSIC EQUITY FUND
(An Open Ended Equity Scheme)
STANDARD CHARTERED PREMIER EQUITY FUND
(An Open Ended Equity Scheme)
STANDARD CHARTERED IMPERIAL EQUITY FUND
(An Open Ended Equity Scheme)
STANDARD CHARTERED CLASSIC EQUITY FUND
STANDARD CHARTERED PREMIER EQUITY FUND
STANDARD CHARTERED IMPERIAL EQUITY FUND
Standard Chartered Asset Management Company Pvt. Ltd.
Equity Schemes
Classic A N N U A L R E P O R T
2 0 0 6

1
ANNUAL REPORT 2006
CONTENTS
Page
1. Trustee Report 2 - 6Standard Chartered Classic Equity FundStandard Chartered Premier Equity FundStandard Chartered Imperial Equity Fund
2. Auditors’ Report 7 - 9
3. Balance Sheet 10
4. Revenue Account 11
5. Cash Flow Statement 12
6. Schedules to the financial statements 13 - 39
7. Risk Factors 40

2
EQUITY SCHEMES
TRUSTEE REPORT
Report of the Board of Directors of the Standard Chartered Trustee CompanyPrivate Limited to the Unit-holders of Standard Chartered Mutual Fund.
Dear Unit-holder,
The Directors of Standard Chartered Trustee Company Private Limited herebypresent the Sixth Annual Report of Standard Chartered Mutual Fund for the yearended March 31, 2006.
STANDARD CHARTERED MUTUAL FUND
Standard Chartered Mutual Fund (“SCMF” or “the Fund”) (erstwhile the ANZGrindlays Mutual Fund) has been constituted as a Trust vide a Trust Deed datedDecember 29, 1999 in accordance with the provisions of the Indian Trust Act,1882 (2 of 1882). The Mutual Fund was registered with the Securities & ExchangeBoard of India (SEBI) on March 13, 2000.
SCMF has been sponsored by Standard Chartered Bank, with Standard CharteredTrustee Company Private Limited (formerly known as the ANZ Grindlays TrusteeCompany Private Limited) (“the Trustee”) as Trustee and Standard CharteredAsset Management Company Private Limited (formerly known as the ANZGrindlays Asset Management Company Private Limited) (“the AMC”) as theInvestment Manager for all the Schemes of SCMF.
The schemes launched by SCMF comprised of Eleven open ended schemesand and Twenty close-ended schemes as on March 31, 2006.
The open-ended schemes (Debt & Equity) were:
1) Grindlays Super Saver Income Fund (“GSSIF”) with Investment Plan,Short-Term Plan and Medium Term Plan
2) Grindlays Cash Fund (“GCF”),3) Grindlays Government Securities Fund (“GGSF”) with Investment Plan,
Short Term Plan and Provident Fund Plan4) Grindlays Dynamic Bond Fund (“GDBF”),5) Grindlays Floating Rate Fund (“GFRF”) with Short Term and Long Term
Plan and6) Standard Chartered All Seasons Bond Fund (“SCASBF”)7) Standard Chartered Liquidity Manager8) Standard Chartered Liquidity Manager Plus9) Standard Chartered Classic Equity Fund10) Standard Chartered Premier Equity Fund11) Standard Chartered Imperial Equity Fund
The Close ended schemes were:
1) Grindlays Fixed Maturity 4th Plan (GFMP-4)2) Grindlays Fixed Maturity 6th Plan (GFMP-6)3) Grindlays Fixed Maturity 5th Plan (GFMP-5)4) Grindlays Fixed Maturity 7th Plan (GFMP-7)5) Grindlays Fixed Maturity 9th Plan (GFMP-9)6) Grindlays Fixed Maturity 8th Plan (GFMP-8)7) Grindlays Fixed Maturity 12th Plan (GFMP-12)8) Grindlays Fixed Maturity 15th Plan (GFMP-15)9) Grindlays Fixed Maturity 16th Plan (GFMP-16)10) Grindlays Fixed Maturity 19th Plan (GFMP-19)11) Grindlays Fixed Maturity 20th Plan (GFMP-20)
12) Grindlays Fixed Maturity 21st Plan (GFMP-21)13) Grindlays Fixed Maturity 22nd Plan (GFMP-22)14) Standard Chartered Fixed Maturity 1st Plan (SCFMP-1)15) Standard Chartered Fixed Maturity 2nd Plan (SCFMP-2)16) Standard Chartered Fixed Maturity 3rd Plan (SCFMP-3)17) Standard Chartered Fixed Maturity 4th Plan (SCFMP-4)18) Standard Chartered Tristar Series-I (SCTS-I)19) Grindlays Fixed Maturity Plus Plan – I (GFMPP-I)20) Grindlays Fixed Maturity Plus Plan- II (GFMPP-II)
The total Funds under Management (FuM) under the thirty (not including SCASBF)Schemes as on March 31, 2006 aggregated to 9411.52 Crores.
Year 2005-2006 was the Sixth year of operation of SCMF. Till 2005 SCMF hadlaunched debt and liquid funds, with the objective of meeting the diverse risk-return requirements of debt fund investors. SCMF introduced Equity funds in2005-2006 . The fund also introduced certain hybrid products with a mix of debtand equity during the year, thus widening the investment opportunities availableto the investors under the SCMF family.
During the year under review, Standard Chartered Liquidity Manager and StandardChartered Liquidity Manager Plus Plan were the open ended liquid schemeslaunched by SCMF. Marking its foray into the equity mutual fund business, thefund launched three open ended equity schemes during the FY 2005-2006, viz.Standard Chartered Classic Equity Fund, Standard Chartered Premier EquityFund and Standard Chartered Imperial Equity Fund.
Eighteen close-ended schemes were also launched during the year. This includedfifteen vanilla debt funds and three debt funds with up to 35% exposure permittedin equities (hybrid funds). While the debt portion in these hybrid funds provideinvestors with an opportunity to earn income over the period of investment, theexposure to equity provides them with an opportunity to grow capital.
THE SPONSOR
Standard Chartered Bank (“SCB”) is a member of the Standard CharteredGroup, which is a multinational banking and financial services group with aunique emerging markets network. Standard Chartered is the world’s leadingemerging markets bank and has offices in many countries in the Asia PacificRegion, South Asia, the Middle East, Africa, United Kingdom. Through theyears SCB has grown its operations and is now a truly international bank offeringa wide array of financial products and services. As an organisation, SCB iscommitted to delivering consistently superior performance and to buildingshareholder value. With more than150 years in the emerging markets the Bankhas unmatched knowledge and understanding of its customers in its markets.
SCB operates in India through various branches which are spread in variouscities and offer a complete range of banking and financial products. It is thelargest foreign bank in India
STANDARD CHARTERED TRUSTEE COMPANY PRIVATE LIMITED
The Trustee is a company incorporated under the Companies Act, 1956 and isthe Trustee to the Fund vide Trust Deed dated December 29, 1999 as amendedfrom time to time. The Trustee is 100% owned by Standard Chartered Bank.
The Trustee is the exclusive owner of the Trust Fund and holds the same in trustfor the benefit of the unitholders. The Trustee seeks to ensure that the Fund and
3
ANNUAL REPORT 2006
the Schemes floated thereunder are managed by the AMC in accordance withthe Trust Deed, the SEBI (Mutual Funds) Regulations, 1996 as amended fromtime to time, the Investment Management Agreement, the Stock Exchangesand other regulatory agencies.
The Directors of Standard Chartered Trustee Company Private Limitedare:
Mr. Sanjeev Agrawal: He is the Chairman of the Company. He is a CharteredAccountant and is designated as the Chief Financial Officer - India & SouthAsia Region of Standard Chartered Bank with responsibilities for Financefunctions of Standard Chartered Bank. He had successfully managed theintegration process of Standard Chartered Bank and Standard CharteredGrindlays Bank. His efforts were recognized by the Indian ManagementAssociation (IMA) and he was awarded the CFO of the year award in the“Mergers & Acquisitions” category for the year 2002. Prior to the assignmentwith SCB, he was associated with Tata Steel, Bombay and with PriceWaterhouse-New Delhi.
Mr. Dattatraya M. Sukthankar: In his career spanning over 34 years till 1990as an IAS Officer, had held very important portfolios in the Govt. of Maharashtraincluding that of Secretary - Education Department, Secretary - IndustriesDept, Metropolitan Commissioner, Municipal Commissioner - Greater Bombay,and finally as Chief Secretary to the Govt. of Maharashtra. He was also theSecretary, Ministry of Urban Development, Govt. of India for two years.
Mr. Jamsheed G. Kanga: In his career as an I A S officer, had held variousimportant positions including that of Managing Director - Maharashtra StateAgro Industries Development Corporation and Maharashtra State TourismDevelopment Corporation, Joint Secretary -Finance Department, MaharashtraState, Joint Secretary (Projects & Finance) - Department of Atomic Energy,Secretary to Government of Maharashtra, Municipal Commissioner - BombayMunicipal Corporation, Chairman and Managing Director - Export CreditGuarantee Corporation of India in the rank of Secretary to Government ofIndia. After retirement, he had been the Vice-Chairman and Managing Directorof Tata Housing Development Co. Ltd. and now is a Senior Corporate Advisorto Tata Housing Development Co. Ltd. from April 1997. He is also a Consultantto Forbes Gokak Limited.
Mr. Sukant Kelkar: He was initially associated with Bank of India. He isassociated with Bombay Dyeing & Mfg. Co. Ltd since 1972. He was theExecutive Director (Finance) in Bombay Dyeing & Mfg. Co. Ltd for a period of7 years and still continues to be a Non - Executive Director, Member of AuditCommittee and Investors Greivance Committee of the Board of BombayDyeing & Mfg. Co. Ltd.
STANDARD CHARTERED ASSET MANAGEMENT COMPANY PRIVATELIMITED
As at March 31, 2006 equity share capital of the AMC was held by StandardChartered Bank (74.99%), the Atul C. Choksey Group of Companies (25%)and a resident individual. The AMC formerly known as ANZ Grindlays AssetManagement Company Private Limited was sponsored by the ANZ BankingGroup, the holding of ANZ was acquired by Standard Chartered Bank andsubsequently on March 13, 2001 the name of the AMC was changed toStandard Chartered Asset Management Company Private Limited. The AMC
is the Investment Manager for all the Schemes under SCMF.
The Directors of Standard Chartered Asset Management CompanyPrivate Limited as at March 31, 2006 were:
Mr. Paul Jebson: He is the Head Funds Management, Global Markets withStandard Chartered Bank. He has been associated with Standard CharteredBank since June 1977 with responsibilities of institutional and commercialbank sales and marketing and treasury functions. He was the Group Head ofInstitutional and Commercial Bank Sales and Marketing from 1999 to 2001and the Global Head of Treasury Bank relationships from 1998 to 1999.
Dr. A. C. Shah: He is a M.A., Ph.D (Economics) from the University ofBombay. He retired as the Chairman and Managing Director of Bank ofBaroda after a meritorious service of over 30 years during which he held manyresponsible positions in the bank. He was advisor to UTI for setting up UTIBank.
Mr. Atul C. Choksey: He is a Chemical Engineer from Illinois Institute ofTechnology, Chicago, USA. He has also completed courses in managementdisciplines like Finance, Personnel, Micro and Macro Economics etc. duringhis stay abroad. He is the Chairman of Apcotex Lattices Limited (now knownas Apcotex Industries Limited), Apcotex Financial Services Limited and ApcotexInfoway Private Limited as well as other group companies. He was the ManagingDirector of Asian Paints (India) Limited from 1984 to 1997.
Mr. Pradip Madhavji: He was the Chairman of Thomas Cook (India) Limitedfor 8 years and was responsible for enhancing its position externally, throughfurther strengthening the company’s relationships with business partners,trade bodies and associates. He has been with Thomas Cook since 1977 andhas held senior positions as Managing Director, Deputy Chairman & ManagingDirector & Executive Chairman. Prior to this he was with Dena Bank for over18 years where at the time of leaving he was in charge of the entire foreignexchange function of the Bank.
Mrs. Bakul Patel: She is a Chartered Secretary from the Chartered Instituteof Company Secretaries, U.K. She is a Member of Zonal Advisory Board,Western Zone, Life Insurance Corporation of India and Western RegionalAdvisory Committee, Industrial Development Bank of India. She was theChairperson of Maharashtra State Financial Corporation from 1992 to 1995and was the Sheriff of Mumbai from 1992 – 1993. She was a member on theIndian Advisory Board, Standard Chartered Grindlays Bank.
Mr. Naval Bir Kumar: He is a rank holder in Mathematics from Bombay Universityand holds an MBA from the Indian Institute of Management, Calcutta. He is theManaging Director of Standard Chartered Asset Management Company PrivateLimited. Prior to this he was Director & Head Originations of Global CapitalMarkets for ANZ Investment Bank. In this role he has handled debt and equitycapital market transactions for a number of leading Indian corporates and wassuccessful in improving the Bank’s position in the domestic capital markets from193 to number 6. He is also on the Board of the Association of Mutual Funds ofIndia (“AMFI”). He joined the Bank in 1990 in the Merchant Banking Division andwas appointed Head of the Merchant Bank for West India in 1994 and subsequentlyHead of the Investment Bank for West India in 1996. In these roles he has workedon a cross-section of investment banking products such as: Infrasturcture financing,Corporate finance, Cross-Border debt financing and Domestic capital market

4
EQUITY SCHEMES
transactions.He worked briefly with Colgate Palmolive (India) Limited as a BrandManager prior to joining Standard Chartered Grindlays bank.
Industry Review and Future Outlook
The year saw the resurgence of growth in the equity-oriented funds. Equity fundsgrew by a whopping 152% during the fiscal year on the back of bullish sentimentin the equity markets. During the same period ELSS schemes also grew almost4 fold to Rs. 6589 crs. The interest rate environment in the economy remainedbearish during the period. As a result of which long-term income funds were notsought after. Most mutual funds including ours actively advised investors againstinvesting in long-term debt funds taking into consideration the underlying bearishinterest rate environment. As a consequence, Income funds as a categoryexperienced only a modest 26% growth, most of this coming from short durationfunds rather than from long duration funds. Liquid category grew about 14%reflecting the parsimonious state of liquidity in the banking system.
Outlook for the current year looks stable. With incisive corrections in the equitymarkets, growth oriented schemes have stopped being attracted to customersas of now. Short duration debt funds are back in vogue given the uncertain natureof interest rate movements in the economy.
Details of the schemes covered under this report are given below:-
OPEN ENDED EQUITY SCHEMES :
STANDARD CHARTERED CLASSIC EQUITY FUND (“SCCEF”)
The primary objective of the scheme is to seek to generate long term capitalgrowth from a diversified portfolio of predominantly equity and equity relatedinstruments.
To achieve the above objective the assets of the Scheme shall be predominantlyinvested in equity and equity related instruments.
The Funds Under Management (“FuM”) of the as of March 31, 2006 is Rs.788.50crores, the scheme has delivered a absolute return of 42.20% from its inceptiondate (i.e. the date of allotment ) of August 9, 2005 (NAV of Rs. 10.00) to March31, 2006. The NAV of the growth option as of March 31, 2006 is Rs. 14.22.
STANDARD CHARTERED PREMIER EQUITY FUND (“SCPEF”)
The Scheme shall seek to generate long-term capital growth from an activelymanaged portfolio of predominantly equity and equity related instruments. TheScheme portfolio would acquire, inter alia, small and medium size businesseswith good long term potential, which are available at cheap valuations. Suchsecurities would be identified through disciplined fundamental research keepingin view medium to long-term trends in the business environment.
The Scheme shall endeavor to accumulate long-term investor wealth by openingsubscriptions to units during periods when stocks are available at reasonablevaluations. By doing so, the Fund managers would endeavor to prevent short-term money from flowing into the fund which can prove detrimental to theinterests of long-term investors. As the scheme would be sold to investors witha long-term investment horizon, it is also expected that the portfolio wouldremain relatively more insulated to day to day redemption pressures. The fundwill close subscription, once it has collected a predetermined “manageable”corpus (approximate amount), which will be decided by the fund manager of thescheme depending on the available investment opportunities in the stock market /if the fund manager is of the opinion that investment opportunities have diminished.Thus the fund manager will endeavour to ensure that there are sufficient assetsavailable to meet the long-term objectives of the fund.

5
ANNUAL REPORT 2006
To achieve the above objective the assets of the Scheme shall be predominantlyinvested in equity and equity related instruments.
The Funds Under Management (“FuM”) of the as of March 31, 2006 is Rs.310.07crores, the scheme has delivered a absolute return of 28.30% from its inceptiondate (i.e. the date of allotment ) of September 28, 2005 (NAV of Rs. 10.00) toMarch 31, 2006. The NAV of the growth option as of March 31, 2006 isRs. 12.83.
STANDARD CHARTERED IMPERIAL EQUITY FUND (“SCIEF”)
The investment objective of the Scheme is to seek to generate capital appreciationand/or provide income distribution from a portfolio of predominantly equity andequity related instruments. There is no assurance or guarantee that the objectivesof the scheme will be realized.
To achieve the above objective the assets of the Scheme shall be predominantlyinvested in equity and equity related instruments.
The Funds Under Management (“FuM”) of the as of March 31, 2006 is Rs.449.49crores, the scheme has delivered a absolute return of 6.30% from its inceptiondate (i.e. the date of allotment ) of March 16, 2006 (NAV of Rs. 10.00) to March31, 2006. The NAV of the growth option as of March 31, 2006 is Rs. 10.63.
INVESTOR SERVICES
The AMC successfully managed big sized NFOs like the Standard CharteredClassic Equity Fund, Standard Chartered Premier Equity Fund and StandardChartered Imperial Equity Fund.
The Investor Service team continued to innovate and among the more prominentones was the Auto Switch facility during NFOs. This facility allowed investors toearn incremental returns for the days between the day of investment and the endof the NFO. The appreciated amount then was automatically switched into theNFO on the last day.
The AMC continues to see an impressive growth in the SIP numbers. The Fundis among the few funds to have a Any Day SIP facility. The AMC has enteredinto arrangements with various banks to ensure that investors in as many Indiantowns can avail the benefits of SIP with the least amount of transactionalinconvenience. Investors today can apply through any of the following modes:Post dated cheques, Auto Debits through the ECS facility and StandingInstructions (available for investors with accounts in select banks only).
The Fund set up a Central Customer Care Cell in Chennai to ensure that allcorrespondences with our investors have a standardized quality response. TheCustomer Care cell serves to be a repository of all communication with investors.
The Fund also entered into a Channel partner agreement with India Infoline andKotak Street in the last financial year.
Our unique Phone Transact service, that allows investors to redeem/ switchinvestments on the phone without any PIN, continues to grow in stature. It nowextends to over 675 cities and redemptions through phone continue to grow as aproportion of total redemptions.
The Fund now through a combination of own offices and registrars officesreaches to 78 cities.
DISTRIBUTION OF INCOME
The distribution of Dividend will be made out of Net Surplus under this subject toavailability of distributable profits, as computed in accordance with SEBIRegulations. The AMC reserves the right to change the periodicity.
Name of the Dividend OptionScheme / Plan
SCCEF Dividends, if declared, will be paid out of the netsurplus of the Scheme/Plan to those Unitholderswhose names appear in the Register of Unitholderson the record date. The investors may obtaininformation on the exact record date from the officeof the Mutual Fund/ the Registrar. Unitholders areentitled to receive dividend within 30 days of thedate of declaration of the dividend. However, theMutual Fund will endeavour to make dividendpayments sooner to Unitholders. There is noassurance or guarantee to Unitholders as to therate of dividend distribution nor that dividends willbe regularly paid, though it is the intention of theMutual Fund to make regular dividend distributionsunder the respective investment option.
SCPEF Dividends, if declared, will be paid out of net surplusof the scheme/plan to those Unitholders whosenames appear in the Register of Unitholders on therecord date. Unitholders are entitled to receivedividend within 30 days on the date of declarationof the dividend. However, the Mutual Fund willendeavour to make dividend payments sooner toUnitholders. There is no assurance or guarantee toUnitholders at to the rate of dividend distributionnor that dividends will be regularly paid.
SCIEF Dividends, if declared, will be paid out of net surplusof the scheme/plan to those Unitholders whosenames appear in the Register of Unitholders on therecord date. Unitholders are entitled to receivedividend within 30 days on the date of declarationof the dividend. However, the Mutual Fund willendeavour to make dividend payments sooner toUnitholders. There is no assurance or guarantee toUnitholders at to the rate of dividend distributionnor that dividends will be regularly paid.
STATUTORY DETAILS
The price and redemption value of units, and income from them, can go up aswell as down with fluctuations in the market value of its underlying investments.
On written request, present and prospective unitholder/investors can obtaincopy of the trust deed, the annual report of the scheme and the asset managementcompany and the text of the relevant scheme.

6
EQUITY SCHEMES
ACKNOWLEDGEMENT
The trustees wish to place on record their gratitude to the unitholders for theircontinued support and to the Securities and Exchange Board of India, theReserve Bank of India, the Registrars, Bankers, the Custodians and Sponsor(present and erstwhile) of SCMF for support provided by them during the year.
For Standard Chartered Trustee Company Private Limited
(The Trustee of Standard Chartered Mutual Fund)
Chairman
Place: MumbaiDate: August 2, 2006

7
ANNUAL REPORT 2006
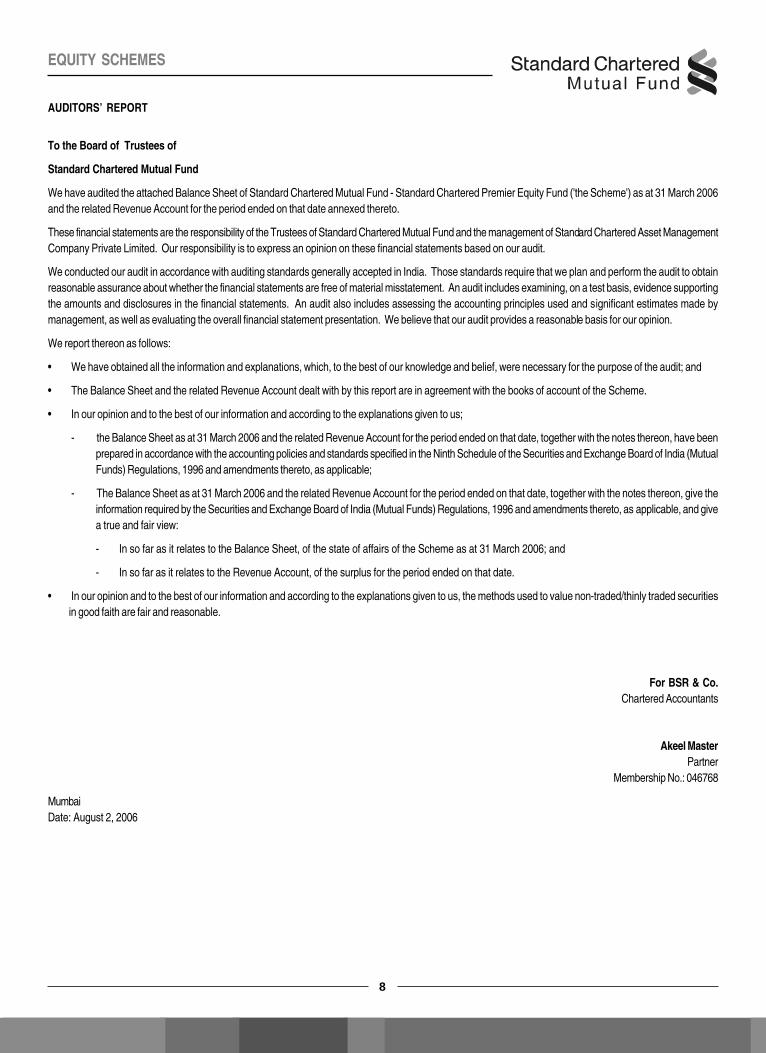
To the Board of Trustees of
Standard Chartered Mutual Fund
We have audited the attached Balance Sheet of Standard Chartered Mutual Fund - Standard Chartered Classic Equity Fund ('the Scheme') as at 31 March 2006and the related Revenue Account for the period ended on that date annexed thereto.
These financial statements are the responsibility of the Trustees of Standard Chartered Mutual Fund and the management of Standard Chartered Asset ManagementCompany Private Limited. Our responsibility is to express an opinion on these financial statements based on our audit.
We conducted our audit in accordance with auditing standards generally accepted in India. Those standards require that we plan and perform the audit to obtainreasonable assurance about whether the financial statements are free of material misstatement. An audit includes examining, on a test basis, evidence supportingthe amounts and disclosures in the financial statements. An audit also includes assessing the accounting principles used and significant estimates made bymanagement, as well as evaluating the overall financial statement presentation. We believe that our audit provides a reasonable basis for our opinion.
We report thereon as follows:
• We have obtained all the information and explanations, which, to the best of our knowledge and belief, were necessary for the purpose of the audit; and
• The Balance Sheet and the related Revenue Account dealt with by this report are in agreement with the books of account of the Scheme.
• In our opinion and to the best of our information and according to the explanations given to us;
- the Balance Sheet as at 31 March 2006 and the related Revenue Account for the period ended on that date, together with the notes thereon, have beenprepared in accordance with the accounting policies and standards specified in the Ninth Schedule of the Securities and Exchange Board of India (MutualFunds) Regulations, 1996 and amendments thereto, as applicable;
- The Balance Sheet as at 31 March 2006 and the related Revenue Account for the period ended on that date, together with the notes thereon, give theinformation required by the Securities and Exchange Board of India (Mutual Funds) Regulations, 1996 and amendments thereto, as applicable, and givea true and fair view:
- In so far as it relates to the Balance Sheet, of the state of affairs of the Scheme as at 31 March 2006; and
- In so far as it relates to the Revenue Account, of the surplus for the period ended on that date.
• In our opinion and to the best of our information and according to the explanations given to us, the methods used to value non-traded/thinly traded securitiesin good faith are fair and reasonable.
For BSR & Co.Chartered Accountants
Akeel MasterPartner
Membership No.: 046768
MumbaiDate: August 2, 2006
AUDITORS’ REPORT
8
EQUITY SCHEMES
To the Board of Trustees of
Standard Chartered Mutual Fund
We have audited the attached Balance Sheet of Standard Chartered Mutual Fund - Standard Chartered Premier Equity Fund ('the Scheme') as at 31 March 2006and the related Revenue Account for the period ended on that date annexed thereto.
These financial statements are the responsibility of the Trustees of Standard Chartered Mutual Fund and the management of Standard Chartered Asset ManagementCompany Private Limited. Our responsibility is to express an opinion on these financial statements based on our audit.
We conducted our audit in accordance with auditing standards generally accepted in India. Those standards require that we plan and perform the audit to obtainreasonable assurance about whether the financial statements are free of material misstatement. An audit includes examining, on a test basis, evidence supportingthe amounts and disclosures in the financial statements. An audit also includes assessing the accounting principles used and significant estimates made bymanagement, as well as evaluating the overall financial statement presentation. We believe that our audit provides a reasonable basis for our opinion.
We report thereon as follows:
• We have obtained all the information and explanations, which, to the best of our knowledge and belief, were necessary for the purpose of the audit; and
• The Balance Sheet and the related Revenue Account dealt with by this report are in agreement with the books of account of the Scheme.
• In our opinion and to the best of our information and according to the explanations given to us;
- the Balance Sheet as at 31 March 2006 and the related Revenue Account for the period ended on that date, together with the notes thereon, have beenprepared in accordance with the accounting policies and standards specified in the Ninth Schedule of the Securities and Exchange Board of India (MutualFunds) Regulations, 1996 and amendments thereto, as applicable;
- The Balance Sheet as at 31 March 2006 and the related Revenue Account for the period ended on that date, together with the notes thereon, give theinformation required by the Securities and Exchange Board of India (Mutual Funds) Regulations, 1996 and amendments thereto, as applicable, and givea true and fair view:
- In so far as it relates to the Balance Sheet, of the state of affairs of the Scheme as at 31 March 2006; and
- In so far as it relates to the Revenue Account, of the surplus for the period ended on that date.
• In our opinion and to the best of our information and according to the explanations given to us, the methods used to value non-traded/thinly traded securitiesin good faith are fair and reasonable.
For BSR & Co.Chartered Accountants
Akeel MasterPartner
Membership No.: 046768
MumbaiDate: August 2, 2006
AUDITORS’ REPORT

9
ANNUAL REPORT 2006
To the Board of Trustees of
Standard Chartered Mutual Fund
We have audited the attached Balance Sheet of Standard Chartered Mutual Fund - Standard Chartered Imperial Equity Fund ('the Scheme') as at 31 March 2006and the related Revenue Account for the period ended on that date annexed thereto.
These financial statements are the responsibility of the Trustees of Standard Chartered Mutual Fund and the management of Standard Chartered Asset ManagementCompany Private Limited. Our responsibility is to express an opinion on these financial statements based on our audit.
We conducted our audit in accordance with auditing standards generally accepted in India. Those standards require that we plan and perform the audit to obtainreasonable assurance about whether the financial statements are free of material misstatement. An audit includes examining, on a test basis, evidence supportingthe amounts and disclosures in the financial statements. An audit also includes assessing the accounting principles used and significant estimates made bymanagement, as well as evaluating the overall financial statement presentation. We believe that our audit provides a reasonable basis for our opinion.
We report thereon as follows:
• We have obtained all the information and explanations, which, to the best of our knowledge and belief, were necessary for the purpose of the audit; and
• The Balance Sheet and the related Revenue Account dealt with by this report are in agreement with the books of account of the Scheme.
• In our opinion and to the best of our information and according to the explanations given to us;
- the Balance Sheet as at 31 March 2006 and the related Revenue Account for the period ended on that date, together with the notes thereon, have beenprepared in accordance with the accounting policies and standards specified in the Ninth Schedule of the Securities and Exchange Board of India (MutualFunds) Regulations, 1996 and amendments thereto, as applicable;
- The Balance Sheet as at 31 March 2006 and the related Revenue Account for the period ended on that date, together with the notes thereon, give theinformation required by the Securities and Exchange Board of India (Mutual Funds) Regulations, 1996 and amendments thereto, as applicable, and givea true and fair view:
- In so far as it relates to the Balance Sheet, of the state of affairs of the Scheme as at 31 March 2006; and
- In so far as it relates to the Revenue Account, of the surplus for the period ended on that date.
• In our opinion and to the best of our information and according to the explanations given to us, the methods used to value non-traded/thinly traded securitiesin good faith are fair and reasonable.
For BSR & Co.Chartered Accountants
Akeel MasterPartner
Membership No.: 046768
MumbaiDate: August 2, 2006
AUDITORS’ REPORT

10
EQUITY SCHEMES
Balance Sheet as at March 31, 2006
(Currency: Indian Rupee)
Schedules SCCEF SCPEF SCIEF
LIABILITIES
Unit capital 3 5,543,436,910 2,414,969,962 4,226,025,928
Reserves and surplus 4 2,339,489,902 684,417,832 267,393,282
Current liabilities and provisions 5 525,141,204 82,675,167 219,781,778
8,408,068,016 3,182,062,961 4,713,200,988
ASSETS
Investments 6 7,751,245,320 3,055,135,491 4,311,585,832
Current assets 7 598,209,727 126,927,470 223,192,374
Deferred Revenue Expenditure 10 58,612,969 - 178,422,782
(to the extent not written off)
8,408,068,016 3,182,062,961 4,713,200,988
Net Asset Value per unit
Growth Option 14.22 12.84 10.63
Dividend Option 14.22 12.84 10.63
Significant accounting policies 2
Notes to Accounts 11
The schedules referred to above form an integral part of the Balance Sheet.
As per our report attached of even date.
For BSR & Co. For Standard Chartered Asset For Standard Chartered Trustee
Chartered Accountants Management Company Private Limited Company Private Limited
Akeel Master Paul Jebson Naval Bir Kumar Rajiv Anand
Partner Chairman Managing Director Head-Investments Chairman / Director Director
Membership No. 046768
Place : Mumbai
Date : August 2, 2006
11
ANNUAL REPORT 2006
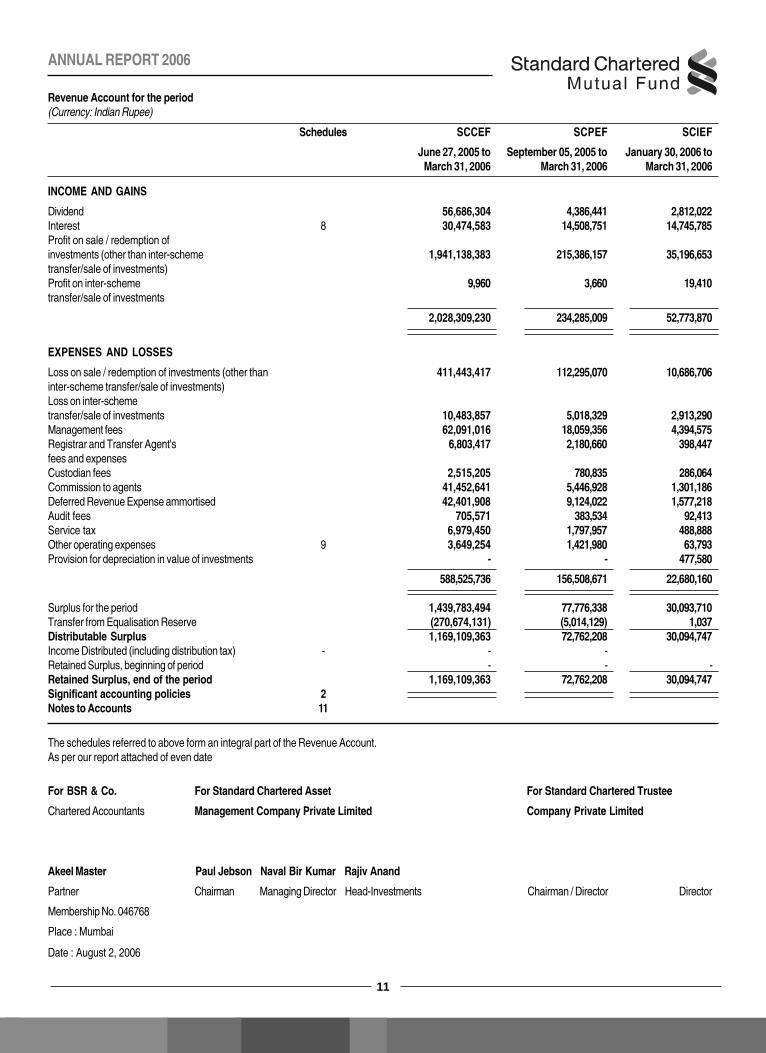
Revenue Account for the period(Currency: Indian Rupee)
Schedules SCCEF SCPEF SCIEF
June 27, 2005 to September 05, 2005 to January 30, 2006 toMarch 31, 2006 March 31, 2006 March 31, 2006
INCOME AND GAINS
Dividend 56,686,304 4,386,441 2,812,022Interest 8 30,474,583 14,508,751 14,745,785Profit on sale / redemption ofinvestments (other than inter-scheme 1,941,138,383 215,386,157 35,196,653transfer/sale of investments)Profit on inter-scheme 9,960 3,660 19,410transfer/sale of investments
2,028,309,230 234,285,009 52,773,870
EXPENSES AND LOSSES
Loss on sale / redemption of investments (other than 411,443,417 112,295,070 10,686,706inter-scheme transfer/sale of investments)Loss on inter-schemetransfer/sale of investments 10,483,857 5,018,329 2,913,290Management fees 62,091,016 18,059,356 4,394,575Registrar and Transfer Agent's 6,803,417 2,180,660 398,447fees and expensesCustodian fees 2,515,205 780,835 286,064Commission to agents 41,452,641 5,446,928 1,301,186Deferred Revenue Expense ammortised 42,401,908 9,124,022 1,577,218Audit fees 705,571 383,534 92,413Service tax 6,979,450 1,797,957 488,888Other operating expenses 9 3,649,254 1,421,980 63,793Provision for depreciation in value of investments - - 477,580
588,525,736 156,508,671 22,680,160
Surplus for the period 1,439,783,494 77,776,338 30,093,710Transfer from Equalisation Reserve (270,674,131) (5,014,129) 1,037Distributable Surplus 1,169,109,363 72,762,208 30,094,747Income Distributed (including distribution tax) - - -Retained Surplus, beginning of period - - -Retained Surplus, end of the period 1,169,109,363 72,762,208 30,094,747Significant accounting policies 2Notes to Accounts 11
The schedules referred to above form an integral part of the Revenue Account.As per our report attached of even date
For BSR & Co. For Standard Chartered Asset For Standard Chartered Trustee
Chartered Accountants Management Company Private Limited Company Private Limited
Akeel Master Paul Jebson Naval Bir Kumar Rajiv Anand
Partner Chairman Managing Director Head-Investments Chairman / Director Director
Membership No. 046768
Place : Mumbai
Date : August 2, 2006

12
EQUITY SCHEMES
Cash Flow Statement for the year ended March 31, 2006
(Currency: Indian Rupee)
August 9, 2005 to March 31, 2006
A. Cashflow from Operating Activity
Surplus as per revenue account 1,439,783,494
Adjustments for :
Depreciation / (Provision for depreciation written back) in value of investments -
Operating Surplus Before Working Capital Changes 1,439,783,494
Adjustments for :
(Increase)/Decrease in Other Current Assets (563,443,505)
(Increase)/Decrease in Money Market Lending (Deposits) -
(Increase)/Decrease in Investments (6,098,531,665)
Increase/(Decrease) in Deferred Revenue Expenditure (58,612,969)
Increase/(Decrease) in Current Liabilities and Provisions 512,305,089
Net Cash Generated / (Used in) Operations (A) (4,768,499,556)
B. Cashflow from Financing Activities
Increase/(Decrease) in Unit Capital 5,543,436,910
Increase/(Decrease) in Redemption Amount Payable 12,836,115
(Increase)/Decrease in Switch in receivable (1,221,483)
Increase/(Decrease) in Unit Premium Reserve (including Equalisation Reserve) (753,007,247)
Dividend paid during the year (including dividend tax paid) -
Net Cash Generated / (Used in) Financing Activities (B) 4,802,044,295
Net Increase/(Decrease) in Cash and Cash Equivalents (A+B) 33,544,739
Cash and Cash Equivalents as at the beginning of the year -
Cash and Cash Equivalents as at the end of the year (Balance with Schedule Banks) 33,544,739
Net Increase/(Decrease) in Cash and Cash Equivalents 33,544,739

13
ANNUAL REPORT 2006
1. Background
Standard Chartered Mutual Fund (‘the Fund’) is sponsored by Standard CharteredBank, U.K. (‘SCB’) and is constituted as a Trust under the Indian Trust Act,1882 with Standard Chartered Trustee Company Private Limited (‘the Trustee’)as trustee. In accordance with the Securities and Exchange Board of India(SEBI) (Mutual Funds) Regulations, 1996 (‘the Regulations’) and amendmentsthereto as applicable the Trustees have entrusted the investment managementfunction to Standard Chartered Asset Management Company Private Limited(‘the AMC’).
Standard Chartered Classic Equity Fund
Standard Chartered Classic Equity Fund (‘SCCEF’) is an open-ended equityscheme launched on June 27, 2005. As stated in the offer document, thescheme is designed to generate long term capital growth from a diversifiedportfolio of predominantly equity and equity related instruments. There are twoinvestment options in the scheme viz. Dividend and Growth Option. Under theDividend Option reinvestment facility is available.
Standard Chartered Premier Equity Fund
Standard Chartered Premier Equity Fund (‘SCPEF’) is an open-ended equityscheme launched on September 05, 2005. As stated in the offer document, thescheme is designed to generate long-term capital growth from an activelymanaged portfolio of predominantly equity and equity related instruments. TheScheme invests in small and medium size businesses with good long termpotential. There are two investment options in the scheme viz. Dividend andGrowth Option. Under the Dividend Option reinvestment facility is available.
Standard Chartered Imperial Equity Fund
Standard Chartered Imperial Equity Fund (‘SCIEF’) is an open-ended equityscheme launched on January 30, 2006. As stated in the offer document, thescheme is designed to capital appreciation and/or provide income distribution froma portfolio of predominantly equity and equity related instruments. There are twoinvestment options in the scheme viz. Dividend and Growth Option. Under theDividend Option reinvestment facility is available.
2. Significant accounting policies
2.1 Basis of preparation of financial statements
The financial statements are prepared and presented under the historical costconvention, as modified for investments which are ‘marked-to-market’, on theaccrual basis of accounting and in accordance with the accounting policies andstandards specified in the Ninth Schedule of the Regulations and amendmentsthereto, and the accounting standards issued by the Institute of CharteredAccountants of India.
2.2 Use of estimates
The preparation of financial statements in conformity with generally acceptedaccounting principles (‘GAAP’) requires management to make estimates andassumptions that affect the reported amounts of assets and liabilities and thedisclosure of contingent liabilities as at the date of financial statements. Theestimates and the assumptions used in accompanying financial statements arebased upon managements evaluation of relevant facts and circumstances as atthe date of financial statements. Actual results could differ from those estimatesand assumptions used in preparing financial statements. Any revision toaccounting estimates is recognized prospectively in the current and futureperiods.
2.3 Investments
Basis of accounting
• Transactions for purchase and sale of investments are recorded on tradedate. Cost of investments includes brokerage. Any front end-discount onprivately placed investments is reduced from the cost of such investments.
• Bonus entitlements are recognised as investments on the ‘ex- bonusdate’. Rights entitlements are recognised as investments on the ‘ex-rightsdate’.
• Broken period interest paid/received is debited/credited to Interest Receivableaccount and is not included in the cost of purchase/sale value.
• Inter scheme purchase/sale of securities are recorded at prevailing marketrates.
Valuation
• Investments for the purpose of valuation are classified as traded and nontraded in accordance with the provisions of the Regulations.
• Equity securities awaiting listing are valued at the price at which they havebeen allotted.
• Investments are stated at market/fair value as follows:
Traded equity securities
Traded equity securities are valued at the last quoted price on the NationalStock Exchange of India Limited (NSE). However, if the securities are not listedon the NSE, the securities are valued at the price quoted at the exchange whereit is principally traded. When on a particular valuation day, a security has notbeen traded on NSE but has been traded on another stock exchange, the valueat which it is traded on that stock exchange is used provided it is not more thanthirty days to the valuation date.
Traded debt securities
Government securities
• Government securities are valued at prices obtained from Credit RatingInformation Services of India Limited (‘CRISIL’) in accordance with theguidance note for valuation of securities for Mutual Fund issued by SEBI.
Other traded debt securities
• Traded debt securities (other than Government securities) with residualmaturity over 182 days are valued at the last quoted closing price on theNational Stock Exchange (the ‘NSE’) as on the date of valuation or thelast quoted closing price on the principal exchange on which the securityis traded on the date of valuation, where on the particular valuation day asecurity is not quoted on the NSE.
• Traded debt securities (other than Government Securities) with a residualmaturity over 182 days, but which have not been traded on the date ofvaluation are valued on the same basis as that of a non-traded debtsecurity with residual maturity over 182 days.
• All traded debt securities (other than Government securities) with aresidual maturity upto 182 days are valued on same basis as moneymarket instruments.
Non-traded/ thinly traded debt securities
• Non traded debt securities (other than Government Securities) aresecurities that are not traded on any stock exchange for a period of
Schedules to the financial statements for the period ended March 31, 2006(Currency: Indian Rupee)

14
EQUITY SCHEMES
fifteen days prior to the valuation date.
• Non traded/thinly traded debt securities with residual maturity of over 182days to maturity are being valued as per CRISIL Bond Valuer (‘CBV’)from the day on which the security is not traded. These are valued “in goodfaith” by the AMC as per procedures approved by the Trustees and on thebasis of the valuation principles laid down by the Regulations.
• Non traded securities purchased with residual maturity upto 182 daysare valued at cost / last valuation price (including accrued interest tillthe beginning of the day) plus the difference between the redemptionvalue (inclusive of interest) and cost / last valuation price, spreaduniformly over the remaining maturity period of the instrument.
Debt securities with put/call options
• Securities with call option are valued at the lower of the value asobtained by valuing the security to final maturity and valuing thesecurity to call option. In case there are multiple call options, thelowest value obtained by valuing to the various call dates and valuingto the maturity date is taken as the value of the instrument.
• Securities with put option are valued at the higher of the value asobtained by valuing the security to final maturity and valuing thesecurity to put option. In case there are multiple put options, thehighest value obtained by valuing to the various put dates and valuingto the maturity date is taken as the value of the instruments.
• The securities with both Put and Call option on the same day would bedeemed to mature on the Put/Call day and would be valued accordingly.
Money Market Instruments
• Traded money market securities are valued at the yield they weretraded as on the valuation date. In case these securities are nottraded, they are valued at the last traded price plus accretion ofdifference between the redemption value and the last traded price.
Repos
• Instruments bought on ‘repo’ basis are valued at the resale price afterdeduction of applicable interest upto date of resale.
Collateralized Borrowings and Lending Obligation (CBLO)
• CBLOs are valued at cost/last valuation price (including accruedinterest till the beginning of the day) plus the difference between theredemption value (inclusive of interest) and cost / last valuation price,spread uniformly over the remaining maturity period of the instrument.
Asset backed securities
• Asset backed securities with a residual maturity over 182 days andhaving variable cash flows are valued on the same basis as that fornon traded securities with residual maturity over 182 days.
• Asset backed securities with a residual maturity upto 182 days andhaving variable cash flows are valued on the basis of amortization, thelast valued yield being the base for amortization.
In accordance with the Guidance Note on Accounting for Investments in theFinancial Statements of Mutual funds issued by the Institute of CharteredAccountants of India, pursuant to the Eleventh Schedule of the Regulations, thenet unrealized gain or loss in the value of investments is determined separately foreach category of investments. The loss on investments sold or transferred during
the period or year is charged to the revenue account instead of being first adjustedagainst the provision for depreciation, if already created in the previous year, asrecommended by the Guidance note. The unrealised loss/gain is reversed on thefirst day of the immediately succeeding financial year. However, this departurefrom the Guidance note does not have any net impact on the Scheme’s netassets and the financial statements of the Scheme.
2.4 Revenue recognition
Dividend income is recognized on ex-dividend date. Interest income isrecorded on an accrual basis.
Profit or loss on sale / redemption of investments represents sale proceedsless weighted average cost and is recognised on a trade date basis.
In accordance with the Guidance note on accounting for investments in thefinancial statements of Mutual Funds issued by the Institute of CharteredAccountants of India, appreciation/depreciation in value of securities iscomputed category wise, wherein the cost is compared with the market/fair value and the resultant appreciation is credited to Unrealized AppreciationReserve and any depreciation is charged to the Revenue account.
2.5 Computation of Net Asset Value (NAV)
The NAV of the units of each of the various schemes is computedseparately for units issued under the various options of the relevant plans,although the corresponding scheme’s investments and other net assetsare managed as a single portfolio. For computing the NAV for variousplans/options, daily income earned, including realised and unrealised gainsor losses in the value of investments and expenses incurred by thecorresponding scheme are allocated to the plans/sub-plans/options inproportion to the net assets of each plans/sub-plan/options.
2.6 Dividend distribution
Dividend distributed on units is recognised on the date of declaration ofdividend.
2.7 Unit premium reserve
When units are issued or redeemed, the net premium or discount to theface value is transferred to the unit premium reserve, after an appropriateportion of the issue proceeds and redemption payout is credited or debitedrespectively to the equalisation reserve. The unit premium reserve isavailable for dividend distribution except to the extent it is represented byunrealised net appreciation in investments.
2.8 Equalisation reserve
The net distributable income (after providing for the net unrealiseddepreciation in the value of investments) relating to units issued/redeemedis transferred to equalisation reserve for determining the net surplus/deficit, from unit premium reserve.
2.9 Load charges
Load collected is retained under a separate account in the Scheme and isused to meet the selling and distribution expenses of the Scheme.
2.10 Deferred Revenue Expenditure
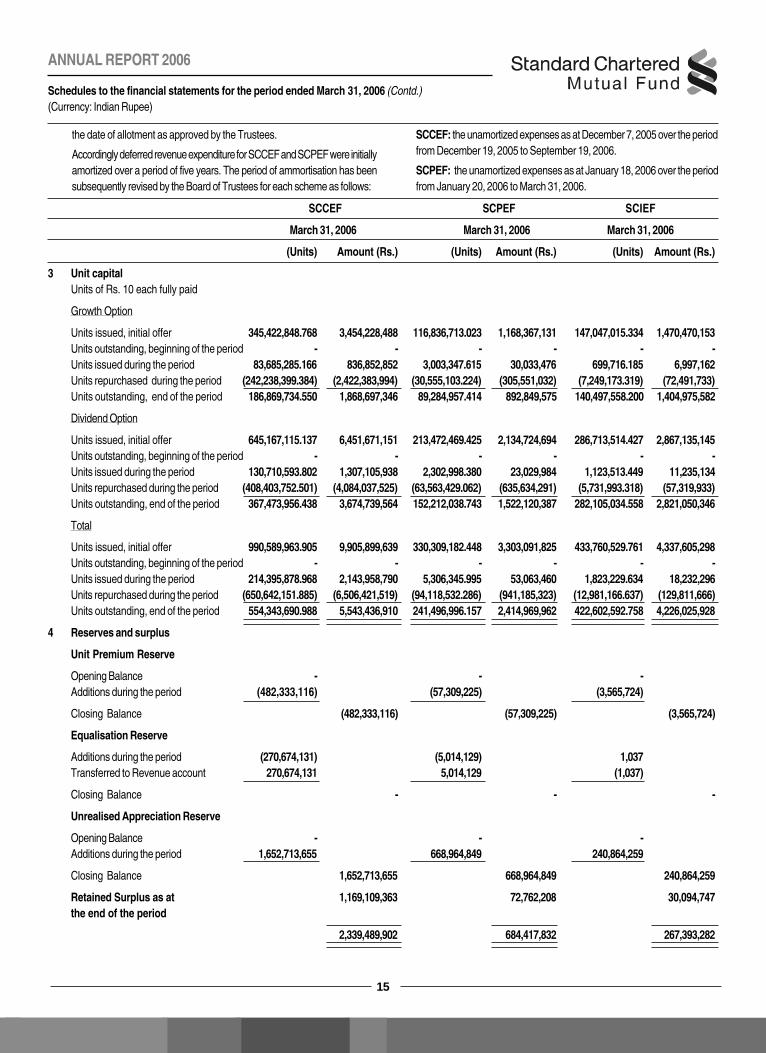
Initial issue expenses are charged to SCCEF, SCPEF and SCIEF inaccordance with the offer document and within the limits specified by SEBI.These expenses are considered as deferred revenue expenditure and areamortized over a period not exceeding five years or such shorter period from
Schedules to the financial statements for the period ended March 31, 2006 (Contd.)(Currency: Indian Rupee)
15
ANNUAL REPORT 2006
the date of allotment as approved by the Trustees.
Accordingly deferred revenue expenditure for SCCEF and SCPEF were initiallyamortized over a period of five years. The period of ammortisation has beensubsequently revised by the Board of Trustees for each scheme as follows:
SCCEF: the unamortized expenses as at December 7, 2005 over the periodfrom December 19, 2005 to September 19, 2006.
SCPEF: the unamortized expenses as at January 18, 2006 over the periodfrom January 20, 2006 to March 31, 2006.
SCCEF SCPEF SCIEF
March 31, 2006 March 31, 2006 March 31, 2006
(Units) Amount (Rs.) (Units) Amount (Rs.) (Units) Amount (Rs.)
3 Unit capitalUnits of Rs. 10 each fully paid
Growth Option
Units issued, initial offer 345,422,848.768 3,454,228,488 116,836,713.023 1,168,367,131 147,047,015.334 1,470,470,153Units outstanding, beginning of the period - - - - - -Units issued during the period 83,685,285.166 836,852,852 3,003,347.615 30,033,476 699,716.185 6,997,162Units repurchased during the period (242,238,399.384) (2,422,383,994) (30,555,103.224) (305,551,032) (7,249,173.319) (72,491,733)Units outstanding, end of the period 186,869,734.550 1,868,697,346 89,284,957.414 892,849,575 140,497,558.200 1,404,975,582
Dividend Option
Units issued, initial offer 645,167,115.137 6,451,671,151 213,472,469.425 2,134,724,694 286,713,514.427 2,867,135,145Units outstanding, beginning of the period - - - - - -Units issued during the period 130,710,593.802 1,307,105,938 2,302,998.380 23,029,984 1,123,513.449 11,235,134Units repurchased during the period (408,403,752.501) (4,084,037,525) (63,563,429.062) (635,634,291) (5,731,993.318) (57,319,933)Units outstanding, end of the period 367,473,956.438 3,674,739,564 152,212,038.743 1,522,120,387 282,105,034.558 2,821,050,346
Total
Units issued, initial offer 990,589,963.905 9,905,899,639 330,309,182.448 3,303,091,825 433,760,529.761 4,337,605,298Units outstanding, beginning of the period - - - - - -Units issued during the period 214,395,878.968 2,143,958,790 5,306,345.995 53,063,460 1,823,229.634 18,232,296Units repurchased during the period (650,642,151.885) (6,506,421,519) (94,118,532.286) (941,185,323) (12,981,166.637) (129,811,666)Units outstanding, end of the period 554,343,690.988 5,543,436,910 241,496,996.157 2,414,969,962 422,602,592.758 4,226,025,928
4 Reserves and surplus
Unit Premium Reserve
Opening Balance - - -Additions during the period (482,333,116) (57,309,225) (3,565,724)
Closing Balance (482,333,116) (57,309,225) (3,565,724)
Equalisation Reserve
Additions during the period (270,674,131) (5,014,129) 1,037Transferred to Revenue account 270,674,131 5,014,129 (1,037)
Closing Balance - - -
Unrealised Appreciation Reserve
Opening Balance - - -Additions during the period 1,652,713,655 668,964,849 240,864,259
Closing Balance 1,652,713,655 668,964,849 240,864,259
Retained Surplus as at 1,169,109,363 72,762,208 30,094,747the end of the period
2,339,489,902 684,417,832 267,393,282
Schedules to the financial statements for the period ended March 31, 2006 (Contd.)(Currency: Indian Rupee)
16
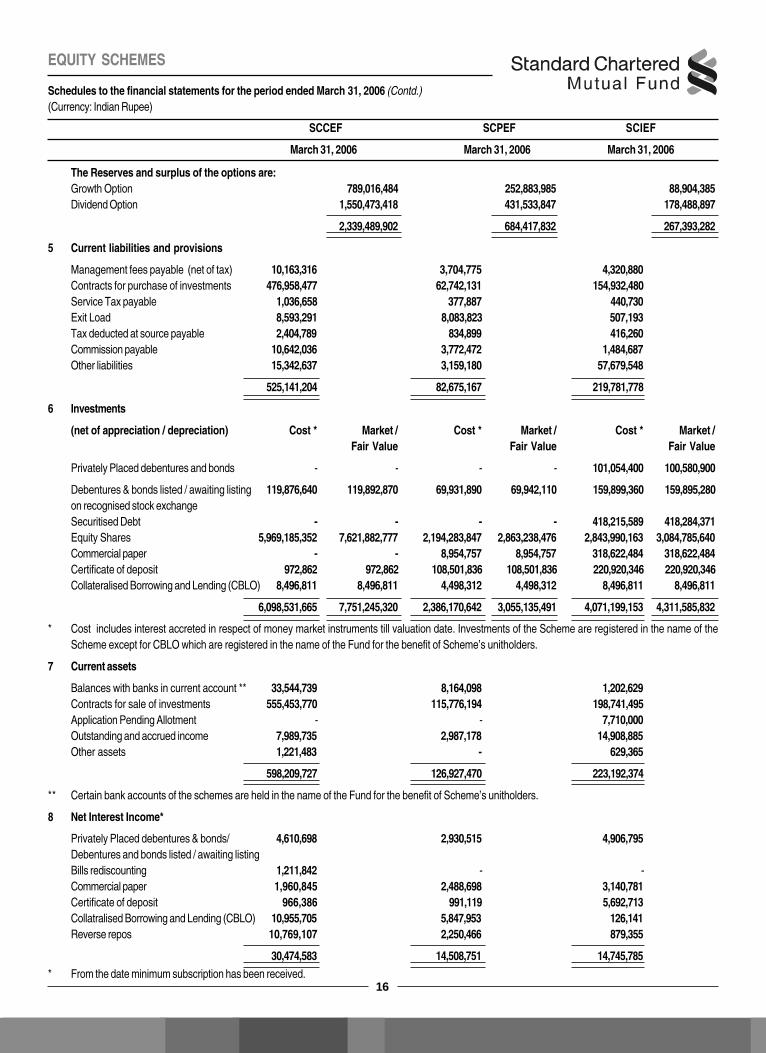
EQUITY SCHEMES
The Reserves and surplus of the options are:Growth Option 789,016,484 252,883,985 88,904,385Dividend Option 1,550,473,418 431,533,847 178,488,897
2,339,489,902 684,417,832 267,393,282
5 Current liabilities and provisions
Management fees payable (net of tax) 10,163,316 3,704,775 4,320,880Contracts for purchase of investments 476,958,477 62,742,131 154,932,480Service Tax payable 1,036,658 377,887 440,730Exit Load 8,593,291 8,083,823 507,193Tax deducted at source payable 2,404,789 834,899 416,260Commission payable 10,642,036 3,772,472 1,484,687Other liabilities 15,342,637 3,159,180 57,679,548
525,141,204 82,675,167 219,781,778
6 Investments
(net of appreciation / depreciation) Cost * Market / Cost * Market / Cost * Market /Fair Value Fair Value Fair Value
Privately Placed debentures and bonds - - - - 101,054,400 100,580,900
Debentures & bonds listed / awaiting listing 119,876,640 119,892,870 69,931,890 69,942,110 159,899,360 159,895,280on recognised stock exchangeSecuritised Debt - - - - 418,215,589 418,284,371Equity Shares 5,969,185,352 7,621,882,777 2,194,283,847 2,863,238,476 2,843,990,163 3,084,785,640Commercial paper - - 8,954,757 8,954,757 318,622,484 318,622,484Certificate of deposit 972,862 972,862 108,501,836 108,501,836 220,920,346 220,920,346Collateralised Borrowing and Lending (CBLO) 8,496,811 8,496,811 4,498,312 4,498,312 8,496,811 8,496,811
6,098,531,665 7,751,245,320 2,386,170,642 3,055,135,491 4,071,199,153 4,311,585,832
* Cost includes interest accreted in respect of money market instruments till valuation date. Investments of the Scheme are registered in the name of theScheme except for CBLO which are registered in the name of the Fund for the benefit of Scheme’s unitholders.
7 Current assets
Balances with banks in current account ** 33,544,739 8,164,098 1,202,629Contracts for sale of investments 555,453,770 115,776,194 198,741,495Application Pending Allotment - - 7,710,000Outstanding and accrued income 7,989,735 2,987,178 14,908,885Other assets 1,221,483 - 629,365
598,209,727 126,927,470 223,192,374
** Certain bank accounts of the schemes are held in the name of the Fund for the benefit of Scheme’s unitholders.
8 Net Interest Income*
Privately Placed debentures & bonds/ 4,610,698 2,930,515 4,906,795Debentures and bonds listed / awaiting listingBills rediscounting 1,211,842 - -Commercial paper 1,960,845 2,488,698 3,140,781Certificate of deposit 966,386 991,119 5,692,713Collatralised Borrowing and Lending (CBLO) 10,955,705 5,847,953 126,141Reverse repos 10,769,107 2,250,466 879,355
30,474,583 14,508,751 14,745,785* From the date minimum subscription has been received.
SCCEF SCPEF SCIEF
March 31, 2006 March 31, 2006 March 31, 2006
Schedules to the financial statements for the period ended March 31, 2006 (Contd.)(Currency: Indian Rupee)
17
ANNUAL REPORT 2006
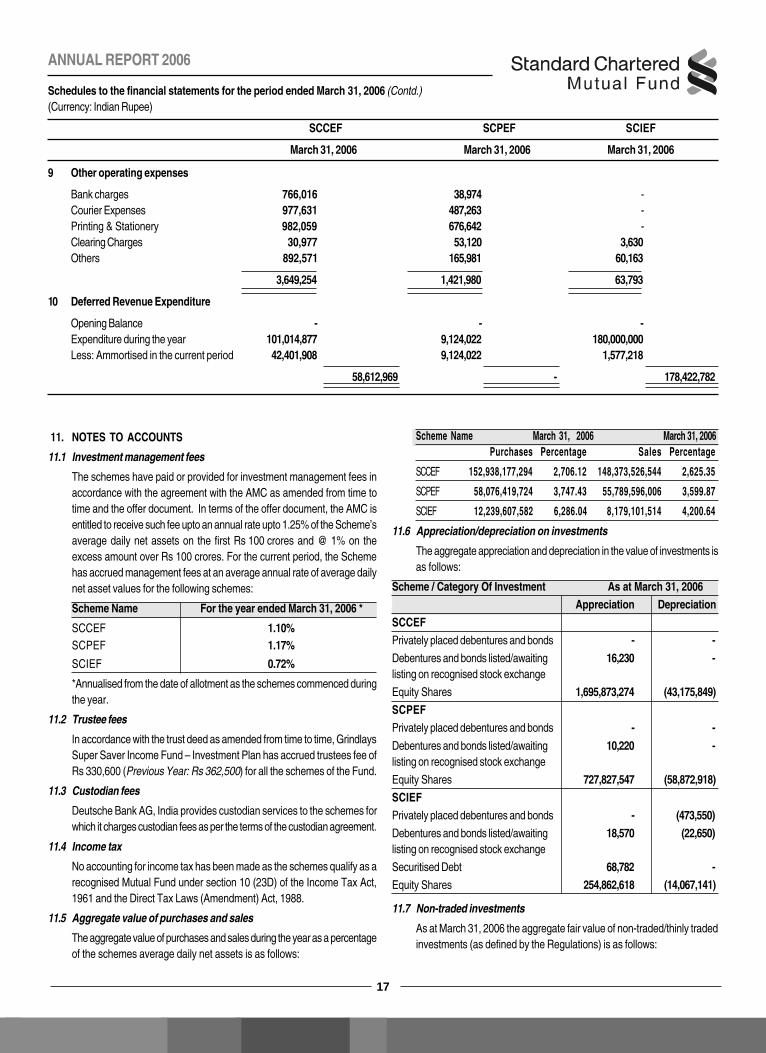
9 Other operating expenses
Bank charges 766,016 38,974 -Courier Expenses 977,631 487,263 -Printing & Stationery 982,059 676,642 -Clearing Charges 30,977 53,120 3,630Others 892,571 165,981 60,163
3,649,254 1,421,980 63,793
10 Deferred Revenue Expenditure
Opening Balance - - -Expenditure during the year 101,014,877 9,124,022 180,000,000Less: Ammortised in the current period 42,401,908 9,124,022 1,577,218
58,612,969 - 178,422,782
11. NOTES TO ACCOUNTS
11.1 Investment management fees
The schemes have paid or provided for investment management fees inaccordance with the agreement with the AMC as amended from time totime and the offer document. In terms of the offer document, the AMC isentitled to receive such fee upto an annual rate upto 1.25% of the Scheme’saverage daily net assets on the first Rs 100 crores and @ 1% on theexcess amount over Rs 100 crores. For the current period, the Schemehas accrued management fees at an average annual rate of average dailynet asset values for the following schemes:
Scheme Name For the year ended March 31, 2006 *
SCCEF 1.10%SCPEF 1.17%
SCIEF 0.72%
*Annualised from the date of allotment as the schemes commenced duringthe year.
11.2 Trustee fees
In accordance with the trust deed as amended from time to time, GrindlaysSuper Saver Income Fund – Investment Plan has accrued trustees fee ofRs 330,600 (Previous Year: Rs 362,500) for all the schemes of the Fund.
11.3 Custodian fees
Deutsche Bank AG, India provides custodian services to the schemes forwhich it charges custodian fees as per the terms of the custodian agreement.
11.4 Income tax
No accounting for income tax has been made as the schemes qualify as arecognised Mutual Fund under section 10 (23D) of the Income Tax Act,1961 and the Direct Tax Laws (Amendment) Act, 1988.
11.5 Aggregate value of purchases and sales
The aggregate value of purchases and sales during the year as a percentageof the schemes average daily net assets is as follows:
Scheme Name March 31, 2006 March 31, 2006Purchases Percentage Sales Percentage
SCCEF 152,938,177,294 2,706.12 148,373,526,544 2,625.35
SCPEF 58,076,419,724 3,747.43 55,789,596,006 3,599.87
SCIEF 12,239,607,582 6,286.04 8,179,101,514 4,200.64
11.6 Appreciation/depreciation on investments
The aggregate appreciation and depreciation in the value of investments isas follows:
Scheme / Category Of Investment As at March 31, 2006Appreciation Depreciation
SCCEFPrivately placed debentures and bonds - -Debentures and bonds listed/awaiting 16,230 -listing on recognised stock exchange
Equity Shares 1,695,873,274 (43,175,849)SCPEFPrivately placed debentures and bonds - -
Debentures and bonds listed/awaiting 10,220 -listing on recognised stock exchange
Equity Shares 727,827,547 (58,872,918)SCIEFPrivately placed debentures and bonds - (473,550)Debentures and bonds listed/awaiting 18,570 (22,650)listing on recognised stock exchange
Securitised Debt 68,782 -Equity Shares 254,862,618 (14,067,141)
11.7 Non-traded investments
As at March 31, 2006 the aggregate fair value of non-traded/thinly tradedinvestments (as defined by the Regulations) is as follows:
SCCEF SCPEF SCIEF
March 31, 2006 March 31, 2006 March 31, 2006
Schedules to the financial statements for the period ended March 31, 2006 (Contd.)(Currency: Indian Rupee)

18
EQUITY SCHEMES
Scheme Name March 31, 2006
SCCEF 129,362,543SCPEF 191,897,015SCIEF 1,226,800,193
11.8 Income and expenditure
The total income (net of loss on sale of investments and net change inunrealised depreciation in value of investments) and expenditure and theseamounts as a percentage of the Scheme’s average daily net assets:
Scheme Name Expenditure * Income *
March 31, 2006 March 31, 2006
Amount Percentage Amount Percentage
SCCEF 124,196,554 2.20 1,606,381,956 28.42
SCPEF 30,071,250 1.94 116,971,610 7.55
SCIEF 7,025,366 2.07 38,696,294 19.87
*Annualised from the date of allotment as the schemes commenced duringthe year. Income represents income from the date when minimumsubscription achieved and expenditure represents expenses from the dateof allotment.
11.9 Segment reporting
The schemes are a part of the Mutual Fund, which have been incorporatedas a trust and is exclusively engaged in raising monies through the sale ofunits to the public for investing in securities. This business is consideredto constitute one single primary segment in the context of AccountingStandard 17 on Segmental Reporting issued by the Institute of CharteredAccountants of India. There are no geographical reportable segments sincethe Fund provides investment management services to customers in theIndian market only and does not distinguish any reportable regions withinIndia.
11.10Disclosure under regulation 25 (8) of SEBI Regulations
a) Commission and charges incurred on security transactions with sponsor orany of its associates as defined in the regulation 25(8):
Standard Chartered Bank, India branches is an associate of StandardChartered Bank UK, the sponsor of the trust.
Scheme Name Commission Paid / Payable toStandard Chartered Bank, India branches
March 31, 2006
Amount *
SCCEF 92,045,555
SCPEF 19,015,463
SCIEF 50,399,781
* The above amounts includes Rs.76,490,745 in SCCEF, Rs.17,180,354 inSCPEF and Rs.49,872,140 in SCIEF paid towards collections in the NewFund Offer and these have been adjusted against load collected or is beingamortized as stated in the offer document.
b) There are no investments made by the schemes during the period in issueslead managed by Standard Chartered Bank - India Branches:
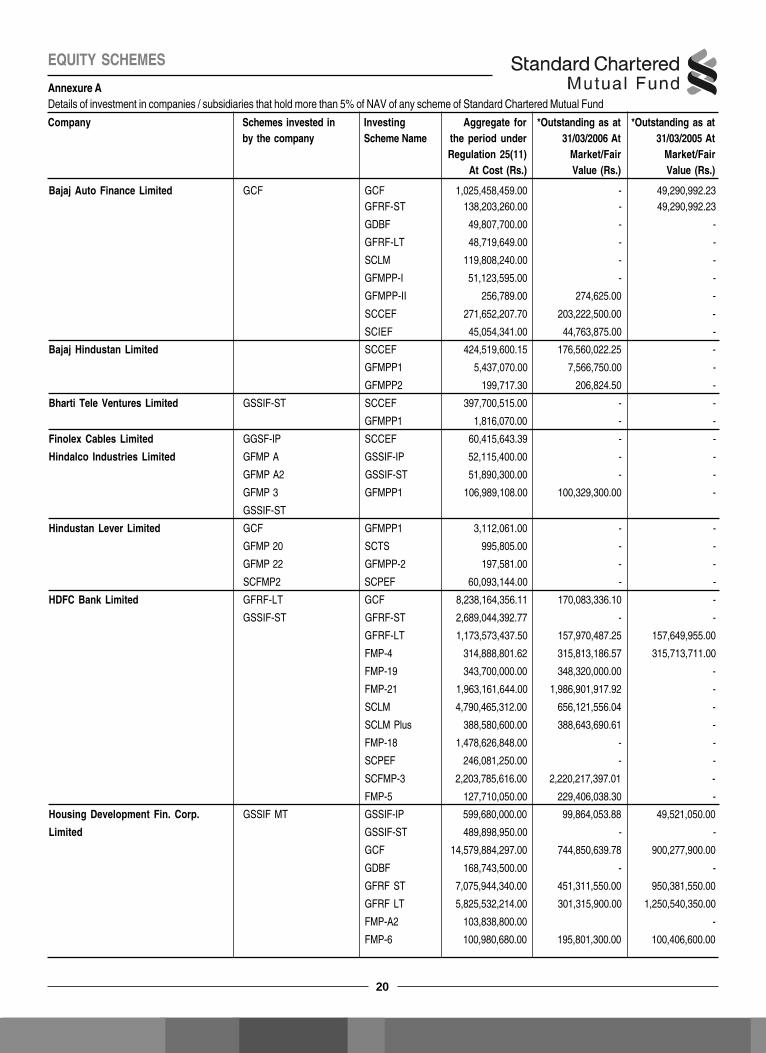
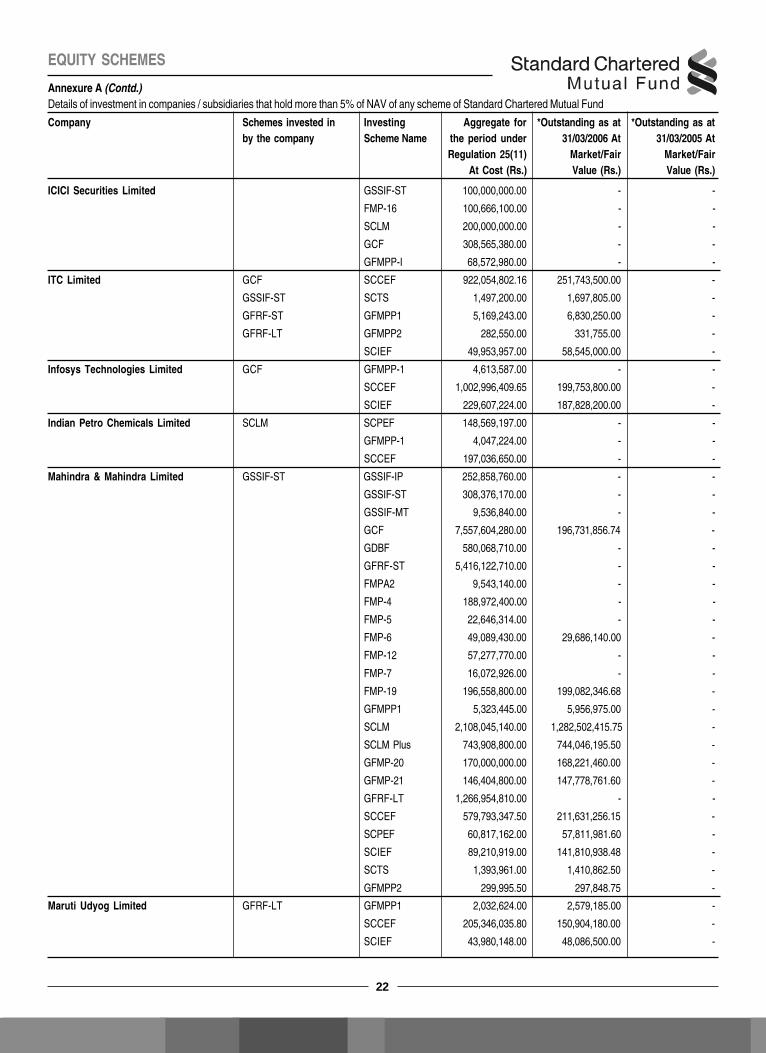
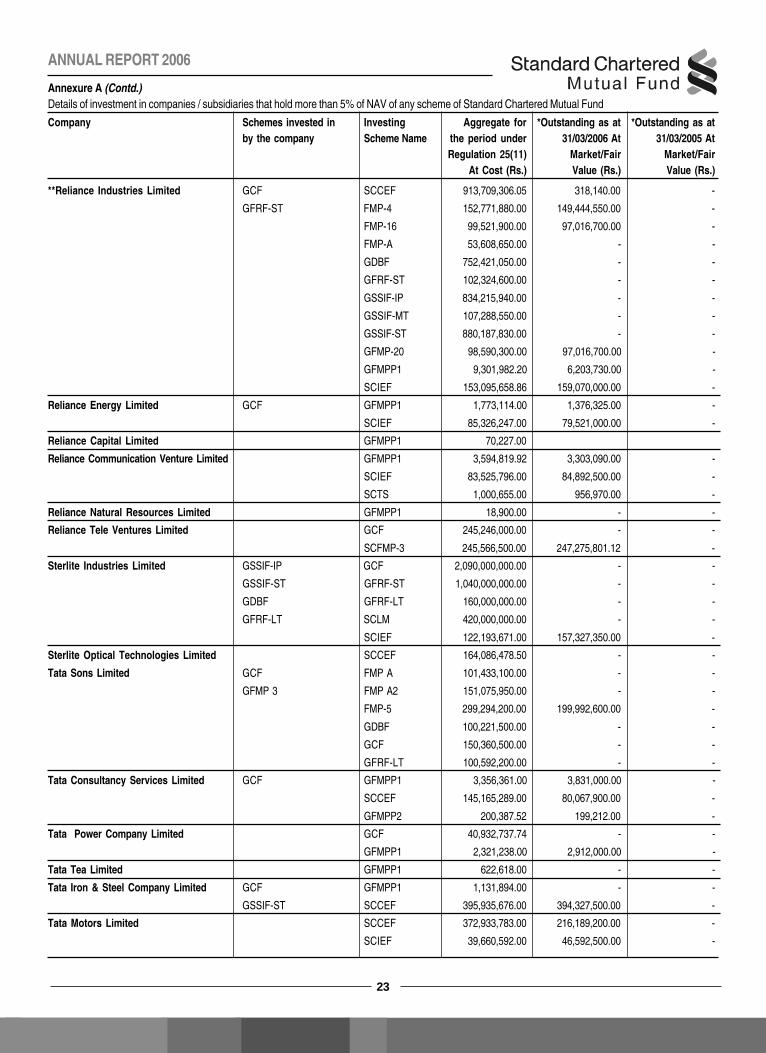
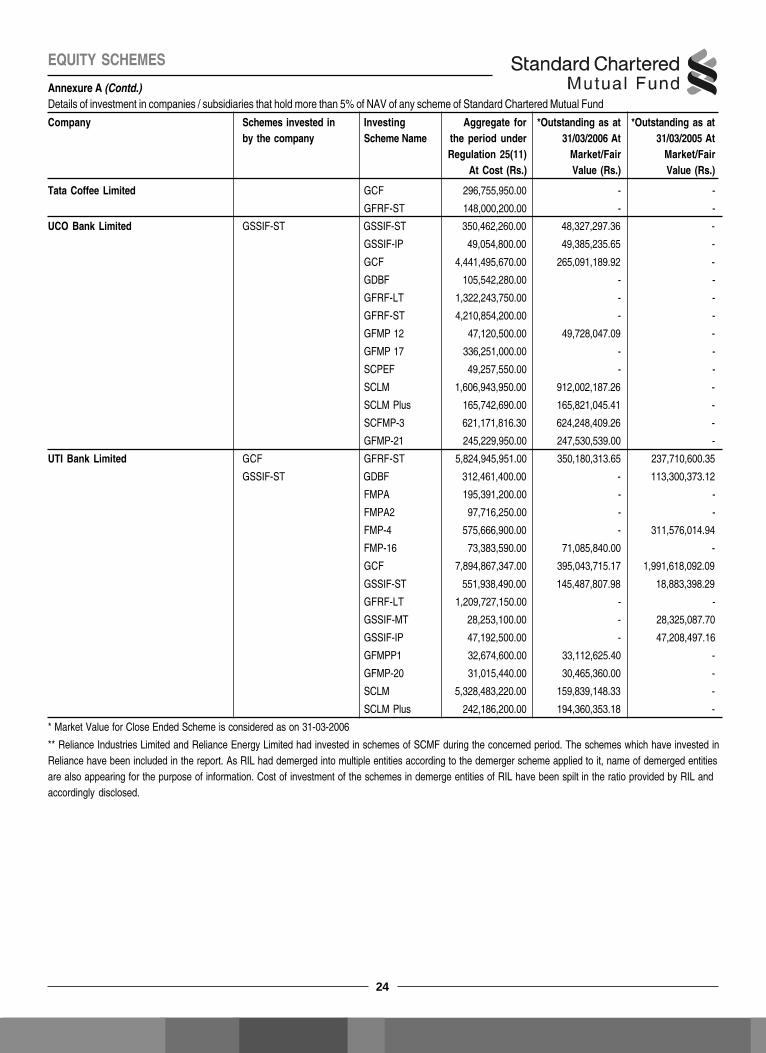
11.11Details of investment in companies that hold more than 5% of NAVof any scheme of Standard Chartered Mutual Fund:
Refer Annexure A
11.12Details of large holdings
Details of unit holdings over 25% of the net assets as on March 31, 2006is Nil
11.13Portfolio holding (market / fair value) as at March 31, 2006:
Refer Annexure B
All investments, except for mutual fund units, are held in safe custody withDeutsche Bank AG, India /Reserve Bank of India.
11.14Unpaid redemption and unclaimed dividend
The details of unpaid redemption as at March 31, 2006 are Nil. No Dividendhas been declared by the schemes during the current period.
11.15Historical Per Unit Statistics: Refer Annexure C
11.16 Related party disclosures in accordance with Accounting Standard18 issued by the Institute of Chartered Accountants of India:
Entities under common control
Standard Chartered Plc.Standard Chartered Bank (UK)Standard Chartered Bank - India branches (SCB)Standard Chartered Trustee Company Private Limited (Trustee Company)Grindlays Super Saver Income Fund - Investment Plan (GSSIF - IP)Grindlays Super Saver Income Fund - Short Term Plan (GSSIF - ST)Grindlays Super Saver Income Fund - Medium Term Plan (GSSIF - MT)Grindlays Dynamic Bond Fund (GDBF)Grindlays Government Securities Fund - Investment Plan (GGSF - IP)Grindlays Government Securities Fund - Short Term Plan (GGSF - ST)Grindlays Government Securities Fund - Provident Fund Plan (GGSF - PF)Grindlays Floating Rate Fund - Short Term Plan (GFRF - ST)Grindlays Floating Rate Fund - Long Term Plan (GFRF - LT)Standard Chartered All Seasons Bond Fund (ASBF)Standard Chartered Classic Equity Fund (SCCEF)Standard Chartered Premier Equity Fund (SCPEF)Standard Chartered Imperial Equity Fund (SCIEF)Standard Chartered Liquidity Manager (SCLM)Standard Chartered Liquidity Manager Plus (SCLM - Plus)Grindlays Fixed Maturity - 3rd Plan (GFMP - 3)Grindlays Fixed Maturity - 4th Plan (GFMP - 4)Grindlays Fixed Maturity - 5th Plan (GFMP - 5)Grindlays Fixed Maturity - 6th Plan (GFMP - 6)Grindlays Fixed Maturity - 7th Plan (GFMP - 7)Grindlays Fixed Maturity - 8th Plan (GFMP - 8)Grindlays Fixed Maturity - 9th Plan (GFMP - 9)Grindlays Fixed Maturity - 10th Plan (GFMP - 10)Grindlays Fixed Maturity - 11th Plan (GFMP - 11)Grindlays Fixed Maturity - 12th Plan (GFMP - 12)Grindlays Fixed Maturity - 15th Plan (GFMP - 15)Grindlays Fixed Maturity - 16th Plan (GFMP - 16)Grindlays Fixed Maturity - 17th Plan (GFMP - 17)Grindlays Fixed Maturity - 18th Plan (GFMP - 18)Grindlays Fixed Maturity - 19th Plan (GFMP - 19)Grindlays Fixed Maturity - 20th Plan (GFMP - 20)Grindlays Fixed Maturity - 21st Plan (GFMP - 21)
Schedules to the financial statements for the period ended March 31, 2006 (Contd.)(Currency: Indian Rupee)

19
ANNUAL REPORT 2006
For Standard Chartered Asset For Standard Chartered Trustee
Management Company Private Limited Company Private Limited
Paul Jebson Chairman / DirectorChairman
Naval Bir KumarManaging Director Director
Rajiv AnandHead-Investments
Place : MumbaiDate : August 2, 2006
Grindlays Fixed Maturity - 22nd Plan (GFMP - 22)Grindlays Fixed Maturity Plus - Plan 1 (GFMPP - 1)Standard Chartered Fixed Maturity - 3rd Plan (SCFMP - 3)Standard Chartered Tristar Series - I (SCTS - I)Grindlays Fixed Maturity Plan - Quarterly (GFMP - Q)Grindlays Fixed Maturity Plan - Annual (GFMP - A)Grindlays Fixed Maturity Plan - Annual Plan 2 (GFMP - A2)
AssociatesStandard Chartered Asset Management Company Private Limited (AMC)Standard Chartered - UTI Securities Private Limited (SCUTI)
Related Party transactions during the year:Refer Annexure D
11.17 Prior period/year comparatives
There are no prior period figures as all the schemes were launched duringthe current period.
Schedules to the financial statements for the period ended March 31, 2006 (Contd.)(Currency: Indian Rupee)
20
EQUITY SCHEMES
Bajaj Auto Finance Limited GCF GCF 1,025,458,459.00 - 49,290,992.23GFRF-ST 138,203,260.00 - 49,290,992.23
GDBF 49,807,700.00 - -
GFRF-LT 48,719,649.00 - -
SCLM 119,808,240.00 - -
GFMPP-I 51,123,595.00 - -
GFMPP-II 256,789.00 274,625.00 -
SCCEF 271,652,207.70 203,222,500.00 -
SCIEF 45,054,341.00 44,763,875.00 -
Bajaj Hindustan Limited SCCEF 424,519,600.15 176,560,022.25 -
GFMPP1 5,437,070.00 7,566,750.00 -
GFMPP2 199,717.30 206,824.50 -
Bharti Tele Ventures Limited GSSIF-ST SCCEF 397,700,515.00 - -
GFMPP1 1,816,070.00 - -
Finolex Cables Limited GGSF-IP SCCEF 60,415,643.39 - -
Hindalco Industries Limited GFMP A GSSIF-IP 52,115,400.00 - -
GFMP A2 GSSIF-ST 51,890,300.00 - -
GFMP 3 GFMPP1 106,989,108.00 100,329,300.00 -
GSSIF-ST
Hindustan Lever Limited GCF GFMPP1 3,112,061.00 - -
GFMP 20 SCTS 995,805.00 - -
GFMP 22 GFMPP-2 197,581.00 - -
SCFMP2 SCPEF 60,093,144.00 - -
HDFC Bank Limited GFRF-LT GCF 8,238,164,356.11 170,083,336.10 -
GSSIF-ST GFRF-ST 2,689,044,392.77 - -
GFRF-LT 1,173,573,437.50 157,970,487.25 157,649,955.00
FMP-4 314,888,801.62 315,813,186.57 315,713,711.00
FMP-19 343,700,000.00 348,320,000.00 -
FMP-21 1,963,161,644.00 1,986,901,917.92 -
SCLM 4,790,465,312.00 656,121,556.04 -
SCLM Plus 388,580,600.00 388,643,690.61 -
FMP-18 1,478,626,848.00 - -
SCPEF 246,081,250.00 - -
SCFMP-3 2,203,785,616.00 2,220,217,397.01 -
FMP-5 127,710,050.00 229,406,038.30 -
Housing Development Fin. Corp. GSSIF MT GSSIF-IP 599,680,000.00 99,864,053.88 49,521,050.00
Limited GSSIF-ST 489,898,950.00 - -
GCF 14,579,884,297.00 744,850,639.78 900,277,900.00
GDBF 168,743,500.00 - -
GFRF ST 7,075,944,340.00 451,311,550.00 950,381,550.00
GFRF LT 5,825,532,214.00 301,315,900.00 1,250,540,350.00
FMP-A2 103,838,800.00 -
FMP-6 100,980,680.00 195,801,300.00 100,406,600.00
Company Schemes invested in Investing Aggregate for *Outstanding as at *Outstanding as atby the company Scheme Name the period under 31/03/2006 At 31/03/2005 At
Regulation 25(11) Market/Fair Market/FairAt Cost (Rs.) Value (Rs.) Value (Rs.)
Annexure ADetails of investment in companies / subsidiaries that hold more than 5% of NAV of any scheme of Standard Chartered Mutual Fund
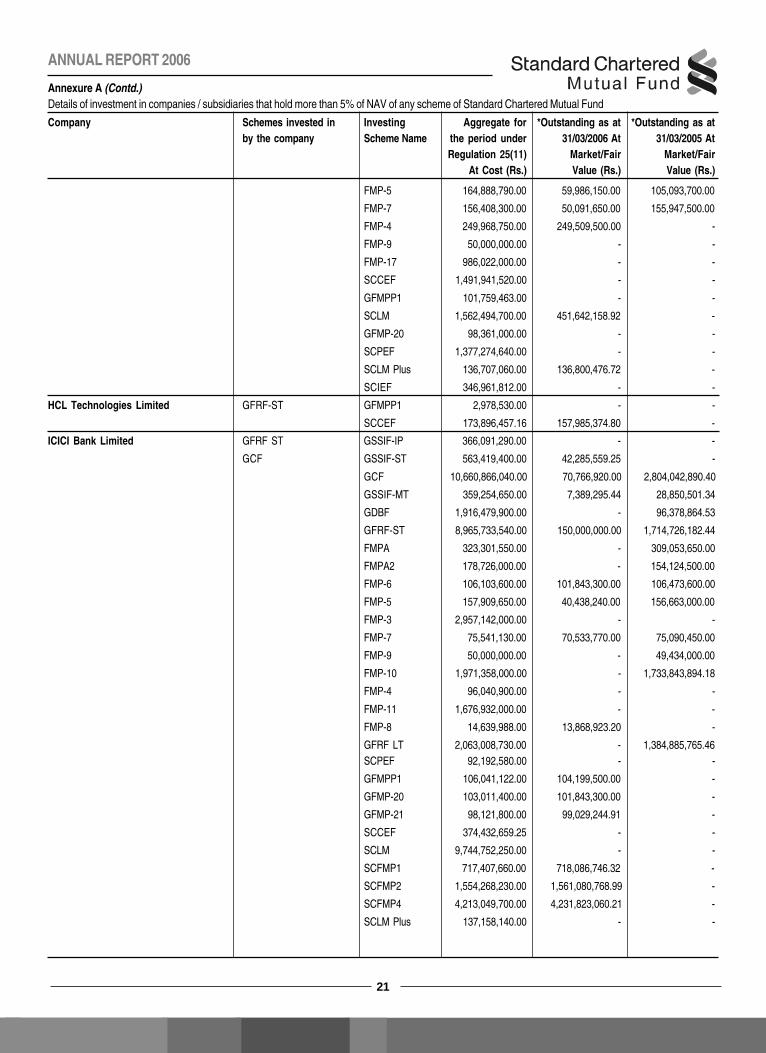
21
ANNUAL REPORT 2006
FMP-5 164,888,790.00 59,986,150.00 105,093,700.00
FMP-7 156,408,300.00 50,091,650.00 155,947,500.00
FMP-4 249,968,750.00 249,509,500.00 -
FMP-9 50,000,000.00 - -
FMP-17 986,022,000.00 - -
SCCEF 1,491,941,520.00 - -
GFMPP1 101,759,463.00 - -
SCLM 1,562,494,700.00 451,642,158.92 -
GFMP-20 98,361,000.00 - -
SCPEF 1,377,274,640.00 - -
SCLM Plus 136,707,060.00 136,800,476.72 -
SCIEF 346,961,812.00 - -
HCL Technologies Limited GFRF-ST GFMPP1 2,978,530.00 - -
SCCEF 173,896,457.16 157,985,374.80 -
ICICI Bank Limited GFRF ST GSSIF-IP 366,091,290.00 - -
GCF GSSIF-ST 563,419,400.00 42,285,559.25 -
GCF 10,660,866,040.00 70,766,920.00 2,804,042,890.40
GSSIF-MT 359,254,650.00 7,389,295.44 28,850,501.34
GDBF 1,916,479,900.00 - 96,378,864.53
GFRF-ST 8,965,733,540.00 150,000,000.00 1,714,726,182.44
FMPA 323,301,550.00 - 309,053,650.00
FMPA2 178,726,000.00 - 154,124,500.00
FMP-6 106,103,600.00 101,843,300.00 106,473,600.00
FMP-5 157,909,650.00 40,438,240.00 156,663,000.00
FMP-3 2,957,142,000.00 - -
FMP-7 75,541,130.00 70,533,770.00 75,090,450.00
FMP-9 50,000,000.00 - 49,434,000.00
FMP-10 1,971,358,000.00 - 1,733,843,894.18
FMP-4 96,040,900.00 - -
FMP-11 1,676,932,000.00 - -
FMP-8 14,639,988.00 13,868,923.20 -
GFRF LT 2,063,008,730.00 - 1,384,885,765.46SCPEF 92,192,580.00 - -
GFMPP1 106,041,122.00 104,199,500.00 -
GFMP-20 103,011,400.00 101,843,300.00 -
GFMP-21 98,121,800.00 99,029,244.91 -
SCCEF 374,432,659.25 - -
SCLM 9,744,752,250.00 - -
SCFMP1 717,407,660.00 718,086,746.32 -
SCFMP2 1,554,268,230.00 1,561,080,768.99 -
SCFMP4 4,213,049,700.00 4,231,823,060.21 -
SCLM Plus 137,158,140.00 - -
Company Schemes invested in Investing Aggregate for *Outstanding as at *Outstanding as atby the company Scheme Name the period under 31/03/2006 At 31/03/2005 At
Regulation 25(11) Market/Fair Market/FairAt Cost (Rs.) Value (Rs.) Value (Rs.)
Annexure A (Contd.)Details of investment in companies / subsidiaries that hold more than 5% of NAV of any scheme of Standard Chartered Mutual Fund
22
EQUITY SCHEMES
ICICI Securities Limited GSSIF-ST 100,000,000.00 - -
FMP-16 100,666,100.00 - -
SCLM 200,000,000.00 - -
GCF 308,565,380.00 - -
GFMPP-I 68,572,980.00 - -
ITC Limited GCF SCCEF 922,054,802.16 251,743,500.00 -
GSSIF-ST SCTS 1,497,200.00 1,697,805.00 -
GFRF-ST GFMPP1 5,169,243.00 6,830,250.00 -
GFRF-LT GFMPP2 282,550.00 331,755.00 -
SCIEF 49,953,957.00 58,545,000.00 -
Infosys Technologies Limited GCF GFMPP-1 4,613,587.00 - -
SCCEF 1,002,996,409.65 199,753,800.00 -
SCIEF 229,607,224.00 187,828,200.00 -
Indian Petro Chemicals Limited SCLM SCPEF 148,569,197.00 - -
GFMPP-1 4,047,224.00 - -
SCCEF 197,036,650.00 - -
Mahindra & Mahindra Limited GSSIF-ST GSSIF-IP 252,858,760.00 - -
GSSIF-ST 308,376,170.00 - -
GSSIF-MT 9,536,840.00 - -
GCF 7,557,604,280.00 196,731,856.74 -
GDBF 580,068,710.00 - -
GFRF-ST 5,416,122,710.00 - -
FMPA2 9,543,140.00 - -
FMP-4 188,972,400.00 - -
FMP-5 22,646,314.00 - -
FMP-6 49,089,430.00 29,686,140.00 -
FMP-12 57,277,770.00 - -
FMP-7 16,072,926.00 - -
FMP-19 196,558,800.00 199,082,346.68 -
GFMPP1 5,323,445.00 5,956,975.00 -
SCLM 2,108,045,140.00 1,282,502,415.75 -
SCLM Plus 743,908,800.00 744,046,195.50 -
GFMP-20 170,000,000.00 168,221,460.00 -
GFMP-21 146,404,800.00 147,778,761.60 -
GFRF-LT 1,266,954,810.00 - -
SCCEF 579,793,347.50 211,631,256.15 -
SCPEF 60,817,162.00 57,811,981.60 -
SCIEF 89,210,919.00 141,810,938.48 -
SCTS 1,393,961.00 1,410,862.50 -
GFMPP2 299,995.50 297,848.75 -
Maruti Udyog Limited GFRF-LT GFMPP1 2,032,624.00 2,579,185.00 -
SCCEF 205,346,035.80 150,904,180.00 -
SCIEF 43,980,148.00 48,086,500.00 -
Company Schemes invested in Investing Aggregate for *Outstanding as at *Outstanding as atby the company Scheme Name the period under 31/03/2006 At 31/03/2005 At
Regulation 25(11) Market/Fair Market/FairAt Cost (Rs.) Value (Rs.) Value (Rs.)
Annexure A (Contd.)Details of investment in companies / subsidiaries that hold more than 5% of NAV of any scheme of Standard Chartered Mutual Fund
23
ANNUAL REPORT 2006
**Reliance Industries Limited GCF SCCEF 913,709,306.05 318,140.00 -
GFRF-ST FMP-4 152,771,880.00 149,444,550.00 -
FMP-16 99,521,900.00 97,016,700.00 -
FMP-A 53,608,650.00 - -
GDBF 752,421,050.00 - -
GFRF-ST 102,324,600.00 - -
GSSIF-IP 834,215,940.00 - -
GSSIF-MT 107,288,550.00 - -
GSSIF-ST 880,187,830.00 - -
GFMP-20 98,590,300.00 97,016,700.00 -
GFMPP1 9,301,982.20 6,203,730.00 -
SCIEF 153,095,658.86 159,070,000.00 -
Reliance Energy Limited GCF GFMPP1 1,773,114.00 1,376,325.00 -
SCIEF 85,326,247.00 79,521,000.00 -
Reliance Capital Limited GFMPP1 70,227.00
Reliance Communication Venture Limited GFMPP1 3,594,819.92 3,303,090.00 -
SCIEF 83,525,796.00 84,892,500.00 -
SCTS 1,000,655.00 956,970.00 -
Reliance Natural Resources Limited GFMPP1 18,900.00 - -
Reliance Tele Ventures Limited GCF 245,246,000.00 - -
SCFMP-3 245,566,500.00 247,275,801.12 -
Sterlite Industries Limited GSSIF-IP GCF 2,090,000,000.00 - -
GSSIF-ST GFRF-ST 1,040,000,000.00 - -
GDBF GFRF-LT 160,000,000.00 - -
GFRF-LT SCLM 420,000,000.00 - -
SCIEF 122,193,671.00 157,327,350.00 -
Sterlite Optical Technologies Limited SCCEF 164,086,478.50 - -
Tata Sons Limited GCF FMP A 101,433,100.00 - -
GFMP 3 FMP A2 151,075,950.00 - -
FMP-5 299,294,200.00 199,992,600.00 -
GDBF 100,221,500.00 - -
GCF 150,360,500.00 - -
GFRF-LT 100,592,200.00 - -
Tata Consultancy Services Limited GCF GFMPP1 3,356,361.00 3,831,000.00 -
SCCEF 145,165,289.00 80,067,900.00 -
GFMPP2 200,387.52 199,212.00 -
Tata Power Company Limited GCF 40,932,737.74 - -
GFMPP1 2,321,238.00 2,912,000.00 -
Tata Tea Limited GFMPP1 622,618.00 - -
Tata Iron & Steel Company Limited GCF GFMPP1 1,131,894.00 - -
GSSIF-ST SCCEF 395,935,676.00 394,327,500.00 -
Tata Motors Limited SCCEF 372,933,783.00 216,189,200.00 -
SCIEF 39,660,592.00 46,592,500.00 -
Company Schemes invested in Investing Aggregate for *Outstanding as at *Outstanding as atby the company Scheme Name the period under 31/03/2006 At 31/03/2005 At
Regulation 25(11) Market/Fair Market/FairAt Cost (Rs.) Value (Rs.) Value (Rs.)
Annexure A (Contd.)Details of investment in companies / subsidiaries that hold more than 5% of NAV of any scheme of Standard Chartered Mutual Fund
24
EQUITY SCHEMES
Tata Coffee Limited GCF 296,755,950.00 - -
GFRF-ST 148,000,200.00 - -
UCO Bank Limited GSSIF-ST GSSIF-ST 350,462,260.00 48,327,297.36 -
GSSIF-IP 49,054,800.00 49,385,235.65 -
GCF 4,441,495,670.00 265,091,189.92 -
GDBF 105,542,280.00 - -
GFRF-LT 1,322,243,750.00 - -
GFRF-ST 4,210,854,200.00 - -
GFMP 12 47,120,500.00 49,728,047.09 -
GFMP 17 336,251,000.00 - -
SCPEF 49,257,550.00 - -
SCLM 1,606,943,950.00 912,002,187.26 -
SCLM Plus 165,742,690.00 165,821,045.41 -
SCFMP-3 621,171,816.30 624,248,409.26 -
GFMP-21 245,229,950.00 247,530,539.00 -
UTI Bank Limited GCF GFRF-ST 5,824,945,951.00 350,180,313.65 237,710,600.35
GSSIF-ST GDBF 312,461,400.00 - 113,300,373.12
FMPA 195,391,200.00 - -
FMPA2 97,716,250.00 - -
FMP-4 575,666,900.00 - 311,576,014.94
FMP-16 73,383,590.00 71,085,840.00 -
GCF 7,894,867,347.00 395,043,715.17 1,991,618,092.09
GSSIF-ST 551,938,490.00 145,487,807.98 18,883,398.29
GFRF-LT 1,209,727,150.00 - -
GSSIF-MT 28,253,100.00 - 28,325,087.70
GSSIF-IP 47,192,500.00 - 47,208,497.16
GFMPP1 32,674,600.00 33,112,625.40 -
GFMP-20 31,015,440.00 30,465,360.00 -
SCLM 5,328,483,220.00 159,839,148.33 -
SCLM Plus 242,186,200.00 194,360,353.18 -
* Market Value for Close Ended Scheme is considered as on 31-03-2006
** Reliance Industries Limited and Reliance Energy Limited had invested in schemes of SCMF during the concerned period. The schemes which have invested inReliance have been included in the report. As RIL had demerged into multiple entities according to the demerger scheme applied to it, name of demerged entitiesare also appearing for the purpose of information. Cost of investment of the schemes in demerge entities of RIL have been spilt in the ratio provided by RIL andaccordingly disclosed.
Company Schemes invested in Investing Aggregate for *Outstanding as at *Outstanding as atby the company Scheme Name the period under 31/03/2006 At 31/03/2005 At
Regulation 25(11) Market/Fair Market/FairAt Cost (Rs.) Value (Rs.) Value (Rs.)
Annexure A (Contd.)Details of investment in companies / subsidiaries that hold more than 5% of NAV of any scheme of Standard Chartered Mutual Fund

25
ANNUAL REPORT 2006
Annexure BPortfolio holding (market / fair value) as at March 31, 2006
Equity SharesAuto-Ancilliaries:Amtek Auto Limited 189,569,258 2.49 155,536,008 5.43 - -
Automobiles:Ashok Leyland Limited 159,185,000 2.09 - - - -Bajaj Auto Limited 203,222,500 2.67 - - 44,763,875 1.45Mahindra & Mahindra Limited 211,631,256 2.78 - - 92,803,400 3.01Maruti Udyog Limited 150,904,180 1.98 - - 48,086,500 1.56Tata Motors Limited 216,189,200 2.84 - - 46,592,500 1.51
Banks:Bank Of India 85,541,312 1.12 - - - -Oriental Bank Of Commerce 82,145,000 1.08 - - - -State Bank Of India 242,125,000 3.18 - - 156,993,850 5.09Union Bank Of India 112,065,952 1.47 - - 12,160,000 0.39Centurion Bank Of Punjab - - 80,250,000 2.80 - -Punjab National Bank - - - - 77,616,000 2.52
Cement:Associated Cement Companies Limited 234,660,000 3.08 - - - -Birla Corporation Limited 158,436,181 2.08 - - - -JK Cement Limited 173,705,592 2.28 - - - -Grasim Industries Limited - - - - 206,245,000 6.69Madras Cements Limited - - - - 39,793,526 1.29
ChemicalsSolar Explosives Limited - - - - 17,311,090 0.56
Construction & Housing:Gammon India Limited 28,171,000 0.37 - - - -Jaiprakash Associates Limited 240,334,285 3.15 - - - -Nagarjuna Constructions Limited - - 90,712,500 3.17 - -Mahindra Gesco Developers Limited - - 57,811,982 2.02 - -B.L. Kashyap Limited - - - - 78,077,650 2.53
Consumer Non Durables:Bajaj Hindustan Limited 176,560,022 2.32 - - - -Balrampur Chini Mills Limited 244,075,000 3.20 - - 86,365,000 2.80Colgate Palmolive (India) Limited 76,328,494 1.00 - - - -Crew BOS 73,281,249 0.96 87,877,250 3.07 - -Dabur India Limited - - - - 63,004,400 2.04Glaxosmithkline Consumer Healthcare Limited - - - - 37,800,422 1.23Nitco Tiles Limited - - - - 50,337,500 1.63Sakthi Sugars Limited 87,410,984 1.15 100,080,000 3.50 - -Shree Renuka Sugars Limited - - 158,162,578 5.52 77,002,155 2.50ICI India Limited - - 25,992,822 0.91 - -
DiversifiedITC Limited 251,743,500 3.30 - - 58,545,000 1.90
EngineeringElecon Engineering Limited - - - - 55,138,000 1.79
SCCEF SCPEF SCIEF
Amount (Rs) % Amount (Rs) % Amount (Rs) %

26
EQUITY SCHEMES
Ferrous Metal:Steel Authority Of India Limited 352,981,728 4.63 - - 237,892,150 7.71Tata Iron & Steel Company Limited 394,327,500 5.17 - - - -Maharashtra Seamless Limited - - 122,606,631 4.28 - -Man Industries (India) Limited - - 25,488,524 0.89 - -
Hotels:Hotel Leela Ventures Limited 179,251,328 2.35 - - - -
Healthcare Services:Vimta Laboratories Limited - - 65,318,279 2.28 - -
Industrial Capital Goods:Asea Brown Boveri Limited - - - - 128,834,200 4.18Areva T & D india Limited - - 208,829,595 7.29 - -Crompton Greaves Limited - - 58,967,292 2.06 - -Emco Limited - - 251,545,497 8.79 - -Bharat Heavy Electricals Limited 272,509,023 3.58 - - 178,842,592 5.80Indo Asean Fusegear Limited - - 38,363,021 1.34 - -Larsen & Toubro Limited 240,058,836 3.15 - - 133,798,500 4.34RPG Transmissions Limited - - 171,668,802 6.00 - -Sintex Industries Limited - - 99,871,992 3.49 - -Siemens India Limited 273,536,710 3.59 - - - -
Media & Entertainment:Deccan Chronicle Holdings Limited 32,504,381 0.43 133,017,928 4.65 - -Entertainement Network (I) Limited 4,841,951 0.06 8,604,839 0.30 - -Television Eighteen India Limited - - 93,589,388 3.27 - -New Delhi Television Limited - - 74,747,500 2.61 - -
Non Ferrous MetalsSterlite Industries Limited - - - - 157,327,350 5.10National Aluminium Company Limited 105,531,350 1.38 - - 70,476,000 2.28Hindustan Zinc Limited - - - - 65,400,000 2.12
Oil:Oil & Natural Gas Corporation 98,351,250 1.29 - - 140,052,180 4.54
Pesticides:United Phosphorous Limited 133,631,121 1.75 - - - -
Petroleum Products:Reliance Industries Limited 318,140 0.00 - - 159,070,000 5.16India Oil Corporation Limited - - - - 57,818,198 1.87
Pharmaceuticals:Dr. Reddy’s Laboratories 210,617,366 2.76 - - - -Ind - Swift Laboratories Limited 9,173,361 0.12 9,081,359 0.32 - -Jubiliant Organosys Limited 82,187,952 1.08 - - - -Orchid Chemicals & Pharmaceuticals Limited 236,949,523 3.11 - - - -Panacea Biotech Limited\ 308,007,570 4.04 16,565,798 0.58 - -Glaxo India Limited - - - - 63,903,400 2.07Wyeth Limited - - 36,383,819 1.27 - -Wockhardt Limited 93,261,174 1.22 - - - -
Annexure B (Contd.)Portfolio holding (market / fair value) as at March 31, 2006
SCCEF SCPEF SCIEF
Amount (Rs) % Amount (Rs) % Amount (Rs) %

27
ANNUAL REPORT 2006
PowerReliance Energy Limited - - - - 79,521,000 2.58
Retailing:Pantaloon Retail India Limited - - 97,857,199 3.42 - -Pantaloon Retail India Limited - Rights - - 24,281,287 0.85 - -Trent limited - - 87,828,345 3.07 - -
Software:HCL Technologies Limited 157,985,375 2.07 - - - -Infosys Technologies Limited 199,753,800 2.62 - - 187,828,200 6.09I-flex Solutions Limited - - - - 43,791,000 1.42Mphasis BFL Limited 118,430,242 1.55 - - - -Satyam Computer Services Limited 99,886,269 1.31 - - - -Subex Systems Limited 189,876,963 2.49 - - - -Tata Consultancy Services Limited 80,067,900 1.05 - - - -Financial Technologies (India) Limited - - 43,451,393 1.52 - -Geodesic Information Systems Limited - - 38,005,056 1.33 - -
Telecom - servicesReliance Communication Ventures Limited - - - - 84,892,500 2.75
Tea and coffeeCCL Products of India Limited 129,981,029 1.71 37,604,304 1.31 - -
Textile productsAlok Industries Limited 18,901,692 0.25 58,960,000 2.06 - -Bombay Rayon Fashions Limited - - 126,335,400 4.41 - -
Textiles - SyntheticSarla Polyester Limited - - 9,434,836 0.33 - -S R F Limited 150,576,481 1.98 110,489,400 3.86 - -
Transportation - AirlinesSpice Jet Limited - - 57,917,852 2.02 46,702,500 1.51Jet Airways Limited 51,097,979 0.67 - - - -
Total 7,621,882,777 100.00 2,863,238,476 100.00 3,084,785,640 100.00
Privately Placed Debentures
Non Banking Financial Companies (NBFC)IDFC Limited - - - - 100,580,900 100.00
Total - - - - 100,580,900 100.00
Debentures And Bonds Listed/AwaitingListing On Recognised Stock Exchange
Non Banking Financial Companies (NBFC)GE Capital Services Limited - - - - 49,978,500 31.26IRFC Limited - - - - 49,966,400 31.25
Banks and Financial InstitutionsNabard 89,925,570 75.00 69,942,110 100.00 59,950,380 37.49
Housing & FinanceLIC Housing Finance Limited 29,967,300 25.00 - - - -
Total 119,892,870 100.00 69,942,110 100.00 159,895,280 100.00
SCCEF SCPEF SCIEF
Amount (Rs) % Amount (Rs) % Amount (Rs) %
Annexure B (Contd.)Portfolio holding (market / fair value) as at March 31, 2006

28
EQUITY SCHEMES
Securitised PaperIndian Retail ABS Trust - - - - 418,284,371 100.00
Total - - - - 418,284,371 100.00
Commercial Paper
Non Banking Financial Companies (NBFC)Citi Corp Finance India Limited - - - - 196,098,640 61.55Exim Bank - - 8,954,757 100.00 - -Rabo India Finance Private Limited - - - - 122,523,844 38.45
Total - - 8,954,757 100.00 318,622,484 100.00
Certificate Of Deposits
Banks and Financial Institutions
Allahabad Bank - - 108,501,836 100.00 108,501,836 49.11Karnataka Bank Limited - - - - 5,885,556 2.66Kotak Mahindra Bank Limited - - - - 49,007,538 22.18State Bank of Indore 972,862 100.00 - - 8,755,744 3.96State Bank of Patiala - - - - 48,769,672 22.08
Total 972,862 100.00 108,501,836 100.00 220,920,346 100.00
Collateralised Borrowingand Lending ObligationCBLO - Maturity Date - 03/04/2006 8,496,811 100.00 4,498,312 100.00 8,496,811 100.00
Total 8,496,811 100.00 4,498,312 100.00 8,496,811 100.00
TOTAL INVESTMENTS 7,751,245,320 3,055,135,491 4,311,585,832
Annexure B (Contd.)Portfolio holding (market / fair value) as at March 31, 2006
SCCEF SCPEF SCIEF
Amount (Rs) % Amount (Rs) % Amount (Rs) %

29
ANNUAL REPORT 2006
SCCEF SCPEF SCIEFJune 27, 2005 to September 05, 2005 to Jannuary 30, 2006 toMarch 31, 2006 March 31, 2006 March 31, 2006
A NAVGrowth Option 14.22 12.84 10.63Dividend Option 14.22 12.84 10.63
B Gross Incomei Income other than profit on sale of investment 0.1572 0.0782 0.0415ii Income from profit on inter scheme (0.0189) (0.0208) (0.0068)
Sales / transfer of investmentiii Income from profit on sale 2.7595 0.4269 0.0580
of investment to third partyiv Transfer to revenue account - - -
from past year’s reserveC i Aggregate of expenses, write off, 0.2240 0.1245 0.0166
amortisation and chargesii Deferred Revenue expenses written off 0.0765 0.0378 0.0037
D Net Income 2.5973 0.3220 0.0724E Unrealised Appreciation/ 2.9814 2.7701 0.5688
Depreciation in value of investmentsF (a) NAV Highest * Lowest* Highest * Lowest* Highest * Lowest*
Growth Option 14.22 9.90 12.84 8.60 10.63 10.06Dividend Option 14.22 9.90 12.84 8.60 10.63 10.06
(b) Repurchase PriceGrowth Option 14.22 9.90 12.84 8.60 10.63 10.06Dividend Option 14.22 9.90 12.84 8.60 10.63 10.06
(c) Resale PriceGrowth Option 14.54 10.12 13.13 8.79 10.87 10.29Dividend Option 14.54 10.12 13.13 8.79 10.87 10.29
G Ratio of Expenses to Average 2.20% 1.94% 2.07%Net Assets by percentage (Annualised)
H Ratio of Gross Income to Average 28.42% 7.55% 19.87%Net Assets by percentage (Annualised)
Note*For SCCEF the period is from the date of allotment of units i.e. August 09, 2005 to March 31, 2006*For SCPEF the period is from the date of allotment of units i.e. September 28, 2005 to March 31, 2006*For SCIEF the period is from the date of allotment of units i.e. March 16, 2006 to March 31, 2006There are no comparatives for the prior period for any of the above schemes as the units were allotted during the current year
Annexure C

EQUITY SCHEMES
30
Description GSSIF - IP GSSIF - ST GSSIF - MT GCF GFRF - ST GFRF - LT SCCEF GDBFAMCManagement fees 18,517,440 8,108,275 398,582 48,669,633 39,616,747 31,696,156 62,091,016 4,306,450
72,289,508 23,227,647 12,591,469 104,136,728 51,256,078 16,249,061 Nil 70,230,905Value of units purchased Nil 372,525,746 Nil 124,457,762 1,505,201 3,565,249 Nil Nil
Nil Nil 124,161,594 614,969,524 45,314,256 124,171,991 Nil NilValue of units redeemed Nil Nil Nil 428,161,420 46,682,718 128,519,378 Nil Nil
37,017,961 Nil 211,355,196 315,529,481 Nil Nil Nil NilSCUTIPurchase of securities 379,577,217 Nil 12,349,514 940,978,400 Nil 194,661,400 Nil 275,332,258
116,650,278 108,363,097 294,642,507 671,623,705 Nil Nil Nil 600,141,472Sale of Securities 52,633,847 Nil 54,304,917 Nil Nil Nil Nil 52,362,986
192,531,569 170,946,889 225,144,333 447,925,500 Nil Nil Nil 625,722,250Reverse Repo Nil Nil Nil Nil Nil Nil Nil Nil
1,521,085,945 546,648,586 279,778,637 1,982,518,432 Nil Nil Nil 4,290,213,947Reverse Repo matured Nil Nil Nil Nil Nil Nil Nil Nil
1,521,316,959 546,767,261 279,837,988 1,982,733,912 Nil Nil Nil 4,291,011,864SCBPurchase of securities 423,597,708 840,886,610 Nil 3,555,051,832 Nil 1,657,767,719 Nil 323,851,310
1,335,549,081 1,035,509,065 1,380,669,903 2,250,317,470 Nil Nil Nil 3,129,780,318Sale of securities 51,212,528 331,715,650 52,295,347 3,025,102,339 49,535,850 243,399,000 Nil Nil
267,914,889 488,584,903 578,379,722 960,710,279 Nil Nil Nil 1,540,801,931Reverse Repo Nil Nil Nil Nil Nil Nil Nil Nil
21,215,360,658 4,235,376,378 7,726,254,067 9,806,530,204 Nil Nil Nil 37,242,728,507Reverse Repo matured Nil Nil Nil Nil Nil Nil Nil Nil
21,218,010,520 4,235,970,164 7,727,173,635 9,807,769,253 Nil Nil Nil 37,248,183,646Fixed deposits placed Nil Nil Nil Nil Nil Nil Nil Nil
Nil Nil Nil 750,000,000 Nil Nil Nil NilFixed deposits matured Nil Nil Nil Nil Nil Nil Nil Nil
Nil Nil Nil 750,902,397 Nil Nil Nil NilBank Charges 302,390 281,315 6,823 366,037 75,843 48,486 718,666 22,017
3,497 4,162 9,422 35,645 19,986 24,939 Nil 34,567DerivativesNotional Nil Nil Nil Nil 2,750,000,000 3,750,000,000 Nil Nil
750,000,000 250,000,000 Nil 6,250,000,000 Nil Nil Nil 250,000,000Interest Nil Nil Nil Nil -1,973,076 907,320 Nil Nil
(636,737) 24,497 Nil 1,719,256 Nil Nil Nil (104,425)
Annexure - D: Related Party transactionsMarch 31, 2006March 31, 2005
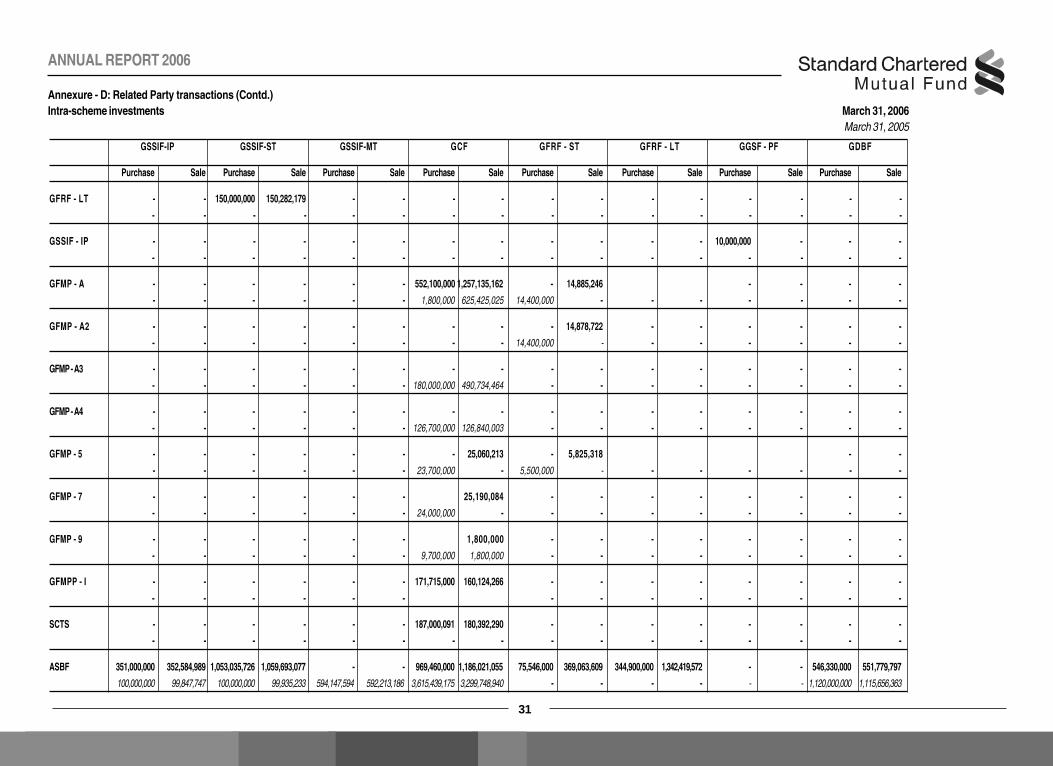
ANNUAL REPORT 2006
31
GSSIF-IP GSSIF-ST GSSIF-MT GCF GFRF - ST GFRF - LT GGSF - PF GDBF
Purchase Sale Purchase Sale Purchase Sale Purchase Sale Purchase Sale Purchase Sale Purchase Sale Purchase Sale
GFRF - LT - - 150,000,000 150,282,179 - - - - - - - - - - - -
- - - - - - - - - - - - - - - -
GSSIF - IP - - - - - - - - - - - - 10,000,000 - - -
- - - - - - - - - - - - - - - -
GFMP - A - - - - - - 552,100,000 1,257,135,162 - 14,885,246 - - - -
- - - - - - 1,800,000 625,425,025 14,400,000 - - - - - - -
GFMP - A2 - - - - - - - - - 14,878,722 - - - - - -
- - - - - - - - 14,400,000 - - - - - - -
GFMP - A3 - - - - - - - - - - - - - - - -
- - - - - - 180,000,000 490,734,464 - - - - - - - -
GFMP - A4 - - - - - - - - - - - - - - - -
- - - - - - 126,700,000 126,840,003 - - - - - - - -
GFMP - 5 - - - - - - - 25,060,213 - 5,825,318 - -
- - - - - - 23,700,000 - 5,500,000 - - - - - - -
GFMP - 7 - - - - - - 25,190,084 - - - - - - - -
- - - - - - 24,000,000 - - - - - - - - -
GFMP - 9 - - - - - - 1,800,000 - - - - - - - -
- - - - - - 9,700,000 1,800,000 - - - - - - - -
GFMPP - I - - - - - - 171,715,000 160,124,266 - - - - - - - -
- - - - - - - - - - - - - -
SCTS - - - - - - 187,000,091 180,392,290 - - - - - - - -
- - - - - - - - - - - - - - - -
ASBF 351,000,000 352,584,989 1,053,035,726 1,059,693,077 - - 969,460,000 1,186,021,055 75,546,000 369,063,609 344,900,000 1,342,419,572 - - 546,330,000 551,779,797
100,000,000 99,847,747 100,000,000 99,935,233 594,147,594 592,213,186 3,615,439,175 3,299,748,940 - - - - - - 1,120,000,000 1,115,656,363
Annexure - D: Related Party transactions (Contd.)Intra-scheme investments March 31, 2006
March 31, 2005

EQUITY SCHEMES
32
Description GSSIF - IP GSSIF - ST GSSIF - MT GCF GDBF GGSF - PF GFRF - ST GFRF - LT SCCEF
AMC
Year-end units outstanding
(Value at last declared NAV) - 373,200,377 - - - - - - -
- - - 302,382,168 53,120,745 -
Management fees payable 1,135,318 - 35,382 - 142,208 - 318,232 - 10,163,316
2,205,210 682,418 240,867 4,410,015 2,659,157 - 14,583,508 - -
Investor Scheme
GSSIF - IP - - - - - 10,415,104 - - -
- - - - 35,579,343 - - - -
GSSIF - MT - - - - - - - - -
- - - - 15,249,157 - - - -
GDBF - - - - - 10,415,104 - - -
- - - - - - - - -
SCTS - 1 - - - 7,017,845 - - - - -
- - - - - - - - -
GFMPP - 1 - - - 11,751,064 - - - - -
- - - - - - - - -
GFMP - A - - - - - - - - -
- - - 703,288,516 - - - - -
GFMP - 5 - - - - - - - - -
- - - 23,900,405 - - 5,553,091 - -
GFMP - 6 - - - - - - - - -
- - - - - - 19,220,151
GFMP - 7 - - - - - - - - -
- - - 24,031,785 - - - - -
GFMP - 9 - - - 8,329,475 - - - - -
- - - 9,712,846 - - - - -
ASBF - - - 130,237,473 - - - - -
- - - 340,100,530 - - 1,270,615,007 - -
Annexure - D: Related Party transactions (Contd.)Related party balances March 31, 2006
March 31, 2005

ANNUAL REPORT 2006
33
GSSIF - IP - 489,448,137 - 894,546,237 49,253,150 - - - 1,433,247,525 - - 108,230,992 2,103,390,847 3,728,116,282 5,939,738,121
GSSIF - ST 1,069,522,181 - 7,369,880 1,684,488,579 278,070,700 18,965,080 - 75,860,320 3,134,276,740 1,036,326,837 1,340,825,939 906,718,194 2,429,441,347 41,412,267 5,754,724,584
GSSIF - MT - 28,353,870 - - - - - - 28,353,870 345,347,181 1,482,133,581 - 618,451,516 900,509,663 2,932,233 49,507,650 3,398,881,824
GCF 778,562,866 1,407,415,928 147,027,600 - 559,086,264 - - 94,746,350 2,986,839,008 2,521,943,113 49,498,600 16,595,103,364 19,166,545,077
GDBF 142,938,150 172,680,109 - 827,599,022 - - - - 1,143,217,281 2,435,512,038 465,687,787 367,062,621 14,246,409,266 - 17,514,671,711
GGSF - IP - - - - - - - - - - - - -
GGSF - ST - - - - - - - - - - - - -
GGSF - PF - - - - - - - 41,407,667 49,685,600 - 91,093,267
GFRF - ST 116,375,140 807,325,900 49,903,080 25,822,543,534 410,306,878 - - - 27,206,454,531 946,304,344 362,677,114 176,245,740 3,013,369,094 4,542,470,622 9,041,066,915
GFRF - LT 209,129,044 480,276,255 - 5,887,329,309 205,266,578 - - - 6,782,001,187 - 255,600,874 2,851,154,991 2,483,736,717 5,590,492,582
SCCEF - 286,288,709 - 3,700,570,369 9,916,950 - - - 3,996,776,029 - -
SCIEF 247,235,700 219,922,251 - - - - - - 467,157,951 - -
SCPEF - 100,976,866 - 3,119,418,913 - - - - 3,220,395,779 - -
SCLM 147,008,800 - 7,865,008 7,608,248,432 - - - - 7,763,122,240 - -
SCLM Plus 29,257,170 - - - - - - - 29,257,170 - -
FMP - Q - - - - - - - - 340,732,427 340,732,427
Grand Total 2,740,029,051 3,992,688,026 212,165,568 49,544,744,395 1,511,900,520 18,965,080 - 170,606,670 58,191,099,311 7,285,433,513 2,607,507,022 2,091,549,492 24,080,226,334 30,679,377,996 - 2,932,233 90,919,917 66,837,946,506
Annexure - D: Related Party transactions (Contd.)Inter-scheme Sales/Purchases March 31, 2006
March 31, 2005
Seller GSSIF - IP GSSIF-ST GSSIF - MT GCF GDBF GGSF - IP GGSF - ST GGSF - PF Grand Total
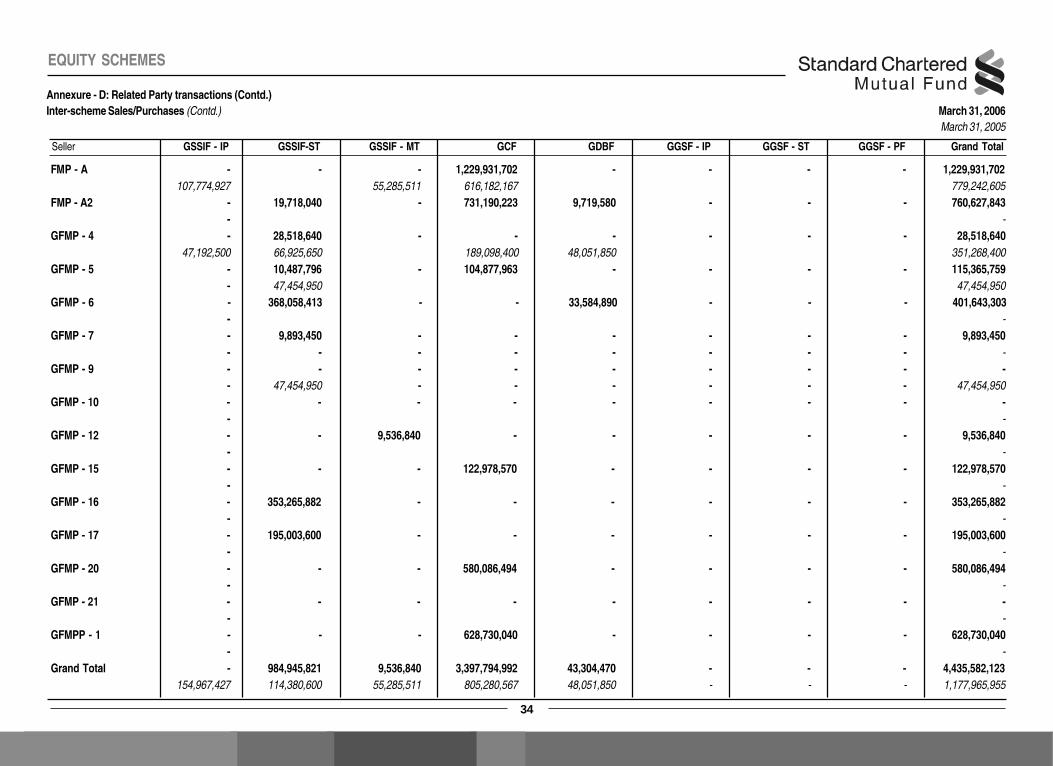
EQUITY SCHEMES
34
Annexure - D: Related Party transactions (Contd.)Inter-scheme Sales/Purchases (Contd.) March 31, 2006
March 31, 2005
FMP - A - - - 1,229,931,702 - - - - 1,229,931,702 107,774,927 55,285,511 616,182,167 779,242,605
FMP - A2 - 19,718,040 - 731,190,223 9,719,580 - - - 760,627,843 - -
GFMP - 4 - 28,518,640 - - - - - - 28,518,640 47,192,500 66,925,650 189,098,400 48,051,850 351,268,400
GFMP - 5 - 10,487,796 - 104,877,963 - - - - 115,365,759 - 47,454,950 47,454,950
GFMP - 6 - 368,058,413 - - 33,584,890 - - - 401,643,303 - -
GFMP - 7 - 9,893,450 - - - - - - 9,893,450 - - - - - - - - -
GFMP - 9 - - - - - - - - - - 47,454,950 - - - - - - 47,454,950
GFMP - 10 - - - - - - - - - - -
GFMP - 12 - - 9,536,840 - - - - - 9,536,840 - -
GFMP - 15 - - - 122,978,570 - - - - 122,978,570 - -
GFMP - 16 - 353,265,882 - - - - - - 353,265,882 - -
GFMP - 17 - 195,003,600 - - - - - - 195,003,600 - -
GFMP - 20 - - - 580,086,494 - - - - 580,086,494 - -
GFMP - 21 - - - - - - - - - - -
GFMPP - 1 - - - 628,730,040 - - - - 628,730,040 - -
Grand Total - 984,945,821 9,536,840 3,397,794,992 43,304,470 - - - 4,435,582,123 154,967,427 114,380,600 55,285,511 805,280,567 48,051,850 - - - 1,177,965,955
Seller GSSIF - IP GSSIF-ST GSSIF - MT GCF GDBF GGSF - IP GGSF - ST GGSF - PF Grand Total
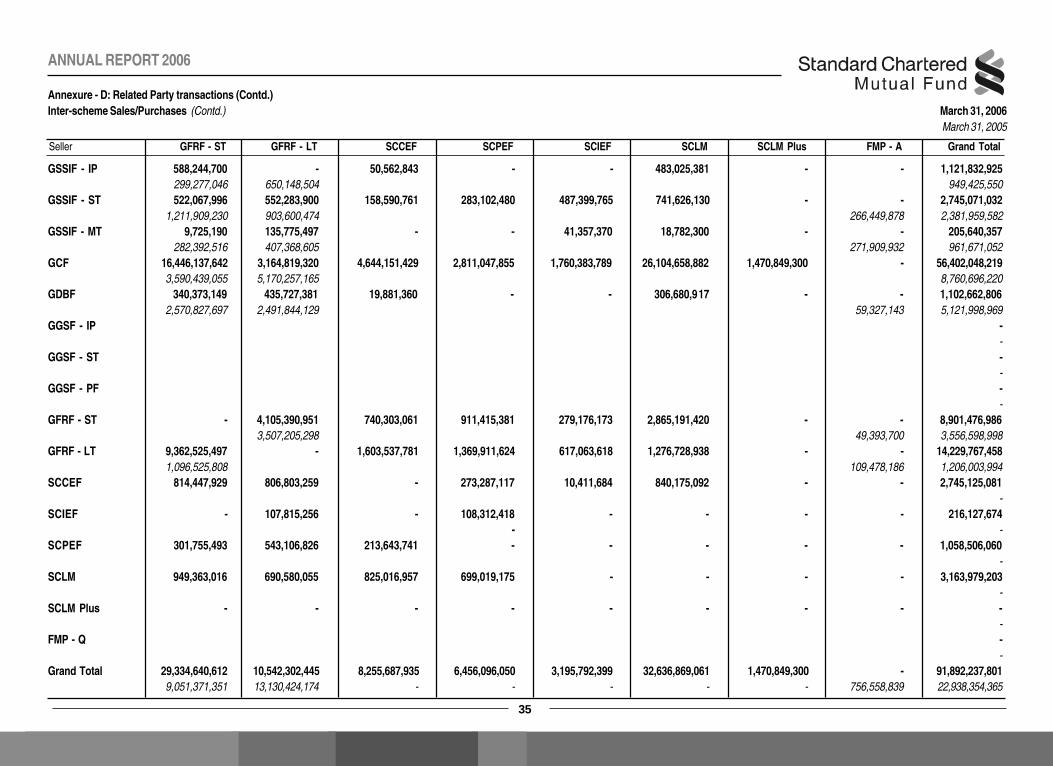
ANNUAL REPORT 2006
35
Annexure - D: Related Party transactions (Contd.)Inter-scheme Sales/Purchases (Contd.) March 31, 2006
March 31, 2005
GSSIF - IP 588,244,700 - 50,562,843 - - 483,025,381 - - 1,121,832,925 299,277,046 650,148,504 949,425,550
GSSIF - ST 522,067,996 552,283,900 158,590,761 283,102,480 487,399,765 741,626,130 - - 2,745,071,032 1,211,909,230 903,600,474 266,449,878 2,381,959,582
GSSIF - MT 9,725,190 135,775,497 - - 41,357,370 18,782,300 - - 205,640,357 282,392,516 407,368,605 271,909,932 961,671,052
GCF 16,446,137,642 3,164,819,320 4,644,151,429 2,811,047,855 1,760,383,789 26,104,658,882 1,470,849,300 - 56,402,048,219 3,590,439,055 5,170,257,165 8,760,696,220
GDBF 340,373,149 435,727,381 19,881,360 - - 306,680,917 - - 1,102,662,806 2,570,827,697 2,491,844,129 59,327,143 5,121,998,969
GGSF - IP - -
GGSF - ST - -
GGSF - PF - -
GFRF - ST - 4,105,390,951 740,303,061 911,415,381 279,176,173 2,865,191,420 - - 8,901,476,986 3,507,205,298 49,393,700 3,556,598,998
GFRF - LT 9,362,525,497 - 1,603,537,781 1,369,911,624 617,063,618 1,276,728,938 - - 14,229,767,458 1,096,525,808 109,478,186 1,206,003,994
SCCEF 814,447,929 806,803,259 - 273,287,117 10,411,684 840,175,092 - - 2,745,125,081 -
SCIEF - 107,815,256 - 108,312,418 - - - - 216,127,674 - -
SCPEF 301,755,493 543,106,826 213,643,741 - - - - - 1,058,506,060 -
SCLM 949,363,016 690,580,055 825,016,957 699,019,175 - - - - 3,163,979,203 -
SCLM Plus - - - - - - - - - -
FMP - Q - -
Grand Total 29,334,640,612 10,542,302,445 8,255,687,935 6,456,096,050 3,195,792,399 32,636,869,061 1,470,849,300 - 91,892,237,801 9,051,371,351 13,130,424,174 - - - - - 756,558,839 22,938,354,365
Seller GFRF - ST GFRF - LT SCCEF SCPEF SCIEF SCLM SCLM Plus FMP - A Grand Total
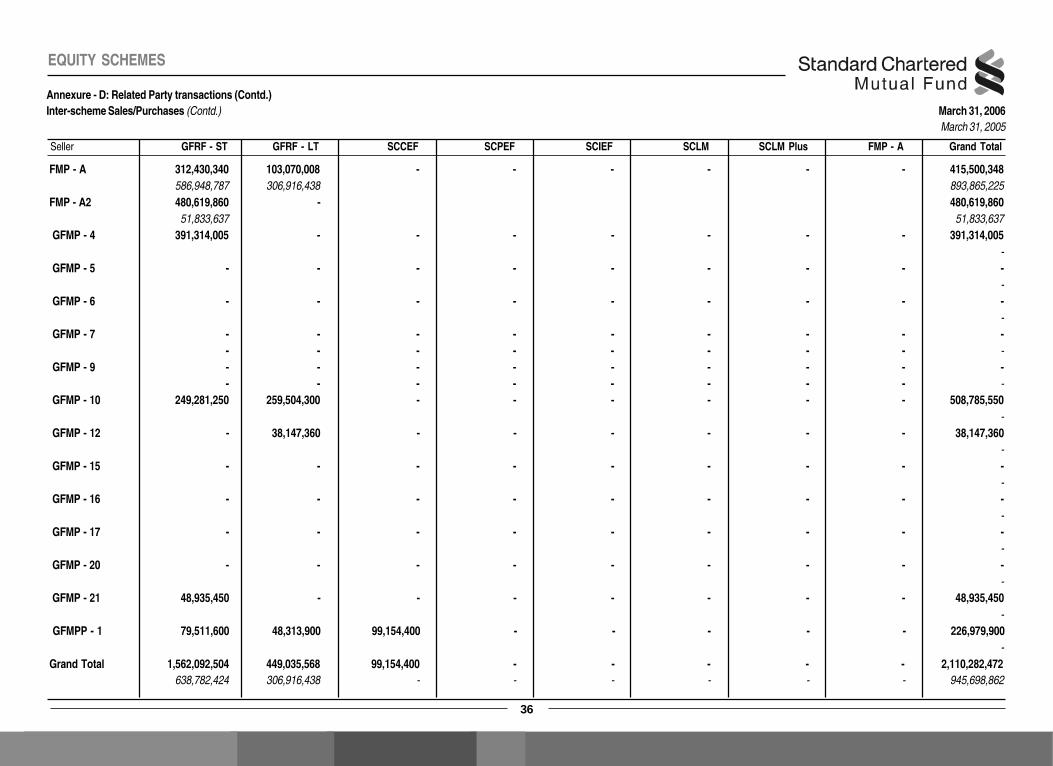
EQUITY SCHEMES
36
Annexure - D: Related Party transactions (Contd.)Inter-scheme Sales/Purchases (Contd.) March 31, 2006
March 31, 2005
FMP - A 312,430,340 103,070,008 - - - - - - 415,500,348 586,948,787 306,916,438 893,865,225
FMP - A2 480,619,860 - 480,619,860 51,833,637 51,833,637
GFMP - 4 391,314,005 - - - - - - - 391,314,005 -
GFMP - 5 - - - - - - - - - -
GFMP - 6 - - - - - - - - - -
GFMP - 7 - - - - - - - - - - - - - - - - - -
GFMP - 9 - - - - - - - - - - - - - - - - - -
GFMP - 10 249,281,250 259,504,300 - - - - - - 508,785,550 -
GFMP - 12 - 38,147,360 - - - - - - 38,147,360 -
GFMP - 15 - - - - - - - - - -
GFMP - 16 - - - - - - - - - -
GFMP - 17 - - - - - - - - - -
GFMP - 20 - - - - - - - - - -
GFMP - 21 48,935,450 - - - - - - - 48,935,450 -
GFMPP - 1 79,511,600 48,313,900 99,154,400 - - - - - 226,979,900 -
Grand Total 1,562,092,504 449,035,568 99,154,400 - - - - - 2,110,282,472 638,782,424 306,916,438 - - - - - - 945,698,862
Seller GFRF - ST GFRF - LT SCCEF SCPEF SCIEF SCLM SCLM Plus FMP - A Grand Total

ANNUAL REPORT 2006
37
Annexure - D: Related Party transactions (Contd.)Inter-scheme Sales/Purchases (Contd.) March 31, 2006
March 31, 2005
GSSIF - IP - - 26,903,916 63,723,362 79,125,002 17,793,630 - 8,749,512 196,295,422 412,788,242 252,084,899 897,388,135 544,790,313 49,631,447 2,156,683,037
GSSIF - ST - - 74,914,622 204,568,754 388,850,111 135,939,253 11,449,012 9,236,408 824,958,161 272,495,529 262,689,161 45,161,304 100,372,362 262,235,176 146,466,998 1,089,420,529
GSSIF - MT 19,274,500 - - - 9,584,100 - - - 28,858,600 11,492,808 204,893,816 116,190,152 44,170,845 376,747,621
GCF - - 4,938,585 30,395,109 36,545,529 36,271,607 - 4,938,585 113,089,415 377,619,000 47,415,650 425,034,650
GDBF - - - 22,051,606 11,035,388 11,037,134 - - 44,124,128 427,502,016 430,629,370 364,766,866 906,447,798 365,244,304 2,494,590,354
GGSF - IP - - - - - - - - - - - - - - - - - -
GGSF - ST - - - - - - - - - - - - - - - - - -
GGSF - PF - - - - - - - - - - - - - - - - - -
GFRF - ST 49,444,750 - 391,327,237 - - - - - 440,771,987 - 16,277,333 282,935,600 299,212,933
GFRF - LT 9,543,140 - - 11,108,305 9,660,660 9,607,740 - - 39,919,845 489,886,170 - 209,786,298 699,672,467
SCCEF - - - - - - - - - - - - - - - - - -
SCIEF - - - - - - - - - - - - - - - - - -
SCPEF - - - - - - - - - - - - - - - - - -
SCLM - - - - - - - - - - - - - - - - - -
SCLM Plus - - - - - - - - - - - - - - - - - -
FMP - Q - - - - - - - - - - - - - - - - - -
Grand Total 78,262,390 - 498,084,360 331,847,135 534,800,790 210,649,364 11,449,012 22,924,505 1,688,017,557 1,189,883,715 16,277,333 1,987,940,479 866,906,885 2,020,398,447 1,216,440,638 - 243,514,095 7,541,361,592
Seller FMP - A2 GFMP - 3 GFMP - 4 GFMP - 5 GFMP - 6 GFMP - 7 GFMP - 8 GFMP - 9 Grand Total

EQUITY SCHEMES
38
Annexure - D: Related Party transactions (Contd.)Inter-scheme Sales/Purchases (Contd.) March 31, 2006
March 31, 2005
GSSIF - IP - - 75,976,972 - 228,871,847 - - - 304,848,819 - - - - - - - - -
GSSIF - ST - - - - 1,142,484,837 192,480,000 - - 1,334,964,837 - - - - - - - - -
GSSIF - MT - - - - - - - - - - - - - - - - - -
GCF - 197,300,400 7,901,736 262,828,076 15,803,472 576,467,200 - 633,747,420 1,694,048,304 1,482,964,030 - - - - - - - 1,482,964,030
GDBF - - 20,206,841 - - - - - 20,206,841 - - - - - - - - -
GGSF - IP - - - - - - - - - - - - - - - - - -
GGSF - ST - - - - - - - - - - - - - - - - - -
GGSF - PF - - - - - - - - - - - - - - - - - -
GFRF - ST - - 47,120,500 - - 528,164,800 9,528,010 - 584,813,310 - - - - - - - - -
GFRF - LT - - 41,206,739 - - 32,522,190 - - 73,728,929 - - - - - - - - -
SCCEF - - - - - - - - - - - - - - - - - -
SCIEF - - - - - - - - - - - - - - - - - -
SCPEF - - - - - - - - - - - - - - - - - -
SCLM - - - - - - - - - - - - - - - - - -
SCLM Plus - - - - - - - - - - - - - - - - - -
FMP - Q - - - - - - - - - - - - - - - - - -
Grand Total - 197,300,400 192,412,788 262,828,076 1,387,160,156 1,329,634,190 9,528,010 633,747,420 4,012,611,040 1,482,964,030 - - - - - - - 1,482,964,030
Seller GFMP - 10 GFMP - 11 GFMP - 12 GFMP - 15 GFMP - 16 GFMP - 17 GFMP - 18 GFMP - 19 Grand Total

ANNUAL REPORT 2006
39
Annexure - D: Related Party transactions (Contd.)Inter-scheme Sales/Purchases (Contd.) March 31, 2006
March 31, 2005
GSSIF - IP 49,473,506 - 16,535,611 - - 66,009,117 - - - - - -
GSSIF - ST 695,882,248 - 115,685,682 110,147,977 - 921,715,908- - - - - -
GSSIF - MT - - - - - - - - - - - -
GCF 530,180,010 645,927,050 - 886,740,980 866,738,316 2,929,586,356 - - - - - -
GDBF - - 14,703,895 - - 14,703,895 - - - - - -
GGSF - IP - - - - - -- - - - - -
GGSF - ST - - - - - - - - - - - -
GGSF - PF - - - - - - - - - - - -
GFRF - ST - - - - - - - - - - - -
GFRF - LT 51,338,024 - - 107,831,923 - 159,169,947 - - - - - -
SCCEF - - - - - - - - - - - -
SCIEF - - - - - - - - - - - -
SCPEF - - - - - - - - - - - -
SCLM - - - - - - - - - - - -
SCLM Plus - - - - - - - - - - - -
FMP - Q - - - - - - - - - - - -
Grand Total 1,326,873,788 645,927,050 146,925,188 1,104,720,880 866,738,316 4,091,185,223 - - - - - -
Seller GFMP - 20 GFMP - 21 GFMP - 22 GFMPP - 1 SCFMP - 3 Grand Total

40
ANNUAL REPORT 2006
Copy of offer document and key information memorandum along with application form may be obtained from the office of Standard Chartered Mutual Fund, 90, MG Road, Mumbai 400 001. Contact 1-800-226622 for details. Risk Factors: Mutual Funds and securities investments are subject to market risks, reinvestment risk,changes in political, economic environment and government policy and there is no assurance or guarantee that the objectives of the Scheme/s will be achieved. TheNAV of the Scheme/s can go up or down depending on factors and forces affecting the Securities Market. Past performance of the Sponsor/AMC/Mutual Fund isnot necessarily indicative of the future performance of the Scheme. Standard Chartered Classic Equity Fund (SCCEF), Standard Chartered Premier Equity Fund(SCPEF) and Standard Chartered Imperial Equity Fund (SCIEF) are the names of the Schemes and does not in any manner indicate either the quality of theScheme(s), their future prospects or returns. The Sponsor or any of its associates is not responsible or liable for any loss resulting from the operation of the Schemebeyond the corpus of the Trust of Rs. 20,000/- Investors in the scheme are not being offered any guaranteed or assured rate of return. Scheme specific risk: Thescheme(s) proposes to invest in equity and equity related instruments which by nature are volatile and prone to price fluctuations on a daily basis due to both macroand micro factors. Trading volumes, settlement periods and transfer procedures may restrict the liquidity of these investments. Investment Objective: SCCEF isan open ended Equity Scheme to generate long term capital growth from a diversified portfolio of predominantly equity and equity related instruments SCPEF (inbrief): The Scheme shall seek to generate long-term capital growth from an actively managed portfolio of predominantly equity and equity related instruments. TheScheme portfolio would seek to acquire, inter alia, small and medium size businesses with good long term potential, which are available at cheap valuations. Suchsecurities would be identified through disciplined fundamental research keeping in view medium to long-term trends in the business environment. The Scheme shallendeavor to accumulate long-term investor wealth by opening subscriptions to units during periods when stocks are available at reasonable valuations. By doing so,the Fund managers would endeavor to prevent short-term money from flowing into the fund which can prove detrimental to the interests of long-term investors.SCIEF: The investment objective of the Scheme is to seek to generate capital appreciation and/or provide income distribution from a portfolio of predominantly equityand equity related instruments. There is no assurance or guarantee that the objectives of the scheme will be realized. Asset Allocation: SCCEF & SCPEF : Equityand equity related instruments 65-100% , Debt and money market instruments 0-35%,securitised debt instruments 0.-35%, Investments in derivatives, securitieslending ,foreign debt instruments and ADR / GDR upto 50%, upto 35%,upto 35% and upto 50% (subject to SEBI regulations ) of net assets of the schemerespectively. SCIEF: 65%-100% in Equity and Equity related securities, 0% - 35% in debt and money market instruments, 0% - 35% in securitised debt instruments.Investment in Derivatives – upto the limits permitted by SEBI Mutual Funds regulations from time to time. Investments in Securities Lending – upto 100% of theequity investments of the Scheme, Investments in Foreign debt instruments – up to 35% of the net assets of the Scheme, Investments in ADRs and GDRs issuedby Companies in India / equity of listed overseas companies as permitted by SEBI regulations – upto 50% of the net assets of the scheme. Terms of Issue,Redemption & Load Structure: SCCEF, SCPEF & SCIEF are open ended Equity Schemes. SCCEF: The Units can be subscribed / redeemed at the ApplicableNAV, subject to applicable load, on all business days during the continuous offer. Entry Load: During the Ongoing Offer Period load will be charged as follows: amountto be invested being less than Rs. 5 Crores- 2.25%, Rs. 5 Crores or more- Nil, by an FOF (irrespective of the amount of Purchase)-Nil, by way of Dividend Re-investment-Nil, through SIP/STP where single installment is less than or equal to Rs. 10 Lakhs or equal to or more than Rs 5 Crores-Nil, through SIP/STP wheresingle installment is more than Rs. 10 Lakhs and less than Rs. 5 Crores- 2.25%.A switch-in may also attract an Entry Load like any Purchase however no load shallbe chargeable on investments switched by investors between Equity Scheme(s) of Standard Chartered Mutual Fund. Conditions Apply Exit Load: Within 2 yearsfrom the date of allotment or Purchase applying First in First Out basis, if the Purchase was made through SIP/STP in cases where single installment is less thanor equal to Rs. 10 lakhs and the entry load applicable at the time of SIP/STP purchase was NIL - 2.00%. No Entry / Exit Loads / CDSC will be chargeable in caseof switches made between different options of the Scheme. If the SIP/STP is discontinued prior to minimum six months after commencement of SIP/STP, an exitload of 2% will be charged on such investments irrespective of the date of redemption. SCPEF: The Units are available at Applicable NAV, subject to applicableload, on all business days during the continuous offer. Entry Load: During the Ongoing Offer Period load will be charged as follows: For purchases of any amount- 2.25%, by an FOF (irrespective of the amount of Purchase)-Nil, by way of Dividend Re-investment-Nil, through SIP/STP -2.25%.A switch-in (including switch infrom other equity schemes of SCMF) may also attract an Entry Load like any Purchase. Exit Load: Within 1 year from the date of allotment or Subscription applyingFirst in First Out basis, (including investments through SIPs/ STPs ) - 1.00%. No Entry / Exit Loads / CDSC will be chargeable in case of switches made betweendifferent options of the Scheme. If the SIP/STP is discontinued prior to minimum six months after commencement of SIP/STP, an exit load of 2% will be chargedon such investments irrespective of the date of redemption. SCIEF: The Units are available at applicable NAV during continuous offer. During the Ongoing OfferPeriod: Entry Load: For Purchases Of less than Rs. 5 Crores (other than by way of SIPs/ STPs) - 2.25%, Of Rs. 5 Crores or more (other than by way of SIPs/STPs) – Nil, By an FOF (irrespective of the amount of Purchase) – Nil, By way of Dividend Re-investment – Nil, Through SIP/STP where single instalment is lessthan or equal to Rs. 10 Lakhs or equal to or more than Rs 5 Crores – Nil, Through SIP/STP where single instalment is more than Rs 10 Lakhs and less than Rs 5Crores - 2.25 % . A switch-in may also attract an Entry Load like any Purchase however no load shall be chargeable on investments switched in by investors fromother Equity Scheme(s) of Standard Chartered Mutual Fund (such switches may however be subject to exit load as applicable in the scheme from where theinvestments are switched out). Exit Load: For purchases of Rs 5 crores or more – Nil, for purchases of less than Rs 5 crores (other than by way of SIPs/STPs wheresingle instalment is less than or equal to Rs. 10 lakhs) and if redeemed within six months from the date of Purchase - 1.00%. For Purchases applying First in FirstOut basis if the purchase is made through SIP/STP in cases where single instalment is less than or equal to Rs 10 Lakhs, if redeemed within 2 years from the dateof purchase – 2.00%. No Entry / Exit Loads / CDSC will be chargeable in case of switches made between different options of the Scheme. If the SIP/STP isdiscontinued prior to minimum six months after commencement of SIP/STP during the ongoing offer an exit load of 2% will be charged on such investmentsirrespective of the date of redemption. It is clarified that if the fund fails to get the proceeds from two instalments out of a series of instalments submitted at the timeof initiating a SIP (Subject to a minimum of six instalments), the SIP is deemed as discontinued and the stated exit load as applicable for an SIP discontinuationwill be applicable. Statutory Details: Standard Chartered Mutual Fund has been set up as a trust by Standard Chartered Bank (liability restricted to corpus of Trustof Rs. 20,000) with Standard Chartered Trustee Company Private Limited (Company with limited liability) as the trustee and Standard Chartered Asset ManagementCompany Private Limited (Company with limited liability) as the investment manager. For other scheme specific risk factors and other details please read theOffer Document carefully before investing.
RISK FACTORS

Ahmedabad : Ground Floor, Zodiac Avenue, Opp. Mayor Bungalow, Near Westside, Law Garden, Ahmedabad - 380006 Tel : 26400572
Bangalore : Raheja Point, 2nd Floor, Opp. Garuda Mall, Magrath Road, Bangalore - 560025. Tel.: 080 - 66111504/05/06.
Chandigarh : SCO 137-138, Sector 9 C, Madhya Marg, Chandigarh-17. Tel.: 5071918/19.
Chennai : Grindlays Centre, I Floor, 19, Rajaji Salai, Chennai-1. Tel.: 25349371/72/73.
Cochin : 1st Floor, HDFC House, Ravipuram Junction, M. G. Road, Cochin -15. Tel.: 2358639.
Coimbatore : Red Rose Plaza, 509, D. B. Road, R. S. Puram, Coimbatore - 2. Tel.: 2542645 / 78
Hyderabad : #6/3/1090, TSR Towers, Raj Bhavan Road, Somajiguda, Hyderabad-82. Tel.: 66779925.
Indore : D. M. Towers, 21/1, Race Course Road, lndore-452 001. Tel.: 4206927/23
Jaipur : G-7,8, AnukampaTower, Church Road, Jaipur, Rajasthan-1. Tel.: 5105798.
Kanpur : 16/105, Mahatma Gandhi Road, Mall Road, Kanpur-1. Tel.: 2305955/2331071.
Kolkata : 41, Chowringee, Kolkata-71. Tel.: 22881686/ 22883017.
Lucknow : Narain Automobiles, 4 Shahnazaf Road, Lucknow-1. Tel.: 2200097.
Ludhiana : SCO 16-17, Feroze Gandhi Market, Ludhiana-1. Tel.: 5022155/56.
Mumbai : 270, D N Road, 4th floor, Cox Building, Fort, Mumbai - 1. Tel.: 22683993.
Nagpur : Narang Towers, 22, Palm Road, Civil Lines, Nagpur - 440 001. Tel.: 5620714.
New Delhi : 4th Floor, Narain Manzil, 23, Barakhamba Road, New Delhi - 110 001 Tel: 41513042-44
Patna : Bhagawati Dwaraka Arcade, Plot No. 830 P, Exhibition Road, Patna-1. Telefax: 2223172.
Pune : 1st Floor, Dr. Herekar Park Bldg., Next to Kamala Nehru Park, Off. Bhandarkar Road, Pune 411004 Tel.: 66020965.
Surat : C K Tower, 1st Floor, Near Sargam Shopping Centre, Parle Point, Surat-7. Tel.: 2254837.
Vadodara : Ground Floor, Akashganga Complex, Adjacent to Vanijya Bhawan, Vadodara-7. Tel.: 6620919/39.