Equity Research Reports… - CIMB€¦ · equity research│april 26, 2016 important disclosures,...
25
Equity research│April 26, 2016 IMPORTANT DISCLOSURES, INCLUDING ANY REQUIRED RESEARCH CERTIFICATIONS, ARE PROVIDED AT THE END OF THIS REPORT. IF THIS REPORT IS DISTRIBUTED IN THE UNITED STATES IT IS DISTRIBUTED BY CIMB SECURITIES (USA), INC. AND IS CONSIDERED THIRD-PARTY AFFILIATED RESEARCH. Powered by the EFA Platform Asia Pacific Daily - 26 April 2016 Equity Research Reports… ▌IDEA OF THE DAY | Hong Kong Environmental (OVERWEIGHT) - Together in electric dreams | P2 Policies to encourage EV usage in China will drive lithium EV battery annual demand 5.5x to 46GWh by 2020, providing opportunities for local battery producers. Lead-acid batteries remain in mainstream use for short distance applications, and will underpin earnings over the short-term as Chinese-makers transition to lithium. We initiate coverage of China battery sector with an Overweight call and Tianneng Power and Chaowei Power with Add ratings and upside of 19-28% to our target prices. ——————————————————————————————————————————————————————————————————————————————————————— ▌China/Hong Kong Gaming (OVERWEIGHT) - GGR weekly: 24 Apr 2016 | P3 ——————————————————————————————————————————————————————————————————————————————————————— ▌India HDFC Bank (ADD, tp:Rs1,270.00▲) - Another strong quarter | P4 Mahindra & Mahindra Fin. (HOLD, tp:Rs285.00▲) - Strong recovery | P5 Auto & Parts - Overall (OVERWEIGHT) - Growth widens wings | P6 ——————————————————————————————————————————————————————————————————————————————————————— ▌Indonesia Bank Rakyat Indonesia (ADD, tp:Rp13,600.00) - Muted impact from single digit SME lending rate | P7 Bank Tabungan Negara (ADD, tp:Rp2,070.00) - 1Q16 results: a good start | P8 Strategy Note-Alpha - Picking what to buy and sell from the rally | P9 ——————————————————————————————————————————————————————————————————————————————————————— ▌Malaysia Axis REIT (ADD, tp:RM1.80) - Asset injections to drive growth | P10 Bursa Malaysia (HOLD, tp:RM8.44▼) - 1Q16 results – not a good start to 2016 | P11 Sime Darby Bhd (HOLD, tp:RM7.78) - Targets higher yield via Genome Select | P12 ——————————————————————————————————————————————————————————————————————————————————————— ▌Singapore Mapletree Industrial Trust (HOLD, tp:S$1.67▲) - 4QFY16: credible performance | P13 Raffles Medical Group (REDUCE, tp:S$4.23) - Revenue ahead, but still outweighed by costs | P14 Economic Update - Mar 16 CPI: Steeper decline due to high base | P15 ——————————————————————————————————————————————————————————————————————————————————————— ▌Taiwan Poya Co Ltd (HOLD, tp:NT$348.00▲) - Short-term hiccup | P16 ——————————————————————————————————————————————————————————————————————————————————————— ▌Thailand Mega Lifesciences PCL (ADD, tp:THB19.30▼) - 1Q16 preview: Headwinds for branded topline | P17 MK Restaurant Group (HOLD, tp:THB57.00) - Consumption or Competitors? | P18 Quality Houses (ADD, tp:THB3.00) - Feedback from non-deal roadshow | P19 Showcasing CIMB Research Ideas CHN: Strategy Note-Alpha 22/04 VAT/BT reform – structurally positive to enhance tax system >PDF ——————————————————————————————————————————————————————————————————————————————————— HKG: Gaming 21/04 Ultra-premium continues recovery: Eye on Macau Vol. 31 - April mass table analysis >PDF ——————————————————————————————————————————————————————————————————————————————————— APAC: Economic Focus 20/04 Asian Currencies: Awaiting a Reversal >PDF ——————————————————————————————————————————————————————————————————————————————————— HKG: Union Medical Healthcare 19/04 Aesthetically pleasing >PDF ——————————————————————————————————————————————————————————————————————————————————— IND: Construction 17/03 Bigger and bolder >PDF Regional Equity Research Contacts Kenneth NG, CFA Head of Research T: (65) 6210 8610 E: [email protected] ——————————————————————————————————————————————————————————————————————————————————— Show Style "View Doc Map" CIMB Conference / Events | CIMB Malaysia Construction & Infrastructure Day 28 April 2016, Mandarin Oriental Kuala Lumpur, Malaysia ——————————————————————————————————————————————————————————————————————————————————— CIMB HK/China Property Corporate Day 18 May 2016, Island Shangri-La Hotel, Hong Kong ——————————————————————————————————————————————————————————————————————————————————— CIMB 10th Annual Indonesia Conference 08-12 August 2016, Bali ——————————————————————————————————————————————————————————————————————————————————— Page 1
Transcript of Equity Research Reports… - CIMB€¦ · equity research│april 26, 2016 important disclosures,...
Equity research│April 26, 2016
IMPORTANT DISCLOSURES, INCLUDING ANY REQUIRED RESEARCH CERTIFICATIONS, ARE PROVIDED AT THE END OF THIS REPORT. IF THIS REPORT IS DISTRIBUTED IN THE UNITED STATES IT IS DISTRIBUTED BY CIMB SECURITIES (USA), INC. AND IS CONSIDERED THIRD-PARTY AFFILIATED RESEARCH.
Powered by the EFA Platform
Asia Pacific Daily - 26 April 2016
Equity Research Reports…
▌IDEA OF THE DAY | Hong Kong Environmental (OVERWEIGHT) - Together in electric dreams | P2 Policies to encourage EV usage in China will drive lithium EV battery annual demand 5.5x to 46GWh by 2020, providing opportunities for local battery producers. Lead-acid batteries remain in mainstream use for short distance applications, and will underpin earnings over the short-term as Chinese-makers transition to lithium. We initiate coverage of China battery sector with an Overweight call and Tianneng Power and Chaowei Power with Add ratings and upside of 19-28% to our target prices. ——————————————————————————————————————————————————————————————————————————————————————— ▌China/Hong Kong Gaming (OVERWEIGHT) - GGR weekly: 24 Apr 2016 | P3 ——————————————————————————————————————————————————————————————————————————————————————— ▌India HDFC Bank (ADD, tp:Rs1,270.00▲) - Another strong quarter | P4 Mahindra & Mahindra Fin. (HOLD, tp:Rs285.00▲) - Strong recovery | P5 Auto & Parts - Overall (OVERWEIGHT) - Growth widens wings | P6 ——————————————————————————————————————————————————————————————————————————————————————— ▌Indonesia Bank Rakyat Indonesia (ADD, tp:Rp13,600.00) - Muted impact from single digit SME lending rate | P7 Bank Tabungan Negara (ADD, tp:Rp2,070.00) - 1Q16 results: a good start | P8 Strategy Note-Alpha - Picking what to buy and sell from the rally | P9 ——————————————————————————————————————————————————————————————————————————————————————— ▌Malaysia Axis REIT (ADD, tp:RM1.80) - Asset injections to drive growth | P10 Bursa Malaysia (HOLD, tp:RM8.44▼) - 1Q16 results – not a good start to 2016 | P11 Sime Darby Bhd (HOLD, tp:RM7.78) - Targets higher yield via Genome Select | P12 ——————————————————————————————————————————————————————————————————————————————————————— ▌Singapore Mapletree Industrial Trust (HOLD, tp:S$1.67▲) - 4QFY16: credible performance | P13 Raffles Medical Group (REDUCE, tp:S$4.23) - Revenue ahead, but still outweighed by costs | P14 Economic Update - Mar 16 CPI: Steeper decline due to high base | P15 ——————————————————————————————————————————————————————————————————————————————————————— ▌Taiwan Poya Co Ltd (HOLD, tp:NT$348.00▲) - Short-term hiccup | P16 ——————————————————————————————————————————————————————————————————————————————————————— ▌Thailand Mega Lifesciences PCL (ADD, tp:THB19.30▼) - 1Q16 preview: Headwinds for branded topline | P17 MK Restaurant Group (HOLD, tp:THB57.00) - Consumption or Competitors? | P18 Quality Houses (ADD, tp:THB3.00) - Feedback from non-deal roadshow | P19
Sources: CIMB. COMPANY REPORTS
Showcasing CIMB Research Ideas
CHN: Strategy Note-Alpha 22/04 VAT/BT reform – structurally positive to enhance tax system >PDF
———————————————————————————————————————————————————————————————————————————————————
HKG: Gaming 21/04 Ultra-premium continues recovery: Eye on Macau Vol. 31 - April mass table analysis >PDF
———————————————————————————————————————————————————————————————————————————————————
APAC: Economic Focus 20/04 Asian Currencies: Awaiting a Reversal >PDF
———————————————————————————————————————————————————————————————————————————————————
HKG: Union Medical Healthcare 19/04 Aesthetically pleasing >PDF
———————————————————————————————————————————————————————————————————————————————————
IND: Construction 17/03 Bigger and bolder >PDF
Regional Equity Research Contacts
Kenneth NG, CFA
Head of Research T: (65) 6210 8610 E: [email protected]
———————————————————————————————————————————————————————————————————————————————————
Show Style "View Doc Map"
CIMB Conference / Events |
CIMB Malaysia Construction & Infrastructure Day 28 April 2016, Mandarin Oriental Kuala Lumpur, Malaysia
———————————————————————————————————————————————————————————————————————————————————
CIMB HK/China Property Corporate Day 18 May 2016, Island Shangri-La Hotel, Hong Kong
———————————————————————————————————————————————————————————————————————————————————
CIMB 10th Annual Indonesia Conference 08-12 August 2016, Bali
———————————————————————————————————————————————————————————————————————————————————
Page 1
https://brokingrfs.cimb.com/TZM6qcHStd_7EjcFvZwpWWygG0CqetE9rskroBy8QVe2YLe4yJn6h4pRp80OqbCEN6Y1.pdf
https://brokingrfs.cimb.com/in303qBgjsvlmyGM_UojXCjw-9PxuZ9j4ssRZWbkR1SEYM3xKEINmOUNKeqR5GQchWo1.pdf
https://brokingrfs.cimb.com/LrA_P9V_R8ycwHbdEQqvDzeGl5Aa-v9tN5T8nSAP613Phijg2JiuqKTMrXRuA1aLkdc1.pdf
https://brokingrfs.cimb.com/BBTaz3Z-J5eMkX47pW7TgSz3OghZnWOA7xsGNX_0BQNunhBrCkpfx5GDRhfMDmkWj9I1.pdf
https://www.conference.cimb.com/reg/page.asp?eid=113&uritkn=8a24ea07bde7c1d89210dc2d1a292468a489498f

Navigating Hong Kong│Environmental│Equity research│April 25, 2016
Sector Note
IMPORTANT DISCLOSURES, INCLUDING ANY REQUIRED RESEARCH CERTIFICATIONS, ARE PROVIDED AT THE END OF THIS REPORT.
Powered by EFA
Environmental Together in electric dreams
Policies to encourage EV usage in China will drive lithium EV battery annual ■demand 5.5x to 46GWh by 2020, providing opportunities for local battery producers.
Lead-acid batteries remain in mainstream use for short distance applications, and ■will underpin earnings over the short-term as Chinese-makers transition to lithium.
We initiate coverage of the sector with an Overweight call, and Tianneng Power and ■Chaowei Power with Add ratings and upside of 19-28% to our target prices.
Favourable policies and new affordable models drive EV demand Despite the 343% yoy jump in 2015 to 331k units, we expect these factors to drive electric vehicles (EV) demand in 2016-2020: 1) favourable policies e.g. enhanced charging facilities and EV subsidy, and 2) new models by local automakers at affordable prices. The government is targeting cumulative EV sales of 5m units and 2m new energy vehicles (NEV) sales p.a. by end-2020.
Domestic battery manufacturers the key EV beneficiaries We believe domestic battery manufacturers are key beneficiaries due to their: 1) competitive cost structure, 2) strong local government support, 3) solid production track record with proven product performance, 4) financial stability, with steady supply, and 5) close relationship with local automakers.
Lithium motive batteries demand to surge 5.5x by 2020
We forecast lithium motive battery demand, mainly from domestic EV manufacturers, will jump 5.5x from c.8GWh (equivalent to 330k NEVs) in 2015 to over 46GWh (equivalent to 2m NEVs) in 2020, which translates to 41% CAGR in 2016-2020. Apart from BYD aggressively boosting capacity from 10GWh/year in 2015 to 28GWh/year by end-2018, Tianneng Power and Chaowei Power each plan to add 5GWh/year to their lithium battery capacity by end-2018.
Lead-acid battery: mainstream for short distance transportation We expect a 6% CAGR in 2015-2020 from lead-acid motive battery demand in China, as lead-acid should remain the mainstream power supply for short distance transportation due to its cost-efficiency. We believe the transition to Li-ion will be slow, especially in rural areas where power consumption is low and consumers more price-sensitive. The largest e-bike/tricycle/mini electric car battery producers, Tianneng and Chaowei, control over 80% of the e-bike battery market, and will benefit from steady demand growth and stable lead-acid motive battery prices as competition eases, in our view.
Tianneng Power and Chaowei Power our battery sector top picks We initiate coverage of China battery sector with an Overweight call. We also initiate coverage of Tianneng Power with an Add call and target price upside of 28%, as we think the market has underestimated earnings growth of MEC, which is underpinned by dominant battery market share of 58% and a 4x increase in lithium motive battery capacity to 5GWh by 2018, as well as Chaowei Power with an Add rating and target price upside of 19%, as we expect its FY16F net profit to rebound 83% driven by stabilised e-bike battery prices and contributions from graphene-type lead-acid batteries and lithium motive batteries.
[ X ]
Figure 1: Estimated battery market size for EV, MEC and tricycles/e-bikes in China
SOURCES: CIMB RESEARCH, COMPANY
▎Hong Kong
Overweight (no change) Highlighted companies
Chaowei Power Holdings Limited ADD, TP HK$6.04, HK$5.08 close
We expect Chaowei's net profit to rebound strongly in FY16 and grow 83% on the back of stabilised e-bike battery prices and contributions from graphene-type lead-acid batteries and lithium motive batteries. New growth drivers are its two fast-growing and high-margin segments: lithium EV batteries and start-stop batteries
Tianneng Power International Ltd ADD, TP HK$9.70, HK$7.61 close
We believe Tianneng will be the key beneficiary of the rapid growth of the mini electric car market in China given its dominant battery market share of 58%. The group is also well positioned to capture the robust demand for lithium EV batteries
Summary valuation metrics
Analysts
Ray KWOK
T (852) 2532 1113 E [email protected] Paul SNELGROVE T (852) 2532 1125 E [email protected]
0102030405060708090
100110120130
2009 2010 2011 2012 2013 2014 2015 2016 2017 2018 2019 2020
Rm
b (b
illio
n)
New Energy Car Batteries Electric Tricycle BatteriesElectric Bike Batteries Mini Electric Car Battery
P/E (x) Dec-16F Dec-17F Dec-18F
Chaowei Power Holdings Limited 8.24 6.78 5.73 Tianneng Power International Ltd 8.44 6.29 4.76
P/BV (x) Dec-16F Dec-17F Dec-18F
Chaowei Power Holdings Limited 1.34 1.12 0.91 Tianneng Power International Ltd 1.85 1.55 1.27
Dividend Yield Dec-16F Dec-17F Dec-18F
Chaowei Power Holdings Limited 3.64% 4.42% 5.24%Tianneng Power International Ltd 3.56% 4.77% 6.30%
3Page 2

Travel and Leisure│Hong Kong│Equity research
Sector Flash Note
IMPORTANT DISCLOSURES, INCLUDING ANY REQUIRED RESEARCH CERTIFICATIONS, ARE PROVIDED AT THE END OF THIS REPORT. IF THIS REPORT IS DISTRIBUTED IN THE UNITED STATES IT IS DISTRIBUTED BY CIMB SECURITIES (USA), INC. AND IS CONSIDERED THIRD-PARTY AFFILIATED RESEARCH. EFACustomEntityStatement|
Powered by the EFA Platform
Gaming GGR weekly: 24 Apr 2016
Weekly average daily revenue (ADR) for 18-24 Apr was MOP600m (+5% wow). ■ Maintain our Apr gross gaming revenue (GGR) forecast of MOP17.4bn (-9% yoy, -■3% mom).
Remain Overweight on the gaming sector, with Galaxy as our top pick. Share price ■catalysts could be from stronger than expected earnings or sector revenues.
Weekly ADR up wow ● Based on our estimates, for the first 24 days of Apr, ADR was MOP570m. For the
seven days ending on 24 Apr, ADR reached MOP600m (+5% wow), in line with our expectations. Assuming ADR of MOP620m for the final six days of the month, we project Apr GGR of MOP17.4bn (-9% yoy, -3% wow), in line with our expectations.
Buying opportunities – top pick Galaxy ● The sector is trading at 11x forward consensus EV/EBITDA, down from 12x last week
due to weaker investor sentiment following the poor Sands China 1QFY16 results, which were negatively affected by non-gaming weakness. The gaming sector could continue to see steady improvement in 2016, driven by an improving political climate resulting in higher gaming volumes. Our top pick remains Galaxy whose share price catalysts could come from higher-than-expected industry revenues or earnings.
Figure 1: Macau consensus forward EV/EBITDA
SOURCES: CIMB, BLOOMBERG
Title:
Source:
Please fill in the values above to have them entered in your report
7
9
11
13
15
17
19
EV/EBITDA Mean +1 Stdev -1 Stdev
▎Hong Kong April 25, 2016 - 7:31 PM
Overweight (no change) Highlighted companies
Galaxy Entertainment ADD, TP HK$39.91, HK$27.50 close
Galaxy continues to deliver strong performance across all gaming segments. In the longer term, Galaxy will have the most significant landbank, following the current Cotai expansion.
MGM China Holdings ADD, TP HK$15.20, HK$11.24 close
Given MGM China’s low fixed costs on an absolute basis, its earnings are likely to be the first to recover when sector revenues rise.
Sands China ADD, TP HK$36.92, HK$28.30 close
Sands China’s dividends are the most stable among all gaming operators, making this stock relatively defensive.
Summary valuation metrics
Analyst(s)
Michael TING
T (852) 2532 1121 E [email protected] Jensen POON T (852) 2868 0350 E [email protected]
P/E (x) Dec-16F Dec-17F Dec-18F
Galaxy Entertainment 20.08 19.57 18.42 MGM China Holdings 21.08 15.14 14.07 Sands China 22.79 20.62 19.40
P/BV (x) Dec-16F Dec-17F Dec-18F
Galaxy Entertainment 2.60 2.43 2.27 MGM China Holdings 2.98 4.02 3.33 Sands China 4.33 4.53 4.41
Dividend Yield Dec-16F Dec-17F Dec-18F
Galaxy Entertainment 2.49% 2.55% 2.71%MGM China Holdings 1.44% 2.01% 2.84%Sands China 7.77% 8.55% 9.41%
Page 3

Banks│India│Equity research│April 25, 2016
Company Note
IMPORTANT DISCLOSURES, INCLUDING ANY REQUIRED RESEARCH CERTIFICATIONS, ARE PROVIDED AT THE END OF THIS REPORT. IF THIS REPORT IS DISTRIBUTED IN THE UNITED STATES IT IS DISTRIBUTED BY CIMB SECURITIES (USA), INC. AND IS CONSIDERED THIRD-PARTY AFFILIATED RESEARCH.
Powered by the EFA Platform
HDFC Bank Another strong quarter
Strong 4QFY3/16 results, with strong underlying trends for loan/deposit growth, NIM ■and fee income. FY16 core net profit was in line at 99% of our forecast.
NIM was 4.3% in 4QFY16 despite some pressure on loan yield. It is the best-placed ■bank in the current environment, as ~33% of its loans are on floating rates.
Asset quality remains pristine Drawdown in floating provisions was largely due to ■provision on a loan to a state government, as directed by RBI.
Best-in-class return ratios, with ROE rising to 21% in FY18F. One of our top picks. ■
Strong loan growth in both retail and corporate segments 4QFY16 loan growth momentum was strong at 27% yoy (7% qoq). Retail loan growth was 30% yoy (4% qoq), while non-retail portfolio growth was 25% yoy. Most retail loan components posted strong growth in 4Q, as credit cards and personal loans (unsecured retail loans) rose 27% and 44% yoy, respectively, to comprise combined 26% of retail portfolio. Non-retail loan growth of 25% shows HDFC Bank gaining market share in contrast to most players (PSUs) that are plagued with high stress on balance sheets.
NIMs remained stable qoq at 4.3% despite falling yield on advances Higher-than-expected NII growth in 4QFY16 (24% yoy, 5.7% qoq) was driven by higher loan growth (27% yoy) and stable NIMs qoq (4.3%). Calculated yield on loans fell 14bp qoq but was offset by higher investment yields. CASA ratio improved 320bp qoq to 43%.
High fee growth but low other income due to high base Other income growth of 12% yoy in 4QFY16 was lower than expected due to the high fee income base in 4QFY15, drop in forex fees (-14% yoy) and lower portfolio gains (-41% yoy). Core fee income was strong at 18% yoy (from high base), supported by strong third-party distribution and origination fees related to retail loans. Cost-to-income ratio was 44.9% (ex-trading gains) in 4QFY16 (vs. 46% in 4QFY15). Costs could remain elevated due to branch openings, rising headcount and technology-related spends.
Stable asset quality Annualised incremental delinquencies stood at 1.5% (Rs17bn) for Q4FY16, with gross NPLs at 0.9% and net NPLs at 0.3%. Specific provisioning coverage ratio stood at ~70%. Outstanding standard restructured loans comprised 0.1% of loans in 4QFY16 (stable qoq). It made provisions of 7.5% on a Rs20bn loan to a state government as per RBI directive (with another 7.5% provision coming in 1QFY17). The Rs1.5bn provision was drawn down from stock of floating provisions and hence, had no P&L impact.
Outlook and valuations We like HDFC Bank’s strong retail presence, solid liabilities franchise and impeccable asset quality. FY16 earnings were in line. We forecast EPS CAGR of 25% in FY17-18, driven by stable NIMs and strong loan growth relative to peers. We cut EPS by 2%/1% in FY17/18 for higher opex and lower other income. We think HDFC’s valuations of 3.3x FY17 BV and 18.1x FY17 P/E are attractive, following the time correction over the past year. Maintain Add, with a higher discounted economic profit based TP of Rs1,270 (due to rollover).
▎India
ADD (no change) Current price: Rs1,092 Target price: Rs1,270 Previous target: Rs1,250
Up/downside: 16.3% Reuters: HDFCBK.BO Bloomberg: HDFCB IN Market cap: US$41,531m Rs2,761,159m Average daily turnover: US$23.19m Rs1,562m Current shares o/s 2,506m Free float: 84.5% Key changes in this note
FY17-18F revenue lowered by c.1%. FY17-18F EPS lowered by 1-2%. FY17-18F ROE cut by 0.5% pt.
Source: Bloomberg Price performance 1M 3M 12M
Absolute (%) 3.6 6 7.8 Relative (%) 1.6 0.3 15.2
Analyst(s)
Siddharth TELI
T (91) 22 6602 5158 E [email protected] Vivek VERMA T (91) 22 6602 5162 E [email protected]
[ X ]
SOURCE: COMPANY DATA, CIMB FORECASTS
Financial Summary Mar-14A Mar-15A Mar-16A Mar-17F Mar-18F
Net Interest Income (Rsm) 184,826 223,957 275,916 331,856 398,611Total Non-Interest Income (Rsm) 79,196 89,964 107,517 127,149 150,579Operating Revenue (Rsm) 264,023 313,920 383,434 459,005 549,190Total Provision Charges (Rsm) (15,873) (20,750) (27,256) (30,175) (34,547)Net Profit (Rsm) 84,784 102,159 122,963 154,119 193,428Core EPS (Rs) 35.49 41.65 48.81 60.58 75.27Core EPS Growth 24.7% 17.4% 17.2% 24.1% 24.3%FD Core P/E (x) 30.78 26.22 22.37 18.03 14.51DPS (Rs) 6.85 8.00 9.00 9.50 9.50Dividend Yield 0.63% 0.73% 0.82% 0.87% 0.87%BVPS (Rs) 181.2 247.4 287.1 335.0 397.1P/BV (x) 6.03 4.41 3.80 3.26 2.75ROE 21.3% 19.4% 18.3% 19.5% 20.6%% Change In Core EPS Estimates (2.33%) (1.34%)CIMB/consensus EPS (x)
94.099.0104.0109.0114.0119.0
920970
1,0201,0701,1201,170
Price Close Relative to SENSEX (RHS)
2
4
6
Apr-15 Jul-15 Oct-15 Jan-16
Vol m
Page 4
Finance Companies│India│Equity research│April 25, 2016
Company Note
IMPORTANT DISCLOSURES, INCLUDING ANY REQUIRED RESEARCH CERTIFICATIONS, ARE PROVIDED AT THE END OF THIS REPORT. IF THIS REPORT IS DISTRIBUTED IN THE UNITED STATES IT IS DISTRIBUTED BY CIMB SECURITIES (USA), INC. AND IS CONSIDERED THIRD-PARTY AFFILIATED RESEARCH.
Powered by the EFA Platform
Mahindra & Mahindra Finance Strong recovery
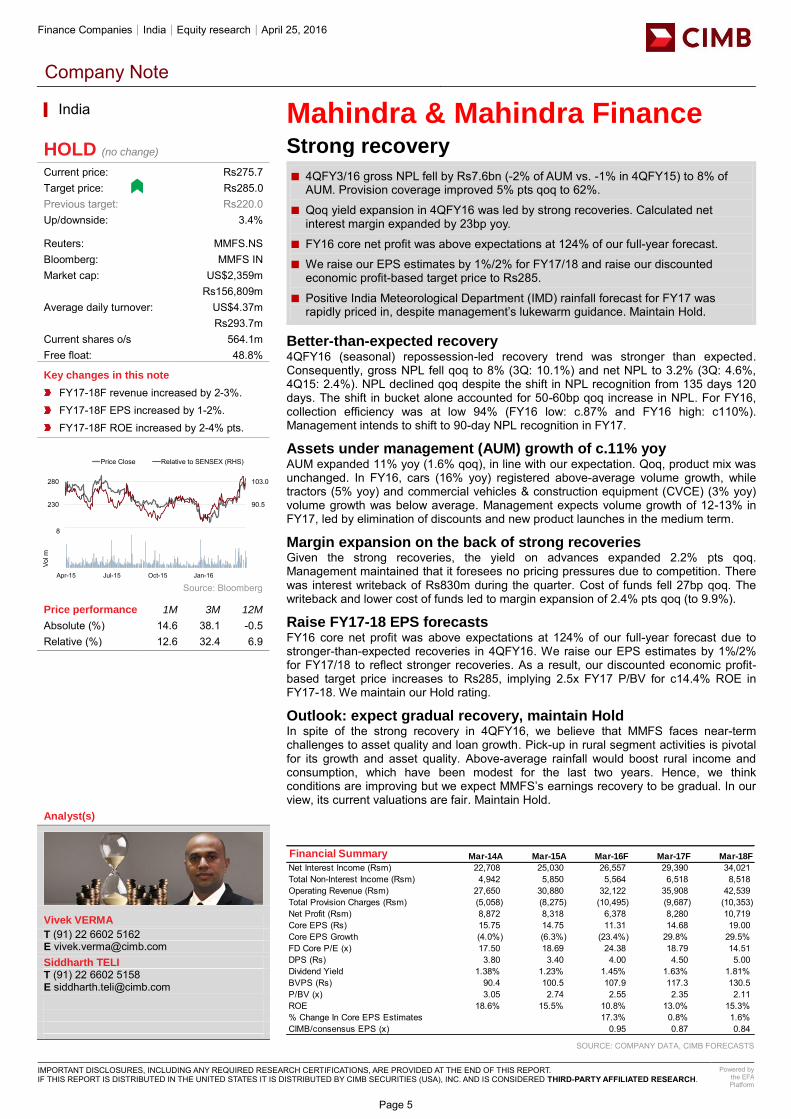
4QFY3/16 gross NPL fell by Rs7.6bn (-2% of AUM vs. -1% in 4QFY15) to 8% of ■AUM. Provision coverage improved 5% pts qoq to 62%.
Qoq yield expansion in 4QFY16 was led by strong recoveries. Calculated net ■interest margin expanded by 23bp yoy.
FY16 core net profit was above expectations at 124% of our full-year forecast. ■ We raise our EPS estimates by 1%/2% for FY17/18 and raise our discounted ■economic profit-based target price to Rs285.
Positive India Meteorological Department (IMD) rainfall forecast for FY17 was ■rapidly priced in, despite management’s lukewarm guidance. Maintain Hold.
Better-than-expected recovery 4QFY16 (seasonal) repossession-led recovery trend was stronger than expected. Consequently, gross NPL fell qoq to 8% (3Q: 10.1%) and net NPL to 3.2% (3Q: 4.6%, 4Q15: 2.4%). NPL declined qoq despite the shift in NPL recognition from 135 days 120 days. The shift in bucket alone accounted for 50-60bp qoq increase in NPL. For FY16, collection efficiency was at low 94% (FY16 low: c.87% and FY16 high: c110%). Management intends to shift to 90-day NPL recognition in FY17.
Assets under management (AUM) growth of c.11% yoy AUM expanded 11% yoy (1.6% qoq), in line with our expectation. Qoq, product mix was unchanged. In FY16, cars (16% yoy) registered above-average volume growth, while tractors (5% yoy) and commercial vehicles & construction equipment (CVCE) (3% yoy) volume growth was below average. Management expects volume growth of 12-13% in FY17, led by elimination of discounts and new product launches in the medium term.
Margin expansion on the back of strong recoveries Given the strong recoveries, the yield on advances expanded 2.2% pts qoq. Management maintained that it foresees no pricing pressures due to competition. There was interest writeback of Rs830m during the quarter. Cost of funds fell 27bp qoq. The writeback and lower cost of funds led to margin expansion of 2.4% pts qoq (to 9.9%).
Raise FY17-18 EPS forecasts FY16 core net profit was above expectations at 124% of our full-year forecast due to stronger-than-expected recoveries in 4QFY16. We raise our EPS estimates by 1%/2% for FY17/18 to reflect stronger recoveries. As a result, our discounted economic profit-based target price increases to Rs285, implying 2.5x FY17 P/BV for c14.4% ROE in FY17-18. We maintain our Hold rating.
Outlook: expect gradual recovery, maintain Hold In spite of the strong recovery in 4QFY16, we believe that MMFS faces near-term challenges to asset quality and loan growth. Pick-up in rural segment activities is pivotal for its growth and asset quality. Above-average rainfall would boost rural income and consumption, which have been modest for the last two years. Hence, we think conditions are improving but we expect MMFS’s earnings recovery to be gradual. In our view, its current valuations are fair. Maintain Hold.
▎India
HOLD (no change) Current price: Rs275.7 Target price: Rs285.0 Previous target: Rs220.0
Up/downside: 3.4% Reuters: MMFS.NS Bloomberg: MMFS IN Market cap: US$2,359m Rs156,809m Average daily turnover: US$4.37m Rs293.7m Current shares o/s 564.1m Free float: 48.8% Key changes in this note
FY17-18F revenue increased by 2-3%. FY17-18F EPS increased by 1-2%. FY17-18F ROE increased by 2-4% pts.
Source: Bloomberg Price performance 1M 3M 12M
Absolute (%) 14.6 38.1 -0.5 Relative (%) 12.6 32.4 6.9
Analyst(s)
Vivek VERMA
T (91) 22 6602 5162 E [email protected] Siddharth TELI T (91) 22 6602 5158 E [email protected]
[ X ]
SOURCE: COMPANY DATA, CIMB FORECASTS
Financial Summary Mar-14A Mar-15A Mar-16F Mar-17F Mar-18F
Net Interest Income (Rsm) 22,708 25,030 26,557 29,390 34,021Total Non-Interest Income (Rsm) 4,942 5,850 5,564 6,518 8,518Operating Revenue (Rsm) 27,650 30,880 32,122 35,908 42,539Total Provision Charges (Rsm) (5,058) (8,275) (10,495) (9,687) (10,353)Net Profit (Rsm) 8,872 8,318 6,378 8,280 10,719Core EPS (Rs) 15.75 14.75 11.31 14.68 19.00Core EPS Growth (4.0%) (6.3%) (23.4%) 29.8% 29.5%FD Core P/E (x) 17.50 18.69 24.38 18.79 14.51DPS (Rs) 3.80 3.40 4.00 4.50 5.00Dividend Yield 1.38% 1.23% 1.45% 1.63% 1.81%BVPS (Rs) 90.4 100.5 107.9 117.3 130.5P/BV (x) 3.05 2.74 2.55 2.35 2.11ROE 18.6% 15.5% 10.8% 13.0% 15.3%% Change In Core EPS Estimates 17.3% 0.8% 1.6%CIMB/consensus EPS (x) 0.95 0.87 0.84
78.0
90.5
103.0
180
230
280
Price Close Relative to SENSEX (RHS)
2468
Apr-15 Jul-15 Oct-15 Jan-16
Vol m
Page 5

Automobiles and Parts│India│Equity research│April 25, 2016
Sector Note
IMPORTANT DISCLOSURES, INCLUDING ANY REQUIRED RESEARCH CERTIFICATIONS, ARE PROVIDED AT THE END OF THIS REPORT. IF THIS REPORT IS DISTRIBUTED IN THE UNITED STATES IT IS DISTRIBUTED BY CIMB SECURITIES (USA), INC. AND IS CONSIDERED THIRD-PARTY AFFILIATED RESEARCH.
Powered by the EFA Platform
Auto & Parts - Overall Growth widens wings
We expect a revival in auto sector growth in FY17F, driven by voluminous 2-■wheelers and rural market. Cars and M&HCV growth rates to ease yoy.
Recent revival in monthly sales volume for LCV, 2-wheelers and tractors to improve ■further, helped by improved rainfall and loan availability.
Big market share gainers in FY16 were Ashok (M&HCV) and Mahindra (LCV) may ■take a breather. We expect Tata to gain back part of lost ground in FY17F.
Maintain Overweight with preference for 2-wheelers and tractor makers. ■
Commercial Vehicle segment – winner takes all Ashok Leyland’s second year of sustained high growth in the M&HCV segment along with lumpy market share gains (at 15-year high) make it a winner in the segment. We feel the pre-buying benefits of BS-IV emissions are largely behind us, and scrappage policy will be difficult to implement. In our bull case scenario, we expect LCV growth rate to outperform that of MHCV in FY17F.
Two wheelers – sustained growth revival key for re-rating The revival in 2-wheeler demand post festive period was impressive, leading to double-digit growth in Feb-Mar 2016. The easing competition from Honda (130bp dip in 2H) coupled with sustained double-digit growth, supported by rural market revival, can improve profitability and lead to valuation re-rating, in our view.
Passenger vehicles – recent month slowdown is concerning The sustained hike in duty on cars and fuel has started to impact the car demand in recent months. We believe the concerns over policy correction due to diesel car/SUV pollution are behind us and factored into the valuations. We expect new product launches will drive SUVs’ growth, which will help the segment outperform cars in FY17F. This can drive Mahindra’s stock to outperform Maruti.
Rural theme re-emerges – help from rains and government plans The government corrected its policy for the agriculture sector in the recent budget. We believe the plan to double farm incomes in the next five years is a step in the right direction. Moreover, the recent favourable rainfall prediction by the Indian Meteorological Department (IMD) will lend support to the government’s plan. We believe this can revive the demand for agriculture equipment and motorcycles, and address investor concerns over limited potential due to high penetration, leading to a revival in sector valuations.
Overweight on sector – Add Mahindra, Hero and Maruti We reiterate our Overweight rating on the sector, as we expect the sales volume growth revival to spread to other segments like tractors, LCV and motorcycles. We maintain Add ratings on Mahindra, Hero Motocorp, Maruti Suzuki and Bajaj Auto. Ashok remains a Hold as valuations fully discount the MHCV growth. Reduce maintained for Tata Motors and Eicher Motors.
[ X ]
Figure 1: Domestic Sales Volume growth, by segment
SOURCES: CIMB RESEARCH, COMPANY
▎India
Overweight (no change) Highlighted companies
Mahindra & Mahindra ADD, TP Rs1,420, Rs1,326 close
Major beneficiary of improved rainfall outlook and rural demand revival, as 72% of consolidated EBIT is derived from these segments. Favourable valuations for 14.8% EPS CAGR expectation.
Maruti Suzuki ADD, TP Rs4,181, Rs3,816 close
A sharp correction in the stock price provides an opportunity to play the under-penetrated car segment’s demand revival from seventh pay commission benefits and new products’ success.
Tata Motors REDUCE, TP Rs289.1, Rs417.0 close
The sharp bounce back in the stock price undermines impact of Brexit and weakening product mix through Jaguar cars. Indian business continues to post losses.
Summary valuation metrics
Analyst(s)
Pramod AMTHE
T (91) 22 6602 5167 E [email protected]
March YE FY15 FY16 FY17F
Passenger cars and MPV 13.1% 8.3% 9.8% Sports Utility Vehicles 5.0% 6.3% 12.0%Total Passenger Vehicles 11.3% 7.9% 10.3%
M&HCV 21.7% 30.0% 10.0% LCV -18.9% -1.2% 7.0%Total Commercial Vehicles -7.6% 10.2% 8.3%
Two wheelers 8.1% 2.8% 11.4%Three wheelers 11.0% 1.1% 8.0%
Total Domestic Automobile Sector 8.0% 3.7% 11.0%
Tractors -13.0% -10.7% 10.0%
P/E (x) Dec-15F Dec-16F Dec-17F
Mahindra & Mahindra 23.89 21.31 18.64 Maruti Suzuki 25.31 19.32 16.86 Tata Motors 13.06 11.41 8.94
P/BV (x) Dec-15F Dec-16F Dec-17F
Mahindra & Mahindra 3.73 3.32 2.94 Maruti Suzuki 4.35 3.74 3.24 Tata Motors 2.04 1.70 1.44
Dividend Yield Dec-15F Dec-16F Dec-17F
Mahindra & Mahindra 0.96% 1.12% 1.28%Maruti Suzuki 0.95% 1.25% 1.51%Tata Motors 0.36% 0.66% 0.90%
Page 6

Banks│Indonesia│Equity research
Company Flash Note
IMPORTANT DISCLOSURES, INCLUDING ANY REQUIRED RESEARCH CERTIFICATIONS, ARE PROVIDED AT THE END OF THIS REPORT. IF THIS REPORT IS DISTRIBUTED IN THE UNITED STATES IT IS DISTRIBUTED BY CIMB SECURITIES (USA), INC. AND IS CONSIDERED THIRD-PARTY AFFILIATED RESEARCH.
Powered by the EFA Platform
Bank Rakyat Indonesia Muted impact from single digit SME lending rate
BBRI to cut its SME lending rate to 9.75% from 12.5% effective 1 May. ■ We expect muted impact given that the effective pricing (after adding service fee ■and admin fee, etc.) will be similar to the previous rate.
We believe the 4% drop in stock price today was a knee-jerk reaction. Maintain Add ■with unchanged GGM-based TP. BBRI remains our top pick among Indo banks.
Single digit SME lending rate ● A local newspaper reported that BBRI will cut its SME lending rate to 9.75% from
12.5% previously. The new lending rate will be effective 1 May 16, and will only be applicable to new borrowers and not existing borrowers. This follows a similar move by BBNI which cut its small segment (loan size lower than Rp5bn) lending rate to 9.95% from 12% effective 1 Apr.
Muted impact given similar effective pricing ● We believe the impact on margins will be muted given that it is only applicable to new
borrowers and not existing. Currently, BBRI has c.Rp69tr of SME loans with a loan size of above Rp1bn – 51% of total SME loan portfolio/12% of total loan book.
● The effective pricing on the new SME loan is relatively unchanged. Our channel check suggest that on top of the 9.75% lending rate there will be: 1) a service fee of 1.5% (which did not exist before), 2) a provision fee of 0.25%, and 3) an administration fee of 1% of total loan size; previously the admin fee was between Rp100k and Rp5m which was far below the 1% of loan size (Rp10m admin fee for Rp1bn loan). This brings the effective lending rate to 12.5% (9.75%+1.5% service fee+0.25% provision+1% admin fee).
● We do not expect a meaningful impact on overall margins from this move. We estimate that in the worst case scenario where 12% of its loan book experiences a 275bp lending rate cut, it will see c.30bp compression in its loan yield or c.5.5% earnings downside in FY16. The 30bp drop in loan yield can largely be offset by a 75bp drop in TD rate i.e. a 26bp drop in COF as TD represents 35% of interest bearing liabilities.
No more pressure on lending rates – BBRI remains our top pick ● Given that its micro loan (KUR) and corporate loan rates are already in single digits
(9% effective interest rate for KUR), we believe that regulatory pressure on the bank will greatly subside post this announcement.
● We believe the 4% drop in its stock price today was a knee jerk reaction to the news. BBRI remains our top pick among Indonesian banks given the lower risk of further cuts in lending rate, higher micro loan growth and lower COF from its heavy reliance on TD (which should gradually be re-priced lower over time). Maintain Add.
Figure 1: BBRI’s loan breakdown in Rptr - SME loans represent 24% of total loan
SOURCES: CIMB, COMPANY REPORTS
76 90 107 132 153 17975
8192
114125
135
4456
88
110131
156
5156
62
74
81
89
0
100
200
300
400
500
600
2010 2011 2012 2013 2014 2015
Micro SME Corporate Consumer
▎Indonesia April 25, 2016 - 12:03 AM
ADD (no change) Current price: Rp10,500 Target price: Rp13,600 Previous target: Rp13,600
Up/downside: 29.5% Reuters: BBRI.JK Bloomberg: BBRI IJ Market cap: US$19,632m Rp259,026,208m Average daily turnover: US$24.38m Rp328,775m Current shares o/s 24,669m Free float: 43.3% Key financial forecasts
Source: Bloomberg Price performance 1M 3M 12M
Absolute (%) -6.9 -8.1 -18.9 Relative (%) -8 -16.4 -8.7
Analyst(s)
Jovent GIOVANNY
T (62) 21 3006 1727 E [email protected] Timothy HANDERSON T (62) 21 3006 1724 E [email protected]
Dec-16F Dec-17F Dec-18F
Net Profit (Rpb) 27,180 32,476 38,035Core EPS (Rp) 1,001 1,203 1,414Core EPS Growth 5.4% 20.2% 17.5%FD Core P/E (x) 10.49 8.73 7.43Recurring ROE 19.9% 20.2% 20.1%P/BV (x) 1.92 1.63 1.38DPS (Rp) 291.2 327.7 391.5Dividend Yield 2.77% 3.12% 3.73%
85.0
95.0
105.0
115.0
7,800
9,800
11,800
13,800Price Close Relative to JCI (RHS)
50
100
Apr-15 Jul-15 Oct-15 Jan-16
Vol m
Page 7

Banks│Indonesia│Equity research│April 25, 2016
Company Note
IMPORTANT DISCLOSURES, INCLUDING ANY REQUIRED RESEARCH CERTIFICATIONS, ARE PROVIDED AT THE END OF THIS REPORT. IF THIS REPORT IS DISTRIBUTED IN THE UNITED STATES IT IS DISTRIBUTED BY CIMB SECURITIES (USA), INC. AND IS CONSIDERED THIRD-PARTY AFFILIATED RESEARCH.
Powered by the EFA Platform
Bank Tabungan Negara 1Q16 results: a good start
BBTN’s 1Q16 net profit of Rp490bn (+22% yoy) was in line with our and consensus ■estimates (at 23/22% of our/consensus FY16F).
The strong net profit growth can be attributed to the robust expansion in net interest ■income (+15% yoy) and lower provisioning (-27% yoy).
NPL and SML rose slightly to 3.6% and 13.8% in 1Q16, from 3.4% and 12.5% in ■4Q15, respectively.
BBTN remains our top pick among mid-cap banks for its strong lending growth, ■improving deposit base and asset quality. Maintain Add and GGM-based TP.
1Q16 results highlights BBTN’s 1Q16 net profit came at Rp490bn (+22% yoy), in line with our/consensus forecasts as it formed 23/22% of our/consensus FY16 estimates. Its strong profit growth can be attributed to lower provisioning (-27% yoy) and robust growth in net interest income (+15% yoy) amid strong loan growth (+19% yoy), despite slightly lower margins (4.6% NIM in 1Q16 vs. 4.7%/5% in 1Q15/4Q15). Opex rose 18% yoy due to a steep increase in personnel (+21% yoy) and rental expenses (+37% yoy).
Lower NIM due to seasonality Overall NIM fell slightly to 4.6% in 1Q16 from 4.7% in 1Q15 (5% in 4Q15) largely due to the increase in cost of funds (CoF) as we estimate the overall CoF rose to 6.8% in 1Q16 from 6.7% in 1Q15 (6.3% in 4Q15). The quarterly CoF jump was due to a steep rise in term deposits (+7% qoq) against overall deposits (+2.5% qoq); overall its CASA ratio fell to 47% in 1Q16 from 49% in 4Q15, largely attributed to seasonality in 1Q. Asset yield, on the other hand, improved to 11.6% in 1Q16 from 11.3% in 1Q15 (11.5% in 4Q15).
Robust loan growth Overall loans grew by 19% yoy (+3% qoq) due to strong growth in the subsidised mortgages (+28% yoy/+6% qoq) and construction loan (+25% yoy/+2.5% qoq) segments. Commercial loans (the segment most affected by asset quality issues) were flat yoy and down 2% qoq. This indicates that BTN has remained focused on its core business and is letting the commercial loan portfolios (KUR, investment loans, etc.) lapse over time.
Asset quality remains in check The non-performing loan (NPL) and Special Mention (SML) ratios deteriorated slightly in 1Q16 (to 3.6% and 13.8% respectively) from 4Q15 (3.4% and 12.5%) but improved from 1Q15 (4.8% and 14.8%). 1Q is traditionally the weakest quarter due to seasonally weak loan growth. In absolute terms, NPL rose by 8% qoq but fell 10% yoy. BTN has guided for its NPL and SML ratios to be below 3% and 12%, respectively, by year-end.
Remains one of our top picks BTN’s share price has done well YTD (up by 34%), outperforming JAKFIN and JCI by 35% and 28%, respectively, during the period. We believe the stock will continue to outperform its peers due to lower risk on lending rate (most of the subsidised mortgages are already at 5%) and robust loan growth – as evidenced by the improvement in asset yield in 1Q despite the lending rate cut on its non-subsidised mortgages and construction loans (75bps and 25bps in 1Q, respectively). Maintain Add.
▎Indonesia
ADD (no change) Current price: Rp1,730 Target price: Rp2,070 Previous target: Rp2,070
Up/downside: 19.7% Reuters: BBTN.JK Bloomberg: BBTN IJ Market cap: US$1,389m Rp18,320,700m Average daily turnover: US$3.05m Rp40,489m Current shares o/s 10,565m Free float: 40.0% Key changes in this note
No change.
Source: Bloomberg Price performance 1M 3M 12M
Absolute (%) -1.7 28.1 49.8 Relative (%) -3.5 19 59.4
Analyst(s)
Jovent GIOVANNY
T (62) 21 3006 1727 E [email protected] Timothy HANDERSON T (62) 21 3006 1724 E [email protected]
[ X ]
SOURCE: COMPANY DATA, CIMB FORECASTS
Financial Summary Dec-14A Dec-15A Dec-16F Dec-17F Dec-18F
Net Interest Income (Rpb) 5,465 6,811 8,168 9,361 10,860Total Non-Interest Income (Rpb) 895 1,106 1,215 1,391 1,599Operating Revenue (Rpb) 6,359 7,917 9,383 10,751 12,459Total Provision Charges (Rpb) (772) (894) (1,217) (1,358) (1,616)Net Profit (Rpb) 1,116 1,851 2,168 2,629 2,990Core EPS (Rp) 106.5 174.4 204.3 247.8 281.8Core EPS Growth (33.2%) 63.8% 17.1% 21.3% 13.7%FD Core P/E (x) 16.25 9.92 8.47 6.98 6.14DPS (Rp) 44.36 21.12 43.80 51.30 62.21Dividend Yield 2.56% 1.22% 2.53% 2.97% 3.60%BVPS (Rp) 1,155 1,312 1,496 1,694 1,914P/BV (x) 1.50 1.32 1.16 1.02 0.90ROE 9.4% 14.1% 14.5% 15.5% 15.6%CIMB/consensus EPS (x) 0.96 0.99 0.94
92
130
167
850
1,350
1,850
Price Close Relative to JCI (RHS)
50
100
150
Apr-15 Jul-15 Oct-15 Jan-16
Vol m
Page 8

Indonesia│Equity research│April 25, 2016
Strategy Note │ Alpha series
IMPORTANT DISCLOSURES, INCLUDING ANY REQUIRED RESEARCH CERTIFICATIONS, ARE PROVIDED AT THE END OF THIS REPORT. IF THIS REPORT IS DISTRIBUTED IN THE UNITED STATES IT IS DISTRIBUTED BY CIMB SECURITIES (USA), INC. AND IS CONSIDERED THIRD-PARTY AFFILIATED RESEARCH.
Powered by the EFA Platform
Indonesia Strategy Picking what to buy and sell from the rally
If history is any guide, the trickle-down effects from the government’s current ■aggressive spending should start to materialise by 2H16.
Impact of the policy rate cuts on consumption would be seen by 1Q17 if past ■correlation holds; fuel price cuts and tax reforms may accelerate the recovery.
Some stocks have run ahead of fundamentals, but others remain laggards. We ■screen for both, using top-down and bottom-up approaches.
Our top 5 picks are ASII, GGRM, ROTI, BBRI and PWON. Our top 5 sells are ITMG, ■UNVR, TLKM, MAPI and KLBF
Government-led recovery Apart from pushing for greater infra spending, the government is unleashing a host of reforms that include tax cuts for the masses, and a tax amnesty for the rich. Meanwhile, the central bank has also started to ease more aggressively. While budget and external risks remain, the stabilisation of key macro indicators and improvements in government execution suggest that the recovery momentum from 2H15 has legs. We think government spending will remain the key and sole driver for a while.
When will the rest pick up the slack Historical data suggest investment picking up some four quarters after government spending gains momentum, while policy rate cuts could result in lending rate declines some 1-2 quarters later. More crucially, rate cuts boost consumption growth about four quarters later by some +12-14 bps for every 25 bps cut in rates. Our base case assumes a similar, if not faster, catch-up than in the past, with consumption likely to pick up ahead of investment given the government’s tax stimulus, benign inflation and lower fuel prices.
Outperformers and underperformers YTD, the JCI has gained 5.9% in Rp terms and 10.4% in US$ terms, underperforming bonds which returned 11.1% and 15.6%, respectively. The best performing sectors were resources, consumer staples, and construction; the latter two in line with the view of a domestic recovery. The key underperforming sectors were cement, banks and property. Banking stocks have clearly priced in policy risk concerns, coupled with lingering worries over asset quality, though the upcoming 1Q16 numbers should help put minds at ease.
Top five buys We screen top-down and bottom-up to identify outperformers that still have legs, and laggards that have been overlooked. Based on the criteria, we like 1) consumer plays ASII, GGRM, ROTI as we think the earnings upside from a consumption recovery is under-appreciated; 2) BBRI, which has been punished by policy risk worries (misplaced concern given the single lending rate target will not affect its core micro-lending segment); 3) PWON on valuations and beneficiary of tax amnesty, Jakarta infra build-up.
Top five sells On the flipside, coal producer ITMG is primed for a tumble if coal prices stay low. On valuation grounds, UNVR and TLKM have hit their highest multiples ever, while KLBF and MAPI may have earnings downsides that are not priced in yet.
b[ X ]
Figure 1: Earnings rebound on the cards if GDP continues to mend
SOURCES: CIMB RESEARCH, COMPANY
▎Indonesia
Analyst(s)
Erwan TEGUH
T (62) 21 3006 1720 E [email protected] Peter P. SUTEDJA, CFA T (62) 21 3006 1726 E [email protected]
(4x)
-
4x
8x
12x
16x
-20%
0%
20%
40%
60%
80%
2002 2003 2004 2005 2006 2007 2008 2009 2010 2011 2012 2013 2014 2015
EPS Growth EPS/ Real GDP (RHS) EPS/Nom GDP (RHS)
Page 9

REIT│Malaysia│Equity research│April 25, 2016
Company Note
1
Axis REIT Asset injections to drive growth
Axis REIT’s 1Q16 core earnings were in line with expectations, making up 22% of ■our full-year forecast and 23% of consensus.
1Q16 DPU of 2.5 sen was also in line with our expectations. ■ The group is still in an aggressive acquisition mode, and is targeting to acquire ■assets worth a total of RM242m in 2016.
Maintain Add with an unchanged target price of RM1.80. ■
Within expectations Axis REIT’s 1Q16 revenue rose 1.5% yoy to RM41.2m, while reported net earnings increased by 7.7% yoy to RM25.1m. After stripping out revaluation gains worth RM2.5m for its Axis Shah Alam DC1, core net profit was flat yoy at RM22.6m. The group declared 1Q16 distribution per unit (DPU) of 2.5 sen (vs. 1Q15 DPU: 2.0 sen), up 2.5% yoy. This was within our expectations. Our full-year DPU forecast is 9.5 sen.
Top-line growth supported by positive rental reversions The group’s topline growth was mainly supported by the additional contribution from the recently completed acquisition of the Beyonics i-Park Campus, Johor and positive rental reversions from its diverse asset portfolio (+4.2% yoy). Nonetheless, the 8.6% yoy increase in overall property expenses kept its net property income (NPI) growth subdued at +0.4% yoy (RM34.5m). Core earnings growth was negated by higher borrowing costs (+8% yoy) to finance its asset acquisitions.
Inorganic growth with strong asset acquisition pipeline The group has accepted two Letters of Offer (LOA) to acquire a logistics warehouse (Pasir Gudang, Johor) and a manufacturing facility (Rawang, Selangor) for RM33m and RM42m, respectively. The group is still on the hunt and is evaluating several properties. It is targeting to acquire assets worth RM242m in 2016. We believe that the group is on track to meet its target assets under management value (AUM) of RM3bn over the next three years (vs. 2015’s AUM: RM2.14bn).
Updates on the mega distribution centre Axis REIT has proposed to redevelop its PDI Centre into a mega distribution logistics hub with a NLA of 1.2m sq. ft. The group is embarking on this venture with Axis Group to develop 50-acres of land and is targeting to start construction by 3Q16. It expects the centre to be completed and injected into Axis REIT by early-2018. We believe that once completed, the group will be well-poised to capture the e-commerce growth trend in Malaysia by offering e-commerce players warehousing and logistics facilities.
Maintain Add We make no changes to our earnings forecasts. Our DDM-based target price of RM1.80 and Add call are also maintained. We continue to like Axis REIT’s commitment to continuous asset injections as one of its key growth strategies in the foreseeable future. Additionally, the group is well-positioned to capitalise on the catalyst of rising demand for e-commerce through its industrial portfolio exposure (21% of its NLA as at end-1Q16).
▎Malaysia
ADD (no change) Current price: RM1.62 Target price: RM1.80 Previous target: RM1.80
Up/downside: 11.2% Reuters: AXSR.KL Bloomberg: AXRB MK Market cap: US$456.8m RM1,782m Average daily turnover: US$0.25m RM1.02m Current shares o/s 1,326m Free float: 83.8% Key changes in this note
No changes.
Source: Bloomberg Price performance 1M 3M 12M
Absolute (%) 3.8 3.2 -10 Relative (%) 4.2 -2.5 -2.6
Analyst(s)
Kristine WONG
T (60) 3 2261 9085 E [email protected]
[ X ]
SOURCE: COMPANY DATA, CIMB FORECASTS
Financial Summary Dec-14A Dec-15A Dec-16F Dec-17F Dec-18F
Gross Property Revenue (RMm) 140.0 165.7 170.6 175.8 181.0Net Property Income (RMm) 118.5 141.9 139.9 145.9 150.1Net Profit (RMm) 83.7 96.6 102.4 107.8 111.9Distributable Profit (RMm) 110.5 92.0 104.2 109.6 114.7Core EPS (RM) 0.08 0.09 0.09 0.10 0.10Core EPS Growth (30.8%) 5.8% 6.0% 5.3% 3.8%FD Core P/E (x) 19.44 18.37 17.34 16.47 15.87DPS (RM) 0.12 0.08 0.10 0.10 0.10Dividend Yield 7.69% 4.90% 5.87% 6.17% 6.46%Asset Leverage 21.8% 20.0% 20.5% 20.5% 20.5%BVPS (RM) 1.21 1.23 1.24 1.24 1.24P/BV (x) 1.34 1.31 1.30 1.30 1.31Recurring ROE 7.19% 7.21% 7.54% 7.92% 8.23%CIMB/consensus DPS (x) 1.07 1.09 1.09
88.092.096.0100.0104.0108.0
1.4001.5001.6001.7001.8001.900
Price Close Relative to FBMKLCI (RHS)
5
10
Apr-15 Jul-15 Oct-15 Jan-16
Vol m
Page 10

Stockbroking & Exchanges│Malaysia│Equity research│April 25, 2016
Company Note
IMPORTANT DISCLOSURES, INCLUDING ANY REQUIRED RESEARCH CERTIFICATIONS, ARE PROVIDED AT THE END OF THIS REPORT. IF THIS REPORT IS DISTRIBUTED IN THE UNITED STATES IT IS DISTRIBUTED BY CIMB SECURITIES (USA), INC. AND IS CONSIDERED THIRD-PARTY AFFILIATED RESEARCH.
Powered by the EFA Platform
Bursa Malaysia 1Q16 results – not a good start to 2016
1Q16 net profit was below expectations, at only 23% of our full-year forecast and ■Bloomberg consensus.
1Q16 equity income fell by 0.7% yoy due to lower market trading value. ■ Derivative income increased by a strong 9.6% yoy in 1Q16. ■ Equity income contributed the biggest share of Bursa’s 1Q16 revenue (45%). ■ Maintain Hold on Bursa given its pricey valuations. We cut our FY16-18 EPS ■forecasts by 2.5% and lower our target price from RM8.66 to RM8.44.
1Q16 results below expectations Bursa’s 1Q16 net profit was below expectations, at only 23% of our full-year forecast and consensus. This was mainly attributable to weaker-than-expected revenue, for both equity and derivative income. As per norm, there was no dividend declared in 1Q16. The company’s net profit advanced by 5.9% yoy in 1Q16, on the back of a 5.4% rise in revenue.
Marginal yoy drop in equity income Malaysia’s equity market average daily trading value (ADTV) fell by 4.8% yoy to RM1.98bn in 1Q16 because of the: (1) decline in market velocity from 30% in 1Q15 to 29% in 1Q16, and (2) 1.7% yoy drop in market capitalisation to RM1.71tr as at end-Mar 16. The above were partly offset by the increase in effective clearing fee rate from 2.31% a year ago to 2.38% in 1Q16. Overall, Bursa’s 1Q16 equity trading income contracted marginally by 0.7% yoy to RM57.1m.
Better performance by derivative business but… The derivative business turned in a better performance with a 9.6% yoy increase in income to RM22.5m. This was mainly driven by higher guarantee and collateral management fees from a low base in 1Q15. However, it was a negative surprise that the number of average daily contracts fell by 4.1% yoy to 57,900 in 1Q16.
Equity income still made biggest contribution to revenue In 1Q16, equity income was still the biggest contributor to Bursa’s total revenue, although its contribution dropped from 48% a year ago to 45.3% in 1Q16. On the other hand, the share of derivative income as a percentage of Bursa’s total revenue increased from 17.1% in 1Q15 to 17.8% in 1Q16.
Maintain Hold The weaker-than-expected 1Q16 results prompt us to cut our FY16-18 net profit forecasts by about 2.5%, as we reduce our revenue forecasts by 2.8%. This led to a drop in our target price from RM8.66 to RM8.44, still pegged to a target FY17 P/E of 19.4x, derived from a 10% discount to its 5-year average P/E of 21.4x. Although we are bullish on the outlook for the equity market in 2016, Bursa remains a Hold, given its high valuation of 20.3x FY17 P/E and 5.6x FY17 P/BV.
▎Malaysia
HOLD (no change) Current price: RM8.73 Target price: RM8.44 Previous target: RM8.66
Up/downside: -3.3% Reuters: BMYS.KL Bloomberg: BURSA MK Market cap: US$1,197m RM4,669m Average daily turnover: US$0.97m RM3.92m Current shares o/s 531.9m Free float: 65.3% Key changes in this note
FY16-18 EPS forecasts lowered by 2.5%.
Source: Bloomberg Price performance 1M 3M 12M
Absolute (%) -1.9 5.2 -0.2 Relative (%) -1.5 -0.5 7.2
Analyst(s)
Winson NG, CFA
T (60) 3 2261 9071 E [email protected]
[ X ]
SOURCE: COMPANY DATA, CIMB FORECASTS
Financial Summary Dec-14A Dec-15A Dec-16F Dec-17F Dec-18F
Revenue (RMm) 471.3 487.7 518.8 554.5 593.2Operating EBITDA (RMm) 297.1 302.5 319.0 342.2 367.7Net Profit (RMm) 198.2 198.6 212.9 229.3 246.3Core EPS (RM) 0.37 0.37 0.40 0.43 0.46Core EPS Growth 14.5% 0.2% 7.2% 7.7% 7.4%FD Core P/E (x) 23.43 23.38 21.81 20.25 18.85DPS (RM) 0.54 0.35 0.38 0.41 0.44Dividend Yield 6.19% 3.95% 4.36% 4.69% 5.04%EV/EBITDA (x) 12.12 10.50 10.12 9.58 9.04P/FCFE (x) 14.21 19.40 29.14 10.90 14.83Net Gearing (139%) (181%) (171%) (162%) (153%)P/BV (x) 6.20 5.78 5.67 5.55 5.43ROE 25.4% 25.6% 26.2% 27.7% 29.1%% Change In Core EPS Estimates (2.52%) (2.52%) (2.54%)CIMB/consensus EPS (x) 1.02 1.01 1.02
96.0
100.4
104.8
109.1
7.50
8.00
8.50
9.00
Price Close Relative to FBMKLCI (RHS)
1
2
3
Apr-15 Jul-15 Oct-15 Jan-16
Vol m
Page 11

Conglomerate│Malaysia│Equity research
Company Flash Note
IMPORTANT DISCLOSURES, INCLUDING ANY REQUIRED RESEARCH CERTIFICATIONS, ARE PROVIDED AT THE END OF THIS REPORT. IF THIS REPORT IS DISTRIBUTED IN THE UNITED STATES IT IS DISTRIBUTED BY CIMB SECURITIES (USA), INC. AND IS CONSIDERED THIRD-PARTY AFFILIATED RESEARCH.
Powered by the EFA Platform
Sime Darby Bhd Targets higher yield via Genome Select
Sime commenced first large-scale planting of Genome Select high-yield oil palms. ■ The genome materials have the potential to produce at least 15% more crude palm ■oil than its best planting materials currently.
We expect this to have minimal impact on near-term earnings. However, we are ■positive for the group in the long term as it could boost future yields. Maintain Hold.
Sime starts first planting of Genome Select oil palm ● We attended Sime’s Genome Select planting event at its Dusun Durian estates,
which are located on Carey Island today. During the event, we witnessed the first large-scale planting of Genome Select high-yield oil palms (oil palms selected using genetic-testing tools) by the group. This is a major milestone in the group’s genome studies and will help to boost the future CPO yields of its estates.
Minimal impact on earnings in the near term ● However, we think this will have minimal impact on the group’s near-term earnings as
the Genome Select planting materials will only be planted at two 50ha sites located in the coastal and inland areas of Malaysia in the current year. This represents less than 1% of the group’s total planted oil palm area in Malaysia of 312,795ha.
Genome Select materials to cover all replanting needs by 2023 ● Sime is looking to ramp up capacities and targets to have enough genome planting
materials to meet its Malaysia replanting requirements of around 15,000ha per annum by 2023. We view this positively, as it would help the group to raise productivity on existing land. Furthermore, 24.8% of the group’s estates in Malaysia are aged 19 years and above, and due for replanting over the next decade.
Genome materials could produce at least 15% higher oil yield ● The group revealed that the selected palms have the potential to produce at least
15% higher oil yield than its current best planting materials. It indicated that the Genome Select palms have the potential to produce average CPO yields of 6.1 tonnes/ha across all environments. This is 30% higher than its FY6/15 Malaysia CPO yield of 4.73 tonnes/ha.
One of four known genome studies on palm oil in Malaysia ● Based on our knowledge, there are four Malaysian entities that have embarked on
genome studies- the Malaysian Palm Oil Board (MPOB), Sime, Felda and Genting Plantations. Sime’s Genome Select palms come from naturally-pollinated seeds that have undergone a simple DNA (genetic) test using proprietary technology. Only palms with the best gene combinations will be selected for plantings.
Research costs and its competitive advantages ● Sime revealed that it sets aside around 2-3% of annual revenue or approximately
RM120m per annum for research expenditure and around 10% of the fund goes to genomics research. The group’s key advantages in terms of genome studies are the huge pool of genetic variations available at its seed gardens and its involvement in plant breeding for 85 years.
Maintain Hold due to limited catalysts ● We maintain our Hold call with unchanged SOP-based target price as we see price
support from the group’s rich assets and decent dividend yields.
Figure 1: Plantings of Sime Genome Select materials at Dusun Durian estates
SOURCES: CIMB, COMPANY REPORTS
▎Malaysia April 25, 2016 - 10:26 PM
HOLD (no change) Current price: RM7.95 Target price: RM7.78 Previous target: RM7.78
Up/downside: -2.2% Reuters: SIME.KL Bloomberg: SIME MK Market cap: US$12,873m RM50,300m Average daily turnover: US$6.53m RM26.65m Current shares o/s 6,211m Free float: 33.8% Key financial forecasts
Source: Bloomberg Price performance 1M 3M 12M
Absolute (%) 0.6 8.2 -14.3 Relative (%) 0 2.7 -6.3
Analyst(s)
Ivy NG Lee Fang, CFA
T (60) 3 2261 9073 E [email protected]
Jun-16F Jun-17F Jun-18F
Net Profit (RMm) 1,774 2,187 2,562Core EPS (RM) 0.29 0.36 0.42Core EPS Growth (8.8%) 23.3% 17.1%FD Core P/E (x) 27.82 22.56 19.26Recurring ROE 5.78% 6.94% 7.89%P/BV (x) 1.59 1.54 1.50DPS (RM) 0.14 0.18 0.21Dividend Yield 1.80% 2.22% 2.60%
87.0
93.7
100.3
107.0
6.70
7.70
8.70
9.70Price Close Relative to FBMKLCI (RHS)
10
20
30
Apr-15 Jul-15 Oct-15 Jan-16
Vol m
Page 12

REIT│Singapore│Equity research│April 26, 2016
Company Note
IMPORTANT DISCLOSURES, INCLUDING ANY REQUIRED RESEARCH CERTIFICATIONS, ARE PROVIDED AT THE END OF THIS REPORT. IF THIS REPORT IS DISTRIBUTED IN THE UNITED STATES IT IS DISTRIBUTED BY CIMB SECURITIES (USA), INC. AND IS CONSIDERED THIRD-PARTY AFFILIATED RESEARCH.
Powered by the EFA Platform
Mapletree Industrial Trust 4QFY16: credible performance
FY16 DPU of 11.15Scts (+7% yoy) was slightly ahead of our expectation, at 104% ■of our full-year forecast. 4Q16 DPU of 2.81Scts (+6% yoy) was at 26%.
Improved portfolio performance and progress from development and improvement ■works led to an increase in portfolio value of S$133.7m.
Portfolio occupancy at 94.6%; portfolio passing rents at S$1.90 psfpm. 21.1% of ■GRI up for renewal in FY17.
We raise our DDM target price slightly, but maintain Hold after the recent run-up. ■
4QFY16: credible performance We view MINT’s 4Q16 results as credible. 4Q16 distributable income increased 8% yoy to S$50.4m, due mainly to higher occupancies and rental rates achieved across all property segments, as well as contribution from the build-to-suit (BTS) project for Equinix at 26A Auer Rajah Crescent (came online in Mar 15). There were also cost savings from lower utilities and marketing costs. For FY16, distributable income hiked up 9% yoy to S$197.8m.
Increase in portfolio value of S$133.7m Coupled with improved portfolio performance, a 25 bps compression in cap rates for its business parks (currently 6%), as well as construction progress at the Telok Blangah Cluster and commencement of the AEI at Kallang Basin 4 Cluster, MINT booked a portfolio revaluation gain of S$82m and capitalised cost of S$51.7m from development and improvement works. Accordingly, NAV/unit increased to S$1.37/unit (FY15: S$1.32)
Portfolio performance: expect flattish rental reversion in FY17 4Q16 portfolio occupancy slipped 0.1% pts qoq to 94.6% due mainly to lower occupancy at Stack-up/Ramp-up buildings. Portfolio passing rent rose to S$1.90 psfpm vs. S$1.89 psfpm in 3Q16. For flatted factories, the +2.8% rental reversion in 4Q was due to leases renewed at more centrally-located areas, while new leases signed were 5.1% lower than passing rents as they were at outlying areas. For Hi-Tech buildings, the -4.9% rental reversion was due to a top 10 tenant taking up more space within the REIT’s portfolio.
21.1% of GRI up for renewal in FY17 Portfolio WALE by GRI stood at 2.8 years as at end-Mar. MINT has 21.1% of GRI up for renewal in FY17, lower than the historical c.30% as management focused on tenant retention. We understand that none of MINT’s top 10 tenants have leases up for renewal in FY17. The slight negative is that a tenant at 19 Changi South (light industrial building) scaled down space requirements (from 100% to 24%) towards end-Mar.
Expect higher borrowing costs We note that all-in funding cost increased to 2.5% (3Q16: 2.4%, 4Q15: 2.3%) due to higher hedged rates over pcp. In total, S$470m of hedges will expire in FY17. Of this, S$210m has been replaced. Replacements of these expiring interest rate hedges are expected to be costlier. That said, depending on market conditions, the Manager could also lower the % of debt with fixed rates (end-Mar 16: 88% hedged).
Maintain Hold Increasing our FY17-18F DPU by 0.6-1.3% (on higher revenue and NPI margin), we roll forward our DDM valuations to FY17, which results in a slightly higher DDM target price. After the recent run-up, we maintain our Hold rating on the stock. The stock trades at 1.2x P/BV (historical average) and offers an FY17 yield of 6.7% vs. average of 7.4%.
▎Singapore
HOLD (no change) Current price: S$1.64 Target price: S$1.67 Previous target: S$1.62
Up/downside: 2.0% Reuters: MAPI.SI Bloomberg: MINT SP Market cap: US$2,186m S$2,954m Average daily turnover: US$2.43m S$3.36m Current shares o/s 1,747m Free float: 69.7% Key changes in this note
FY17-18F DPU increased by 0.6-1.3%. Introduce FY19F estimates.
Source: Bloomberg Price performance 1M 3M 12M
Absolute (%) 2.5 8.6 0.3 Relative (%) 0.6 -3.7 17.8
Analyst(s)
YEO Zhi Bin
T (65) 6210 8669 E [email protected] LOCK Mun Yee T (65) 6210 8606 E [email protected]
[ X ]
SOURCE: COMPANY DATA, CIMB FORECASTS
Financial Summary Mar-15A Mar-16A Mar-17F Mar-18F Mar-19F
Gross Property Revenue (S$m) 313.9 331.6 336.5 401.6 411.0Net Property Income (S$m) 228.6 245.1 248.3 293.9 300.7Net Profit (S$m) 375.4 272.6 194.6 238.6 242.6Distributable Profit (S$m) 180.8 197.8 199.1 243.8 248.3Core EPS (S$) 0.10 0.11 0.11 0.13 0.13Core EPS Growth 5.5% 3.8% 0.5% 22.6% 1.7%FD Core P/E (x) 15.84 15.26 15.18 12.38 12.17DPS (S$) 0.10 0.11 0.11 0.14 0.14Dividend Yield 6.36% 6.80% 6.74% 8.26% 8.41%Asset Leverage 30.7% 28.3% 28.9% 28.9% 30.4%BVPS (S$) 1.32 1.36 1.36 1.36 1.36P/BV (x) 1.25 1.20 1.20 1.20 1.20Recurring ROE 8.22% 8.02% 7.93% 9.73% 9.89%% Change In DPS Estimates 1.29% 0.63%CIMB/consensus DPS (x) 1.01 1.14
96.0
103.5
111.0
118.5
126.0
1.300
1.400
1.500
1.600
1.700Price Close Relative to FSSTI (RHS)
10203040
Apr-15 Jul-15 Oct-15 Jan-16
Vol m
Page 13
Hospitals│Singapore│Equity research
Company Flash Note
IMPORTANT DISCLOSURES, INCLUDING ANY REQUIRED RESEARCH CERTIFICATIONS, ARE PROVIDED AT THE END OF THIS REPORT. IF THIS REPORT IS DISTRIBUTED IN THE UNITED STATES IT IS DISTRIBUTED BY CIMB SECURITIES (USA), INC. AND IS CONSIDERED THIRD-PARTY AFFILIATED RESEARCH.
Powered by the EFA Platform
Raffles Medical Group Revenue ahead, but still outweighed by costs
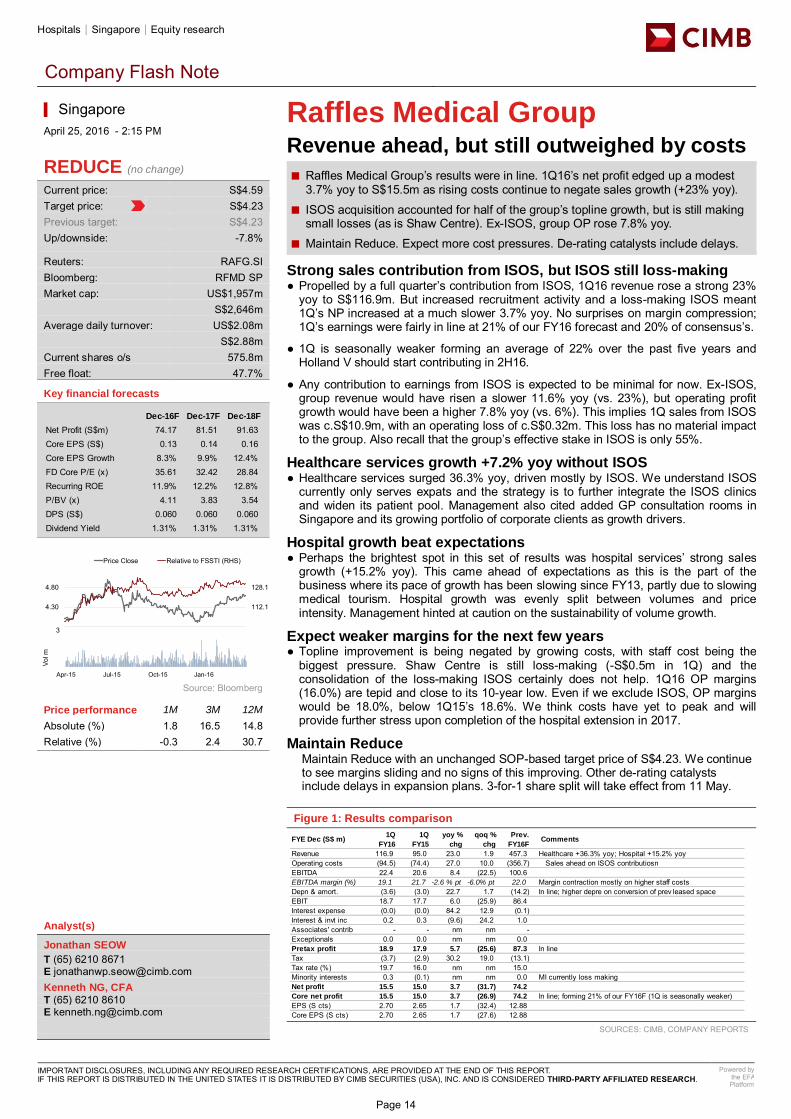
Raffles Medical Group’s results were in line. 1Q16’s net profit edged up a modest ■3.7% yoy to S$15.5m as rising costs continue to negate sales growth (+23% yoy).
ISOS acquisition accounted for half of the group’s topline growth, but is still making ■small losses (as is Shaw Centre). Ex-ISOS, group OP rose 7.8% yoy.
Maintain Reduce. Expect more cost pressures. De-rating catalysts include delays. ■
Strong sales contribution from ISOS, but ISOS still loss-making ● Propelled by a full quarter’s contribution from ISOS, 1Q16 revenue rose a strong 23%
yoy to S$116.9m. But increased recruitment activity and a loss-making ISOS meant 1Q’s NP increased at a much slower 3.7% yoy. No surprises on margin compression; 1Q’s earnings were fairly in line at 21% of our FY16 forecast and 20% of consensus’s.
● 1Q is seasonally weaker forming an average of 22% over the past five years and Holland V should start contributing in 2H16.
● Any contribution to earnings from ISOS is expected to be minimal for now. Ex-ISOS, group revenue would have risen a slower 11.6% yoy (vs. 23%), but operating profit growth would have been a higher 7.8% yoy (vs. 6%). This implies 1Q sales from ISOS was c.S$10.9m, with an operating loss of c.S$0.32m. This loss has no material impact to the group. Also recall that the group’s effective stake in ISOS is only 55%.
Healthcare services growth +7.2% yoy without ISOS ● Healthcare services surged 36.3% yoy, driven mostly by ISOS. We understand ISOS
currently only serves expats and the strategy is to further integrate the ISOS clinics and widen its patient pool. Management also cited added GP consultation rooms in Singapore and its growing portfolio of corporate clients as growth drivers.
Hospital growth beat expectations ● Perhaps the brightest spot in this set of results was hospital services’ strong sales
growth (+15.2% yoy). This came ahead of expectations as this is the part of the business where its pace of growth has been slowing since FY13, partly due to slowing medical tourism. Hospital growth was evenly split between volumes and price intensity. Management hinted at caution on the sustainability of volume growth.
Expect weaker margins for the next few years ● Topline improvement is being negated by growing costs, with staff cost being the
biggest pressure. Shaw Centre is still loss-making (-S$0.5m in 1Q) and the consolidation of the loss-making ISOS certainly does not help. 1Q16 OP margins (16.0%) are tepid and close to its 10-year low. Even if we exclude ISOS, OP margins would be 18.0%, below 1Q15’s 18.6%. We think costs have yet to peak and will provide further stress upon completion of the hospital extension in 2017.
Maintain Reduce Maintain Reduce with an unchanged SOP-based target price of S$4.23. We continue to see margins sliding and no signs of this improving. Other de-rating catalysts include delays in expansion plans. 3-for-1 share split will take effect from 11 May.
Figure 1: Results comparison
SOURCES: CIMB, COMPANY REPORTS
FYE Dec (S$ m) 1Q
FY16
1Q
FY15
yoy %
chg
qoq %
chg
Prev.
FY16F Comments
Revenue 116.9 95.0 23.0 1.9 457.3 Healthcare +36.3% yoy; Hospital +15.2% yoy Operating costs (94.5) (74.4) 27.0 10.0 (356.7) Sales ahead on ISOS contributiosnEBITDA 22.4 20.6 8.4 (22.5) 100.6EBITDA margin (%) 19.1 21.7 -2.6 % pt -6.0% pt 22.0 Margin contraction mostly on higher staff costsDepn & amort. (3.6) (3.0) 22.7 1.7 (14.2) In line; higher depre on conversion of prev leased spaceEBIT 18.7 17.7 6.0 (25.9) 86.4Interest expense (0.0) (0.0) 84.2 12.9 (0.1)Interest & invt inc 0.2 0.3 (9.6) 24.2 1.0Associates' contrib - - nm nm -Exceptionals 0.0 0.0 nm nm 0.0Pretax profit 18.9 17.9 5.7 (25.6) 87.3 In lineTax (3.7) (2.9) 30.2 19.0 (13.1)Tax rate (%) 19.7 16.0 nm nm 15.0Minority interests 0.3 (0.1) nm nm 0.0 MI currently loss makingNet profit 15.5 15.0 3.7 (31.7) 74.2
Core net profit 15.5 15.0 3.7 (26.9) 74.2 In line; forming 21% of our FY16F (1Q is seasonally weaker)EPS (S cts) 2.70 2.65 1.7 (32.4) 12.88Core EPS (S cts) 2.70 2.65 1.7 (27.6) 12.88
▎Singapore April 25, 2016 - 2:15 PM
REDUCE (no change) Current price: S$4.59 Target price: S$4.23 Previous target: S$4.23
Up/downside: -7.8% Reuters: RAFG.SI Bloomberg: RFMD SP Market cap: US$1,957m S$2,646m Average daily turnover: US$2.08m S$2.88m Current shares o/s 575.8m Free float: 47.7% Key financial forecasts
Source: Bloomberg Price performance 1M 3M 12M
Absolute (%) 1.8 16.5 14.8 Relative (%) -0.3 2.4 30.7
Analyst(s)
Jonathan SEOW
T (65) 6210 8671 E [email protected] Kenneth NG, CFA
T (65) 6210 8610 E [email protected]
Dec-16F Dec-17F Dec-18F
Net Profit (S$m) 74.17 81.51 91.63Core EPS (S$) 0.13 0.14 0.16Core EPS Growth 8.3% 9.9% 12.4%FD Core P/E (x) 35.61 32.42 28.84Recurring ROE 11.9% 12.2% 12.8%P/BV (x) 4.11 3.83 3.54DPS (S$) 0.060 0.060 0.060Dividend Yield 1.31% 1.31% 1.31%
96.0
112.1
128.1
3.80
4.30
4.80
Price Close Relative to FSSTI (RHS)
1
2
3
Apr-15 Jul-15 Oct-15 Jan-16
Vol m
Page 14

Singapore│Economics Update│April 25, 2016
1
Economics Update Mar 16 CPI: Steeper decline due to high base
Headline CPI declined by a steeper rate of -1.0% yoy in Mar 16. The major ■downward push came from accommodation and private road transport costs.
But MAS core inflation inched higher, albeit marginally and still weak, by 0.6% yoy. ■ The higher core rate was mainly due to the faster rise in food prices ■ We maintain our CPI forecast of -0.3% for 2016. ■
Headline inflation falling again by a steeper rate Consumer price index (CPI) declined 1.0% yoy in Mar 16, steeper than the -0.8% reading in previous month. The decline in Mar marked the 17th consecutive month of contraction. On mom basis but non-seasonally adjusted, the CPI index was unchanged, suggesting that going forward, the pace of contraction in the headline index would ease.
Private road transport and accommodation costs the main drags The bigger yoy decline in petrol prices due to the high base factor last year as well as the sharper decline in car prices due to lower certificates of entitlement (COE) premiums during the month, led private road transport falling 5.9% yoy (Feb: -3.9%) causing the main transport index to contract 4.3% yoy (Feb: -2.9%). Private road transport accounts for 11.5% of the total CPI index. Meanwhile, accommodation cost continued to contract but the pace was little changed (-3.2% vs -3.1% in Feb). However, its weight is bigger at 22.87%, causing a bigger drag to the overall CPI.
But MAS core inflation slightly higher The Monetary Authority of Singapore (MAS) core inflation which excludes the private road transport and accommodation cost – the most volatile components – rose by 0.6% yoy, a slight uptick from the 0.5% pace in Feb. The core index has never contracted since Feb 10 when the country’s economy recovered from the global financial crisis.
Food cost on the rise, albeit still relatively weak The food index rose by 2.2% yoy during the month, marking the 3rd month of faster readings, mainly due to the higher cost of non-cooked items that was mostly imported from the neighbouring countries currently facing supply disruptions due to the hot weather. Eating out cost has also yet to ease in line with the headline index. Food servicing services rose by 2.2% yoy – the same as the pace recorded in Feb.
MAS and MTI maintain their CPI forecast range The joint statement by MAS and Ministry of Trade and Industry Singapore (MTI) on the CPI release said that the likely lower average global oil prices and the expected slower wage growth would keep headline inflation pressure muted. However, they believe the core CPI will likely continue to trend higher as the disinflationary effects of oil prices as well as the measures introduced in the 2015 Budget and other one-off measures ease. They maintain their official CPI forecast range for 2016 at -1.0 to 0%.
We maintain our 2016 CPI forecast at -0.3% The average yoy change in CPI for 1Q16 was at -0.8%. We expect the contraction to ease only slightly in the 2Q, as notwithstanding the expiry of those relief measures introduced in Budget 2015, the base effects for the overall index last year would still be high. A more meaningful arrest to the slide would come from the likely stronger oil prices in the 2H16. We maintain our CPI forecast for 2016 at -0.3%
X#
Figure 1: Headline inflation continued to fall
SOURCE: SINGSTAT, CIMB RESEARCH
▎Singapore
Economist(s)
Maslynnawati AHMAD
T (60) 3 2261 9097 E [email protected]
Page 15

Food Retail│Taiwan│Equity research│April 25, 2016
Company Note
IMPORTANT DISCLOSURES, INCLUDING ANY REQUIRED RESEARCH CERTIFICATIONS, ARE PROVIDED AT THE END OF THIS REPORT. IF THIS REPORT IS DISTRIBUTED IN THE UNITED STATES IT IS DISTRIBUTED BY CIMB SECURITIES (USA), INC. AND IS CONSIDERED THIRD-PARTY AFFILIATED RESEARCH.
Powered by the EFA Platform
Poya Co Ltd Short-term hiccup
■ 1Q16 operating profit disappointed due to lower SSSG and gross margin.
■ Management still guides for 21% store unit growth and 3-5% SSSG for 2016.
■ Initial performance of the #2 store in Taipei City were better than expected.
■ Valuation remains rich given its weaker growth. Maintain Hold.
1Q16 results hurt by weather and absence of suppliers rebates Poya’s 1Q16 EPS of NT$2.59 (+4% yoy, +8% qoq) was 23% below our forecast but 7% higher than consensus. Operating profit was 19% below consensus. The letdown was attributed to a decline in gross margin (-3.1% pts yoy) due to the absence of suppliers rebates for its store celebrations vs. 1Q15. Poya posted SSSG of 3.5% yoy in 1Q16, (+1.9% traffic, +1.6% ticket size), dragged down by -4.5% SSSG in Mar on the back of more rainy days, which affected traffic and sales, vs. the year before.
5G stores to help sustain SSSG Poya still expects to open 27 stores in 2016, and has so far signed 20 contracts towards that end. It also guides for 3-5% SSSG for 2016 and for SSSG to improve sequentially as weather conditions turn better. In order to drive more traffic, a new store design has been adopted (5th generation store), with enhancements mainly in shopping routes, categories, and product displays (Figures 4-11). Our recent visit to one of its 5th generation stores left us feeling positive about the revised format.
Finally, more stores in Taipei City After years of waiting, Poya has finally opened its second store in Taipei City on 9 Apr. The success of its second store in Taipei City will have two important implications: 1) that its business model also works well in Taipei City, and 2) the expansion opportunity for such business model is still abundant in Taipei City. According to management, the second store registered NT$1m sales in its first day and nearly NT$5m in its first two weeks, nearing its breakeven point. A third store in Taipei City will open in May.
Gross margin pressure to offset by opex control Due to the drop in 1Q16 gross margin, we now expect Poya’s FY16 gross margin to decline yoy to 40.6%. However, we expect operating margin to hold up at 10.6% due to improved cost control and operation of its warehouses. Poya is currently building its second warehouse, slated to be fully operational by end-2017, with an estimated capex of NT$250m. It expects the gradual ramp up for the two warehouses to help reduce its staff count by five persons per store from 2015 to 2018.
Maintain Hold; near-term valuation risk We appreciate Poya’s long growth runway but think that its rich valuation (27x FY16F P/E) has downside risks following the weak growth in its 1Q16 numbers. We cut our FY16-17 EPS forecasts by 4% to factor in lower gross margin assumptions but raise our target price to NT$348, still based on 25x P/E, as we roll forward our valuation to include 1H17 forecasts. We suggest that investors revisit this stock when SSSG resumes a higher level. Our Hold rating is maintained.
▎Taiwan
HOLD (no change) Current price: NT$330.0 Target price: NT$348.0 Previous target: NT$324.0
Up/downside: 5.5% Reuters: 5904.TWO Bloomberg: 5904 TT Market cap: US$972.4m NT$31,442m Average daily turnover: US$0.56m NT$18.68m Current shares o/s 93.95m Free float: 46.0% Key changes in this note
FY16F EPS decreased by 4%. FY17F EPS decreased by 4%. FY18 forecasts introduced.
Source: Bloomberg Price performance 1M 3M 12M
Absolute (%) -3.5 10.4 3.1 Relative (%) -1.8 2 16.8
Analyst
Jack LIN
T (886) 2 8729 8387 E [email protected]
[ X ]
SOURCES: COMPANY DATA, CIMB FORECASTS
Financial Summary Dec-14A Dec-15A Dec-16F Dec-17F Dec-18F
Revenue (NT$m) 9,168 10,688 12,999 15,496 17,387Operating EBITDA (NT$m) 1,191 1,478 1,765 2,184 2,498Net Profit (NT$m) 772 952 1,183 1,479 1,693Normalised EPS (NT$) 8.22 10.00 12.43 15.54 17.79Normalised EPS Growth 36.4% 21.7% 24.3% 25.0% 14.5%FD Normalised P/E (x) 39.87 32.78 26.54 21.24 18.55DPS (NT$) 4.81 7.41 8.80 11.19 13.98Dividend Yield 1.46% 2.25% 2.67% 3.39% 4.24%EV/EBITDA (x) 25.76 21.18 17.73 14.35 12.51P/FCFE (x) 59.54 45.46 36.94 30.71 22.23Net Gearing (12.9%) (3.5%) (3.5%) (1.9%) (3.8%)P/BV (x) 12.91 11.48 10.19 8.98 8.14ROE 34.9% 37.1% 40.7% 45.0% 46.0%% Change In Normalised EPS Estimates (4.11%) (3.68%)Normalised EPS/consensus EPS (x) 1.02 1.05
95.0
111.7
128.3
280
330
380
Price Close Relative to TAIEX (RHS)
200
400
600
Apr-15 Jul-15 Oct-15 Jan-16
Vol t
h
Page 16

Pharmaceuticals│Thailand│Equity research│April 25, 2016
Company Note
IMPORTANT DISCLOSURES, INCLUDING ANY REQUIRED RESEARCH CERTIFICATIONS, ARE PROVIDED AT THE END OF THIS REPORT. IF THIS REPORT IS DISTRIBUTED IN THE UNITED STATES IT IS DISTRIBUTED BY CIMB SECURITIES (USA), INC. AND IS CONSIDERED THIRD-PARTY AFFILIATED RESEARCH.
Powered by the EFA Platform
Mega Lifesciences PCL 1Q16 preview: Headwinds for branded topline
■ We estimate 1Q16 core net profit was THB91m, down 27% yoy and 66% qoq.
■ Branded sales likely declined, mainly due to contraction in the Thai market.
■ Distribution business gradually recovering from the loss of a principal distributor.
■ Our FY16-18 EPS forecasts cut by 7-12% following weaker-than-expected sales.
■ Maintain Add. Our SOP-based target price drops to THB19.3.
Weak earnings expected We estimate MEGA’s 1Q16 earnings accounted for only 13% of our full-year forecast, mainly due to a contraction in its branded sales in Thailand. Its distribution revenue is recovering and, as such, we believe revenue from this segment accounted for 50% of MEGA’s total revenue in 1Q16, followed by the branded segment (45%) and OEM (5%). The shift in revenue mix towards the lower-margin distribution segment in 1Q16 will lead to a decline in Mega’s overall GPM and earnings, in our view.
Thai market a drag We estimate branded sales fell 5% yoy in 1Q16 due to slowing SEA markets. We believe sales declined in Thailand, its largest market, as demand was sluggish after the 4Q15 festive period. We also believe Myanmar sales were lower amid weak market sentiment. Vietnam sales will likely continue expanding, albeit at a slower pace. Given the weaker-than-expected recovery in Thailand and softer growth momentum in other SEA countries, we cut our FY16-18 branded sales forecasts by 6-10%.
Early stage of recovery in distribution We estimate distribution revenue rose 4% yoy in 1Q16 as the strong growth in Vietnam distribution likely outweighed the decline in Myanmar. Myanmar sales should have gradually recovered from the loss of a principal distributor but political uncertainties post the country’s national election in November 2015 temporarily slowed local consumption. We cut our FY16-18 distribution revenue forecasts by 0-4% to reflect the slower-than-expected recovery in Myanmar.
Earnings forecasts cut following soft demand momentum in 1Q16 Following weaker-than-expected sales in both branded and distribution segments amid slowing market sentiment, we lower our total FY16-18 revenue forecasts by 4-6%. However, given the significant difference in segmental GPM where the GPM for branded is about three times higher than that of distribution, the change in revenue mix towards the lower-margin distribution segment should result in a lower overall GPM and hence the impact on FY16-18 earnings is wider at 7-12%.
Maintain Add; lower target price of THB19.30 We maintain our Add rating. Our SOP-based target price falls to THB19.30. We believe downside risk is limited as MEGA is currently trading at 21x FY17F P/E (-1 s.d. from its 2-year historical mean). In our view, its long-term prospects remain intact on the back of its unique and solid position in the SEA markets it operates in. Potential re-rating catalysts include stronger-than-expected brand performance and recovery in its distribution business in Myanmar.
▎Thailand
ADD (no change) Current price: THB17.10 Target price: THB19.30 Previous target: THB21.90
Up/downside: 12.9% Reuters: MEGA.BK Bloomberg: MEGA TB Market cap: US$422.3m THB14,796m Average daily turnover: US$0.15m THB5.47m Current shares o/s 865.3m Free float: 43.5% Key changes in this note
FY16F EPS decreased by 7%. FY17F EPS decreased by 11%. FY18F EPS decreased by 12%.
Source: Bloomberg Price performance 1M 3M 12M
Absolute (%) -1.2 4.9 -2.9 Relative (%) -2.2 -6.4 6.2
Analyst(s)
Kasem PRUNRATANAMALA, CFA
T (66) 2 657 9221 E [email protected]
[ X ]
SOURCE: COMPANY DATA, CIMB FORECASTS
Financial Summary Dec-14A Dec-15A Dec-16F Dec-17F Dec-18F
Revenue (THBm) 7,730 7,945 8,248 8,904 9,910Operating EBITDA (THBm) 765 891 934 1,028 1,143Net Profit (THBm) 547.9 695.7 667.5 719.7 799.2Core EPS (THB) 0.63 0.73 0.74 0.80 0.90Core EPS Growth (19.9%) 16.1% 1.4% 8.1% 11.4%FD Core P/E (x) 27.05 23.30 22.98 21.25 19.08DPS (THB) 0.28 0.40 0.38 0.41 0.46Dividend Yield 1.64% 2.34% 2.24% 2.42% 2.69%EV/EBITDA (x) 19.63 16.80 15.20 13.64 12.15P/FCFE (x) NA 29.48 17.67 27.10 28.07Net Gearing 5.7% 4.1% (12.9%) (15.4%) (16.7%)P/BV (x) 3.72 3.41 3.17 2.94 2.72ROE 14.3% 15.3% 14.3% 14.4% 14.8%% Change In Core EPS Estimates (7.0%) (10.9%) (11.9%)CIMB/consensus EPS (x) 0.97 0.93 0.86
97.0
107.0
117.0
127.0
14.00
16.00
18.00
20.00Price Close Relative to SET (RHS)
1234
Apr-15 Jul-15 Oct-15 Jan-16
Vol m
Page 17

Food & Beverages│Thailand│Equity research│April 25, 2016
Company Note
IMPORTANT DISCLOSURES, INCLUDING ANY REQUIRED RESEARCH CERTIFICATIONS, ARE PROVIDED AT THE END OF THIS REPORT. IF THIS REPORT IS DISTRIBUTED IN THE UNITED STATES IT IS DISTRIBUTED BY CIMB SECURITIES (USA), INC. AND IS CONSIDERED THIRD-PARTY AFFILIATED RESEARCH.
Powered by the EFA Platform
MK Restaurant Group Consumption or Competitors?
We expect M to report -8% yoy net profit in 1Q16 mainly from intense competition ■and slow domestic purchasing power.
SSSG in 1Q16 is likely to be negative, in our view. ■ We are more concerned about the competition in the restaurant market, especially ■in Bangkok.
We reiterate our Hold call and DCF-based THB57 target price. ■
1Q16 still slow We expect M to post revenue of THB3.43bn (-4% yoy, -6% qoq) and net profit of THB441m (-8% yoy, -11% qoq) in 1Q16 due to weak local consumption and intense competition. We expect M to maintain its gross profit margin at 65% and net profit margin at 13% in 1Q16.
SSSG in March surprisingly dropped M is likely to report that SSSG surprisingly dropped in 1Q16, especially in Mar16, when it dropped 12%. The SSSG in 1Q16 for MK restaurant was -5% and for Yayoi was -1%. Although the 1Q16 number was better than 4Q15 at -8% for both MK and Yayoi, the slower-than-expected SSSG was still disappointing. The company’s branch expansion is still on track. M opened seven new restaurants in 1Q16.
Decelerating Bangkok sales We saw a change in M’s sales growth pattern in 1Q16. There were negative sales growth signs in Bangkok. Over the past two years, the performance of the Bangkok branches was better than that upcountry. The market has generally believed that a deceleration in purchasing power mainly came from upcountry consumers. However, in 1Q16, the pattern was the reverse.
Competition a concern Our assumption about M’s lower sales in Bangkok is the significant movement in Feb-Apr16 from the main competitor, Bar-B-Q Plaza, the barbecue chain restaurant with 103 branches in Thailand. We think the launch of the successful refill campaign on 12 Feb to 10 Apr 16 affected M’s sales during the same period (as M’s sales significantly dropped in Bangkok in March). We think increasing competition in Bangkok should be M’s main concern.
No new catalyst In 1H16, M’s strategies are to focus on pushing SSSG by introducing new menus and increasing the number of branches in order to maintain the company position. In the short term, we do not see any exciting growth strategies from the company. However, with THB8bn in net cash on hand, the company could still be waiting for M&A opportunities.
Maintain Hold We maintain our Hold rating and DCF-based target price at THB57 (WACC: 8.05%). We turn a bit more negative on M’s FY16 performance as, in our view, the company’s strategy over the past few years points to the company’s growth reaching a saturation phase. The main potential re-rating catalysts include M&A and a higher dividend payout ratio.
▎Thailand
HOLD (no change) Current price: THB53.50 Target price: THB57.00 Previous target: THB57.00
Up/downside: 6.5% Reuters: M.BK Bloomberg: M TB Market cap: US$1,390m THB48,698m Average daily turnover: US$0.47m THB16.76m Current shares o/s 910.2m Free float: 24.6% Key changes in this note
No changes
Source: Bloomberg Price performance 1M 3M 12M
Absolute (%) 0.5 -1.8 -7.8 Relative (%) -0.5 -13.1 1.3
Analyst(s)
Uraiwan TANTISUWANNAKUL
T (66) 2 657 9256 E [email protected]
[ X ] |
SOURCE: COMPANY DATA, CIMB FORECASTS
Financial Summary Dec-14A Dec-15A Dec-16F Dec-17F Dec-18F
Revenue (THBm) 14,492 14,478 15,167 16,218 17,269Operating EBITDA (THBm) 2,825 2,695 2,933 3,089 3,217Net Profit (THBm) 2,042 1,856 1,890 2,025 2,136Core EPS (THB) 2.26 2.06 2.08 2.22 2.35Core EPS Growth (22.3%) (9.1%) 0.9% 7.2% 5.5%FD Core P/E (x) 23.97 26.38 26.13 24.38 23.12DPS (THB) 2.40 1.89 1.75 1.88 1.98Dividend Yield 4.42% 3.49% 3.23% 3.46% 3.65%EV/EBITDA (x) 14.30 14.95 13.76 12.89 12.23P/FCFE (x) 51.07 53.15 28.79 29.62 29.94Net Gearing (68.3%) (68.3%) (70.6%) (73.1%) (74.9%)P/BV (x) 3.88 3.80 3.87 3.77 3.68ROE 16.3% 14.6% 14.7% 15.7% 16.1%% Change In Core EPS Estimates 0% 0% 0%CIMB/consensus EPS (x) 0.91 0.88 0.86
94.0
101.1
108.3
115.4
52.0
54.0
56.0
58.0
Price Close Relative to SET (RHS)
1122
Apr-15 Jul-15 Oct-15 Jan-16
Vol m
Page 18

Property Development│Thailand│Equity research
Company Flash Note
IMPORTANT DISCLOSURES, INCLUDING ANY REQUIRED RESEARCH CERTIFICATIONS, ARE PROVIDED AT THE END OF THIS REPORT. IF THIS REPORT IS DISTRIBUTED IN THE UNITED STATES IT IS DISTRIBUTED BY CIMB SECURITIES (USA), INC. AND IS CONSIDERED THIRD-PARTY AFFILIATED RESEARCH.
Powered by the EFA Platform
Quality Houses Feedback from non-deal roadshow
We accompanied QH management for an NDR in London. The majority of investors ■know QH and asked for an update on the sector’s demand & supply outlook.
A lot of investors asked about its inventory management, land bank and impact of ■CTBC’s investment in LHBANK.
Our Add call reflects more positive earnings outlook and appealing valuation. ■
Possible change in dividend policy ● We recently accompanied QH management to meet investors in London. About 60%
of investors are familiar with the company and Thai residential developers. Investors are interested in QH on the angle of high dividend yield and attractive valuations. Its focus areas for 2016 are speeding up sales of existing projects and reducing its D/E ratio to 1.0x. QH’s Board is considering changing its dividend policy from up to 50% to at least 30-40% to attract investors and to be comparable with other developers.
Low-rise housing is a key revenue driver ● QH targets presales and revenue growth of 8-10% in 2016. It has introduced new
housing designs, security systems, quality control and product innovations, i.e. twin townhouses and townhouses with a mezzanine, which are expected to improve sales. Low-rise housing remains its key driver, which should contribute 82% of total residential revenue in 2016. Meanwhile, it cuts land capex to THB4bn from THB4.5bn in 2015 as its land bank, mostly in Greater Bangkok, should be enough for development about four years.
Expect gross margin improvement from depleted low-margin stock ● Many investors asked about QH’s inventory. Completed stock totaled THB7.8bn at
end-2015 (THB4bn low-rise housing and THB3.8bn condo stock). Management expects to take a year to clear low-rise housing stock and two to clear condo stock, which is mostly upcountry. Its completed stock with poor gross margin (below 30%) is worth THB4bn, 6.5% of total available-for-sale value. QH targets gross margin to be stable at 31% in 2016 and to improve to 33% in 2017 due to reducing stock and higher margin from new projects.
Contribution from LHBANK likely to be unaffected by CTBC deal ● Management expects CTBC’s investment in LH Financial Group (LHBANK) to be
finalized in Aug 16. After the sales of new shares to CTBC, QH's holding in LHBANK will decline to 13.7% from 21.3%. QH does not plan to divest its remaining investment in LHBANK over the next few years. CTBC is likely to use its expertise in wealth management, trade finance and Taiwanese client base to boost LHBANK’s growth. Management expects the contribution from LHBANK in 2017 should be the same or higher than 2015’s THB697m.
Retain Add on earnings recovery, lower leverage & cheap valuation ● We maintain our Add call in view of an expected recovery in earnings prospects,
improving balance sheet position and appealing valuations. We expect QH’s core net profit CAGR to recover to 12.2% in 2016-17 (vs -6.7% in 2015). The current share price trades at 41.7% discount to its NAV of THB4.05. QH also offers attractive dividend yields of 6.7% and 7.5%, in 2016F and 2017F.
Figure 1: QH’s revenue from residential sales in 2010-17F
SOURCES: CIMB, COMPANY REPORTS
9,364 7,637 8,640 11,926 14,725 14,582 15,933 16,562
2,870
1,176
3,345
6,552
5,427 4,632 4,176
5,939
19.4%
-28.0%
36.0%
54.2%
9.1%
-4.7%
4.7%
11.9%
-40.0%
-30.0%
-20.0%
-10.0%
0.0%
10.0%
20.0%
30.0%
40.0%
50.0%
60.0%
-
5,000
10,000
15,000
20,000
25,000
2010 2011 2012 2013 2014 2015 2016F 2017F
(THBm)
Revenue from low-rise housing Revenue from condo % yoy growth from residential sales
▎Thailand April 25, 2016 - 3:50 PM
ADD (no change) Current price: THB2.36 Target price: THB3.00 Previous target: THB3.00
Up/downside: 27.1% Reuters: QH.BK Bloomberg: QH TB Market cap: US$721.6m THB25,286m Average daily turnover: US$2.13m THB75.25m Current shares o/s 9,184m Free float: 63.1% Key financial forecasts
Source: Bloomberg Price performance 1M 3M 12M
Absolute (%) -1.7 8.3 -30.2 Relative (%) -2.7 -3 -21.1
Analyst(s)
Pornthipa RAYABSANGDUAN
T (66) 2 657 9229 E [email protected]
Dec-16F Dec-17F Dec-18F
Net Profit (THBm) 3,434 3,909 4,367Core EPS (THB) 0.32 0.36 0.41Core EPS Growth 10.5% 13.8% 11.7%FD Core P/E (x) 7.36 6.47 5.79Recurring ROE 15.3% 16.1% 16.4%P/BV (x) 1.09 1.00 0.91DPS (THB) 0.16 0.18 0.20Dividend Yield 6.65% 7.46% 8.34%
73.0
82.4
91.8
101.1
1.90
2.40
2.90
3.40
Price Close Relative to SET (RHS)
50100150200
Apr-15 Jul-15 Oct-15 Jan-16
Vol m
Page 19

Asia Pacific Daily│Equity research│April 26, 2016
7
REGIONAL SECTOR HEADS
Arup RAHA KJ KWANG Ivy NG, CFA Raymond YAP, CFA Economics Offshore & Marine Plantations Transportation +65 6210 8412 +82 (2) 6730 6123 +60 (3) 2261 9073 +60 (3) 2261 9072 [email protected] [email protected] [email protected] [email protected]
COUNTRY HEADS OF RESEARCH
Ivy NG, CFA Bertram LAI Eric LIN Erwan TEGUH Dohoon LEE Malaysia (Deputy Head) Hong Kong/China Taiwan Indonesia South Korea +60 (3) 2261 9073 +852 2532 1111 +886 (2) 8729 8380 +62 (21) 3006 1720 +82 (2) 6730 6121 [email protected] [email protected] [email protected] [email protected] [email protected] Jose Paolo Deogracias Fontanilla Kenneth NG, CFA Kasem PRUNRATANAMALA, CFA Michael KOKALARI, CFA Yolan SEIMON Philippines Singapore Thailand Vietnam Sri Lanka +63 (2) 888 7118 +65 6210 8610 +66 (2) 657 9221 +84 907 974408 +94 (11) 2306273 [email protected] [email protected] [email protected] [email protected] [email protected] Coverage via partnership arrangement with Coverage via partnership arrangement with
SB Equities John Keells Stock Brokers
Page 20

Asia Pacific Daily│Equity research│April 26, 2016
8
DISCLAIMER WJV#05
The content of this report (including the views and opinions expressed therein, and the information comprised therein) has been prepared by and belongs to CIMB save that (i) if it is a report written by the analyst(s) of John Keells Stock Brokers (“John Keells”), it belongs to John Keells; (ii) if it is a report written by the analyst(s) of SB Equities Inc (“SBE”), it belongs to SBE; and (iii) if it is a report written by the analyst(s) of Morgans Financial Limited (“Morgans”), it belongs to Morgans. This report is distributed by CIMB and in respect of sections of the report relating to (i), (ii) and/or (iii) aforesaid, it is distributed pursuant to an arrangement between John Keells, SBE and Morgans respectively and none of the aforesaid parties is an affiliate of CIMB.
This report is not directed to, or intended for distribution to or use by, any person or entity who is a citizen or resident of or located in any locality, state, country or other jurisdiction where such distribution, publication, availability or use would be contrary to law or regulation.
By accepting this report, the recipient hereof represents and warrants that he is entitled to receive such report in accordance with the restrictions set forth below and agrees to be bound by the limitations contained herein (including the “Restrictions on Distributions” set out below). Any failure to comply with these limitations may constitute a violation of law. This publication is being supplied to you strictly on the basis that it will remain confidential. No part of this report may be (i) copied, photocopied, duplicated, stored or reproduced in any form by any means or (ii) redistributed or passed on, directly or indirectly, to any other person in whole or in part, for any purpose without the prior written consent of CIMB.
The information contained in this research report is prepared from data believed to be correct and reliable at the time of issue of this report. CIMB, John Keells, SBE and/or Morgans, as the case may be, may or may not issue regular reports on the subject matter of this report at any frequency and may cease to do so or change the periodicity of reports at any time. None of CIMB, John Keells, SBE or Morgans is under any obligation to update this report in the event of a material change to the information contained in this report. None of CIMB, John Keells, SBE or Morgans has any and none of them will accept any, obligation to (i) check or ensure that the contents of this report remain current, reliable or relevant, (ii) ensure that the content of this report constitutes all the information a prospective investor may require, (iii) ensure the adequacy, accuracy, completeness, reliability or fairness of any views, opinions and information, and accordingly, CIMB, John Keells, SBE and Morgans and their respective affiliates and related persons (and their respective directors, associates, connected persons and/or employees) shall not be liable in any manner whatsoever for any consequences (including but not limited to any direct, indirect or consequential losses, loss of profits and damages) of any reliance thereon or usage thereof. In particular, CIMB, John Keells, SBE and Morgans disclaim all responsibility and liability for the views and opinions set out in this report.
Unless otherwise specified, this report is based upon reasonable sources. Such sources will, unless otherwise specified, for market data, be market data and prices available from the main stock exchange or market where the relevant security is listed, or, where appropriate, any other market. Information on the accounts and business of company(ies) will generally be based on published statements of the company(ies), information disseminated by regulatory information services, other publicly available information and information resulting from our research.
Whilst every effort is made to ensure that statements of facts made in this report are accurate, all estimates, projections, forecasts, expressions of opinion and other subjective judgments contained in this report are based on assumptions considered to be reasonable as of the date of the document in which they are contained and must not be construed as a representation that the matters referred to therein will occur. Past performance is not a reliable indicator of future performance. The value of investments may go down as well as up and those investing may, depending on the investments in question, lose more than the initial investment. No report shall constitute an offer or an invitation by or on behalf of CIMB, John Keells, SBE or Morgans or their respective affiliates to any person to buy or sell any investments.
CIMB, John Keells, SBE and/or Morgans and/or their respective affiliates and related companies, their directors, associates, connected parties and/or employees may own or have positions in securities of the company(ies) covered in this research report or any securities related thereto and may from time to time add to or dispose of, or may be materially interested in, any such securities. Further, CIMB, John Keells, SBE and/or Morgans and/or their respective affiliates and related companies do and seek to do business with the company(ies) covered in this research report and may from time to time act as market maker or have assumed an underwriting commitment in securities of such company(ies), may sell them to or buy them from customers on a principal basis and may also perform or seek to perform significant investment banking, advisory, underwriting or placement services for or relating to such company(ies) as well as solicit such investment, advisory or other services from any entity mentioned in this report.
CIMB, John Keells, SBE and/or Morgans and/or their respective affiliates may enter into an agreement with the company(ies) covered in this report relating to the production of research reports. CIMB, John Keells, SBE and/or Morgans may disclose the contents of this report to the company(ies) covered by it and may have amended the contents of this report following such disclosure.
The analyst responsible for the production of this report hereby certifies that the views expressed herein accurately and exclusively reflect his or her personal views and opinions about any and all of the issuers or securities analysed in this report and were prepared independently and autonomously. No part of the compensation of the analyst(s) was, is, or will be directly or indirectly related to the inclusion of specific recommendations(s) or view(s) in this report. The analyst(s) who prepared this research report are prohibited from receiving any compensation, incentive or bonus based on specific investment banking transactions or for providing a specific recommendation for, or view of, a particular company. Information barriers and other arrangements may be established where necessary to prevent conflicts of interests arising. However, the analyst(s) may receive compensation that is based on his/their coverage of company(ies) in the performance of his/their duties or the performance of his/their recommendations and the research personnel involved in the preparation of this report may also participate in the solicitation of the businesses as described above. In reviewing this research report, an investor should be aware that any or all of the foregoing, among other things, may give rise to real or potential conflicts of interest. Additional information is, subject to the duties of confidentiality, available on request.
The term “John Keells Stock Brokers” shall, unless the context otherwise requires, mean each of John Keells Stock Brokers and its affiliates, subsidiaries and related companies. The term “SB Equities Inc.” shall, unless the context otherwise requires, mean each of SB Equities Inc. and its affiliates, subsidiaries and related companies. The term “Morgans Financial Limited” shall, unless the context otherwise requires, mean each of Morgans Financial Limited and its affiliates, subsidiaries and related companies. The term “CIMB” shall denote, where appropriate, the relevant entity distributing or disseminating the report in the particular jurisdiction referenced below, or, in every other case, CIMB Group Holdings
Page 21

Asia Pacific Daily│Equity research│April 26, 2016
9
Berhad ("CIMBGH") and its affiliates, subsidiaries and related companies.
Country CIMB Entity Regulated by
Hong Kong CIMB Securities Limited Securities and Futures Commission Hong Kong India CIMB Securities (India) Private Limited Securities and Exchange Board of India (SEBI)
Indonesia PT CIMB Securities Indonesia Financial Services Authority of Indonesia
Malaysia CIMB Investment Bank Berhad Securities Commission Malaysia Singapore CIMB Research Pte. Ltd. Monetary Authority of Singapore
South Korea CIMB Securities Limited, Korea Branch Financial Services Commission and Financial Supervisory Service
Taiwan CIMB Securities Limited, Taiwan Branch Financial Supervisory Commission
Thailand CIMB Securities (Thailand) Co. Ltd. Securities and Exchange Commission Thailand
Information in this report is a summary derived from individual research reports. As such, readers are directed to the individual research report or note to review the individual Research Analyst’s full analysis of the subject company. Important disclosures relating to the companies that are the subject of research reports published by CIMB, John Keells, SBE or Morgans, as the case may be, and the proprietary position by each of them and shareholdings of its Research Analysts’ who prepared the report in the securities of the company(s) are available in the individual research report.
This report does not purport to contain all the information that a prospective investor may require. CIMB, John Keells, SBE and Morgans and their respective affiliates do not make any guarantee, representation or warranty, express or implied, as to the adequacy, accuracy, completeness, reliability or fairness of any such information and opinion contained in this report. None of CIMB, John Keells, SBE, Morgans and their respective affiliates and related persons shall be liable in any manner whatsoever for any consequences (including but not limited to any direct, indirect or consequential losses, loss of profits and damages) of any reliance thereon or usage thereof.
This report is general in nature and has been prepared for information purposes only. It is intended for circulation amongst CIMB and its affiliates’ clients generally and does not have regard to the specific investment objectives, financial situation and the particular needs of any specific person who may receive this report. The information and opinions in this report are not and should not be construed or considered as an offer, recommendation or solicitation to buy or sell the subject securities, related investments or other financial instruments or any derivative instrument, or any rights pertaining thereto.
Investors are advised to make their own independent evaluation of the information contained in this research report, consider their own individual investment objectives, financial situation and particular needs and consult their own professional and financial advisers as to the legal, business, financial, tax and other aspects before participating in any transaction in respect of the securities of company(ies) covered in this research report.
The securities of such company(ies) may not be eligible for sale in all jurisdictions or to all categories of investors.
Australia : The distribution of this report is not an offer to buy or sell to any person within or outside Australia or a solicitation to any person within or outside of Australia to buy or sell any instrument described herein. This report is being issued outside Australia to a limited number of institutional investors and may not be provided to any person other than the original recipient and may not be reproduced or used for any other purposes.
Canada: This research report has not been prepared in accordance with the disclosure requirements of Dealer Member Rule 3400 – Research Restrictions and Disclosure Requirements of the Investment Industry Regulatory Organization of Canada. For any research report distributed by CIBC, further disclosures related to CIBC conflicts of interest can be found at https://researchcentral.cibcwm.com .
China: For the purpose of this report, the People’s Republic of China (“PRC”) does not include the Hong Kong Special Administrative Region, the Macau Special Administrative Region or Taiwan. The distributor of this report has not been approved or licensed by the China Securities Regulatory Commission or any other relevant regulatory authority or governmental agency in the PRC. This report contains only marketing information. The distribution of this report is not an offer to buy or sell to any person within or outside PRC or a solicitation to any person within or outside of PRC to buy or sell any instruments described herein. This report is being issued outside the PRC to a limited number of institutional investors and may not be provided to any person other than the original recipient and may not be reproduced or used for any other purpose.
France: Only qualified investors within the meaning of French law shall have access to this report. This report shall not be considered as an offer to subscribe to, or used in connection with, any offer for subscription or sale or marketing or direct or indirect distribution of financial instruments and it is not intended as a solicitation for the purchase of any financial instrument.
Germany: This report is only directed at persons who are professional investors as defined in sec 31a(2) of the German Securities Trading Act (WpHG). This publication constitutes research of a non-binding nature on the market situation and the investment instruments cited here at the time of the publication of the information.
The current prices/yields in this issue are based upon closing prices from Bloomberg as of the day preceding publication. Please note that neither the German Federal Financial Supervisory Agency (BaFin), nor any other supervisory authority exercises any control over the content of this report.
Hong Kong: This report is issued and distributed in Hong Kong by CIMB Securities Limited (“CHK”) which is licensed in Hong Kong by the Securities and Futures Commission for Type 1 (dealing in securities), Type 4 (advising on securities) and Type 6 (advising on corporate finance) activities. Any investors wishing to purchase or otherwise deal in the securities covered in this report should contact the Head of Sales at CIMB Securities Limited. The views and opinions in this research report are of CIMB, John Keells, SBE or Morgans, as the case may be, as of the date hereof and are subject to change. If the Financial Services and Markets Act of the United Kingdom or the rules of the Financial Conduct Authority apply to a recipient, our obligations owed to such recipient therein are unaffected. CHK has no obligation to update its opinion or the information in this research report.
This publication is strictly confidential and is for private circulation only to clients of CHK.
India: This report is issued and distributed in India by CIMB Securities (India) Private Limited (“CIMB India”) which is registered with the National Stock Exchange of India Limited and BSE Limited as a trading and clearing member under the Securities and Exchange Board of India (Stock
Page 22

Asia Pacific Daily│Equity research│April 26, 2016
10
Brokers and Sub-Brokers) Regulations, 1992. In accordance with the provisions of Regulation 4(g) of the Securities and Exchange Board of India (Investment Advisers) Regulations, 2013, CIMB India is not required to seek registration with the Securities and Exchange Board of India (“SEBI”) as an Investment Adviser. CIMB India is registered with SEBI as a Research Analyst pursuant to the SEBI (Research Analysts) Regulations, 2014 ("Regulations").
This report does not take into account the particular investment objectives, financial situations, or needs of the recipients. It is not intended for and does not deal with prohibitions on investment due to law/jurisdiction issues etc. which may exist for certain persons/entities. Recipients should rely on their own investigations and take their own professional advice before investment.
The report is not a “prospectus” as defined under Indian Law, including the Companies Act, 2013, and is not, and shall not be, approved by, or filed or registered with, any Indian regulator, including any Registrar of Companies in India, SEBI, any Indian stock exchange, or the Reserve Bank of India. No offer, or invitation to offer, or solicitation of subscription with respect to any such securities listed or proposed to be listed in India is being made, or intended to be made, to the public, or to any member or section of the public in India, through or pursuant to this report.
The research analysts, strategists or economists principally responsible for the preparation of this research report are segregated from the other activities of CIMB India and they have received compensation based upon various factors, including quality, accuracy and value of research, firm profitability or revenues, client feedback and competitive factors. Research analysts', strategists' or economists' compensation is not linked to investment banking or capital markets transactions performed or proposed to be performed by CIMB India or its affiliates.
Indonesia: This report is issued and distributed by PT CIMB Securities Indonesia (“CIMBI”). The views and opinions in this research report are our own as of the date hereof and are subject to change. If the Financial Services and Markets Act of the United Kingdom or the rules of the Financial Conduct Authority apply to a recipient, our obligations owed to such recipient therein are unaffected. CIMBI has no obligation to update its opinion or the information in this research report. Neither this report nor any copy hereof may be distributed in Indonesia or to any Indonesian citizens wherever they are domiciled or to Indonesian residents except in compliance with applicable Indonesian capital market laws and regulations.
This research report is not an offer of securities in Indonesia. The securities referred to in this research report have not been registered with the Financial Services Authority (Otoritas Jasa Keuangan) pursuant to relevant capital market laws and regulations, and may not be offered or sold within the territory of the Republic of Indonesia or to Indonesian citizens through a public offering or in circumstances which constitute an offer within the meaning of the Indonesian capital market law and regulations.
Ireland: CIMB is not an investment firm authorised in the Republic of Ireland and no part of this document should be construed as CIMB acting as, or otherwise claiming or representing to be, an investment firm authorised in the Republic of Ireland.
Malaysia: This report is issued and distributed by CIMB Investment Bank Berhad (“CIMB”) solely for the benefit of and for the exclusive use of our clients. If the Financial Services and Markets Act of the United Kingdom or the rules of the Financial Conduct Authority apply to a recipient, our obligations owed to such recipient therein are unaffected. CIMB has no obligation to update, revise or reaffirm its opinion or the information in this research reports after the date of this report.
New Zealand: In New Zealand, this report is for distribution only to persons who are wholesale clients pursuant to section 5C of the Financial Advisers Act 2008.
Singapore: This report is issued and distributed by CIMB Research Pte Ltd (“CIMBR”). CIMBR is a financial adviser licensed under the Financial Advisers Act, Cap 110 (“FAA”) for advising on investment products, by issuing or promulgating research analyses or research reports, whether in electronic, print or other form. Accordingly CIMBR is a subject to the applicable rules under the FAA unless it is able to avail itself to any prescribed exemptions.
Recipients of this report are to contact CIMB Research Pte Ltd, 50 Raffles Place, #19-00 Singapore Land Tower, Singapore in respect of any matters arising from, or in connection with this report. CIMBR has no obligation to update its opinion or the information in this research report. This publication is strictly confidential and is for private circulation only. If you have not been sent this report by CIMBR directly, you may not rely, use or disclose to anyone else this report or its contents.
If the recipient of this research report is not an accredited investor, expert investor or institutional investor, CIMBR accepts legal responsibility for the contents of the report without any disclaimer limiting or otherwise curtailing such legal responsibility. If the recipient is an accredited investor, expert investor or institutional investor, the recipient is deemed to acknowledge that CIMBR is exempt from certain requirements under the FAA and its attendant regulations, and as such, is exempt from complying with the following :
(a) Section 25 of the FAA (obligation to disclose product information);
(b) Section 27 (duty not to make recommendation with respect to any investment product without having a reasonable basis where you may be reasonably expected to rely on the recommendation) of the FAA;
(c) MAS Notice on Information to Clients and Product Information Disclosure [Notice No. FAA-N03];
(d) MAS Notice on Recommendation on Investment Products [Notice No. FAA-N16];
(e) Section 36 (obligation on disclosure of interest in securities), and
(f) any other laws, regulations, notices, directive, guidelines, circulars and practice notes which are relates to the above, to the extent permitted by applicable laws, as may be amended from time to time, and any other laws, regulations, notices, directive, guidelines, circulars, and practice notes as we may notify you from time to time. In addition, the recipient who is an accredited investor, expert investor or institutional investor acknowledges that a CIMBR is exempt from Section 27 of the FAA, the recipient will also not be able to file a civil claim against CIMBR for any loss or damage arising from the recipient’s reliance on any recommendation made by CIMBR which would otherwise be a right that is available to the recipient under Section 27 of the FAA, the recipient will also not be able to file a civil claim against CIMBR for any loss or damage arising from the recipient’s reliance on any recommendation made by CIMBR which would otherwise be a right that is available to the recipient under Section 27 of the FAA.
South Korea: This report is issued and distributed in South Korea by CIMB Securities Limited, Korea Branch (“CIMB Korea”) which is licensed as a cash equity broker, and regulated by the Financial Services Commission and Financial Supervisory Service of Korea. In South Korea, this report is for distribution only to professional investors under Article 9(5) of the Financial Investment Services and Capital Market Act of Korea
Page 23

Asia Pacific Daily│Equity research│April 26, 2016
11
(“FSCMA”).
Spain: This document is a research report and it is addressed to institutional investors only. The research report is of a general nature and not personalised and does not constitute investment advice so, as the case may be, the recipient must seek proper advice before adopting any investment decision. This document does not constitute a public offering of securities.
CIMB is not registered with the Spanish Comision Nacional del Mercado de Valores to provide investment services.
Sweden: This report contains only marketing information and has not been approved by the Swedish Financial Supervisory Authority. The distribution of this report is not an offer to sell to any person in Sweden or a solicitation to any person in Sweden to buy any instruments described herein and may not be forwarded to the public in Sweden.
Switzerland: This report has not been prepared in accordance with the recognized self-regulatory minimal standards for research reports of banks issued by the Swiss Bankers’ Association (Directives on the Independence of Financial Research).
Taiwan: This research report is not an offer or marketing of foreign securities in Taiwan. The securities as referred to in this research report have not been and will not be registered with the Financial Supervisory Commission of the Republic of China pursuant to relevant securities laws and regulations and may not be offered or sold within the Republic of China through a public offering or in circumstances which constitutes an offer or a placement within the meaning of the Securities and Exchange Law of the Republic of China that requires a registration or approval of the Financial Supervisory Commission of the Republic of China.
Thailand: This report is issued and distributed by CIMB Securities (Thailand) Company Limited (“CIMBS”) based upon sources believed to be reliable (but their accuracy, completeness or correctness is not guaranteed). The statements or expressions of opinion herein were arrived at after due and careful consideration for use as information for investment. Such opinions are subject to change without notice and CIMBS has no obligation to update its opinion or the information in this research report.
If the Financial Services and Markets Act of the United Kingdom or the rules of the Financial Conduct Authority apply to a recipient, our obligations owed to such recipient are unaffected.
CIMB Securities (Thailand) Co., Ltd. may act or acts as Market Maker, and issuer and offerer of Derivative Warrants and Structured Note which may have the following securities as its underlying securities. Investors should carefully read and study the details of the derivative warrants in the prospectus before making investment decisions.
AAV, ADVANC, AMATA, ANAN, AOT, AP, BA, BANPU, BBL, BCP, BDMS, BEAUTY, BEC, BEM, BH, BJCHI, BLA, BLAND, BTS, CBG, CENTEL, CHG, CK, CKP, CPALL, CPF, CPN, DELTA, DTAC, EARTH, EGCO, EPG, GL, GLOW, GPSC, GUNKUL, HANA, HMPRO, ICHI, INTUCH, IRPC, ITD, IVL, JAS, KBANK, KCE, KKP, KTB, KTC, LH, LHBANK, LPN, M, MAJOR, MINT, PLANB, PLAT, PS, PTG, PTT, PTTEP, PTTGC, QH, ROBINS, RS, S, SAMART, SAMTEL, SAWAD, SCB, SCC, SCCC, SCN, SGP, SIRI, SPALI, SPCG, STEC, STPI, SVI, TASCO, TCAP, THAI, THCOM, TICON, TISCO, TMB, TOP, TPIPL, TRUE, TTA, TTCL, TTW, TU, UNIQ, UV, VGI, VNG, WHA, WORK.
Corporate Governance Report:
The disclosure of the survey result of the Thai Institute of Directors Association (“IOD”) regarding corporate governance is made pursuant to the policy of the Office of the Securities and Exchange Commission. The survey of the IOD is based on the information of a company listed on the Stock Exchange of Thailand and the Market for Alternative Investment disclosed to the public and able to be accessed by a general public investor. The result, therefore, is from the perspective of a third party. It is not an evaluation of operation and is not based on inside information.
The survey result is as of the date appearing in the Corporate Governance Report of Thai Listed Companies. As a result, the survey result may be changed after that date. CIMBS does not confirm nor certify the accuracy of such survey result.
Score Range: 90 - 100 80 - 89 70 - 79 Below 70 or No Survey Result
Description: Excellent Very Good Good N/A
United Arab Emirates: The distributor of this report has not been approved or licensed by the UAE Central Bank or any other relevant licensing authorities or governmental agencies in the United Arab Emirates. This report is strictly private and confidential and has not been reviewed by, deposited or registered with UAE Central Bank or any other licensing authority or governmental agencies in the United Arab Emirates. This report is being issued outside the United Arab Emirates to a limited number of institutional investors and must not be provided to any person other than the original recipient and may not be reproduced or used for any other purpose. Further, the information contained in this report is not intended to lead to the sale of investments under any subscription agreement or the conclusion of any other contract of whatsoever nature within the territory of the United Arab Emirates.
United Kingdom: The distribution of this report is not an offer to buy or sell to any person within or outside the United Kingdom or a solicitation to any person within or outside of the United Kingdom to buy or sell any instruments described herein. This report is being issued outside the United Kingdom and to a limited number of institutional investors and may not be provided to any person other than the original recipient and may not be reproduced or used for any other purpose.
United States: This research report is distributed in the United States of America by CIMB Securities (USA) Inc, a U.S. registered broker-dealer and a related company of CIMB Research Pte Ltd, CIMB Investment Bank Berhad, PT CIMB Securities Indonesia, CIMB Securities (Thailand) Co. Ltd, CIMB Securities Limited, CIMB Securities (India) Private Limited, and is distributed solely to persons who qualify as “U.S. Institutional Investors” as defined in Rule 15a-6 under the Securities and Exchange Act of 1934. This communication is only for Institutional Investors whose ordinary business activities involve investing in shares, bonds, and associated securities and/or derivative securities and who have professional experience in such investments. Any person who is not a U.S. Institutional Investor or Major Institutional Investor must not rely on this communication. The delivery of this research report to any person in the United States of America is not a recommendation to effect any transactions in the securities discussed herein, or an endorsement of any opinion expressed herein. CIMB Securities (USA) Inc, is a FINRA/SIPC member and takes responsibility for the content of this report. For further information or to place an order in any of the above-mentioned securities please contact a registered representative of CIMB Securities (USA) Inc.
Other jurisdictions: In any other jurisdictions, except if otherwise restricted by laws or regulations, this report is only for distribution to professional, institutional or sophisticated investors as defined in the laws and regulations of such jurisdictions.
Page 24

Asia Pacific Daily│Equity research│April 26, 2016
12
Corporate Governance Report of Thai Listed Companies (CGR). CG Rating by the Thai Institute of Directors Association (Thai IOD) in 2015, Anti-Corruption Progress Indicator 2015.
AAV – Very Good, 3B, ADVANC – Excellent, 3A, AEONTS – Good, 1, AMATA – Very Good, 2, ANAN – Very Good, 3A, AOT – Very Good, 2, AP - Good, 3A, ASK – Very Good, 3B, ASP – Very Good, 4, BANPU – Very Good, 4, BAY – Very Good, 4, BBL – Very Good, 4, BCH – not available, no progress, BCP - Excellent, 5, BDMS – Very Good, 3B, BEAUTY – Good, 2, BEC - Good, 3B, BECL – Very Good, 3B, BH - Good, 2, BIGC - Excellent, 3A, BJC – Good, 1, BLA – Very Good, 4, BMCL - Very Good, 1, BTS - Excellent, 3A, CBG – Good, 1, CCET – not available, 1, CENTEL – Very Good, 3A, CHG – Good, 3B, CK – Excellent, 3B, COL – Very Good, 3A, CPALL – Good, 3A, CPF – Very Good, 3A, CPN - Excellent, 5, DELTA - Very Good, 3A, DEMCO – Very Good, 3A, DTAC – Excellent, 3A, EA – not available, 3A, ECL – Good, 4, EGCO - Excellent, 4, EPG – not available, 3B, GFPT - Very Good, 3A, GLOBAL – Very Good, 2, GLOW - Good, 3A, GRAMMY - Excellent, 3B, GUNKUL – Very Good, 1, HANA - Excellent, 4, HEMRAJ – Very Good, 2, HMPRO - Excellent, 3A, ICHI – Very Good, 3A, INTUCH - Excellent, 4, ITD – Good, 1, IVL - Excellent, 4, JAS – not available, 3A, JASIF – not available, no progress, JUBILE – Good, 3A, KAMART – not available, no progress, KBANK - Excellent, 4, KCE - Excellent, 4, KGI – Good, 4, KKP – Excellent, 4, KSL – Very Good, 2, KTB - Excellent, 4, KTC – Very Good, 3A, LH - Very Good, 3B, LPN – Excellent, 3A, M - Good, 2, MAJOR - Good, 1, MAKRO – Good, 3A, MBKET – Good, 2, MC – Very Good, 3A, MCOT – Excellent, 3A, MEGA – Very Good, 2, MINT - Excellent, 3A, MTLS – Good, 2, NYT – Good, no progress, OISHI – Very Good, 3B, PLANB – Good, 3B, PS – Excellent, 3A, PSL - Excellent, 4, PTT - Excellent, 5, PTTEP - Excellent, 4, PTTGC - Excellent, 5, QH – Very Good, 2, RATCH – Excellent, 3A, ROBINS – Excellent, 3A, RS – Very Good, 1, SAMART - Excellent, 3B, SAPPE - Good, 3B, SAT – Excellent, 5, SAWAD – Good, 1, SC – Excellent, 3B, SCB - Excellent, 4, SCBLIF – not available, no progress, SCC – Excellent, 5, SCN – Good, 1, SCCC - Good, 3A, SIM - Excellent, 3B, SIRI - Good, 1, SPALI - Excellent, 3A, SPRC – not available, no progress, STA – Very Good, 1, STEC – Very Good, 3B, SVI – Very Good, 3A, TASCO – Very Good, 3A, TCAP – Very Good, 4, THAI – Very Good, 3A, THANI – Very Good, 5, THCOM – Excellent, 4, THRE – Very Good, 3A, THREL – Very Good, 3A, TICON – Very Good, 3A, TISCO - Excellent, 4, TK – Very Good, 3B, TMB - Excellent, 4, TPCH – Good, 3B, TOP - Excellent, 5, TRUE – Very Good, 2, TTW – Very Good, 2, TU – Very Good, 3A, VGI – Excellent, 3A, WHA – Good, 3A, WORK – not available, no progress. Comprises level 1 to 5 as follows: Level 1: Committed Level 2: Declared Level 3: Established (3A: Established by Declaration of Intent, 3B: Established by Internal Commitment and Policy) Level 4: Certified Level 5: Extended.
CIMB Recommendation Framework
Stock Ratings Definition:
Add The stock’s total return is expected to exceed 10% over the next 12 months.
Hold The stock’s total return is expected to be between 0% and positive 10% over the next 12 months.
Reduce The stock’s total return is expected to fall below 0% or more over the next 12 months.
The total expected return of a stock is defined as the sum of the: (i) percentage difference between the target price and the current price and (ii) the forward net dividend yields of the stock. Stock price targets have an investment horizon of 12 months.
Sector Ratings Definition:
Overweight An Overweight rating means stocks in the sector have, on a market cap-weighted basis, a positive absolute recommendation.
Neutral A Neutral rating means stocks in the sector have, on a market cap-weighted basis, a neutral absolute recommendation.
Underweight An Underweight rating means stocks in the sector have, on a market cap-weighted basis, a negative absolute recommendation.
Country Ratings Definition:
Overweight An Overweight rating means investors should be positioned with an above-market weight in this country relative to benchmark.
Neutral A Neutral rating means investors should be positioned with a neutral weight in this country relative to benchmark.
Underweight An Underweight rating means investors should be positioned with a below-market weight in this country relative to benchmark.
Page 25