Equity Research on Cement Sector
85
Equity Research on Cement Sector PROJECT REPORT ON EQUITY RESEARCH ON CEMENT SECTOR IN BIRLA SUN LIFE INSURANCE COMPANY LTD. SUBMITTED IN PARTIAL FULFILMENT OF THE REQUIREMENT OF MASTER OF MANAGEMENT STUDIES BY GURPREET SINGH SALUJA ROLL NO. : 2010129 MMS-II (SEM III) YEAR 2010-2012 Page 1
Transcript of Equity Research on Cement Sector
Equity Research on Cement Sector
PROJECT REPORT ON
EQUITY RESEARCH ON CEMENT SECTORIN
BIRLA SUN LIFE INSURANCE COMPANY LTD.
SUBMITTED IN PARTIAL FULFILMENT OF THE REQUIREMENT OF
MASTER OF MANAGEMENT STUDIES
BY
GURPREET SINGH SALUJA
ROLL NO. : 2010129
MMS-II (SEM III)
YEAR 2010-2012
Page 1

Equity Research on Cement Sector
LALA LAJPATRAI INSTITUTE OF MANAGEMENT MAHALAXMI, MUMBAI - 400034
PROJECT REPORT ON
EQUITY RESEARCH ON CEMENT SECTOR
In
BIRLA SUN LIFE INSURANCE COMPANY LTD.
SUBMITTED IN PARTIAL FULFILMENT OF THE REQUIREMENT OF
MASTER OF MANAGEMENT STUDIES
BY
GURPREET SINGH SALUJA
ROLL NO. : 2010129
MMS-II (SEM III)
YEAR 2010-2012
Page 2

Equity Research on Cement Sector
LALA LAJPATRAI INSTITUTE OF MANAGEMENT MAHALAXMI, MUMBAI - 400034
SUMMER INTERNSHIP PROJECT
SUBMITTED BYGURPREET SINGH SALUJA
ROLL NO. : 2010129MMS – II (SEM III)
Year 2010-2012
Page 3

Equity Research on Cement Sector
Page 4

Equity Research on Cement Sector
Page 5
Equity Research on Cement Sector
CertifiCate
This is to certify that the project work titled “Equity Research on Cement Sector” is a summer internship work carried out by Mr. Gurpreet Singh Saluja.The project was completed for “Birla Sunlife Insurance Company Ltd.”, under the guidance of Mr. Nikesh Ruparel.I further certify that the said work has not been submitted in the part or in full, to any other University.
Date:
____________________ ____________________ Prof. Arati Kale Dr V.B. AngadiProject Guide Director,
Lala Lajpatrai Institute of Management
Page 6
Equity Research on Cement Sector
DECLARATION
I, Mr. Gurpreet Singh Saluja, student of Lala Lajpatrai Institute of Management of MMS II (Semester III) hereby declare that I have completed the summer internship project on Equity Research on Cement Sector with Birla Sunlife Insurance Company Ltd. in the Academic year 2010-2012. The information submitted is true & original to the best of my knowledge.
Signature of the student
Page 7
Equity Research on Cement Sector
ACKNOWLEDGEMENT
At the outset of this project, I would like to express my profound thanks to a few people without whose help, completion of this project would not have been possible.
First and foremost, I would like to express sincere thanks to Birla Sunlife Insurance Company Ltd. for giving me this opportunity to work with them.The list is endless but to name a few special people, I would like to thank Mr.Nikesh Ruparel for being extremely supportive and guiding me throughout my internship and giving me constant motivation and expert advice.
I would also like to thank the entire Birla Sunlife Insurance Department for providing me their precious time and making this internship a successful learning experience.
I am very grateful to Dr. Angadi, Directorof Lala Lajpat Rai Institute of Management, for giving me the opportunity to do this project in Birla Sunlife Insurance Company Ltd. My sincere thanks to Prof. Arati Kale for her valuable guidance and advice in completing this project.
I would also like to thank Prof. Narendran and Prof. Avni Pramod for being an excellent mentor and helping me whenever I approached him/her.
Last but not the least; I take pride in thanking my family, siblings and friends for their much valued support..
Page 8
Equity Research on Cement Sector
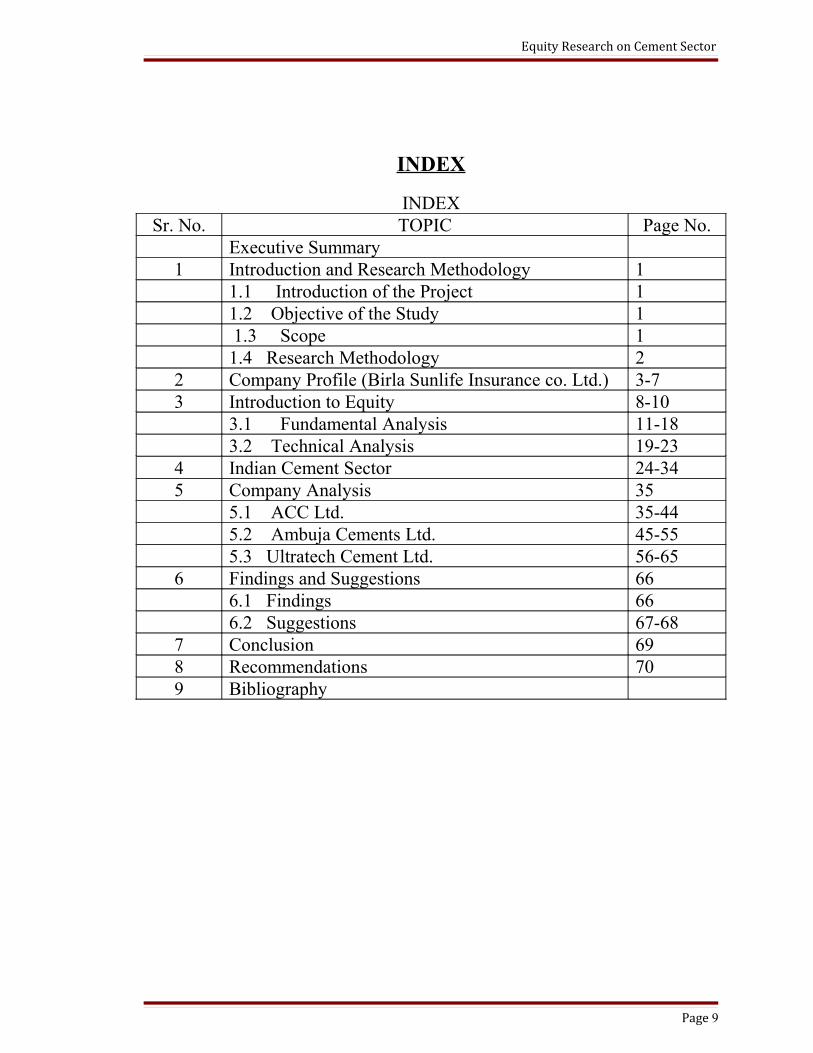
INDEX
INDEXSr. No. TOPIC Page No.
Executive Summary1 Introduction and Research Methodology 1
1.1 Introduction of the Project 11.2 Objective of the Study 1 1.3 Scope 11.4 Research Methodology 2
2 Company Profile (Birla Sunlife Insurance co. Ltd.) 3-73 Introduction to Equity 8-10
3.1 Fundamental Analysis 11-183.2 Technical Analysis 19-23
4 Indian Cement Sector 24-345 Company Analysis 35
5.1 ACC Ltd. 35-445.2 Ambuja Cements Ltd. 45-555.3 Ultratech Cement Ltd. 56-65
6 Findings and Suggestions 666.1 Findings 666.2 Suggestions 67-68
7 Conclusion 698 Recommendations 709 Bibliography
Page 9
Equity Research on Cement Sector
EXECUTIVE SUMMARY
Indian economy being one of the fastest developing economies in the world, companies
in India are growing at faster rate as compared to their growth rate a decade back. Many
Indian Companies are expanding their business globally with mergers and acquisitions.
Thus Indian equity markets today are attracting investors from around the world to take
advantage of India’s growth story.
As companies grow their shareholders are benefitted with good dividend and capital
appreciation on investment in equity shares of such companies. Number of companies
listed in stock exchange (BSE & NSE) has been increasing every year with new IPO’s
coming in the market.
In India people are realizing that equity has potential to give highest return as compared
to other investment avenues however people do not have proper knowledge in which
stock to invest their hard earned money to get good returns. They just invest on the basis
of tips given by brokers or friends which is not correct. The penetration of retail investors
in the Indian Markets is just around 5%, which means that the Indian investor is not able
to take the maximum advantage of India’s growth.
This report is meant to narrow down this gap between retail investors and equity markets
by simplifying the basic investment strategies and give a basic understanding of how
stocks are analysed for investment using the the theories of fundamental and technical
analysis
Equity Research helps the investor to know about the value, risk & volatility of the
covered security, and thus assist investors to decide whether to buy, hold, sell, sell short,
or simply avoid the security in question.
Page 10
Equity Research on Cement Sector
Fundamental analysis is very helpful to the investor, which is reflected in the investment
purpose. Fundamental analysis consist of three parts, they are economic, industry and
company. Any investors who go to systematic investment, he/she would like to know, the
complete scenario of the industry. If the industry looks positive then analyze various
companies in the sector. A Company is analyzed fundamentally to check its performance
and financial strength. With the help of this analysis investors comes to know whether to
make an investment in a particular stock.
In this report I have explained How to do fundamental analysis with analysis of cement
sector and few companies in the sector.
Page 11
Equity Research on Cement Sector
1. INTRODUCTION AND RESEARCH METHODOLOGY
1.1 INTRODUCTION OF THE PROJECT :
Equity Research is a subject which involves detailed knowledge of the share market. This
knowledge can be obtained through fundamental and technical analysis. Fundamental
Analysis looks into the company’s financial statements and key ratios to determine
whether a stock is worth buying or not. Fundamental Analysis is generally for long term
perspective. Technical Analysis make use of charts to determine the future price of a
particular stock. These analysis helps in making informed decisions which stock to buy,
hold or sell. This research report is prepared on cement sector in India and its three
companies namely ACC LTd, Ambuja Cements Ltd. and Ultratech Cement Ltd. and an
analysis is done in order to determine which company provides good returns to the
investors.
1.2 OBJECTIVE OF THE STUDY:
To acquire a deep knowledge of the Cement Sector through fundamental analysis.
• To assess the financial health & management effectiveness of the Company.
• To evaluate the share of the company ACC Ltd., Ambuja Cements Ltd. and
Ultratech Cement Ltd. on the basis of fundamental analysis.
• To find out how effectively resources are used within the enterprise
• To predict the future performance of the stocks and give suggestion on the same.
1.3 SCOPE:
The scope of project is limited to Understanding the basics of Fundamental analysis and
apply it to take a decision of investing in Cement Stocks.
Page 12
Equity Research on Cement Sector
1.4 RESEARCH METHODOLOGY:
Formation of the Problem
• Which significant ratios determine investment decision in share market ?
Collection of Data
Secondary Data:
The sources of secondary data are:
• Company Annual Report
• Internet-Websites
Research Limitation
• Information available on the websites was not updated.
• There was a limited time period to complete the project.
• This research is restricted to analysis of cement sector.
Page 13
Equity Research on Cement Sector
2. COMPANY PROFILE
Company Profile
Established in 2000, Birla Sun Life Insurance Company Limited (BSLI) is a joint venture
between the Aditya Birla Group, a well known and trusted name globally amongst Indian
conglomerates and Sun Life Financial Inc, leading international financial services
organization from Canada. The local knowledge of the Aditya Birla Group combined
with the domain expertise of Sun Life Financial Inc., offers a formidable protection for its
customers’ future.
With an experience of over 9 years, BSLI has contributed significantly to the growth and
development of the life insurance industry in India and currently ranks amongst the top 5
private life insurance companies in the country.
Page 14
Equity Research on Cement Sector
Known for its innovation and creating industry benchmarks, BSLI has several firsts to
its credit. It was the first Indian Insurance Company to introduce “Free Look Period”
and the same was made mandatory by IRDA for all other life insurance companies.
Additionally, BSLI pioneered the launch of Unit Linked Life Insurance plans amongst
the private players in India. To establish credibility and further transparency, BSLI also
enjoys the prestige to be the originator of practice to disclose portfolio on monthly basis.
These category development initiatives have helped BSLI be closer to its policy holders’
expectations, which gets further accentuated by the complete bouquet of insurance
products (viz. pure term plan, life stage products, health plan and retirement plan) that
the company offers.
Add to this, the extensive reach through its network of 600 branches and 175,000
empanelled advisors. This impressive combination of domain expertise, product range,
reach and ears on ground, helped BSLI cover more than 2 million lives since it
commenced operations and establish a customer base spread across more than 1500
towns and cities in India. To ensure that our customers have an impeccable experience,
BSLI has ensured that it has lowest outstanding claims ratio of 0.00% for FY 2008-09.
Additionally, BSLI has the best Turn Around Time according to LOMA on all claims
Parameters. Such services are well supported by sound financials that the Company has.
The AUM of BSLI stood at Rs. 8165 crs as on February 28, 2009, while as on March 31,
2009, the company has a robust capital base of Rs. 2000 crore.
Vision
To be a leader and role model in a broad based and integrated financial services business.
Mission
To help people mitigate risks of life, accident, health, and money at all stages and under
all circumstances.
Enhance the financial future of our customers including enterprises.
Values
Page 15
Equity Research on Cement Sector
Integrity, Commitment, Passion, Seamlessness, Speed
Management
The management team comprises of
• Mr. Kumar Mangalam Birla (Chairman)
• Mr.Niall O’Hare (Chief Actuarial Officer)
• Mr. Jayant Dua ( Managing Director and CEO)
A US $28 billion corporation, the Aditya Birla Group is in the league of Fortune 500
worldwide. It is anchored by an extraordinary force of 100,000 employees, belonging to
25 different nationalities. The group operates in 25 countries across six continents –
truly India's first multinational corporation.
Aditya Birla Group through Aditya Birla Financial Services Group (ABFSG), has a
strong presence across various financial services verticals that include life insurance,
fund management, distribution & wealth management, security based lending,
insurance broking, private equity and retail broking. The seven companies representing
ABFSG are Birla Sun Life Insurance Company, Birla Sun Life Asset Management
Company, Aditya Birla Money, Aditya Birla Finance, Birla Insurance Advisory &
Broking Services, Aditya Birla Capital Advisors and Apollo Sindhoori Capital
Investment. In FY 2008-09, the consolidated revenues of ABFSG from these businesses
crossed Rs. 4763 crore, registering a growth rate of 36%.
Sun Life Financial is a leading international financial services organisation providing a
diverse range of protection and wealth accumulation products and services to individuals
and corporate customers. Chartered in 1865, Sun Life Financial and its partners today
have operations in key markets worldwide, including Canada, the United States, the
United Kingdom, Ireland, Hong Kong, the Philippines, Japan, Indonesia, India, China
Page 16
Equity Research on Cement Sector
and Bermuda. As of December 31, 2008, the Sun Life Financial group of companies had
total assets under management of $381 billion.
Awards
At Birla Sun Life Insurance, winning is a way of life. Our innovative solutions and
customer-friendly services have been admired, appreciated and rewarded by customers
and the industry at large.
• Recruiting and Staffing Best in Class Awards.
• Outlook Money Awards 2004 BSLI - Best Life Insurer (Runner Up) 2004
TROPHY
• The 8th Asia Insurance Industry Awards 2004 - Birla Sun Life Insurance was
among the top five nominees in the category.
• The Indo-Canadian Business Chamber- BSLI awarded for its 'Successful
Performance' for 4 years April 2005.
• Birla Sun Life Insurance was presented 'The Hewitt Best Employers In India
Awards 2004' Trophy.
• Birla Sun Life Insurance was awarded 'The Great Place to Work Seminar Series
2007’ Presented by Anil Sachdev (Chairman & MD of Grow Talent Company
Page 17
Equity Research on Cement Sector
Ltd) Robert Levering (Co-founder Great Place to Work Institute) and Jehangir
Pocha (Business World Magazine).
• The Bhartiya Shiromani Puraskar awarded to BSLI at the seminar on "Economic
Development” New Delhi, on February 13, 2006. This is a Certificate of
Excellence for Enhancing the image of India presented by Dr. Bhishma Narain
Singh (Former Governor of Tamil Nadu & Assam) in association with the
"Institute of Economic Studies (IES)".
• Hewitt Best Employers in India 2004.
• Sponsorship Acknowledgement for - The Asia Insurance Review.
Future Business Continuity Plan
Birla Sun Life Insurance is one of the few Indian companies to have a fully operational
Business Continuity Plan (BCP) to ensure minimal impact to the organisation, its people,
and most importantly, its customers. Our Business Continuity Planning (BCP) Program is
a response plan which would ensure that in the event of a disaster we would be able to
restore and recover operations for critical processes within a predetermined time after the
disaster
BSLI’S Business Continuity Management Policy
To have a planned response in the event of any contingency ensuring recovery of critical
activities at agreed levels within agreed timeframe thereby complying with various
Page 18
Equity Research on Cement Sector
regulatory requirements and minimizing the potential business impact to BSLI.
Additionally to create a system that fosters continuous improvement of business
continuity management.
3. INTRODUCTION TO EQUITY
What is Equity?
In accounting and finance, equity is the residual claim or interest of the most junior class
of investors in assets, after all liabilities are paid. If valuations placed on assets do not
exceed liabilities, negative equity exists. In an accounting context, Shareholders' equity
(or stockholders' equity, shareholders' funds, shareholders' capital or similar terms)
represents the remaining interest in assets of a company, spread among individual
shareholders of common or preferred stock.
At the start of a business, owners put some funding into the business to finance assets.
This creates liability on the business in the shape of capital as the business is a separate
entity from its owners. Businesses can be considered to be, for accounting purposes, sums
of liabilities and assets; this is the accounting equation. After liabilities have been
accounted for, the positive remainder is deemed the owner's interest in the business.
This definition is helpful to understand the liquidation process in case of bankruptcy. At
first, all the secured creditors are paid against proceeds from assets. Afterward, a series of
creditors, ranked in priority sequence, have the next claim/right on the residual proceeds.
Ownership equity is the last or residual claim against assets, paid only after all other
creditors are paid. In such cases where even creditors could not get enough money to pay
their bills, nothing is left over to reimburse owners' equity. Thus owners' equity is
reduced to zero. Ownership equity is also known as risk capital, liable capital and equity.
Page 19
Equity Research on Cement Sector
What is Equity Shares?
Total equity capital of a company is divided into equal units of small denominations,
each called a share. For example, in a company the total equity capital of Rs 2,00,00,000
is divided into 20,00,000 units of Rs 10 each. Each such unit of Rs 10 is called a Share.
Thus, the company then is said to have 20, 00,000 equity shares of Rs 10 each. The
holders of such shares are members of the company and have voting rights.
Equity Investment
Equity investments generally refers to the buying and holding of shares of stock on a
stock market by individuals and firms in anticipation of income from dividends and
capital gain as the value of the stock rises. It also sometimes refers to the acquisition of
equity (ownership) participation in a private (unlisted) company or a startup (a company
being created or newly created). When the investment is in infant companies, it is
referred to as venture capital investing and is generally understood to be higher risk than
investment in listed going-concern situations.
How to invest in Equity Shares?
Investors can buy equity shares of a company from Security market that is from Primary
market or Secondary market.
The primary market provides the channel for sale of new securities. Primary market
provides opportunity to issuers of securities; Government as well as corporate, to raise
resources to meet their requirements of investment and/or discharge some obligation.
Investors can buy shares of a company through IPO (Initial Public Offering) when it is
first time issued to the public. Once shares are issued to the public it is traded in the
secondary market. Stock exchange only acts as facilitator for trading of equity shares.
Anyone who wishes to buy shares of a company can buy it from an existing shareholder
of a company.
Page 20
Equity Research on Cement Sector
Why should one invest in Equity in particular?
When you buy a share of a company you become a shareholder in that Company
.Equities have the potential to increase in value over time. It also provides your portfolio
with the growth necessary to reach your long term investment goals. Research studies
have proved that the equities have outperformed most other forms of investments in the
long term.
Equities are considered the most challenging and the rewarding, when compared to other
investment options. Research studies have proved that investments in some shares with a
longer tenure of investment have yielded far superior returns than any other investment.
However, this does not mean all equity investments would guarantee similar high returns.
Equities are high risk investments. One needs to study them carefully before investing
It is important for investors to note that while equity shares give highest return as
compared to other investment avenues it also carries highest risk therefore it is important
to find ‘ real value’ or ‘ intrinsic value’ of the security before investing in it. The
intrinsic value of a security being higher than the security’s market value represents a
time to buy. If the value of the security is lower than its market price, investors should
sell it.
To be able to value equity, we need to first understand how equity is to be analyzed.
Equity Share of any company can be analyzed through
• Fundamental Analysis
• Technical Analysis
Page 21
Equity Research on Cement Sector
3.1 FUNDAMENTAL ANALYSIS
Introduction
Fundamental analysis applied to the share market is a method of assessing whether a
company is a good investment using information from various sources such as financial
statements, company announcements, disclosures and economic and industry
reports.Fundamental analysis typically focuses on key statistics in a company's financial
statements to determine if the stock price is correctly valued.
Interpretation
Most fundamental information focuses on economic, industry, and company statistics.
The typical approach to analyzing a company involves four basic steps:
• Determine the condition of the general economy.
• Determine the condition of the industry.
• Determine the condition of the company.
• Determine the value of the company's stock.
Fundamental analysis includes:
• Economic analysis
• Industry analysis
Page 22
Equity Research on Cement Sector
• Company analysis
Economic Analysis
The economy is studied to determine if overall conditions are good for the stock market.
Is inflation a concern? Are interest rates likely to rise or fall? Are consumers spending? Is
the trade balance favorable? Is the money supply expanding or contracting? These are
just some of the questions that the fundamental analyst would ask to determine if
economic conditions are right for the stock market.
Industry Analysis
The company's industry obviously influences the outlook for the company. Even the best
stocks can post mediocre returns if they are in an industry that is struggling. It is often
said that a weak stock in a strong industry is preferable to a strong stock in a weak
industry.
Company Analysis
After determining the economic and industry conditions, the company itself is analyzed
to determine its financial health. This is usually done by studying the company's financial
statements. From these statements a number of useful ratios can be calculated. The ratios
fall under five main categories: profitability, price, liquidity, leverage, and efficiency.
When performing ratio analysis on a company, the ratios should be compared to other
companies within the same or similar industry to get a feel for what is considered
"normal."
Fundamental analysis looks at both ‘quantitative’ data (eg. revenue growth, margins and
financial ratios) and ‘qualitative’ data (eg. management strength, market position, patents
and proprietary technology).
Under this method, the company’s valuation is based on past performance, industry
trends, growth potential management and competition. Unlike the Efficient Market
Theory (EMT), which says that all information is already reflected in current prices and
Page 23

Equity Research on Cement Sector
therefore cannot be predicted, fundamental analysis believes that an intrinsic value may
be derived and that investors can profit by buying ‘undervalued’ shares and, where short
selling is allowed, selling ‘overvalued’ shares.
‘Undervalued’ shares are those that have a higher intrinsic valuation compared to the
current market price. Conversely, ‘overvalued’ shares are those with intrinsic valuations
less than the current market price. The assumption here is that in the long run, shares will
move towards the intrinsic valuation or the ‘correct price’.
Earnings
It is often said that earnings are the "bottom line" when it comes to valuing a company's
stock, and indeed fundamental analysis places much emphasis upon a company's
earnings. Simply put, earnings are how much profit (or loss) a company has made after
subtracting expenses. During a specific period of time, all public companies are required
to report their earnings on a quarterly basis through a 10-Q Report . Earnings are
important to investors because they give an indication of the company's expected
dividends and its potential for growth and capital appreciation. That does not necessarily
mean, however, that low or negative earnings always indicate a bad stock; for example,
many young companies report negative earnings as they attempt to grow quickly enough
to capture a new market, at which point they'll be even more profitable than they
otherwise might have been. The key is to look at the data underlying a company's
earnings on its financial statements and to use the following profitability ratios to
determine whether or not the stock is a sound investment.
Approaches to Fundamental Analysis
‘Top-down’ and ‘bottom-up’
There are two approaches to conducting fundamental analysis: top-down and bottom-up.
Both have their strengths and weaknesses and both have the same goal of choosing the
best companies for investment. The important thing is to use the approach that you are
comfortable with and which suits your investment style.
Page 24
Equity Research on Cement Sector
The bottom-up approach starts from the individual company before proceeding to the
general economic and market conditions. Advocates of this approach such as Warren
Buffett, Peter Lynch and Benjamin Graham primarily look for companies that are
financially healthy, have a strong track record of earnings growth and good prospects.
The general idea behind this is that there are the companies that can deliver profits in any
market environment and thrive even under difficult conditions. Industry and
macroeconomic factors are then considered, but are only secondary under this approach.
On the other hand, the top-down approach, as the name suggests, begins from the macro
level (general or broad) and ends at the micro level (specific). Under this approach, one
first looks at the global market conditions, then drills down to the state of a country’s
economy, then a specific sector and finally an individual company.
Fundamental Analysis Tools
Earnings Per Share:
Earnings Per Share = Net Earnings / Outstanding Shares
Earnings per share serve as an indicator of a company's profitability. An important aspect
of EPS that's often ignored is the capital that is required to generate the earnings (net
income) in the calculation. Two companies could generate the same EPS number, but one
could do so with less equity (investment) - that company would be more efficient at using
its capital to generate income and, all other things being equal would be a "better"
company. EPS plays major role in investment decision. One should look for high EPS
stocks and the higher the better is the stock. EPS comparison should be done from one
company to another which are in the same industry/sector and not from one company
from Auto sector and another company from IT sector.
There are three types of EPS numbers:
Trailing EPS - Trailing EPS means last year’s EPS which is considered as actual and for
ongoing current year.
Current EPS - Current EPS means which is still under projections and going to come on
Page 25
Equity Research on Cement Sector
financial year end.
Forward EPS - Forward EPS which is again under projections and going to come on
next financial year end
The EPS is helpful in comparing one company to another, assuming they are in the same
industry, but it alone doesn’t tell you the whole story of the company. For that
information, we need to look at some more ratios.
Price to Earnings Ratio:
The P/E looks at the relationship between the stock price and the company’s earnings.
The P/E is the most popular metric of stock analysis
You calculate the P/E by taking the share price and dividing it by the company’s EPS.
P/E = Stock Price / EPS
The P/E gives you an idea of what the market is willing to pay for the company’s
earnings. The higher the P/E the more the market is willing to pay for the company’s
earnings. Some investors read a high P/E as an overpriced stock and that may be the case,
however it can also indicate the market has high hopes for this stock’s future and has bid
up the price.
Conversely, a low P/E may indicate a “vote of no confidence” by the market or it could
mean this is a sleeper that the market has overlooked..
What is the “right” P/E? There is no correct answer to this question, because part of the
answer depends on your willingness to pay for earnings. The more you are willing to pay,
which means you believe the company has good long term prospects over and above its
current position, the higher the “right” P/E is for that particular stock in your decision-
making process. Another investor may not see the same value and think your “right” P/E
is all wrong.
Page 26

Equity Research on Cement Sector
Many investors try finding low P/E ratios stocks of high value growth companies and
make investments in such stocks which may prove real diamonds in future. Generally the
P/E ratios are compared of one company to other companies in the same sector/industry
and not in other industry before selecting any particular share.
Dividend Payout Ratio:
The Dividend Payout Ratio measures what a company’s pays out to investors in the form
of dividends.You calculate the DPR by dividing the annual dividends per share by the
Earnings Per Share.
DPR = Dividends Per Share / EPS
Growing companies will typically retain more profits to fund growth and pay lower or no
dividends. Companies that pay higher dividends may be in mature industries where there
is little room for growth and paying higher dividends is the best use of profits (utilities
used to fall into this group, although in recent years many of them have been
diversifying).
The payout ratio and the retained earning ratio are the indicators of the amount of
earnings that have been ploughed back in the business. The lower the payout ratio, the
higher will be the amount of earnings ploughed back in the business and vice versa. A
lower payout ratio or higher retained earnings ratio means a stronger financial position of
the company.
Dividend Yield:
The dividend yield of a company's stock offerings is the yearly total dividend payments
that the corporation makes divided by its market capitalization. The dividend yield can
also be expressed as dividend per share divided by the share price.
This is the return to shareholders based on current share prices (as determined by the
market).
Page 27

Equity Research on Cement Sector
Interpretation of Dividend Yield
High Dividend Yield Low Dividend Yield
Shows that stock is underpriced
(less than its real value)
- Indicates future dividend
payments may NOT be as high as
the current one
- Shows the company has been hit
hard in times of economic
depression and financial hardship
Shows that stock is overpriced
(more than its real value)
- Indicates future dividend
payments might actually be higher
than the current dividend payments
- Shows the company is relatively
financially stable
Return on Equity:
Return on Equity (ROE) is one measure of how efficiently a company uses its assets to
produce earnings. You calculate ROE by dividing Net Income by Book Value.
ROE = Net Income/ Book Value
A healthy company may produce an ROE in the 13% to 15% range. Like all metrics,
compare companies in the same industry to get a better picture. The investors favour the
company with higher ROE.
Return on Capital Employed:
Page 28
Equity Research on Cement Sector
This ratio shows the relationship between the profit earned before interest and tax and the
capital employed to earn such profit.
Return on Capital Employed
= Net Profit before Interest, Tax and Dividend/Capital Employed x 100
Where Capital Employed = Share Capital (Equity + Preference) + Reserves and Surplus
+ Long-term Loans – Fictitious Assets
Or
Capital Employed = Fixed Assets + Current Assets – Current Liabilities
Return on capital employed measures the profit, which a firm earns on investing a unit of
capital. The profit being the net result of all operations, the return on capital expresses all
efficiencies and inefficiencies of a business. This ratio has a great importance to the
shareholders and investors and also to management. To shareholders it indicates how
much their capital is earning and to the management as to how efficiently it has been
working. This ratio influences the market price of the shares. The higher the ratio, the
better it is.
Inventory Turnover Ratio
Cost of goods sold / Average inventory at cost
Usually a high inventory turnover/stock velocity indicates efficient management of
inventory because more frequently the stocks are sold, the lesser amount of money is
required to finance the inventory. A low inventory turnover ratio indicates an inefficient
management of inventory. A low inventory turnover implies over-investment in
inventories, dull business, poor quality of goods, stock accumulation, accumulation of
obsolete and slow moving goods and low profits as compared to total investment.
Page 29

Equity Research on Cement Sector
3.2 TECHNICAL ANALYSIS
Introduction
Should I buy today? What will prices be tomorrow, next week, or next year? Wouldn't
investing be easy if we knew the answers to these seemingly simple questions? technical
analysis has the answers to these questions.
Technical analysis is the process of analyzing a security's historical prices in an effort to
determine probable future prices. This is done by comparing current price action (i.e.,
current expectations) with comparable historical price action to predict a reasonable
outcome.
Simply put, technical analysis is the study of prices, with charts being the primary tool.
Technical analysts are sometimes referred to as chartists because they rely almost
exclusively on charts for their analysis.
Technical analysis is applicable to stocks, indices, commodities, futures or any tradable
instrument where the price is influenced by the forces of supply and demand. Price refers
to any combination of the open, high, low or close for a given security over a specific
timeframe. The time frame can be based on intraday (tick, 5-minute, 15-minute or
hourly), daily, weekly or monthly price data and last a few hours or many years.
Technicians, as technical analysts are called, are only concerned with two things:
• What is the current price?
• What is the history of the price movement?
Page 30
Equity Research on Cement Sector
The price is the end result of the battle between the forces of supply and demand for the
company's stock. The objective of analysis is to forecast the direction of the future price.
By focusing on price and only price, technical analysis represents a direct approach.
Technicians believe it is best to concentrate on what and never mind why. Why did the
price go up? It is simple, more buyers (demand) than sellers (supply). After all, the value
of any asset is only what someone is willing to pay for it.
Characteristics
Technical analysis employs models and trading rules based on price and volume
transformations, such as the relative strength index, moving averages, regressions, inter-
market and intra-market price correlations, cycles or, classically, through recognition of
chart patterns.
Technical analysis stands in contrast to the fundamental analysis approach to security and
stock analysis. Technical analysis "ignores" the actual nature of the company, market,
currency or commodity and is based solely on "the charts," that is to say price and
volume information, whereas fundamental analysis does look at the actual facts of the
company, market, currency or commodity. For example, any large brokerage, trading
group, or financial institution will typically have both a technical analysis and
fundamental analysis team.
Principles
Technicians say that a market's price reflects all relevant information, so their analysis
looks at the history of a security's trading pattern rather than external drivers such as
economic, fundamental and news events. Price action also tends to repeat itself because
investors collectively tend toward patterned behavior – hence technicians' focus on
identifiable trends and conditions.
The field of technical analysis is based on three assumptions:
Page 31
Equity Research on Cement Sector
• The market discounts everything.
• Price moves in trends.
• History tends to repeat itself.
The Market Discounts Everything
A major criticism of technical analysis is that it only considers price movement, ignoring
the fundamental factors of the company. However, technical analysis assumes that, at any
given time, a stock's price reflects everything that has or could affect the company -
including fundamental factors. Technical analysts believe that the company's
fundamentals, along with broader economic factors and market psychology, are all priced
into the stock, removing the need to actually consider these factors separately. This only
leaves the analysis of price movement, which technical theory views as a product of the
supply and demand for a particular stock in the market.
Price Moves in Trends
In technical analysis, price movements are believed to follow trends. This means that
after a trend has been established, the future price movement is more likely to be in the
same direction as the trend than to be against it. Most technical trading strategies are
based on this assumption.
History Tends To Repeat Itself
Another important idea in technical analysis is that history tends to repeat itself, mainly
in terms of price movement. The repetitive nature of price movements is attributed to
market psychology; in other words, market participants tend to provide a consistent
reaction to similar market stimuli over time. Technical analysis uses chart patterns to
Page 32
Equity Research on Cement Sector
analyze market movements and understand trends. Although many of these charts have
been used for more than 100 years, they are still believed to be relevant because they
illustrate patterns in price movements that often repeat themselves.
Other Usage
Technical analysis can be used on any security with historical trading data. This includes
stocks, futures and commodities, fixed-income securities, forex, etc. In this tutorial, we'll
usually analyze stocks in our examples, but keep in mind that these concepts can be
applied to any type of security. In fact, technical analysis is more frequently associated
with commodities and forex, where the participants are predominantly traders.
Now that you understand the philosophy behind technical analysis, we'll get into
explaining how it really works. One of the best ways to understand what technical
analysis is (and is not) is to compare it to fundamental analysis. We'll do this in the next
section.
Charting Terms and Indicators
Types of charts
OHLC "Bar Charts" — Open-High-Low-Close charts, also known as bar charts, plot
the span between the high and low prices of a trading period as a vertical line segment at
the trading time, and the open and close prices with horizontal tick marks on the range
line, usually a tick to the left for the open price and a tick to the right for the closing
price.
Candlestick chart — Of Japanese origin and similar to OHLC, candlesticks widen and
fill the interval between the open and close prices to emphasize the open/close
relationship. In the West, often black or red candle bodies represent a close lower than
the open, while white, green or blue candles represent a close higher than the open price.
Line chart — Connects the closing price values with line segments.
Page 33
Equity Research on Cement Sector
Point and figure chart — a chart type employing numerical filters with only passing
references to time, and which ignores time entirely in its construction.
Concepts
Resistance — a price level which acts as a ceiling above prices
Support — a price level which acts as a floor below prices
Breakout — the concept whereby prices forcefully penetrate an area of prior support or
resistance, usually, but not always, accompanied by an increase in volume.
Trending — the phenomenon by which price movement tends to persist in one direction
for an extended period of time
Average true range — averaged daily trading range, adjusted for price gaps
Chart pattern — distinctive pattern created by the movement of security prices on a
chart
Momentum — the rate of price change
Point and figure analysis — a priced-based analytical approach employing numerical
filters which may incorporate time references, though ignores time entirely in its
construction.
Overlays
Overlays are generally superimposed over the main price chart.
Resistance — an area that brings on increased selling
Support — an area that brings on increased buying
Trend line — a sloping line of support or resistance
Page 34
Equity Research on Cement Sector
Channel — a pair of parallel trend lines
Moving average — an average that lags behind the price action but filters out short term
movements.
4. CEMENT INDUSTRY
Industry Background
Pre Independence
The first endeavor to manufacture cement dates back to 1889 when a Calcutta based
company endeavored to manufacture cement from Argillaceous (kankar).
But the first endeavor to manufacture cement in an organized way commenced in
Madras. South India Industries Limited began manufacture of Portland cement in
1904.But the effort did not succeed and the company had to halt production.
Finally it was in 1914 that the first licensed cement manufacturing unit was set up by
India Cement Company Ltd at Porbandar, Gujarat with an available capacity of 10,000
tons and production of 1000 installed. The First World War gave the impetus to the
cement industry still in its initial stages. The following decade saw tremendous progress
in terms of manufacturing units, installed capacity and production. This phase is also
referred to as the Nascent Stage of Indian Cement Industry.
Page 35
Equity Research on Cement Sector
During the earlier years, production of cement exceeded the demand. Society had a
biased opinion against the cement manufactured in India, which further led to reduction
in demand. The government intervened by giving protection to the Industry and by
encouraging cooperation among the manufacturers.
In 1927, the Concrete Association of India was formed with the twin goals of creating a
positive awareness among the public of the utility of cement and to propagate cement
consumption.
Post Independence
The growth rate of cement was slow around the period after independence due to various
factors like low prices, slow growth in additional capacity and rising cost. The
government intervened several times to boost the industry, by increasing prices and
providing financial incentives. But it had little impact on the industry.
In 1956, the price and distribution control system was set up to ensure fair prices for both
the manufacturers and consumers across the country and to reduce regional imbalances
and reach self sufficiency.
Period of Restriction (1969-1982)
The cement industry in India was severely restrained by the government during this
period. Government hold over the industry was through both direct and indirect means.
Government intervened directly by exercising authority over production, capacity and
distribution of cement and it intervened indirectly through price control.
In 1977 the government authorized higher prices for cement manufactured by new units
or through capacity increase in existing units. But still the growth rate was below par.
In 1979 the government introduced a three tier price system. Prices were different for
cement produced in low, medium and high cost plants.
However the price control did not have the desired effect. Rise in input cost, reduced
profit margins meant the manufacturers could not allocate funds for increase in capacity.
Partial Control (1982-1989)
Page 36
Equity Research on Cement Sector
To give impetus to the cement industry, the Government of India introduced a quota
system in 1982.A quota of 66.60% was imposed for sales to Government and small real
estate developers. For new units and sick units a lower quota at 50% was affected. The
remaining 33.40% was allowed to be sold in the open market.
These changes had a desired effect on the industry. Profitability of the manufacturers
increased substantially, but the rising input cost was a cause for concern.
Post Liberalization
In 1989 the cement industry was given complete freedom, to gear it up to meet the
challenges of free market competition due to the impending policy of liberalization. In
1991 the industry was de licensed.This resulted in an accelerated growth for the industry
and availability of state of the art technology for modernization. Most of the major
players invested heavily for capacity expansion.To maximize the opportunity available in
the form of global markets, the industry laid greater focus on exports. The role of the
government has been extremely crucial in the growth of the industry.
Cement is one of the core industries which plays a vital role in the growth and expansion
of a nation. It is basically a mixture of compounds, consisting mainly of silicates and
aluminates of calcium, formed out of calcium oxide, silica, aluminium oxide and iron
oxide. The demand for cement depends primarily on the pace of activities in the business,
financial, real estate and infrastructure sectors of the economy. Cement is considered
preferred building material and is used worldwide for all construction works such as
housing and industrial construction, as well as for creation of infrastructures like ports,
roads, power plants, etc. Indian cement industry is globally competitive because the
industry has witnessed healthy trends such as cost control and continuous technology
upgradation.
Current Scenario
The Indian cement industry is the 2nd largest market after China. The cement industry in
India has received a great impetus from a number of infrastructure projects taken up by
the Government of India like road networks and housing facilities. While the Indian
Page 37

Equity Research on Cement Sector
cement industry enjoys a phenomenal phase of growth, experts reveal that it is poised
towards a highly prosperous future over the very recent years. The country’s cement
production is projected to grow at a compound annual growth rate (CAGR) of around 12
per cent during 2011-12 - 2013-14 to reach 303 million metric tonnes (MMT), as per the
RNCOS research report.
India’s cement industry has suffered two major setbacks recently. The largest domestic
supplier of coal to cement plants, Coal India Ltd, recently increased their prices by 30%.
In addition to this, the government’s 2011 Budget outlined a 2% hike in excise duty for
the already suffering cement sector. The two setbacks are likely to reduce profits in the
upcoming year. Despite a bad performance during the last four quarters, the cement
sector had started to turn around since December when the industry saw a gradual
increase of demand, in particular from the realty sector.
Indian cement industry comprises of 137 large and 365 mini cement plants. The large
plants employ 120,000 people, according to a recent report on the Indian cement industry
published by Cement Manufacturers Association (CMA).
Cement Production & Despatches (P)
Description Jan-11 Dec-10 Jan-102010-11 2009-10
(Apr-Jan)
Cement
Production14.52 13.59 14.65 136.51 130.85
Cement
Despatches14.47 13.60 14.59 135.56 130.09
Source: Cement Manufacturers' Association
Cement production during April to January 2010-11 was 136.51 million tonnes as
compared to 130.85 million tonnes during the same period for the year 2009-10.
Despatches were estimated at 135.56 million tonnes during April to January 2010-11
whereas during the same period for the year 2009-10, it stood at 130.09 million tonnes.
Page 38

Equity Research on Cement Sector
Key Drivers of Cement Industry
• Buoyant real estate market
• Increase in infrastructure spending
• Various governmental programmes like National Rural Employment Guarantee
• Low-cost housing in urban and rural areas under schemes like Jawaharlal Nehru
National Urban Renewal Mission (JNNURM) and Indira Aawas Yojana
Globalisation of Indian Cement Industry
Cement, being a bulk commodity, is a freight intensive industry and transporting it over
long distances can prove to be uneconomical. This has resulted in cement being largely a
regional play with the industry divided into five main regions viz. north, south, west, east
and the central region. While the southern region always had excess capacity in the past
owing to abundant availability of limestone, the western and northern regions are the
most lucrative markets on account higher demand and production shortfall. However,
with capacity addition taking place at a faster rate as compared to demand, prices have
remained southbound, especially in the recent past. Nevertheless, considering the
government's thrust on infrastructure long term demand remains intact.
Given the high potential for growth, quite a few foreign transnationals have been eyeing
the Indian markets and are planning to acquire domestic companies. Thus globalization
of Indian Cement Industry has led to many foreign companies engaging in mergers and
acquisitions of Indian cement companies. For example,
HeidelbergCement-IndoramaCementLtd.
Heidelberg Cement Company entered into an agreement for a 50% joint venture with the
Indorama Cement Ltd., situated in Mumbai, originally possessed by the Indorama S P
Lohia Group. Heidelberg Cement company is the leading German cement manufacturing
company. The Heidelberg Cement was set up in 1873 and has a long and prosperous
Page 39
Equity Research on Cement Sector
history. Being one of the best in the world the Heidelberg Cement Company has its bases
in different countries. The Heidelberg Cement Company has two manufacturing units in
India. A grinding plant in Mumbai and a cement terminal near Mumbai harbor. A clinker
plant is coming up in the state on Gujarat.
Holcim Cement - Gujarat Ambuja Cements(GACL)
Holcim Cement Company is among the leading cement manufacturing and supplying
companies in the world. It has increased its stake from 46.44 per cent to 50 per cent stake
in Ambuja Cement through the creeping acquisition route. It has also increased its stake
in ACC to reach 50.1 per cent.
Italcementi cement - Zuari Cement Limited
Italcementi Cement Company with the help of the Ciments Français, a subsidiary for its
global activities, has acquired shares of the famous Indian cement manufacturer - Zuari
Cement Limited. The acquisition was of 50% shareholding and the deal was of about 100
million Euros. Italcementi Cement is the 5th largest cement manufacturing company in
the world. The production capacity of the Italcementi cement company is about 70
million tons in a year. With the construction boom in India the company looks for a
stable future. In 2001 the Italcementi cement entered the Indian market scenario. It took
over the plant of the Zuari Cement Limited in Andhra Pradesh in southern India. The
joint venture earned revenues of around 100 million Euros and an operating profit of 4
million Euros.
Lafarge India is the subsidiary of the Lafarge Cement Company of France. It was
established in 1999 in India with the acquisition of the Tisco and the Raymond cement
plants. Lafarge Cement presently has three cement manufacturing units in India. One of
them is in Jharkhand which is used for the purpose of grinding and the other two are in
Chhattisgarh used for manufacturing. The Lafarge Cement Company was set up in the
year 1833 by Leon Pavin. Lafarge Cement Company situated in France is the leading
cement producing company in the world. It has plans for increasing the cement
production through technological innovations and maximization of the capacity of the
Page 40
Equity Research on Cement Sector
plant. It has a large network of distributors in the eastern part of India. The Lafarge
Cement Company is presently producing nearly 5.5 million tons of cement for the Indian
cement market.
During the first half of FY11, UltraTech Cement merged itself with Samruddhi Cement
to become the largest cement company in the country. Considering the long term growth
story, fair valuations, fragmented structure of the industry and low gearing, another wave
of consolidation would not come as a surprise.
Technological Advancements
Modernization and technology up-gradation is a continous process for any growing
industry and is equally true for the cement industry. At present, the quality of cement and
building materials produced in India meets international standards and benchmarks and
can compete in international markets. The productivity parameters are now nearing the
theoretical bests and alternate means. Substantial technological improvements have been
brought about and today, the industry can legitimately be proud of its state-of-the-art
technology and processes incorporated in most of its cement plants. This technology up
gradation is resulting in increased capacity, reduction in cost of production of cement.
SWOT Analysis
Strenghts:
• High Entry Barriers
Cement being a capital-intensive industry creates high entry barriers for the new
players. Moreover, the creation of distribution channel, acquisition of limestone
reserves etc makes entry of new players extremely difficult.
Weakness:
• Dependence on Government
Industry is highly dependent on government authorities for power supply. Cement
industry has been suffering from frequent power cuts.
Page 41
Equity Research on Cement Sector
• Increasing dependence on imported coal
Over the years, there has been deterioration in the quality of coal. In particular,
the ash content has increased implying lower calorific values for coal, and
improper and inefficient burning, etc. This has increased the dependence of
cement industry on imported coal. Poor port infrastructure and high volatility in
exchange rates creates concerns.
Oppurtunities:
• Growth from newer products - Ready to mix concrete
RMC is a value-added semi-finished product that results in a superior quality
concrete.Various advantages of RMC are quality control, eco friendly, greater
speed of construction, correct proportion of ingredients, lower wastage, reduce
manpower requirement etc. RMC is a high margin product as compared to site
mixed concrete (SMC). In India, RMC accounting for meager5% of cement
production that is converted to RMC as against 70% in developed countries.
Though India is the second largest cement manufacturer, it is among the lowest
cement consuming countries. In India per capita cement consumption is 122 kg,
which is far below the world average of approximately320 kg. With the growth of
economy, per capita cement consumption rises at brisk pace. It indicates there is a
potential for growth in cement industry.
Threats:
• Rising interest rate
Rising interest rates may impact housing demand and thereby affecting cement
demand and also capital expenditure.
• Substitutes
Bitumen and Engineering plastic have emerged as substitute of cement in road
and building construction.
Page 42

Equity Research on Cement Sector
Budget 2011:
The year 2010 was quite challenging for the entire cement industry. On the one hand,
demand off-take was weaker than expected due to lower realty and infrastructure
spending. Prolonged monsoons and logistical constraints further dampened the
construction activity. On the supply front, overcapacity continued to plague the industry.
Cement prices remained under pressure and caused margins to contract severely. The
industry is expected to end the current fiscal at about 75% capacity utilisation. And this
does not seem to be the end yet. The demand-supply mismatch is here to stay for quite
some time as the total industry cement capacity is expected to increase even further over
the next 18-24 months. Excess supply would reach its highest level (about 126 mtpa) in
FY13 with capacity going up to 393 mtpa. On the cost front, key raw material costs,
especially prices of coal show no signs of abating. Going forward, rising interest costs
remain a challenge for the construction industry. Much will depend on government’s
housing and infrastructure initiatives. Given this backdrop, over the next couple of years,
the margins of the cement companies will continue to remain under strain.
Budget Measures:
Incentives have been doled out for end users of cement such as the housing sector and
development of infrastructure.
• To replace excise with ad valorem duties on cement:
• In case of packaged cement, retail price per 50 kg bag not exceeding Rs 190 per
bag (equivalent to Rs 3,800 per tonne) would entail 10% ad valorem duty plus Rs
80 per tonne from Rs 290 per tonne earlier. In case of retail price per 50 kg bag
exceeding Rs 190 per bag, there would be an ad valorem duty of 10% plus Rs
160 per tonne from just 10% of retail sales price earlier.
• 10% ad valorem duty for all goods other than those cleared in packaged form.
• For cement clinker, there would be an ad valorem duty of 10% plus Rs 200 per
tonne from flat Rs 375 per tonne earlier.
Page 43
Equity Research on Cement Sector
• To reduce basic custom duty on two critical raw materials of the cement industry
viz. petcoke and gypsum to 2.5%
• Rate of minimum alternate tax (MAT) on book profits has been increased from
18% to 18.5%.
Budget Impact:
• Increased budgetary allocation towards infrastructural development and housing
is likely to boost demand for cement. Thus, cement manufacturers will continue to
benefit owing to increase in volumes.
• Impact of cut on customs duty on key raw materials such as petcoke and gypsum
would bring some relief to cement manufacturers who have been facing margin
pressures due to rising input costs.
• Cash dispensers and their parts have been fully exempted from basic customs
duty, to drive the financial inclusion agenda of the Government. This would result
in lower input cost and pressure on operating profit margin could marginally ease.
• The new excise duty structure will increase the tax incidence on the cement
industry.
Company Impact:
• With more incentives being spelled out for the infrastructure and housing sector,
cement manufacturers will continue to benefit. This is beneficial to all cement
companies, specifically the top layers catering to eastern region such as ACC and
Ultratech Cement.
• Lower duty on key materials will aid the profitability of large players like ACC,
Ambuja Cement and Ultratech Cement.
Future Ahead of Indian Cement Industry:
Page 44
Equity Research on Cement Sector
In the Budget 2011, with country's GDP pegged to grow ~8%+ annually going forward,
cement industry is likely to grow in double digit over long term and outlook for demand
remains positive. The cement industry is pushing for increased use of cement in highway
and road construction. The Ministry of Road Transport and Highways has planned to
invest US$ 354 billion in road infrastructure by 2012. Housing, infrastructure projects
and the nascent trend of concrete roads would continue to accelerate the consumption of
cement.
Increased infrastructure spending has been a key focus area. Finance Minister Pranab
Mukherjee has proposed to earmark US$ 47 billion for infrastructure development during
2011-12.
The infrastructure sector has received an impetus in the form of increased funds and tax
related incentives offered to attract investors for tapping the infrastructure opportunities
around the country. Introduction of tax free bonds, creation of infrastructure debt funds,
formulating a comprehensive policy for developing public private partnership projects are
some announcements which will give a fillip to the infrastructure sector which is the
backbone of any economy.
Page 45
Equity Research on Cement Sector
5. COMPANY ANALYSIS
5.1 ACC Ltd
ACC (ACC Limited) is India's foremost manufacturer of cement and concrete. ACC's
operations are spread throughout the country with 16 modern cement factories, more than
40 Ready mix concrete plants, 21 sales offices, and several zonal offices. It has a
workforce of about 9,000 persons and a countrywide distribution network of over 9,000
dealers.
Since inception in 1936, the company has been a trendsetter and important benchmark for
the cement industry in many areas of cement and concrete technology. ACC has a unique
track record of innovative research, product development and specialized consultancy
Page 46
Equity Research on Cement Sector
services. The company's various manufacturing units are backed by a central technology
support services centre - the only one of its kind in the Indian cement industry.
ACC has rich experience in mining, being the largest user of limestone. As the largest
cement producer in India, it is one of the biggest customers of the domestic coal industry,
of Indian Railways, and a considerable user of the country’s road transport network
services for inward and outward movement of materials and products.
Among the first companies in India to include commitment to environmental protection
as one of its corporate objectives, the company installed sophisticated pollution control
equipment as far back as 1966, long before pollution control laws came into existence.
Today each of its cement plants has state-of-the art pollution control equipment and
devices.
ACC plants, mines and townships visibly demonstrate successful endeavours in quarry
rehabilitation, water management techniques and ‘greening’ activities. The company
actively promotes the use of alternative fuels and raw materials and offers total solutions
for waste management including testing, suggestions for reuse, recycling and co-
processing.
ACC has taken purposeful steps in knowledge building. We run two institutes that offer
professional technical courses for engineering graduates and diploma holders which are
relevant to manufacturing sectors such as cement. The main beneficiaries are youth from
remote and backward areas of the country.
During the year ended December 31, 2010, it sold 20.984 million tons of cement and
0.120 million tons of clinker. The Company’s subsidiaries include ACC Concrete
Limited, Bulk Cement Corporation (India) Limited, ACC Mineral Resources Limited,
Lucky Minmat Limited, Encore Cements & Additives Private Limited, National
Limestone Co. Private Limited and National Limestone Co. Private Limited. In April
2010, the Company acquired 45% interest in Asian Concrete and Cements Private
Limited.
Page 47
Equity Research on Cement Sector
ACC has made significant contributions to the nation building process by way of quality
products, services and sharing expertise. Its commitment to sustainable development, its
high ethical standards in business dealings and its on-going efforts in community welfare
programmes have won it acclaim as a responsible corporate citizen. ACC’s brand name is
synonymous with cement and enjoys a high level of equity in the Indian market. It is the
only cement company that figures in the list of Consumer SuperBrands of India.
ACC Ltd recorded 2.13% YOY rise in dispatches for the month of December 2010.
Cement dispatch in December was 1.92 million tonnes as compared to 1.88 million tons a
year ago. Production of cement in December rose to 1.91 million tonnes as against 1.86
million tons in the corresponding period last year.
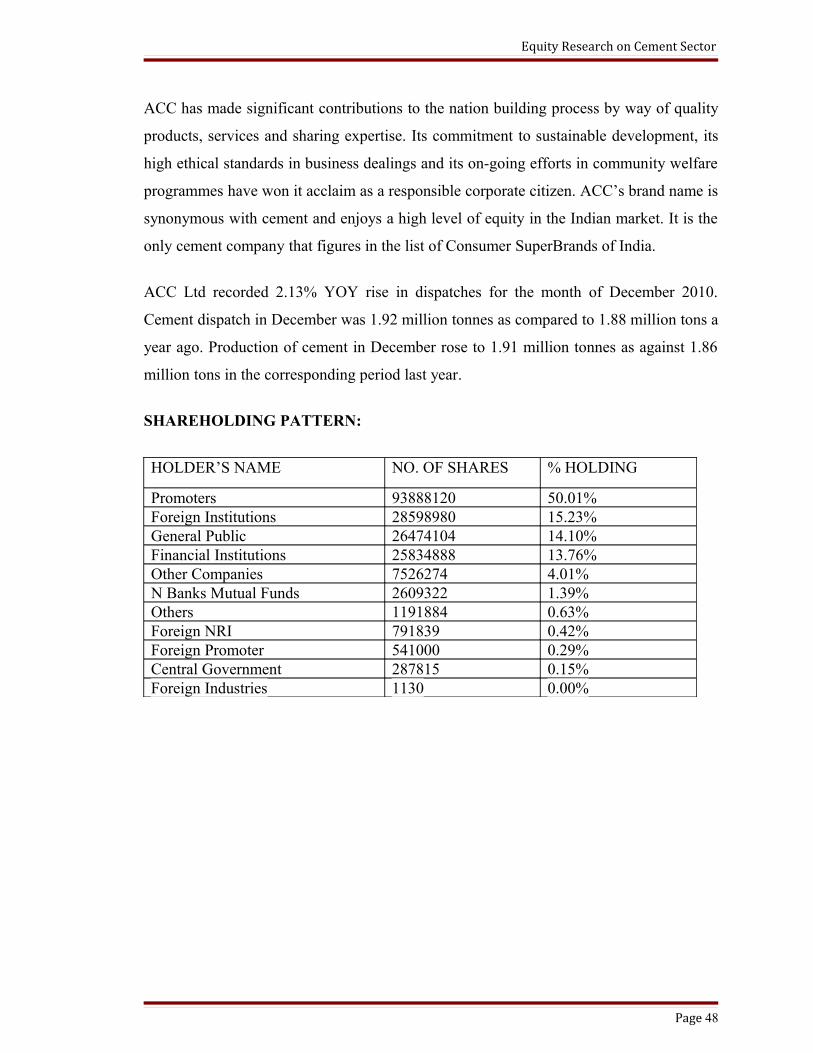
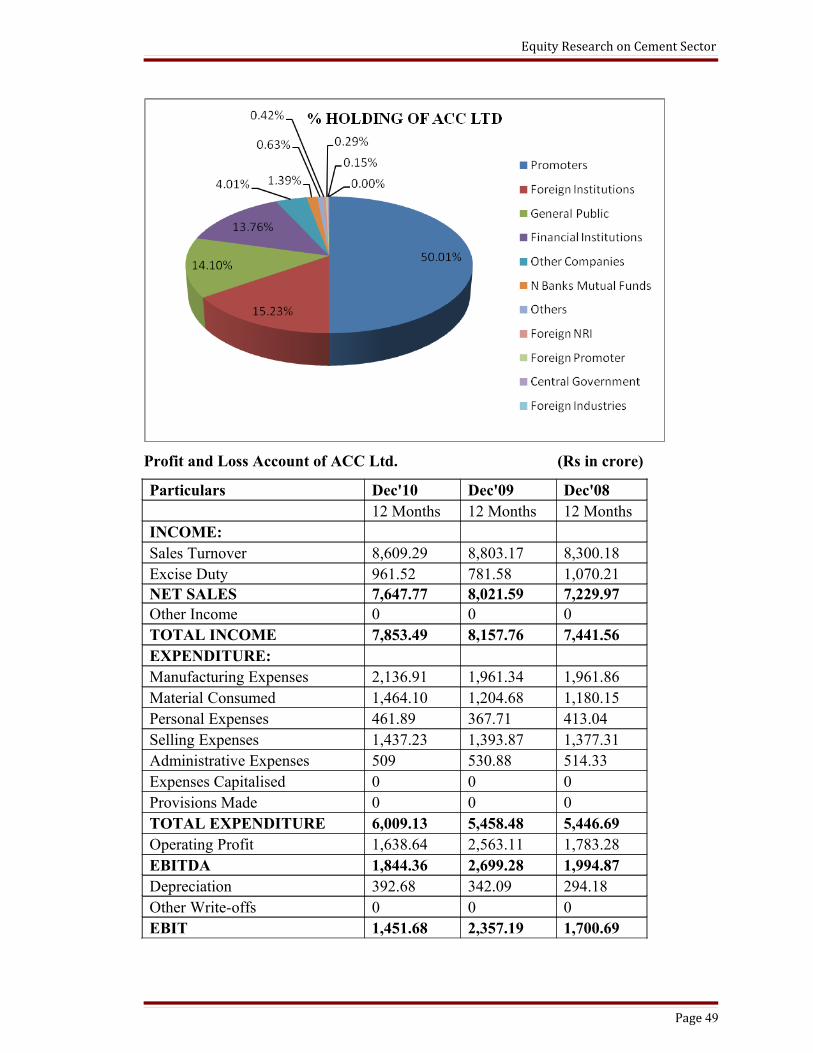
SHAREHOLDING PATTERN:
HOLDER’S NAME NO. OF SHARES % HOLDING
Promoters 93888120 50.01%Foreign Institutions 28598980 15.23%General Public 26474104 14.10%Financial Institutions 25834888 13.76%Other Companies 7526274 4.01%N Banks Mutual Funds 2609322 1.39%Others 1191884 0.63%Foreign NRI 791839 0.42%Foreign Promoter 541000 0.29%Central Government 287815 0.15%Foreign Industries 1130 0.00%
Page 48
Equity Research on Cement Sector
Profit and Loss Account of ACC Ltd. (Rs in crore)
Particulars Dec'10 Dec'09 Dec'08 12 Months 12 Months 12 MonthsINCOME: Sales Turnover 8,609.29 8,803.17 8,300.18Excise Duty 961.52 781.58 1,070.21NET SALES 7,647.77 8,021.59 7,229.97Other Income 0 0 0TOTAL INCOME 7,853.49 8,157.76 7,441.56EXPENDITURE: Manufacturing Expenses 2,136.91 1,961.34 1,961.86Material Consumed 1,464.10 1,204.68 1,180.15Personal Expenses 461.89 367.71 413.04Selling Expenses 1,437.23 1,393.87 1,377.31Administrative Expenses 509 530.88 514.33Expenses Capitalised 0 0 0Provisions Made 0 0 0TOTAL EXPENDITURE 6,009.13 5,458.48 5,446.69Operating Profit 1,638.64 2,563.11 1,783.28EBITDA 1,844.36 2,699.28 1,994.87Depreciation 392.68 342.09 294.18Other Write-offs 0 0 0EBIT 1,451.68 2,357.19 1,700.69
Page 49

Equity Research on Cement Sector
Interest 56.78 84.3 39.96EBT 1,394.90 2,272.89 1,660.73Taxes 424.15 688.93 524.6Profit and Loss for the Year 970.75 1,583.96 1,136.13Non Recurring Items (35.73) 1.23 41.25Other Non Cash Adjustments 185.92 21.54 35.39Other Adjustments -0.9 0 0.02REPORTED PAT 1,120.01 1,606.73 1,212.79KEY ITEMS Preference Dividend 0 0 0Equity Dividend 572.63 431.76 375.33Equity Dividend (%) 304.67 229.73 199.77Shares in Issue (Lakhs) 1,877.45 1,877.40 1,876.82EPS - Annualised (Rs) 59.66 85.58 64.62
Balance-Sheet of ACC Ltd. (Rs. In crore)
Particulars Dec'10 Dec'09 Dec'08Liabilities 12 Months 12 Months 12 MonthsShare Capital 187.95 188.02 187.88Reserves & Surplus 6,281.54 5,828.20 4,739.85Net Worth 6,469.49 6,016.22 4,927.73Secured Loans 518.05 559.74 450Unsecured Loans 5.77 7.18 32.03TOTAL LIABILITIES 6,993.31 6,583.14 5,409.76Assets Gross Block 8,076.95 6,826.27 5,835.67(-) Acc. Depreciation 2,994.51 2,667.98 2,365.97Net Block 5,082.44 4,158.29 3,469.70Capital Work in Progress. 1,562.80 2,156.21 1,602.86Investments. 1,702.67 1,475.64 679.08Inventories 914.98 778.98 793.27Sundry Debtors 178.28 203.7 310.17Cash And Bank 1,080.03 746.38 984.24Loans And Advances 752.41 714.55 779.76Total Current Assets 2,925.70 2,443.61 2,867.44Current Liabilities 2,627.84 2,558.73 2,245.39Provisions 1,652.46 1,091.88 963.93Total Current Liabilities 4,280.30 3,650.61 3,209.32
Page 50
Equity Research on Cement Sector
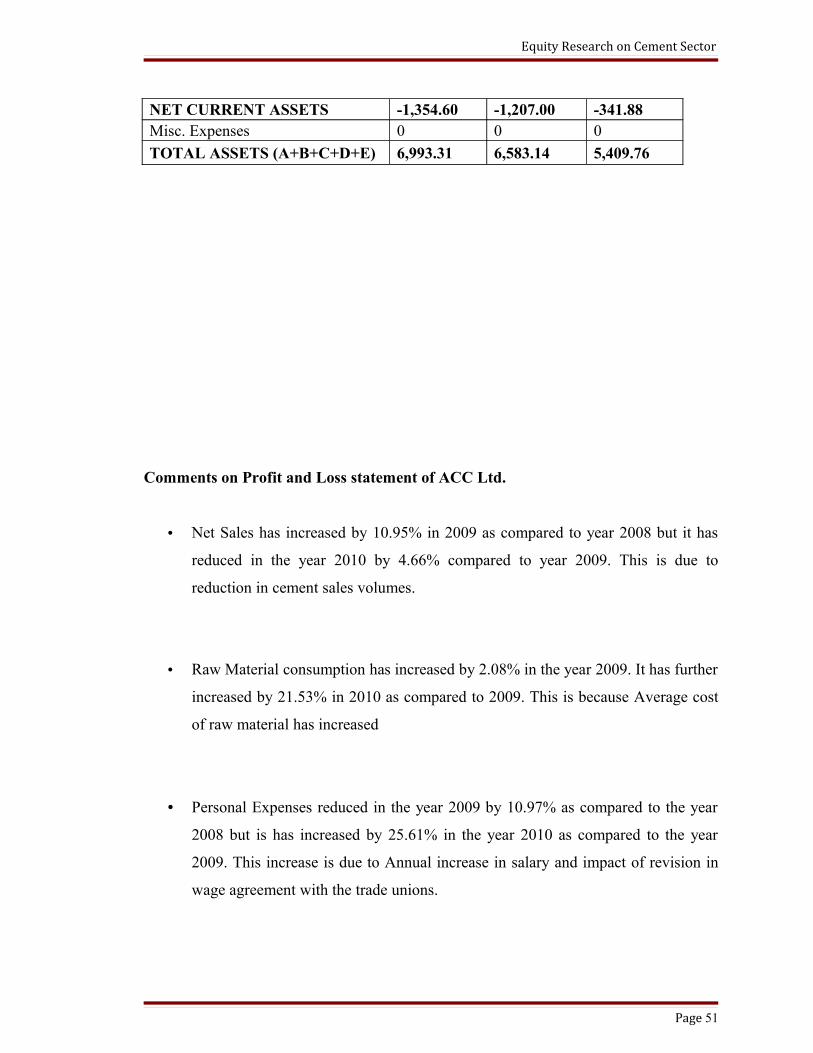
NET CURRENT ASSETS -1,354.60 -1,207.00 -341.88Misc. Expenses 0 0 0
TOTAL ASSETS (A+B+C+D+E) 6,993.31 6,583.14 5,409.76
Comments on Profit and Loss statement of ACC Ltd.
• Net Sales has increased by 10.95% in 2009 as compared to year 2008 but it has
reduced in the year 2010 by 4.66% compared to year 2009. This is due to
reduction in cement sales volumes.
• Raw Material consumption has increased by 2.08% in the year 2009. It has further
increased by 21.53% in 2010 as compared to 2009. This is because Average cost
of raw material has increased
• Personal Expenses reduced in the year 2009 by 10.97% as compared to the year
2008 but is has increased by 25.61% in the year 2010 as compared to the year
2009. This increase is due to Annual increase in salary and impact of revision in
wage agreement with the trade unions.
Page 51
Equity Research on Cement Sector
• Total expenditure has marginally increased in the year 2009 in comparison with
the year 2008. However in the year 2010 total expenditure has increased by
10.09% as compared to 2009.
• EBIT increased by 38.60% in 2009 as compared to 2008 but it decreased in the
year 2010 by 38.41% as compared to 2009. This is because of reduction in net
sales and increase in total expenditure.
• Interest expenses has decreased by 32.65% as compared to the year 2009 because
of repayment of Rupee Term loan of Rs. 50 crore (Rs. 200 Crore was repaid in
the month of Dec 2009).
• Reported PAT increased in 2009 by 32.48% as compared to 2008 but has reduced
in the year 2010 by 30.29% as compared to 2009 because of reduction in sales
and increase in expenditure.
Comments on Balance Sheet of ACC Ltd.
• Reserves and Surplus has increased by 22.09% in2009 as compared to 2008 but
has increased only by 7.78% in 2010 as compared to 2009.
• Secured Loans increased during 2009 by 24.39% as compared to 2008 but it
decreased in the year 2010 by 7.45% as compared to the year 2009. Secured
Loans decreased because of repayment of rupee term loan of Rs. 50 crore during
the current year.
Page 52
Equity Research on Cement Sector
• Unsecured Loans also decreased in 2009 by 77.58% as compared to 2008 and
further decreased in 2010 by 19.64% as comparedto previous year. This marginal
decrease is due to repayment of Rs. 3.03 as compared to previous year.
• Fixed Assets has increased by 19.85% in the year 2009 as compared to the year
2008 and further increased by 22.22% in the year 2010 as compared to 2009. This
increase is mainly due to mainly due to commissioning of Bargarh expansion /
modernization project, Wadi capacity expansion, captive power plants at Chanda
and Bargarh, grinding units at Kudithini and Thondebhavi and other
capitalizations.
• Capital work in progress decreased by 27.52% as compared to previous year
mainly due to capitalization of projects.
• Investments increased to a great extent in 2009 by 117.30% as compared to 2008.
It further increased in 2010 by 15.39% as compared to 2009. This increase is
because of increase in the investment of mutual funds as compared to previous
year. As on December 31, 2010 the company invested Rs. 1,307.56 Crore
(Previous Year Rs. 1,129.47 Crore) in mutual funds of its surplus cash. 100%
Investment in Encore Cement and Additives Private Limited, a Company engaged
in manufacturing and supply of ground Slag. 45% Investment in Asian Concretes
and Cements Private Limited, a Company engaged in cement grinding.
• Inventories decreased in 2009 by 1.80% but increased in the year 2010 by 17.46%
as compared to previous year. Stock-in-trade as on December 31, 2010 was higher
than the level of December 31, 2009 by Rs. 56.57 Crore. raw materials inventory
Page 53
Equity Research on Cement Sector
was higher by 50.45% due to increase in inventories of gypsum and slag.
Inventory of Coal increased by 44.28% as compared to previous year
• Sundry Debtors decreased by 34.33% in 2009 as compared to 2008 and it further
decreased to 12.48% in the year 2010 as compared to the year 2009 which
indicates collection period of ACC Ltd. has improved yoy.
• Loans and Advances decreased in 2009 as compared to 2008 but has increased in
2010 by 5.30% as compared to 2010.
• Current Liabilities increased by 13.95% in 2009 as compared to 2008 but has
marginally increased in 2010 by 2.70% as compared to previous year.
• Provisions has increased by 13.27% in 2009 when compared to 2008 but
increased further to 51.34% in the year 2010 as compared to previous year. This
increase is due to following reasons employee benefits provision has increased by
Rs. 22.99 crore on account of change in discount rate as well as change in
assumption for salary escalation rate. Proposed a one-time special Platinum
Jubilee final dividend of Rs. 7.50 per share. Higher Provision for income tax.
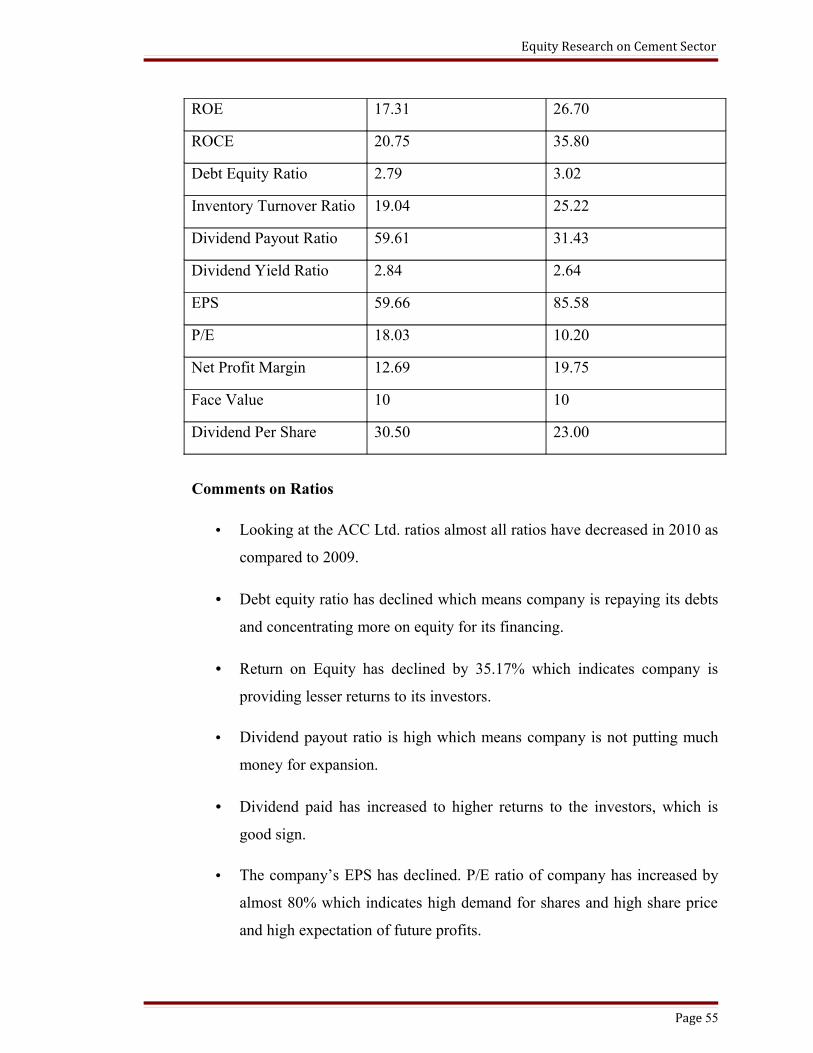
Ratios of ACC Cement
Ratios Year 2010 Year 2009
Page 54
Equity Research on Cement Sector
ROE 17.31 26.70
ROCE 20.75 35.80
Debt Equity Ratio 2.79 3.02
Inventory Turnover Ratio 19.04 25.22
Dividend Payout Ratio 59.61 31.43
Dividend Yield Ratio 2.84 2.64
EPS 59.66 85.58
P/E 18.03 10.20
Net Profit Margin 12.69 19.75
Face Value 10 10
Dividend Per Share 30.50 23.00
Comments on Ratios
• Looking at the ACC Ltd. ratios almost all ratios have decreased in 2010 as
compared to 2009.
• Debt equity ratio has declined which means company is repaying its debts
and concentrating more on equity for its financing.
• Return on Equity has declined by 35.17% which indicates company is
providing lesser returns to its investors.
• Dividend payout ratio is high which means company is not putting much
money for expansion.
• Dividend paid has increased to higher returns to the investors, which is
good sign.
• The company’s EPS has declined. P/E ratio of company has increased by
almost 80% which indicates high demand for shares and high share price
and high expectation of future profits.
Page 55

Equity Research on Cement Sector
ACC Ltd. Chart
From the above chart it can be analysed that ACC Ltd. approximately till December
2010 has been in line with benchmark i.e. sensex and from January 2011 it has
outperformed the benchmark.
Page 56

Equity Research on Cement Sector
5.2 AMBUJA CEMENTS LTD.
Ambuja Cements Ltd. (ACL) is one of the leading cement manufacturing companies in
India. The company was incorporated in the year 1981 as Ambuja Cements Pvt Ltd and it
was rehabilitated into a public limited company on 19th March 1983 as Gujarat Ambuja
Cements Ltd The Company was founded by Narotam Sekhsaria in 1983 with a partner,
Suresh Neotia. Sekhsaria’s business acumen and leadership skills put the company on a
fast track to growth. The Company commenced cement production in 1986.
ACL has grown dynamically over the past decade. Its current cement capacity is about 25
million tonnes. The Company has five integrated cement manufacturing plants and eight
cement grinding units across the country. ACL enjoys a reputation of being one of the
most efficient cement manufacturers in the world. Its environment protection measures
are on par with the finest in the country. It is one of the most profitable and innovative
cement companies in India. ACL is the first Indian cement manufacturers to build a
captive port with three terminals along the country’s western coastline to facilitate timely,
cost effective and environmentally cleaner shipments of bulk cement to its customers.
The Company has its own fleet of ships. ACL has also pioneered the development of the
multiple bio-mass co-fired technology for generating greener power in its captive plants.
Page 57
Equity Research on Cement Sector
ACL company amalgamated its subsidiary company Indo-Nippon Special Cements Ltd in
July of the year 2005. It also entered into a partnership with Holcim Ltd of Switzerland
through Ambuja Cement India Ltd (ACIL) during 2004-05. Holcim today holds about
50% equity in ACL.
The company name was changed from Gujarat Ambuja Cements Limited to Ambuja
Cements Limited on April, 2007, the word Gujarat was dropped to reflect the true
geographical presence of the company
During the year ended December 31, 2010, its cement capacity was about 25 million
tons. During 2010, ACL had subsidiaries, including Kakinada Cements Limited, M.G.T
Cements (Private) Limited and Chemical Limes Mundwa (Private) Limited. During 2010,
commercial production commenced at two new 2.2 million ton clinker production lines,
at Bhatapara (Chattisgarh) and Rauri (Himachal Pradesh), as well as two new 1.5 million
ton cement grinding facilities, at Dadri (Uttar Pradesh) and Nalagarh (Himachal Pradesh).
In June 2011, the Company acquired Dang Cement Industries Pvt. Ltd.
In the last decade the company has grown tenfold. The first company in India introduced
the concept of bulk cement movement by the sea transport. The company's most
distinctive attribute, however, is its approach to the business. Ambuja follows a unique
homegrown philosophy for successful survival. Ambuja is the most profitable cement
company in India, and one of the lowest cost producers of cement in the world.
Ambuja Cements Ltd, one of India’s leading cement manufacturer recorded 5.6% YoY
rise in dispatches for the month of December 2010. Cement dispatch in December was
1.93 million tonnes as compared to 1.83 million tonnes a year ago.
Production of cement in December rose to 1.79 million tonnes as against 1.74 million
tonnes in the corresponding period last year.
Page 58
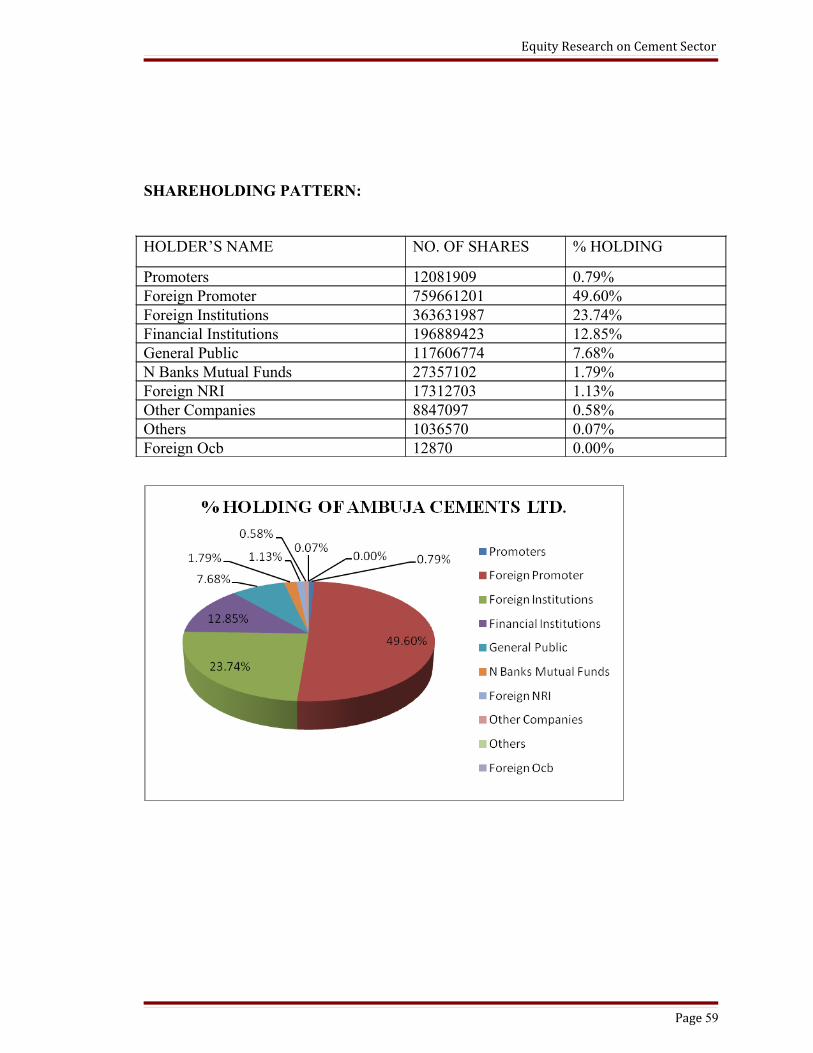
Equity Research on Cement Sector
SHAREHOLDING PATTERN:
HOLDER’S NAME NO. OF SHARES % HOLDING
Promoters 12081909 0.79%Foreign Promoter 759661201 49.60%Foreign Institutions 363631987 23.74%Financial Institutions 196889423 12.85%General Public 117606774 7.68%N Banks Mutual Funds 27357102 1.79%Foreign NRI 17312703 1.13%Other Companies 8847097 0.58%Others 1036570 0.07%Foreign Ocb 12870 0.00%
Page 59
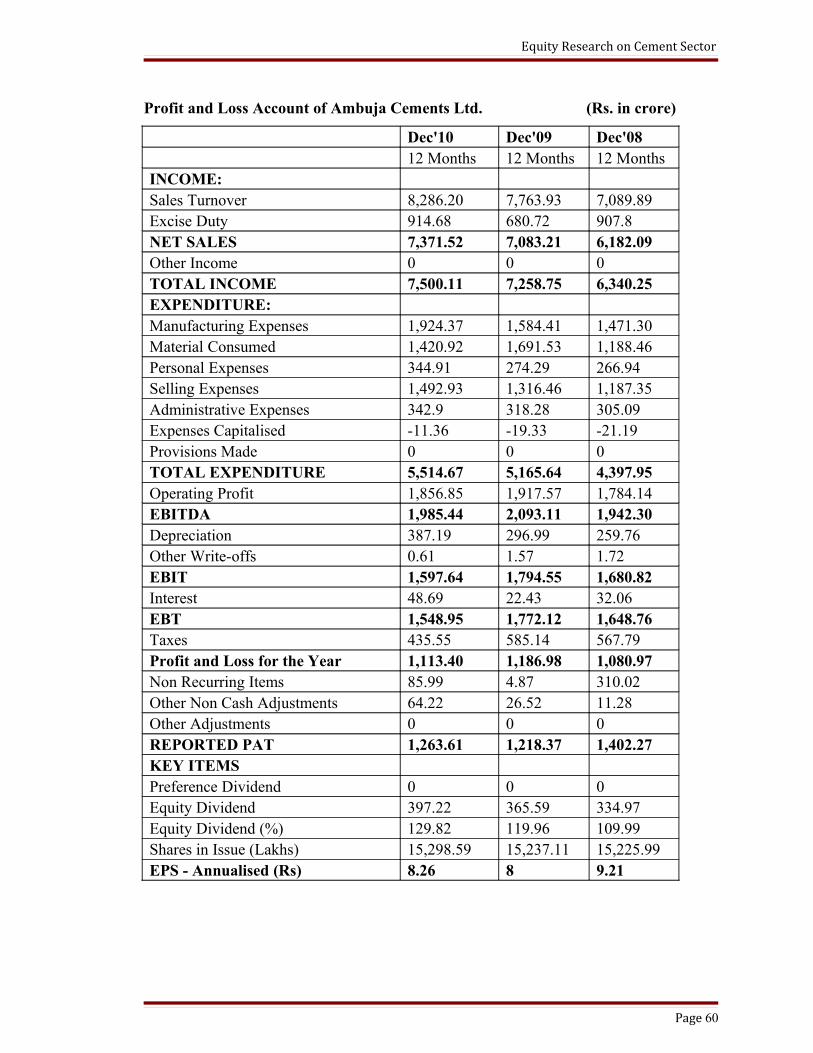
Equity Research on Cement Sector
Profit and Loss Account of Ambuja Cements Ltd. (Rs. in crore)
Dec'10 Dec'09 Dec'08 12 Months 12 Months 12 MonthsINCOME: Sales Turnover 8,286.20 7,763.93 7,089.89Excise Duty 914.68 680.72 907.8NET SALES 7,371.52 7,083.21 6,182.09Other Income 0 0 0TOTAL INCOME 7,500.11 7,258.75 6,340.25EXPENDITURE: Manufacturing Expenses 1,924.37 1,584.41 1,471.30Material Consumed 1,420.92 1,691.53 1,188.46Personal Expenses 344.91 274.29 266.94Selling Expenses 1,492.93 1,316.46 1,187.35Administrative Expenses 342.9 318.28 305.09Expenses Capitalised -11.36 -19.33 -21.19Provisions Made 0 0 0TOTAL EXPENDITURE 5,514.67 5,165.64 4,397.95Operating Profit 1,856.85 1,917.57 1,784.14EBITDA 1,985.44 2,093.11 1,942.30Depreciation 387.19 296.99 259.76Other Write-offs 0.61 1.57 1.72EBIT 1,597.64 1,794.55 1,680.82Interest 48.69 22.43 32.06EBT 1,548.95 1,772.12 1,648.76Taxes 435.55 585.14 567.79Profit and Loss for the Year 1,113.40 1,186.98 1,080.97Non Recurring Items 85.99 4.87 310.02Other Non Cash Adjustments 64.22 26.52 11.28Other Adjustments 0 0 0REPORTED PAT 1,263.61 1,218.37 1,402.27KEY ITEMS Preference Dividend 0 0 0Equity Dividend 397.22 365.59 334.97Equity Dividend (%) 129.82 119.96 109.99Shares in Issue (Lakhs) 15,298.59 15,237.11 15,225.99EPS - Annualised (Rs) 8.26 8 9.21
Page 60
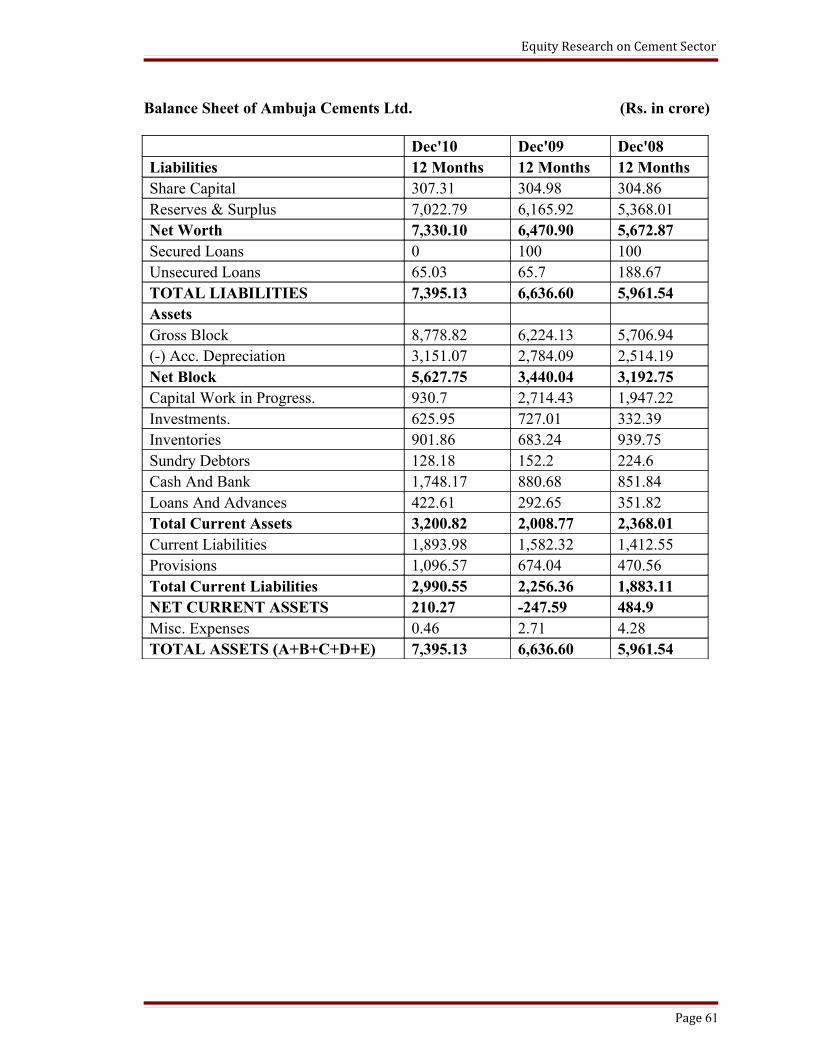
Equity Research on Cement Sector
Balance Sheet of Ambuja Cements Ltd. (Rs. in crore)
Dec'10 Dec'09 Dec'08Liabilities 12 Months 12 Months 12 MonthsShare Capital 307.31 304.98 304.86Reserves & Surplus 7,022.79 6,165.92 5,368.01Net Worth 7,330.10 6,470.90 5,672.87Secured Loans 0 100 100Unsecured Loans 65.03 65.7 188.67TOTAL LIABILITIES 7,395.13 6,636.60 5,961.54Assets Gross Block 8,778.82 6,224.13 5,706.94(-) Acc. Depreciation 3,151.07 2,784.09 2,514.19Net Block 5,627.75 3,440.04 3,192.75Capital Work in Progress. 930.7 2,714.43 1,947.22Investments. 625.95 727.01 332.39Inventories 901.86 683.24 939.75Sundry Debtors 128.18 152.2 224.6Cash And Bank 1,748.17 880.68 851.84Loans And Advances 422.61 292.65 351.82Total Current Assets 3,200.82 2,008.77 2,368.01Current Liabilities 1,893.98 1,582.32 1,412.55Provisions 1,096.57 674.04 470.56Total Current Liabilities 2,990.55 2,256.36 1,883.11NET CURRENT ASSETS 210.27 -247.59 484.9Misc. Expenses 0.46 2.71 4.28TOTAL ASSETS (A+B+C+D+E) 7,395.13 6,636.60 5,961.54
Page 61
Equity Research on Cement Sector
Comments on Profit & Loss Account of Ambuja Cements Ltd.:
• Net Sales has increased by 14.58% in 2009 as compared to year 2008 and in the
year 2010 it has increased by 4.07% compared to year 2009.
• Raw Material consumption has increased by 42.33% in the year 2009 while in
2010it has decreased by 16% as compared to 2009.
• Personal Expenses increased in the year 2009 by 2.75% as compared to the year
2008 and it increased by 25.75% in the year 2010 as compared to the year 2009.
This increase is due to Annual increase in salary and impact of revision in wage
agreement with the trade unions.
• Total expenditure has increased in the year 2009 in comparison with the year
2008. However in the year 2010 total expenditure has increased by 6.76% as
compared to 2009. This is because of increase in expenditure.
• EBIT increased by 6.77% in 2009 as compared to 2008 but it decreased in the
year 2010 by 10.97% as compared to 2009.
• Interest expenses has decreased in 2009 by 30.04% as compared to the year 2008
but it has increased drastically in 2010 by 117.08% as compared to previous year.
Page 62
Equity Research on Cement Sector
• Reported PAT reduced in 2009 by 13.11% as compared to 2008 but has increased
in the year 2010 by 3.71% as compared to 2009 which shows that company
performance has improved as compared to previous year.
Comments on Balance Sheet of Ambuja Cements Ltd.:
• Reserves and Surplus has increased by 14.86% in2009 as compared to 2008 and
increased by 13.90% in 2010 as compared to 2009.
• Secured Loans have been repaid in current year.
• Unsecured Loans also decreased in 2009 by 65.18% as compared to 2008 and
further decreased in 2010 by 1.00% as compared to previous year.
• Fixed Assets has increased by 7.75% in the year 2009 as compared to the year
2008 and further increased by 63.6% in the year 2010 as compared to 2009. This
increase is mainly due to mainly due to installation of additional plants.
• Capital work in progress decreased by 65.70% in 2010 as compared to previous
year mainly due to capitalization of projects.
• Investments increased to a great extent in 2009 by 118.72% as compared to 2008.
It decreased in 2010 by 13.90% as compared to 2009.
Page 63
Equity Research on Cement Sector
• Inventories decreased in 2009 by 27.30% but increased in the year 2010 by
32.00% as compared to previous year which means more inventory is lying in the
company.
• Sundry Debtors decreased by 32.24% in 2009 as compared to 2008 and it further
decreased to 15.80% in the year 2010 as compared to the year 2009 which
indicates collection period of Ambuja Cement has improved yoy.
• Loans and Advances decreased in 2009 as compared to 2008 but has increased in
2010 by 44.4% as compared to 2010.
• Current Liabilities increased by 12.02% in 2009 as compared to 2008 and has
increased in 2010 by 19.07% as compared to previous year.
• Provisions has increased by 43.24% in 2009 when compared to 2008 but
increased further to 62.70% in the year 2010 as compared to previous year. This
increase may be due to employee benefits provision has increased.
Page 64
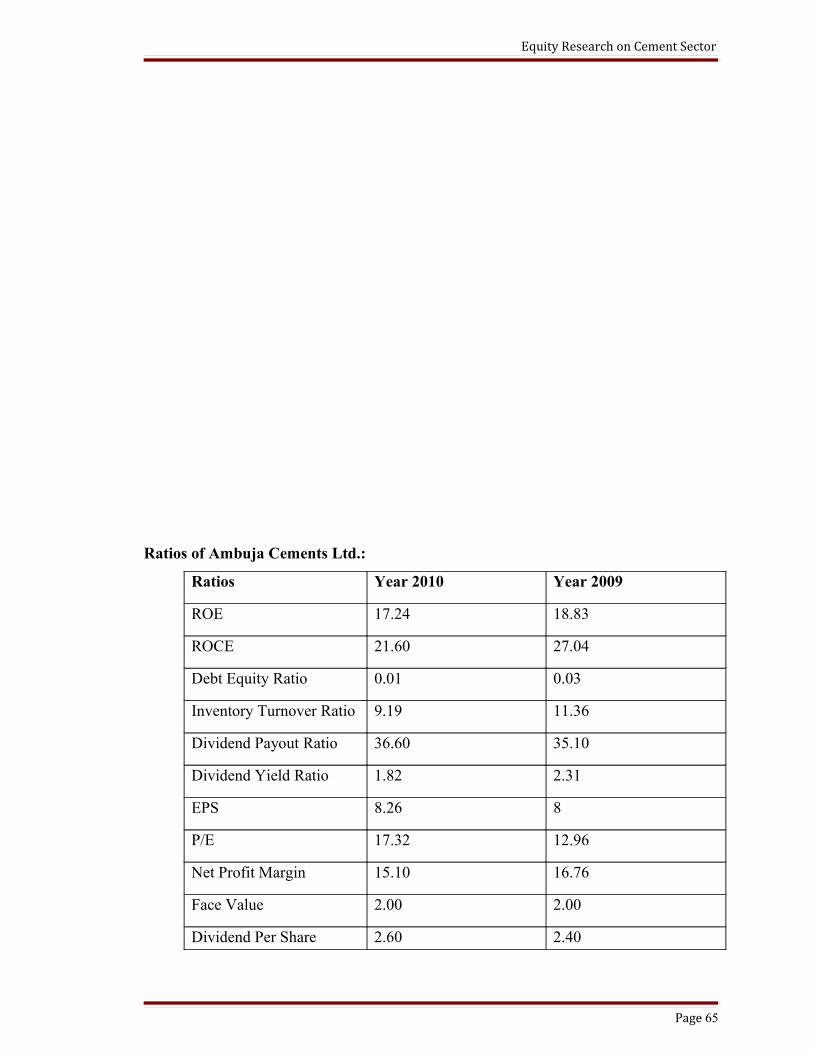
Equity Research on Cement Sector
Ratios of Ambuja Cements Ltd.:
Ratios Year 2010 Year 2009
ROE 17.24 18.83
ROCE 21.60 27.04
Debt Equity Ratio 0.01 0.03
Inventory Turnover Ratio 9.19 11.36
Dividend Payout Ratio 36.60 35.10
Dividend Yield Ratio 1.82 2.31
EPS 8.26 8
P/E 17.32 12.96
Net Profit Margin 15.10 16.76
Face Value 2.00 2.00
Dividend Per Share 2.60 2.40
Page 65
Equity Research on Cement Sector
Comments on Ratios:
• Looking at the Ambuja Cements Ltd ratios almost all ratios have
decreased in 2010 as compared to 2009.
• Debt equity ratio has declined which means company is repaying its debts
and concentrating more on equity for its financing. Company has repaid its
secured loans.
• Return on Equity has marginally declined which indicates company is
providing little lesser returns to its investors as compared to previous year.
• Dividend payout ratio has increased marginally as compared to previous
year which means company is paying a consistent dividend and rest
amount is utilised for expansion purpose.
• Dividend paid has reduced in percentage terms in 2010 as compared to
previous year. Dividend paid in current year is Rs. 2.60 whereas in 2009
dividend was Rs. 2.40. still there is reduction in Dividend Yield Ratio.
• The company’s EPS has increased. P/E ratio of company has increased by
almost 34% which indicates good demand for shares and high share price
and high expectation of future profits.
Page 66

Equity Research on Cement Sector
• Net Profit Margin has declined in 2010 because of increase in personal,
manufacturing and selling expenses.
Page 67
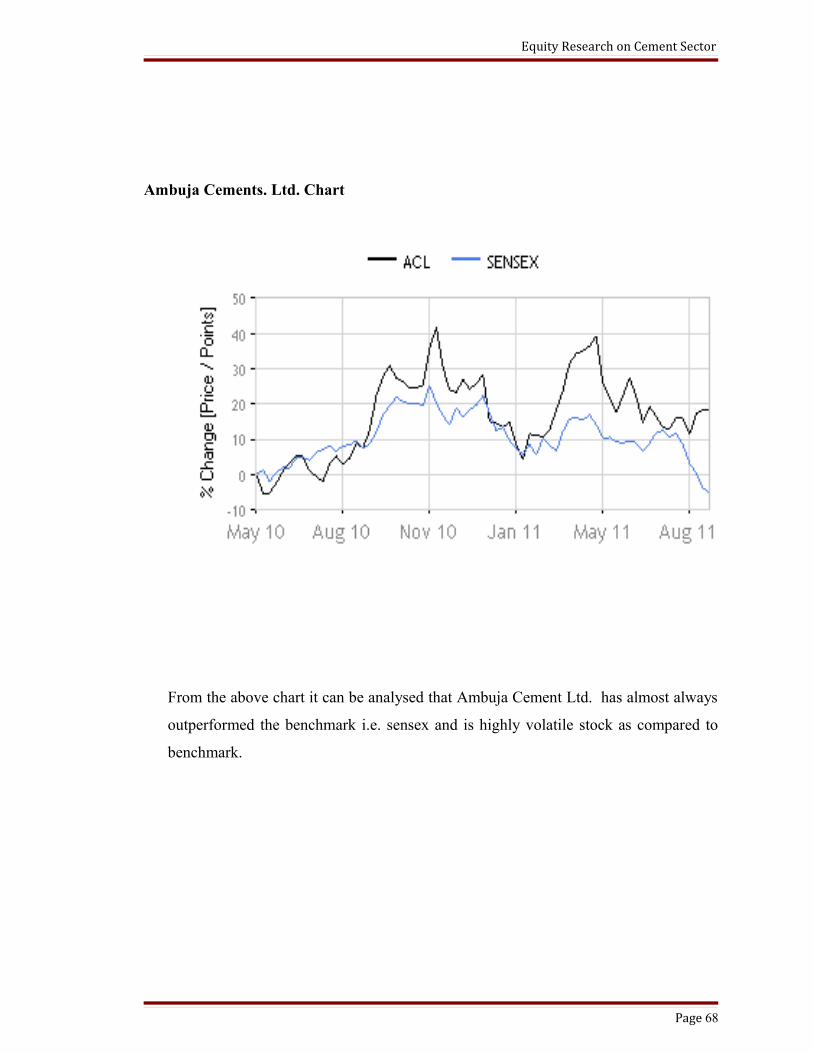
Equity Research on Cement Sector
Ambuja Cements. Ltd. Chart
From the above chart it can be analysed that Ambuja Cement Ltd. has almost always
outperformed the benchmark i.e. sensex and is highly volatile stock as compared to
benchmark.
Page 68
Equity Research on Cement Sector
5.3 ULTRATECH CEMENT
UltraTech Cement Ltd is an India-based company engaged in the production of cement.
The company manufactures and markets Ordinary Portland Cement, Portland Blast
Furnace Slag Cement and Portland Pozzalana Cement. They also manufacture ready mix
concrete. They are having 11 integrated plants, one white cement plant, 12 grinding units
and five terminals - four in India and one in Sri Lanka. The company is the subsidiary of
Grasim Industries Ltd. The company is the country's largest exporter of cement clinker.
The export markets span countries around the Indian Ocean, Africa, Europe and the
Middle East. The export market comprises of countries around the Indian Ocean, Africa,
Europe and the Middle East.
The company's subsidiaries are Dakshin Cements Ltd, UltraTech Cement Lanka Pvt Ltd
and UltraTech Cement Middle East Investments Ltd. UltraTech Cement Ltd was
incorporated on August 24, 2000 as a public limited company with the name L&T
Cement Ltd as a 100% subsidiary of Larsen & Toubro Ltd. In November 2003, the name
of the company was changed from L&T Cement Ltd to UltraTech ChemCo Ltd.
In the year 2004, pursuant to the scheme of arrangement, the cement business of Larsen
& Toubro Ltd was de-merged and got transferred to the company with effect from April
1, 2003. In May 14, 2004, the company acquired four crore equity shares of Larsen &
Toubro Ceylino (Pvt) Ltd from Larsen & Toubro Ltd at an aggregate consideration
Page 69
Equity Research on Cement Sector
of Rs. 23.03 crore. In July 2004, Grasim Industries Ltd acquired management control of
the company and in October 14, 2004, the name of the company was changed from
UltraTech ChemCo Ltd to UltraTech Cement Ltd. Also, Narmada Cement Company Ltd
became a subsidiary of the company by virtue of the scheme of arrangement for de-
merger of cement business of Larsen & Toubro Ltd.
During the year 2005-06, the company increased the production capacity of Cement
from 155 lakh tonnes to 170 lakh tonnes. As per the scheme of amalgamation, Narmada
Cement Company Ltd was amalgamated with the company. Thus, the entire undertaking
of Narmada Cement Company Ltd was transferred to the company with effect from
October 1, 2005. During the year 2007-08, the company increased the production
capacity of Cement from 170 lakh tonnes to 182 lakh tonnes.
During the year 2008-09, the company increased the production capacity of Cement from
182 lakh tonnes to 219 lakh tonnes as a result of expansion of capacity at the company's
unit at Andhra Pradesh Cement Works (APCW) together with a new split grinding unit at
Ginigera, Karnataka. They commenced commercial production of cement from their unit
in APCW and grinding unit at Ginigera. During the year, the company commissioned 192
MW captive TPPs at their units at APCW, Hirmi Cement Works (HCW) in Chhattisgarh
and Gujarat Cement Works (GCW) in Gujarat in a phased manner. Also, they set up new
Ready Mix Concrete (RMC) plants and thus increased the RMC capacity to 4.76 million
cubic metres per annum.
During the fiscal year ended March 31, 2011 (fiscal 2011), its wholly owned subsidiary,
UltraTech Cement Middle East Investments Limited (UCMEIL) acquired ETA Star
Cement together with its operations in the United Arab Emirates, Bahrain and
Bangladesh and acquired management control. On July 1, 2010, Samruddhi Cement
Limited (Samruddhi) amalgamated with the Company.
The cement production of UltraTech Cement, the Aditya Birla company, for the period
April-March 2011, has moved up by 3.12% at 384.34 lakh mt as against 372.72 lakh mt
Page 70
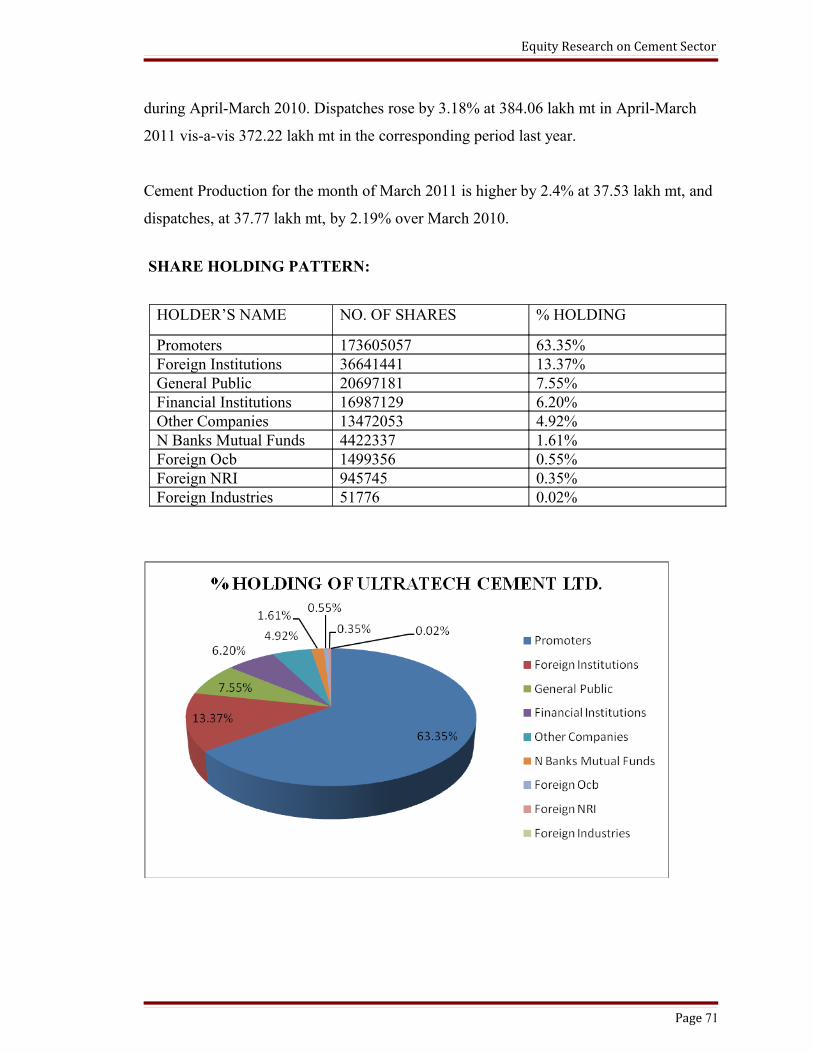
Equity Research on Cement Sector
during April-March 2010. Dispatches rose by 3.18% at 384.06 lakh mt in April-March
2011 vis-a-vis 372.22 lakh mt in the corresponding period last year.
Cement Production for the month of March 2011 is higher by 2.4% at 37.53 lakh mt, and
dispatches, at 37.77 lakh mt, by 2.19% over March 2010.
SHARE HOLDING PATTERN:
HOLDER’S NAME NO. OF SHARES % HOLDING
Promoters 173605057 63.35%Foreign Institutions 36641441 13.37%General Public 20697181 7.55%Financial Institutions 16987129 6.20%Other Companies 13472053 4.92%N Banks Mutual Funds 4422337 1.61%Foreign Ocb 1499356 0.55%Foreign NRI 945745 0.35%Foreign Industries 51776 0.02%
Page 71
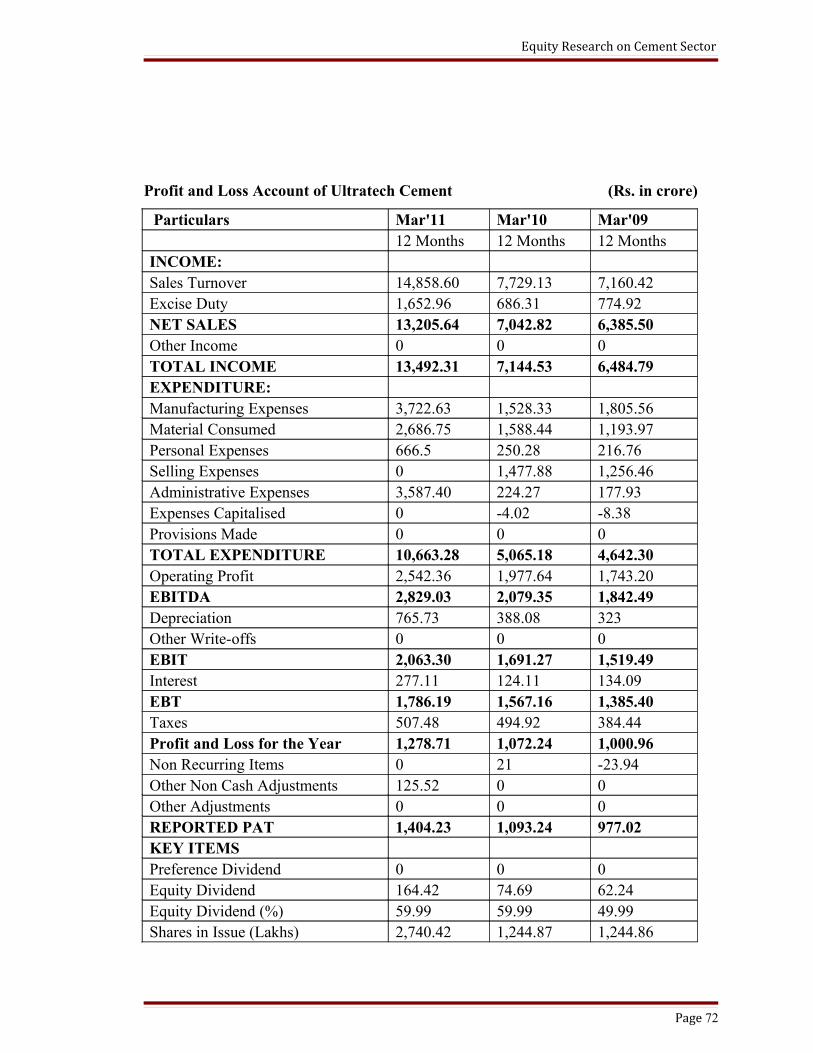
Equity Research on Cement Sector
Profit and Loss Account of Ultratech Cement (Rs. in crore)
Particulars Mar'11 Mar'10 Mar'09 12 Months 12 Months 12 MonthsINCOME: Sales Turnover 14,858.60 7,729.13 7,160.42Excise Duty 1,652.96 686.31 774.92NET SALES 13,205.64 7,042.82 6,385.50Other Income 0 0 0TOTAL INCOME 13,492.31 7,144.53 6,484.79EXPENDITURE: Manufacturing Expenses 3,722.63 1,528.33 1,805.56Material Consumed 2,686.75 1,588.44 1,193.97Personal Expenses 666.5 250.28 216.76Selling Expenses 0 1,477.88 1,256.46Administrative Expenses 3,587.40 224.27 177.93Expenses Capitalised 0 -4.02 -8.38Provisions Made 0 0 0TOTAL EXPENDITURE 10,663.28 5,065.18 4,642.30Operating Profit 2,542.36 1,977.64 1,743.20EBITDA 2,829.03 2,079.35 1,842.49Depreciation 765.73 388.08 323Other Write-offs 0 0 0EBIT 2,063.30 1,691.27 1,519.49Interest 277.11 124.11 134.09EBT 1,786.19 1,567.16 1,385.40Taxes 507.48 494.92 384.44Profit and Loss for the Year 1,278.71 1,072.24 1,000.96Non Recurring Items 0 21 -23.94Other Non Cash Adjustments 125.52 0 0Other Adjustments 0 0 0REPORTED PAT 1,404.23 1,093.24 977.02KEY ITEMS Preference Dividend 0 0 0Equity Dividend 164.42 74.69 62.24Equity Dividend (%) 59.99 59.99 49.99Shares in Issue (Lakhs) 2,740.42 1,244.87 1,244.86
Page 72
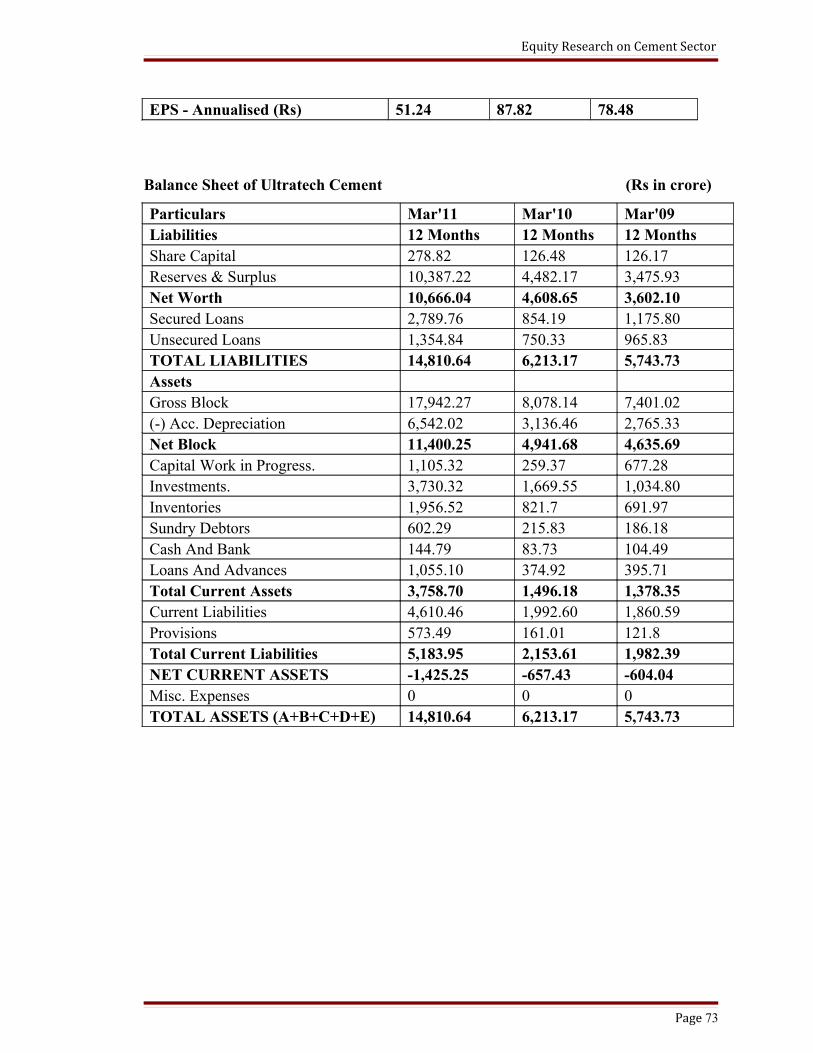
Equity Research on Cement Sector
EPS - Annualised (Rs) 51.24 87.82 78.48
Balance Sheet of Ultratech Cement (Rs in crore)
Particulars Mar'11 Mar'10 Mar'09Liabilities 12 Months 12 Months 12 MonthsShare Capital 278.82 126.48 126.17Reserves & Surplus 10,387.22 4,482.17 3,475.93Net Worth 10,666.04 4,608.65 3,602.10Secured Loans 2,789.76 854.19 1,175.80Unsecured Loans 1,354.84 750.33 965.83TOTAL LIABILITIES 14,810.64 6,213.17 5,743.73Assets Gross Block 17,942.27 8,078.14 7,401.02(-) Acc. Depreciation 6,542.02 3,136.46 2,765.33Net Block 11,400.25 4,941.68 4,635.69Capital Work in Progress. 1,105.32 259.37 677.28Investments. 3,730.32 1,669.55 1,034.80Inventories 1,956.52 821.7 691.97Sundry Debtors 602.29 215.83 186.18Cash And Bank 144.79 83.73 104.49Loans And Advances 1,055.10 374.92 395.71Total Current Assets 3,758.70 1,496.18 1,378.35Current Liabilities 4,610.46 1,992.60 1,860.59Provisions 573.49 161.01 121.8Total Current Liabilities 5,183.95 2,153.61 1,982.39NET CURRENT ASSETS -1,425.25 -657.43 -604.04Misc. Expenses 0 0 0TOTAL ASSETS (A+B+C+D+E) 14,810.64 6,213.17 5,743.73
Page 73
Equity Research on Cement Sector
Comments on Profit and Loss Account of Ultratech Cement Ltd.:
• Net Sales has increased by 10.29% in 2009-2010 as compared to year 2008-2009
and in the year 2010-2011 it has increased by 87.51% compared to year 2009-
2010.
• Raw Material consumption has increased by 33.04% in the year 2009-2010 and in
the year 2010-2011 it has decreased by 16% as compared to 2009-2010.
• Personal Expenses increased in the year 2009-2010 by 15.46% as compared to the
year 2008-2009 and it increased by 166.30% in the year 2010-2011 as compared
to previous year. This increase may be due to Annual increase in salary of
employees.
• Total expenditure has increased in the year 2009-2010 by 9.11% in comparison
with the year 2008-2009. However in the year 2010-2011 total expenditure has
increased by 110.52% as compared to 2009-2010.
• EBIT increased by 6.77% in 2009-2010 as compared to 2008-2009 but it
decreased in the year 2010-2011 by 10.97% as compared to 2009-2010. This is
because net sales has not increased that much as compared to increase in
expenditure.
Page 74
Equity Research on Cement Sector
• Interest expenses has decreased in 2009-2010 by 7.44% as compared to the year
2008-2009 but it has increased in the year 2010-2011 by 123.28% as compared to
previous year which means company has borrowed more debts.
• Reported PAT increased in 2009-2010 by 11.90% as compared to 2008-2009 and
has increased in the year 2010-2011 by 28.45% as compared to 2009-2010.
Comments on Balance-Sheet of Ultratech Cement Ltd.:
• Reserves and Surplus has increased by 28.95% in2009-2010 as compared to
2008-2009 and increased drastically in 2010-2011 as compared to 2009-2010.
• Secured Loans has decreased in 2009-2010 by 27.35% as compared to the year
2008-2009 but it increased in 2010-2011 by 226.60% as compared to previous
year which means company is borrowing more debts.
• Unsecured Loans also decreased in 2009-2010 by 22.31% as compared to 2008-
2009 and increased in 2010-2011 by 80.57% as compared to previous year.
• Fixed Assets has increased by 6.60% in the year 2009-2010 as compared to the
year 2008-2009 and further increased by 130.70% in the year 2010-2011 as
compared to 2009-2010. This increase may be mainly due to installation of
additional plants.
• Investments increased in the year 2009-2010 by 61.34% as compared to 2008-
2009. It further increased in 2010-2011 by 123.43% as compared to 2009-2010.
Page 75
Equity Research on Cement Sector
• Inventories increased in 2009-2010 by 18.75% and further increased in the year
2010-2011 by 138.11% as compared to previous year. This means a lot of
inventory is lying which is not yet sold.
• Sundry Debtors increased by 15.93% in 2009-2010 as compared to 2008-2009
and it further increased to 179.06% in the year 2010-2011 as compared to the year
2009-2010 which indicates collection period of Ultratech Cement Ltd. is
disappointing.
• Loans and Advances decreased in 2009-2010 as compared to 2008-2009 but has
increased in 2010-2011 by 181.42% as compared to 2009-2010.
• Current Liabilities increased in 2009-2010 as compared to 2008-2009 and has
increased in 2010-2011 by 131.38% as compared to previous year.
• Provisions has increased by 32.19% in 2009-2010 when compared to 2008-2009
and increased further to 256.18% in the year 2010-2011 as compared to previous
year.
Page 76
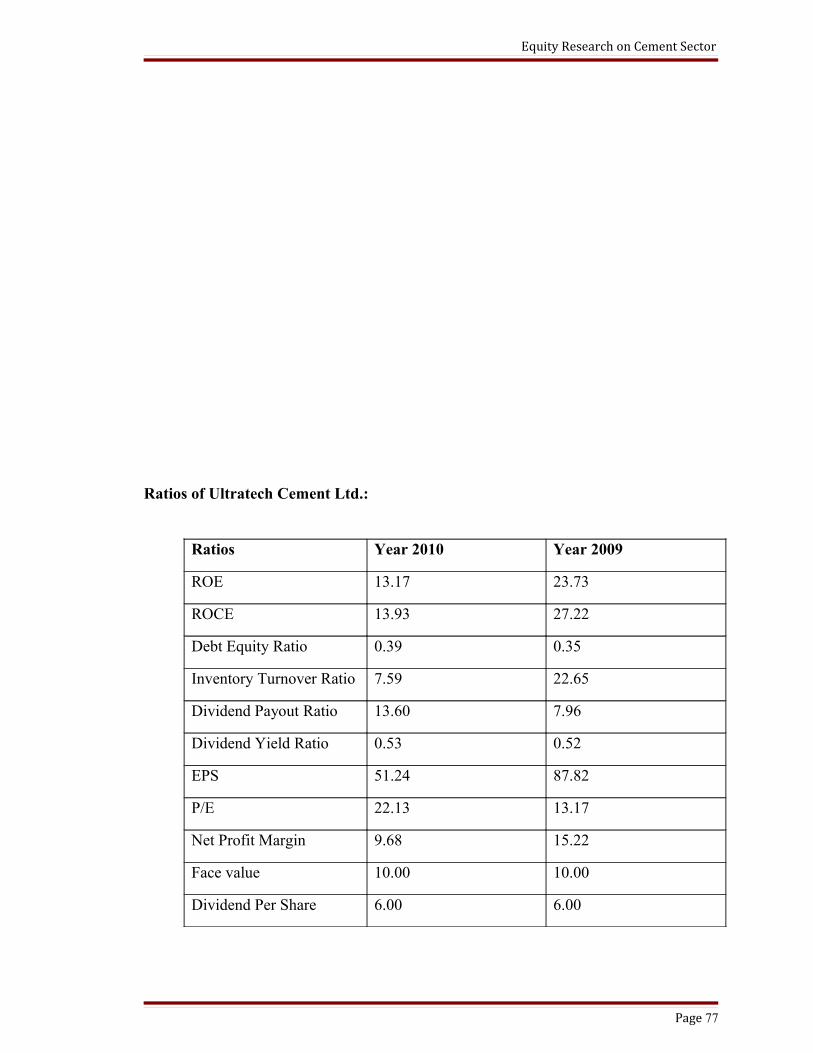
Equity Research on Cement Sector
Ratios of Ultratech Cement Ltd.:
Ratios Year 2010 Year 2009
ROE 13.17 23.73
ROCE 13.93 27.22
Debt Equity Ratio 0.39 0.35
Inventory Turnover Ratio 7.59 22.65
Dividend Payout Ratio 13.60 7.96
Dividend Yield Ratio 0.53 0.52
EPS 51.24 87.82
P/E 22.13 13.17
Net Profit Margin 9.68 15.22
Face value 10.00 10.00
Dividend Per Share 6.00 6.00
Page 77
Equity Research on Cement Sector
Comments on Ratios:
Looking at the Ultratech Cement ratios I found that:
• Debt equity ratio has increased which means company has borrowed more
debts. It has raised its equity also but increase in debt proportion is more.
• Return on Equity has declined which indicates company is providing
lesser returns to its investors.
• Dividend payout ratio is high as compared to previous year which means
company is not putting much money for expansion.
• Dividend paid has increased to higher returns to the investors, which is
good sign.
• The company’s EPS has declined. P/E ratio of company has increased by
almost 70% which indicates high demand for shares and high share price
and high expectation of future profits.
Ultratech Cement Ltd. Chart
Page 78
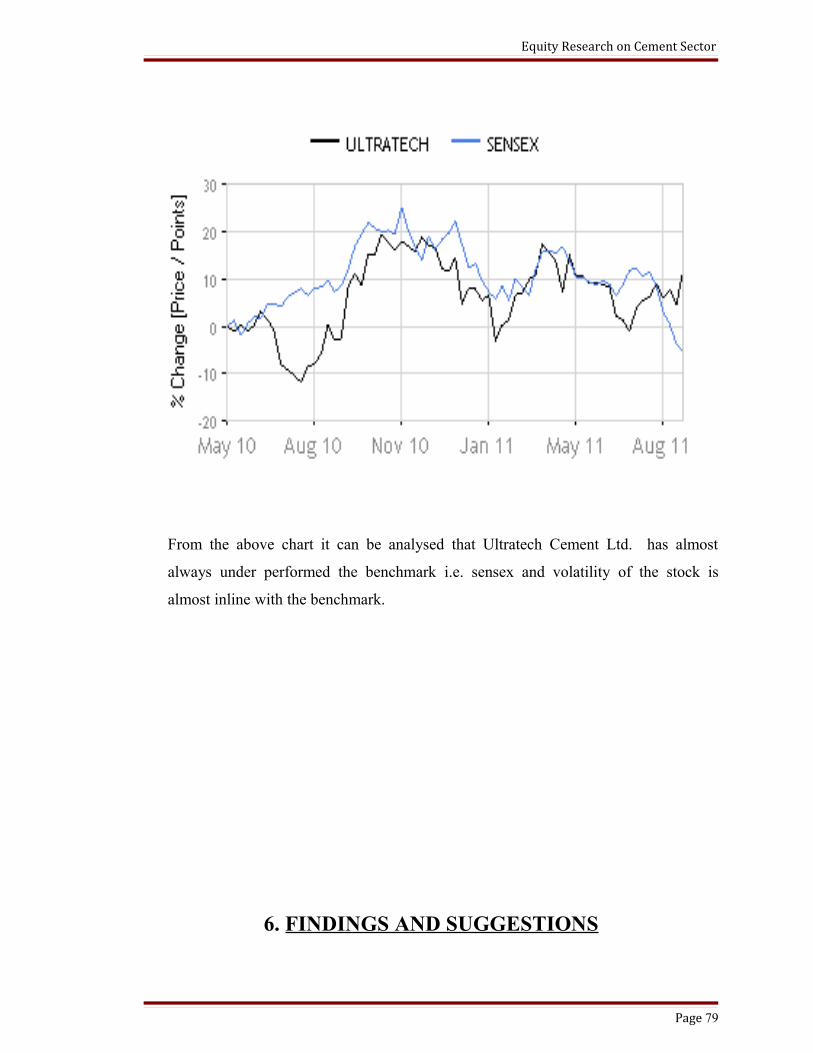
Equity Research on Cement Sector
From the above chart it can be analysed that Ultratech Cement Ltd. has almost
always under performed the benchmark i.e. sensex and volatility of the stock is
almost inline with the benchmark.
6. FINDINGS AND SUGGESTIONS
Page 79
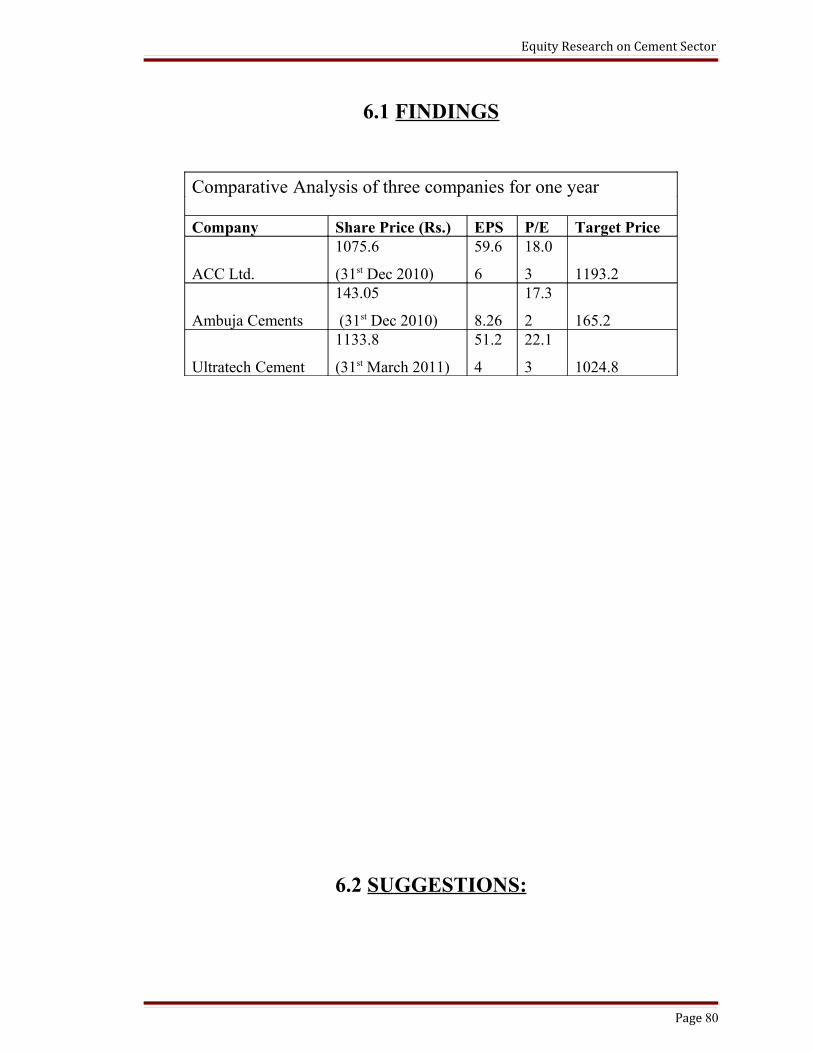
Equity Research on Cement Sector
6.1 FINDINGS
Comparative Analysis of three companies for one year Company Share Price (Rs.) EPS P/E Target Price
ACC Ltd.
1075.6
(31st Dec 2010)
59.6
6
18.0
3 1193.2
Ambuja Cements
143.05
(31st Dec 2010) 8.26
17.3
2 165.2
Ultratech Cement
1133.8
(31st March 2011)
51.2
4
22.1
3 1024.8
6.2 SUGGESTIONS:
Page 80
Equity Research on Cement Sector
• From the above findings based on EPS and P/E I found that target price (which is
for long term) of ACC Ltd is higher than share price of 2010 by Rs.117.60.
Investors will get an approximate returns of 11%. According to me those
investors who already have these shares should hold the shares and those
investors who want to make an investment in share market can invest in shares of
ACC Ltd. As P/E ratio has increased as compared to last year which means there
is demand for shares of ACC Ltd.
• Target price of Ambuja Cement Ltd is 165.2 which is high as compared to price
of 143.05 as on 31st December 2010. Investors can expect approximate returns of
15% in future which is calculated taking target price into consideration. So
investors should buy these shares. EPS has also increased in the year 2010 as
compared to last year which is also a good sign for investors.
• In case of Ultratech Cement target price is less as compared to share price in
March 2011. So investors should sell shares of Ultratech Cement as shares of
Ultratech Cement are expected to go down (WRT) the lower earnings which
shows over valued stock. So it’s better to avoid any new position in this stock.
• According to me both the companies ACC Ltd. and Ambuja Cement Ltd are
expected to generate good returns in future investors can make an investment in
both the stocks but by investing in Ambuja Cements Ltd. investors will get higher
returns than by investing in ACC Ltd. and amount required for investing in
Ambuja Cements Ltd. is also less.
• As per chart analysis also Ambuja Cement Ltd. has always outperformed the
benchmark i.e. sensex whereas ACC Ltd. initially was in line with the benchmark
Page 81

Equity Research on Cement Sector
and then afterwards it outperformed the benchmark and in case of Ultratech
cement Ltd. it has always underperformed the benchmark. So Ambuja Cements
Ltd is a preferred choice over both ACC Ltd. and Ultratech Cement Ltd.
Page 82

Equity Research on Cement Sector
7. CONCLUSION
• We had done our summer internship as trainee in Birla Sunlife Insurance
Company where we were asked to achieve target and, in turn we were being
provided training on equity research and wealth management.
• We were given a traditional plan to sell the policy. This policy was for a long
tenure of 22 years or 35 years. When we approached to people we found that
people were reluctant to make an investment in this plan for such a long period of
time. It was also found that people prefer LIC to make an investment than making
an investment in any private company. So it was difficult task to sell this policy.
• Our training program helped us to understand various aspects of training module.
We got knowledge of share market, mutual funds and our mentor advised to make
project on equity research or on IPO or on mergers and acquisitions or on mutual
funds.
• We also learnt preparing a dummy portfolio as an activity by choosing stocks and
maintaining the NAV.
Page 83
Equity Research on Cement Sector
8. RECOMMENDATIONS
• The training room should be more spacious.
• There is a need for an improvement in company’s system as it takes more time to
execute the policy. At times the operational system used to be down and because
of that there was delay in login of the policy. To overcome this, the company
should have a smooth operational system in place.
• The policy documents also took time of 15-20 days to reach to the clients which
can be improved if the policy gets login on the day when company receives all
client details along with money.
• Interns should be given two-three insurance plans to sell so that it becomes easy
for interns to achieve the targets. Smaller duration plans should be promoted as
people are ready to invest in such plans. Company should even focus on ULIP
plan though it is totally based on equity which is a risky investment but in a
period of 10-12 years share market provides good returns to investors.
• The company should start promoting by emphasizing on its recent achievement of
100% claim settlement. This will surely help them to attract new customers and
improve their market position. The company should also come up with innovative
products to meet the tough competition.
Page 84

Equity Research on Cement Sector
Page 85