
Equity Research INDIA Dairyvid.investmentguruindia.com/report/2019/October/Amul_FY19_AR_update...
13
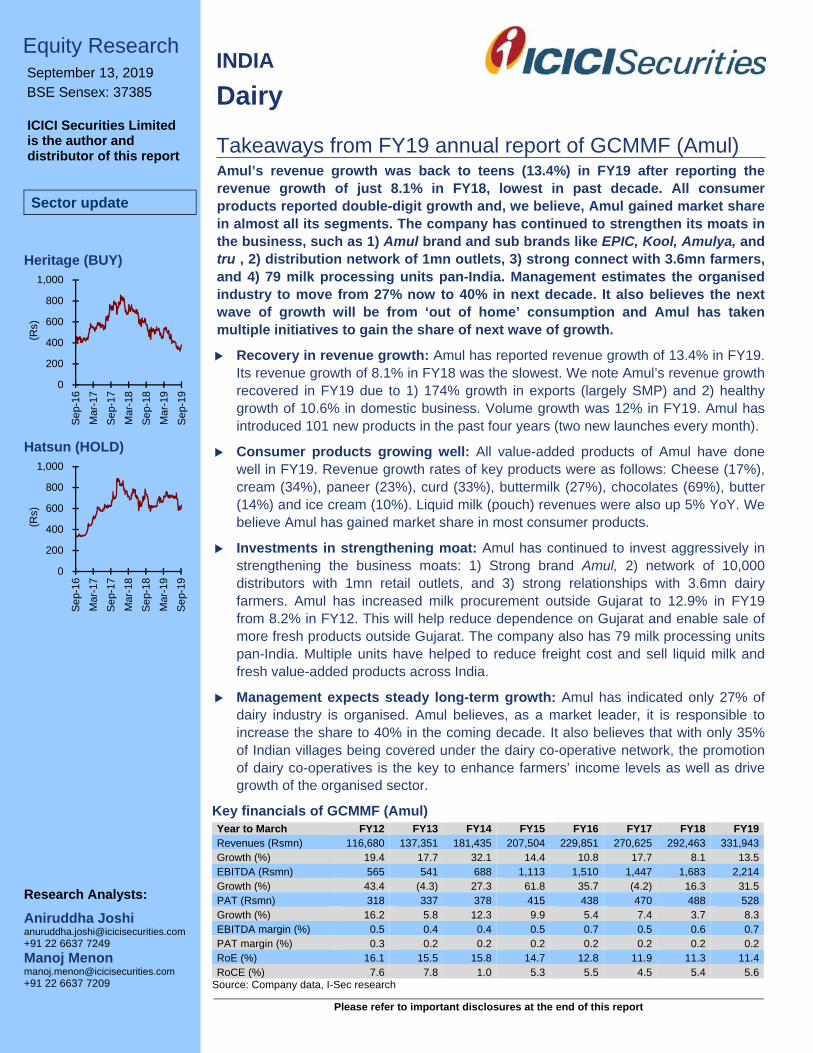
Please refer to important disclosures at the end of this report Equity Research September 13, 2019 BSE Sensex: 37385 ICICI Securities Limited is the author and distributor of this report Sector update Heritage (BUY) Hatsun (HOLD) Dairy Takeaways from FY19 annual report of GCMMF (Amul) 0 200 400 600 800 1,000 Sep-16 Mar-17 Sep-17 Mar-18 Sep-18 Mar-19 Sep-19 (Rs) 0 200 400 600 800 1,000 Sep-16 Mar-17 Sep-17 Mar-18 Sep-18 Mar-19 Sep-19 (Rs) Research Analysts: Aniruddha Joshi [email protected] +91 22 6637 7249 Manoj Menon [email protected] +91 22 6637 7209 INDIA Amul’s revenue growth was back to teens (13.4%) in FY19 after reporting the revenue growth of just 8.1% in FY18, lowest in past decade. All consumer products reported double-digit growth and, we believe, Amul gained market share in almost all its segments. The company has continued to strengthen its moats in the business, such as 1) Amul brand and sub brands like EPIC, Kool, Amulya, and tru , 2) distribution network of 1mn outlets, 3) strong connect with 3.6mn farmers, and 4) 79 milk processing units pan-India. Management estimates the organised industry to move from 27% now to 40% in next decade. It also believes the next wave of growth will be from ‘out of home’ consumption and Amul has taken multiple initiatives to gain the share of next wave of growth. Recovery in revenue growth: Amul has reported revenue growth of 13.4% in FY19. Its revenue growth of 8.1% in FY18 was the slowest. We note Amul’s revenue growth recovered in FY19 due to 1) 174% growth in exports (largely SMP) and 2) healthy growth of 10.6% in domestic business. Volume growth was 12% in FY19. Amul has introduced 101 new products in the past four years (two new launches every month). Consumer products growing well: All value-added products of Amul have done well in FY19. Revenue growth rates of key products were as follows: Cheese (17%), cream (34%), paneer (23%), curd (33%), buttermilk (27%), chocolates (69%), butter (14%) and ice cream (10%). Liquid milk (pouch) revenues were also up 5% YoY. We believe Amul has gained market share in most consumer products. Investments in strengthening moat: Amul has continued to invest aggressively in strengthening the business moats: 1) Strong brand Amul, 2) network of 10,000 distributors with 1mn retail outlets, and 3) strong relationships with 3.6mn dairy farmers. Amul has increased milk procurement outside Gujarat to 12.9% in FY19 from 8.2% in FY12. This will help reduce dependence on Gujarat and enable sale of more fresh products outside Gujarat. The company also has 79 milk processing units pan-India. Multiple units have helped to reduce freight cost and sell liquid milk and fresh value-added products across India. Management expects steady long-term growth: Amul has indicated only 27% of dairy industry is organised. Amul believes, as a market leader, it is responsible to increase the share to 40% in the coming decade. It also believes that with only 35% of Indian villages being covered under the dairy co-operative network, the promotion of dairy co-operatives is the key to enhance farmers’ income levels as well as drive growth of the organised sector. Key financials of GCMMF (Amul) Year to March FY12 FY13 FY14 FY15 FY16 FY17 FY18 FY19 Revenues (Rsmn) 116,680 137,351 181,435 207,504 229,851 270,625 292,463 331,943 Growth (%) 19.4 17.7 32.1 14.4 10.8 17.7 8.1 13.5 EBITDA (Rsmn) 565 541 688 1,113 1,510 1,447 1,683 2,214 Growth (%) 43.4 (4.3) 27.3 61.8 35.7 (4.2) 16.3 31.5 PAT (Rsmn) 318 337 378 415 438 470 488 528 Growth (%) 16.2 5.8 12.3 9.9 5.4 7.4 3.7 8.3 EBITDA margin (%) 0.5 0.4 0.4 0.5 0.7 0.5 0.6 0.7 PAT margin (%) 0.3 0.2 0.2 0.2 0.2 0.2 0.2 0.2 RoE (%) 16.1 15.5 15.8 14.7 12.8 11.9 11.3 11.4 RoCE (%) 7.6 7.8 1.0 5.3 5.5 4.5 5.4 5.6 Source: Company data, I-Sec research
Transcript of Equity Research INDIA Dairyvid.investmentguruindia.com/report/2019/October/Amul_FY19_AR_update...
Please refer to important disclosures at the end of this report
Equity Research September 13, 2019 BSE Sensex: 37385
ICICI Securities Limited is the author and distributor of this report
Sector update
Heritage (BUY)
Hatsun (HOLD)
Dairy
Takeaways from FY19 annual report of GCMMF (Amul)
0
200
400
600
800
1,000
Se
p-16
Mar
-17
Se
p-17
Mar
-18
Se
p-18
Mar
-19
Se
p-19
(Rs)
0
200
400
600
800
1,000
Se
p-16
Mar
-17
Se
p-17
Mar
-18
Se
p-18
Mar
-19
Se
p-19
(Rs)
Research Analysts:
Aniruddha Joshi [email protected] +91 22 6637 7249
Manoj Menon [email protected] +91 22 6637 7209
INDIA
Amul’s revenue growth was back to teens (13.4%) in FY19 after reporting therevenue growth of just 8.1% in FY18, lowest in past decade. All consumerproducts reported double-digit growth and, we believe, Amul gained market sharein almost all its segments. The company has continued to strengthen its moats inthe business, such as 1) Amul brand and sub brands like EPIC, Kool, Amulya, andtru , 2) distribution network of 1mn outlets, 3) strong connect with 3.6mn farmers,and 4) 79 milk processing units pan-India. Management estimates the organisedindustry to move from 27% now to 40% in next decade. It also believes the nextwave of growth will be from ‘out of home’ consumption and Amul has takenmultiple initiatives to gain the share of next wave of growth.
Recovery in revenue growth: Amul has reported revenue growth of 13.4% in FY19.Its revenue growth of 8.1% in FY18 was the slowest. We note Amul’s revenue growthrecovered in FY19 due to 1) 174% growth in exports (largely SMP) and 2) healthygrowth of 10.6% in domestic business. Volume growth was 12% in FY19. Amul hasintroduced 101 new products in the past four years (two new launches every month).
Consumer products growing well: All value-added products of Amul have donewell in FY19. Revenue growth rates of key products were as follows: Cheese (17%),cream (34%), paneer (23%), curd (33%), buttermilk (27%), chocolates (69%), butter(14%) and ice cream (10%). Liquid milk (pouch) revenues were also up 5% YoY. Webelieve Amul has gained market share in most consumer products.
Investments in strengthening moat: Amul has continued to invest aggressively instrengthening the business moats: 1) Strong brand Amul, 2) network of 10,000distributors with 1mn retail outlets, and 3) strong relationships with 3.6mn dairyfarmers. Amul has increased milk procurement outside Gujarat to 12.9% in FY19from 8.2% in FY12. This will help reduce dependence on Gujarat and enable sale ofmore fresh products outside Gujarat. The company also has 79 milk processing unitspan-India. Multiple units have helped to reduce freight cost and sell liquid milk andfresh value-added products across India.
Management expects steady long-term growth: Amul has indicated only 27% ofdairy industry is organised. Amul believes, as a market leader, it is responsible toincrease the share to 40% in the coming decade. It also believes that with only 35%of Indian villages being covered under the dairy co-operative network, the promotionof dairy co-operatives is the key to enhance farmers’ income levels as well as drivegrowth of the organised sector.
Key financials of GCMMF (Amul) Year to March FY12 FY13 FY14 FY15 FY16 FY17 FY18 FY19 Revenues (Rsmn) 116,680 137,351 181,435 207,504 229,851 270,625 292,463 331,943 Growth (%) 19.4 17.7 32.1 14.4 10.8 17.7 8.1 13.5 EBITDA (Rsmn) 565 541 688 1,113 1,510 1,447 1,683 2,214 Growth (%) 43.4 (4.3) 27.3 61.8 35.7 (4.2) 16.3 31.5 PAT (Rsmn) 318 337 378 415 438 470 488 528 Growth (%) 16.2 5.8 12.3 9.9 5.4 7.4 3.7 8.3 EBITDA margin (%) 0.5 0.4 0.4 0.5 0.7 0.5 0.6 0.7 PAT margin (%) 0.3 0.2 0.2 0.2 0.2 0.2 0.2 0.2 RoE (%) 16.1 15.5 15.8 14.7 12.8 11.9 11.3 11.4 RoCE (%) 7.6 7.8 1.0 5.3 5.5 4.5 5.4 5.6
Source: Company data, I-Sec research
Dairy sector, September 13, 2019 ICICI Securities
2
Takeaways - FY19 annual report of GCMMF (Amul)
Our analysis of the FY19 annual report of GCMMF (Amul) leads us to various interesting facts regarding 1) product-wise revenue growth rates, 2) efforts to strengthen the moats, and 3) management’s vision of long-term growth.
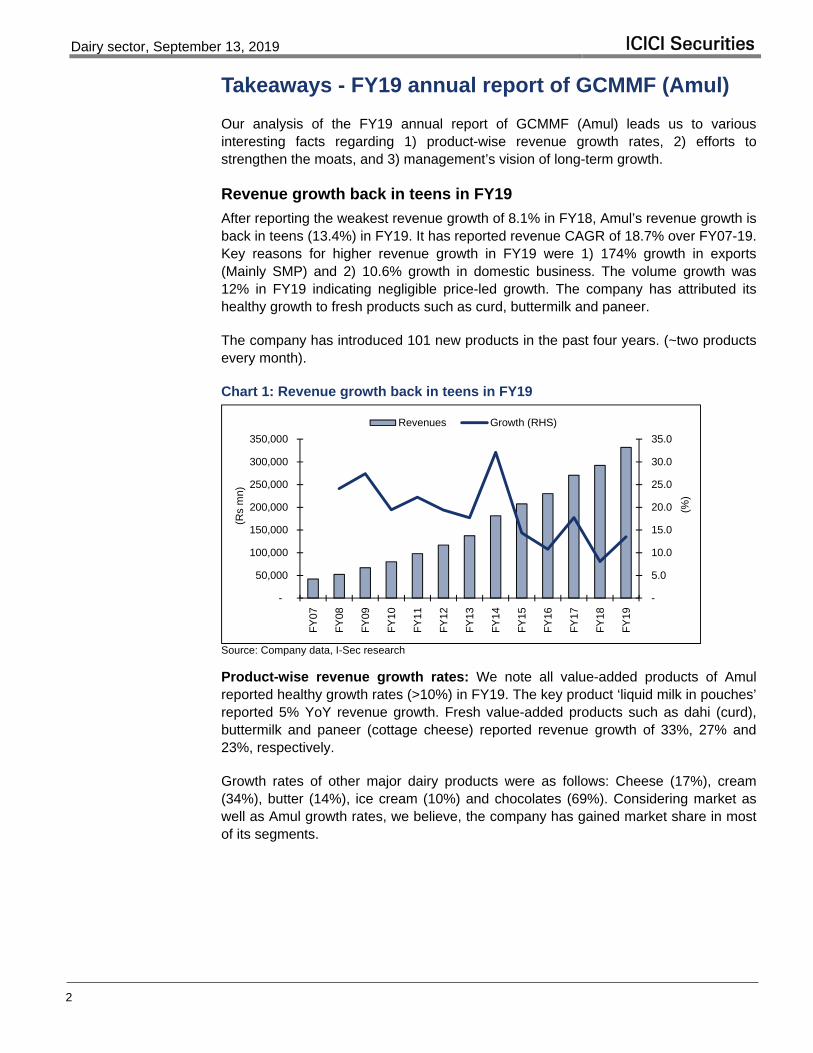
Revenue growth back in teens in FY19
After reporting the weakest revenue growth of 8.1% in FY18, Amul’s revenue growth is back in teens (13.4%) in FY19. It has reported revenue CAGR of 18.7% over FY07-19. Key reasons for higher revenue growth in FY19 were 1) 174% growth in exports (Mainly SMP) and 2) 10.6% growth in domestic business. The volume growth was 12% in FY19 indicating negligible price-led growth. The company has attributed its healthy growth to fresh products such as curd, buttermilk and paneer.
The company has introduced 101 new products in the past four years. (~two products every month).
Chart 1: Revenue growth back in teens in FY19
Source: Company data, I-Sec research
Product-wise revenue growth rates: We note all value-added products of Amul reported healthy growth rates (>10%) in FY19. The key product ‘liquid milk in pouches’ reported 5% YoY revenue growth. Fresh value-added products such as dahi (curd), buttermilk and paneer (cottage cheese) reported revenue growth of 33%, 27% and 23%, respectively.
Growth rates of other major dairy products were as follows: Cheese (17%), cream (34%), butter (14%), ice cream (10%) and chocolates (69%). Considering market as well as Amul growth rates, we believe, the company has gained market share in most of its segments.
-
5.0
10.0
15.0
20.0
25.0
30.0
35.0
-
50,000
100,000
150,000
200,000
250,000
300,000
350,000
FY
07
FY
08
FY
09
FY
10
FY
11
FY
12
FY
13
FY
14
FY
15
FY
16
FY
17
FY
18
FY
19
(%)
(Rs
mn)
Revenues Growth (RHS)

Dairy sector, September 13, 2019 ICICI Securities
3
Table 1: Product-wise revenue growth rates, YoY Product FY18 FY19 Dairy commodities* (60.0) Cheese 26.0 17.0 Milk based beverages 38.5 Cream 34.0 34.0 Paneer 21.0 23.0 Dahi (curd) 26.0 33.0 Buttermilk 21.0 27.0 Liquid milk 12.0 5.0 Infant milk food 11.0 Dairy whitener 11.5 Butter 17.0 14.0 Ice cream 15.0 10.0 Chocolates 69.0
Source: Company, I-Sec research *SMP
Rising milk collection of Amul and increase in procurement prices
Amul has reported 10.8% CAGR in milk procurement over FY07-19 but milk procurement increased by 9.3% YoY in FY19. Interestingly, its milk procurement outside Gujarat, which was growing faster than milk procurement in Gujarat reported decline in FY19.
Milk procurement outside Gujarat declined 20%, YoY whereas milk procurement in Gujarat increased 15.6%, YoY.
The company’s milk procurement (fats) price has also declined from Rs705/kg in FY18 to Rs690 in FY19, indicating decline of 2.1%.
Chart 2: Rising milk procurement by Amul… Chart 3: …and higher milk procurement prices
Source: Company, I-Sec research
-
5
10
15
20
25
FY
07
FY
08
FY
09
FY
10
FY
11
FY
12
FY
13
FY
14
FY
15
FY
16
FY
17
FY
18
FY
19
(mn
ltrs/
day)
Gujarat Outside Gujarat
0
100
200
300
400
500
600
700
800
FY
07
FY
08
FY
09
FY
10
FY
11
FY
12
FY
13
FY
14
FY
15
FY
16
FY
17
FY
18
FY
19
(Rs/
kg fa
t)
Dairy sector, September 13, 2019 ICICI Securities
4
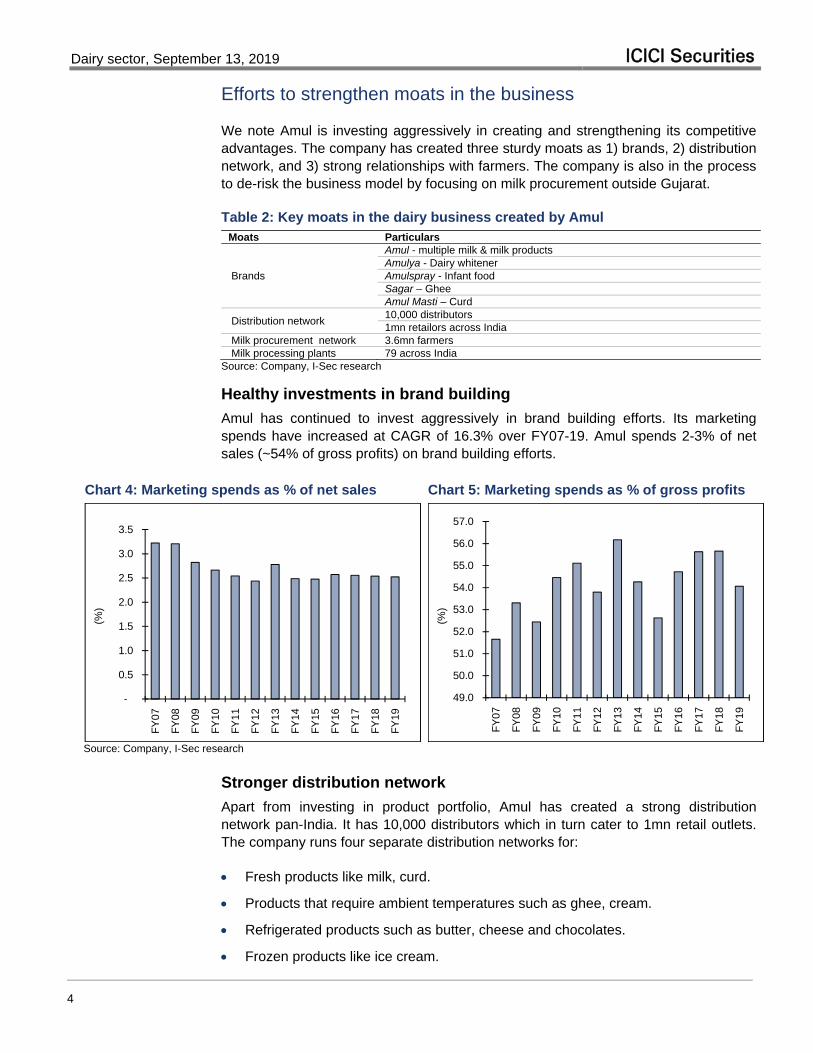
Efforts to strengthen moats in the business
We note Amul is investing aggressively in creating and strengthening its competitive advantages. The company has created three sturdy moats as 1) brands, 2) distribution network, and 3) strong relationships with farmers. The company is also in the process to de-risk the business model by focusing on milk procurement outside Gujarat.
Table 2: Key moats in the dairy business created by Amul Moats Particulars
Brands
Amul - multiple milk & milk products Amulya - Dairy whitener Amulspray - Infant food Sagar – Ghee Amul Masti – Curd
Distribution network 10,000 distributors 1mn retailors across India
Milk procurement network 3.6mn farmers Milk processing plants 79 across India
Source: Company, I-Sec research
Healthy investments in brand building
Amul has continued to invest aggressively in brand building efforts. Its marketing spends have increased at CAGR of 16.3% over FY07-19. Amul spends 2-3% of net sales (~54% of gross profits) on brand building efforts.
Chart 4: Marketing spends as % of net sales Chart 5: Marketing spends as % of gross profits
Source: Company, I-Sec research
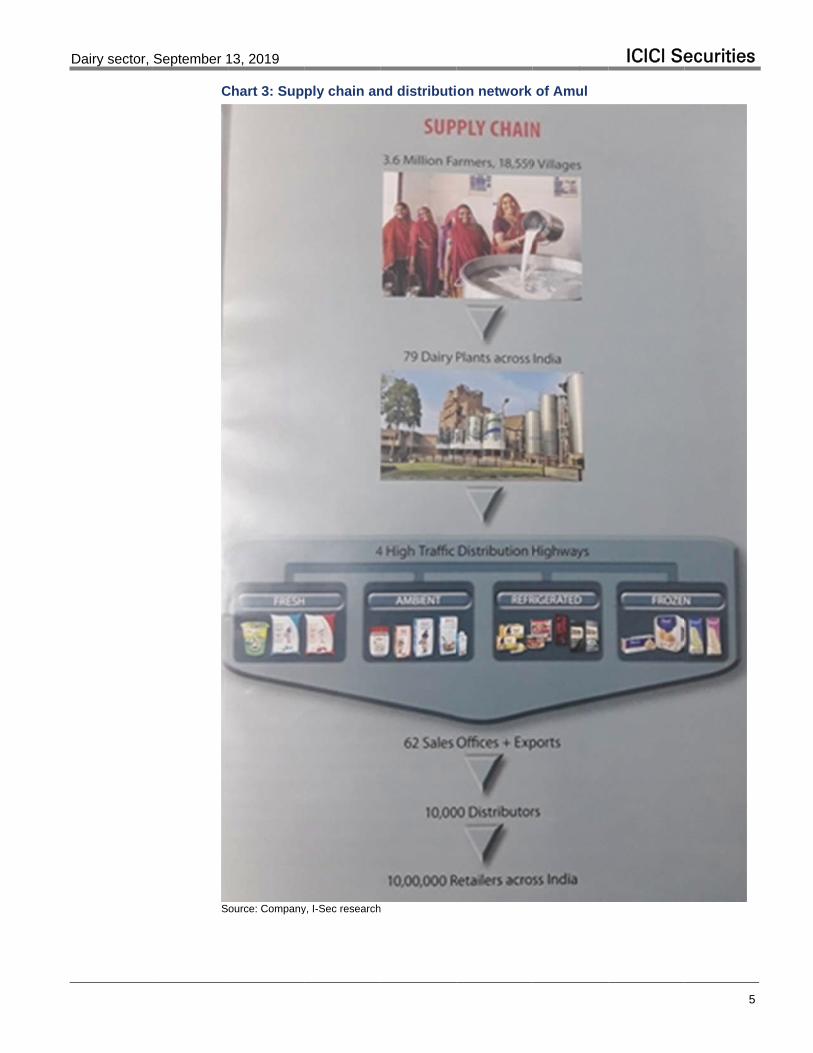
Stronger distribution network
Apart from investing in product portfolio, Amul has created a strong distribution network pan-India. It has 10,000 distributors which in turn cater to 1mn retail outlets. The company runs four separate distribution networks for:
Fresh products like milk, curd.
Products that require ambient temperatures such as ghee, cream.
Refrigerated products such as butter, cheese and chocolates.
Frozen products like ice cream.
-
0.5
1.0
1.5
2.0
2.5
3.0
3.5
FY
07
FY
08
FY
09
FY
10
FY
11
FY
12
FY
13
FY
14
FY
15
FY
16
FY
17
FY
18
FY
19
(%)
49.0
50.0
51.0
52.0
53.0
54.0
55.0
56.0
57.0
FY
07
FY
08
FY
09
FY
10
FY
11
FY
12
FY
13
FY
14
FY
15
FY
16
FY
17
FY
18
FY
19
(%)
D
Dairy sector,
September 1
C
S
13, 2019
Chart 3: Sup
ource: Company
ply chain an
y, I-Sec research
nd distributi
h
on network of Amul
ICICI Seecurities
5
Dairy sector, September 13, 2019 ICICI Securities
6
Plans to improve relationships with farmers
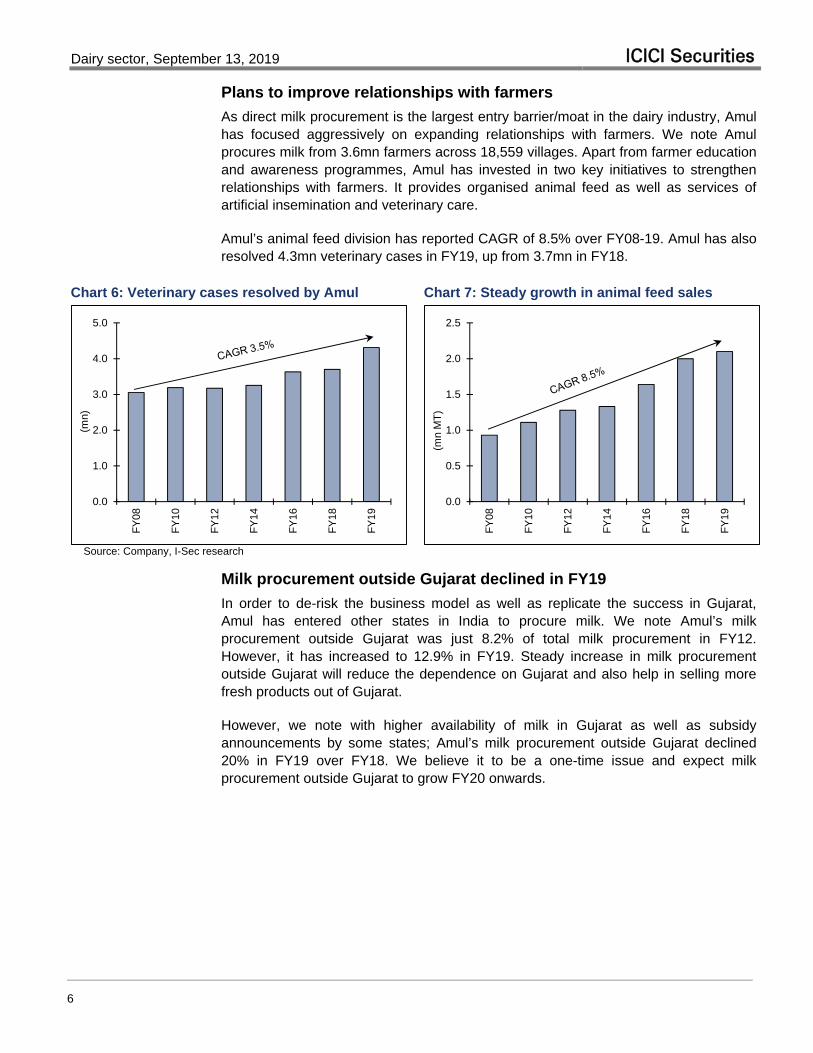
As direct milk procurement is the largest entry barrier/moat in the dairy industry, Amul has focused aggressively on expanding relationships with farmers. We note Amul procures milk from 3.6mn farmers across 18,559 villages. Apart from farmer education and awareness programmes, Amul has invested in two key initiatives to strengthen relationships with farmers. It provides organised animal feed as well as services of artificial insemination and veterinary care.
Amul’s animal feed division has reported CAGR of 8.5% over FY08-19. Amul has also resolved 4.3mn veterinary cases in FY19, up from 3.7mn in FY18.
Chart 6: Veterinary cases resolved by Amul Chart 7: Steady growth in animal feed sales
Source: Company, I-Sec research
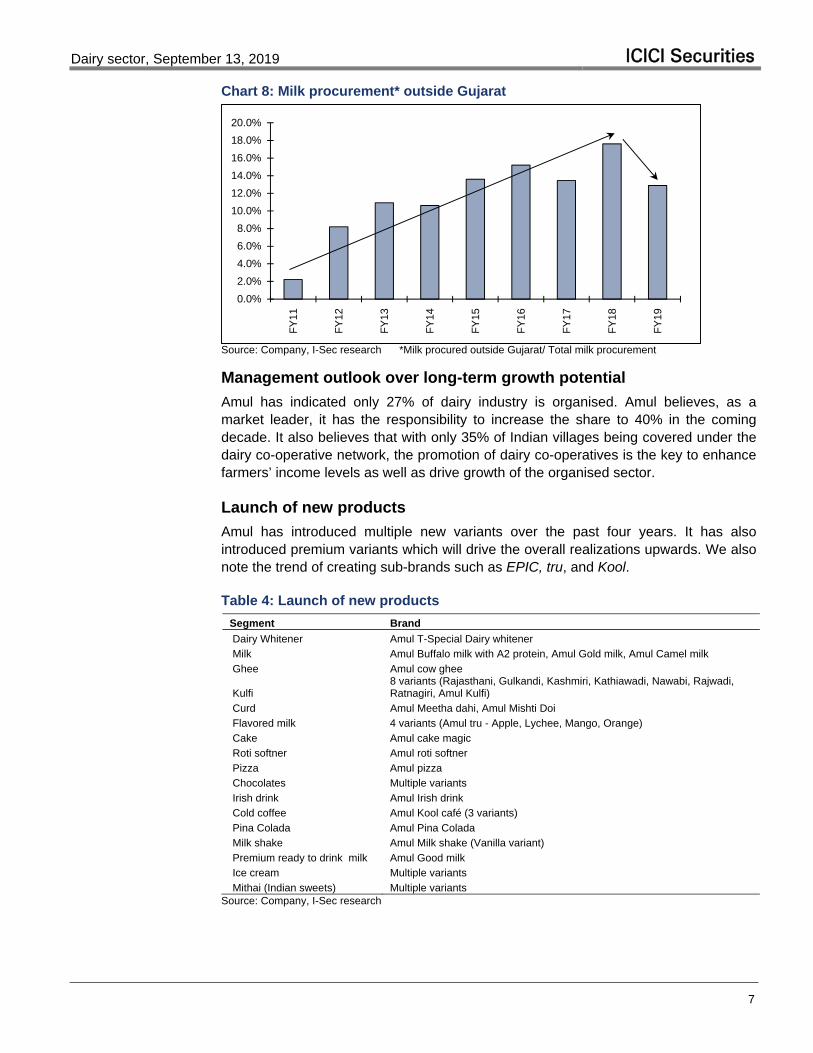
Milk procurement outside Gujarat declined in FY19
In order to de-risk the business model as well as replicate the success in Gujarat, Amul has entered other states in India to procure milk. We note Amul’s milk procurement outside Gujarat was just 8.2% of total milk procurement in FY12. However, it has increased to 12.9% in FY19. Steady increase in milk procurement outside Gujarat will reduce the dependence on Gujarat and also help in selling more fresh products out of Gujarat.
However, we note with higher availability of milk in Gujarat as well as subsidy announcements by some states; Amul’s milk procurement outside Gujarat declined 20% in FY19 over FY18. We believe it to be a one-time issue and expect milk procurement outside Gujarat to grow FY20 onwards.
0.0
1.0
2.0
3.0
4.0
5.0
FY
08
FY
10
FY
12
FY
14
FY
16
FY
18
FY
19
(mn)
0.0
0.5
1.0
1.5
2.0
2.5
FY
08
FY
10
FY
12
FY
14
FY
16
FY
18
FY
19
(mn
MT
)
Dairy sector, September 13, 2019 ICICI Securities
7
Chart 8: Milk procurement* outside Gujarat
Source: Company, I-Sec research *Milk procured outside Gujarat/ Total milk procurement
Management outlook over long-term growth potential
Amul has indicated only 27% of dairy industry is organised. Amul believes, as a market leader, it has the responsibility to increase the share to 40% in the coming decade. It also believes that with only 35% of Indian villages being covered under the dairy co-operative network, the promotion of dairy co-operatives is the key to enhance farmers’ income levels as well as drive growth of the organised sector.
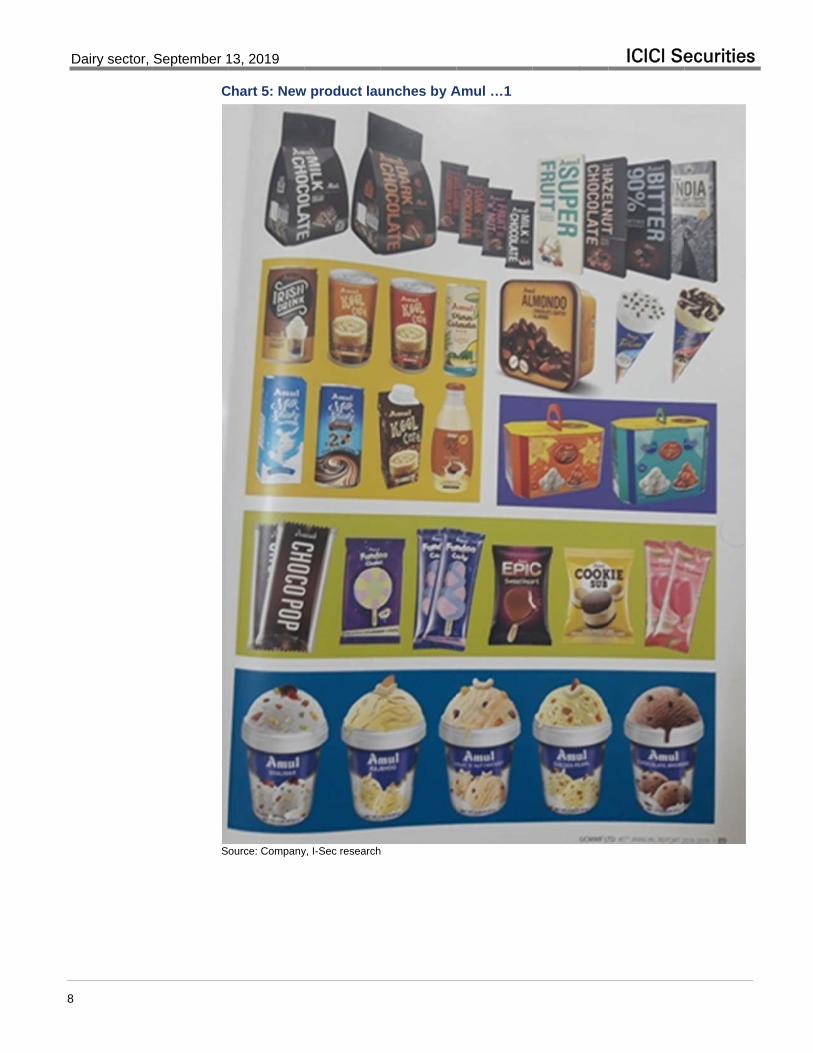
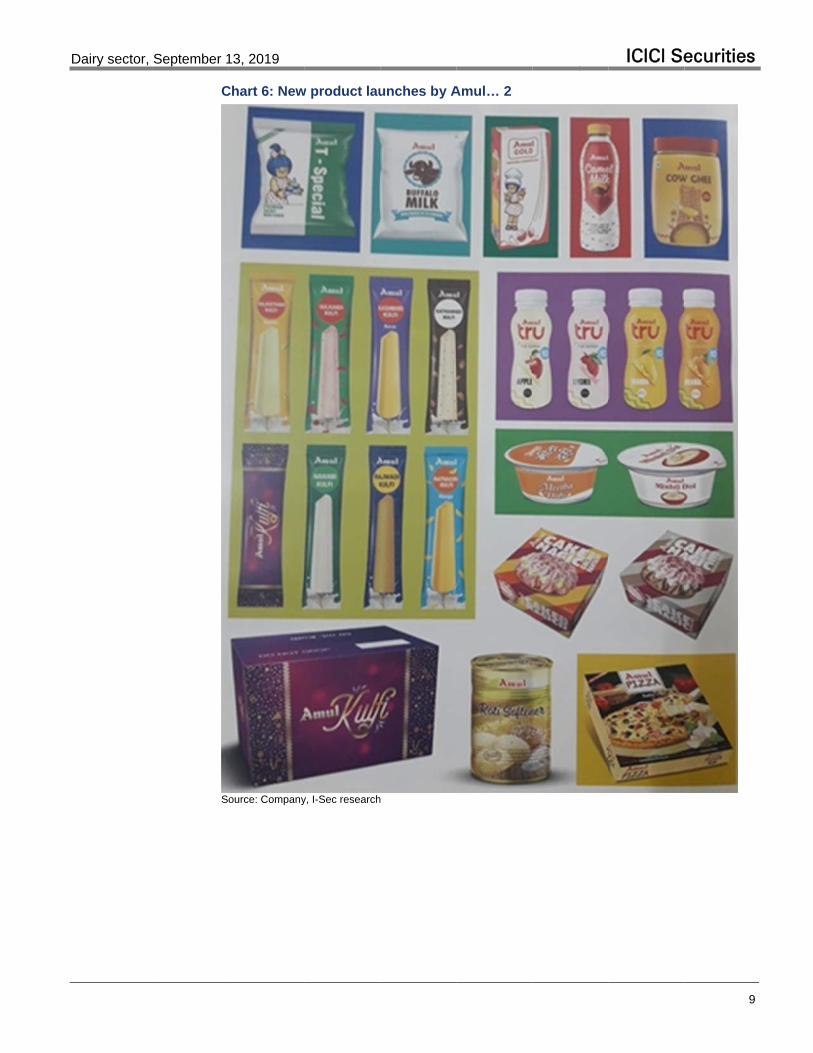
Launch of new products
Amul has introduced multiple new variants over the past four years. It has also introduced premium variants which will drive the overall realizations upwards. We also note the trend of creating sub-brands such as EPIC, tru, and Kool.
Table 4: Launch of new products
Segment Brand
Dairy Whitener Amul T-Special Dairy whitener
Milk Amul Buffalo milk with A2 protein, Amul Gold milk, Amul Camel milk
Ghee Amul cow ghee
Kulfi 8 variants (Rajasthani, Gulkandi, Kashmiri, Kathiawadi, Nawabi, Rajwadi, Ratnagiri, Amul Kulfi)
Curd Amul Meetha dahi, Amul Mishti Doi
Flavored milk 4 variants (Amul tru - Apple, Lychee, Mango, Orange)
Cake Amul cake magic
Roti softner Amul roti softner
Pizza Amul pizza
Chocolates Multiple variants
Irish drink Amul Irish drink
Cold coffee Amul Kool café (3 variants)
Pina Colada Amul Pina Colada
Milk shake Amul Milk shake (Vanilla variant)
Premium ready to drink milk Amul Good milk
Ice cream Multiple variants
Mithai (Indian sweets) Multiple variants Source: Company, I-Sec research
0.0%
2.0%
4.0%
6.0%
8.0%
10.0%
12.0%
14.0%
16.0%
18.0%
20.0%
FY
11
FY
12
FY
13
FY
14
FY
15
FY
16
FY
17
FY
18
FY
19
D
8
Dairy sector,
September 1
C
S
13, 2019
Chart 5: New
ource: Company
w product lau
y, I-Sec research
unches by A
h
Amul …1
ICICI Seecurities
D
Dairy sector,
September 1
C
S
13, 2019
Chart 6: New
ource: Company
w product lau
y, I-Sec research
unches by A
h
Amul… 2
ICICI Seecurities
9
Dairy sector, September 13, 2019 ICICI Securities
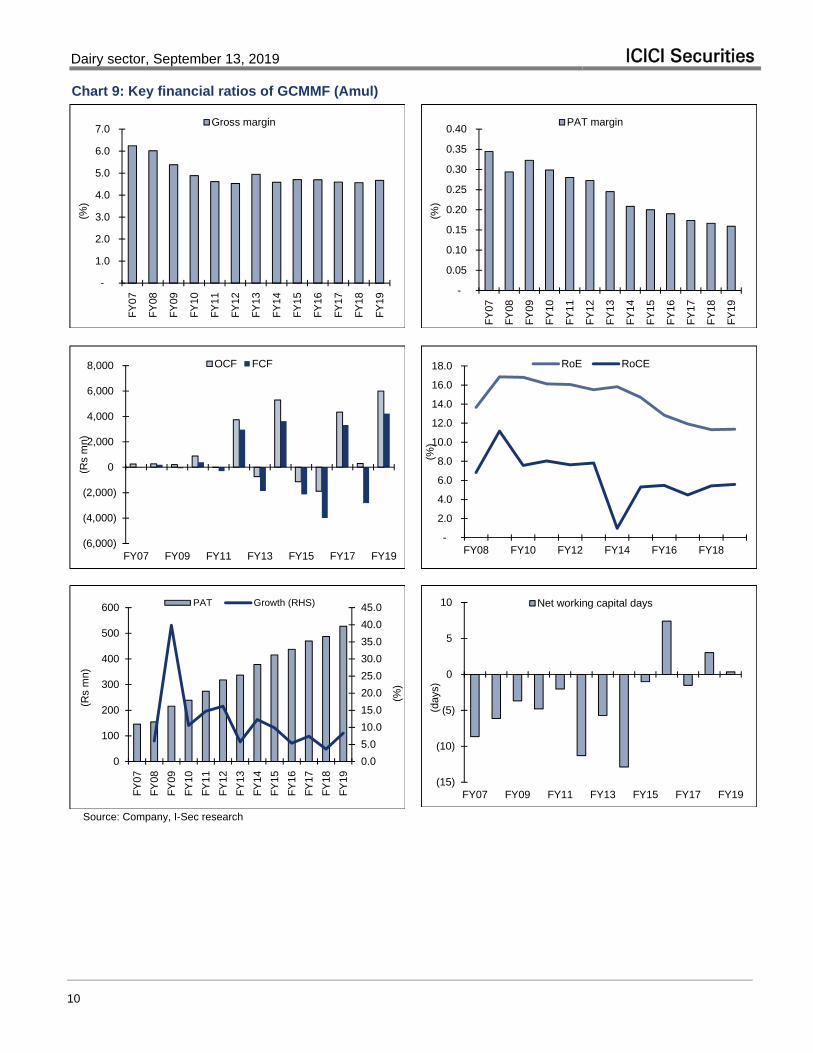
10
Chart 9: Key financial ratios of GCMMF (Amul)
Source: Company, I-Sec research
-
1.0
2.0
3.0
4.0
5.0
6.0
7.0 F
Y07
FY
08
FY
09
FY
10
FY
11
FY
12
FY
13
FY
14
FY
15
FY
16
FY
17
FY
18
FY
19
(%)
Gross margin
-
0.05
0.10
0.15
0.20
0.25
0.30
0.35
0.40
FY
07
FY
08
FY
09
FY
10
FY
11
FY
12
FY
13
FY
14
FY
15
FY
16
FY
17
FY
18
FY
19
(%)
PAT margin
(6,000)
(4,000)
(2,000)
0
2,000
4,000
6,000
8,000
FY07 FY09 FY11 FY13 FY15 FY17 FY19
(Rs
mn)
OCF FCF
-
2.0
4.0
6.0
8.0
10.0
12.0
14.0
16.0
18.0
FY08 FY10 FY12 FY14 FY16 FY18
(%)
RoE RoCE
0.0
5.0
10.0
15.0
20.0
25.0
30.0
35.0
40.0
45.0
0
100
200
300
400
500
600
FY
07
FY
08
FY
09
FY
10
FY
11
FY
12
FY
13
FY
14
FY
15
FY
16
FY
17
FY
18
FY
19
(%)
(Rs
mn)
PAT Growth (RHS)
(15)
(10)
(5)
0
5
10
FY07 FY09 FY11 FY13 FY15 FY17 FY19
(day
s)
Net working capital days
Dairy sector, September 13, 2019 ICICI Securities
11
Table 7: Profit & loss statement (Rs mn)
FY11 FY12 FY13 FY14 FY15 FY16 FY17 FY18 FY19 Gross Sales 97,825 116,767 137,520 181,715 207,809 230,170 271,016 292,618 331,943 Less: Excise Duty 84 87 168 280 304 319 392 155 - Net Sales 97,741 116,680 137,351 181,435 207,504 229,851 270,625 292,463 331,943 Growth (%) 22.2 19.4 17.7 32.1 14.4 10.8 17.7 8.1 13.5 Expenditure Cost of Goods Sold 93,230 111,395 130,558 173,120 197,732 219,043 258,198 279,116 316,447 Staff Cost 683 729 751 1,123 1,206 1,049 1,635 1,545 1,742 Manufacturing expenses 393 611 960 1,103 1,349 1,415 1,498 1,687 2,006 Marketing & selling expenses 2,486 2,843 3,816 4,512 5,142 5,914 6,913 7,429 8,378 Other Expenses 555 537 726 888 961 921 932 1,003 1,157 EBITDA 394 565 541 688 1,113 1,510 1,447 1,683 2,214 EBITDA margin (%) 0.4 0.5 0.4 0.4 0.5 0.7 0.5 0.6 0.7 Depreciation 251 407 361 659 799 871 883 944 1,248 EBIT 143 158 179 29 314 639 564 739 966 Interest Expense & Bank Exps 7 4 21 82 86 327 188 297 464 Other Income 240 305 341 629 406 355 340 307 297 Profit Before Tax 376 459 499 575 634 667 717 749 799 Income Taxes 102 140 162 197 218 230 246 262 271 Effective tax rate (%) 27.1 30.6 32.5 34.3 34.4 34.4 34.4 34.9 33.9 Profit After Tax 274 318 337 378 415 438 470 488 528
Source: Company data, I-Sec research
Table 8: Balance sheet (Rs mn)
FY11 FY12 FY13 FY14 FY15 FY16 FY17 FY18 FY19 Sources of Funds Share Capital 1,000 1,000 1,000 1,000 1,500 1,900 2,401 2,401 2,401 Reserves and Surplus 930 1,095 1,279 1,504 1,692 1,855 1,983 2,111 2,638 Deferred Tax Liability (29) (34) (1) (4) (42) (87) (163) (119) (142) Net Worth 1,901 2,062 2,278 2,500 3,151 3,668 4,221 4,392 4,897 Secured Loans 72 90 157 1,042 4,282 10,338 4,708 11,369 12,236 Unsecured Loans - - - - 848 1,085 1,276 1,263 451 Total Loans 72 90 157 1,042 5,130 11,422 5,984 12,633 12,686 Total 1,973 2,152 2,435 3,542 8,281 15,090 10,205 17,024 17,583 Application of Funds Fixed Assets Gross Block 4,452 5,233 6,230 7,794 8,583 10,081 10,896 12,451 16,031 Less: Depreciation 3,006 3,389 3,715 4,158 4,832 5,646 6,487 7,343 8,582 Net Block 1,447 1,845 2,515 3,636 3,751 4,435 4,409 5,109 7,450 Capital WIP 99 68 164 38 76 573 499 1,832 135 Gross Block-Brand value 4,452 5,233 6,230 7,794 8,583 10,081 10,896 12,451 16,031 Other Investments 7 7 7 7 1,553 1,568 1,682 713 844 Current Assets 4,021 9,957 12,212 12,089 17,882 23,244 19,992 29,318 39,582 Inventories 2,668 5,345 8,693 4,412 9,069 11,898 10,414 14,448 16,208 Sundry Debtors 316 564 1,127 932 1,371 2,089 2,269 3,415 5,427 Cash & Bank Balances 963 3,848 1,894 6,267 3,474 3,848 4,753 6,937 8,840 Loans & Advances 74 200 498 478 3,968 5,409 2,555 4,518 9,107 Current Liabilities 3,601 9,725 12,463 12,229 14,982 14,730 16,377 19,948 30,428 Liabilities 3,266 9,311 12,064 11,805 14,605 14,296 15,854 19,420 30,143 Provisions 336 414 399 424 377 435 523 527 285 Net Current Assets 420 232 (251) (140) 2,900 8,514 3,615 9,371 9,154 Total 1,973 2,152 2,435 3,542 8,281 15,090 10,205 17,024 17,583
Source: Company data, I-Sec research
Dairy sector, September 13, 2019 ICICI Securities
12
Table 9: Cashflow statement (Rs mn)
FY11 FY12 FY13 FY14 FY15 FY16 FY17 FY18 FY19 OCF before W/C changes 496 684 717 930 1,205 1,210 1,268 1,582 1,704 W/c Changes (519) 3,050 (1,457) 4,365 (2,347) (3,106) 3,076 (1,287) 4,296 OCF After W/C Changes (23) 3,734 (740) 5,296 (1,142) (1,895) 4,344 294 6,000 Cash Flow from Investing Capital Expenditure (291) (779) (1,209) (1,759) (1,009) (2,107) (1,047) (3,148) (1,776) Disposal 2 1 78 102 18 10 20 37 2 Investments - - - - (1,600) (1,637) 2,499 (2,494) (3,778) Acquisitions - - - - - - - - - Net Cash used in Investing (289) (778) (1,131) (1,657) (2,591) (3,734) 1,473 (5,606) (5,553) Cash Flow from Financing Changes in Share Capital 250 0 0 0 500 400 500 - - Changes in Loans (13) 18 68 884 3,780 5,764 (5,614) 6,208 (51) Dividends & change in reserves (75) (90) (150) (150) (150) (213) (275) (341) (360) Net Cash used in Financing 162 (71) (82) 734 4,130 5,951 (5,389) 5,866 (412) Extraordinary Items - - - - - - - - - Changes in Cash & Equivalents (150) 2,884 (1,953) 4,373 398 322 429 555 36 Opening Cash & Equivalents 1,113 963 3,848 1,894 1,609 2,007 2,329 2,758 3,312 Closing Cash & Equivalents 963 3,848 1,894 6,267 2,007 2,329 2,758 3,312 3,348 Free Cash Flow (312) 2,956 (1,871) 3,639 (2,133) (3,992) 3,318 (2,817) 4,225
Source: Company data, I-Sec research
Table 10: Ratio analysis (Rs mn)
FY11 FY12 FY13 FY14 FY15 FY16 FY17 FY18 FY19 Profitability Ratios (%) Gross margin 4.6 4.5 4.9 4.6 4.7 4.7 4.6 4.6 4.7 EBITDA Margin 0.4 0.5 0.4 0.4 0.5 0.7 0.5 0.6 0.7 EBIT Margin 0.1 0.1 0.1 0.0 0.2 0.3 0.2 0.3 0.3 PBT Margin 0.4 0.4 0.4 0.3 0.3 0.3 0.3 0.3 0.2 PAT Margin 0.3 0.3 0.2 0.2 0.2 0.2 0.2 0.2 0.2 Income Tax Rate 27.1 30.6 32.5 34.3 34.4 34.4 34.4 34.9 33.9 Excise Duty Rate 0.1 0.1 0.1 0.2 0.1 0.1 0.1 0.1 - RoE 16.1 16.1 15.5 15.8 14.7 12.8 11.9 11.3 11.4 RoCE 8.0 7.6 7.8 1.0 5.3 5.5 4.5 5.4 5.6 Growth rates (%) Revenues 22.2 19.4 17.7 32.1 14.4 10.8 17.7 8.1 13.5 EBITDA 0.7 43.4 (4.3) 27.3 61.8 35.7 (4.2) 16.3 31.5 PAT 14.7 16.2 5.8 12.3 9.9 5.4 7.4 3.7 8.3 Major Costs as % of Net Sales Cost of Goods Sold 95.4 95.5 95.1 95.4 95.3 95.3 95.4 95.4 95.3 Staff Cost 0.7 0.6 0.5 0.6 0.6 0.5 0.6 0.5 0.5 Manufacturing expenses 0.4 0.5 0.7 0.6 0.7 0.6 0.6 0.6 0.6 Marketing & selling expenses 2.5 2.4 2.8 2.5 2.5 2.6 2.6 2.5 2.5 Other Expenses 0.6 0.5 0.5 0.5 0.5 0.4 0.3 0.3 0.3 Turnover ratios (%) Debtors Turnover ratio 0.3 0.5 0.8 0.5 0.7 0.9 0.8 1.2 1.6 Current Liabilities Turnover Ratio 3.3 8.0 8.8 6.5 7.0 6.2 5.9 6.6 9.1 Inventory Turnover Ratio 2.7 4.6 6.3 2.4 4.4 5.2 3.8 4.9 4.9 Fixed Assets Turnover Ratio 1.6 1.6 2.0 2.0 1.8 2.2 1.8 2.4 2.3 Other ratios (%) Net debt/Equity (x) (0.5) (1.8) (0.8) (2.1) 0.5 2.1 0.3 1.3 0.8 FCF/EPS (114.0) 928.5 (555.8) 962.3 (513.3) (911.8) 705.4 (577.8) 800.5 OCF/Sales (0.0) 3.2 (0.5) 2.9 (0.6) (0.8) 1.6 0.1 1.8
Source: Company data, I-Sec research

Dairy sector, September 13, 2019 ICICI Securities
13
“In case of industry/sector reports or a report containing multiple stocks, the rating/recommendation for a particular stock may be based on the last released stock specific report for that company.”
This report may be distributed in Singapore by ICICI Securities, Inc. (Singapore branch). Any recipients of this report in Singapore should contact ICICI Securities, Inc. (Singapore branch) in respect of any matters arising from, or in connection with, this report. The contact details of ICICI Securities, Inc. (Singapore branch) are as follows: Address: 10 Collyer Quay, #40-92 Ocean Financial Tower, Singapore - 049315, Tel: +65 6232 2451 and email: [email protected], [email protected].
"In case of eligible investors based in Japan, charges for brokerage services on execution of transactions do not in substance constitute charge for research reports and no charges are levied for providing research reports to such investors."
New I-Sec investment ratings (all ratings based on absolute return; All ratings and target price refers to 12-month performance horizon, unless mentioned otherwise)
BUY: >15% return; ADD: 5% to 15% return; HOLD: Negative 5% to Positive 5% return; REDUCE: Negative 5% to Negative 15% return; SELL: < negative 15% return
ANALYST CERTIFICATION I/We, Aniruddha Joshi, CA; Manoj Menon, MBA, CMA; authors and the names subscribed to this report, hereby certify that all of the views expressed in this research report accurately reflect our views about the subject issuer(s) or securities. We also certify that no part of our compensation was, is, or will be directly or indirectly related to the specific recommendation(s) or view(s) in this report. Analysts are not registered as research analysts by FINRA and are not associated persons of the ICICI Securities Inc. It is also confirmed that above mentioned Analysts of this report have not received any compensation from the companies mentioned in the report in the preceding twelve months and do not serve as an officer, director or employee of the companies mentioned in the report. Terms & conditions and other disclosures: ICICI Securities Limited (ICICI Securities) is a full-service, integrated investment banking and is, inter alia, engaged in the business of stock brokering and distribution of financial products. ICICI Securities Limited is a SEBI registered Research Analyst with SEBI Registration Number – INH000000990. ICICI Securities Limited SEBI Registration is INZ000183631 for stock broker. ICICI Securities is a subsidiary of ICICI Bank which is India’s largest private sector bank and has its various subsidiaries engaged in businesses of housing finance, asset management, life insurance, general insurance, venture capital fund management, etc. (“associates”), the details in respect of which are available on www.icicibank.com. ICICI Securities is one of the leading merchant bankers/ underwriters of securities and participate in virtually all securities trading markets in India. We and our associates might have investment banking and other business relationship with a significant percentage of companies covered by our Investment Research Department. ICICI Securities generally prohibits its analysts, persons reporting to analysts and their relatives from maintaining a financial interest in the securities or derivatives of any companies that the analysts cover. Recommendation in reports based on technical and derivative analysis centre on studying charts of a stock's price movement, outstanding positions, trading volume etc as opposed to focusing on a company's fundamentals and, as such, may not match with the recommendation in fundamental reports. Investors may visit icicidirect.com to view the Fundamental and Technical Research Reports. Our proprietary trading and investment businesses may make investment decisions that are inconsistent with the recommendations expressed herein. ICICI Securities Limited has two independent equity research groups: Institutional Research and Retail Research. This report has been prepared by the Institutional Research. The views and opinions expressed in this document may or may not match or may be contrary with the views, estimates, rating, target price of the Retail Research. The information and opinions in this report have been prepared by ICICI Securities and are subject to change without any notice. The report and information contained herein is strictly confidential and meant solely for the selected recipient and may not be altered in any way, transmitted to, copied or distributed, in part or in whole, to any other person or to the media or reproduced in any form, without prior written consent of ICICI Securities. While we would endeavour to update the information herein on a reasonable basis, ICICI Securities is under no obligation to update or keep the information current. Also, there may be regulatory, compliance or other reasons that may prevent ICICI Securities from doing so. Non-rated securities indicate that rating on a particular security has been suspended temporarily and such suspension is in compliance with applicable regulations and/or ICICI Securities policies, in circumstances where ICICI Securities might be acting in an advisory capacity to this company, or in certain other circumstances. This report is based on information obtained from public sources and sources believed to be reliable, but no independent verification has been made nor is its accuracy or completeness guaranteed. This report and information herein is solely for informational purpose and shall not be used or considered as an offer document or solicitation of offer to buy or sell or subscribe for securities or other financial instruments. Though disseminated to all the customers simultaneously, not all customers may receive this report at the same time. ICICI Securities will not treat recipients as customers by virtue of their receiving this report. Nothing in this report constitutes investment, legal, accounting and tax advice or a representation that any investment or strategy is suitable or appropriate to your specific circumstances. The securities discussed and opinions expressed in this report may not be suitable for all investors, who must make their own investment decisions, based on their own investment objectives, financial positions and needs of specific recipient. This may not be taken in substitution for the exercise of independent judgment by any recipient. The recipient should independently evaluate the investment risks. The value and return on investment may vary because of changes in interest rates, foreign exchange rates or any other reason. ICICI Securities accepts no liabilities whatsoever for any loss or damage of any kind arising out of the use of this report. Past performance is not necessarily a guide to future performance. Investors are advised to see Risk Disclosure Document to understand the risks associated before investing in the securities markets. Actual results may differ materially from those set forth in projections. Forward-looking statements are not predictions and may be subject to change without notice. ICICI Securities or its associates might have managed or co-managed public offering of securities for the subject company or might have been mandated by the subject company for any other assignment in the past twelve months. ICICI Securities or its associates might have received any compensation from the companies mentioned in the report during the period preceding twelve months from the date of this report for services in respect of managing or co-managing public offerings, corporate finance, investment banking or merchant banking, brokerage services or other advisory service in a merger or specific transaction. ICICI Securities or its associates might have received any compensation for products or services other than investment banking or merchant banking or brokerage services from the companies mentioned in the report in the past twelve months. ICICI Securities encourages independence in research report preparation and strives to minimize conflict in preparation of research report. ICICI Securities or its associates or its analysts did not receive any compensation or other benefits from the companies mentioned in the report or third party in connection with preparation of the research report. Accordingly, neither ICICI Securities nor Research Analysts and their relatives have any material conflict of interest at the time of publication of this report. Compensation of our Research Analysts is not based on any specific merchant banking, investment banking or brokerage service transactions. ICICI Securities or its subsidiaries collectively or Research Analysts or their relatives do not own 1% or more of the equity securities of the Company mentioned in the report as of the last day of the month preceding the publication of the research report. Since associates of ICICI Securities are engaged in various financial service businesses, they might have financial interests or beneficial ownership in various companies including the subject company/companies mentioned in this report. ICICI Securities may have issued other reports that are inconsistent with and reach different conclusion from the information presented in this report. Neither the Research Analysts nor ICICI Securities have been engaged in market making activity for the companies mentioned in the report. We submit that no material disciplinary action has been taken on ICICI Securities by any Regulatory Authority impacting Equity Research Analysis activities. This report is not directed or intended for distribution to, or use by, any person or entity who is a citizen or resident of or located in any locality, state, country or other jurisdiction, where such distribution, publication, availability or use would be contrary to law, regulation or which would subject ICICI Securities and affiliates to any registration or licensing requirement within such jurisdiction. The securities described herein may or may not be eligible for sale in all jurisdictions or to certain category of investors. Persons in whose possession this document may come are required to inform themselves of and to observe such restriction. This report has not been prepared by ICICI Securities, Inc. However, ICICI Securities, Inc. has reviewed the report and, in so far as it includes current or historical information, it is believed to be reliable, although its accuracy and completeness cannot be guaranteed.


![Masti Oksidacija lipidi oksidacija inicijacija propagacija]terminaija](https://static.fdocuments.us/doc/165x107/577cd70d1a28ab9e789deb6b/masti-oksidacija-lipidi-oksidacija-inicijacija-propagacijaterminaija.jpg)

![Identification of QTLs associated with curd architecture in … · 2020. 4. 22. · curd and loose curd [8, 9]. Further, the differences of health-promoting compounds and antioxidant](https://static.fdocuments.us/doc/165x107/60b0083cf78b902313319d9c/identification-of-qtls-associated-with-curd-architecture-in-2020-4-22-curd.jpg)


