EQUITY RESEARCH – ENERGY MASTER LIMITED PARTNERSHIPS WACHOVIA pg. 1 Upstream Master Limited...
26
EQUITY RESEARCH – ENERGY MASTER LIMITED PARTNERSHIPS WACHOVIA pg. 1 Upstream Master Limited Partnerships “A Wall Street Perspective” IPAA, January 2008 For certain non-U.S. institutional readers, this research is issued by Wachovia Securities International Limited, which is regulated in the U.K. by the Financial Services Authority. Wachovia Securities International Limited provides investment services in certain countries, and each has approved the contents of this document for viewing by approved parties in the country in which it does business. Not all investments or related services are available to residents of every country. Please consult your Financial Advisor or the Wachovia Securities office in your area for additional information. U.S. residents are directed to Wachovia.com for investment and related services. Yves Siegel, CFA (212) 214-5036 Michael Blum (212) 214-5037 Sharon Lui, CPA (212) 214-5035 Eric Shiu (212) 214-5038 Praneeth Satish (212) 214-8056 A publication of Wachovia Capital Markets, LLC Ronald Londe (314) 955-3829 Jeffrey Morgan, CFA (314) 955-6558
-
Upload
adonis-swift -
Category
Documents
-
view
216 -
download
2
Transcript of EQUITY RESEARCH – ENERGY MASTER LIMITED PARTNERSHIPS WACHOVIA pg. 1 Upstream Master Limited...

EQUITY RESEARCH – ENERGY MASTER LIMITED PARTNERSHIPS
WACHOVIA
pg. 1
Upstream Master Limited Partnerships
“A Wall Street Perspective”IPAA, January 2008
For certain non-U.S. institutional readers, this research is issued by Wachovia Securities International Limited, which is regulated in the U.K. by the Financial Services Authority. Wachovia Securities International Limited provides investment services in certain countries, and each has approved the contents of this document for viewing by approved parties in the country in which it does business. Not all investments or related services are available to residents of every country. Please consult your Financial Advisor or the Wachovia Securities office in your area for additional information. U.S. residents are directed to Wachovia.com for investment and related services.
Yves Siegel, CFA (212) 214-5036
Michael Blum (212) 214-5037
Sharon Lui, CPA(212) 214-5035
Eric Shiu (212) 214-5038
Praneeth Satish(212) 214-8056
A publication ofWachovia Capital
Markets, LLC
Ronald Londe(314) 955-3829
Jeffrey Morgan, CFA(314) 955-6558
EQUITY RESEARCH – ENERGY MASTER LIMITED PARTNERSHIPS
WACHOVIA
pg. 2
Discussion Points
The Jury Is Still Out On Upstream MLPs Long-term sustainability has become a concern Unlike investors in Canadian royalty trusts, investors in upstream MLPs expect
sustainable distributions It is still unclear whether upstream MLPs are properly allocating adequate capital to
replace reserves and sustain distributions over the long term
Uncertainty Has Resulted In Some Headwinds For Recent Upstream MLP IPOs Market appears to be demanding a higher yield for new upstream MLP issues Issuers may pull or delay IPOs given the narrowing spread between upstream MLP
valuations and E&P C-Corp valuations
The Silver Lining Crude oil prices are at record levels and natural gas prices remain relatively strong While financing costs have increased, acquisitions will still likely get done
Closing Remarks
EQUITY RESEARCH – ENERGY MASTER LIMITED PARTNERSHIPS
WACHOVIA
pg. 3
Source: FactSet, Standard & Poor’s, Wachovia Capital Markets, LLC
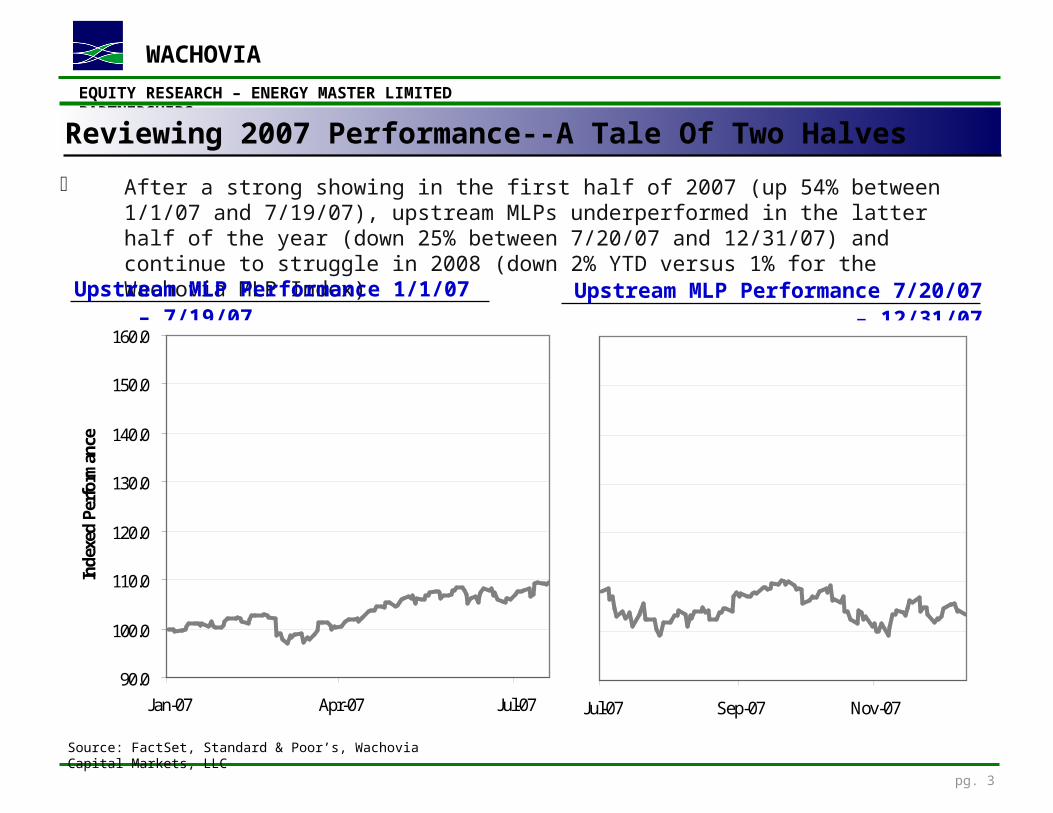
Reviewing 2007 Performance--A Tale Of Two Halves
After a strong showing in the first half of 2007 (up 54% between 1/1/07 and 7/19/07), upstream MLPs underperformed in the latter half of the year (down 25% between 7/20/07 and 12/31/07) and continue to struggle in 2008 (down 2% YTD versus 1% for the Wachovia MLP Index)
Upstream MLP Performance 1/1/07 – 7/19/07
90.0
100.0
110.0
120.0
130.0
140.0
150.0
160.0
Jan-07 Apr-07 Jul-07
Inde
xed
Perf
orm
ance
Upstream MLPs: +54%
S&P 500: +10%
WMLP Index: +20%
Upstream MLP Performance 7/20/07 – 12/31/07
Jul-07 Sep-07 Nov-07
Upstream MLPs: -25%
WMLP Index: -13%
S&P 500: -9%
EQUITY RESEARCH – ENERGY MASTER LIMITED PARTNERSHIPS
WACHOVIA
pg. 4
Source: FactSet, Standard & Poor’s, Wachovia Capital Markets, LLC
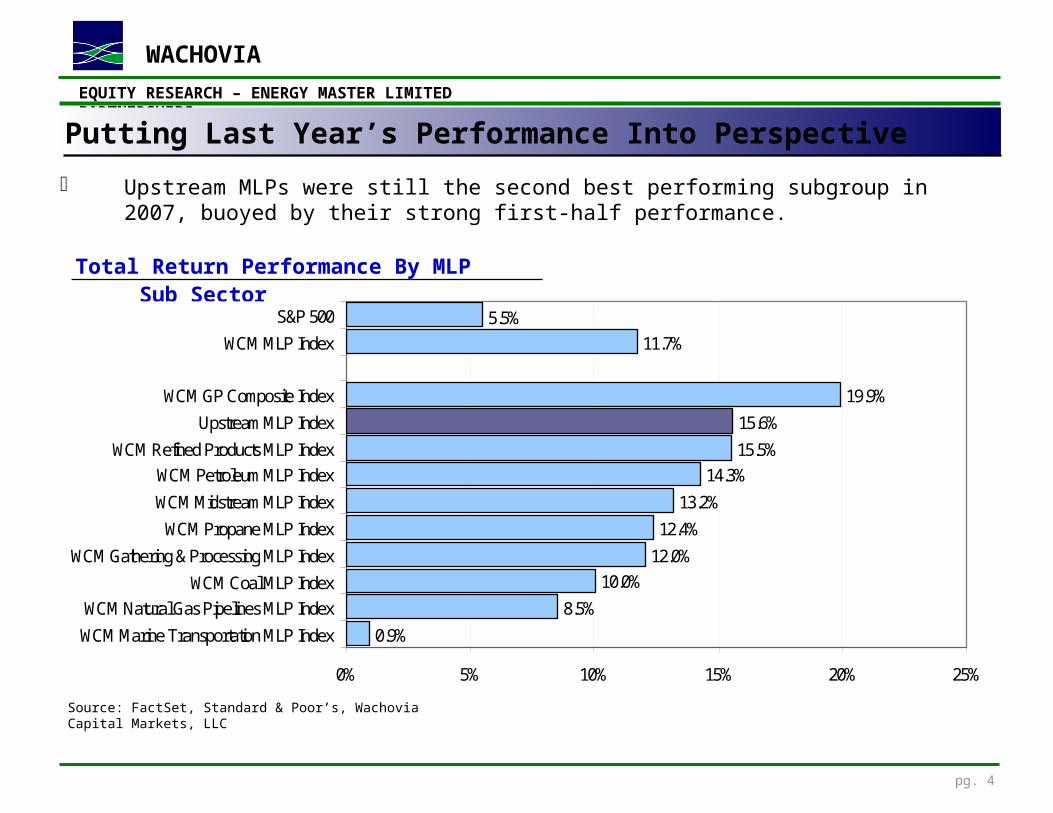
Putting Last Year’s Performance Into Perspective
Upstream MLPs were still the second best performing subgroup in 2007, buoyed by their strong first-half performance.
Total Return Performance By MLP Sub Sector
0.9%
8.5%
10.0%12.0%
12.4%
13.2%
14.3%15.5%
15.6%
19.9%
11.7%5.5%
0% 5% 10% 15% 20% 25%
WCM Marine Transportation MLP Index
WCM Natural Gas Pipelines MLP IndexWCM Coal MLP Index
WCM Gathering & Processing MLP Index
WCM Propane MLP Index
WCM Midstream MLP Index
WCM Petroleum MLP IndexWCM Refined Products MLP Index
Upstream MLP Index
WCM GP Composite Index
WCM MLP Index
S&P 500
EQUITY RESEARCH – ENERGY MASTER LIMITED PARTNERSHIPS
WACHOVIA
pg. 5
39%
27%
20%
9%
(14% ) (16% ) (17% )(22% )
(16% )
18%
6% 4%
(30% )
(20% )
(10% )
0%
10%
20%
30%
40%
50%
EVEP CEP BBEP LGCY ENP VNR QELP LINE RecentE&P MLP
IPOs
EarlierE&P
MLPs
WMLPIndex
S&P 500
2007
Pric
e Pe
rfor
man
ce (%
)
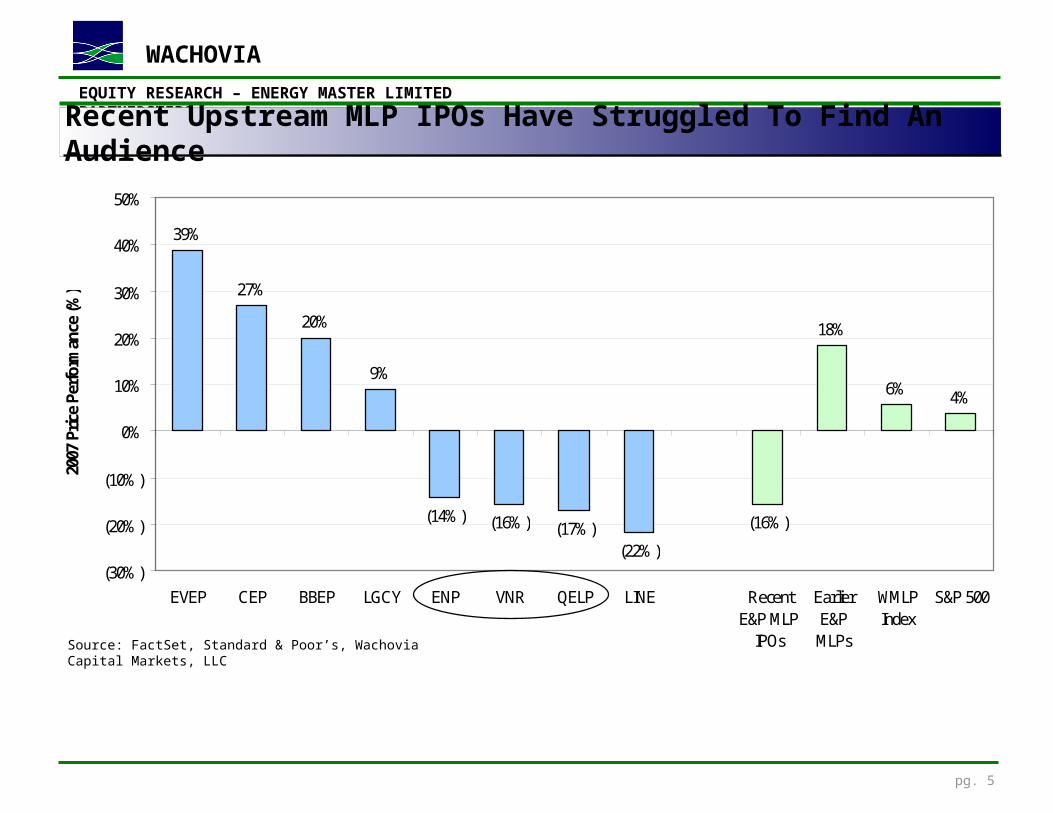
Recent Upstream MLP IPOs Have Struggled To Find An Audience
Source: FactSet, Standard & Poor’s, Wachovia Capital Markets, LLC
EQUITY RESEARCH – ENERGY MASTER LIMITED PARTNERSHIPS
WACHOVIA
pg. 6
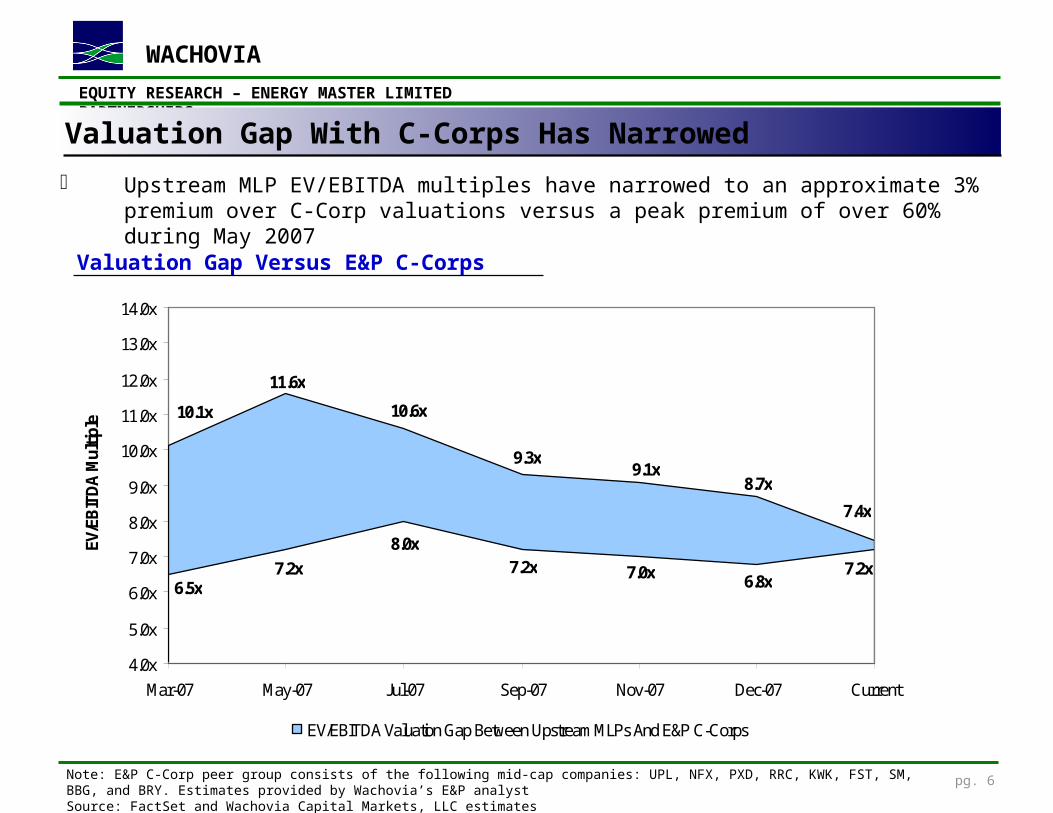
Upstream MLP EV/EBITDA multiples have narrowed to an approximate 3% premium over C-Corp valuations versus a peak premium of over 60% during May 2007
Valuation Gap With C-Corps Has Narrowed
Valuation Gap Versus E&P C-Corps
Note: E&P C-Corp peer group consists of the following mid-cap companies: UPL, NFX, PXD, RRC, KWK, FST, SM, BBG, and BRY. Estimates provided by Wachovia’s E&P analystSource: FactSet and Wachovia Capital Markets, LLC estimates
10.1x
11.6x
10.6x
9.3x9.1x
8.7x
7.4x
6.5x7.2x
8.0x7.2x 7.0x 6.8x
7.2x
4.0x
5.0x
6.0x
7.0x
8.0x
9.0x
10.0x
11.0x
12.0x
13.0x
14.0x
Mar-07 May-07 Jul-07 Sep-07 Nov-07 Dec-07 Current
EV/E
BIT
DA
Mul
tiple
EV/EBITDA Valuation Gap Between Upstream MLPs And E&P C-Corps
EQUITY RESEARCH – ENERGY MASTER LIMITED PARTNERSHIPS
WACHOVIA
pg. 7
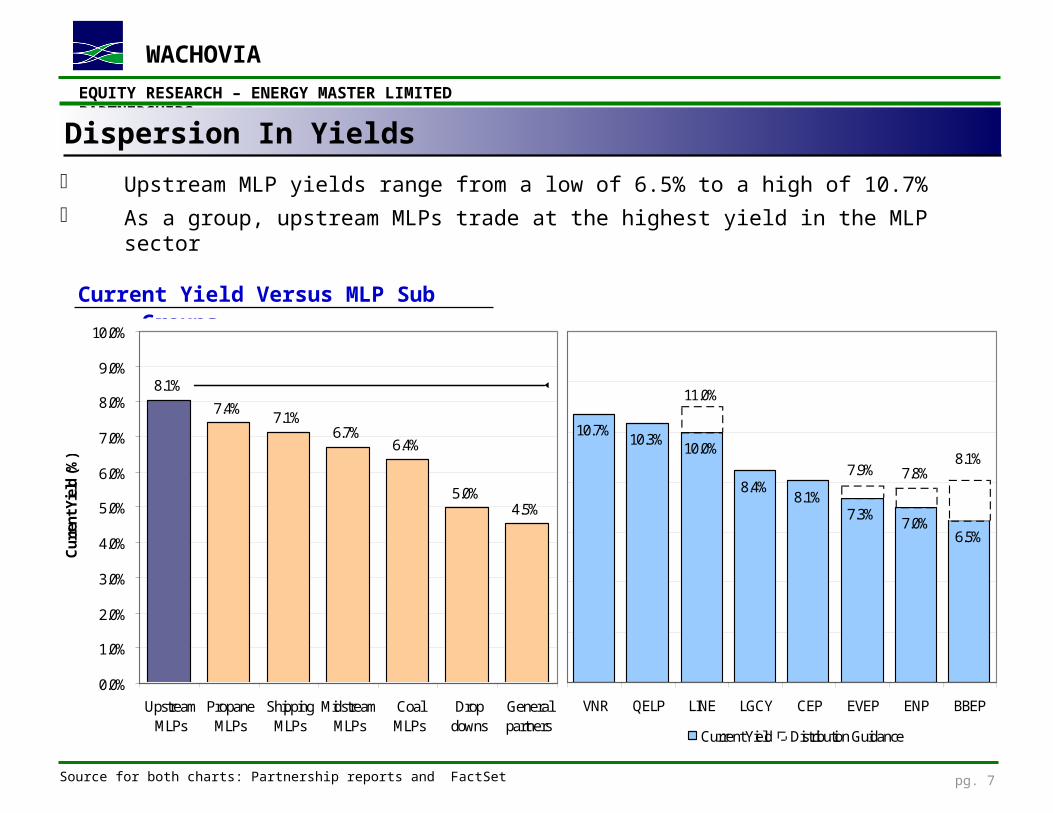
Upstream MLP yields range from a low of 6.5% to a high of 10.7% As a group, upstream MLPs trade at the highest yield in the MLP sector
Dispersion In Yields
Source for both charts: Partnership reports and FactSet
Current Yield Versus MLP Sub Groups
8.1%
7.4%7.1%
6.7%6.4%
5.0%4.5%
0.0%
1.0%
2.0%
3.0%
4.0%
5.0%
6.0%
7.0%
8.0%
9.0%
10.0%
UpstreamMLPs
PropaneMLPs
ShippingMLPs
MidstreamMLPs
CoalMLPs
Dropdowns
Generalpartners
Cur
rent
Yie
ld (%
)
10.7%10.3%
10.0%
8.4%8.1%
7.3%7.0%
6.5%
11.0%
8.1%7.8%7.9%
VNR QELP LINE LGCY CEP EVEP ENP BBEP
Current Yield Distribution Guidance
EQUITY RESEARCH – ENERGY MASTER LIMITED PARTNERSHIPS
WACHOVIA
pg. 8
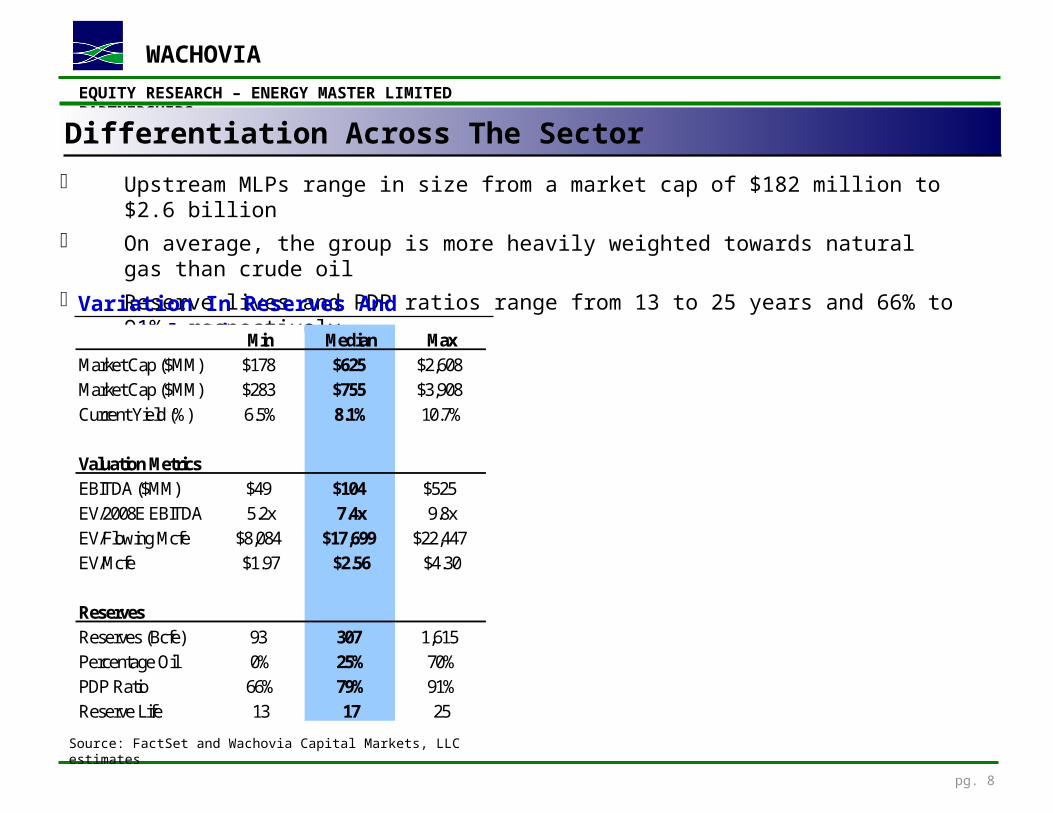
Upstream MLPs range in size from a market cap of $182 million to $2.6 billion On average, the group is more heavily weighted towards natural gas than crude oil Reserve lives and PDP ratios range from 13 to 25 years and 66% to 91%, respectively
Differentiation Across The Sector
Source: FactSet and Wachovia Capital Markets, LLC estimates
Variation In Reserves And ValuationMin Median Max
Market Cap ($MM) $178 $625 $2,608Market Cap ($MM) $283 $755 $3,908Current Yield (%) 6.5% 8.1% 10.7%
Valuation MetricsEBITDA ($MM) $49 $104 $525EV/2008E EBITDA 5.2x 7.4x 9.8xEV/Flowing Mcfe $8,084 $17,699 $22,447EV/Mcfe $1.97 $2.56 $4.30
ReservesReserves (Bcfe) 93 307 1,615Percentage Oil 0% 25% 70%PDP Ratio 66% 79% 91%Reserve Life 13 17 25
EQUITY RESEARCH – ENERGY MASTER LIMITED PARTNERSHIPS
WACHOVIA
pg. 9
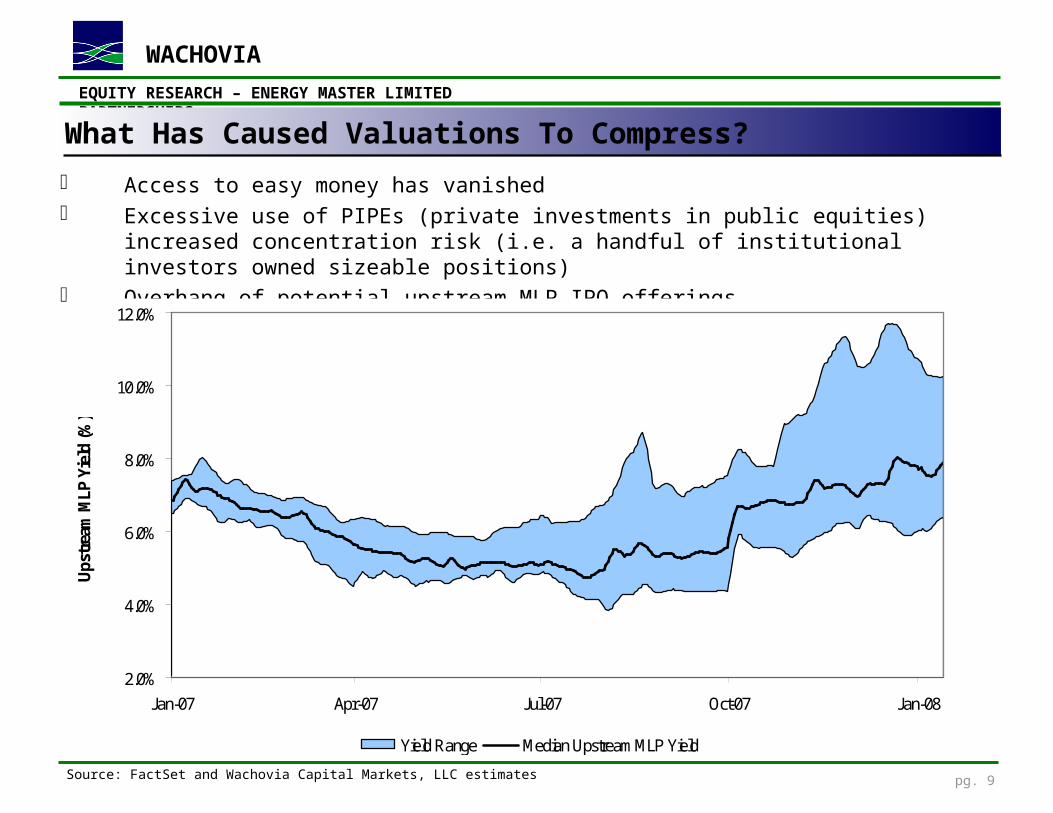
Access to easy money has vanished Excessive use of PIPEs (private investments in public equities) increased concentration risk (i.e. a handful of
institutional investors owned sizeable positions) Overhang of potential upstream MLP IPO offerings
What Has Caused Valuations To Compress?
Source: FactSet and Wachovia Capital Markets, LLC estimates
2.0%
4.0%
6.0%
8.0%
10.0%
12.0%
Jan-07 Apr-07 Jul-07 Oct-07 Jan-08
Ups
trea
m M
LP Y
ield
(%)
Yield Range Median Upstream MLP Yield
EQUITY RESEARCH – ENERGY MASTER LIMITED PARTNERSHIPS
WACHOVIA
pg. 10
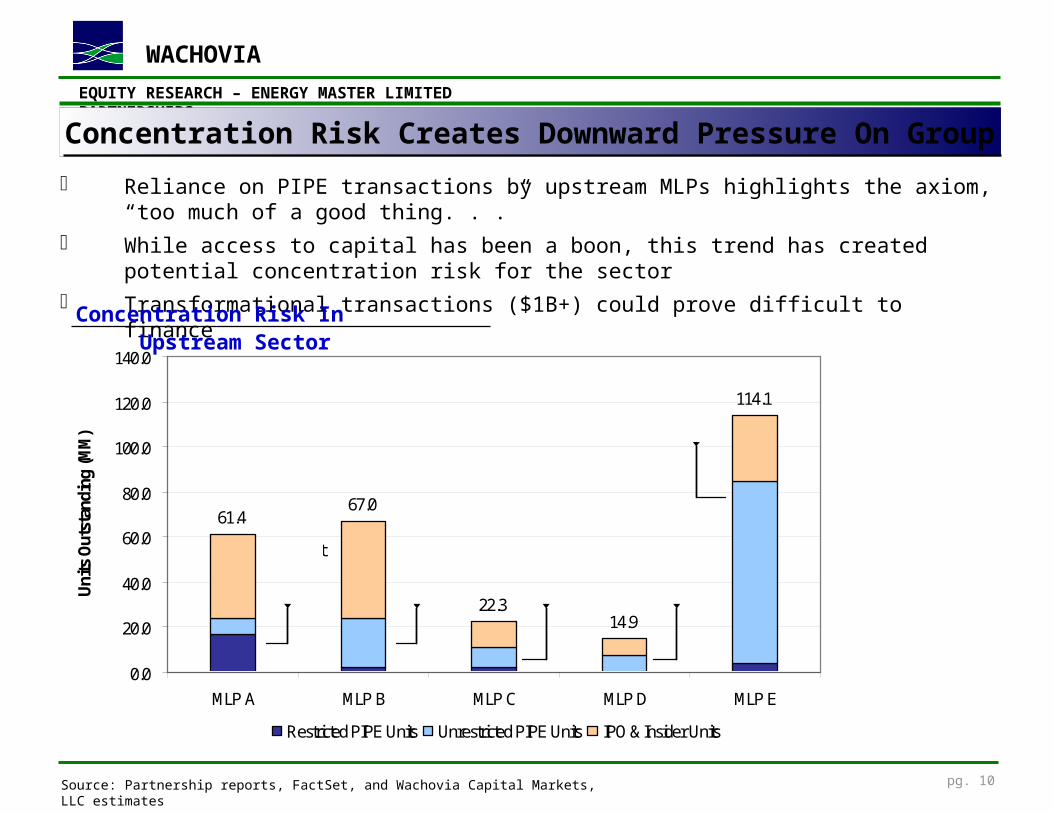
61.467.0
22.314.9
114.1
0.0
20.0
40.0
60.0
80.0
100.0
120.0
140.0
MLP A MLP B MLP C MLP D MLP E
Uni
ts O
utst
andi
ng (M
M)
Restricted PIPE Units Unrestricted PIPE Units IPO & Insider Units
PIPES represent
39% of total units
35% of total units
48% of total units
49% of total units
74% of total units
Concentration Risk Creates Downward Pressure On Group
Reliance on PIPE transactions by upstream MLPs highlights the axiom, “too much of a good thing. . .” While access to capital has been a boon, this trend has created potential concentration risk for the sector Transformational transactions ($1B+) could prove difficult to finance
Source: Partnership reports, FactSet, and Wachovia Capital Markets, LLC estimates
Concentration Risk In Upstream Sector

EQUITY RESEARCH – ENERGY MASTER LIMITED PARTNERSHIPS
WACHOVIA
pg. 11
Upstream MLPs29%
Midstream50%
Other21%
Source for both charts: Partnership reports
2007 Was A Record Year For Equity Issuances
Equity Offerings By Sector
Historical Equity Offerings
MLPs raised approximately $14.6B of equity in 2007, versus $9.4B in 2006 and $5.6B in 2005 Approximately 59% of the equity raised in 2007 was via PIPE transactions Upstream MLPs raised $4.2B of equity in 2007, of which $3.7B was via PIPE transactions
$1,379$3,028
$8,549
$2,981
$4,598
$5,610
$9,415
$14,558
$3,756
$2,823
$1,259
$2,836
$3,781
$2,972
$0
$2,500
$5,000
$7,500
$10,000
$12,500
$15,000
2004 2005 2006 2007
Gro
ss E
quity
Pro
ceed
s ($
MM
)
IPOs Private Placements Public Secondaries
EQUITY RESEARCH – ENERGY MASTER LIMITED PARTNERSHIPS
WACHOVIA
pg. 12
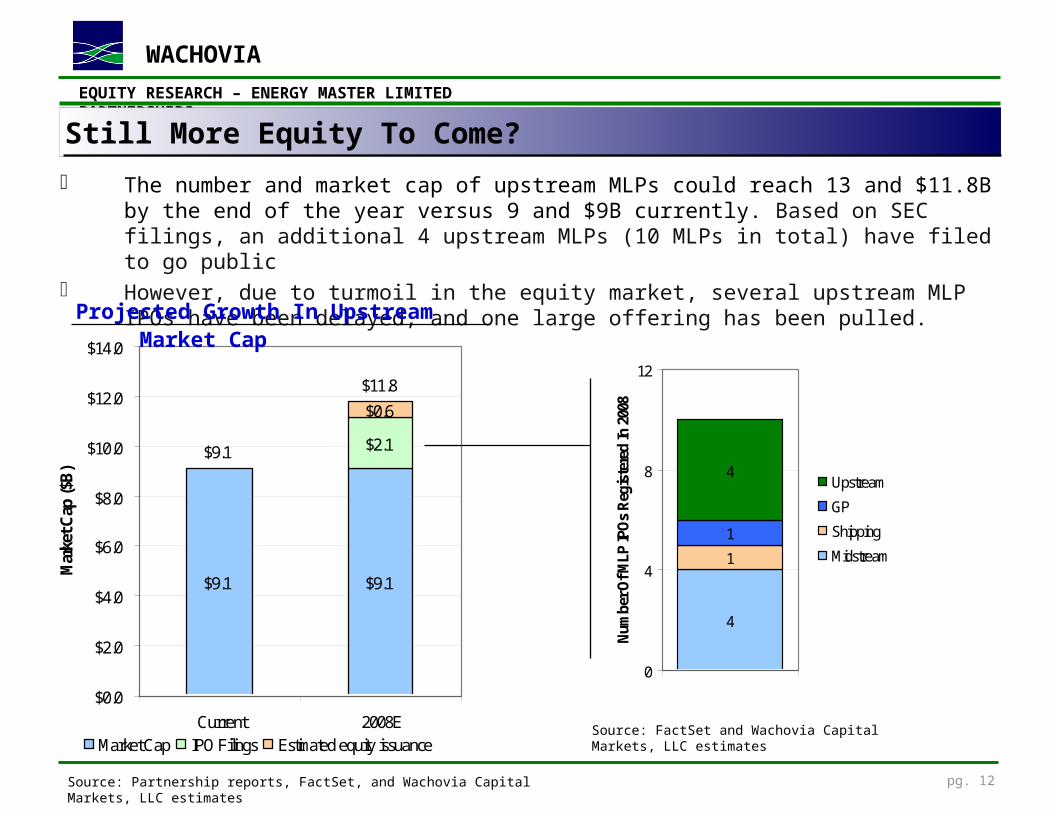
$9.1
$2.1
$0.6
$9.1
$11.8
$9.1
$0.0
$2.0
$4.0
$6.0
$8.0
$10.0
$12.0
$14.0
Current 2008E
Mar
ket C
ap ($
B)
Market Cap IPO Filings Estimated equity issuance
The number and market cap of upstream MLPs could reach 13 and $11.8B by the end of the year versus 9 and $9B currently. Based on SEC filings, an additional 4 upstream MLPs (10 MLPs in total) have filed to go public
However, due to turmoil in the equity market, several upstream MLP IPOs have been delayed, and one large offering has been pulled.
Still More Equity To Come?
Source: Partnership reports, FactSet, and Wachovia Capital Markets, LLC estimates
Source: FactSet and Wachovia Capital Markets, LLC estimates
Projected Growth In Upstream Market Cap
4
1
1
4
0
4
8
12
Num
ber O
f MLP
IPO
s R
egis
tere
d In
200
8
Upstream
GP
Shipping
Midstream
EQUITY RESEARCH – ENERGY MASTER LIMITED PARTNERSHIPS
WACHOVIA
pg. 13
$2.3
0
$2.3
6 $2.6
8
$1.4
3
$3.8
0
$1.7
3
$2.4
2
$2.3
2
$2.3
8$2.5
9
$2.1
8 $2.4
4
$1.3
8
$3.4
9
$1.6
8
$2.4
3
$1.7
1
$2.6
1
$2.2
0
$1.7
7
$2.2
5
$1.4
0
$2.2
4
$1.7
2
$2.2
8
$1.6
0
$1.7
0
$0.00
$0.50
$1.00
$1.50
$2.00
$2.50
$3.00
$3.50
$4.00
$4.50
MLP A MLP B MLP C MLP D MLP E MLP F MLP G MLP H MLP I
$ Pe
r Uni
t
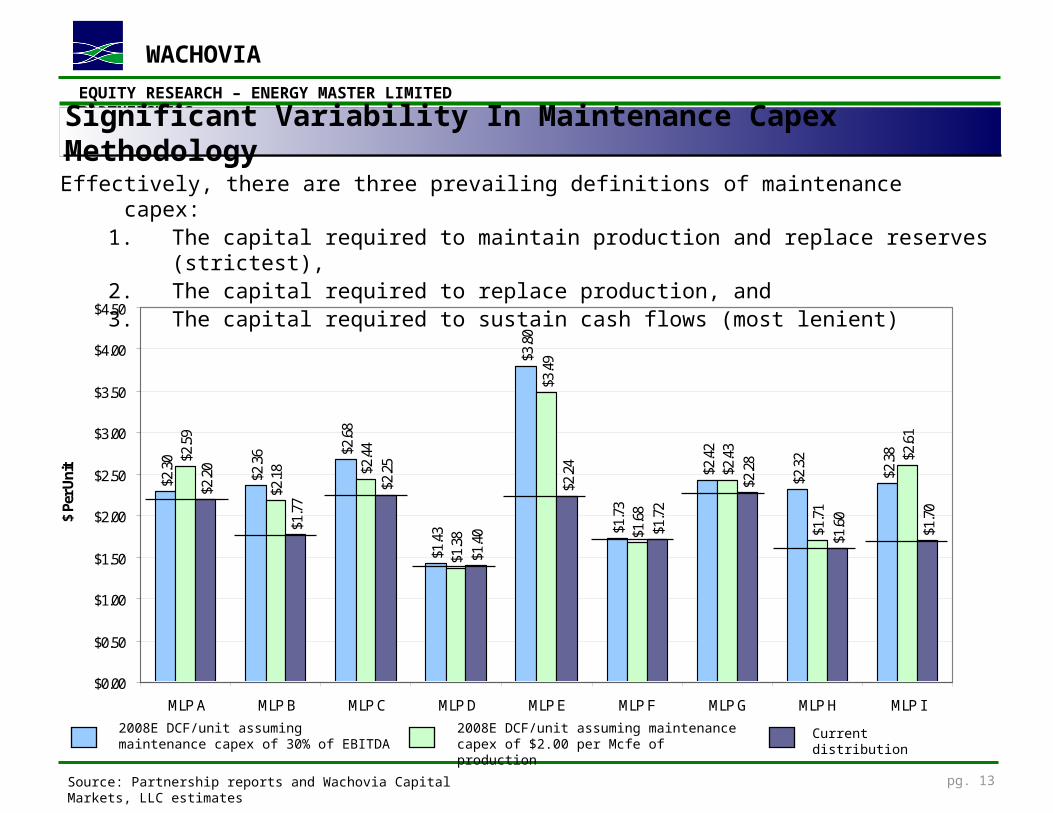
Effectively, there are three prevailing definitions of maintenance capex: 1. The capital required to maintain production and replace reserves (strictest), 2. The capital required to replace production, and 3. The capital required to sustain cash flows (most lenient)
Significant Variability In Maintenance Capex Methodology
Source: Partnership reports and Wachovia Capital Markets, LLC estimates
2008E DCF/unit assuming maintenance capex of 30% of EBITDA
2008E DCF/unit assuming maintenance capex of $2.00 per Mcfe of production
Current distribution
EQUITY RESEARCH – ENERGY MASTER LIMITED PARTNERSHIPS
WACHOVIA
pg. 14
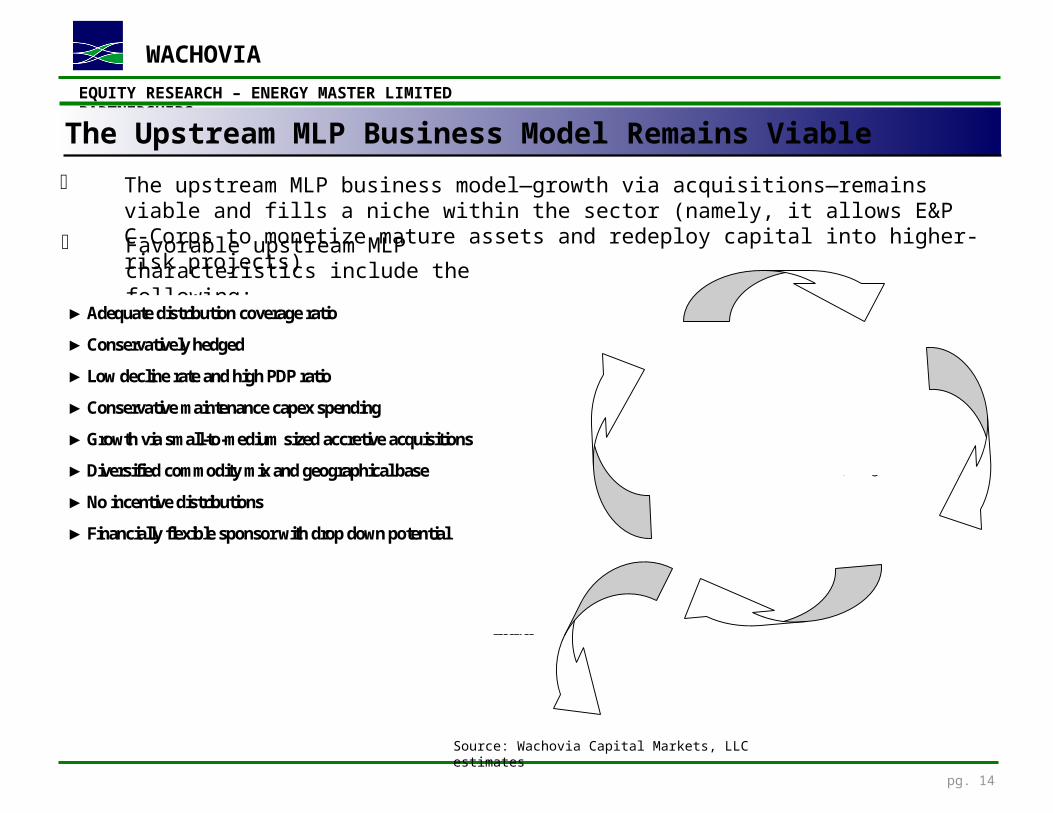
The upstream MLP business model—growth via acquisitions—remains viable and fills a niche within the sector (namely, it allows E&P C-Corps to monetize mature assets and redeploy capital into higher-risk projects)
The Upstream MLP Business Model Remains Viable
Source: Wachovia Capital Markets, LLC estimates
Oil & Gas Company (C-Corp) discovers new
reserves via exploratory drilling
Oil & Gas Company develops reserves and captures higher initial
production and cash flow (and higher decline rates)
Oil & Gas Company sells the mature reserves to an Upstream MLP after production rates have declined to a more manageable
and stable level (5-6%)
Oil & Gas Company redeploys capital
received from MLP
Common unitholders receive distributions
Upstream MLP distributes predictable cash flow to unitholders from proved
developed producing reserves
Favorable upstream MLP characteristics include the following:
►Adequate distribution coverage ratio
►Conservatively hedged
►Low decline rate and high PDP ratio
►Conservative maintenance capex spending
►Growth via small-to-medium sized accretive acquisitions
►Diversified commodity mix and geographical base
►No incentive distributions
►Financially flexible sponsor with drop down potential
EQUITY RESEARCH – ENERGY MASTER LIMITED PARTNERSHIPS
WACHOVIA
pg. 15
$0
$20
$40
$60
$80
$100
$120
2000 2001 2002 2003 2004 2005 2006 2007 2008
Fron
t Mon
th N
YMEX
Cru
de O
il Pr
ice
($/B
bl)
$0
$2
$4
$6
$8
$10
$12
$14
$16
2000 2001 2002 2003 2004 2005 2006 2007 2008
Fron
t Mon
th N
YMEX
Nat
ural
Gas
Pric
e ($
/Mcf
e)
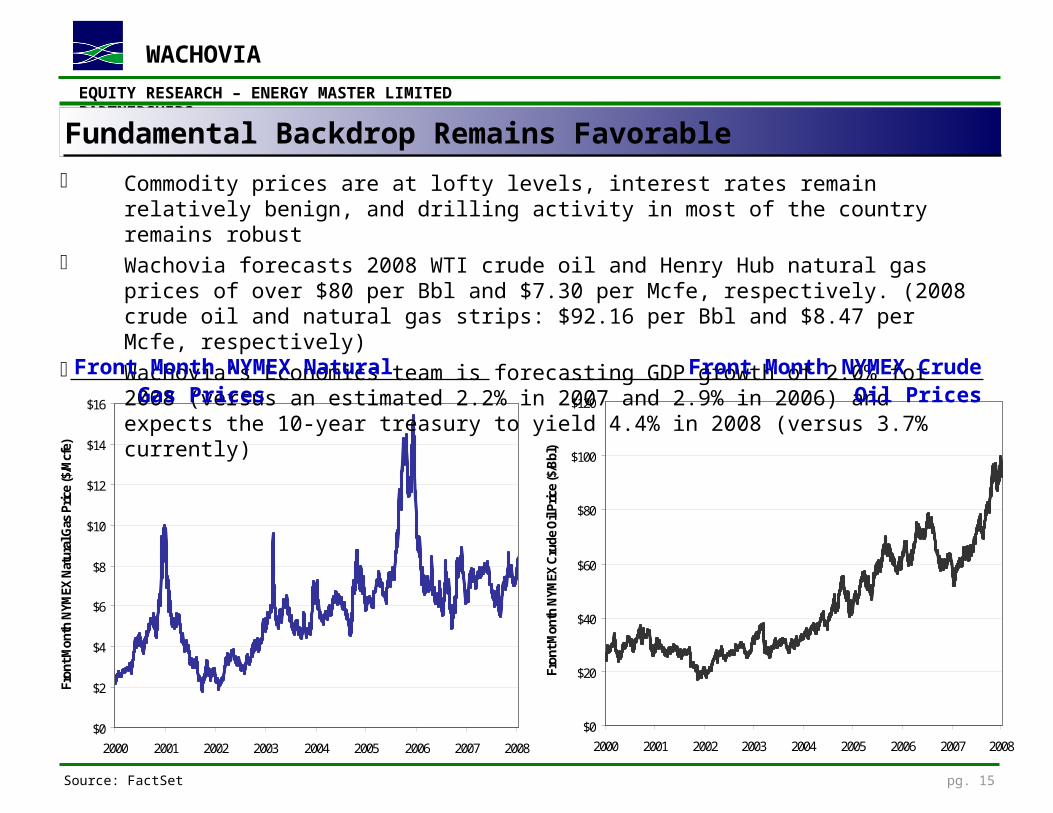
Commodity prices are at lofty levels, interest rates remain relatively benign, and drilling activity in most of the country remains robust
Wachovia forecasts 2008 WTI crude oil and Henry Hub natural gas prices of over $80 per Bbl and $7.30 per Mcfe, respectively. (2008 crude oil and natural gas strips: $92.16 per Bbl and $8.47 per Mcfe, respectively)
Wachovia’s Economics team is forecasting GDP growth of 2.0% for 2008 (versus an estimated 2.2% in 2007 and 2.9% in 2006) and expects the 10-year treasury to yield 4.4% in 2008 (versus 3.7% currently)
Source: FactSet
Fundamental Backdrop Remains Favorable
Front Month NYMEX Natural Gas Prices Front Month NYMEX Crude Oil Prices
EQUITY RESEARCH – ENERGY MASTER LIMITED PARTNERSHIPS
WACHOVIA
pg. 16
$101
$256$121
$1,521
$2,470
$172
$1,521
$70
$880
$0
$600
$1,200
$1,800
$2,400
$3,000
Jan Feb Mar Apr May Jun Jul Aug Sep Oct Nov Dec
Ups
trea
m M
LP A
cqui
sitio
n Sp
endi
ng, $
MM
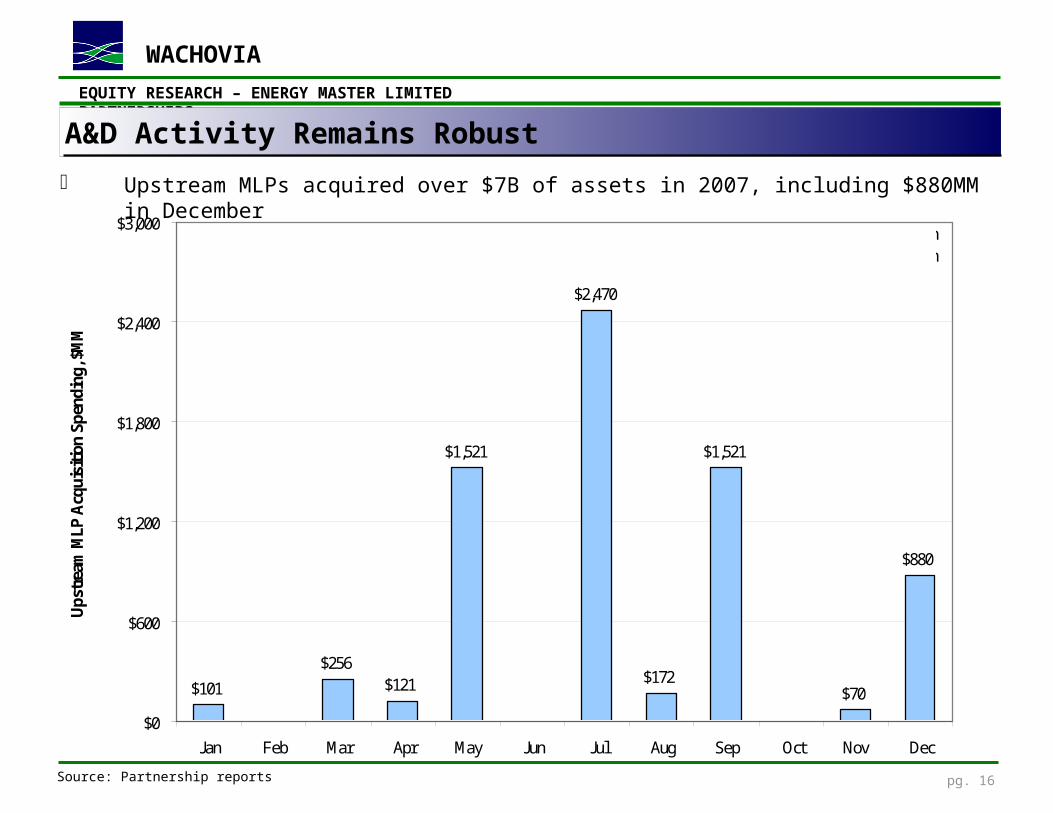
Median size: $84 millionLargest acq: $2.1 billionNo. of transactions: 28Price per Mcfe: $2.31
Upstream MLPs acquired over $7B of assets in 2007, including $880MM in December
A&D Activity Remains Robust
Source: Partnership reports
EQUITY RESEARCH – ENERGY MASTER LIMITED PARTNERSHIPS
WACHOVIA
pg. 17
$2,602
$603$483
$337$174 $156
$2,757
$1.95
$2.27
$2.58 $2.59
$2.13$2.25
$1.81
$0
$500
$1,000
$1,500
$2,000
$2,500
$3,000
Antrim Shale Midcontinent West Texas CherokeeBasin
Other TexasPanhandle
Appalachia
Tota
l ($M
M)
$0.00
$0.50
$1.00
$1.50
$2.00
$2.50
$3.00
Ave
rage
Pric
e / M
cfe
Mul
tiple
Total Acquisition Spending (Left Axis) Price / Mcfe (Right Axis)
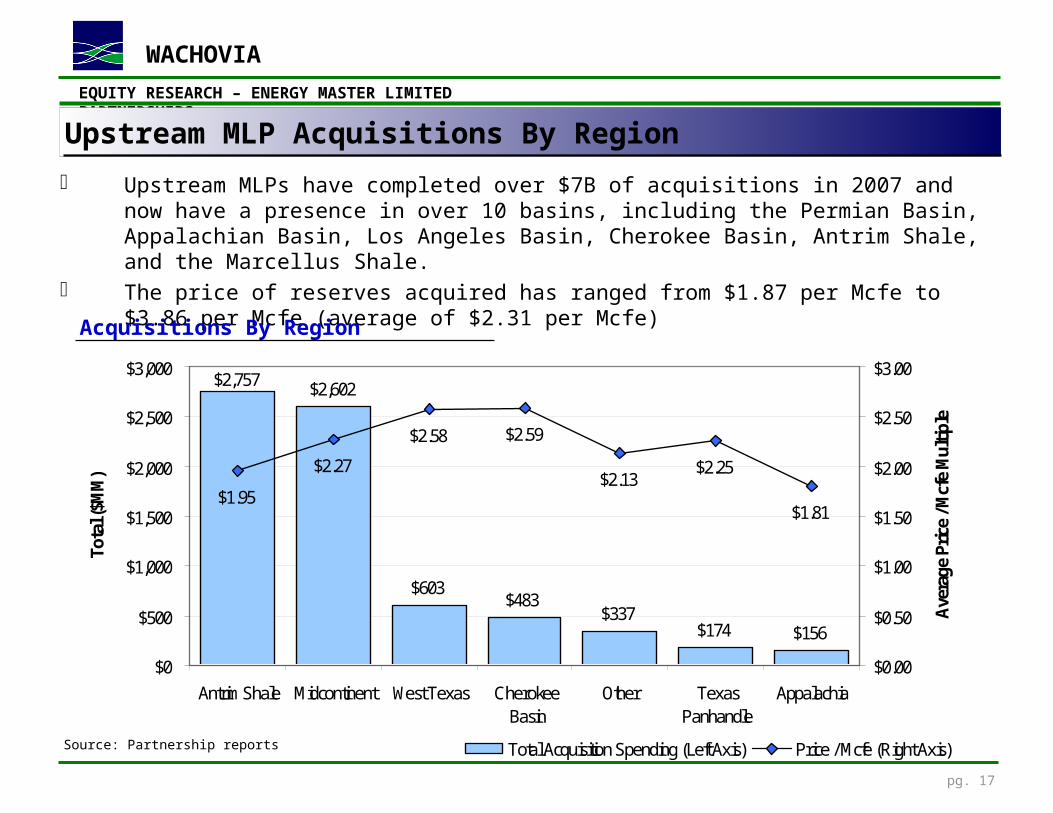
Upstream MLPs have completed over $7B of acquisitions in 2007 and now have a presence in over 10 basins, including the Permian Basin, Appalachian Basin, Los Angeles Basin, Cherokee Basin, Antrim Shale, and the Marcellus Shale.
The price of reserves acquired has ranged from $1.87 per Mcfe to $3.86 per Mcfe (average of $2.31 per Mcfe)
Upstream MLP Acquisitions By Region
Source: Partnership reports
Acquisitions By Region
EQUITY RESEARCH – ENERGY MASTER LIMITED PARTNERSHIPS
WACHOVIA
pg. 18
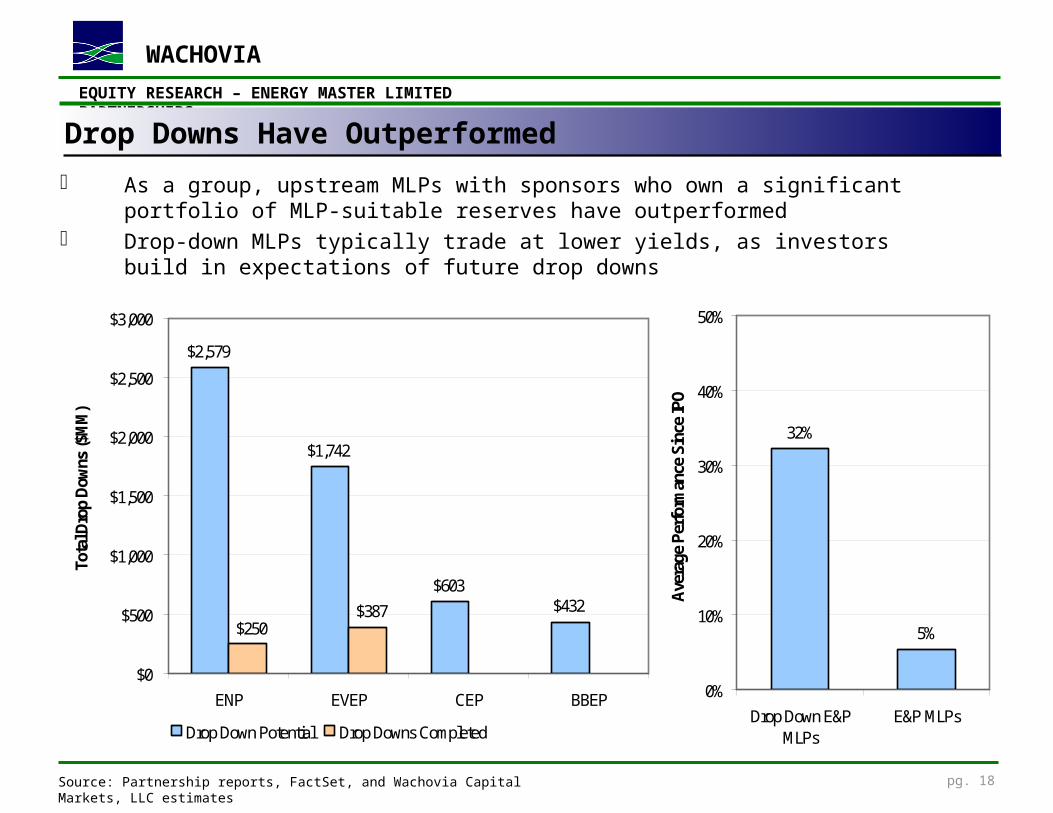
As a group, upstream MLPs with sponsors who own a significant portfolio of MLP-suitable reserves have outperformed
Drop-down MLPs typically trade at lower yields, as investors build in expectations of future drop downs
Drop Downs Have Outperformed
Source: Partnership reports, FactSet, and Wachovia Capital Markets, LLC estimates
$2,579
$1,742
$603$432$387
$250
$0
$500
$1,000
$1,500
$2,000
$2,500
$3,000
ENP EVEP CEP BBEP
Tota
l Dro
p D
owns
($M
M)
Drop Down Potential Drop Downs Completed
32%
5%
0%
10%
20%
30%
40%
50%
Drop Down E&PMLPs
E&P MLPs
Ave
rage
Per
form
ance
Sin
ce IP
O
EQUITY RESEARCH – ENERGY MASTER LIMITED PARTNERSHIPS
WACHOVIA
pg. 19
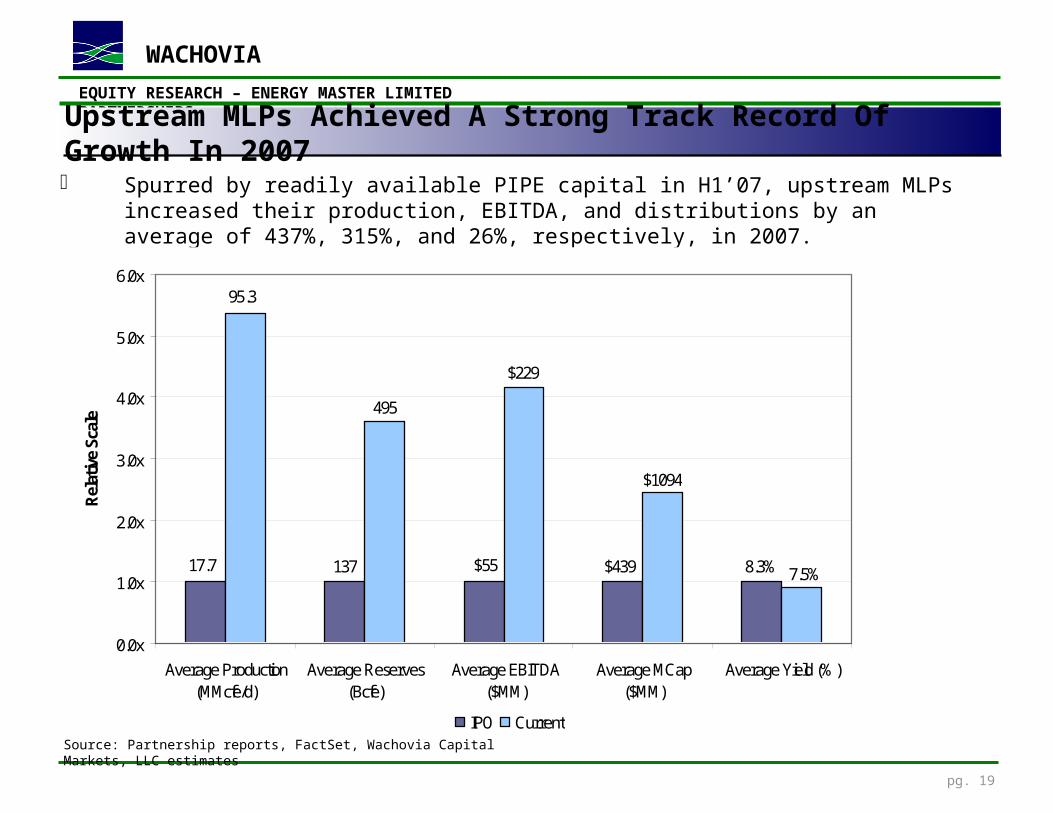
Spurred by readily available PIPE capital in H1’07, upstream MLPs increased their production, EBITDA, and distributions by an average of 437%, 315%, and 26%, respectively, in 2007.
Upstream MLPs Achieved A Strong Track Record Of Growth In 2007
Source: Partnership reports, FactSet, Wachovia Capital Markets, LLC estimates
17.7 $55137 $439 8.3%
95.3
$229
$1094
495
7.5%
0.0x
1.0x
2.0x
3.0x
4.0x
5.0x
6.0x
Average Production(MMcfe/d)
Average Reserves(Bcfe)
Average EBITDA($MM)
Average MCap($MM)
Average Yield (% )
Rel
ativ
e Sc
ale
IPO Current
EQUITY RESEARCH – ENERGY MASTER LIMITED PARTNERSHIPS
WACHOVIA
pg. 20
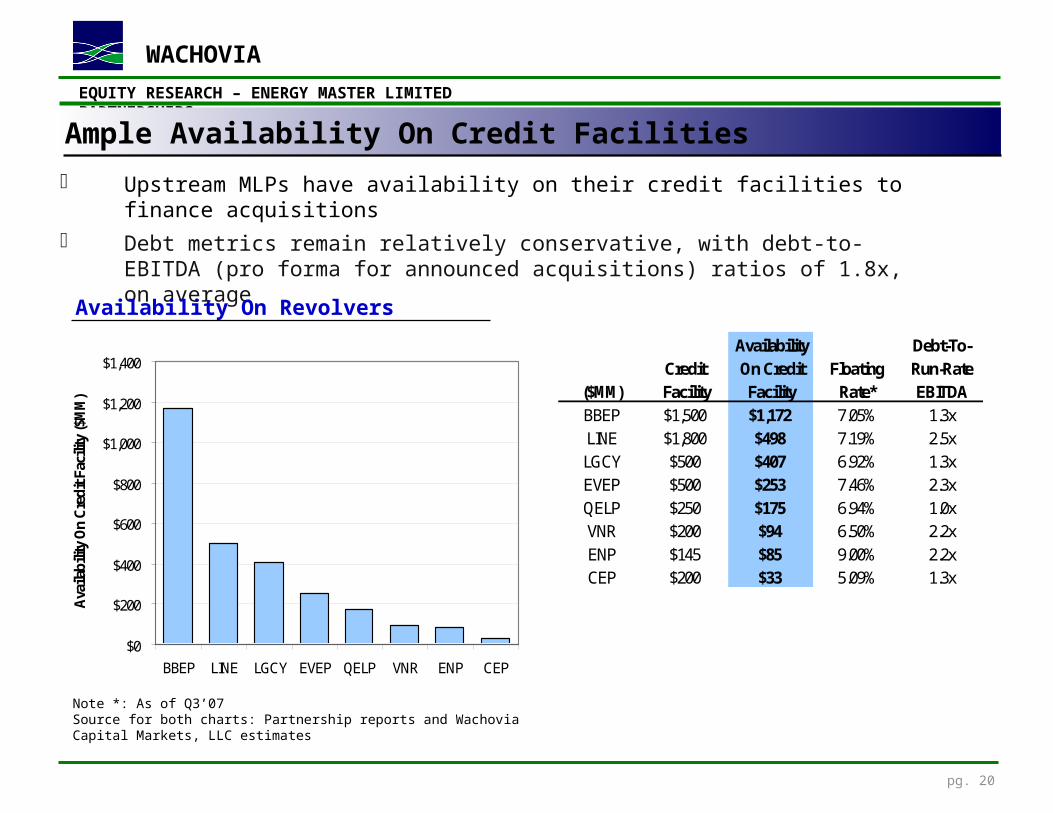
Upstream MLPs have availability on their credit facilities to finance acquisitions Debt metrics remain relatively conservative, with debt-to-EBITDA (pro forma for announced
acquisitions) ratios of 1.8x, on average
Ample Availability On Credit Facilities
Note *: As of Q3’07Source for both charts: Partnership reports and Wachovia Capital Markets, LLC estimates
Availability On Revolvers
Availability Debt-To-Credit On Credit Floating Run-Rate
($MM) Facility Facility Rate* EBITDABBEP $1,500 $1,172 7.05% 1.3xLINE $1,800 $498 7.19% 2.5xLGCY $500 $407 6.92% 1.3xEVEP $500 $253 7.46% 2.3xQELP $250 $175 6.94% 1.0xVNR $200 $94 6.50% 2.2xENP $145 $85 9.00% 2.2xCEP $200 $33 5.09% 1.3x
$0
$200
$400
$600
$800
$1,000
$1,200
$1,400
BBEP LINE LGCY EVEP QELP VNR ENP CEP
Ava
ilabi
lity
On
Cre
dit F
acili
ty ($
MM
)
EQUITY RESEARCH – ENERGY MASTER LIMITED PARTNERSHIPS
WACHOVIA
pg. 21Source: FactSet and Wachovia Capital Markets, LLC estimates
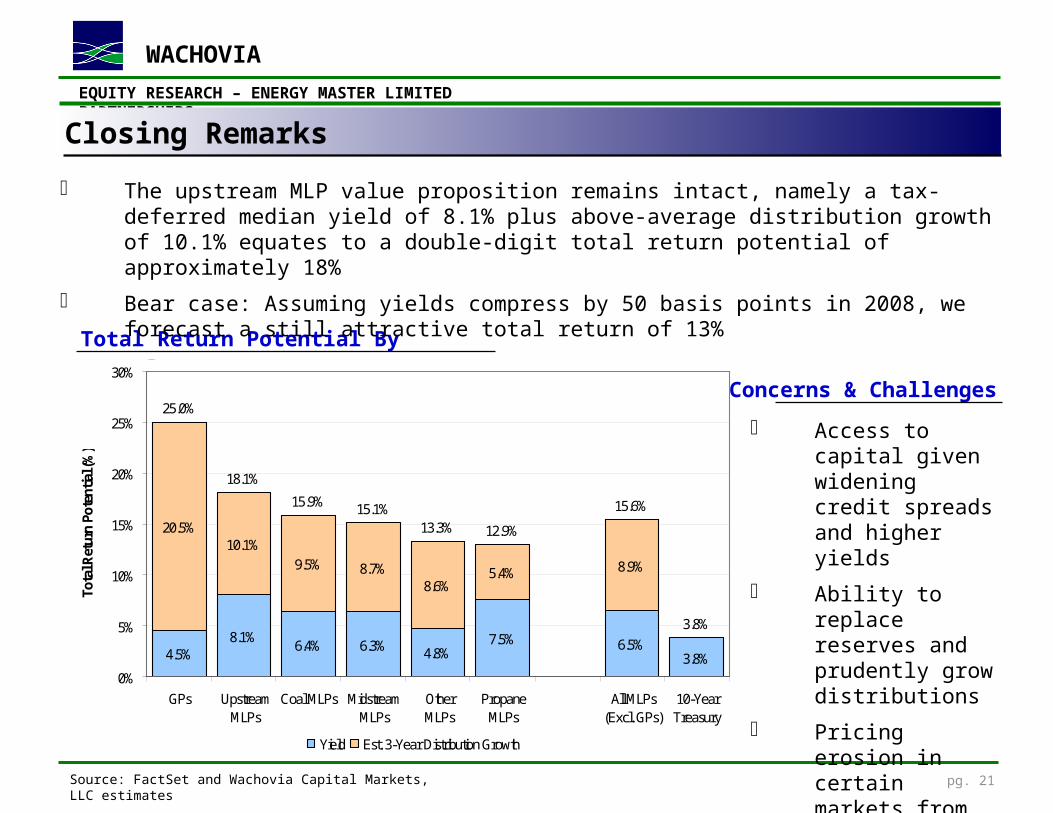
Closing Remarks
Total Return Potential By Sector
Higher Risk
The upstream MLP value proposition remains intact, namely a tax-deferred median yield of 8.1% plus above-average distribution growth of 10.1% equates to a double-digit total return potential of approximately 18%
Bear case: Assuming yields compress by 50 basis points in 2008, we forecast a still attractive total return of 13%
Concerns & Challenges
Access to capital given widening credit spreads and higher yields
Ability to replace reserves and prudently grow distributions
Pricing erosion in certain markets from the start-up of Rockies Express
4.5%8.1%
6.4% 6.3% 4.8%7.5% 6.5%
3.8%
20.5%10.1%
9.5% 8.7%8.6%
5.4% 8.9%
25.0%
18.1%
15.9% 15.1%13.3% 12.9%
15.6%
3.8%
0%
5%
10%
15%
20%
25%
30%
GPs UpstreamMLPs
Coal MLPs MidstreamMLPs
OtherMLPs
PropaneMLPs
All MLPs(Excl. GPs)
10-YearTreasury
Tota
l Ret
urn
Pote
ntia
l (%
)
Yield Est. 3-Year Distribution Growth
EQUITY RESEARCH – ENERGY MASTER LIMITED PARTNERSHIPS
WACHOVIA
pg. 22
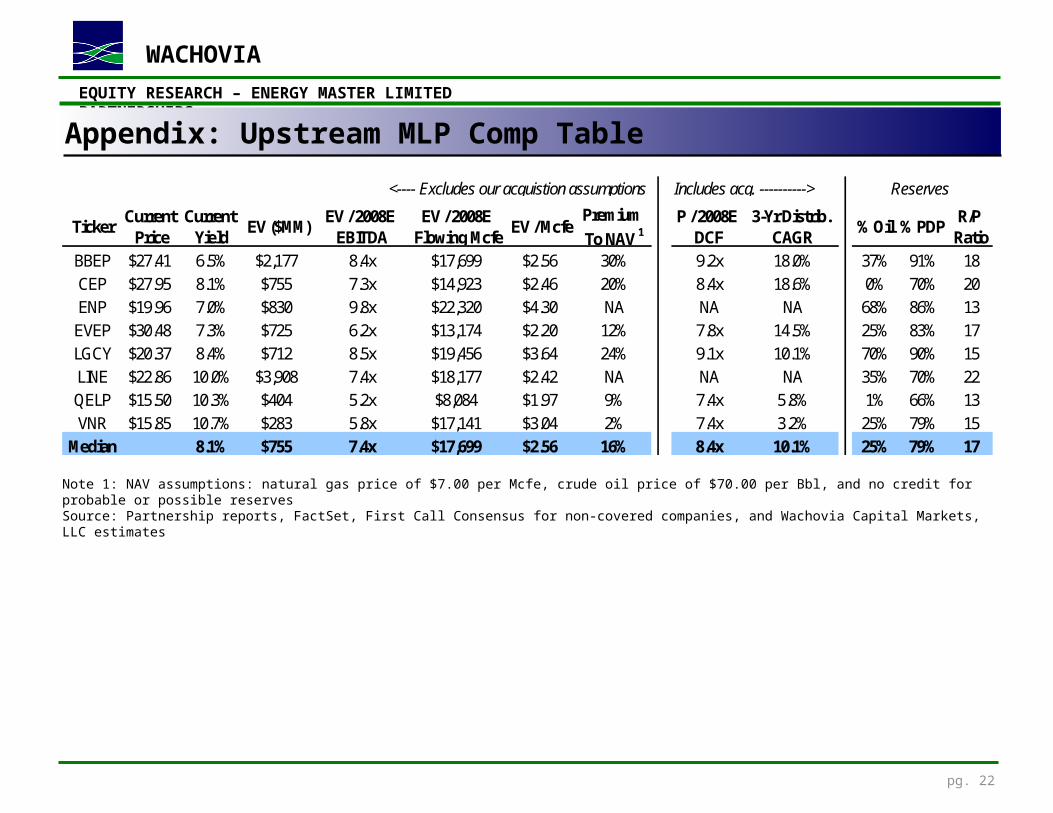
Appendix: Upstream MLP Comp Table
Note 1: NAV assumptions: natural gas price of $7.00 per Mcfe, crude oil price of $70.00 per Bbl, and no credit for probable or possible reservesSource: Partnership reports, FactSet, First Call Consensus for non-covered companies, and Wachovia Capital Markets, LLC estimates
<---- Excludes our acquistion assumptions Includes acq. ----------> Reserves Maintenance capex
TickerCurrent
PriceCurrent
YieldEV ($MM)
EV / 2008E EBITDA
EV / 2008E Flowing Mcfe
EV / McfePremium
To NAV 1P / 2008E
DCF3-Yr Distrib.
CAGR% Oil % PDP
R/P Ratio
BBEP $27.41 6.5% $2,177 8.4x $17,699 $2.56 30% 9.2x 18.0% 37% 91% 18CEP $27.95 8.1% $755 7.3x $14,923 $2.46 20% 8.4x 18.6% 0% 70% 20ENP $19.96 7.0% $830 9.8x $22,320 $4.30 NA NA NA 68% 86% 13
EVEP $30.48 7.3% $725 6.2x $13,174 $2.20 12% 7.8x 14.5% 25% 83% 17LGCY $20.37 8.4% $712 8.5x $19,456 $3.64 24% 9.1x 10.1% 70% 90% 15LINE $22.86 10.0% $3,908 7.4x $18,177 $2.42 NA NA NA 35% 70% 22QELP $15.50 10.3% $404 5.2x $8,084 $1.97 9% 7.4x 5.8% 1% 66% 13VNR $15.85 10.7% $283 5.8x $17,141 $3.04 2% 7.4x 3.2% 25% 79% 15
Median 8.1% $755 7.4x $17,699 $2.56 16% 8.4x 10.1% 25% 79% 17
EQUITY RESEARCH – ENERGY MASTER LIMITED PARTNERSHIPS
WACHOVIA
pg. 23
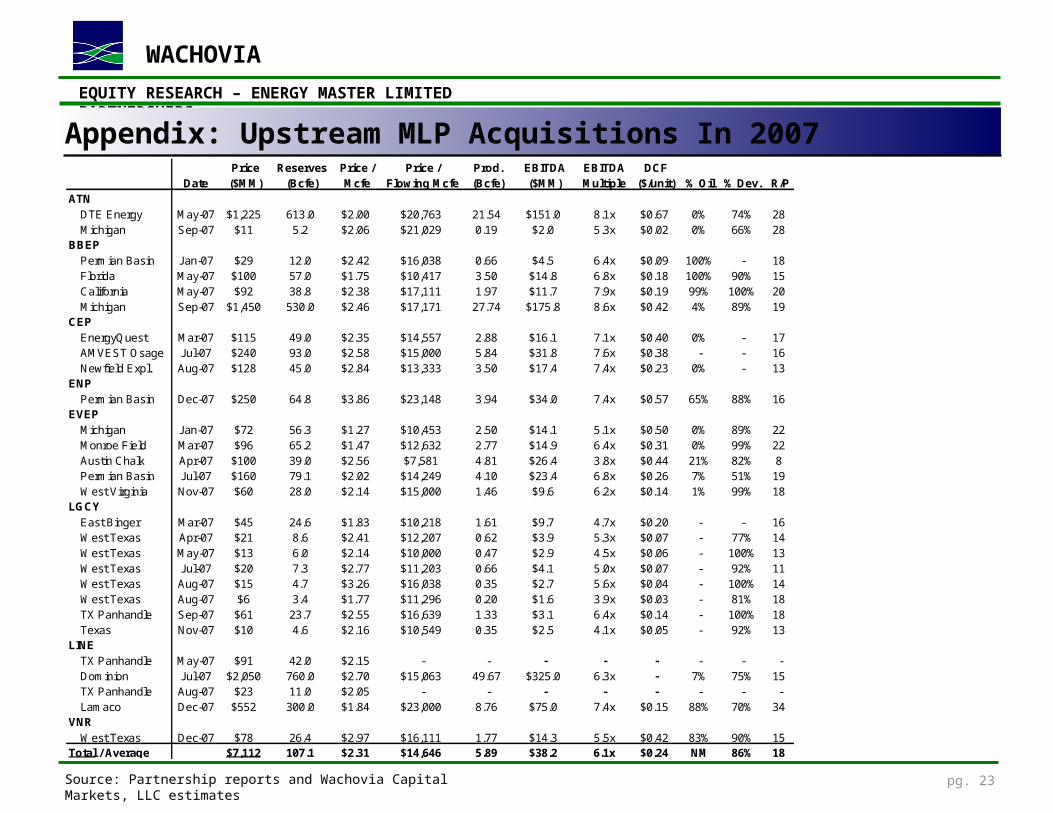
Appendix: Upstream MLP Acquisitions In 2007
Source: Partnership reports and Wachovia Capital Markets, LLC estimates
Price Reserves Price / Price / Prod. EBITDA EBITDA DCFDate ($MM) (Bcfe) Mcfe Flowing Mcfe (Bcfe) ($MM) Multiple ($/unit) % Oil % Dev. R/P
ATNDTE Energy May-07 $1,225 613.0 $2.00 $20,763 21.54 $151.0 8.1x $0.67 0% 74% 28Michigan Sep-07 $11 5.2 $2.06 $21,029 0.19 $2.0 5.3x $0.02 0% 66% 28
BBEPPermian Basin Jan-07 $29 12.0 $2.42 $16,038 0.66 $4.5 6.4x $0.09 100% - 18Florida May-07 $100 57.0 $1.75 $10,417 3.50 $14.8 6.8x $0.18 100% 90% 15California May-07 $92 38.8 $2.38 $17,111 1.97 $11.7 7.9x $0.19 99% 100% 20Michigan Sep-07 $1,450 530.0 $2.46 $17,171 27.74 $175.8 8.6x $0.42 4% 89% 19
CEPEnergyQuest Mar-07 $115 49.0 $2.35 $14,557 2.88 $16.1 7.1x $0.40 0% - 17AMVEST Osage Jul-07 $240 93.0 $2.58 $15,000 5.84 $31.8 7.6x $0.38 - - 16Newfield Expl. Aug-07 $128 45.0 $2.84 $13,333 3.50 $17.4 7.4x $0.23 0% - 13
ENPPermian Basin Dec-07 $250 64.8 $3.86 $23,148 3.94 $34.0 7.4x $0.57 65% 88% 16
EVEPMichigan Jan-07 $72 56.3 $1.27 $10,453 2.50 $14.1 5.1x $0.50 0% 89% 22Monroe Field Mar-07 $96 65.2 $1.47 $12,632 2.77 $14.9 6.4x $0.31 0% 99% 22Austin Chalk Apr-07 $100 39.0 $2.56 $7,581 4.81 $26.4 3.8x $0.44 21% 82% 8Permian Basin Jul-07 $160 79.1 $2.02 $14,249 4.10 $23.4 6.8x $0.26 7% 51% 19West Virginia Nov-07 $60 28.0 $2.14 $15,000 1.46 $9.6 6.2x $0.14 1% 99% 18
LGCYEast Binger Mar-07 $45 24.6 $1.83 $10,218 1.61 $9.7 4.7x $0.20 - - 16West Texas Apr-07 $21 8.6 $2.41 $12,207 0.62 $3.9 5.3x $0.07 - 77% 14West Texas May-07 $13 6.0 $2.14 $10,000 0.47 $2.9 4.5x $0.06 - 100% 13West Texas Jul-07 $20 7.3 $2.77 $11,203 0.66 $4.1 5.0x $0.07 - 92% 11West Texas Aug-07 $15 4.7 $3.26 $16,038 0.35 $2.7 5.6x $0.04 - 100% 14West Texas Aug-07 $6 3.4 $1.77 $11,296 0.20 $1.6 3.9x $0.03 - 81% 18TX Panhandle Sep-07 $61 23.7 $2.55 $16,639 1.33 $3.1 6.4x $0.14 - 100% 18Texas Nov-07 $10 4.6 $2.16 $10,549 0.35 $2.5 4.1x $0.05 - 92% 13
LINETX Panhandle May-07 $91 42.0 $2.15 - - - - - - - -Dominion Jul-07 $2,050 760.0 $2.70 $15,063 49.67 $325.0 6.3x - 7% 75% 15TX Panhandle Aug-07 $23 11.0 $2.05 - - - - - - - -Lamaco Dec-07 $552 300.0 $1.84 $23,000 8.76 $75.0 7.4x $0.15 88% 70% 34
VNRWest Texas Dec-07 $78 26.4 $2.97 $16,111 1.77 $14.3 5.5x $0.42 83% 90% 15
Total / Average $7,112 107.1 $2.31 $14,646 5.89 $38.2 6.1x $0.24 NM 86% 18
EQUITY RESEARCH – ENERGY MASTER LIMITED PARTNERSHIPS
WACHOVIA
pg. 24
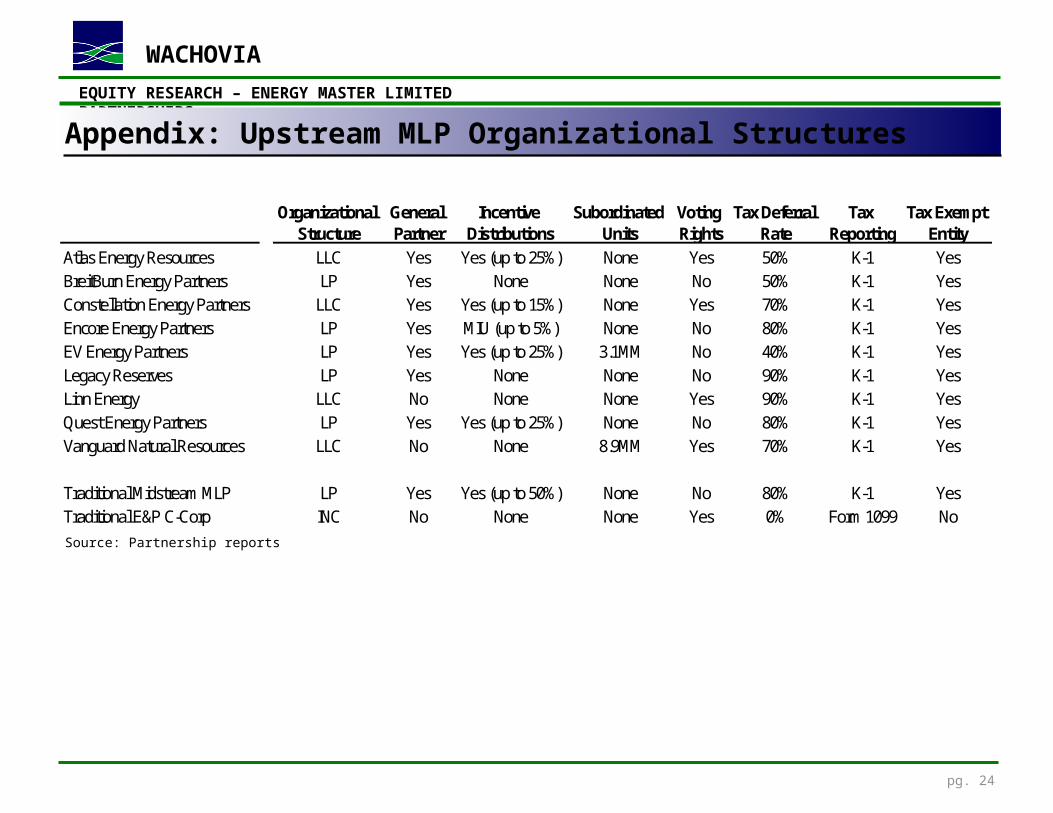
Appendix: Upstream MLP Organizational Structures
Source: Partnership reports
Organizational Structure
General Partner
Incentive Distributions
Subordinated Units
Voting Rights
Tax Deferral Rate
Tax Reporting
Tax Exempt Entity
Atlas Energy Resources LLC Yes Yes (up to 25%) None Yes 50% K-1 YesBreitBurn Energy Partners LP Yes None None No 50% K-1 YesConstellation Energy Partners LLC Yes Yes (up to 15%) None Yes 70% K-1 YesEncore Energy Partners LP Yes MIU (up to 5%) None No 80% K-1 YesEV Energy Partners LP Yes Yes (up to 25%) 3.1MM No 40% K-1 YesLegacy Reserves LP Yes None None No 90% K-1 YesLinn Energy LLC No None None Yes 90% K-1 YesQuest Energy Partners LP Yes Yes (up to 25%) None No 80% K-1 YesVanguard Natural Resources LLC No None 8.9MM Yes 70% K-1 Yes
Traditional Midstream MLP LP Yes Yes (up to 50%) None No 80% K-1 YesTraditional E&P C-Corp INC No None None Yes 0% Form 1099 No
EQUITY RESEARCH – ENERGY MASTER LIMITED PARTNERSHIPS
WACHOVIA
pg. 25
To view price charts for all companies rated in this document, please go to www.wachoviaresearch.com or write to 7 Saint Paul Street, 1st Floor, MD5202, Baltimore, MD 21202
ATTN: Research Publications Additional Information Available Upon Request
I certify that:1) All views expressed in this research report accurately reflect my personal views about any and all of the subject securities or issuers discussed; and
2) No part of my compensation was, is, or will be, directly or indirectly, related to the specific recommendations or views expressed by me in this research report.
Wachovia Capital Markets, LLC maintains a market in the common stock of BreitBurn Energy Partners L.P., EV Energy Partners, L.P., Legacy Reserves, L.P., Quest Energy Partners, L.P.Wachovia Capital Markets, LLC or its affiliates managed or comanaged a public offering of securities for Legacy Reserves, L.P., Quest Energy Partners, L.P., Vanguard Natural Resources, LLC within the past 12 months.Wachovia Capital Markets, LLC or its affiliates intends to seek or expects to receive compensation for investment banking services in the next three months from BreitBurn Energy Partners L.P., Constellation Energy Partners LLC, EV Energy Partners, L.P., Legacy Reserves, L.P., Quest Energy Partners, L.P., Vanguard Natural Resources, LLC.Wachovia Capital Markets, LLC or its affiliates received compensation for investment banking services from BreitBurn Energy Partners L.P., Constellation Energy Partners LLC, EV Energy Partners, L.P., Legacy Reserves, L.P., Quest Energy Partners, L.P., Vanguard Natural Resources, LLC in the past 12 months.Wachovia Capital Markets, LLC and/or its affiliates, have beneficial ownership of 1% or more of any class of the common stock of BreitBurn Energy Partners L.P.BreitBurn Energy Partners L.P., Constellation Energy Partners LLC, EV Energy Partners, L.P., Legacy Reserves, L.P., Quest Energy Partners, L.P., Vanguard Natural Resources, LLC currently is, or during the 12-month period preceding the date of distribution of the research report was, a client of Wachovia Capital Markets, LLC. Wachovia Capital Markets, LLC provided investment banking services to BreitBurn Energy Partners L.P., Constellation Energy Partners LLC, EV Energy Partners, L.P., Legacy Reserves, L.P., Quest Energy Partners, L.P., Vanguard Natural Resources, LLC.Wachovia Capital Markets, LLC received compensation for products or services other than investment banking services from Quest Energy Partners, L.P. in the past 12 months.
Wachovia Capital Markets, LLC does not compensate its research analysts based on specific investment banking transactions. WCM’s research analysts receive compensation that is based upon and impacted by the overall profitability and revenue of the firm, which includes, but is not limited to investment banking revenue.STOCK RATING1 = Outperform: The stock appears attractively valued, and we believe the stock's total return will exceed that of the market over the next 12 months. BUY2 = Market Perform: The stock appears appropriately valued, and we believe the stock's total return will be in line with the market over the next 12 months. HOLD3 = Underperform: The stock appears overvalued, and we believe the stock's total return will be below the market over the next 12 months. SELLSECTOR RATINGO = Overweight: Industry expected to outperform the relevant broad market benchmark over the next 12 months.M = Market Weight: Industry expected to perform in-line with the relevant broad market benchmark over the next 12 months.U = Underweight: Industry expected to underperform the relevant broad market benchmark over the next 12 months.VOLATILITY RATINGV = A stock is defined as volatile if the stock price has fluctuated by +/-20% or greater in at least 8 of the past 24 months or if the analyst expects significant volatility. All IPO stocks are automatically rated volatile within the first 24 months of trading.As of: January 15, 2008
47% of companies covered by Wachovia Equity Research are rated Outperform. Wachovia Capital Markets, LLC has provided investment banking services for 40% of its Equity Research Outperform-rated companies.52% of companies covered by Wachovia Equity Research are rated Market Perform. Wachovia Capital Markets, LLC has provided investment banking services for 32% of its Equity Research Market Perform-rated companies.2% of companies covered by Wachovia Equity Research are rated Underperform. Wachovia Capital Markets, LLC has provided investment banking services for 21% of its Equity Research Underperform-rated companies.
EQUITY RESEARCH – ENERGY MASTER LIMITED PARTNERSHIPS
WACHOVIA
pg. 26
Additional Disclosures For International Clients
For additional disclosure information please go to: www.wachoviaresearch.comThe securities and related financial instruments described herein may not be eligible for sale in all jurisdictions or to certain categories of investors. For certain non-U.S. institutional readers (including readers in the EEA), this report is distributed by Wachovia Securities International Limited. For the purposes of Section 21 of the U.K. Financial Services and Markets Act 2000, this report has been approved by Wachovia Securities International Limited. This research is not intended for, and should not be relied on by, private customers. Please consult your Financial Advisor or the Wachovia Securities office in your area for additional information. U.S. residents are directed to wachovia.com for investment and related services.
For Wachovia Securities International Limited's policy for managing conflicts of interest in connection with research, please go to: www.wachoviaresearch.com/conflicts
Important Information for Japanese RecipientsThis material is distributed in Japan by Wachovia Securities (Japan) Co., Ltd., a foreign securities company registered with the Financial Services Agency in Japan.
Important Information for Australian RecipientsWachovia Capital Markets, LLC ("WCM”) is exempt from the requirements to hold an Australian financial services license in respect of the financial services it provides to wholesale clients in Australia. WCM is a registered broker-dealer registered with the U.S. Securities and Exchange Commission, and a member of the New York Stock Exchange, the National Association of Securities Dealers, Inc. and the Securities Investor Protection Corp. WCM is regulated under U.S. laws which differ from Australian laws. Any offer or documentation provided to you by WCM in the course of providing the financial services will be prepared in accordance with the laws of the United States and not Australian laws.
Additional DisclosuresWCM is a U.S. broker-dealer registered with the U.S. Securities and Exchange Commission and a member of the New York Stock Exchange, the National Association of Securities Dealers, Inc., and the Securities Investor Protection Corp. Wachovia Securities International Limited is a U.K. incorporated investment firm authorized and regulated by the Financial Services Authority.
This report is for your information only and is not an offer to sell, or a solicitation of an offer to buy, the securities or instruments named or described in this report. Interested parties are advised to contact the entity with which they deal, or the entity that provided this report to them, if they desire further information. The information in this report has been obtained or derived from sources believed by Wachovia Capital Markets, LLC, to be reliable, but Wachovia Capital Markets, LLC, does not represent that this information is accurate or complete. Any opinions or estimates contained in this report represent the judgement of Wachovia Capital Markets, LLC, at this time, and are subject to change without notice. Wachovia Capital Markets, LLC, and its affiliates may from time to time provide advice with respect to, acquire, hold, or sell a position in, the securities or instruments named or described in this report. For the purposes of the U.K. Financial Services Authority's rules, this report constitutes impartial investment research. Each of Wachovia Capital Markets, LLC, and Wachovia Securities International Limited is a separate legal entity and distinct from affiliated banks. Copyright © 2008 Wachovia Capital Markets, LLC.
SECURITIES: NOT FDIC-INSURED/NOT BANK-GUARANTEED/MAY LOSE VALUE