Equity Reputazionale e Multicanalità · REPUTAZIONE È UNA VARIABILE DI BREVE-MEDIO-LUNGO TERMINE...
36
Reputation Institute | 20 Years of Reputation Leadership Equity Reputazionale e Multicanalità 2017 Italy RepTrak®: usare i dati per migliorare il ROI della comunicazione Stefano Cini Managing Director Reputation Institute Italia Milano, 6 aprile 2017
Transcript of Equity Reputazionale e Multicanalità · REPUTAZIONE È UNA VARIABILE DI BREVE-MEDIO-LUNGO TERMINE...

1Reputation Institute | 20 Years of Reputation Leadership
Equity Reputazionale e Multicanalità2017 Italy RepTrak®: usare i dati per migliorare il ROI della comunicazione
Stefano CiniManaging Director Reputation Institute Italia
Milano, 6 aprile 2017

2Reputation Institute | 20 Years of Reputation Leadership
REPUTAZIONE NON È UN OPINIONE, È UN ‘HARD FACT’È una variabile misurabile: un nuovo KPI da inserire nel cruscotto aziendale
La Reputazione nell’era della Multicanalità
REPUTAZIONE È UNA LEVA DI BUSINESSImpatta le scelte degli stakeholder e i risultati di business (top/bottom line)
REPUTAZIONE È ISTINTO E RAZIONALITÀIl legame emotivo azienda-stakeholder è mosso da 7 driver “hard” – sia di prodotto sia corporate
REPUTAZIONE È UNA VARIABILE DI BREVE-MEDIO-LUNGO TERMINEÈ un indice sintetico di come l’azienda ha lavorato in passato e delle sue promesse per il futuro
MULTICANALITÀ è la NUOVA NORMALITÀGestire proattivamente la Reputazione significa mixare efficacemente CX + paid, earned e owned media

3Reputation Institute | 20 Years of Reputation Leadership
UK 70,3
86,8
Olanda 66,4
79,7
Germania 73,1
87,1
Svizzera 65,6
82,1
Francia 69,0
81,5
Danimarca 71,8
89,5
Spagna 66,2
83,4
In Europa la Reputazione resiste alla globalizzazione...
Italia
RepTrak® 2017
Stakeholder: Popolazione ItalianaPeriodo di riferimento: Gennaio 2017
Approccio: CAWI# ratings: + 37.000
# aziende misurate: 326

4Reputation Institute | 20 Years of Reputation LeadershipFonte: Reputation Institute – Italy RepTrak® Pulse 2011, 2012, 2013, 2014, 2015, 2016, 2017
RepTrend aziende Italiane vs Straniere2013 - 2017
...in Italia no, le aziende straniere sono apprezzate più delle italiane (e alzano la media)...
2017
RepTrend aziende in Italia 2011 - 2017
20152014 2016
70,8
66,9
69,6
Rep
uta
zio
ne
(Rep
Trak
® P
uls
e)
68,7
70,2
67,0
70,4
66,3
70,8
68,1
72,2
Rep
uta
zio
ne
(Rep
Trak
® P
uls
e)201320122011
66,666,666,2
67,4
2013 2014 2015 2016 2017
70,1
65,2

5Reputation Institute | 20 Years of Reputation Leadership
...alcune tendenze da tenere a mente quando si pianifica la comunicazione
Donna
71,9
Uomo
69,7
Alta educazione
69,372,3
Educazione
73,769,1
Geografia
Bassa educazione SudNord
Sesso
2,2 pti
3,0 pti 4,6 pti
Età
Over 35
71,2
Millennials
69,9 1,3 pti

6Reputation Institute | 20 Years of Reputation Leadership
EXCELLENT
STRONG
AVERAGE
WEAK
La performance reputazionale dei settori in Italia nel 2017…
Rank Settore RepTrak® Pulse
1 Retail - Online 80.9
2 Luxury Products 75.3
3 FMCG - Beverage 75.1
4 FMCG - Home & Personal Care 74.8
5 Electrical & Electronics 74.4
6 Automotive 73.9
7 Financial - Diversified 73.9
8 FMCG - Food 73.8
9 Streetwear 72.8
10 Pharmaceutical 72.4
11 Entertainment - Media 71.7
12 Logistic 70.9
13 Industrial 70.8
14 Turism 70.7
15 Retail - Brick&Mortar 68.9
16 Financial - Insurance 65.0
17 Telco 64.8
18 Energy & Utilities 61.5
19 Football 60.5
20 Financial - Bank 59.5
21 Entertainment - Gaming 57.3
+ 14,4 ptiEntertainment - Media
Entertainment - Gaming
Retail - Online
Retail - Brick&Mortar+ 12,0 pti
Financial - Diversified
Financial - Insurance
Financial - Bank
+ 14,4 pti
Differenze tra settori limitrofi

7Reputation Institute | 20 Years of Reputation Leadership
EXCELLENT
STRONG
AVERAGE
WEAK
Settori compatti vs polarizzati: conoscere il proprio contesto per ‘uscire dal coro’
Rank Settore RepTrak® Pulse
1 Retail - Online 80.9
2 Luxury Products 75.3
3 FMCG - Beverage 75.1
4 FMCG - Home & Personal Care 74.8
5 Electrical & Electronics 74.4
6 Automotive 73.9
7 Financial - Diversified 73.9
8 FMCG - Food 73.8
9 Streetwear 72.8
10 Pharmaceutical 72.4
11 Entertainment - Media 71.7
12 Logistic 70.9
13 Industrial 70.8
14 Turism 70.7
15 Retail - Brick&Mortar 68.9
16 Financial - Insurance 65.0
17 Telco 64.8
18 Energy & Utilities 61.5
19 Football 60.5
20 Financial - Bank 59.5
21 Entertainment - Gaming 57.3
Settori polarizzati
84.2
63.3
+ 20,9 pti
70,9
28.8
+ 42,1 pti
Settori compatti
+ 4,1 pti + 8,3 pti

8Reputation Institute | 20 Years of Reputation Leadership
Reputation driver: 2 miti da sfatare

9Reputation Institute | 20 Years of Reputation Leadership
Heineken e Coca Cola sono 2 "powerbrand"...ma Heineken ha saputo ritagliarsi un posizionamento distintivo e credibile affrontando di petto l’hot-topic di settore
% A
war
enes
s (N
oto
riet
à)
Reputazione (RepTrak® Pulse)
89% 68,5 90% 77,7

10Reputation Institute | 20 Years of Reputation Leadership
Recommendation #1: Sky needs to increase its engagement (multi-touchpoint interaction) with its key targets, an increase in their familiarity with the Company and what it does shows a great business impact
% A
war
enes
s (N
oto
riet
à)
Reputazione (RepTrak® Pulse)
Ferrovie e Alitalia sono i 2 principali "Italian Carrier"…nonostante ambedue stentano a convincere gli Italiani, Alitalia gode di un posizionamento più aspirazionale
87% 48,7 87% 58,7
89% 68,5 90% 77,7

11Reputation Institute | 20 Years of Reputation Leadership
Recommendation #1: Sky needs to increase its engagement (multi-touchpoint interaction) with its key targets, an increase in their familiarity with the Company and what it does shows a great business impactMonte Paschi e Mediolanum sono 2«storiche banche italiane»...mentre MPS attraversa
momenti difficili, Mediolanum comunica alla testa e al cuore degli Italiani
% A
war
enes
s (N
oto
riet
à)
Reputazione (RepTrak® Pulse)
87% 28,8 70% 61,9
87% 48,7 87% 58,7
89% 68,5 90% 77,7

12Reputation Institute | 20 Years of Reputation Leadership
Recommendation #1: Sky needs to increase its engagement (multi-touchpoint interaction) with its key targets, an increase in their familiarity with the Company and what it does shows a great business impact
% A
war
enes
s (N
oto
riet
à)
Reputazione (RepTrak® Pulse)
17% 74,2 91% 73,2
87% 28,8 70% 61,9
87% 48,7 87% 58,7
89% 68,5 90% 77,7
Nike e Under Armour sono oggi 2 "sportwear" di tendenza ...Nike è il marchio mainstream per eccellenza, UA si è creata una nicchia di fanatici ambasciatori…

13Reputation Institute | 20 Years of Reputation Leadership
17% 74,2 91% 73,2
87% 28,8 70% 61,9
87% 48,7 87% 58,7
89% 68,5 90% 77,7
90% 71,2 50% 76,6
Coop e NaturaSi sono oggi 2 "retailer" apprezzati dai consumatori... mentre Coop fa parte della "storia Italiana", NaturaSì ha rivoluzionato il concetto di supermercato
% A
war
enes
s (N
oto
riet
à)
Reputazione (RepTrak® Pulse)

14Reputation Institute | 20 Years of Reputation Leadership
Recommendation #1: Sky needs to increase its engagement (multi-touchpoint interaction) with its key targets, an increase in their familiarity with the Company and what it does shows a great business impactLearning #1: NON c’è correlazione tra Awareness e Reputazione
17% 74,2 91% 73,2
87% 28,8 70% 61,9
87% 48,7 87% 58,7
89% 68,5 90% 77,7
90% 71,2 50% 76,6
% A
war
enes
s (N
oto
riet
à)
Reputazione (RepTrak® Pulse)
15Reputation Institute | 20 Years of Reputation Leadership
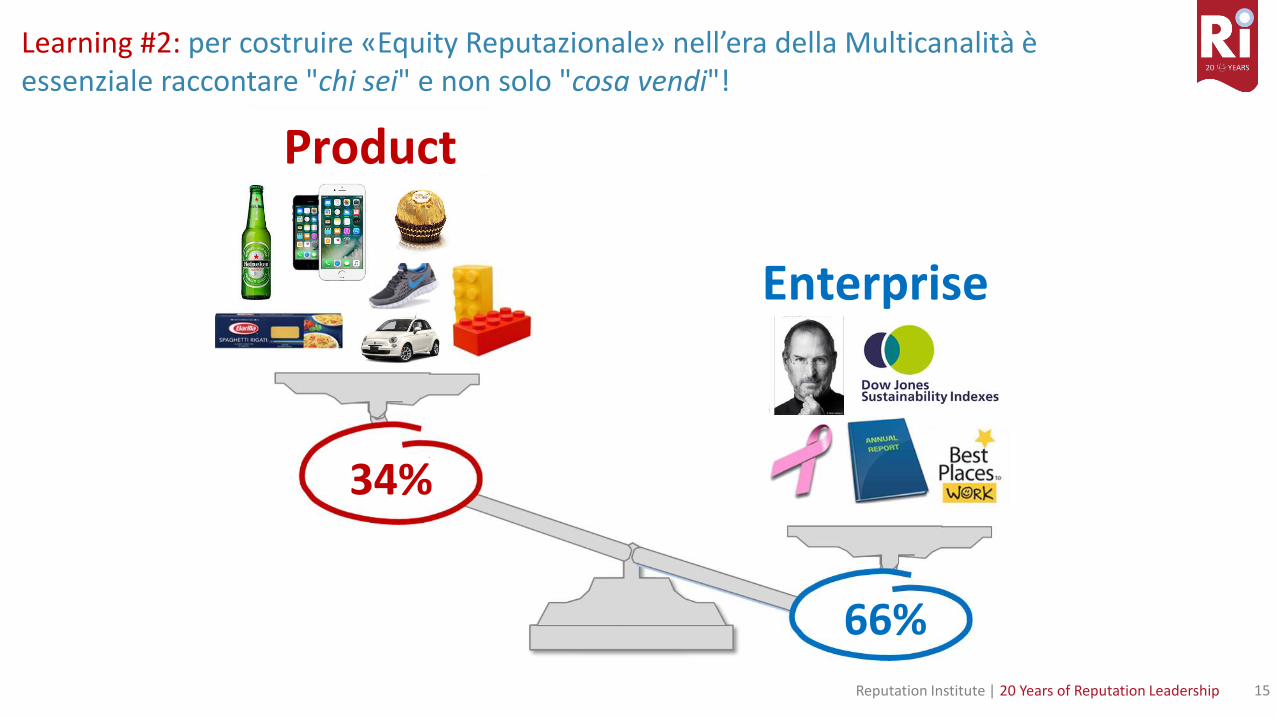
Learning #2: per costruire «Equity Reputazionale» nell’era della Multicanalità è essenziale raccontare "chi sei" e non solo "cosa vendi"!
Enterprise
66%
34%
Product
Enterprise

16Reputation Institute | 20 Years of Reputation Leadership
Golden rule: come costruire Equity Reputazionale

17Reputation Institute | 20 Years of Reputation LeadershipFonte: Reputation Institute – Italy RepTrak® Pulse 2017
Conoscere il livello di Awareness è solo il punto di partenza.
Per costruire Equity Reputazionale è fondamentale indagare i livelli di
Familiarità degli stakeholder vs azienda
Aware
62,1%
Awareness Familiarità
Raccomandazione #1: lavorare sulla «familiarità» per intensificare l’engagement con il consumatore
Not Aware
37,9%Not Aware
37,9%
Not Aware
37,9%
Scarsa
14,9%
Sufficiente
20,7%
Buona
10,3%
Eccellente
16,2%
Il gap reputazionale tra chi ha uno scarso livello di conoscenza dell’azienda (60,8) e chi ha un
engagement eccellente (81,3) è +20 pti
Scarsa Sufficiente Eccellente
Familiarità
+20,5pti
Rep
uta
zio
ne
(Rep
Trak
® P
uls
e)
Migliorare il livello di familiarità provoca un aumento diretto
di +5pti di Reputazione…
+4,6pt
Oggi +1pt familiarità
Rep
uta
zio
ne
(Rep
Trak
® P
uls
e)
...che a sua volta impatta sulla performance di business aumentando la propensione all’acquisto (+7,3 pti),
il passaparola positivo (+6,9 pti) e il beneficio del dubbio (+4,9pti)
BUY
RACCOMANDARE L’AZIENDA
Corr.ne: 0,69
Corr.ne: 0,81
+7,3%
+6,9%
BENEFICIODEL DUBBIO
+4,9%
Corr.ne: 0,83
Familiarità Familiarità x Reputazione Reputazione Business Impact
Buona

18Reputation Institute | 20 Years of Reputation LeadershipFonte: Reputation Institute – Italy RepTrak® Pulse 2017
Aware
95%
Awareness Familiarità
Case study Ferrero – Nestlè: a parità di awareness Nestlè ha molto più da lavorare (e guadagnare) per ingaggiare il consumatore (28 punti di differenza)…ma come si fa?
Not Aware
Not Aware
37,9%
Familiarità
Not Aware
Aware
94%
84,7 67,2
Familiarità x Reputazione
Eccellente46,1%
BuonoSufficienteScarsa8,1%
Eccellente31,3%
BuonoSufficienteScarsa13,1%Li
velli
di f
amili
arit
à
83,1
90,9
49,5
78,3
Rep
uta
zio
ne
(Rep
Trak
® P
uls
e)
+28,8pti
+7,8pti
Scarsa EccellenteFamiliarità
BUY
BENEFICIODEL DUBBIO
4,9% 38,7% 56,4%
15,4% 46,2% 38,4%
4,9% 38,7% 56,4%
15,4% 46,2% 38,4%
+11,4 -21,5
+10,5 -18,0
Business Impact

19Reputation Institute | 20 Years of Reputation Leadership
Le opzioni strategiche per intensificare lo stakeholder engagement e vincere nella Reputation Economy

20Reputation Institute | 20 Years of Reputation Leadership
La base per creare Equity Reputazionale oggi
Strategia di canale- +
+
-
Le 2 opzioni strategiche
Fai leva sui canali Situazione ideale
Fai leva sui contenutiFai leva su entrambi
Sono 2 le opzioni strategiche (che lavorano sulla familiarità) per intensificare l’engagement
Scarsa Buona Sufficiente Eccellente
Familiarità
+20,5pti
Rep
uta
zio
ne
(Rep
Trak
® P
uls
e)
Stra
tegi
a d
i co
nte
nu
to

21Reputation Institute | 20 Years of Reputation Leadership
Star
tegi
ad
i co
nte
nu
to –
Avg
Sco
re s
ui m
essa
ggi c
hia
ve
Strategia di canale - % Reach by Paid – Owned – Earned Media
Il posizionamento delle aziende in Italia oggi

22Reputation Institute | 20 Years of Reputation Leadership
Il posizionamento delle aziende in Italia oggiSt
arte
gia
di c
on
ten
uto
–A
vgSc
ore
su
i mes
sagg
i ch
iave
Strategia di canale - % Reach by Paid – Owned – Earned Media

23Reputation Institute | 20 Years of Reputation Leadership
Come applicare una "content driven strategy" orientata all’Equity Reputazionale
Come fare leva sui messaggi/contenuti chiave per far crescere la reputazione
e l’impatto sul business

24Reputation Institute | 20 Years of Reputation Leadership
Raccomandazione #2: nel 2017 in Italia occorre mettere al centro della vostra strategia di engagement 3 (+1) contenuti chiave con messaggi specifici...
21,3%12,3%
12,4%13,0%
14,4% 11,4%
15,2%
1
Meets customer needsOffers high quality products and servicesStands behind its products and servicesOffers products / services that are a good value for the money
2Behaves ethicallyIs open and transparent about the way the company operates
3Has a positive influence on society
4Is a well organized company

25Reputation Institute | 20 Years of Reputation Leadership
...ma all’interno di ogni settore gli equilibri cambiano… non si può prescindere dal conoscere il proprio contesto competitivo
21,8%13,7%
11,5%13,0%
12,8% 12,2%
15,0%
21,6%12,6%
13,6%14,5%
13,0% 10,8%
13,8%
13,0%12,9%
10,9%12,5%
17,4% 14,6%
18,8%
22,7%13,0%
13,3%13,2%
12,0% 12,0%
13,7%
18,3%14,6%
12,3%12,2%
16,1% 12,0%
14,5%
Shows strong prospects for future growth
Delivers financial results that are better than expected
Has a clear vision for its future
Has excellent managers
Is a well organized company
Is fair in the way it does business
Behaves ethically
Is open and transparent about the way the company operates
Is fair in the way it does business
Behaves ethically
Is open and transparent about the way the company operates
Has a positive influence on societyStrong prospects for future growth
Supports good causesActs responsibly to protect environment
Delivers financial results better than expected

26Reputation Institute | 20 Years of Reputation Leadership
Insurance: come crescere in un settore difficile
2014
69,0
66,7
62,459,9
66,3+5,6%
65,5+6,0%
62,6
62,3+5,4%
64,3
64,064,5
18,3%14,6%
12,3%12,2%
16,1% 12,0%
14,5%
Reputazione (RepTrak® Pulse)
2015 2016 2017
Dimension Scores

27Reputation Institute | 20 Years of Reputation Leadership
Automotive: come uscire da una crisi
Reputazione (RepTrak® Pulse)
2015 2016 2017
Dimension Scores
21,6%12,6%
13,6%14,5%
13,0% 10,8%
13,8%
63,3
77,9
56,7
65,9+6,0%
68,1+6,0%
46,3+23%
52,0+57%
66,7+5,2%
67,3+9,6%
64,8+32%

28Reputation Institute | 20 Years of Reputation Leadership
Come applicare una «channel driven strategy" orientata all’Equity Reputazionale
Come fare leva sui canali chiave per far crescere la reputazione
e l’impatto sul business

29Reputation Institute | 20 Years of Reputation Leadership
Impatto sullaReputazione
Reach%
Direct Experience
Earned Media
Customer Service Buying Experience
Sponsorship
ADV on Digital/Social Media
ADV on Traditional Media
Family & Peers
News on Traditional Media
Experts & KOL
Buzz on Social Media
Website
Newsletter
Social Media Posting
Annual Report
Press Release
+
-- +
Paid Media
Owned Media
Le performance dei canali in Italia nel 2017.State ripartendo il vs budget sui canali a maggior resa?
+8,0
13%

30Reputation Institute | 20 Years of Reputation Leadership
Buying Experience
Customer Service
ADV on Traditional Media
ADV on Digital/Social Media
Sponsorship
News on Traditional Media
Buzz on Social Media
WOM by Family and Peers
WOM by Experts and KOL
Company’s Website
Company’s Newsletter
Company’s Social Media posting
Company’s Press Release
Company’s Annual Report
Earned
Paid
Consumer Experience
Owned
+9,3 pti
+11,9 pti
+6,7 pti
+7,0 pti
Reach%
Impatto sulla Reputazione
24,2% 39,1% 48,4%33,1%
Raccomandazione #3: l’engagement dei vs consumatori passa da un mix bilanciato di due macro-canali…

31Reputation Institute | 20 Years of Reputation Leadership
Impatto sullaReputazione
Reach%
ADV on Digital/Social Media
ADV on Traditional Media
Website
Newsletter
Annual Report
Press Release
+
-- +
Social Media Posting
Paid Media
Owned Media
...i Paid media devono essere usati come ‘enabler’ per portare il consumatore sui vostri Owned Media – il macro-canale che vi garantisce maggior equity reputazionale...
+8,0
13%

32Reputation Institute | 20 Years of Reputation Leadership
Impatto sullaReputazione
Reach%
Family & Peers
News on Traditional Media
Experts & KOL
Buzz on Social Media
Website
Newsletter
Annual Report
Press Release
+
-- +
Social Media Posting
Earned Media
Paid Media
Owned Media
...gli Owned media devono agire da "ponte" per aumentare il volume di messaggi positivi veicolati da terzi sugli Earned media – il macro-canale che con la reach% maggiore
+8,0
13%

33Reputation Institute | 20 Years of Reputation Leadership
For Sky, multi-touchpoint strategies generate important reputation impacts… but only 15% of Italians are engaged today by 4 touchpoints simultaneously
N° canali utilizzati
44,6%
3+ Canali
75,1%
19,4%
4 Canali
1+ Canale
70,8Reach100%
+2,6 pti
2+ Canali
70,8
70,883,3
+12,5 pti
5,7%
+3,8 pti
+3,4 pti
+3,4 pti
Direct Experience
Earned Media
Paid Media
Owned Media
Il risultato a cui ambire applicando una strategia multi-canale: 12 pti reputazionali

34Reputation Institute | 20 Years of Reputation Leadership
51,7
74,1
78,1
82,4
Un case study: quale upside reputazionale potenziale per P&G
Campagna ADV Thank You Mom – Rio 2016

35Reputation Institute | 20 Years of Reputation Leadership
Sum-up: come massimizzare ROI delle attività di comunicazione nell’era della Multicanalità
NON C’È CORRELAZIONE TRA AWARENESS E REPUTAZIONE
INVESTI RISORSE A RACCONTA "CHI SEI" E NON SOLO "COSA VENDI"
LAVORARE SULLA «FAMILIARITÀ» CONSENTE DI INTENSIFICARE L’ENGAGEMENT CON LO STAKEHOLDER EOTTENERE UN CONSEGUENTE IMPATTO SUL BUSINESS
PER USCIRE DAL CORO È NECESSARIO IMPLEMENTARE UNA «CONTENT STRATEGY» CHE TENGA CONTONON SOLO DELLE ATTESE DEGLI ITALIANI MA ANCHE (E SOPRATTUTTO) DI QUELLE DI SETTORE
UNA «CHANNEL STRATEGY» EFFICACE PASSA DA UNA VALORIZZAZIONE DELLE PROPERTIES AZIENDALI (OWNED MEDIA) E DA UNA COMPRENSIONE DELL’EFFETTO DOMINO GENERATO DALLA MULTICANALITÀ
LEARNING #1
LEARNING #2
RECO #1
RECO #2
RECO #3

36Reputation Institute | 20 Years of Reputation Leadership
Star
tegi
ad
i co
nte
nu
to -
Avg
Sco
re s
ui m
essa
ggi c
hia
ve
Strategia di canale - % Reach by Paid – Owned – Earned Media
Quo vadis ?