Equity in Public Financing of Water, Sanitation and ...€¦ · Equity in Public Financing of...
44
unite for children Equity in Public Financing of Water, Sanitation and Hygiene (WASH) Analysis from INDONESIA, MONGOLIA and VIET NAM UNICEF East Asia and Pacific Regional Office June 2016
Transcript of Equity in Public Financing of Water, Sanitation and ...€¦ · Equity in Public Financing of...

unite forchildren
Equity in Public Financing of Water, Sanitation and Hygiene (WASH)
Analysis from INDONESIA, MONGOLIA and VIET NAM
UNICEF East Asia and Pacific Regional OfficeJune 2016

©2016 UNICEF/EAPRO East Asia and Pacific Regional Office,19 Phra Atit Road, Bangkok 10200, Thailand Tel: +66 2356 9274www.unicef.org/eapro All cover photos ©UNICEF
unite forchildren
How better sub-national financing can contribute to improved water, sanitation and hygiene in East Asia and the Pacific
Equity in Public Financing of Water, Sanitation and Hygiene (WASH)
Analysis from INDONESIA, MONGOLIA and VIET NAM
UNICEF East Asia and Pacific Regional OfficeJune 2016


EQUITY IN PUBLIC FINANCING OF WASH
v
FOREWORD
Understanding and tracking the flows of public finance in the water, sanitation and hygiene (WASH) sector is increasingly recognized as being essential to achieve equitable sectoral outcomes. However, understanding the bottlenecks in public financing in the WASH sector, and especially in the financing of local governments responsible for the provision of water and sanitation services, is often constrained by a lack of information regarding the scale and quality of public expenditures.
To contribute to the understanding of public financing of WASH in the region, the WASH and Social Policy programmes of UNICEF East Asia and Pacific Regional Office (EAPRO) engaged Oxford Policy Management (OPM) to undertake a study of WASH financing in Mongolia, Indonesia and Viet Nam. This study contributes to a growing body of knowledge on national WASH financing from Public Expenditure Reviews (PERs) and Service Delivery Assessments (SDAs) by the World Bank and WHO-led GLAAS Track-Fin, tracking changes in institutions and financing. The study addresses a significant knowledge gap on WASH financing at the local government level. For example, the study notes that central government financing of public WASH assets on behalf of local governments and their service providers (whether local government or community owned) has contributed to an awkward build – neglect – rebuild cycle which is characterized by deteriorating WASH service delivery standards.
These and other findings from the three country study are presented in a regional analysis report and three separate country reports, which are respectively entitled:
1. Equity in Public Financing of Water, Sanitation & Hygiene (WASH) Analysis from Indonesia, Mongolia and Viet Nam
2. Equity in Public Financing of Water, Sanitation & Hygiene (WASH) Indonesia
3. Equity in Public Financing of Water, Sanitation & Hygiene (WASH) Mongolia
4. Equity in Public Financing of Water, Sanitation & Hygiene (WASH) Viet Nam
These reports are based on an extensive review of available literature and build on feedback from consultations with numerous partners. The assessment in particular benefitted substantially from inputs by Nicoletta Feruglio – Social Policy Specialist at UNICEF EAPRO, and WASH and Social Policy colleagues from each of the three countries which were studied. This analysis on decision-making; financial flows; allocation criteria; and spending of public funds for WASH services in Viet Nam, Indonesia and Mongolia aims to inform programming and advocacy for promoting equitable and sustainable WASH services for children.
Chander Badloe
Regional Adviser - Water, Sanitation & Hygiene (WASH) UNICEF East Asia and Pacific Regional Office (EAPRO)
Gaspar Fajth
Regional Adviser - Social Policy and Economic Analysis, UNICEF East Asia and Pacific Regional Office (EAPRO)

EQUITY IN PUBLIC FINANCING OF WASH
vi
ACKNOWLEDGEMENT
This project consumed a huge amount of time, effort, research and dedication, and its implementation would not have been possible without the contributions of many individuals and organizations. We would like to extend our sincere gratitude to all of those involved.
This Synthesis Report is the final output of the project contracted by UNICEF East Asia and Pacific Regional Office (EAPRO) to OPM to assess WASH financing processes and outcomes in three countries in East Asia. The purpose of the assignment was to map and analyse decision-making, financial flows, allocation criteria and spending levels relevant to WASH services in Vietnam, Indonesia and Mongolia to inform UNICEF EAPRO programming and advocacy for promoting equitable and sustainable WASH services for children. This synthesis report sets out the key recommendations for improved WASH financing for children based on the findings of the three country case studies. UNICEF EAPRO recognizes the high quality expertise and professionalism provided by the OPM team – Mark Ellery and Henlo van Nieuwenhuyzen – in undertaking this assignment.
A special gratitude is expressed to Chander Badloe (UNICEF Regional Advisor – WASH EAPRO); Nicoletta Feruglio (UNICEF Specialist – Social Policy and Economic Analysis EAPRO); and the country WASH teams of Mongolia, Indonesia and Viet Nam for providing their generous support and expertise in the research process.
EAPRO particularly acknowledges, with much appreciation, the crucial role of UNICEF staff from the country offices in Mongolia, Indonesia and Viet Nam, the regional office, and national consultants, who dedicated their time and enthusiasm to ensuring that the project was a success. UNICEF also acknowledges the contributions from the various donor organizations, ministries and local government staff who made themselves available for interviews and whose dedication to addressing the challenges within the WASH sector cannot be doubted.

CONTENTS
Foreword v
List of figures viii
Acronyms ix
Executive summary 1
Introduction 3
1. WATER, SANITATION AND HYGIENE 5 IN EAST ASIA AND THE PACIFIC
1.1 A snapshot of the WASH status in Mongolia, 7 Indonesia and Viet Nam
2. ANALYSIS OF WASH PFM AND FINANCING 9 IN INDONESIA, MONGOLIA AND VIET NAM
2.1 WASH public spending in Indonesia, Mongolia and Viet Nam 9
2.2 Institutional framework and public responsibilities 10 for WASH services
2.3 Fiscal significance of central and local government 13 WASH functions
2.4 Public financial resources for WASH services 15
3. WASH SUBNATIONAL 18 FINANCING RECOMMENDATIONS
Annex 1 Terms of Reference 24
Annex 2 References 28

EQUITY IN PUBLIC FINANCING OF WASH
viii
LIST OF FIGURES
FIGURES
Figure 1: Water trends in East Asia and the Pacific 5
Figure 2: Sanitation trends in East Asia and the Pacific 6
Figure 3: Access to water supply and sanitation versus wealth 8 (by country)
Figure 4: Average WSS expenditure as a percentage of GDP 9 for countries with WSS PER data
Figure 5: Average recent WSS expenditure as a percentage of GDP 16 versus improved access to water and sanitation
Figure 6: The executive/elected vertical structure of the governments 11 in Indonesia, Mongolia and Viet Nam
Figure 7: Responsibility for WASH services in Indonesia, 11 Mongolia and Viet Nam
Figure 8: WASH institutional framework and functions in Mongolia 12
Figure 9: Indonesia WASH spending by level of government in 2010 13
Figure 10: Indonesia central government water and sanitation spending 14 by programme in 2010-2013
Figure 11: Build-neglected-rebuild cycle of WASH services 15
Figure 12: Operate-maintain-invest cycle of WASH services 15
Figure 13: Composition of Indonesia and Mongolia local governments’ 16 budget by source of fund
Figure 14: DAK for water and sanitation 17
Figure 15: The separation of revenue and capital budgeting processes 19 from asset ownership
Figure 16: Water tariffs 20
Figure 17: Local government service provider relation/regulations’ 21 recommendations
Figure 18: Retaining WASH assets and financing liability 22 with local government
Figure 19: Delegation of WASH assets and financing liability 22 to the provider
Figure A.1: Proportion of population openly defecating in the six EAP 25 countries still above the developing world average, 2011

EQUITY IN PUBLIC FINANCING OF WASH
ix
ACRONYMS
C-PEM child-focused public expenditure monitoring
DAK Dana Alokasi Khusus (Specific-Purpose Grant), Indonesia
EAP East Asia and Pacific
GDP gross domestic product
GLAAS Global Analysis and Assessment of Sanitation and Drinking-Water
LDF Local Development Fund
ODA official development assistance
O&M operations and maintenance
OPM Oxford Policy Management
PER Public Expenditure Review
PETS Public Expenditure Tracking Survey
SDA Service Delivery Assessment
SDG Sustainable Development Goal
UNICEF United Nations Children’s Fund
WASH water, sanitation and hygiene
WHO World Health Organization
WSP Water and Sanitation Program, The World Bank Group
WSS water supply and sanitation

EQUITY IN PUBLIC FINANCING OF WASH
x

EXECUTIVE SUMMARY
1
EXECUTIVE SUMMARY
In this report we have highlighted some of the progress that has been made in Indonesia, Mongolia and Viet Nam in addressing issues of water and sanitation access though the Public Financial Management (PFM) system and subnational financing. However, we have dedicated more space and attention to those areas of the system where challenges still remain.
The report is a synthesis of three country studies – Indonesia, Mongolia and Viet Nam – providing an assessment of institutional arrangements, public financial management procedures and funding flows for water, sanitation and hygiene (WASH) services. The report is structured along the main pillars of the PFM and decentralized financing systems and provides an assessment of the main challenges and issues the public sector faces in those pillars. The main areas covered include: stocktaking assessments of the WASH sector in the three countries, institutional framework and expenditure assignments, and the fiscal significance for WASH services, revenue assignments, intergovernmental transfers and borrowing. In the final section, we outline a set of key policy recommendations to which UNICEF could contribute.
This study defines WASH as not only large-scale water supply and sewerage systems, but is also focussed on WASH in schools, health facilities and communities in both rural and urban areas.
The methodology of the study has been to synthesize all available data and information from existing studies to map out the institutional structure and financing flows within the sector to identify the key bottlenecks and barriers that hamper the delivery of WASH outcomes. This enabled the specific areas of relevance for primary analysis in each country to be defined. These target areas for primary analysis were then supplemented with in-depth analysis of the situation in a sample of subnational jurisdictions, through in-country data collection and key informant interviews
Mongolia and Indonesia almost achieved the global average in access to improved water and sanitation facilities at average levels of GDP per capita, while Viet Nam surpassed average levels of access to improved water and sanitation at less than average levels of GDP per capita. All three countries have achieved this level of access to improved water and sanitation facilities while recording relatively low levels of public expenditure over the last decade. This improvement in access was primarily the result of relatively high levels of expenditure by households/users, along with recurrent expenditure by service providers.
Despite the considerable progress made to date in many fronts, the PFM and subnational financing system for WASH still faces considerable challenges in all three countries.

EQUITY IN PUBLIC FINANCING OF WASH
2
At a more specific level, there are some serious challenges: the assignment of functional responsibilities for WASH services at the central and local levels remains unclear; there is a net separation between the capital and recurrent expenditures for WASH services; and the system lacks an objective transparent method for arriving at the expenditure needs associated with the assigned competencies. On the side of revenue assignments, the great bulk of WASH capital spending is undertaken by the central government and the tariffs are kept artificially low, which detracts overall accountability from the system. While the transfer system does not sufficiently incentivize performance to achieve WASH sector outcomes.
There are concerns about transferring public WASH assets to public service, which undermines, rather than enhances, provider viability, and the local government’s quality assurance role for the service delivered by those providers.
There are also challenges in accounting and budgeting codes, and budget structures. As a result, WASH public budget/spending is hard to obtain and thus key information on subnational financing or spending efficiency/effectiveness are hard to address.
While each of the aforementioned challenges needs to be addressed, the likelihood of successful reform will increase with the proper sequencing of the reforms.
The most important step in the way forward is to develop a unified and coordinated reform strategy for improved water, sanitation and hygiene services. Once the consensus on the overall system has been reached, UNICEF could contribute to the following policy interventions:
• In the short term, two immediate steps are, first, to reform and clarify WASH expenditure assignments at all levels of government, and second, to calculate the costs associated to those responsibilities.
• In the short term it should also be feasible to revise the WASH tariff structure and create a ‘quality assurance mechanism’ in the form of performance contracts or licensing for services delivered by providers. It is as urgent to establish a regular system of tracking and monitoring of public WASH spending and performance.
• In the medium term, it will be desirable to reform the transfers from the central government including the setup of (capital) performance-based grants.
• In the medium term, and according to the country PFM reform direction and pace, it will be helpful to revise the accounting codes and budget structure towards output-based/programme-based/performance-based budgeting.

INTRODUCTION
3
INTRODUCTION
Sustainable Development Goal (SDG) 6 sets a number of ambitious targets for water and sanitation access and management. Public finance is currently thought to be the largest source of funding to achieve the SDG targets. With official development assistance (ODA) expected to decrease, the effectiveness of public finance will have to improve significantly to maintain current expenditure levels and expand future investments to ensure the achievement of both quality and equity in services for children in WASH and other sectors. Available resources must also be used more efficiently to ensure the level and quality of service provision benefits the poor and marginalized.
It is in this context that the UNICEF East Asia and Pacific Regional Office (EAPRO), in collaboration with UNICEF country offices, government partners and the technical assistance from Oxford Policy Management (OPM) has undertaken this study. The purpose of the assignment is to have a comprehensive understanding of the institutions, decision-making processes and key bottlenecks in the financing of the WASH sector, particularly at the subnational level where service delivery takes place. Furthermore, the study aims to provide key policy recommendations and entry points for UNICEF programming and advocacy to improve the effectiveness of the financing of WASH services in each of the country cases. The study has examined three countries: Indonesia, Viet Nam and Mongolia.
This study defines WASH as not only large-scale water supply and sewerage systems, but also WASH in schools, health facilities and communities in both rural and urban areas.
The assignment has built on existing initiatives that are contributing to an improved level of understanding of WASH financing systems. These include the World Health Organization (WHO)-led Global Analysis and Assessment of Sanitation and Drinking-Water (GLAAS) TrackFin initiative which has developed a comprehensive framework for tracking national WASH financing (currently being piloted)1 and the Decentralization and Local Governance group which have engaged in a stock-taking exercise to assess the contribution of local governments (and the local public sector more broadly) to achieving global development goals in the health and education sectors.2 This study has drawn on these existing methodologies and the approach has been to synthesize all available data and information from existing studies. This will then aid in mapping out the institutional structure and financing flows within the sector to identify the key bottlenecks and barriers that hamper the delivery of WASH outcomes. Key documentation compiled by WHO through the United Nation-GLAAS initiative, the Service Delivery Assessments (SDAs) conducted by the Water and Sanitation Programme (WSP) and the Public Expenditure Reviews (PERs) undertaken by the World Bank in the WASH sector was utilized where available. This enabled the specific areas of relevance for primary analysis in each country to be defined (i.e., national versus subnational, budget effectiveness versus budget efficiency, and capital creation versus operations and maintenance). These target areas for primary analysis were then
1 See http://www.who.int/water_sanitation_health/glaas/trackfin_guidance_document/en/2 See http://www.localpublicsector.org/lps_development_study.htm

EQUITY IN PUBLIC FINANCING OF WASH
4
supplemented with in-depth analysis of the situation in a sample of subnational jurisdictions, through in-country data collection and key informant interviews.
It is important to point out that understanding the public financing bottlenecks in the WASH sector is constrained. The reasons for this are many, not least that the WASH sector is characterized by multiple stakeholders, sources of finance flowing between various public and private financing units, service providers and users as well as a lack of information regarding the allocation and expenditure of funds. The present research could not access WASH budgetary and expenditure data from the Government of Viet Nam and had to rely on figures made available by development partners. In addition, given the limited resources available for this assignment, it has not been feasible to conduct comprehensive PER or Public Expenditure Tracking Surveys (PETS) for the wash, sanitation and hygiene sector in these countries.
This paper reviews the water, sanitation and hygiene status in Indonesia, Mongolia and Viet Nam, the financing for the water and sanitation sector in these countries and identifies the bottlenecks that hinder service delivery outcomes. The study concludes that in all three countries
that while the size of the WASH sector budget is insufficient to meet sector targets it may not be the most urgent financing problem that the sector faces. Simply securing more funds is therefore not necessarily the answer. Other bottlenecks in the planning, financing and execution of budgets prove to be more significant than the size of the budget.
The report is structured in three Sections. Section 1 is a stocktaking and comparative assessment of the water and sanitation sector in the three countries. Despite some significant differences and varying challenges in managing the transition to middle-income status, all three countries in this study are in a relatively similar position in regard to their access to water and sanitation. Section 2 provides an analysis of current WASH financing mechanisms by analysing the stakeholders involved in the provision of water, sanitation and hygiene, their roles, responsibilities and fiscal significance, the financial resources allocated to the WASH sector, and finally the service arrangements between local governments and the service providers. In this section the study focuses on the issues and challenges in each of the main areas of analysis. Section 3 presents recommendations and entry points for UNICEF programming in PFM and financing for efficient, effective and accessible WASH services.

1. WATER, SANITATION AND HYGIENE IN EAP
5
1WATER, SANITATION AND HYGIENE IN EAST ASIA AND THE PACIFIC
Despite rapid economic growth, inadequate sanitation and hygiene remain a significant challenge in the East Asia and Pacific (EAP) region (see Figure 1). While several countries in the region have achieved lower middle-income status with commendable progress in improving access to water and sanitation facilities, the quality of water, sanitation and hygiene services remain a significant challenge for child development (mortality and under-nutrition) in the region.
In the period from 1990 to 2015, the use of improved water supplies increased by 25 per cent in the EAP region (see Figure 1). This translates to 817 million more people accessing improved drinking water than 25 years ago, the majority of them in China. Although access to an improved water supply in the region
FIGURE 1: WATER TRENDS IN EAST ASIA AND THE PACIFIC
Source: WHO/UNICEF Monitoring Programme for Water Supply and Sanitation 2015 dataset.
Regional and world water coverage trends
Surface water
Unimproved water
Other improved water
Piped on premises
100
90
80
70
60
50
40
30
20
10
0 1990 2015
27
42
23
8
61
33
5
1
East Asia and the Pacific
100
90
80
70
60
50
40
30
20
10
0 1990 2015
44
32
17
7
58
33
7
2
World
EQUITY IN PUBLIC FINANCING OF WASH
6
is high as a proportion of the total population, 130 million people still lack access. This is characterized by significant disparities in access to improved water supplies across different countries (e.g., ranging from 40 per cent in Papua New Guinea to over 95 per cent in Thailand and Malaysia) and within countries (e.g., rich or urban households are more likely to have better access than poor or rural households) (UNICEF, 2015). The high prevalence of water treatment, an estimated 60 per cent of urban and rural households in 2014, suggests that water quality remains a major challenge in the region (UNICEF, 2014). This data does not illustrate the inequitable nature of access to improved water supplies within countries, with urban dwellers more likely to have access to improved water supplies than rural households.
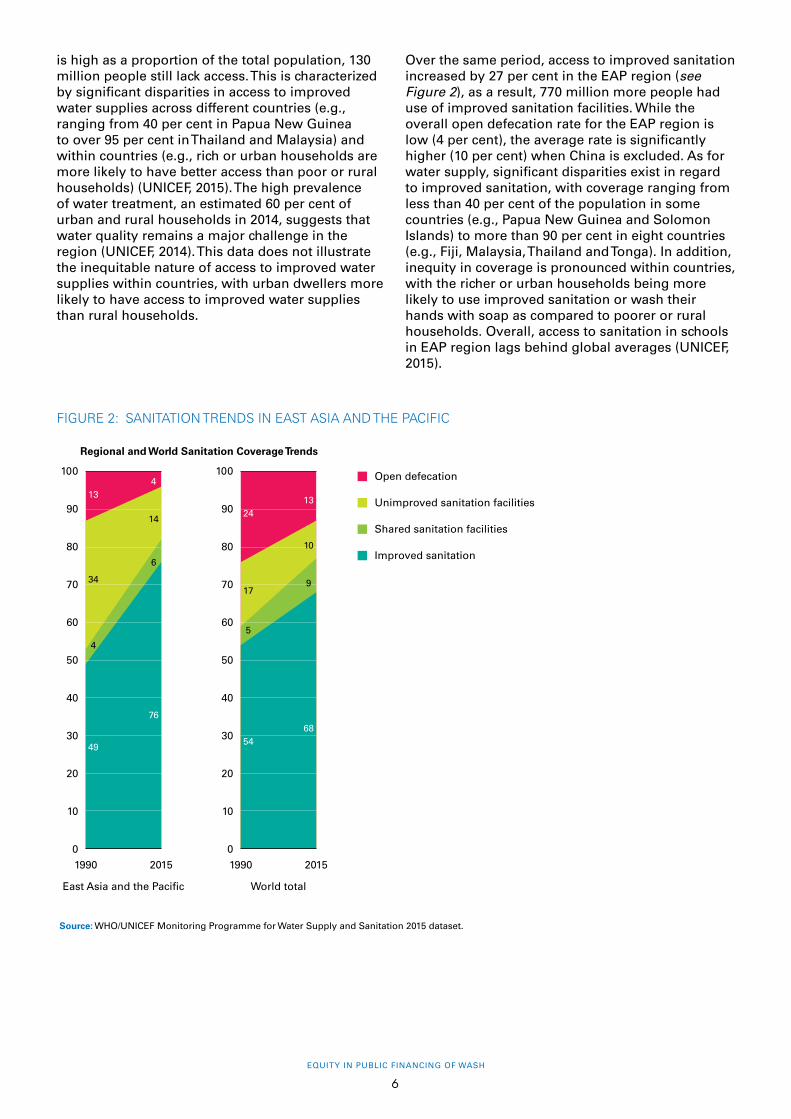
Over the same period, access to improved sanitation increased by 27 per cent in the EAP region (see Figure 2), as a result, 770 million more people had use of improved sanitation facilities. While the overall open defecation rate for the EAP region is low (4 per cent), the average rate is significantly higher (10 per cent) when China is excluded. As for water supply, significant disparities exist in regard to improved sanitation, with coverage ranging from less than 40 per cent of the population in some countries (e.g., Papua New Guinea and Solomon Islands) to more than 90 per cent in eight countries (e.g., Fiji, Malaysia, Thailand and Tonga). In addition, inequity in coverage is pronounced within countries, with the richer or urban households being more likely to use improved sanitation or wash their hands with soap as compared to poorer or rural households. Overall, access to sanitation in schools in EAP region lags behind global averages (UNICEF, 2015).
FIGURE 2: SANITATION TRENDS IN EAST ASIA AND THE PACIFIC
Source: WHO/UNICEF Monitoring Programme for Water Supply and Sanitation 2015 dataset.
Regional and World Sanitation Coverage Trends
Open defecation
Unimproved sanitation facilities
Shared sanitation facilities
Improved sanitation
100
90
80
70
60
50
40
30
20
10
0 1990 2015
49
4
34
13
76
6
14
4
East Asia and the Pacific
100
90
80
70
60
50
40
30
20
10
0 1990 2015
54
5
17
24
68
9
10
13
World total

1. WATER, SANITATION AND HYGIENE IN EAP
7
3 The reliability of the data for Viet Nam is disputed and may overestimate the access rate.
TABLE 1: KEY DEVELOPMENT INDICATORS FOR INDONESIA, MONGOLIA AND VIET NAM
KEY DEVELOPMENT INDICATORS INDONESIA MONGOLIA VIET NAM
Population, total 254,454,778.00 2,909,871.00 90,730,000.00
Population, growth (annual %) 1.30 1.80 1.10
GDP growth (annual %) 5.00 7.80 6.00
GDP per capita (current USD) 3,491.93 4,129.37 2,052.29
GINI index (World Bank estimate) 35.57 33.08 42.68
Improved water source (% of population with access) 87.40 64.40 97.60
% of urban population with access 94.20 66.40 99.10
% of rural population with access 79.50 59.20 96.90
Improved sanitation facilities (% of population with access) 60.80 59.70 78.00
% of urban population with access 72.30 66.40 94.40
% of rural population with access 47.50 42.60 69.70
Life expectancy at birth 70.00 67.00 75.00
Mortality rate, under 5 27.20 22.40 21.70
Prevalence of stunting 39.20 15.60 23.30
Prevalence of wasting 12.30 1.80 4.40
Poverty headcount ratio at US$1.90 a day 15.90 0.76 4.78
Source: Source: World Bank Development Indicators (2010-2015) (updated in 2015).
1.1 A SNAPSHOT OF THE WASH STATUS IN MONGOLIA, INDONESIA AND VIET NAM
According to World Bank data (see Table 1), all the three countries continue to experience strong annual GDP growth in the 2010-2015 period as well as rapid urbanization with increased pressure on the public sector to manage and support growth with equitable access to basic public services. All three countries have made considerable progress in improving access to safe water and sanitation and are in relatively similar positions in regard to their access to water and sanitation.3
Access to water and sanitation is skewed towards urban areas. The expansion of new infrastructure services has disproportionally favoured urban areas, leaving rural areas lagging behind in access to WASH services. As a consequence, water and
sanitation coverage rates are over 28 per cent lower in rural areas in comparison to urban areas. Few people have access to piped water in rural areas, where alternative supply forms, such as bottled water, have been growing. The level of access to improved water and sanitation in rural areas is correlated with income level. The disparities in improved sanitation coverage between the poorest and richest rural households is 70 per cent in Indonesia and 50 per cent in Mongolia (UNICEF 2015).
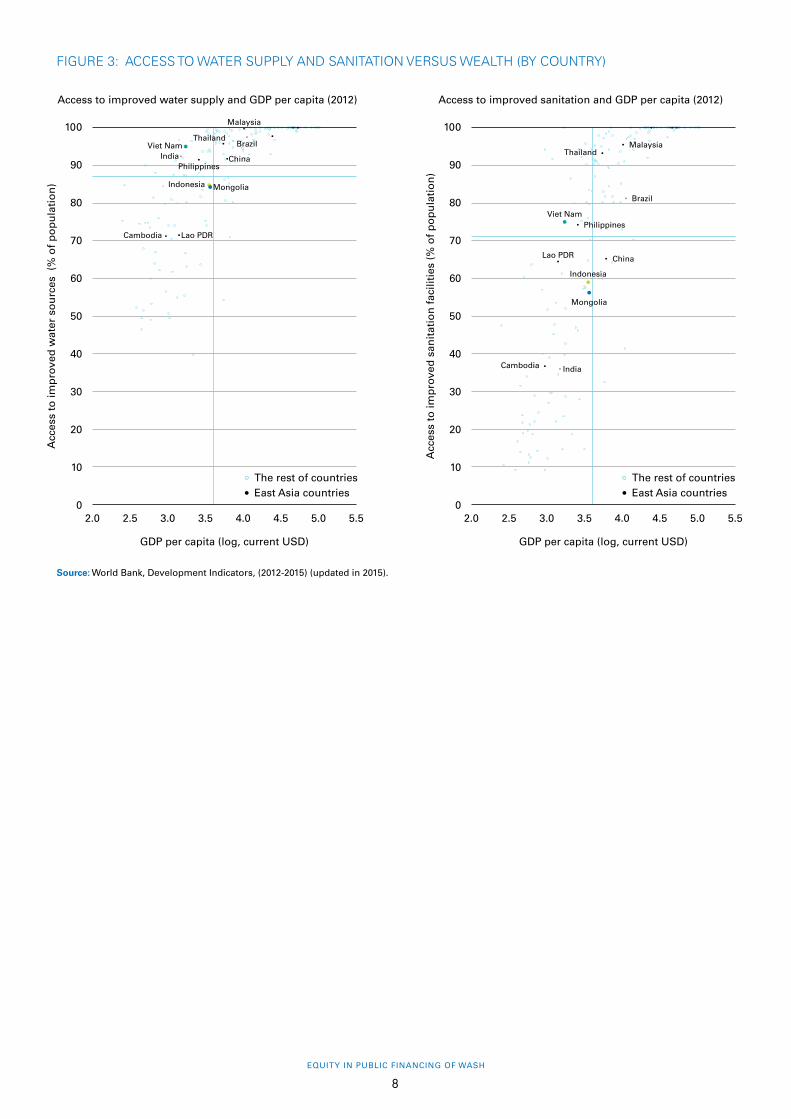
Finally, while Indonesia and Mongolia have slightly lower than average levels of access to improved water supply and sanitation facilities at average GDP per capita levels, Viet Nam has achieved higher levels of access to improved water supply and sanitation facilities at lower than average GDP per capita levels (see Figure 3).
EQUITY IN PUBLIC FINANCING OF WASH
8
FIGURE 3: ACCESS TO WATER SUPPLY AND SANITATION VERSUS WEALTH (BY COUNTRY)
Source: World Bank, Development Indicators, (2012-2015) (updated in 2015).
Access to improved water supply and GDP per capita (2012)
100
90
80
70
60
50
40
30
20
10
0 2.0 2.5 3.0 3.5 4.0 4.5 5.0 5.5
Acc
ess
to im
pro
ved
wat
er s
ou
rces
(%
of
po
pu
lati
on
)
GDP per capita (log, current USD)
The rest of countriesEast Asia countries
Malaysia
ThailandBrazilViet Nam
India ChinaPhilippines
Indonesia Mongolia
Cambodia Lao PDR
Access to improved sanitation and GDP per capita (2012)
100
90
80
70
60
50
40
30
20
10
0 2.0 2.5 3.0 3.5 4.0 4.5 5.0 5.5
Acc
ess
to im
pro
ved
san
itat
ion
fac
iliti
es (
% o
f p
op
ula
tio
n)
GDP per capita (log, current USD)
The rest of countriesEast Asia countries
MalaysiaThailand
Brazil
Viet NamPhilippines
Lao PDR China
Indonesia
IndiaCambodia
Mongolia

2. ANALYSIS OF WASH PFM AND FINANCING IN INDONESIA, MONGOLIA AND VIET NAM
9
2 ANALYSIS OF WASH PFM AND FINANCING IN INDONESIA, MONGOLIA AND VIET NAM
This section of the report first takes stock and highlights the main features of the WASH PFM and financing system – WASH public spending, institutional framework, expenditure responsibilities, resource financing, and service agreement between the local government and service providers – in the three country cases. A serious diagnostic of the system and clear direction for reform needs to be based on a solid understanding of how the current system works. The end of this section focuses on the issue and challenges in each of the main areas of the current system.
2.1 WASH PUBLIC SPENDING IN INDONESIA, MONGOLIA AND VIET NAM
Public expenditure relative to GDP in all three countries is relatively modest, with public financing for water supply and sanitation (WSS) hovering between 0.15-0.2 per cent of GDP (which in most cases is less than 1 per cent of public expenditure) (see Figure 4). The very low share on water, sanitation and hygiene spending suggests that this sector is not given a high priority at the national level, partly due to other sector priorities, such as education and health.
Although comparisons to other countries are limited by the availability of data, these levels of public expenditure are much lower than that of low-income countries in Africa.
FIGURE 4: AVERAGE AS A PERCENTAGE OF WSS EXPENDITURE GDP FOR COUNTRIES WITH WSS PER DATA
Source: Calculated by authors based on WSS PERs World Bank and Development Indicators, (2012-2015) (updated in 2015).
0.8
0.7
0.6
0.5
0.4
0.3
0.2
0.1
0
Ave
rag
e W
SS
exp
end
itu
re
(% G
DP
)
Mongolia
(02-
10)
Indones
ia (0
8-10
)
Viet N
am (0
9-11
)
Ivory
Coa
st (02
-07)
Camer
oon (
02-07
)
Mad
agas
car (
00-05
)
Centra
l Afri
can R
epub
lic (0
2-08)
Togo
(02-0
8)
Congo
, Rep
ublic
(02-0
8)
Ethiop
ia (08
)
Burkin
a Fas
o (01
-07)
Congo
, DR (0
2-08)
Ghana
(01-0
6)
Mali
(01-1
6)
Mex
ico (0
4)
Niger (
02-17
)
Egypt
(05)
Tanz
ania
(01-06
)
El Sav
ador
(90-0
3)
Moz
ambiq
ue (0
2, 08
)
Countries (Data from WSS Public Expenditure Reviews)
Classification of the functions of
government
General administration
Economic affairs
Public worksand housing
Environmental protection
Water supply
Health
Education
Social protection
Land use/ planning
Sanitation
Drainage
Solid waste
Hygiene

EQUITY IN PUBLIC FINANCING OF WASH
10
By comparing data from WSS public expenditure reviews (see Figure 5), all three countries have achieved relatively high levels of access to improved water supply and sanitation facilities while maintaining low levels of public expenditure.
In all three cases, household access to improved water supplies is facilitated by readily accessible shallow water tables and springs enabling a culture of self-provision to emerge. In the case of Mongolia, access to improved water is due to the legacy of self-provision from protected community wells in rural areas and Soviet-financed networked systems in urban areas. In all three countries, access to private bottled drinking water is already significant and expanding rapidly.
Given the failures of state subsidy programmes for latrine construction, there is minimal public funding for household sanitation. With the emergence of community-led sanitation and sanitation marketing approaches, the financing of latrine construction is primarily with households. The role of the central government has been to finance the mobilization and monitoring of progress in sanitation, while local government’s financing is directed towards capital investments in drainage systems (and hence more in the realm of environmental sanitation than the safe disposal of excreta). Financing for solid waste is primarily borne by households, either as a payment to public providers or through self-management.
2.2 INSTITUTIONAL FRAMEWORK AND PUBLIC RESPONSIBILITIES FOR WASH SERVICES
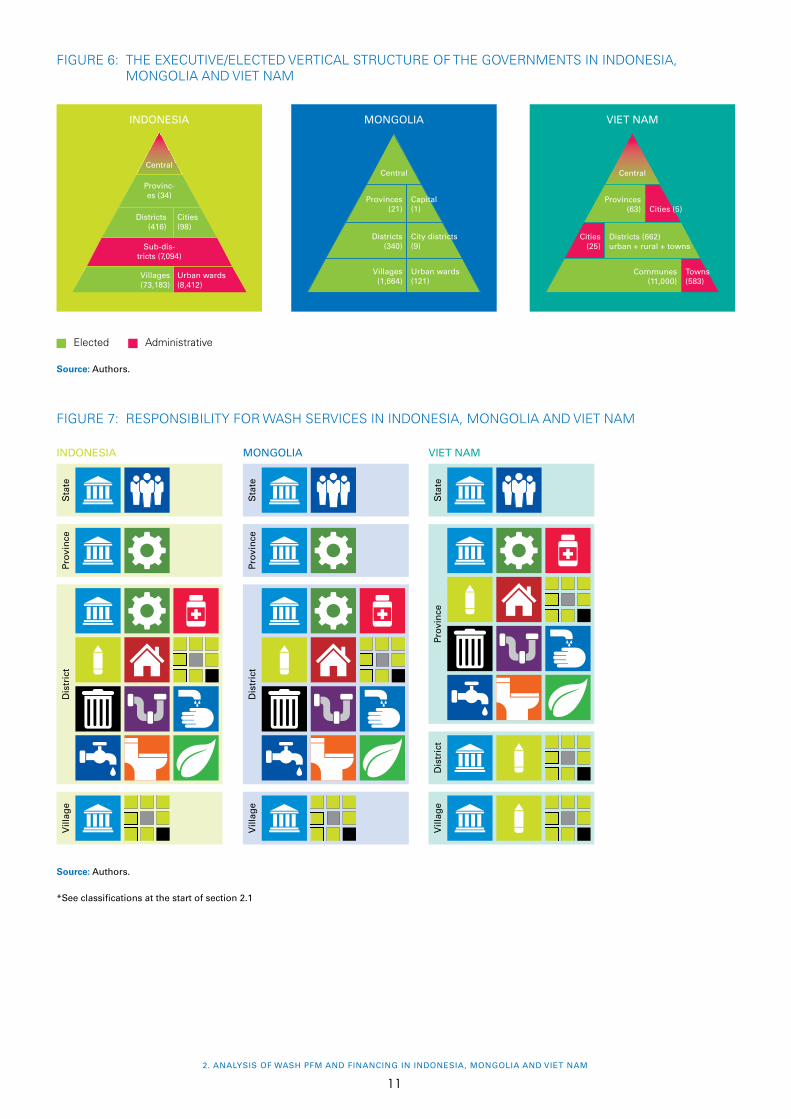
Vertical structures of the governments in the three countries vary (see Figure 6).
In all three countries, the policy, legislative and regulatory functions, including evaluating and enforcing sector progress in WASH is the exclusive responsibility of the central government, whereas the WASH service provision function has been assigned to local government. In accordance with the regulatory frameworks, the central government is only involved in large-scale, national-level WASH infrastructure. In Mongolia and Indonesia, the responsibility for the service provision function has been decentralized to the district level, whilst in Viet Nam this is the responsibility of the provincial government. Different tiers of the government in the three countries have distinct WASH functions assigned (see Figure 8).
The service provision function exercised by local governments in all three countries entails the responsibility to establish the means (i.e., define the rules, plans and budget allocations) to create WASH assets (i.e., financial, physical, social and human). In addition, it entails the responsibility to deploy the resources to manages these WASH assets (i.e., human resources, operations and maintenance (O&M)) to ensure the safe, sufficient,
FIGURE 5: AVERAGE RECENT WSS EXPENDITURE AS A PERCENTAGE OF GDP VERSUS IMPROVED ACCESS TO WATER AND SANITATION
Source: Calculated by authors based on WSS Public Expenditure Reviews.
Access to water vs WSS expenditure
0.8
0.7
0.6
0.5
0.4
0.3
0.2
0.1
0
Ave
rag
e W
SS
exp
end
itu
re
(% G
DP
)
Average access to improved water supply (% population)
0 20 40 60 80 100
Viet NamIndonesia
Mongolia
Access to sanitation vs WSS expenditure
0.8
0.7
0.6
0.5
0.4
0.3
0.2
0.1
0
Ave
rag
e W
SS
exp
end
itu
re
(% G
DP
)
Average access to improved sanitation (% population)
0 20 40 60 80 100
Viet Nam
Indonesia
Mongolia
2. ANALYSIS OF WASH PFM AND FINANCING IN INDONESIA, MONGOLIA AND VIET NAM
11
FIGURE 6: THE EXECUTIVE/ELECTED VERTICAL STRUCTURE OF THE GOVERNMENTS IN INDONESIA, MONGOLIA AND VIET NAM
Source: Authors.
Source: Authors.
*See classifications at the start of section 2.1
FIGURE 7: RESPONSIBILITY FOR WASH SERVICES IN INDONESIA, MONGOLIA AND VIET NAM
MONGOLIA
Central
Provinces (21)
Capital (1)
Districts (340)
City districts (9)
Villages (1,664)
Urban wards (121)
INDONESIA
Central
Provinc-es (34)
Districts (416)
Cities (98)
Sub-dis-tricts (7,094)
Villages (73,183)
Urban wards (8,412)
VIET NAM
Central
Provinces (63) Cities (5)
Cities (25)
Districts (662)urban + rural + towns
Communes (11,000)
Towns (583)
Elected Administrative
MONGOLIA
Sta
tePr
ovin
ceD
istr
ict
Vill
age
INDONESIA
Sta
tePr
ovin
ceD
istr
ict
Vill
age
VIET NAM
Sta
tePr
ovin
ceD
istr
ict
Vill
age
EQUITY IN PUBLIC FINANCING OF WASH
12
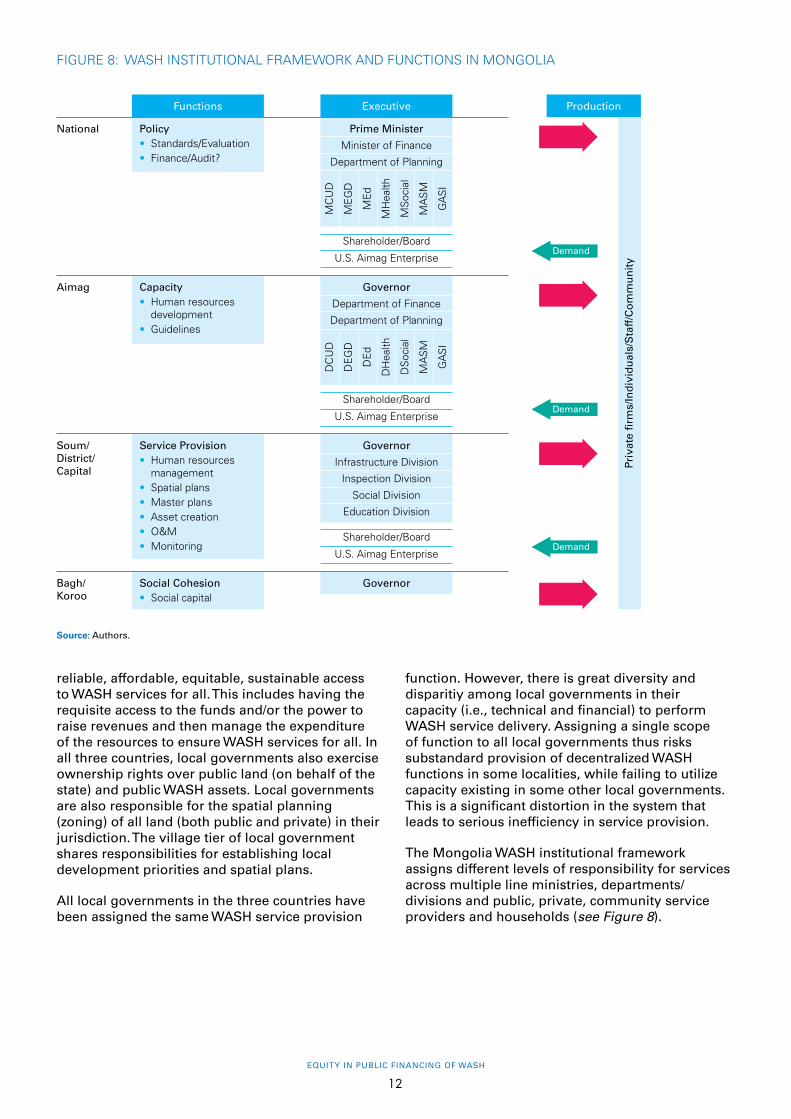
reliable, affordable, equitable, sustainable access to WASH services for all. This includes having the requisite access to the funds and/or the power to raise revenues and then manage the expenditure of the resources to ensure WASH services for all. In all three countries, local governments also exercise ownership rights over public land (on behalf of the state) and public WASH assets. Local governments are also responsible for the spatial planning (zoning) of all land (both public and private) in their jurisdiction. The village tier of local government shares responsibilities for establishing local development priorities and spatial plans.
All local governments in the three countries have been assigned the same WASH service provision
function. However, there is great diversity and disparitiy among local governments in their capacity (i.e., technical and financial) to perform WASH service delivery. Assigning a single scope of function to all local governments thus risks substandard provision of decentralized WASH functions in some localities, while failing to utilize capacity existing in some other local governments. This is a significant distortion in the system that leads to serious inefficiency in service provision.
The Mongolia WASH institutional framework assigns different levels of responsibility for services across multiple line ministries, departments/divisions and public, private, community service providers and households (see Figure 8).
FIGURE 8: WASH INSTITUTIONAL FRAMEWORK AND FUNCTIONS IN MONGOLIA
Governor
Infrastructure Division
Inspection Division
Social Division
Education Division
Shareholder/Board
U.S. Aimag Enterprise
Governor
Department of Finance
Department of PlanningD
CU
D
DE
GD
DH
ealth
DS
ocia
l
GA
SI
DE
d
MA
SM
Shareholder/Board
U.S. Aimag Enterprise
Soum/ District/Capital
Service Provision• Human resources
management• Spatial plans• Master plans• Asset creation• O&M• Monitoring
Functions
National Policy• Standards/Evaluation• Finance/Audit?
Executive
Prime Minister
Minister of Finance
Department of Planning
MC
UD
ME
GD
MH
ealth
MS
ocia
l
GA
SI
ME
d
MA
SM
Shareholder/Board
U.S. Aimag Enterprise
Aimag Capacity• Human resources
development• Guidelines
GovernorBagh/ Koroo
Social Cohesion• Social capital
Production
Priv
ate
firm
s/In
div
idu
als/
Sta
ff/C
om
mu
nit
y
Demand
Demand
Demand
Source: Authors.

2. ANALYSIS OF WASH PFM AND FINANCING IN INDONESIA, MONGOLIA AND VIET NAM
13
2.3 FISCAL SIGNIFICANCE OF CENTRAL AND LOCAL GOVERNMENT WASH FUNCTIONS
In all three countries, public finance budget data from the ministries of finance and line ministries were available to varying degrees. Budget data for Viet Nam were very limited. Furthermore the budget classification in Viet Nam is by line item, constraining the reading of the budget according to WASH functions/programmes. Nonetheless, while budgets are extremely important in predicting where public finance should be spent, it is the public accounts that capture where public funds were actually spent. In all three countries, this was not possible because of a lack of structured segmented accounting codes that enable expenditure data to be filtered across sectors, expenditure types and tiers of government. For example, the local government accounting codes in Indonesia were fully itemized but not segmented nor aligned with the central government accounting codes, while the accounting codes in Mongolia were not aligned with the budget codes. The shortcomings of the accounting codes in Viet Nam, Mongolia and Indonesia impact the ability and transparency of WASH public spending data by level of government, programme, function and economic classification. An improved accounting code structure that is aligned with the budgeting codes would enable a better linkage between the planned and executed budget. It is also essential
in assessing the efficiency and effectiveness of public spending to link funds to service results. Furthermore, accounting codes for local and central governments must be comparable to ensure that the central government can monitor and evaluate the use of funds and ensure quality in usage of funds.
The lack of available budget data, as well as the budget and accounting code structure, have limited the analysis of the fiscal significance of central and local government WASH functions in all three countries. According to the full set of financial data obtained for Indonesia (see Figure 9), in 2010, most of the spending in water, sanitation and hygiene was allocated towards capital spending, followed by goods and services. The central government incurred significant expenditures in WASH asset creation.
The central government has been identified as the major government founder, designer and builder of WASH assets in Mongolia and Viet Nam as well, contravening the legal regulatory framework in these countries.
Furthermore, analysis reveals that the central government in Indonesia (see Figure 10), Mongolia and Viet Nam has low levels of spending in its core areas of responsibility, namely policy formulation and guidelines, the setting of sector standards and the evaluation of sector performance, capacity building as well as technical support.
FIGURE 9: INDONESIA WASH SPENDING BY LEVEL OF GOVERNMENT IN 2010
Source: Indonesia PER WSS, World Bank, 2015.
Personnel
Goods and services
Capital
Social aid
100
90
80
70
60
50
40
30
20
10
0
Perc
enta
ge
Central Province District
13.20
78.8
7.9
7.7
16.5
75.7
0
1.7
17.4
80.9
0

EQUITY IN PUBLIC FINANCING OF WASH
14
Central government WASH capital expenditures primarily consist of urban water and sewerage treatment facilities or rural piped water networks. In all three countries, the only area where local governments play a major role in WASH capital expenditure is in the creation of drainage systems. Although not intended for this particular purpose, these drainage networks tend to collect and transfer storm water and solid waste, faecal sludge and effluent. These drainage systems, therefore, play an important role in local waste management.
Furthermore, local governments in all three countries tend not to have significant budgets for salaries, repairs and the maintenance of WASH services. This is due to the fact that such services and their operations are generally the responsibility of service providers, such as local government-owned utilities, communities and firms. In addition, local governments in Mongolia, Viet Nam and Indonesia have minimal expenditure on licensing, inspection and enforcement of quality standards on WASH service providers. The standard shareholder agreements signed between local government and service providers in these three countries do not cover elements of performance, sanctions or quality of service provisions. For example, WASH service provision regulations in rural communities in all three countries require the provider to recover 100 per cent of their salaries, wages, equipment, repairs and maintenance expenditure from the tariffs they collect. Due
to the low spending on licensing and quality control of WASH service providers as well as the typology of service shareholders agreements, local governments in all three countries are thus failing to ensure the quality of service provision.
In all three countries, the division or roles and responsibilities for the provision of WASH services is still unclear.
Furthermore, the central government, while stepping into the local government’s asset-creation mandate, tends to build infrastructure that is heavily overdesigned and does not meet local needs. This creates instances, such as in Viet Nam, where sanitation facilities are built in local clinics with low water pressure; or in schools in Mongolia where there is no connection of sanitation facilities to central water systems. Once the WASH asset is created, central government hands it over to the local government. In all three countries, the local government (once a WASH asset has been transferred to them by central government) tends to transfer ownership to a local government-owned service provider or to the community. Asset owners often do not have the necessary budgets or funding to pay for the running of such an asset. As asset owners did not invest in the creation of the asset, and in the absence of sufficient funds, they underspend on O&E in the hope that the central government will refinance system rehabilitation and improvements when it deteriorates. This perverse
FIGURE 10: INDONESIA CENTRAL GOVERNMENT WATER AND SANITATION SPENDING BY PROGRAMME IN 2010-2013
Source: Indonesia PER WSS, World Bank, 2015.
8,000
6,000
4,000
2,000
0
IDR
bill
ion
2010 2011 2012 2013
Capacity building
Administration
Policy development and monitoring
Infrastructure
4,000
3,000
2,000
1,000
0
IDR
bill
ion
2010 2011 2012 2013
Administration
Infrastructure-drainage
Infrastructure-solid waste
Infrastructure-waste water
Policy development and monitoring
Water spending by programme Sanitation spending by programme
2. ANALYSIS OF WASH PFM AND FINANCING IN INDONESIA, MONGOLIA AND VIET NAM
15
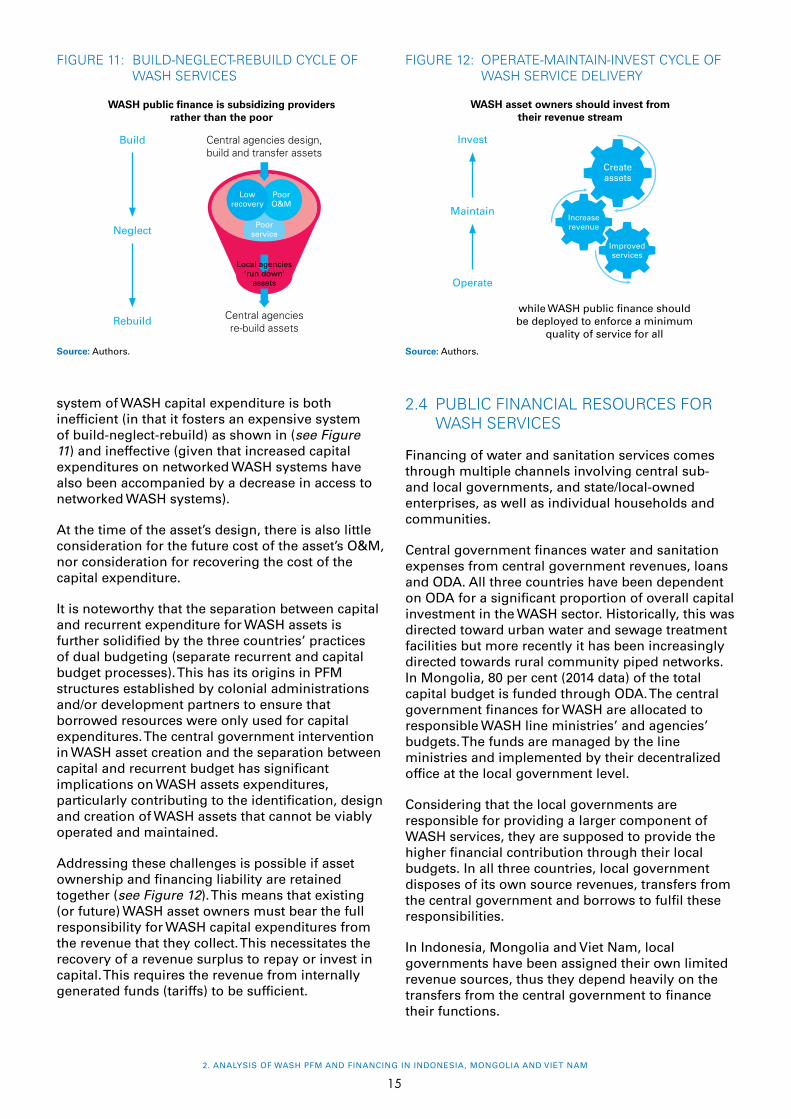
system of WASH capital expenditure is both inefficient (in that it fosters an expensive system of build-neglect-rebuild) as shown in (see Figure 11) and ineffective (given that increased capital expenditures on networked WASH systems have also been accompanied by a decrease in access to networked WASH systems).
At the time of the asset’s design, there is also little consideration for the future cost of the asset’s O&M, nor consideration for recovering the cost of the capital expenditure.
It is noteworthy that the separation between capital and recurrent expenditure for WASH assets is further solidified by the three countries’ practices of dual budgeting (separate recurrent and capital budget processes). This has its origins in PFM structures established by colonial administrations and/or development partners to ensure that borrowed resources were only used for capital expenditures. The central government intervention in WASH asset creation and the separation between capital and recurrent budget has significant implications on WASH assets expenditures, particularly contributing to the identification, design and creation of WASH assets that cannot be viably operated and maintained.
Addressing these challenges is possible if asset ownership and financing liability are retained together (see Figure 12). This means that existing (or future) WASH asset owners must bear the full responsibility for WASH capital expenditures from the revenue that they collect. This necessitates the recovery of a revenue surplus to repay or invest in capital. This requires the revenue from internally generated funds (tariffs) to be sufficient.
2.4 PUBLIC FINANCIAL RESOURCES FOR WASH SERVICES
Financing of water and sanitation services comes through multiple channels involving central sub-and local governments, and state/local-owned enterprises, as well as individual households and communities.
Central government finances water and sanitation expenses from central government revenues, loans and ODA. All three countries have been dependent on ODA for a significant proportion of overall capital investment in the WASH sector. Historically, this was directed toward urban water and sewage treatment facilities but more recently it has been increasingly directed towards rural community piped networks. In Mongolia, 80 per cent (2014 data) of the total capital budget is funded through ODA. The central government finances for WASH are allocated to responsible WASH line ministries’ and agencies’ budgets. The funds are managed by the line ministries and implemented by their decentralized office at the local government level.
Considering that the local governments are responsible for providing a larger component of WASH services, they are supposed to provide the higher financial contribution through their local budgets. In all three countries, local government disposes of its own source revenues, transfers from the central government and borrows to fulfil these responsibilities.
In Indonesia, Mongolia and Viet Nam, local governments have been assigned their own limited revenue sources, thus they depend heavily on the transfers from the central government to finance their functions.
FIGURE 11: BUILD-NEGLECT-REBUILD CYCLE OF WASH SERVICES
FIGURE 12: OPERATE-MAINTAIN-INVEST CYCLE OF WASH SERVICE DELIVERY
Source: Authors.
Poor service
Poor O&M
WASH public finance is subsidizing providers rather than the poor
Build Central agencies design, build and transfer assets
Neglect
Rebuild Central agencies re-build assets
Low recovery
Local agencies ‘run down’
assets
Source: Authors.
WASH asset owners should invest from their revenue stream
Invest
Maintain
Operate
while WASH public finance should be deployed to enforce a minimum
quality of service for all
Create assets
Increase revenue
Improved services

EQUITY IN PUBLIC FINANCING OF WASH
16
In Mongolia and Viet Nam, government fiscal rules undermine the local government’s collection effort as well as allocated efficiency. In Mongolia, collected internal revenues exceeding 30 per cent of the budget must be transferred to the higher level of government, while in Viet Nam over-realized revenue must be allocated to wages and salaries (50 per cent), capital expenditures (30 per cent) and other expenditures (20 per cent). Furthermore, it is noteworthy that most of local government revenues are discretionary and thus not targeted to be spent in water, sanitation and hygiene.
In Indonesia and Mongolia, transfers from the central government represent a considerable percentage of local government budgets (in both cases more than 50 per cent) (see Figure 13). There are different types of grants – general purpose, earmarked and capital – transferred to the local governments. These types of grants are part of the local government’s budget and channelled to these entities through the Treasury and disbursed, in most cases, according to cash flow plans presented by the local authorities to the Ministry of Finance. Indonesia and Mongolia dispose of earmarked transfers that contribute to spending in WASH. The Local Development Fund (LDF) in Mongolia is a capital grant attributed to local authorities (Soums) to finance capital projects, mainly rehabilitation and refurbishment, included in the Local Development Plan.
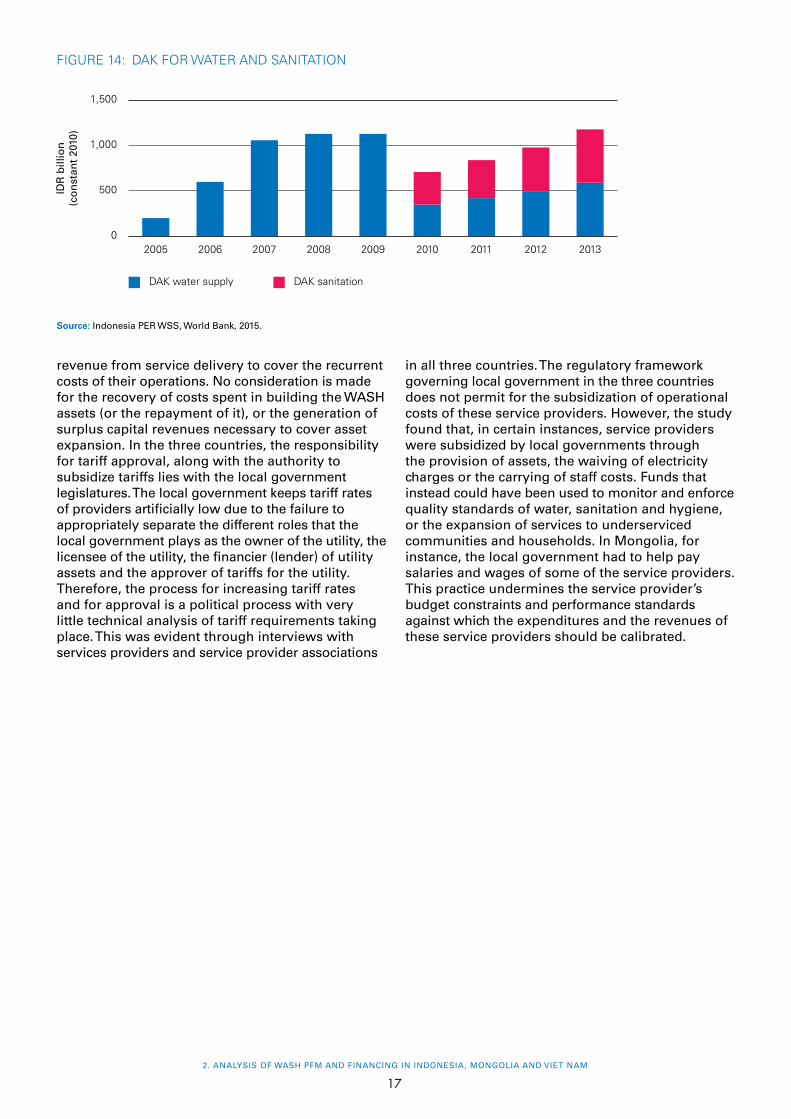
In Indonesia, the specific-purpose grants Dana Alokasi Khusus (DAK) transfer finance investment expenditures that are identified as national
priorities. The allocation of DAK for water infrastructure started in 2005, followed by sanitation in 2010. The DAK allocation is equally spent between water and sanitation services (see Figure 14). DAK contributes, on average, about 21 per cent to the total local expenditure in WASH. Thus, other funding sources in the form of transfers and own revenues contribute greatly to the sector spending at the local level.
Furthermore, the central government transfers focus primarily on the input level and there is little attention paid to whether the services or goods delivered through these transfers are actually realized.
In all three countries, the local government can borrow money from the central government to finance capital expenditures. To be eligible for central government loans, the local government should meet certain conditions including the ratio of outstanding debt-to-revenue (maximum 75 per cent in Indonesia) as well as the debt-service coverage ratio (not less than 2.5 per cent in Indonesia) and no arrears, especially for long-term loans. In Indonesia, for example, local governments take loans to finance water and sanitation capital expenditures through granting mechanisms that enable funds from overseas to be channelled to local governments.
Finally, locally owned state enterprises are also supposed to contribute to the sector from internally generated revenues/tariffs. The reality is that WASH service providers are simply not collecting sufficient
FIGURE 13: COMPOSITION OF INDONESIA AND MONGOLIA LOCAL GOVERNMENTS’ BUDGET BY SOURCE OF FUND
Source: Calculation by authors based on Ministries of Finance data.
INDONESIA, 2011
General purpose transfers
Earmarked transfers (DAK included)
Own source revenues
71.0%
6.7%
22.0%
MONGOLIA, 2014
Road fund
Foreign project loans
Revenue from core activities
Revenue from non-core activities
Special programme trasfer
Local development fund
1%0%
42%
14%
1% 0%
42%
2. ANALYSIS OF WASH PFM AND FINANCING IN INDONESIA, MONGOLIA AND VIET NAM
17
revenue from service delivery to cover the recurrent costs of their operations. No consideration is made for the recovery of costs spent in building the WASH assets (or the repayment of it), or the generation of surplus capital revenues necessary to cover asset expansion. In the three countries, the responsibility for tariff approval, along with the authority to subsidize tariffs lies with the local government legislatures. The local government keeps tariff rates of providers artificially low due to the failure to appropriately separate the different roles that the local government plays as the owner of the utility, the licensee of the utility, the financier (lender) of utility assets and the approver of tariffs for the utility. Therefore, the process for increasing tariff rates and for approval is a political process with very little technical analysis of tariff requirements taking place. This was evident through interviews with services providers and service provider associations
in all three countries. The regulatory framework governing local government in the three countries does not permit for the subsidization of operational costs of these service providers. However, the study found that, in certain instances, service providers were subsidized by local governments through the provision of assets, the waiving of electricity charges or the carrying of staff costs. Funds that instead could have been used to monitor and enforce quality standards of water, sanitation and hygiene, or the expansion of services to underserviced communities and households. In Mongolia, for instance, the local government had to help pay salaries and wages of some of the service providers. This practice undermines the service provider’s budget constraints and performance standards against which the expenditures and the revenues of these service providers should be calibrated.
FIGURE 14: DAK FOR WATER AND SANITATION
Source: Indonesia PER WSS, World Bank, 2015.
1,500
1,000
500
0
IDR
bill
ion
(c
on
stan
t 20
10)
DAK water supply DAK sanitation
2005 2006 2007 2008 2009 2010 2011 2012 2013

EQUITY IN PUBLIC FINANCING OF WASH
18
3 WASH SUBNATIONAL FINANCING RECOMMENDATIONS
The study revealed that the current public spending in WASH is insufficient to meet government and SDG water and sanitation targets. Immediate priority in all three countries is to improve the low efficiency and ineffectiveness of WASH public financial management and subnational financing. This is more critical than the size of public expenditure. This section presents a series of policy interventions to which UNICEF could contribute. While the detailed reform agenda should emerge locally through a collaborative process involving all relevant stakeholders in the different countries, it is our hope that this study can contribute to this process. In summary, management for WASH public finance resources can be improved and subnational financing can be better exploited to generate better water and sanitation outcomes through a combination of several actions. Reforms in public financial management and subnational financing would create sufficient fiscal space for local initiatives and shift responsibility from the central authorities to local governments. This will enhance the accountability of public officials and improve the quality of services.
ENGAGEMENT OPPORTUNITIES
u Fiscal tracking and monitoring of WASH budgets/expenditures
The study revealed that good quality fiscal information, especially at the local government level, on WASH public budget/spending is hard to obtain. Indeed, in all three countries, WASH public finance budget/expenditure data from line ministries and Ministries of Finance was available to varying degrees. Budget data for Viet Nam was very limited. As a result, key information on national/subnational financing or spending efficiency/effectiveness are hard to address. Without such information becoming available in a timely fashion, central and local governments will remain short of sufficient data to take decisions on planning and budgeting, and budget allocation and execution. In addition, without access to such information, it would be impossible for local communities and citizens to hold local officials accountable. It is therefore important to establish a regular system of tracking and monitoring public WASH spending and performance. Different methodologies are available such as PER, PETS and the recent UNICEF child-focused public expenditure monitoring (C-PEM).
u Assignment of WASH expenditure responsibilities
The assignment of expenditure responsibilities presents different problems. First, despite all the progress that has been made to date, the assignment of expenditure responsibilities still lacks clarity in all three countries. The central government should move away from the infrastructure provider role towards policy, regulation, technical assistance and funding via local governments.
It is also important that the revision of the assignment of WASH expenditure responsibilities addresses the separation between the capital and recurrent

3. WASH SUBNATIONAL FINANCING RECOMMENDATIONS
19
FIGURE 15: THE SEPARATION OF REVENUE AND CAPITAL BUDGETING PROCESSES FROM ASSET OWNERSHIP
Source: Authors.
Capital budget
Departments of finance
Revenue budget
Revenue receipts
Revenue expenditure
Departments of planning
Capitalreceipts
Capital expenditure
Donors
Revenue Surplus
ASSET OWNERSHIP?> revenues or > liabilities
expenditures (see Figure 15). Thus the party that is responsible for building an asset is also responsible for the costs associated with the O&M of the asset. The separation of capital from recurrent expenditures means that O&M are not factored into investment decisions and are neglected during the asset life span.
Such neglect leads to major refurbishments, which is then reflected in the capital budget. By not budgeting and spending money on maintenance and small repairs, governments end up spending much more on capital rehabilitation.
While reviewing the assignment of WASH responsibilities, it is advisable to clarify the responsibility for the outcome of WASH service provision. For example, stakeholders may think that the local government is responsible for the final outcome of WASH asset creation. Or some may think that local authorities are only responsible for the physical construction and maintenance of the facilities but not for finding effective policy measures that would respond to the service needs of their citizens. Delineation of responsibility for WASH service outcomes will contribute to clarifying accountability relations.
Second, to avoid mismatches between functions and funding, it is important to calculate the expenditure needs that are associated with expenditure assignments. In all countries, the costing of expenditure responsibilities has been given little or no attention, either in legislation or in practise. A methodology should be developed to arrive at the expenditure needs based on specific assignments. The costing of expenditure responsibilities will ensure that tiers of local government are assigned with adequate funding to fulfil their WASH competencies.
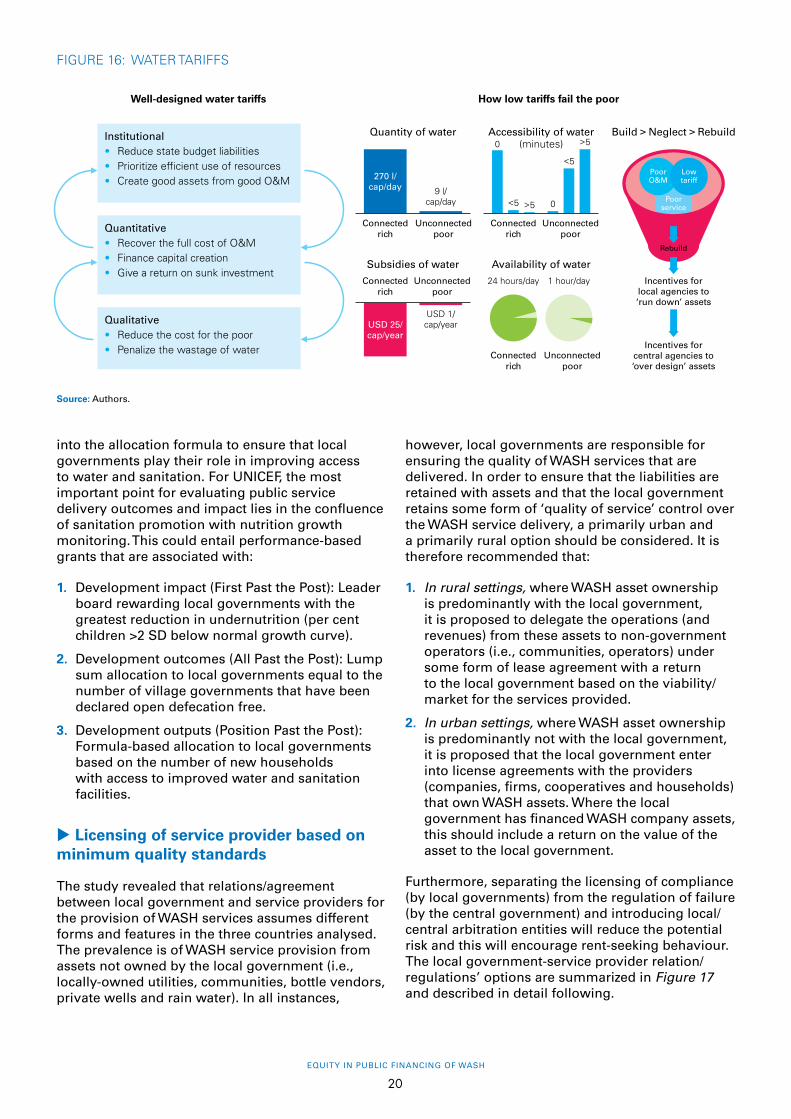
u Water tariff structure
It is fundamental to enable water service providers to increase internally generated revenues. The revision and restructuring of water tariffs should be undertaken for the following purposes:
• To cover O&M, asset creation and return on investments.
• To internalize the current external management of wastewater.
• To improve the accessibility, reliability and affordability of water services for the poor.
Even more important is the urgent political economy priority of educating the public to understand that low and poorly structured
water tariffs are inequitable, unsustainable and irresponsible. This would require technical analysis of the implications on the poor and the existing tariff structures. This would also require materials to educate politicians on the perverse incentives of depressed tariffs on asset creation processes.
u Fiscal transfers from the central government
Given that the local government is responsible for the creation of WASH assets it will be important to gradually channel central government funds to local authorities through capital grants.
In all three countries, intergovernmental transfers from the central government are used as a mechanism to correct imbalance between local governments through a relatively robust, formula-based equalization transfer system. This formula-based transfer allocates greater revenue to local governments with greater expenditure responsibilities and to those with lower revenue potential. In all three countries, the intergovernmental transfer system is characterized by a lack of performance incentives. There are no measures to incentivize local government to achieve outputs or to achieve efficient and effective expenditure. A WASH performance-based grant should be established which would set up access conditions for local governments. The access conditions should prescribe the minimum actions to be taken by the local government for strengthening the quality of WASH service provision, for example the licensing and record keeping of monitoring visits paid to service providers. In addition, the performance grant would provide additional resources to the local government for improved water and sanitation outcomes according to local plans. These performance incentives can be built
EQUITY IN PUBLIC FINANCING OF WASH
20
into the allocation formula to ensure that local governments play their role in improving access to water and sanitation. For UNICEF, the most important point for evaluating public service delivery outcomes and impact lies in the confluence of sanitation promotion with nutrition growth monitoring. This could entail performance-based grants that are associated with:
1. Development impact (First Past the Post): Leader board rewarding local governments with the greatest reduction in undernutrition (per cent children >2 SD below normal growth curve).
2. Development outcomes (All Past the Post): Lump sum allocation to local governments equal to the number of village governments that have been declared open defecation free.
3. Development outputs (Position Past the Post): Formula-based allocation to local governments based on the number of new households with access to improved water and sanitation facilities.
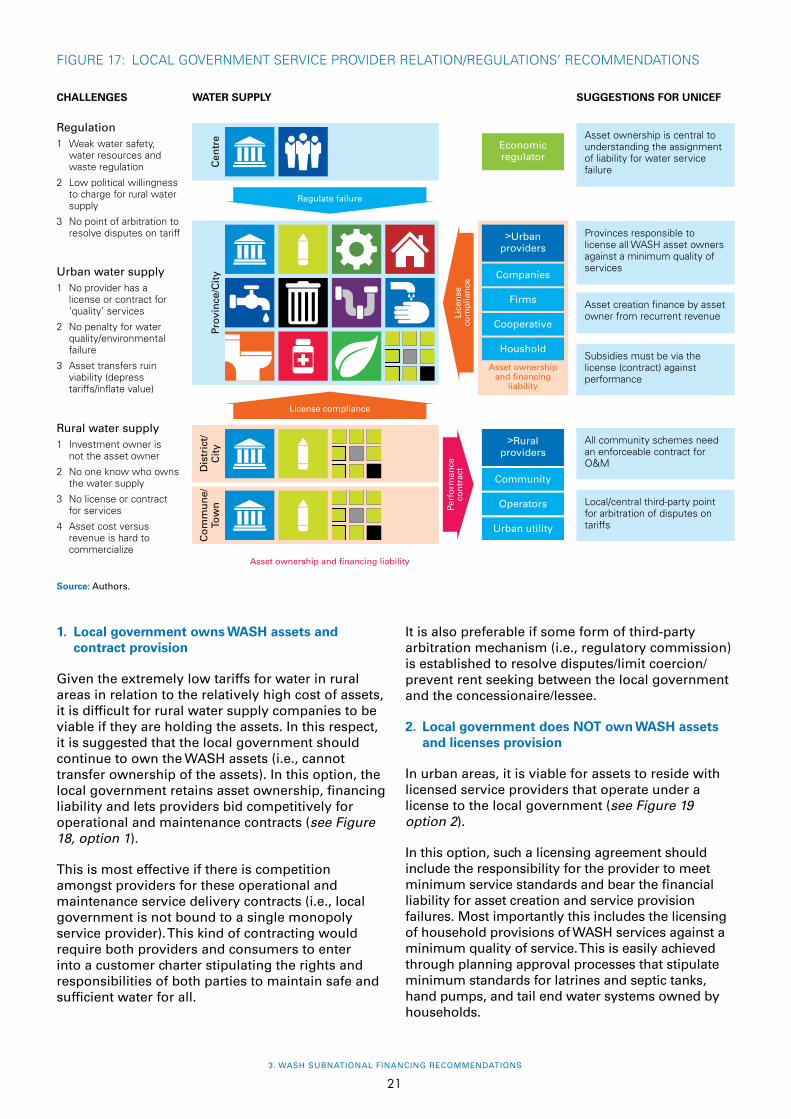
u Licensing of service provider based on minimum quality standards
The study revealed that relations/agreement between local government and service providers for the provision of WASH services assumes different forms and features in the three countries analysed. The prevalence is of WASH service provision from assets not owned by the local government (i.e., locally-owned utilities, communities, bottle vendors, private wells and rain water). In all instances,
however, local governments are responsible for ensuring the quality of WASH services that are delivered. In order to ensure that the liabilities are retained with assets and that the local government retains some form of ‘quality of service’ control over the WASH service delivery, a primarily urban and a primarily rural option should be considered. It is therefore recommended that:
1. In rural settings, where WASH asset ownership is predominantly with the local government, it is proposed to delegate the operations (and revenues) from these assets to non-government operators (i.e., communities, operators) under some form of lease agreement with a return to the local government based on the viability/market for the services provided.
2. In urban settings, where WASH asset ownership is predominantly not with the local government, it is proposed that the local government enter into license agreements with the providers (companies, firms, cooperatives and households) that own WASH assets. Where the local government has financed WASH company assets, this should include a return on the value of the asset to the local government.
Furthermore, separating the licensing of compliance (by local governments) from the regulation of failure (by the central government) and introducing local/central arbitration entities will reduce the potential risk and this will encourage rent-seeking behaviour. The local government-service provider relation/regulations’ options are summarized in Figure 17 and described in detail following.
FIGURE 16: WATER TARIFFS
Source: Authors.
Institutional• Reduce state budget liabilities• Prioritize efficient use of resources• Create good assets from good O&M
Well-designed water tariffs
Quantitative• Recover the full cost of O&M• Finance capital creation• Give a return on sunk investment
Qualitative• Reduce the cost for the poor• Penalize the wastage of water
How low tariffs fail the poor
Quantity of water
Connected rich
Unconnected poor
270 l/ cap/day 9 l/
cap/day
Subsidies of water
Connected rich
Unconnected poor
USD 25/ cap/year
USD 1/ cap/year
Accessibility of water (minutes)
Connected rich
Unconnected poor
0
<5 >5 0
<5
>5
Availability of water
Connected rich
Unconnected poor
24 hours/day 1 hour/day
Build > Neglect > Rebuild
Poor service
Incentives for local agencies to ‘run down’ assets
Poor O&M
Rebuild
Low tariff
Incentives for central agencies to ‘over design’ assets
3. WASH SUBNATIONAL FINANCING RECOMMENDATIONS
21
1. Local government owns WASH assets and contract provision
Given the extremely low tariffs for water in rural areas in relation to the relatively high cost of assets, it is difficult for rural water supply companies to be viable if they are holding the assets. In this respect, it is suggested that the local government should continue to own the WASH assets (i.e., cannot transfer ownership of the assets). In this option, the local government retains asset ownership, financing liability and lets providers bid competitively for operational and maintenance contracts (see Figure 18, option 1).
This is most effective if there is competition amongst providers for these operational and maintenance service delivery contracts (i.e., local government is not bound to a single monopoly service provider). This kind of contracting would require both providers and consumers to enter into a customer charter stipulating the rights and responsibilities of both parties to maintain safe and sufficient water for all.
It is also preferable if some form of third-party arbitration mechanism (i.e., regulatory commission) is established to resolve disputes/limit coercion/prevent rent seeking between the local government and the concessionaire/lessee.
2. Local government does NOT own WASH assets and licenses provision
In urban areas, it is viable for assets to reside with licensed service providers that operate under a license to the local government (see Figure 19 option 2).
In this option, such a licensing agreement should include the responsibility for the provider to meet minimum service standards and bear the financial liability for asset creation and service provision failures. Most importantly this includes the licensing of household provisions of WASH services against a minimum quality of service. This is easily achieved through planning approval processes that stipulate minimum standards for latrines and septic tanks, hand pumps, and tail end water systems owned by households.
Source: Authors.
FIGURE 17: LOCAL GOVERNMENT SERVICE PROVIDER RELATION/REGULATIONS’ RECOMMENDATIONS
CHALLENGES
Regulation1 Weak water safety,
water resources and waste regulation
2 Low political willingness to charge for rural water supply
3 No point of arbitration to resolve disputes on tariff
WATER SUPPLY
Cen
tre
Regulate failure
Prov
ince
/Cit
y
License compliance
Dis
tric
t/C
ity
Co
mm
un
e/To
wn
Asset ownership and financing liability
Urban water supply1 No provider has a
license or contract for ‘quality’ services
2 No penalty for water quality/environmental failure
3 Asset transfers ruin viability (depress tariffs/inflate value)
Rural water supply1 Investment owner is
not the asset owner
2 No one know who owns the water supply
3 No license or contract for services
4 Asset cost versus revenue is hard to commercialize
Lice
nse
co
mp
lian
ce
Perf
orm
ance
co
ntr
act
>Urban providers
Companies
Firms
Cooperative
Houshold
Asset ownership and financing
liability
>Rural providers
Community
Operators
Urban utility
Economic regulator
SUGGESTIONS FOR UNICEF
Asset ownership is central to understanding the assignment of liability for water service failure
Provinces responsible to license all WASH asset owners against a minimum quality of services
Asset creation finance by asset owner from recurrent revenue
Subsidies must be via the license (contract) against performance
All community schemes need an enforceable contract for O&M
Local/central third-party point for arbitration of disputes on tariffs

EQUITY IN PUBLIC FINANCING OF WASH
22
Source: Authors.
Source: Authors.
FIGURE 18: RETAINING WASH ASSETS AND FINANCING LIABILITY WITH LOCAL GOVERNMENT
FIGURE 19: DELEGATION OF WASH ASSETS AND FINANCING LIABILITY TO THE PROVIDER
OPTION 1 (more likely to occur in rural areas) Asset ownership is with local government
Rights and responsibilities of provider and customers
Provider efficiency is driven by market competition for contracts
User
Consumers
Cu
sto
mer
char
ter
Provider
Community
Firm
Urban utility
Perf
orm
ance
con
trac
t Responsibility
LOCAL GOVERNMENT
Water
Sewerage
Solid waste
Asset ownership and financing liability
Arbitration
OPTION 2 (more likely to occur in urban areas) Asset ownership is not with the local government
Rights and responsibilities of provider and customers
Provider efficiency is driven by social / labour / finance markets
User
Consumers
Cu
sto
mer
char
ter Provider
Company
Firm
Cooperative
Lice
nse
Responsibility
LOCAL GOVERNMENT
Water
Sewerage
Solid waste
Asset ownership and financing
liability
Arbitration
Household
3. WASH SUBNATIONAL FINANCING RECOMMENDATIONS
23
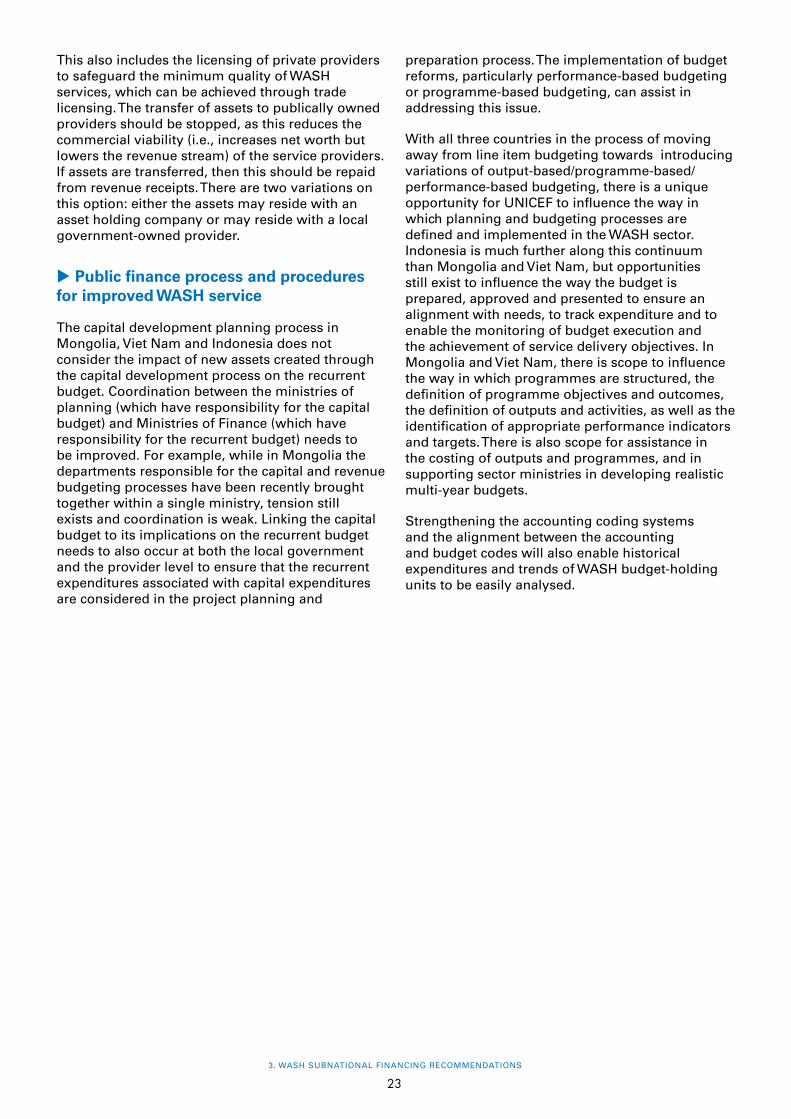
This also includes the licensing of private providers to safeguard the minimum quality of WASH services, which can be achieved through trade licensing. The transfer of assets to publically owned providers should be stopped, as this reduces the commercial viability (i.e., increases net worth but lowers the revenue stream) of the service providers. If assets are transferred, then this should be repaid from revenue receipts. There are two variations on this option: either the assets may reside with an asset holding company or may reside with a local government-owned provider.
u Public finance process and procedures for improved WASH service
The capital development planning process in Mongolia, Viet Nam and Indonesia does not consider the impact of new assets created through the capital development process on the recurrent budget. Coordination between the ministries of planning (which have responsibility for the capital budget) and Ministries of Finance (which have responsibility for the recurrent budget) needs to be improved. For example, while in Mongolia the departments responsible for the capital and revenue budgeting processes have been recently brought together within a single ministry, tension still exists and coordination is weak. Linking the capital budget to its implications on the recurrent budget needs to also occur at both the local government and the provider level to ensure that the recurrent expenditures associated with capital expenditures are considered in the project planning and
preparation process. The implementation of budget reforms, particularly performance-based budgeting or programme-based budgeting, can assist in addressing this issue.
With all three countries in the process of moving away from line item budgeting towards introducing variations of output-based/programme-based/performance-based budgeting, there is a unique opportunity for UNICEF to influence the way in which planning and budgeting processes are defined and implemented in the WASH sector. Indonesia is much further along this continuum than Mongolia and Viet Nam, but opportunities still exist to influence the way the budget is prepared, approved and presented to ensure an alignment with needs, to track expenditure and to enable the monitoring of budget execution and the achievement of service delivery objectives. In Mongolia and Viet Nam, there is scope to influence the way in which programmes are structured, the definition of programme objectives and outcomes, the definition of outputs and activities, as well as the identification of appropriate performance indicators and targets. There is also scope for assistance in the costing of outputs and programmes, and in supporting sector ministries in developing realistic multi-year budgets.
Strengthening the accounting coding systems and the alignment between the accounting and budget codes will also enable historical expenditures and trends of WASH budget-holding units to be easily analysed.

EQUITY IN PUBLIC FINANCING OF WASH
24
ANNEX 1
4 Progress on Sanitation and Drinking Water, WHO/UNICEF Joint Monitoring Program for Water Supply and Sanitation, 2013 Update.5 WHO, 2012. Tracking national financial flows into sanitation, hygiene and drinking-water. Working paper.6 WaterAid, 2008. Think local, act local. Effective financing of local governments to provide water and sanitation services. Report.
TERMS OF REFERENCE
Requesting Sections: Water Sanitation and Hygiene – WASH and Social Policy and Economic Analysis
1. Background and purpose of assignment:
Several countries in East Asia and Pacific region have achieved lower middle-income status, with commendable progress over past decades in improving water and sanitation access; however, sanitation and hygiene remains as one of the main contributing factors to high child mortality and under-nutrition (stunting and anemia) rates. Nine countries have > 30% stunting prevalence rates (SOWC, 2012), around 659 million people are without access to improved sanitation, disparities in communities and schools are stark, and open defecation poses a serious threat to child health. Water safety too also persists as a prevalent issue in many countries.
Despite rapid economic growth, inadequate sanitation and hygiene continues to be a significant problem in the East Asia and Pacific (EAP) region. Around 100 million people in the region continue to practise open defecation. The proportion of people using improved sanitation increased by 37 percentage points between 1990 and 2011 (more than double the rate of the world as a whole). According to the WHO/UNICEF Joint Monitoring Programme for Water Supply and Sanitation 2013 Update (based on 2011 dataset), 836 million more people use improved sanitation in 2011 than in 1990, the majority of them in China.4 However, 5 per cent of the regional population still practise open defecation and six countries in the region still have significant open defecation issues, with three EAP countries – Cambodia, China and Indonesia – being among the 12 countries in the world that have the largest populations practising open defecation. For improved gender and equity-focused WASH
programming, EAPRO WASH plays a critical role in generating evidence, consolidating knowledge and sharing good practices in order to i) strengthen capacity, ii) guide policy dialogue and programmatic innovations and iii) advocate for adequate resourcing and capacity for improved quality of WASH services for the un-reached and vulnerable in both development and humanitarian context.
UNICEF’s analysis and existing research suggests the persistent shortcomings in sustainable and equitable WASH services often stem from inadequate or inappropriate investments in the WASH sector. WASH expenditures often favour urban over rural areas and capital investments in infrastructure over funding for operation and maintenance, monitoring, capacity-building, and social and behavioural change communication. For example, a synthesis of bottleneck analyses on WASH in schools carried out by UNICEF shows that operation, maintenance and budget allocation are critical bottlenecks. Similarly, in promoting community approaches to sanitation, the role of local-level monitoring is critical in ensuring that communities reach open defecation free status and maintain that status over a prolonged period of time.
The scarcity of documentation on budgeting and financial flows in the WASH sector makes it very difficult to monitor aggregate or disaggregate WASH investments, or to assess the equity, efficiency and effectiveness of current financial arrangements and on-going programmes. Currently, it is often not even possible to answer the question of how much governments spend on WASH (WHO, 2012).5 WASH financing is characterized by non-transparency and multiple flows between various public and private financing units, service providers, and users. Financial reporting on WASH expenditures is often fragmented in different sectors and overall limited (WaterAid, 2008).6

ANNEX
25
7 WHO, 2014. UN-Water GLAAS TrackFin Initiative. Tracking financing to sanitation, hygiene and drinking-water at national level. Guidance document – Draft for testing.
8 The criteria will depend on the country territorial organization. However it is anticipated that the sample should include at least a rural and an urban sub-national government.
Existing multi-country and country-level initiatives have contributed to improved understanding of certain aspects of WASH financing, including the WHO-led GLAAS TrackFin initiative which seeks to track national WASH financing and is currently being piloted (WHO, 2014).7 Public Expenditure Tracking exercises are also very limited in the WASH sector. Generally, there is no comprehensive assessment of WASH financial flows from national to sub-national levels down to the operational level (i.e. schools or health centres) in East Asia and Pacific (EAP) countries. This includes not only core WASH components (i.e., urban/rural water supply and urban/rural sanitation), but other critical areas such as capacity-development, monitoring, hygiene and behaviour change promotion, and WASH facilities and services at other sectors such as education (WASH in Schools (WinS)) and health (WASH in Health Care Facilities (WinHCF)). Service Delivery Assessments undertaken in many countries in this region have also focused primarily on the national level and do not provide a clear picture of sub-national financing and budgeting processes.
The purpose of this study is to fill this knowledge gap and provide detailed mapping and analysis of planning and budgeting processes, financial flows, and allocation criteria at various levels, as well as spending levels for equitable WASH services in
FIGURE A.1: PROPORTION OF POPULATION OPENLY DEFECATING IN THE SIX EAP COUNTRIES STILL ABOVE THE DEVELOPING WORLD AVERAGE, 2011
selected case countries and sub-national areas. The study will be conducted in three case countries, namely Indonesia, Viet Nam and Mongolia, at national as well as sub-national government levels. An in-depth analysis will be conducted in 2-3 sub-national jurisdictions as samples and the analysis will include the WASH service providers in these jurisdictions. The criteria for the selection for 2-3 sub-national jurisdictions will be agreed upon with the consultant/s.8 Its added value will be an analysis that goes beyond the sector and national level and instead delves into sub-sectors (including WinS or WinHCF) and the sub-national reality. The objective is to identify bottlenecks and barriers in the existing financing and budgeting process and provide a basis and entry point for UNICEF programming and advocacy for more equitable WASH financing, including to guide future analyses of WASH financing (cost-effectiveness, cost-benefit, etc.). The study will also inform how allocation is prioritized towards addressing priorities (i.e., sanitation, hygiene promotion, capacity building, monitoring, the poorest and most disadvantaged) as well as towards addressing some of the key bottlenecks (i.e., funding for the operation and maintenance of WinS facilities and soap) for ensuring quality and sustainable access to these services for disadvantaged communities, schools and health centers. This will provide a basis for UNICEF upstream work in the WASH sector.
2. Programme area and specific projects involved:
This study is part of the following programme areas:
Outcome 3 – Programmes: Regional support and inter-country initiatives contribute to the quality and impact of policy and programmatic actions for the realization of all children’s rights in the region, including in humanitarian situations.
Output 11 – Water, Sanitation & Hygiene (WASH): Children, especially in the most vulnerable communities across the EAP region, practise safe sanitation, drink clean water and thrive in a healthy environment.
Activity area – Knowledge generation and evidence-based policies improve equity focus, targeting and gender mainstreaming.
The study is also supported by the Social Policy and Economic Analysis Section under:
Timor-
Leste
Indon
esia
Solom
on Is
lands
Lao P
DR
Kiribati
Cambo
dia
58%
37%
32%29%
24%
18%Developing World Average, 18%

EQUITY IN PUBLIC FINANCING OF WASH
26
Output – Enhanced equity and child-sensitive social policies that enable children and families to thrive and be protected from the effects of poverty and discrimination.
Activity – Development of evidence base, thematic research and advocacy on equity challenges and emerging policy issues across sectors. (420R/A0/09/203/017/002)
3. Work assignments:
The scope of work under this assignment is three-fold.
The first component involves a desk review and production of an institutional assessment of WASH budget and non-budget units, service providers, as well as decision-making processes in relation to planning, budgeting, implementation and financial management of WASH services. The assessment will allow for better understanding of the key actors involved and who is responsible for making decisions on WASH planning, budgeting, execution and monitoring at different levels of government, as well as to understand the guidance they receive or provide for financial allocation, and the allocation criteria applicable (or applied) at various levels.
Key research questions include the following:
• Who are the actors involved in the WASH sector according to territorial organization and financial autonomy? What is their mandate (functions) in the WASH sector?
• How does the planning and budgeting process for WASH look at different levels of government? What are the instruments used, and processes and procedures followed at the different levels of government and how they are linked? What is the level of collaboration between the different tiers in planning and budgeting for WASH services? What is the timeframe for the planning and budgeting of WASH services and how does this fit into the general government planning and budgeting calendar?
• How is the implementation, financial management and M&E of the WASH system performed at the different levels?
• How is the quality of planning, budgeting, implementation and M&E of the WASH sector? What are the common bottlenecks identified?
• What is the political economy of the WASH sector in the context described? What are the political and institutional dynamics affecting the decision-making process in relation to planning, budgeting, implementation and financial management of WASH services?
The envisaged methodology for the first component of the assignment is a desk review of existing reports and available information for the three case countries.
The second component of the assignment involves field work in the three case countries (Indonesia, Mongolia and Viet Nam) and a sample of sub national jurisdictions in these countries. The second component comprises of validating the assessment and Public Financial Management decision-making process of WASH services through missions to case countries. Furthermore, the second component analyses the sources of funds for the WASH sector. To assess efficiency, equity and adequacy of WASH spending, there must be a qualitative and quantitative analysis of how WASH public financial resources are allocated among the WASH financing units and service providers, and the budget versus the actual spending of funds (budget execution) at the different financing unit levels. Accordingly, this component of the assignment should improve the initial assessment with quantitative data and should produce three case country reports.
Key research questions include the following:
• Who pays? What are the financial sources of the WASH sectors (national/sub national governments; private sector; households; civil society; donors)? How much is their contribution as a percentage of total WASH expenditure? What is the composition of the expenditures (e.g., capital versus operational)? What is the weight and trend of the WASH public sector as a percentage of total public expenditure and GDP?
• Who decides? Who are the actors that determine WASH sub-sector and geographic allocation at different levels of government?
• How the financial resources are allocated to the different WASH financing units (financial flow from national to service delivery units)? What are the allocation criteria, how are they decided, and how equitable and gender-sensitive are these criteria? Are the allocations stable and predictable?
• Do the WASH financing units plan and budget according to their WASH mandate? How is the link between plans and budgets for WASH services at the different levels?
• How are the funds spent at the different levels? What is the level, stability, equity and efficiency of WASH spending at the different levels?
• How are WASH expenditures accounted, monitored and evaluated at the different levels?
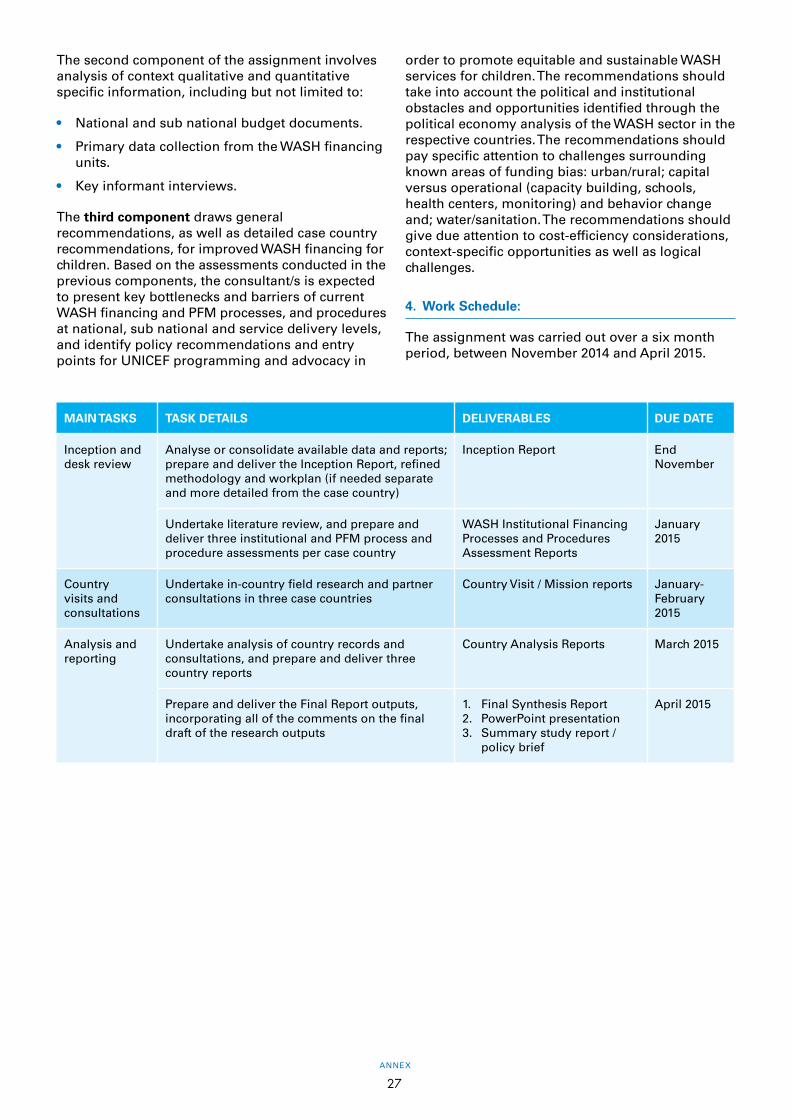
ANNEX
27
The second component of the assignment involves analysis of context qualitative and quantitative specific information, including but not limited to:
• National and sub national budget documents.
• Primary data collection from the WASH financing units.
• Key informant interviews.
The third component draws general recommendations, as well as detailed case country recommendations, for improved WASH financing for children. Based on the assessments conducted in the previous components, the consultant/s is expected to present key bottlenecks and barriers of current WASH financing and PFM processes, and procedures at national, sub national and service delivery levels, and identify policy recommendations and entry points for UNICEF programming and advocacy in
order to promote equitable and sustainable WASH services for children. The recommendations should take into account the political and institutional obstacles and opportunities identified through the political economy analysis of the WASH sector in the respective countries. The recommendations should pay specific attention to challenges surrounding known areas of funding bias: urban/rural; capital versus operational (capacity building, schools, health centers, monitoring) and behavior change and; water/sanitation. The recommendations should give due attention to cost-efficiency considerations, context-specific opportunities as well as logical challenges.
4. Work Schedule:
The assignment was carried out over a six month period, between November 2014 and April 2015.
MAIN TASKS TASK DETAILS DELIVERABLES DUE DATE
Inception and desk review
Analyse or consolidate available data and reports; prepare and deliver the Inception Report, refined methodology and workplan (if needed separate and more detailed from the case country)
Inception Report End November
Undertake literature review, and prepare and deliver three institutional and PFM process and procedure assessments per case country
WASH Institutional Financing Processes and Procedures Assessment Reports
January 2015
Country visits and consultations
Undertake in-country field research and partner consultations in three case countries
Country Visit / Mission reports January-February 2015
Analysis and reporting
Undertake analysis of country records and consultations, and prepare and deliver three country reports
Country Analysis Reports March 2015
Prepare and deliver the Final Report outputs, incorporating all of the comments on the final draft of the research outputs
1. Final Synthesis Report2. PowerPoint presentation3. Summary study report /
policy brief
April 2015
EQUITY IN PUBLIC FINANCING OF WASH
28
ANNEX 2
References
Asian Development Bank. 2010. Viet Nam Water Supply and Sanitation Sector Assessment, Strategy & Roadmap. South East Asia Department Working Paper. Manilla: ADB.
Asian Development Bank. Unknown. Financial Analysis of the Water Supply and Sewerage Authority of Ulaanbaatar City. [ONLINE] Available at: http://www.adb.org/sites/default/files/linked-documents/45007-003-sd-03.pdf [Accessed 2 April 15].
Australian Department of Foreign Affairs and Trade. 2011. Scoping Study for Solid Waste Management in Indonesia. [ONLINE] Available at: http://indii.co.id/images/import_file/201206261043390.Scoping%20Study%20for%20Solid%20Waste%20Management%20in%20Indonesia.pdf [Accessed 29 June 2015].
Australian Department of Foreign Affairs and Trade. 2015. Assessment of National Systems: Vietnam. Canberra: Department of Foreign Affairs and Trade.
Bassandorj, D. & S. Singh. 2008. Improving Local Service Delivery for the Millennium Development Goals: Rural Water Supply and Sanitation in Mongolia. New York: UNDP.
Boex, J. 2013. Analyzing the Role of the Local Public Sector in Achieving Sustainable Development: Does more Spending at the Local Level Result in Better Development Outcomes? [ONLINE] Available at: http://www.urban.org/sites/default/files/alfresco/publication-pdfs/412881-Analyzing-the-Role-of-the-Local-Public-Sector-in-Achieving-Sustainable-Development-Does-More-Spending-at-the-Local-Level-Result-in-Better-Development-Outcomes-.PDF [Accessed 3 November 15]
Bhutta ZA, Ahmed T, Black RE. 2008. What Works? Interventions for maternal and child undernutrition and survival. The Lancet Volume 371. Issue 9610, 2–8 February 2008, Pages 417–440
Brhane, M; Garzon, H; and Lkhagvadorj, A. 2013. City finances of Ulaanbataar: Mongolia. Washington: The World Bank.
General Statistical Office, UNICEF & UNFPA. 2011. Viet Nam Multiple Indicator Cluster Survey 2011. [ONLINE] Available at: http://www.childinfo.org/files/MICS4_Vietnam_FinalReport_2011_Eng.pdf [Accessed 10 November 15].
George, CM et. al. 2015. Geophagy is Associated with Environmental Enteropathy and Stunting in Children in Rural Bangladesh. [ONLINE] Available at: http://www.cmamforum.org/resource/2563 [Accessed 12 November 2015].
Gilmartin AA & W. Petri. 2015. Exploring the role of environmental enteropathy in malnutrition, infant development and oral vaccine response. Unknown.
Government of Mongolia. 2008. Millennium Development Goals based Comprehensive National Development Strategy of Mongolia. [ONLINE] Available at: http://www.adb.org/sites/default/files/linked-documents/cps-mon-2012-2016-oth-01.pdf [Accessed 9 April 15].
Hans, A. & S. Eko. 2012. Village and Sub-District Functions in Decentralized Indonesia. [ONLINE] Available at: http://psflibrary.org/catalog/repository/Village%20and%20Sub-District%20Governance,%20Antlov%20and%20Sutoro.pdf [Accessed 20 June 2015]
Humphrey J H. 2009. Child under-nutrition, tropical enteropathy, toilets, and handwashing. The Lancet, Volume 374. No. 9694, p1032–1035, 19 September 2009
Korpe P.S. & W.A. Petri. 2012. Environmental Enteropathy: Critical Implications of a Poorly Understood Condition. Trends in Molecular Medicine. Volume 18, Issue 6, June 2012, Pages 328–336.
Lewis, B. 2014. Twelve Years of Fiscal Decentralization. In H. Hall (ed). Regional Dynamics in a Decentralized Indonesia. Singapore: ISEAS

ANNEX
29
Lin, A et al. 2013. Household Environmental Conditions Are Associated with Enteropathy and Impaired Growth in Rural Bangladesh. [ONLINE] Available at: http://www.ncbi.nlm.nih.gov/pubmed/23629931 [Accessed 20 November 2015]
Lunn et. Al. 1991. Intestinal permeability, mucosal injury, and growth faltering in Gambian infants. Volume 338, Issue 8772. 12 October 1991, Pages 907–910
Lkhagvadorj, A. & M. Altankhuyag. 2014. Review Paper on Fiscal Equalisation System in Mongolia. Geneva: SDC.
Mietzner, M. 2014. Indonesia’s Decentralization: The Rise of Local Identities and the Survival of the Nation-State. In H. Hall (ed). Regional Dynamics in a Decentralized Indonesia. Singapore: ISEAS
Patunru AA & EA Rahmam. 2014. Local Governance & Development Outcomes. In H. Hall (ed). Regional Dynamics in a Decentralized Indonesia. Singapore: ISEAS
Setboonsarng, S. 2005. Child Malnutrition as a Poverty Indicator: An Evaluation in the Context of Different Development Interventions in Indonesia. [ONLINE] Available at: https://openaccess.adb.org/handle/11540/3609 [Accessed 9 July]
Shah A. 2012. General Purpose Central-Provincial-Local Transfers (DAU) in Indonesia: From Gap Filling to Ensuring Fair Access to Essential Public Services for All. [ONLINE] Available at: http://documents.worldbank.org/curated/en/2012/06/16338364/general-purpose-central-provincial-local-transfers-dau-indonesia-gap-filling-ensuring-fair-access-essential-public-services-all [Accessed 24 June 15]
Shah A. 2012. Autonomy with Equity and Accountability: Towards a More Transparent, Objective, Predictable and Simpler (TOPS) System of Central Financing of Provincial-Local Expenditures in Indonesia. [ONLINE] Available at: http://elibrary.worldbank.org/doi/abs/10.1596/1813-9450-6004 [Accessed 24 June 15]
Spears, D. 2013. How Much International Variation in Child Height Can Sanitation Explain? Policy Research Working Paper 6351. [ONLINE] Available at: http://sanitationdrive2015.org/wp-content/uploads/2013/09/sanitation-height.pdf. [Accessed 3 June 2015]
UNDP. 2013. Country Sector Assessments: UNDP GoAL WASH Programme. Volume 2. New York: UNDP.
UNICEF. 2014. Learnings from the Field 2014: WASH Schools Distance Learning Course. [ONLINE] Available at: http://www.unicef.org/wash/schools/files/Learnings_From_the_Field_2014.pdf [Accessed 21 May 15].
UNICEF. 2014. A Snapshot of Sanitation & Hygiene in East Asia & the Pacific 2014: Regional Analysis & Update. Bangkok: UNICEF
UNICEF. 2014. A Snapshot of Water Supply in East Asia & the Pacific 2014: Regional Analysis & Update. Bangkok. UNICEF
UNICEF & NCERWASS. 2014. Workshop Report: Using the Barrier Analysis Toolkit (BAT) in safe and sustainable Rural Water Supply in Vietnam. Ha Noi: UNICEF.
Urban Institute. 2014. Localising Public Services & Development: The Local Public Sector’s Role in Achieving Development Goals in Health & Education. [ONLINE] Available at: http://www.localpublicsector.org/docs/UI_DELOG_Final.pdf [Accessed 3 March 2015]
WHO. 2012. Water & Sanitation Sector Assessment Report: Vietnam 2011. [ONLINE] Available at: http://www.wpro.who.int/vietnam/topics/water_sanitation/watsan_sector_report_vietnam_2011.pdf [Accessed 10 November 15].
WHO. 2012. UN-Water GLAAS Trackfin Initiative. [ONLINE] Available at: http://www.who.int/water_sanitation_health/glaas/trackfin_guidance_document/en/ [Accessed 4 December 2014]
WHO & UNICEF. 2014. Progress on Drinking Water and Sanitation: Joint Monitoring Programme 2014. [ONLINE] Available at: http://www.who.int/water_sanitation_health/publications/2014/jmp-report/en/ [Accessed 9 September 15]
World Bank. 2005. Indonesia: Local Government Financial Management – A Measurement Framework. [ONLINE] Available at: http://documents.worldbank.org/curated/en/2005/10/7127224/indonesia-local-government-financial-management-measurement-framework [Accessed 7 March 15]

EQUITY IN PUBLIC FINANCING OF WASH
30
World Bank. 2009. Mongolia Consolidating the Gains, Managing the Booms and Busts and Moving to Better Service Delivery: A Public Expenditure and Financial Management Review. [ONLINE] Available at: http://documents.worldbank.org/curated/en/2009/01/10235297/mongolia-consolidating-gains-managing-booms-busts-moving-better-service-delivery-public-expenditure-financial-management-review-vol-1-2-core-report [Accessed 9 April 15]
World Bank. 2010. Mongolia, enhancing policies and practices for Ger area developments in Ulaanbataar. Washington: The World Bank.
World Bank. 2013. Assessment of the Financing Framework for Municipal Infrastructure in Vietnam. Washington: The World Bank
World Bank. 2013. Taking Stock: An update on Vietnam’s recent Economic Developments. Washington: The World Bank.
World Bank. 2013. Vietnam Urban Wastewater Review. [ONLINE] Available at: http://www.worldbank.org/content/dam/Worldbank/document/EAP/Vietnam/vn-urbanwastewater-summary-EN-final.pdf. [Accessed 10 November 15].
World Bank. 2014. Making The Whole Greater Than The Sum Of The Parts: A Review Of Fiscal Decentralization In Vietnam. Washington: The World Bank
World Bank. 2014. Vietnam Review of Urban Water and Wastewater Utility Reform and Regulation. [ONLINE] Available at: http://documents.worldbank.org/curated/en/2014/06/19719352/vietnam-review-urban-water-wastewater-utility-reform-regulation [Accessed 10 November 15]
World Bank. 2014. Making the whole Greater than the Sum of the Parts: A Review of Fiscal Decentralization in Vietnam. Washington: The World Bank
World Bank. 2015. More and Better Spending: Connecting People to Improved Water Supply and Sanitation in Indonesia – Public Expenditure Review. Washington: The World Bank
World Bank. 2015. Turning Finance into Services for the Future: A Regional Synthesis of the Service Delivery Assessments for Water Supply and Sanitation in East Asia and the Pacific.
World Bank. 2015. Vietnam Fiscal Transparency Review: Analysis and Stakeholder Feedback on State Budget Information in the Public Domain. [ONLINE] Available at: http://documents.worldbank.org/curated/en/2014/05/19554712/vietnam-fiscal-transparency-review-analysis-stakeholder-feedback-state-budget-information-public-domain) [Accessed 10 November 15]
World Bank. 2015. World Development Indicators. [ONLINE] Available at: http://data.worldbank.org/data-catalog/world-development-indicators. [Accessed 22 November 15]
WSP. 2006. Review of Public Financing for Water Supply & Sanitation in Indonesia. [ONLINE] Available at: http://www-wds.worldbank.org/external/default/WDSContentServer/WDSP/IB/2008/12/26/000334955_20081226074134/Rendered/PDF/455060WP0Box334087B01PUBLIC1.pdf [Accessed 3 February 15]
WSP. 2013. Review of Community-Managed Decentralized Wastewater Treatment Systems in Indonesia. [ONLINE] Available at: http://www.wsp.org/sites/wsp.org/files/publications/WSP-Review-DEWATS-Indonesia-Technical-Paper.pdf [Accessed 9 August 15]
WSP. 2014. Water Supply and Sanitation in Indonesia, Service Delivery Assessment, Turning Finance into Services. Washington: The World Bank


UNICEF East Asia and Pacific Regional Office (EAPRO)19 Phra Atit RoadBangkok 10200 ThailandTel: (66 2) 356-9499Fax: (66 2) 280-3563E-mail: [email protected]/eapro
UNICEF would like to acknowledge the financial support from the Bill and Melinda Gates Foundation (BMGF), the Australian National Committee for UNICEF, as well as Thematic WASH contributions for undertaking this study and the publication of this report.