Equity in Innovation
47
A Report from the Institute for Women’s Policy Research Equity in Innovation Women Inventors and Patents
Transcript of Equity in Innovation

A Report from the Institute for Women’s Policy Research
Equity in InnovationWomen Inventors and Patents

About This Report This report compiles existing data on women and patenting. It explores both women’s underrepresentation among patent holders and their relative success in being granted patents when they apply for them. The report identifies the technology classes that women are most likely to patent in, and examines the overall success of patents granted to women as measured by their assignment rates and citation counts. The report draws on the social science literature to identify major obstacles that women face to patenting and, based on the research findings, presents several recommendations to help to close the gender patenting gap. This report was funded by Qualcomm, Inc. About the Institute for Women’s Policy Research The Institute for Women’s Policy Research conducts and communicates research to inspire public dialogue, shape policy, and improve the lives and opportunities of women of diverse backgrounds, circumstances, and experiences. The Institute works with policymakers, scholars, and public interest groups to design, execute, and disseminate research and to build a diverse network of individuals and organizations that conduct and use women-oriented policy research. IWPR’s work is supported by foundation grants, government grants and contracts, donations from individuals, and contributions from organizations and corporations. IWPR is a 501(c)(3) tax-exempt organization that also works in affiliation with the women’s studies and public policy and public administration programs at The George Washington University.
Board of Directors Holly Fechner, Chair Covington & Burling LLP
Lorretta Johnson, Vice Chair American Federation of Teachers, AFL-CIO
William Baer, Secretary Bloomingdale's (former)
Sylphiel Yip, Treasurer INTL FCStone Financial Inc.
Martha Darling Boeing (retired)
Cindy Estrada United Automobile, Aerospace, and Agriculture Implement Workers of America, AFL-CIO
Ellen Karp Anerca International Inc.
Katherine Kimpel Shattering the Ceiling
Kai-yan Lee Vanke
Esmeralda O. Lyn Worldwide Capital Advisory Partners LLC
William Rodgers Rutgers University
Elizabeth Shuler AFL-CIO
Marci Sternheim Sternheim Consulting
Sheila Wellington NYU/Stern School of Business
Marcia Worthing New York, NY
Cathy Zoi SunEdison Frontier Power
Leslie Platt Zolov Pfizer Heidi Hartmann, President Institute for Women's Policy Research Barbara Gault, Vice President Institute for Women's Policy Research
IWPR #C448 © Copyright 2016 by the Institute for Women’s Policy Research

i
Equity in Innovation: Women Inventors and Patents
November 29, 2016
Jessica Milli, Ph.D. Emma Williams-Baron
Meika Berlan Jenny Xia
Barbara Gault, Ph.D.
ii
Acknowledgments
This project was generously funded by Qualcomm, Inc. The views and opinions expressed in this report are those of the authors and do not necessarily reflect the views and opinions of Qualcomm or its affiliates. We are grateful for helpful comments on drafts of this report by Dr. Kjersten Bunker Whittington of the Department of Sociology at Reed College, Dr. Sue Rosser, Provost and Vice President for Academic Affairs at San Francisco State University, Heidi Hartmann, President of IWPR, and Ariane Hegewisch, Program Director of Employment and Earnings at IWPR. The report benefited greatly from research assistance provided by IWPR interns Ashley Burke, Crystal Agoncillo, and Emily Davis and from the formatting, layout, and design done by Mallory Mpare-Quarles, IWPR Communications Manager, Production and Website.

iii
Table of Contents Introduction ..................................................................................................... 1 What do we know about women patent-holders? .................................. 3
Trends in Women’s Patenting ....................................................................................... 3
Trends in Patent-Intensive STEM Fields .................................................................. 8
What Technologies are Women Patenting? .............................................................. 9
Characteristics of Women-held Patents .................................................................. 11
Application Success ............................................................................................ 11
Patent Assignment ............................................................................................... 13
Patent Citations ................................................................................................... 14
The Economic and Social Impact of Patents .......................................................... 15
Why are there so few women patent holders? ....................................... 18
The Complexity and Expense of the Patenting Process ........................................ 18
The Concentration of Women in Fields and Job Tasks That Are Less Patent-Intensive ........................................................................................................................ 20
Women’s Limited Networks ........................................................................................ 22
Socialization and Biases Against Women in Commercial Science .................... 26
Lack of Uniform Support Structures Across Organizations .................................... 27
How can we address the challenges women face in patenting? ...... 29
Appendix: Data Sources ............................................................................. 34
United States Patent and Trademark Office Data .................................................. 34
National Survey of College Graduate Data ............................................................ 35
References ..................................................................................................... 36

iv
List of Figures Figure 1. Number of Patents Granted by Gender, 1977-2010 ................................... 4
Figure 2. Share of College Graduates Who Have Applied for a U.S. Patent in the Past Five Years by Gender and Race/Ethnicity, 2003 ................................................. 5
Figure 3. Share of College Graduates That Have Been Granted a U.S. Patent in the Past Five Years by Gender and Race/Ethnicity, 2003 .......................................... 6
Figure 4. Share of Patents with at least One Woman Inventor and Projection to Parity ................................................................................................................................... 7
Figure 5. Share of Patents with at Least One Female Inventor and Share of STEM Degrees Awarded to Women, 1977-2010 ..................................................................... 9
Figure 6. Top 10 Patent Classes by Share with any Women Inventors, 2010 ......... 10
Figure 7. Top 10 Patent Classes by Share with a Woman as the Primary Inventor, 2010 ................................................................................................................................... 11
Figure 8. Number of Patent Applications and Acceptance Rates by Gender of Applicant, 2000-2016 ...................................................................................................... 12
Figure 9. Assignment Status of U.S. Patents by Gender, 1975-2010 ......................... 14

1
Introduction Throughout history innovation has played a critical role in advancing both economies and societies by allowing people to address new and changing problems that emerge in the world. At its core, innovation is the powerful demonstration of problem-solving, which allows society to flourish. Innovation generates new knowledge and tools that foster economic growth and development, propel society forward, and improve the quality of life. Modern civilization innovates to advance the needs of all people and drive economic development in a sustainable and purposeful way.
Humankind faces innumerable challenges that in the years ahead will require the brainpower of top minds around the world—global climate change, food insecurity, disease outbreaks, cyber security, slow economic growth, and much more. The interdependent nature of the global community means that these issues affect individuals across different populations and borders, but the way in which each person experiences these problems can be different. These different experiences highlight the importance of multidimensional approaches to problem solving. Diversity in innovation ensures that a multifaceted lens is applied to the examination of public problems, leading to a more rigorous and productive problem-solving process. Yet, there is a significant lack of diversity at all levels of the innovation process.
William Wulf, former president of the National Academy of Engineering, notes that “At a fundamental level, men, women, ethnic minorities, racial minorities, and people with handicaps, experience the world differently. Those differences in experience are the ‘gene pool’ from which creativity springs” (Wulf 1998). Yet, the diversity of the inventors creating the technologies that help to advance society, does not match the diversity of the societies those technologies should benefit. When significant portions of the population are not represented in the innovative process, social and economic progress suffers. The exclusion of women, people of color, and members of other disadvantaged groups from invention, patenting, and entrepreneurship leaves a vast reserve of untapped potential that could be harnessed to help find solutions to the pressing issues of the day.
Although innovative activity is difficult to measure, one way of examining it is through patenting behavior. Patents serve several different purposes. They facilitate the production and mainstreaming of new products and technologies. Patents protect innovations and grant to individuals and companies ownership rights over their research, which can also motivate companies or researchers to innovate. The record keeping of patents also creates an extensive database that documents scientific research and discovery over time and across place by different people. There is some debate over the merits of the patent system, with some arguing that there are numerous benefits to the system. For the individual, patents can bring financial rewards, peer and professional recognition, promotion opportunities, and additional opportunities for collaboration. Some firms even require patenting for career advancement and bonuses, and academic institutions have started to include patenting in promotion and tenure decisions (Stevens, Johnson, and Sanberg 2011; Association of Public & Land-Grant Universities 2015; Rosser 2009). A larger patent stock has also been linked to stronger economic growth (Blind and Jungmittag 2008; Rothwell et al. 2013). On the other hand, patents can result in reduced competition in the market by preventing other firms from replicating the product or process, which can result in fewer options for consumers and higher prices.
This report focuses specifically on women’s patenting activity. Ever since Mary Kies became the first woman to be granted a United States patent in 1809 (Blakemore 2016), more and more

2
women have sought (and been granted) patents. In fact, many important and well-recognized inventions were created by women. Josephine Cochrane, for example, invented the first working dishwasher and received a patent for it in 1886. Mary Anderson received a patent for developing the first windshield wiper and received a patent for it in 1903. And in 1964, Stephanie Kwolek first developed Kevlar (Edmonds 2011). In spite of the many notable examples of such famous female inventors, women make up only a small portion of all patent holders in the United States, indicating that they continue to face obstacles to patenting.
To present a clear picture of women’s experience in the patenting system, this report compiles existing data on women’s patenting behavior. How many patents have female inventors listed on them? What types of technologies do women patent? How successful are women who apply for patents in getting them granted? The report highlights the fact that women are dramatically underrepresented among patent holders, yet mixed-sex inventing teams tend to produce better results than men- or women-only teams. Thus, increasing diversity and promoting women’s more active participation in commercial science could produce even more effective technologies in the future.
This report also reviews the literature exploring the reasons for women’s underrepresentation in patenting. One of the primary explanations that has been put forward is that patenting is prevalent in STEM fields and women are also underrepresented in STEM fields. While the literature does indicate that women’s underrepresentation in STEM plays a small role in their relatively lower patenting activity, research shows that women’s underrepresentation in key patent-intensive STEM fields, such as engineering, explains more of the patenting gap than women’s underrepresentation in STEM fields in general, though it is still only part of the story. The patenting process can also be difficult and costly to navigate and many women have narrower networks and fewer resources on average than men to draw on. Further, the workplace environments of women scientists themselves pose obstacles, as does their greater share of family work. Sexism and gender discrimination in the workplace, particularly in STEM fields, along with a lack of family friendly workplace policies contribute to high rates of women leaving STEM occupations, and fewer opportunities for collaboration. The report closes with recommendations for steps that policymakers can take to begin to close the patenting gap and directions for future research.

3
What do we know about women patent-holders? Data on the patenting activity of women is limited since data on gender are not collected by the U.S. Patent and Trade Office (USPTO). Surveys such as the National Survey of College Graduates (NSCG) have previously asked about respondent’s patenting activity, but such questions have not recently been fielded. Thus, most research seeking to document women’s patenting activity has predominantly relied on commercial name matching software to identify the gender of inventors in the USPTO data, introducing some margin of error in estimates of patenting activity (see the Appendix for a more detailed discussion of available data sources and their limitations). This report examines the existing data for insights about general trends in women’s and men’s patenting activity and highlights women’s underrepresentation among patent holders, but more complete data are needed to make concrete policy recommendations.
Given the limitations of the available data, a number of methods have been developed by researchers to document women’s patenting activity, each with benefits and drawbacks. The most common method is estimating the number and share of all patents that have any women listed as an inventor on the patent. This report primarily presents data from previous research utilizing this method, but also presents limited data from research estimating women’s patenting activity via primary inventorship and fractional attribution (see the Appendix for a more detailed discussion of these other methodologies along with their benefits and limitations).
The existing data point to a positive trend in women’s representation among patent holders. Between 1977 and 2010, the number of patents that had any women inventors more than quintupled. Although this indicates substantial progress, women remain severely underrepresented in the patenting arena (Figures 1 and 2). Among women who receive patents, many are concentrated in patent classes typically associated with women such as jewelry and apparel, and are less likely to have their patents cited by future patents (Figures 6 and 7). Research indicates that men-only teams also have low citation counts, while mixed-sex teams tend to produce the most successful patents as determined by the number of patent citations (Ashcraft and Breitzman 2012; L. D. Cook and Kongcharoen 2010). Given this, it is likely that improving the diversity of inventing teams would produce more patents of higher quality, but to reap these benefits it is necessary to get more women into the patenting arena to begin with. This section presents the existing data on women’s experience in patenting, documenting the progress towards increasing their representation among inventors and the challenges women face with regard to patent acceptance, assignment, and citations.
Trends in Women’s Patenting The number of all patents granted overall has been on the rise since the 1970s. As depicted in Figure 1, this trend continues despite the bursting of the dot-com bubble in the early 2000s and the Great Recession from 2007-2009. In 2010 the number of all patents granted was nearly three times the number granted in 1977. The number of patents with any women inventors listed has also seen a notable increase, though women still represent a minority of patent-holders. In 1977 just over 1,500 domestic patents had at least one female inventor, but by 2010 the number of patents with at least one female inventor increased by 15 times to just under 23,000. Over the same time period, the number of patents granted with no female inventors also increased, though at a much slower rate. In 1977, just over 43,000 patents had no female inventors; in 2010 that number had more than doubled to just under 100,000 (Figure 1).

4
Figure 1. Number of Patents Granted by Gender, 1977–2010
Note: Data represent total patent grants of U.S. origin only and do not include patent grants of foreign origin. Source: IWPR calculations based on Delixus, Inc. and National Women’s Business Council (2012a) and U.S. Patent and Trademark Office (2016).
0
20,000
40,000
60,000
80,000
100,000
120,000
140,000
1977
1978
1979
1980
1981
1982
1983
1984
1985
1986
1987
1988
1989
1990
1991
1992
1993
1994
1995
1996
1997
1998
1999
2000
2001
2002
2003
2004
2005
2006
2007
2008
2009
2010
Num
ber o
f Pat
ents
Gra
nted
At least one woman inventor No women inventors
5
0.3% 0.3% 0.5%0.9% 1.0%
0.4%
2.7%
1.5% 1.3%
5.1%
2.0%2.7%
0.0%1.0%2.0%3.0%4.0%5.0%6.0%
White Hispanic Black Asian/PacificIslander
Other Race orTwo or More
Races
All
Women Men
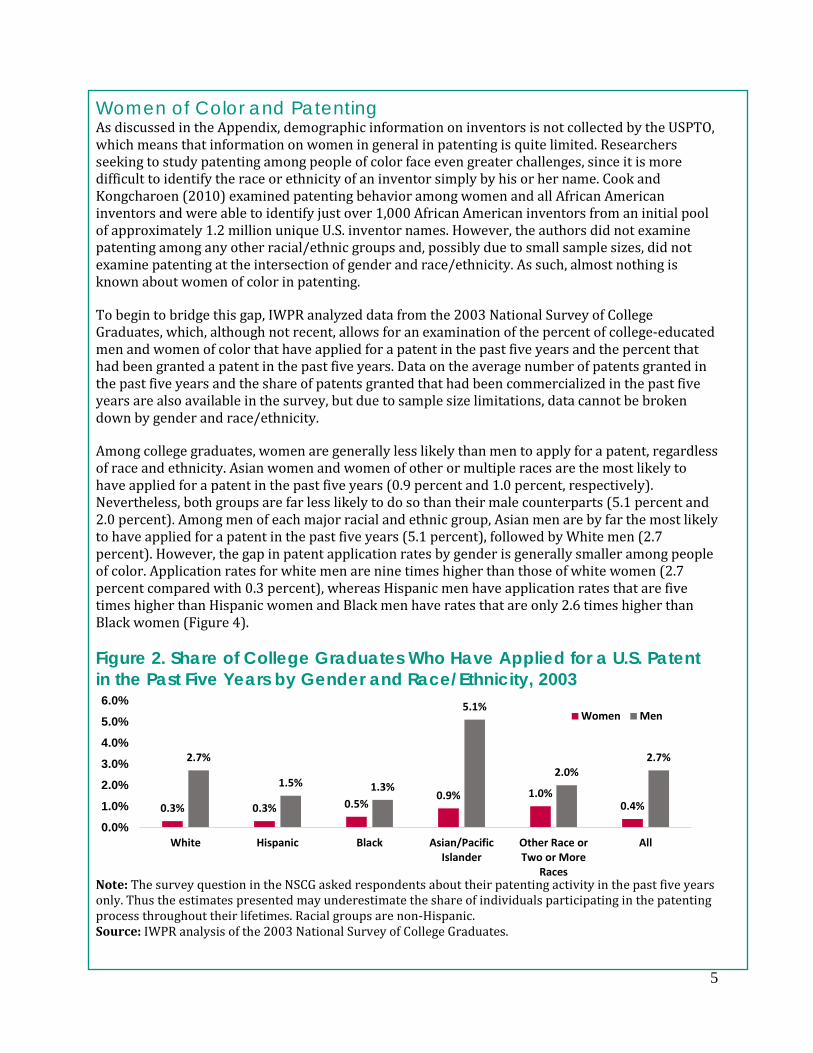
Women of Color and Patenting As discussed in the Appendix, demographic information on inventors is not collected by the USPTO, which means that information on women in general in patenting is quite limited. Researchers seeking to study patenting among people of color face even greater challenges, since it is more difficult to identify the race or ethnicity of an inventor simply by his or her name. Cook and Kongcharoen (2010) examined patenting behavior among women and all African American inventors and were able to identify just over 1,000 African American inventors from an initial pool of approximately 1.2 million unique U.S. inventor names. However, the authors did not examine patenting among any other racial/ethnic groups and, possibly due to small sample sizes, did not examine patenting at the intersection of gender and race/ethnicity. As such, almost nothing is known about women of color in patenting.
To begin to bridge this gap, IWPR analyzed data from the 2003 National Survey of College Graduates, which, although not recent, allows for an examination of the percent of college-educated men and women of color that have applied for a patent in the past five years and the percent that had been granted a patent in the past five years. Data on the average number of patents granted in the past five years and the share of patents granted that had been commercialized in the past five years are also available in the survey, but due to sample size limitations, data cannot be broken down by gender and race/ethnicity.
Among college graduates, women are generally less likely than men to apply for a patent, regardless of race and ethnicity. Asian women and women of other or multiple races are the most likely to have applied for a patent in the past five years (0.9 percent and 1.0 percent, respectively). Nevertheless, both groups are far less likely to do so than their male counterparts (5.1 percent and 2.0 percent). Among men of each major racial and ethnic group, Asian men are by far the most likely to have applied for a patent in the past five years (5.1 percent), followed by White men (2.7 percent). However, the gap in patent application rates by gender is generally smaller among people of color. Application rates for white men are nine times higher than those of white women (2.7 percent compared with 0.3 percent), whereas Hispanic men have application rates that are five times higher than Hispanic women and Black men have rates that are only 2.6 times higher than Black women (Figure 4).
Figure 2. Share of College Graduates Who Have Applied for a U.S. Patent in the Past Five Years by Gender and Race/Ethnicity, 2003
Note: The survey question in the NSCG asked respondents about their patenting activity in the past five years only. Thus the estimates presented may underestimate the share of individuals participating in the patenting process throughout their lifetimes. Racial groups are non-Hispanic. Source: IWPR analysis of the 2003 National Survey of College Graduates.

6
Not all patent applications are successful, however; generally, the share of both women and men who have been granted a patent in the past five years is lower than the share who have applied for one in the same time period. This may partly be due to the fact that patent applications can often take several years to process (Garber 2016) and that applications filed within the past five years may not have been granted yet. This effect works in the opposite direction as well—patents granted within the past five years could be the result of applications filed more than five years ago. These effects likely cancel each other out on average. Approximately 70 percent of all applications filed by women and men are ultimately accepted (see Figure 8), and this trend appears to be reflected in the NSCG data as well (though the ratio of patents granted to patents applied for is slightly lower than 70 percent for most racial/ethnic groups).
Figure 3. Share of College Graduates That Have Been Granted a U.S. Patent in the Past Five Years by Gender and Race/Ethnicity, 2003
Note: The survey question in the NSCG asked respondents about their patenting activity in the past five years only. Thus the estimates presented may underestimate the share of individuals that have ever been granted a patent. Further, data on patents granted do not necessarily correspond to the data on patent applications. Since patent applications can take several years to be approved, it is possible that some of the granted patents reflected in these data are the result of patent applications filed prior to the reference period (the past five years) and/or that applications filed within the reference period may eventually be granted but are still pending. Racial groups are non-Hispanic. Source: IWPR analysis of the 2003 National Survey of College Graduates.
As with patent applications, Asian women and women of other or multiple races are the most likely to have been granted a patent in the past five years (0.4 percent and 0.8 percent, respectively). Across all other racial and ethnic groups, only 0.2 percent of women have been granted a patent during this timeframe. Among men, Asian and White men are the most likely to have been granted a patent in the past five years (3.3 percent and 1.8 percent, respectively), whereas Black and Hispanic men are the least likely (0.8 percent and 0.9 percent; Figure 5).
0.2% 0.2% 0.2% 0.4%0.8%
0.2%
1.8%
0.9% 0.8%
3.3%
1.5%1.8%
0.0%
1.0%
2.0%
3.0%
4.0%
5.0%
6.0%
White Hispanic Black Asian/PacificIslander
Other Race or Twoor More Races
All
Women Men

7
Progress Toward Equal Representation
As a result of this rapid increase in women’s patenting activity relative to men’s, the share of patents having at least one female inventor increased substantially over the same time period. In 1977, just 3.4 percent of all patents had at least one female inventor, but by 2010 that share had more than quintupled to 18.8 percent (though progress was much slower in the early 2000’s; Calculations based on Delixus, Inc. and National Women’s Business Council (2012a)).
Figure 2 presents a simple projection into the coming decades of the share of patents with any women inventors listed. This enables us to see, based on current trends, how long it would take for the United States to reach gender “parity” in patenting. In this analysis parity is defined as half of all patents having at least one woman inventor listed, which is a crude measure since it does not account for the intensity of women’s participation in the patenting process. However, it does provide general insights into women’s underrepresentation on patenting teams more broadly. Based on the projection, at the current rate of change since 2000 women will not see parity in patenting until the year 2092 (Figure 2).1
Figure 4. Share of Patents with at least One Woman Inventor and Projection to Parity
Note: Data represent total patent grants of U.S. origin only and do not include patent grants of foreign origin. Source: IWPR calculations based on Delixus, Inc. and National Women’s Business Council (2012a) and U.S. Patent and Trademark Office (2016).
These findings indicate that women face a long path toward parity in patenting, especially since the gender gap in patenting is evident in all sectors and both across and within STEM fields. Moreover, since this method of assigning gender to a patent does not account for the female to male ratio on a team or the relative involvement of women in the patent writing process, true parity may take even 1 The projected date that women will achieve parity in patenting is sensitive to the date range used in the forecast. Figure 1 shows that much of the progress since 1977 in increasing the number of patents that have any women listed as inventors occurred in mid-1980’s through early-2000’s. With the exception of a notable increase in 2010, the number of patents with any women listed as inventors saw very little change since 2000. The estimates presented in Figure 2 incorporate only this more recent (and slower) progress in increasing women’s representation among inventors and therefore present a more conservative estimate of when the patenting gap will close. Estimates that incorporated earlier data, during which progress was more substantial, would estimate that the gap would close sooner.
0%
5%
10%
15%
20%
25%
30%
35%
40%
45%
50%
2000 2010 2020 2030 2040 2050 2060 2070 2080 2090 2100

8
longer to achieve. Yet, even though researchers have noted positive shifts in attitudes toward patenting and perceptions of opportunities within the patenting arena across cohorts of female scientists, progress has been slow (Ding, Murray, and Stuart 2006; Murray and Graham 2007).
Other methods of defining women’s patenting activity have attempted to account for the relative intensity with which women participate in the patenting arena. For example, while women have made significant progress in increasing their representation in patenting overall, the gender gap in patenting is even larger when defining women-held patents as only those whose primary inventor is a woman.2 In 1977, just two percent of all domestic patents had a woman listed as the primary inventor; this share quadrupled in size by 2010, but with only eight percent of patents having a woman listed as the primary inventor (Delixus, Inc. and National Women’s Business Council 2012a), women have a considerable way to go before achieving parity with men. Less is known about women’s representation in patenting when patents are fractionally attributed based on the gender composition of the team. However, examining IT patents from 1980 to 2010, Ashcraft and Breitzman (2012) suggest that the share is between these two extremes. Among all U.S.-invented IT patents, they find that 13 percent have at least one female inventor while only 5.6 percent have a woman listed as the primary inventor, but when patents are fractionally attributed that share increases slightly to 6.1 percent. Sugimoto et al. (2015) confirm these findings, showing that women were just 10.8 percent of all inventors on patents for whom gender was able to be determined in 2013.3
Trends in Patent-Intensive STEM Fields
Education in science, technology, engineering, and math (STEM) fields often forms the basis of knowledge crucial to inventing and patenting, and research has shown that increases in the number of graduates in STEM fields is tied to increases in patenting activity (Winters 2014). Drawing on this evidence, it is not surprising that these recent trends in women’s patenting activity are correlated with increases in the share of STEM degrees awarded to women. From 1977 to 2010, women’s patenting activity, as well as the share of STEM4 degrees awarded to women, increased noticeably. The share of patents with at least one woman inventor grew from 3.4 percent in 1977 to 18.8 percent in 2010. The share of STEM degrees awarded to women increased from 20.2 percent in 1977 to 33.5 percent in 2010 (Figure 3).
While these two trends are certainly correlated, research indicates that women’s representation in STEM is only one factor among many that influences women’s patenting rates, and that women’s representation in key patent-intensive STEM fields (such as engineering) may play an even larger role than women’s representation in STEM overall (Hunt et al. 2012). With the exception of computer science, the share of women holding degrees in each STEM sub-field has increased between 1977 and 2010 though the share of female engineering degree-holders increased more modestly from just 6.4 percent in 1977 to 19.1 percent in 2010, with progress stalling in the early 2000’s. The percent of women with computer science degrees reached a high of around 35 percent 2 A primary inventor is typically defined as the first inventor listed on a patent. While it is the usual practice in academic research to list authors in order of relative contribution, it is sometimes the case in patent applications to simply list inventors in alphabetical order. As a result, this method of defining the intensity of women’s involvement in patenting is an imperfect one. 3 While the authors do not explore other methods of determining women’s patenting activity, this estimate for 2013 is in line with earlier estimates for 2010 found in Delixus, Inc. and National Women’s Business Council (2012a) that show in 2010 the percentage of patents that had a woman listed as the primary inventor was just eight percent while the percentage of patents that had any women listed as inventors was 18.8 percent. 4 In this report STEM degrees are defined as any bachelor’s, master’s, or doctoral degrees awarded in the fields of ‘biological and biomedical sciences’, ‘computer and information sciences’, ‘mathematics and statistics’, ‘engineering and engineering technologies’, and ‘physical sciences and science technologies’. This definition does not include all possible science fields as data on gender are not available for all degree fields.

9
in the early 1980’s and has continued to drop from this point, falling to 21 percent in 2010 (Figure 3). Since engineering is a very patent-intensive STEM field, further progress in closing the patenting gap may be limited if women continue to be underrepresented in engineering fields.
Figure 5. Share of Patents with at Least One Female Inventor and Share of STEM Degrees Awarded to Women, 1977-2010
Note: Data represent total patent grants of U.S. origin only and do not include patent grants of foreign origin. STEM degrees are defined as any bachelor’s, master’s, or doctoral degrees awarded in the fields of ‘biological and biomedical sciences’, ‘computer and information sciences’, ‘engineering and engineering technologies’, and ‘physical sciences and science technologies’. This definition does not include all possible science fields as data on gender are not available for all degree fields. Source: IWPR calculations based on Delixus, Inc. and National Women’s Business Council (2012a); U.S. Patent and Trademark Office (2016); and Snyder, de Brey, and Dillow (2016).
What Technologies are Women Patenting? Though considerable progress has been made in increasing women’s representation among patent holders overall, that progress has not been uniform, leaving women closer to parity in some patent
0%
10%
20%
30%
40%
50%
60%
70%
1977 1980 1983 1986 1989 1992 1995 1998 2001 2004 2007 2010
Women's Share of STEM Degrees
Share of Patents with Any Women Inventors
Women's Share of Engineering Degrees
Women's Share of Biological/Biomedical Sciences Degrees
Women's Share of Computer Science Degrees
Women's Share of Physical Sciences and Science Technologies Degrees

10
classes5 than in others. An examination of patents with at least one female inventor, and how they are distributed across patent classes, demonstrates this point. In 2010, for example, half of all patents had at least one female inventor in the patent class ‘Chemistry: Natural Resins or Derivatives.’ In three other classes more than 40 percent of all patents had at least one female inventor—‘Organic Compounds,’ ‘Drug, Bio-Affecting and Body Treating Compositions,’ and ‘Chemistry: Molecular Biology and Microbiology’ (Figure 6). On the other hand, among the 25 patent classes with the highest percent of patents with at least one female inventor, four patent classes fell below the overall average of 18.8 percent—‘Multiplex Communications,’ ‘Games, Toys, and Sports Goods,’ ‘Active Solid-State Devices,’ and ‘Telecommunications’ (Delixus, Inc. and National Women’s Business Council 2012a).
Figure 6. Top 10 Patent Classes by Share with any Women Inventors, 2010
Note: Data represent total patent grants of U.S. origin only and do not include patent grants of foreign origin. Source: Delixus, Inc. and National Women’s Business Council (2012a).
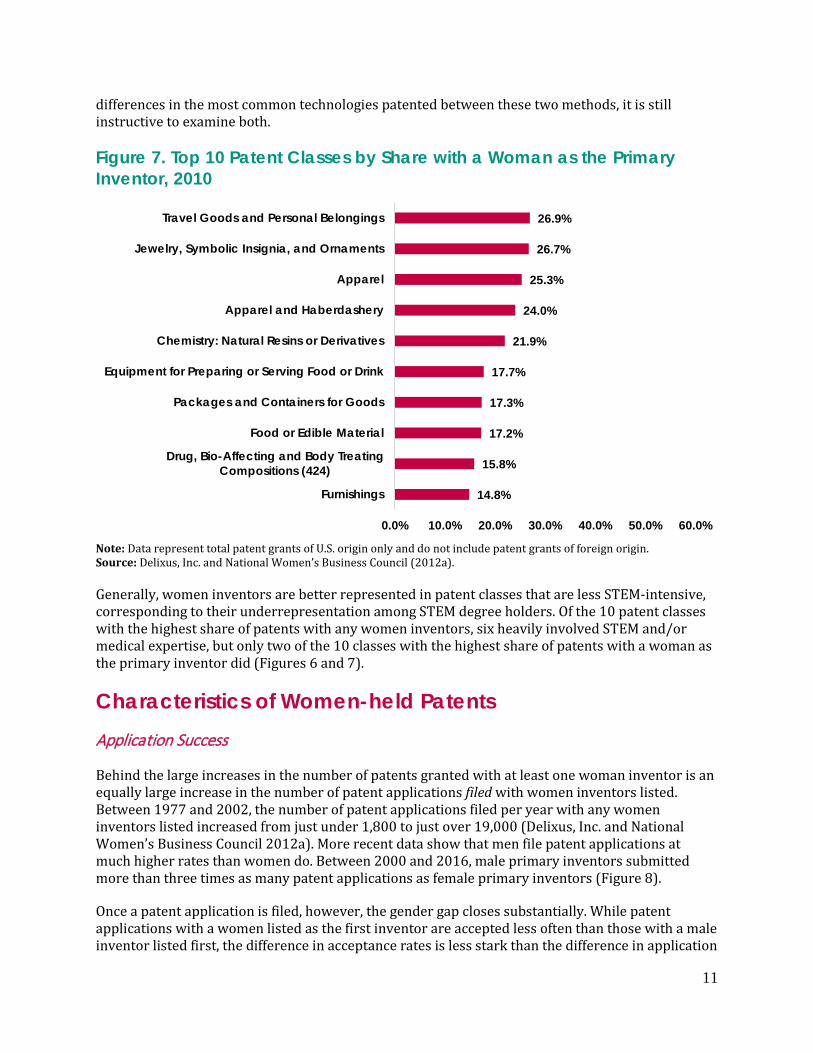
Even among the patent classes with the highest shares of patents that have a woman as the primary inventor, women are still quite underrepresented. In 2010 only five patent classes had more than 20 percent of patents with a female primary inventor—‘Travel Goods and Personal Belongings,’ ‘Jewelry, Symbolic Insignia, and Ornaments,’ ‘Apparel,’ ‘Apparel and Haberdashery,’ and ‘Chemistry: Natural Resins or Derivatives’ (Figure 7). It should be noted, however, that while the intention of the primary inventor methodology used in the research literature is to identify only the patents in which women are substantially involved, because many patent applications list inventors in alphabetical order rather than based on relative contribution, this may not accurately portray the technologies that women inventors are most likely to patent. Yet, since there are such dramatic
5 Patent classes categorize patents based on technical characteristics and systematize the patenting process. Each division in the patent classification system consists of two parts – the class and subclass – that organize patents into different types of technology (the class) and the various features of the technology (the subclass; U.S. Patent and Trademark Office 2016b).
50.1%
43.3%
41.4%
40.7%
37.9%
36.1%
34.1%
32.0%
31.1%
29.2%
0% 10% 20% 30% 40% 50% 60%
Chemistry: Natural Resins or Derivatives
Organic Compounds
Drug, Bio-Affecting and Body TreatingCompositions (514)
Chemistry: Molecular Biology and Microbiology
Drug, Bio-Affecting and Body Treating (424)
Food or Edible Material
Travel Goods and Personal Belongings
Radiation Imagery Chemistry
Packages and Containers for Goods
Apparel and Haberdashery
11
differences in the most common technologies patented between these two methods, it is still instructive to examine both.
Figure 7. Top 10 Patent Classes by Share with a Woman as the Primary Inventor, 2010
Note: Data represent total patent grants of U.S. origin only and do not include patent grants of foreign origin. Source: Delixus, Inc. and National Women’s Business Council (2012a).
Generally, women inventors are better represented in patent classes that are less STEM-intensive, corresponding to their underrepresentation among STEM degree holders. Of the 10 patent classes with the highest share of patents with any women inventors, six heavily involved STEM and/or medical expertise, but only two of the 10 classes with the highest share of patents with a woman as the primary inventor did (Figures 6 and 7).
Characteristics of Women-held Patents Application Success
Behind the large increases in the number of patents granted with at least one woman inventor is an equally large increase in the number of patent applications filed with women inventors listed. Between 1977 and 2002, the number of patent applications filed per year with any women inventors listed increased from just under 1,800 to just over 19,000 (Delixus, Inc. and National Women’s Business Council 2012a). More recent data show that men file patent applications at much higher rates than women do. Between 2000 and 2016, male primary inventors submitted more than three times as many patent applications as female primary inventors (Figure 8).
Once a patent application is filed, however, the gender gap closes substantially. While patent applications with a women listed as the first inventor are accepted less often than those with a male inventor listed first, the difference in acceptance rates is less stark than the difference in application
26.9%
26.7%
25.3%
24.0%
21.9%
17.7%
17.3%
17.2%
15.8%
14.8%
0.0% 10.0% 20.0% 30.0% 40.0% 50.0% 60.0%
Travel Goods and Personal Belongings
Jewelry, Symbolic Insignia, and Ornaments
Apparel
Apparel and Haberdashery
Chemistry: Natural Resins or Derivatives
Equipment for Preparing or Serving Food or Drink
Packages and Containers for Goods
Food or Edible Material
Drug, Bio-Affecting and Body TreatingCompositions (424)
Furnishings

12
rates. Of the patents filed between 2000 and 2016, 67.2 percent of all applications filed by women were eventually accepted compared with 73.0 percent of those filed by men (Figure 8).
Figure 8. Number of Patent Applications and Acceptance Rates by Gender of Applicant, 2000-2016
Note: Patents are classified by gender based on the sex of the first-named inventor on the application. Acceptance rates are calculated based on the total number of patents that were either accepted or abandoned and do not include patent applications whose evaluations are still ongoing. Patent applications are considered “abandoned” when inventors do not respond to a USPTO office action within the six-month timeframe. However, applicants can re-open their evaluation at any time, but it is impossible to determine in the data which applicants will re-open their evaluations. Thus, there may be some margin of error associated with the acceptance rates presented. Source: IWPR calculations based on Garber (2016).
This difference in allowance rates could be due to a number of factors. Women inventors are heavily concentrated in medical and chemistry fields (Figures 6 and 7), both of which have lower than average allowance rates, whereas men inventors are far more common in mechanical and electronic fields which have higher allowance rates (Carley, Hegde, and Marco 2014). Further, most patent applications are not accepted on first action and require one or more rounds of amendments and negotiations with the patent examiner before being ultimately accepted or rejected (Carley, Hegde, and Marco 2014). Women may be less likely to pursue negotiations with patent examiners than men and abandon their applications.6 And among those that are ultimately successful, women inventors have a higher number of office actions7 before their patent is eventually granted, suggesting that they must jump through more hoops before their applications are finally allowed (Garber 2016). This process can become quite time intensive and costly, and many women may not have the resources necessary or may feel that their invention is “not good enough” to patent (Murray and Graham 2007; Quinn 2015).
6 The patent negotiation process can be complicated, and many hire an attorney to represent them in interviews with patent examiners. A relative lack of resources and smaller networks to draw on for advice in navigating the negotiation process with the patent examiner may inhibit women’s ability to pursue negotiations (Delixus, Inc. and National Women’s Business Council 2012b; Whittington 2009; Ding, Murray, and Stuart 2006; Rosser 2012). 7 Office actions refer to written communications between the USPTO and the inventor. This correspondence from the USPTO requires a written and signed response from the inventor regarding any and all rejections or objections from the examiner. This is required to proceed with the patenting process (United States Patent and Trademark Office 2016).
220,863
667,468
0
100,000
200,000
300,000
400,000
500,000
600,000
700,000
800,000
Women Applicants Men Applicants
Number of Applications
67.2%73.0%
0.0%
10.0%
20.0%
30.0%
40.0%
50.0%
60.0%
70.0%
80.0%
Women Applicants Men Applicants
Acceptance Rates
13
Patent Assignment
Once a patent is granted it may be assigned by the inventor(s) to another entity, meaning that that particular entity has the rights to the patent. This is sometimes used as a proxy for whether a patent has been commercialized (that the invention has produced monetary rewards for the inventor or inventors; however it is only a weak proxy. The assumption made is that if a patent has been assigned to another entity the inventors have received monetary compensation for transferring the rights to the technology, but this is impossible to verify. For example, individuals who work for a firm and assign the rights to that technology to his/her firm may not receive monetary compensation, but that particular innovation would be considered commercialized under this methodology.
Patent assignment is a weak proxy measure for commercialization because most individuals working within research firms or universities (where patenting occurs regularly) assign the patent over to the organization. This practice is very common and it is relatively rare that a patent remains unassigned. Further, commercialization includes an array of other activities, including producing and moving a product or technology that has been successfully granted a patent into a larger domain where there is greater public access to that product or technology.
In spite of the limitations of using assignment to indicate commercialization, it is still useful to examine differences in men’s and women’s assignment rates because it can say something about the setting that they are patenting in—on one’s own, or in a firm setting where more support is likely available. Among patents granted between 1975 and 2010, most were eventually assigned to other entities. Overall, just 20 percent of all patents remained unassigned over this time period.8 Interestingly, patents with at least one woman inventor had higher than average assignment rates with just 18.3 percent of all patents remaining unassigned. However, when examining assignment rates by the gender of the primary inventor, a clear gender gap emerges. Nearly 30 percent of all patents with a woman as the primary inventor remained unassigned compared with only 20 percent of patents with a man as the primary inventor (Figure 9). While it is not possible to determine why patents with a woman as the primary inventor are less likely to be assigned than patents with a man as the primary inventor, it is possible that women inventors are indeed less likely to benefit financially from their patents than men are and/or women may patent with less support (from their firm or university, for example) and need to navigate the process more independently than men.
8 Patents that have been assigned could be assigned to any of the following types of entities: a U.S. non-government organization, a foreign non-government organization, the U.S. federal government, a U.S. individual, a foreign individual, or a foreign government. Overall 20.0 percent of all patents remained unassigned. Most patents were assigned to U.S. non-government organizations (74.1 percent overall). A very small percentage (5.8 percent overall) were assigned to other entities.

14
Figure 9. Assignment Status of U.S. Patents by Gender, 1975-2010
Note: Data represent total patent grants of U.S. origin only and do not include patent grants of foreign origin. Source: IWPR calculations based on Delixus, Inc. and National Women’s Business Council (2012a).
Assignment of patents has become increasing more common among women inventors. Cook and Kongcharoen (2010) report that between 1975 and 1980, 39 percent of patents held by women were either unassigned or individually assigned (i.e. ownership of the patent had not been transferred to a firm), compared with only 12 percent between 2001 and 2008. However, the authors find that the gender composition of the team producing the patent plays a significant role in the likelihood that the patent will be assigned. Women-only teams are by far the least likely to assign their patents to firms or other entities. Between 1975 and 2008, 53 percent of all women-only teams had patents that remained unassigned, compared with only 9 percent of mixed-sex teams and 20 percent of men-only teams (Cook and Kongcharoen 2010).
Patent Citations
In addition to assessing women’s representation among patent holders, recent research has also attempted to quantify the impact of these women-held patents. Many studies use the number of citations as one indicator of a patent’s impact and quality. Citations can be either “forward” or “backward.” Forward citations measure how many times a new patent cites the patent being studied; higher forward citation counts generally indicate a greater impact and better patent “quality.” Backward citations, on the other hand, measure how many previous patents the patent being studied cites. Research has generally shown a positive correlation between backward citation counts and patent quality (see, for example, Lanjouw and Schankermann 2002).
Several issues arise when using citation counts as a measure of patent quality. First, the longer a patent has been around, the more potential citations it can have. Second, different technologies have different citation rates in general, so comparing citation rates across technologies is not
20.0% 18.3%29.4%
19.8%
80.0% 81.7%70.6%
80.2%
0%
10%
20%
30%
40%
50%
60%
70%
80%
90%
100%
All U.S. Patents At Least One WomanInventor
Female Primary Inventor Male Primary Inventor
Unassigned Assigned

15
necessarily informative. Researchers assessing the quality of patents attempt to control for these differences either by comparing citation rates only among similar patents (those granted around the same time and utilizing similar technologies; L. D. Cook and Kongcharoen 2010), or by normalizing citation rates to account for the age of the patent and technology class so that all patents can be compared directly (Ashcraft and Breitzman 2012).
Cook and Kongcharoen (2010) examined the quality of patents held by U.S. women inventors by calculating the median number of forward and backward citations using USPTO data from 1976 to 2006. In general, the median number of both forward and backward citations has been increasing over time for all U.S. inventors and U.S. women inventors. When controlling for differences across patent technology and grant year, the median number of citations for U.S. women inventors is at least as high or higher than the overall U.S. median in most technologies. In the “Computer and Communications” patent technology field, for example, the median forward citation count for patents granted between 1991 and 2000 was just under 20 for U.S. inventors overall but nearly 25 for U.S. women inventors.
Ashcraft and Breitzman (2012) examine the issue further by creating a citation index based on a patent’s actual forward citation count relative to the expected citation count of patents of similar age and technology. In addition, the authors examine differences in the citation index by the gender composition of the patent’s team. While examining U.S. patents only in Information Technology (IT), their analysis yields interesting findings. With the exception of the “Semiconductors/Solid-State Devices” category within IT, women-only teams had the lowest scores on the citation index: however, male-only teams did not perform the best either. The authors find that mixed-sex teams yielded patents with far higher scores on the citation index than male- or female-only teams. The authors posit two possible explanations for this observation: 1) greater gender diversity on teams leads to higher quality research and innovation; 2) mixed-sex teams tend to be larger than male- and female-only teams, allowing them to draw on a more diverse pool of knowledge to produce more valuable innovations.
The Economic and Social Impact of Patents For new ventures, having a patent or even having a patent application on file with the USPTO can play a valuable role in securing venture capital (VC) funding, which can in turn be crucial for the venture’s overall success. Häussler, Harhoff, and Mueller (2012) suggest that the reason patent applications and grants may be so important in obtaining VC funding is that when new ventures are in their infancy, observable measures of quality are often scarce. Patent applications and grants then signal to venture capitalists that the venture is at least far enough along to consider commercializing its technology and that its technology is worthy of investment.
Häussler, Harhoff, and Mueller (2012) find that companies with at least one patent application on file obtain VC funding faster than companies without patents and that by increasing their number of patent applications, particularly high-quality applications, companies can further reduce the time to first financing. The authors also find that companies are more likely to receive VC funding and receive it faster if a higher share of their patent applications are opposed by third parties. This is presumably because this signals that a company possesses a valuable technology that others want to utilize. Interestingly, the authors find that patent applications rather than patent grants and citations are critical in determining the likelihood of VC financing and how long it takes to obtain it. This is thought to be the case because of the long process that is involved in pursuing a patent. Venture capitalists need to make quick decisions about which ventures to fund before other

16
organizations are able to partner with them, which usually requires funding the venture before knowing whether the application, and ultimately the invention, will succeed.
Outside of VC funding, research has found that patents also play a significant role in securing funding from other sources. Graham et al. (2009) find, based on the responses of over 1,000 early-stage technology companies founded since 1998, that patents were important in making funding decisions for friends and family (31 percent), commercial banks (21 percent), angel investors (57 percent), and other companies (54 percent), as well as investment banks (50 percent).
Once a firm is established, patents also play an important role in boosting the firm’s market value. Hall, Jaffe, and Trajtenberg (2005) find that an extra patent per million dollars spent on research and development at a firm increases the firm’s market value by about two percent, and an extra citation per patent increases the firm’s market value by over three percent. Because citation count data are highly skewed—many patents do not receive any citations, whereas only a few receive more than 100 citations—the authors further break down the impact of patent citations on the market value of the firm by examining categories of citation counts. They find that there is very little difference in the market value of firms with the median citation count (six citations) and those with fewer citations; however, firms with high citation counts experience drastic growth in market value with additional citations. Firms with seven to 10 citations had a market value that was 10 percent higher than average, those with 11 to 20 citations had a market value that was 35 percent higher, and those having more than 20 citations had a market value that was 54 percent higher.
Beyond a patent’s value to the individual or company that owns it, patents may also play an important role in the broader economy. Blind and Jungmittag (2008) find that a country’s patent stock plays a significant role in its economic growth. These results are corroborated by later work by Rothwell et al. (2013), who found that a one standard deviation increase in the natural log of the patent stock would increase a county’s output per worker by 2.7 percent. The authors further find that if metropolitan areas with patenting rates in the lowest quartile patented as much as those in the highest quartile, their economic growth would be boosted by 6.5 percent over a 10 year period.
While the studies above do not analyze the impact of women-held patents specifically, their results do suggest that closing the patenting gap between men and women could have a substantial impact on the economy. Since fewer than 20 percent of all patents in the United States have at least one female inventor, closing the gender gap in patenting by increasing women’s patenting activity would substantially increase the patent stock, all else equal. Not only would this likely boost productivity in the economy overall, but it could also be beneficial in promoting women’s entrepreneurship more generally. Women have made substantial progress in increasing their representation among business owners, increasing their share from 28 percent in 2002 to 36 percent in 2012 (Institute for Women’s Policy Research 2015a), yet many women business owners lack access to start-up capital, including venture capital, which can be crucial to the success of their business ventures (Premier Quantitative Consulting, Inc. 2015). While not every business venture that women (and men) can engage in has patentable technologies, those that apply for patents are more likely to receive funding from a variety of sources (Häussler, Harhoff, and Mueller 2012; Graham et al. 2009). Further, as higher patent quality (measured by the number of citations received) has been linked to higher market value for firms (Hall, Jaffe, and Trajtenberg 2005) and mixed-sex teams tend to produce patents with higher citation rates on average (Ashcraft and Breitzman 2012) greater gender diversity in patenting could lead to substantial gains in the market value of patent-holding firms.

17
In addition to its economic benefits, patenting has risen in importance for scientists’ careers, becoming key for advancement among both academic and industry scientists. In 2006, for example, Texas A&M University voted to include inventions in its tenure and promotion decisions. Since then, numerous other research universities have factored inventions and commercial involvement into their decisions as well (Stevens, Johnson, and Sanberg 2011; Association of Public & Land-Grant Universities 2015). The increased market value that patenting yields for firms may also make patenting activities more integral for certain positions or serve as a requirement for career advancement for industry scientists. Obstacles to women’s patenting, then, could harm women inventors’ careers and slow the progress of scientific invention.

18
Why are there so few women patent holders? Closing the gender patenting gap requires an understanding of the reasons for women’s underrepresentation among patent holders so that policies and supportive programs can better address the obstacles that are currently keeping more women from patenting. A large body of literature has explored the reasons behind women’s low levels of patenting activity. This section reviews findings from several key studies, illustrating the complex factors perpetuating gender inequality in commercial science broadly and patenting in particular.
The Complexity and Expense of the Patenting Process The patenting process can be complicated and often requires a substantial investment of time and money. An idea for an invention must meet two basic conditions for it to be patented – it must neither be already publicly available nor described in a previous patent. If an inventor believes his or her idea fulfills these criteria, a patent search must be conducted to ensure that the idea is truly unique (U.S. Patent and Trademark Office 2016b). Patent search fees range from $30 to $600, depending on the invention’s complexity and the size of the entity filing the application (U.S. Patent and Trademark Office 2016d).
If a patent search’s results indicate that an idea has not been previously patented, applicants have the option of applying for a provisional patent. Provisional patents last for 12 months and allow for the term “patent pending” to be applied to an invention. Since the cost of filing a provisional patent is lower than that of a non-provisional patent, an inventor may choose to file for a provisional patent in order to obtain an earlier filing date and the chance to improve upon the invention before investing in a non-provisional patent (U.S. Patent and Trademark Office 2016b). The fee for filing a provisional patent ranges from $65 to $260 (U.S. Patent and Trademark Office 2016d).
Non-provisional patent applications generally require more time and effort and are more complicated. When applying for a non-provisional patent, several items must be submitted as part of an application. The elements of a patent application vary based on the type of patent9 that is being requested, but utility, design, and plant patents all require that a detailed and often extensive description of the invention be submitted as part of the application (U.S. Patent and Trademark Office 2015a; U.S. Patent and Trademark Office 2012; U.S. Patent and Trademark Office 2015b). The mandatory fees associated with filing a non-provisional patent vary depending on the invention’s complexity; non-provisional patent filing, exam, and issue fees range from $300 to $1,960. Surcharges for late submission, an accelerated exam, extension of time, and other special requests can also increase the cost of patent filing by thousands of dollars (U.S. Patent and Trademark Office 2016d).
Patent applications and fees are submitted to the United States Patent and Trademark Office (USPTO) and applications are assigned to an examiner. If an examiner rejects an application, he or she will explain why and give the applicant the opportunity to make amendments or dispute the examiner’s objections. If the inventor’s application is rejected twice, the patent filer can appeal the outcome to the Patent Trial and Appeal Board (PTAB). At any point in the application process,
9 There are three main types of patents that can be applied for: utility, design, and plant patents. A utility patent is issued for the creation of a new process, machine, product, etc. A design patent is issued for the creation of a design that can be applied to an existing product. A plant patent is issued for newly discovered or genetically engineered plants. The USPTO identifies three other patent types in addition to these, but they are not often studied in the research literature: reissue patents, defensive publications, and statutory invention registrations (U.S. Patent and Trademark Office 2016c).

19
inventors may also request an interview with their patent examiner, which can help resolve issues with the application and reduce the amount of time until a decision is made. If the patent is ultimately granted, the patent filer will be required to pay an issue and possibly a publication fee before obtaining the patent (U.S. Patent and Trademark Office 2016b). Issue fees range from $140 to $960 and publication fees are generally $300 (U.S. Patent and Trademark Office 2016d).
To keep a patent in force, maintenance fees must be paid at 3.5, 7.5 and 11.5 years after the patent is issued. These fees vary depending on the patent’s complexity and how large the entity filing the patent is. A patent lasting 12 years or more, for example, has associated maintenance fees ranging from around $3,000 to over $12,000 (U.S. Patent and Trademark Office 2016d).
While it is possible to apply for a patent on one’s own, the process can be difficult to navigate without a thorough knowledge of the patent system and patent law. Thus, many inventors seek the assistance of patent attorneys, which can add substantially to the cost of a patent application. Depending on the complexity of the invention, a patent search with an attorney’s opinion can cost between $1,000 and $3,000 on average (Quinn 2015) and if the decision is made to move forward on a patent application, attorney fees can average between $5,000 and $16,000 or more. Further, an attorney may represent an inventor during examiner interviews, which can also add to the substantial cost of applying for a patent (Quinn 2015). Depending on the complexity of the innovation being patented, the size of the entity filing the patent application, the type of application pursued, and whether the inventor chooses to hire an attorney, the total cost of applying for and maintaining the patent for 20 years could total tens of thousands of dollars.
To an inventor, a patent application is a risky venture—it can be quite costly to obtain, but has the potential to allow the inventor to recoup those costs (and perhaps even earn a profit) through commercializing the innovation. There are several ways to commercialize a patent: by introducing the patent to the marketplace through product development, licensing the patent to another individual or company, or selling it (Lemelson-MIT Program n.d.). Since individuals often find it difficult to obtain the financial resources needed to effectively market an invention or may be risk averse to investing further resources into the manufacture10 of their product before seeing a profit, licensing or selling a patent to business enterprises or persons that have such resources are common routes (Quinn 2014). Nonetheless, obtaining a patent is financially risky since the monetary rewards can be outweighed by the heavy costs associated with filing and prosecuting the application.
The accumulated cost of patenting can pose an obstacle for inventors who wish to patent an idea, especially if the invention is complex, since more intricate ideas usually require more attorney time. Financial barriers to applying for a patent are likely greater for women than they are for men since women tend to have fewer financial resources. Thus, the cost of a patent may also discourage women entrepreneurs from filing applications. Women earn less than men do overall—in 2014, women who worked full-time, year-round earned only 80 cents on the dollar compared with men (Anderson et al. 2016). And while having a patent application filed or holding a patent can increase the likelihood of obtaining funding from a number of sources (Graham et al. 2009; Häussler, Harhoff, and Mueller 2012), among entrepreneurs, women are still less likely to have access to any start-up capital and are less likely to have received outside equity (including venture capital) to finance their ventures. In 2012, more than one in three women-owned businesses did not have any start-up capital, while nearly eight in ten men-owned businesses had capital (Institute for Women’s Policy Research 2015b). Further, men are four times more likely than women to have received 10 It should be noted, however, that not all patents granted are for tangible products and may be for ideas not requiring the manufacture of a product, such as a new process. In these cases the costs of manufacturing are irrelevant.

20
outsider equity to finance their businesses—in 2010, outsider equity made up 12.8 percent of men-owned businesses’ total financial capital compared with only 3.0 percent in women-owned businesses. Women, on the other hand, are far more likely to finance their businesses through owner equity (12.7 percent compared with 9.1 percent), as well as owner debt (8.0 percent compared with 4.0 percent; Robb 2013).
The Concentration of Women in Fields and Job Tasks That Are Less Patent-Intensive One intuitive hypothesis explaining the gender gap in patenting points to the gender gap in STEM fields more generally. Women’s underrepresentation in STEM fields is a well-known phenomenon: women make up nearly half of the workforce, but just a quarter of the STEM workforce (Beede et al. 2011). This disparity has remained constant over the past decade, even though women’s educational attainment has increased relative to men’s (Beede et al. 2011). Increasing the percent of new graduates from STEM fields in a population can have a substantial and statistically significant positive impact on the population’s patent activity, whereas increasing the share of non-STEM graduates does not (Winters 2014). The gender gap in patenting may therefore be tied to a larger pattern of occupational and educational segregation.
A recent study by Hunt et al. (2012) examines the gender gap in commercialized patenting and attributes it to the portion that can be explained by women’s underrepresentation in science and engineering fields (S&E) and to the portions that can be explained by women’s lower patenting rates within S&E and non-S&E fields. The study found that just seven percent of women’s underrepresentation in commercialized or licensed patenting is due to the underrepresentation of women among S&E degree holders. Instead, a staggering 78 percent of the commercial patenting gap is due to lower patenting rates among women who hold S&E degrees, and the remaining 15 percent is explained by lower patenting rates among women without S&E degrees. Thus, the gender gap in STEM education in general is not the main driver of the gender gap in commercial patenting rates, since women with relevant education still patent at lower rates than their male counterparts. In fact, women who hold degrees in science or engineering fields are hardly more likely to patent than those who do not (Hunt et al. 2012).
These findings suggest that if the share of women in S&E did equal that of men, while patenting rates within the field stayed the same, women’s share of commercialized patents would nearly double to 10 percent (from 5.5 percent). However, if women’s share of S&E degrees stayed the same and instead their patenting rates were increased to match men’s, women’s share of commercialized patents would increase by over four times, to 23.5 percent (Hunt et al. 2012). This indicates that while increasing women’s representation in S&E fields is still an important part of increasing women’s representation in patenting, eliminating obstacles to patenting for women who already hold science or engineering degrees would increase women’s share of commercialized patents even more.
Within science and engineering fields, men and women are concentrated in different fields: women are concentrated in the life sciences, which have relatively low patenting rates, whereas men are more likely to be in more patent-intensive engineering fields, likely driving the findings of Hunt et al. (2012). Complementing this finding, a 2010 study found that increases in advanced engineering degrees are linked to increases in patenting activity and commercialization for women (Cook and Kongcharoen 2010). Thus, increasing women’s representation in engineering and computer science can potentially reduce the patenting gap. Unfortunately, negative stereotypes, workplace bias,

21
uninviting environments, and ineffective messaging effectively deter women from joining these fields (National Academy of Engineering, Committee on Public Understanding of Engineering Messages 2008; Hill, Corbett, and Rose 2010). Kahler (2011) notes that the disparity in representation among men and women in engineering and computer science is greater than in other scientific fields, and that because these fields are rapidly expanding in their patenting activity the relative lack of women in these fields may have negative consequences for gender parity in patenting (Kahler 2011).
Besides women’s underrepresentation in particular patent-intensive subfields within S&E, women are also underrepresented in development and design, the most patent-intensive job tasks. For example, among those in nonacademic careers, 61 percent of men and just 46 percent of women holding STEM doctoral degrees work in research and development positions (Turk-Bicaki, Berger, and Haxton 2014). This type of underrepresentation explains 13 percent of the commercialized patenting gender gap (Hunt et al. 2012).
One study illustrates that essentialist gender stereotypes might be contributing to segregation in job tasks by interviewing experience women working in technology companies. A female CEO attributed women’s lower patenting rates to her perception that even when beginning in engineering or software development, women transfer to human resources, sales, and marketing departments because they prefer socially-oriented work (Rosser 2012). Yet, while it is true that many women leave STEM after earning doctoral degrees at higher rates than do men, their attrition rates are not drastically different. About 19 percent of women holding STEM doctoral degrees work in non-STEM careers compared with 16 percent of their male counterparts (Turk-Bicaki, Berger, and Haxton 2014).
The CEO continued in her interview to remark that even among women who pursued education and jobs in engineering and software development, women were more interested in more socially oriented positions than technologically oriented ones (Rosser 2012). According to Hill, Corbett, and Rose (2010) this assumption that women move out of technological roles in favor of other departments because of essential “social” psychological orientations is a sexist construction that does not consider other factors affecting women’s decisions. For example, women may feel frustrated when they are disrespected in technological departments and choose to leave them for more accepting environments. Managers may also show gender biases toward female scientists that can exacerbate women’s discomfort in technological departments, and even undermine their performance: perceptions that others hold negative stereotypes about them can lower the quality of women’s work, both academic and otherwise, in a phenomenon termed “stereotype threat” (Spencer, Logel, and Davies 2016; Spencer, Steele, and Quinn 1999). Stereotype threat has been linked to women’s decisions to leave STEM majors in their undergraduate education (Beasley and Fischer 2012); perceptions of negative stereotypes from supervisors could likewise push women out of STEM careers.
Further, women may be responsible for a larger share of caregiving obligations than their male peers, and thus seek work demanding fewer hours and that can more easily be combined with caregiving. In a survey of academic scientists across STEM fields at nine research universities, 63.9 percent of women and 45.2 percent of men reported that family obligations greatly or somewhat interfered with their work; women were almost two and a half times more likely to report that family greatly interfered with their work (Fox, Fonseca, and Bao 2011). In examining the reverse, work interfering with family, 83.7 percent of women and 71.3 percent of men reported a great deal or some interference, with women more than one and a half times as likely to report a great deal of interference (Fox, Fonseca, and Bao 2011). More than 21 percent of women postdoctoral

22
biomedical fellows and just seven percent of their male peers say that plans for childbearing are extremely important considerations in planning their careers (Martinez et al. 2007). Thus, women struggle with a greater amount of conflict between their work and family obligations than men, and in anticipation of this interference, may take future parental roles into greater account in planning their careers than do men.
In light of these patterns of difference and discrimination, Hunt et al. (2012) conclude that increasing women’s representation in electrical and mechanical engineering (relative to life sciences) and in design and development jobs are the first steps toward improving the rate of women’s patenting. While women have the strongest representation within the life sciences, the life sciences are not fertile ground for women’s patenting: Cook and Kongcharoen (2010) find that increases in advanced engineering degrees increase commercial patenting rates among women, but that increases in life sciences doctorates do not have the same effect. Just 39 percent of patents in life sciences fields are commercialized, compared with 62 percent of patents in electrical and mechanical engineering are (Hunt et al. 2012). Further, Hunt et al. (2012) show that the share of women with engineering degrees is increasing by just 0.9 percentage points per decade—and the trend is slowing. This is a concerning development: despite increased awareness about women’s underrepresentation in STEM, and diverse initiatives to combat it, segregation within scientific fields is stubbornly persistent.
After reviewing the data on segregation within S&E fields, Kahler (2011) concludes that assumptions that women are increasing their representation in S&E fields and therefore should begin increasing their representation in the patenting field as a result are not consistent with recent education and patent trend data (Kahler 2011). And, increasing representation in patent-intensive fields and jobs within S&E is only the first step in raising women’s patenting rates. Without cultural and institutional shifts, particularly in network formation, institutional support, and family responsibilities, women’s patenting rates will still likely lag behind men’s.
Women’s Limited Networks Personal and professional networks are important to patenting in several respects. Studies find that informal, social network ties within industry organizations enhance resource exchange and product innovation (Tsai and Ghoshal 1998). Structural network characteristics of inventors, including inventors’ centrality in their networks and their roles in bridging network holes, measured by copatenting, are strongly influential in firms’ decisions to pursue particular research areas (Nerkar and Paruchuri 2005). These rich networks give key inventors access to more and better information, increasing the quality of their research, increasing patenting rates, and leading to more recognition within their organizations (Nerkar and Paruchuri 2005). Beyond the effects of larger teams generally, a study of industrial research and development teams over three decades finds that diversity of team members “enriches the research process and promotes greater productivity” (Reagans and Zuckerman 2001, 512). In these ways, diversity and collaboration are beneficial to firms, inventors, and the production of scientific knowledge broadly.
Networks are also important for inventors’ individual entry into the patenting arena in numerous ways. Broadly, networks are key to an individual’s ability to gain and exercise power within organizations, including both academic and private industry settings. The formation of these networks are influenced by individual characteristics like gender and race (Kanter 1977; Ibarra 1993; Lucas and Baxter 2012). More specific to patenting, the process of evaluating whether it would be worthwhile to pursue a patent is facilitated by asking experienced network contacts for advice—assuming the inventor has access to such contacts (Ding, Murray, and Stuart 2006).

23
Informal lessons on “selling science” through self-presentation skills are available through networks (Murray and Graham 2007). Gaining information about the patenting process—the steps involved, resources necessary, and likely outcomes—is simplified when a mentor, acquaintance, or peer has experience patenting and can share insight (Ding, Murray, and Stuart 2006). Further, most inventions are developed by teams, not by individuals; teams are often formed by selecting contacts with whom inventors are acquainted. Teams of scientists bring more institutional resources to their work, are more likely to successfully patent, produce better quality patents, and are more likely to have their patents renewed (Hsu, Lee, and Lin 2010; Breitzman and Thomas 2015). Links between academic and industry scientists are one way that inventor teams are formed, and are an important way of accessing resources, in terms of skillsets, creative input, legal guidance, and financial support. Invitations to patent flow through networks, and those who do not have many strong—or even weak—ties to other scientists are left out of this process.
Due to centuries of exclusion from STEM fields, women scientists have less access to extensive networks, and the networks they do have contain fewer experienced scientists. In addition, a higher share of their contacts are also women, which further limits their access to resources (for more on women primarily being mentored by women, thus limiting resource flows to women, see Murray and Graham 2007). Diminished access to resources and support through networks, compared with male scientists, likely impedes women’s patenting activity.
Collaboration networks, measured by copatenting, are different between academic and industry scientists. Whittington (2009) demonstrates that academic collaboration networks are more highly centralized, such that most scientists are connected to one or two top scientists, while in industry settings scientists are more equally connected to several other scientists, without particular “star” scientists monopolizing most contacts. These different network shapes indicate that industry scientists may have more collaborative resources to tap into and a greater ability to form new research ties (Whittington 2009). Network structure may shape scientists’ choices about patenting and their opportunities to patent, leaving academic scientists disadvantaged compared with those in industry. Therefore, network connections to industry may be particularly important for academic scientists, allowing them to tap into networks they otherwise would not be able to reach. This is especially true for women scientists. Whittington finds that academic men are more centrally located in their network than academic women, underscoring women’s peripheral status in academic copatenting collaboration networks (Whittington 2009).
Beyond formal copatenting networks, informal social networks between academic and industry scientists influence their patenting decisions. Research shows that outside funding from industry fosters patenting, which demonstrates the importance for academics to have industry contacts and the need for collaborations with industry to commercialize inventions (Owen-Smith and Powell 2001; Bercovitz and Feldman 2007). In fact, Meng (2016) shows that increasing collaboration ties with industry would significantly improve women’s engagement in patenting and that differential effects of collaboration ties explain a large part of the gender patenting gap (Meng 2016). Most of the academic women interviewed by Ding, Murray, and Stuart (2006) had few network contacts in industry, and linked this deficiency to the substantial amount of time required to determine whether an idea is commercially relevant (Ding, Murray, and Stuart 2006). Women who spoke with Rosser (2012) desired more extensive networks in order to help determine an invention’s commercial viability, since they were often critical of themselves and their ideas (Rosser 2012).
Simply understanding the basic steps involved in patenting is confusing without a network of advisors or experienced peers to act as guides. Many women (particularly those outside of academia and industry) are unconvinced that the high costs and long waiting periods associated

24
with patenting are worth the effort. In focus groups, several women indicated feeling that they spent a lot of time and money applying for a patent without seeing much of a return (Delixus, Inc. and National Women’s Business Council 2012b). The costs of patenting extend even beyond acquiring the patent itself; because ideas become public once patented, women were concerned with patent encroachment—that a large firm would take their idea, modify it slightly, and sell it as their own (Delixus, Inc. and National Women’s Business Council 2012b). One woman commented that “there is nobody out there to help me. The process is so obscure” (Delixus, Inc. and National Women’s Business Council 2012b, 15).
Delixus, Inc. and National Women’s Business Council (2012b) report that women perceive the patenting process as too complex, long, and expensive to navigate, which cuts across industries, regions, and prior success with the patent process. Researchers conclude that “the paperwork, the legal requirements, the time it takes to understand the process, the cost of obtaining IP protection and the long timelines” are systematic issues that dissuade women in particular from pursuing patents as they have fewer contacts to help them navigate the process (Delixus, Inc. and National Women’s Business Council 2012b, 21; Whittington 2009). This confirms earlier findings from Ding, Murray, and Stuart (2006) that men had better access to knowledge about the patenting process through their networks than did women. Men had many contacts with diverse experiences who could share information from multiple perspectives, while women were confined to close relationships with similarly-situated peers. These different network configurations imply that men can access a wide range of viewpoints, while women’s contacts could likely offer them information only from a similar position, and women had fewer contacts overall. From interviews with IT scientists, Rosser (2012) finds that women “crave[d] the brainstorming, support, and nurturing atmosphere” of networks, and had great interest in beginning a network for women to “encourage and to guide them through the process” of patenting (Rosser 2012, 162-163). These interviews highlight the many benefits of wide-ranging networks, as well as women’s awareness of these benefits. That women recognize the importance of networks, but have only limited connections with others, implies that they face informal hurdles to forming relationships with male scientists.
Some scholars argue that women in academia have fewer resources to help them develop skills in selling science, and fewer opportunities to join teams developing patentable technologies, likely stemming in part from their relative exclusion from early-career commercial opportunities and networks. Stephan and El-Ganainy (2007) note that women are less likely to associate with colleagues who are involved in commercial activity or to have industry contacts (Stephan and El-Ganainy 2007). Murray and Graham (2007) find that women faculty’s difficulty in joining professional networks deprived them of chances to develop the skills needed to sell science (Murray and Graham 2007). Specifically, women tended to focus on the details of their research while male faculty were more likely to describe their research in the context of a “grand research agenda” with “sweeping potential” (Murray and Graham 2007). Young women scientists are most likely to be mentored by fellow women, restricting access to male networks and continuing women’s ethical ambiguity towards selling science (Murray and Graham 2007). And, since women have smaller laboratories on average than do men, they train fewer students, and in consequence have fewer former students to patent with after some of their students transition into industry (Stephan and El-Ganainy 2007, 483). Further, women’s senior male colleagues were generally supportive but did not often consider them as collaborative partners, denying women avenues to commercial science that are open to men (Murray and Graham 2007). Importantly, women aren’t less interested in commercial science than men, in fact research shows they decline invitations at lower rates than their male peers (Murray and Graham 2007). However, women reported fewer invitations to patent than male colleagues, and their invitations mainly came from male peers. Whereas the invitations offered to equivalent male faculty came from senior faculty and advisors, as

25
well as peers. Almost all male faculty with low levels of participation in commercial science had chosen to decline opportunities; in contrast, women did not have opportunities in the first place (Murray and Graham 2007).
Finally, some research indicates that network access is markedly different across organizational types. In a study examining the impact of institutional structure, Whittington and Smith-Doer (2008) find that “network form” organizations—as opposed to “hierarchical” organizations—lead to higher patenting rates among women. They differentiate “network form” and “hierarchical” organizations with four criteria. First, hierarchical organizations use “in-house routines” to organize operations, while network form organizations use interorganizational relationships to structure projects (Whittington and Smith-Doer 2008, 195). In hierarchies, conflict is addressed through authority ranking, while reputation and reciprocity often mutes conflict in network forms; hierarchies are typified by formality, while network forms feel more open (W. Powell 1990). Finally, in network form organizations, individuals are often more focused on collective benefits rather than individual advancement (Whittington and Smith-Doer 2008). In hierarchical settings, scientists are usually responsible for a small part of a larger project, while in network forms work is more flexible and cross-cutting (Whittington and Smith-Doer 2008, 197).
The flexibility inherent in network forms leads to horizontal distributions of positions and resources, which dismantle barriers for women: “women located in organizational settings that encourage a more even distribution of positions may be better able to overcome some traditional barriers that maintain within-organization sex segregation” (Whittington and Smith-Doer 2008, 198). Beyond better access to resources, they argue that women have increased management opportunities in network form work settings. Further, women may be better able to form collaborative networks in more fluid organizations (Whittington and Smith-Doer 2008). For Whittington and Smith-Doer (2008), it is the “interaction between these differing sector-level social arrangements and the flexible design of the network form that provides the equal playing field for women in the network setting” (Whittington and Smith-Doer 2008, 199). Their data supports this core hypothesis, finding that with the exception of industrial science-based firms, women are less likely than men to patent in every other institutional setting (Whittington and Smith-Doer 2008, 207). Thus, women are better able to enter the patenting realm when in network form industry organizations.
Whittington and Smith-Doer (2008) find that women scientists’ probability of patenting at least once in hierarchical industrial settings is 62 percent that of their male colleagues; in academic settings and government and nonprofit organizations, women’s probability relative to men drops to 43 and 28 percent, respectively. In science-based network form organizations, however, there is no statistically significant difference between women and men’s patenting probabilities (Whittington and Smith-Doer 2008).11 Based on these findings, the authors conclude that there are “structural mechanisms for women's inventing that vary by work setting” (Whittington and Smith-Doer 2008, 207). However, despite there being a marked advantage for women scientists to work in science- 11 Whittington and Smith-Doer (2008) utilized a randomly selected sample of applicants to the Cellular and Molecular Biology training grant program administered by the National Institute of General Medical Sciences. These applications require information on the background and career information of all current and former students, including their current employment. Their sample included over 3,000 pre- and post-doctoral scientists from diverse backgrounds. These applicants were then matched to patent data from USPTO to determine their patenting activity and the names of current employers were used to classify them into three broad categories: industry, academia, or other. Scientists were further classified as working in pharmaceutical firms, chemical corporations, or subsidiaries of pharmaceuticals (what are called “hierarchical” form organizations) or science-based, dedicated biotechnology firms (what are called “network” form organizations). These classifications were drawn from a data set by W. W. Powell et al. (2005) using the Bioscan industry directory.

26
based network firms, very few women (and men) scientists actually work in these settings. In Whittington and Smith-Doer's (2008) random sample of more than 3,000 pre- and post-doctoral scientists applying to a cellular and molecular biology training grant program, only 8 percent of women scientists worked in network firms; most women worked in academia (71 percent). Though the distribution of their sample of men and women across organizational settings was almost identical, the fact that very few women are employed in network firms and that women tend to have more restricted access to networks than men suggests that one possible mechanism for increasing women’s patenting rates might be through fostering women’s networks (Whittington and Smith-Doer 2008).
Socialization and Biases Against Women in Commercial Science Socialization is the continual, invisible process by which norms, attitudes, values, ideologies, practices, rules, and assumptions are informally communicated to members of a group through personal interaction (Mortimer and Simmons 1978; Reskin 1993; Bowles and Gintis 2011). In patenting, socialization is key to the gender gap in two respects. First, broad, society-level gender socialization establishes proscriptions and prescriptions for who women and men are and what they do (Davis and Greenstein 2009). This affects patenting in that the category of “woman” proscribes certain norms for communication; for example, women may be more hesitant to speak up in meetings otherwise composed solely of men, and when they do speak up, their voices are often unconsciously ignored or interrupted by men (Franzwa and Lockhart 1998; Walsh 1997; Sandberg 2013). Murray and Graham (2007) find that in the early period of academic commercial science men’s greater participation led to the role of academic commercial scientists becoming constructed as male, effectively discouraging women’s participation and leading women who did participate to be more likely to view themselves as less competent than their male peers (Murray and Graham 2007).
Several researchers identify a gendered pattern in attitudes toward integrating patenting into academic careers. Generally, women communicated that patenting would take time away from students, teaching, and obligations to the university (for example, sitting on committees and performing administrative work), while men thought that patenting improved their teaching (Murray and Graham 2007). Women were “more likely to describe the challenges associated with balancing multiple career elements,” ultimately hindering their career progress, while male faculty saw their patenting decisions as “unproblematic and driven by translational interests” (Ding, Murray, and Stuart 2006, 666). Women expressed concern about the effects of their potential patenting on traditional faculty responsibilities, as opposed to men’s lack of concern over negative impacts on their careers. This phenomenon is replicated by Murray and Graham's (2007) interviews, in which women saw commercialization as a tradeoff, leaving less time for their students, teaching, and lab work. In contrast, men thought commercialization complemented those commitments because students benefited from direct participation in and observation of commercialization. This disparity in attitudes towards the interaction between academic careers and patenting has implications for women and men’s careers, since the increase in the prevalence of commercial science at universities has made patents an important part of career advancement for many academic scientists (Kahler 2011).
Further, some scientists may feel opposed to patenting on ethical grounds, particularly those engaged in scientific research when commercialization was just beginning to permeate academia. These concerns are often rooted in a feeling that there is a conflict of interest between conducting

27
high-quality research that is relevant to a broader population of people and producing research that can produce more monetary rewards (see Murray and Graham [2007] for a discussion on the ethical opposition academic scientists may feel). Murray and Graham (2007) note that because women were often excluded in the early days of commercial science, they were found to be less able to reconcile the two and were more likely to still feel opposed to commercial activity. Women felt their senior colleagues and mentors were at times reluctant to advise them on commercialization, while men freely approached them for advice, which contributed to their attitude towards selling science. Further, because of the exclusion from networks early on in women’s careers, they did not experience socialization resolving the ethical concerns expressed by all scientists (Murray and Graham 2007).
Murray and Graham (2007) identify three primary factors that intersect to reinforce gender stratification: that women are primarily mentored by women; that cultural stereotypes against women and money complicates women’s roles as commercially-oriented scientists; and that women scientists shoulder more caregiving obligations than do their male peers. Whittington (2011) found that female academic scientists with children are less likely to patent compared with their male counterparts, highlighting how caregiving demands outside of the workplace can affect women differently from men. Together, these three factors resulted in women faculty who had less experience in commercial activity, had reservations about the practice, and were more likely to view themselves as less competent (Murray and Graham 2007). Without the knowledge of how to navigate commercial science, invitations from industry or mentors to build networks, self-presentation skills necessary to sell science, or the chance to resolve ethical concerns, women faculty were at a distinct disadvantage.
Implicit bias may also be at play in communication between male and female scientists, and between patent examiners and inventors. While discussing projects, Murray and Graham found that women faculty focused on the details of projects, perhaps assuming that the value of their work would speak for itself, while men used more sweeping terms that gave the impression of “a grand research agenda” (Murray and Graham 2007). This difference in communication may contribute to differences in both women’s internal perception of their work as patentable and their audiences’ perception of the work’s importance. Further, women report preferring to talk with women patent examiners, under the impression that women examiners would better understand their needs (Delixus, Inc. and National Women’s Business Council 2012b).
Beyond internalized biases, women face overt sexism from peers, industry contacts, and customers. For example, one woman working in information technology reported in an interview that “I am the CEO of a company. Once I answered a call from a customer. He said, ‘Could I speak to some man who knows the business?’” (Delixus, Inc. and National Women’s Business Council 2012b, 16). One woman was told by an ex-patent agent to “get [her] husband on it [the patent] and [the patent] will have a better chance” (Delixus, Inc. and National Women’s Business Council 2012b, 16). These experiences of misogyny may both deter women from pursuing commercial science and limit their success when they do attempt to patent.
Lack of Uniform Support Structures Across Organizations Many studies have examined the importance of institutionalized support for women’s patenting activity, especially given their limited access to resources and informal networks. Women who do not have the advantages supplied through personal networks often turn to their universities’ Technology Transfer Offices (TTOs), or their companies’ services, to gain information about how to approach the patenting office. They used the TTO for a broad range of supports including contacts,

28
advice, and encouragement, while men relied more on their networks (Ding, Murray, and Stuart 2006). Women faculty in Murray and Graham's (2007) interviews felt dependent on their universities’ TTO for resources and education, while male interviewees used them only to access legal support, and used personal connections for all other resources. Women who are not affiliated with a university or company have few resources to tap; a thought echoed by several women in focus groups was the need for a more universal resource that would point them to potential funding sources (Delixus, Inc. and National Women’s Business Council 2012b).
Institutional support is vital in providing information about the steps required to navigate the patenting process. More than that, though, institutional support is critical to funding the patent pursuit. Several women agreed that it is difficult to navigate the process unless one has the funds to pay someone such as a patent attorney to help (Delixus, Inc. and National Women’s Business Council 2012b). Some women in this position turn to venture capitalists to fund their pursuit of patents; however, existing evidence among business owners indicates that men are four times more likely than women to receive outside funding, including venture capital funding, to finance their business ventures (Robb 2013). Further, in a study of 78 venture capital firms employing 815 individuals, 90 percent were male and 38 percent of women in these firms were in the lowest-status positions (Stephan and El-Ganainy 2007), suggesting that part of the reason for women’s relatively low access to venture capital could be biases (subconscious or not) on the part of the venture capitalists themselves.

29
How can we address the challenges women face in patenting? Based on the literature reviewed above, it is clear that women scientists face a variety of challenges when it comes to participating in the patenting process, many of which overlap. While addressing these obstacles will require a cultural shift in attitudes toward women in science and innovation, there are several more tangible actions that can be taken to begin bridging the patenting gap. These actions are discussed in detail below.
Develop systems and data tools to better track women’s progress in patenting.
The lack of available data on women inventors and women inventors of color hampers research on these populations. Because the USPTO does not collect demographic information on any inventors, researchers must rely on name-matching software to identify the gender and race or ethnicity of inventors listed on patents, introducing a margin of error into estimates of women’s representation among patent holders. While data from other sources such as the NSCG do identify the gender and race/ethnicity of inventors, they are either outdated (the NSCG asked questions about patenting activity only in the 2003 survey) or are not representative of all patent holders (or both). In order to make more informed decisions about potential policy solutions, it is important to have the most accurate and complete data possible, and while the existing data do illustrate the need for change, there is still much that researchers do not know because of limitations in the data.
Recognizing the need for data on diversity, the Diversity of Applicants initiative of the Leahy-Smith America Invents Act requires the USPTO to establish methods for studying diversity among patent applicants. Since then, the USPTO has made efforts to comply with this directive. The first step was to partner with the Census Bureau’s Center for Economic Studies (CES) to match information on applicant names and addresses with existing data from the CES that could identify the gender, race/ethnicity, and other basic demographic characteristics of patent holders. However, because uniquely identifying individuals based on name, city, and state can be difficult, particularly in large cities, only 64 percent of the U.S. resident inventors in the USPTO data could be identified, making it difficult to present accurate information on diversity with the resulting merged data (U.S. Patent and Trademark Office 2015c).
The USPTO also sought public comments on whether additional information on applicants should be collected and, if so, how to collect it. The general opinion was largely in support of collecting the information via surveys (and not as part of the application itself) and commenters agreed that the survey should be made voluntary. Ultimately, because voluntary surveys could result in self-selection among respondents, which would bias the results of such surveys, the USPTO has not yet moved forward in this area (U.S. Patent and Trademark Office 2015c). Fostering further dialog between the USPTO, researchers, and other stakeholders could illuminate ways to resolve the conflict between the need for more diversity data in the patent system and concerns about the confidentiality of applicants.
Another route that could be considered in order to better document women’s patenting behavior could be to include questions on patenting in existing government surveys. The NSCG, for example, asked questions about patenting behavior, including applications, grants, and commercialization activity in the 2003 survey, but has not asked those questions since. Adding those questions back into the survey and consistently asking them of survey respondents would go a long way toward

30
improving our understanding of women’s, particularly women of color’s, underrepresentation among patent-holders.
Develop a more uniform network of support services for inventors.
With the passage of the Bayh-Dole Act in 1980, which permitted universities to own intellectual property developed through federally-funded research, a substantial increase in the number of technology transfer offices (TTOs) at universities has been observed (de Melo-Martín 2013). The TTOs generally provide assistance to faculty in navigating the patenting process, assisting in the licensing of intellectual property, and offering legal support to inventors. Outside of academia, inventors have a variety of resources to draw from as well. Every state has at least one inventor’s association, which generally offers educational programs, networking opportunities, and assistance with various stages of the innovative process including patenting (Inventors Eye 2016). Other programs, such as the Empowering Women in Technology Startups program at the University of Florida and Ernst & Young’s Entrepreneurial Winning Women program, have also emerged to help meet the needs of inventors across different fields and in different organizational settings.
These organizations and programs are available to both men and women, though women’s relatively limited access to network contacts to help them navigate the patenting process may mean that women benefit more from them. Ding, Murray, and Stuart (2006), for example, found that women scientists at universities were more likely to rely on their university’s TTO for industry contacts, advice, and encouragement in their innovative endeavors, whereas their male counterparts were more likely to rely on their personal networks. Further, organizations and programs that specifically provide legal assistance for inventors navigating the patenting process and/or assistance in securing funding to help cover the costs of applying for a patent, could be particularly instrumental in fostering innovation among women as the financial barriers to patenting tend to be more difficult for women to overcome.
Some research has suggested that TTOs might have played a role in increasing the share of women holding patents in recent decades (Sugimoto et al. 2015). This is likely due to a reduction in the perceived cost of patenting when women have access to industry contacts, advice, and encouragement through their TTOs (Ding, Murray, and Stuart 2006). However, there has not been a widespread evaluation of their effectiveness or the effectiveness of other similar programs/organizations. Such an evaluation could highlight promising programs and best practices to help foster women’s patenting, and perhaps indicate which programs could have the largest impact if scaled up in order to meet the needs of even more inventors.
Unfortunately, there isn’t currently a one-stop-shop for inventors seeking help and resources, and many inventors, particularly women, do not know where to look. In one of their interviews, Delixus, Inc. and National Women’s Business Council (2012b) found that there is a need for a resource, such as a website, where inventors can go to find out what sources of funding are available, how to apply for them, and what other resources/services are available to help inventors throughout the patenting process. Thus, efforts to create a comprehensive database of such resources for inventors could help women (and men) inventors secure the assistance they need in order to be successful.
Foster networks for women inventors and entrepreneurs.
Networks are extremely helpful for inventors as they provide them with industry contacts, access to a variety of funding sources, technical assistance with one’s own work, and opportunities to collaborate on projects. Women, however, tend to have smaller, more limited, networks than men;

31
women’s networks generally consist of similarly-situated peers that often face the same challenges that they do. Further, though research shows that gender diverse teams tend to be more successful than single-sex teams, women do not receive as many invitations to serve on research teams as men do, likely a partial result of their smaller networks (Murray and Graham 2007).
It is important to develop women scientists’ networks further. This does not necessarily mean that more women-centric professional organizations or other organizations that provide networking opportunities for women scientists are necessary. There are already a number of organizations that provide networking opportunities for inventors, which could be crucial in identifying industry contacts or collaborative partners that one would normally not have access to, such as the United Inventors Association of America and inventors’ networks in each state, as well as professional organizations such as the National Society of Professional Engineers and the Institute of Electrical and Electronics Engineers. Women’s absence in these groups may stem from being unaware of or unfamiliar with any of these organizations. Creating a list of networking and professional organizations and including this list in the database of resources (noted above) would increase awareness and promote the involvement of women in these groups. Encouraging membership and active engagement within these organizations could help expand women’s networks, and lead to more opportunities for collaboration and access to resources.
Continue to support efforts to get more women and girls interested in STEM fields.
Despite substantial progress, women are still vastly underrepresented among STEM degree holders. This is particularly true for patent-intensive fields within STEM such as engineering, where women only make up 19.1 percent of all degree holders (Figure 3). Researchers have determined that while women’s underrepresentation among STEM degree holders overall only accounts for a small part of the patenting gap between men and women, their underrepresentation in key patent-intensive fields accounts for nearly a third of the observed patenting gap (Hunt et al. 2012). Efforts to get more women and girls interested in fields such as engineering, and to stay in those fields once they enter them, may be an effective tool in addressing the gender gap in patenting.
Scholars have examined how to increase women’s entry into and retention in scientific fields, focusing both on interpersonal interventions (such as mentorship, outreach to underrepresented groups, and campaigns against stereotypes) and systematic changes. Initially researchers assumed that women performed worse in science and math and therefore were less inclined to go into STEM fields; as a result, much of the initial efforts to increase women and girls’ participation in STEM were centered around individual encouragement and mentorship to both enter and stay in STEM fields (Bystydzienski 2004). However, performance differences between women and men have become insignificant in recent years though women’s participation remains very low (Clewell and Campbell 2002). This suggests that more systemic barriers facing women in STEM fields must be addressed if further progress is to be made.
Rosser (2004) found overt discrimination and harassment by peers and supervisors to be a major challenge facing women in STEM. One does not need to search long to find examples of rampant sexism and misogyny in these industries (see for example Hu 2013), so it is no surprise that women were 45 percent more likely than their male peers to leave the industry within the year (Hewlett and Sherbin 2014). Though addressing these types of obstacles requires much more of a cultural shift, Rosser (2004) does suggest that institutions need to create (if such policies do not already exist) and enforce policies against sexual harassment and sex discrimination in hiring, promotion, and tenure decisions (Rosser 2004). Proper enforcement of such policies is critical—without adequate enforcement and appropriate consequences for harassment or discriminatory behavior,
32
the behavior will persist. Further, if women do not feel that reporting such behavior will be effective in remedying the situation—or worse, if they feel that they will be adversely affected by reporting it—they may be less inclined to do so.
Beyond creating and enforcing policies against sexual harassment and sex discrimination, some scholars suggest that changes to the language used by leaders can prevent the reinforcement of negative stereotypes about women in STEM and contribute to a gradual culture shift. Burack and Franks (2004), speaking specifically to the field of engineering, note that language that both equates whiteness and masculinity with engineering, as well as establishes engineering as superior to other fields, perpetuates a culture within the field that is particularly unwelcoming to women and people of color. They specifically note the example of engineering requiring both “hard” and “soft” skills. Hard skills are “technical, mathematical, and scientific” whereas soft skills are “interpersonal and communicative.” The word choice implies a hierarchy, with hard skills seen as superior. Additionally, there is an unconscious cultural identification of softness with femininity. Because of this, the authors suggest that leaders in the field avoid these and other words that have gendered connotations in favor of terminology that is more gender neutral. In the case of hard and soft skills, the authors recommend language such as “Successful engineers have strong communication and technical skills” rather than “To succeed, an engineer needs soft skills as well as hard skills.” They further suggest language to highlight the benefits of engineering to all, such as “Engineering meets the needs of society” rather than simply lamenting that “Engineering just doesn’t appeal to women” (Burack and Franks 2004, 86). While such subtle changes to the language employed by leaders may seem trivial, it is likely that the perpetual use of gendered terminology and the assumption of engineering (and other STEM fields) as superior to other fields has contributed to unconscious biases against women and people of color in STEM (Burack and Franks 2004). This language ultimately manifests itself in inhospitable work environments for women and people of color, characterized by racial and sexual harassment (Burack and Franks 2004).
Support family responsibilities with child care and paid family leave
Using responses to e-mail questionnaires filled out by nearly 400 awardees of the National Science Foundation (NSF) funded Professional Opportunities for Women in Research and Education (POWRE) program, Rosser (2004) finds that among female academic scientists the most significant challenge faced, as they plan their careers, is balancing work and family obligations. For women academic scientists, this is especially pressing because for many women the decision to have children can affect their likelihood of getting tenure (Cook 2001). Rosser (2004) suggests that family-friendly policies, such as the ability to stop the tenure clock around the birth or adoption of a new child, providing on-site child care, and making it easier for universities to hire academic spouses are important changes that can be implemented to help recruit and retain more women in these fields. Although these findings are based on insights from women academic scientists, women scientists outside of academia likely face similar issues.
Recognizing the importance of family-friendly workplace policies in attracting and retaining talented female (and male) employees, prominent technology firms are beginning to offer paid maternity and paternity leave or expanding their current offerings. Google, for example, recently increased the amount of paid maternity leave offered to employees from three months to five and made the leave fully paid (when originally it was only partially paid). As a result, turnover among new mothers decreased by 50 percent (Emswiler 2016). Other studies have confirmed that paid maternity leave improves women’s labor force attachment and increases the likelihood that a woman will return to her pre-birth employer (see Gault et al. [2014] for a summary of the research on the impact of maternity leave on women's labor force attachment), suggesting that expanding
33
the availability and generosity of paid leave offered may help improve retention rates among women in high-patenting technology firms and universities.
Include commercial patenting in tenure and promotion decisions and make support for such endeavors clear.
Research indicates that particularly among academic scientists, gendered differences in attitudes toward patenting exist. As noted, Ding, Murray, and Stuart (2006) find that women academic scientists tended to view commercial activity and teaching (and other university obligations) as a tradeoff—patenting activity came at the cost of less time with students etc.—whereas men were more likely to feel that the two were complementary. Further, Murray and Graham (2007) found that many women scientists were ambivalent about commercial science and expressed reservations with the practice. Clear institutional rules, indicating the university’s support for commercial activities and metrics for how such activities are factored into the tenure and promotion process, could both help resolve women academic scientists’ reservations about commercial activity and provide guidance on how the university views patenting activity fitting in with other university activities. Several research universities have already factored inventions and commercial involvement into their tenure and promotion decisions (Stevens, Johnson, and Sanberg 2011; Association of Public & Land-Grant Universities 2015), though many still have yet to clearly define their position on patenting among faculty.

34
Appendix: Data Sources United States Patent and Trademark Office Data The United States Patent and Trademark Office (USPTO) is the primary source of information on patenting activity in the country. Patenting data from the USPTO can be accessed through a variety of channels and information on the patent type (utility, design, or plant), patent class (broad technological category), filing date, grant date, processing time, number of citations, names of inventors and their locations, as well as assignees at-issue and their locations are generally available (“PatentsView” 2016). Due to confidentiality concerns, however, the USPTO does not track any demographic information of inventors such as sex or race/ethnicity (U.S. Patent and Trademark Office 1999). As discussed above, the USPTO has recently attempted to match patent data with existing data sources through the Census Bureau’s Center for Economic Studies in order to gain more information on the diversity of patent holders and has sought public comments on whether and how additional information on applicants should be collected. However, no solution that provides both anonymity to inventors as well as the rich demographic information on patent holders has yet been identified (U.S. Patent and Trademark Office 2015c). Thus, there is still much that researchers do not know about patenting behavior among women.
Because of the nature of the available data, existing research on patenting rates among women has relied on commercial name-matching software in order to identify the gender of the inventor(s) on each patent. Such software compares the names of the inventors listed on each patent with lists of the most popular male and female names for each year. If an inventor’s name corresponds to a name that is exclusively male or female, the software automatically assigns the appropriate gender. However, ambiguity arises when names are not exclusively male or female. Existing research varies in how this is handled: some assign ambiguous names as male (see for example U.S. Patent and Trademark Office 1999); others employ a more rigorous approach using multiple name databases and assigning gender based on the relative frequency that the name appears in each gender’s name database (see for example Delixus, Inc. and National Women’s Business Council 2012a). This obviously introduces some amount of error into estimates of patenting behavior, though more recent research has been able to improve the accuracy of gender assignment. A 2012 study by the National Women’s Business Council (NWBC), for example, deterministically identified the gender of 94 percent of the names in the database of patents analyzed. The remaining six percent were assigned a gender based on the ratio of patents awarded to males and females for each year (Delixus, Inc. and National Women’s Business Council 2012a).
Because patents can have more than one inventor listed, multiple methods of classifying a patent as “female” exist, and each have benefits and drawbacks. The most common is to define a patent as female-held if at least one of the authors is a woman. One problem with this method is that it can overestimate women’s involvement in patenting because it is more common for teams to have more men than women, so even if a team has five men and one woman on it, it is defined as a female-held patent. Another alternative is defining a patent as female-held only if the primary inventor (or the first inventor listed on the patent) is a woman. The drawback of this method is that many companies list authors alphabetically instead of by relative contribution. Finally, patents can be assigned a gender by “fractional attribution” in which the patent is divided into the percentage female based on the relative number of inventors that are women and men listed on the patent. This method paints a more complete picture of women’s representation in patenting, but is more complicated than the other methods to implement (Ashcraft and Breitzman 2012).
35
National Survey of College Graduates Data The National Survey of College Graduates (NSCG) is another common data source used to examine patenting behavior by gender. The NSCG is a longitudinal survey that has been conducted biennially by the National Science Foundation since the 1970’s and samples college graduates with at least a bachelor’s degree, living in the United States during the reference week, and under the age of 76. The 2003 wave of the survey included information on whether the respondent was named as an inventor on a patent application in the past five years, the number of patent applications in which the respondent was named as an inventor, the number of patent applications that have been granted, and the number of patent applications granted that resulted in commercialization.
A notable advantage of the NSCG dataset is that it allows researchers to examine patenting behavior specifically by gender without having to rely on name matching. Additionally, the richness of the information gathered on survey respondents means that researchers can also examine patenting behavior at the intersection of gender and other characteristics such as age, race/ethnicity, and educational attainment. The NSCG, unlike the USPTO data, is not representative of all patent holders in the United States and since the questions pertaining to patenting activity have not been asked again since 2003, the data are out of date. Due to the nature of the data it is not possible to estimate what percentage of patents are women-held; however, the data do allow researchers to estimate other useful statistics that are not possible to gather from the USPTO data, including the percentage of women with a bachelor’s degree or higher that have applied for/have been granted a patent in the recent past and the average number of patents granted among women who have patented.

36
References Anderson, Julie, Elyse Shaw, Chandra Childers, Jessica Milli, and Asha DuMonthier. 2016. Status of
Women in the South. IWPR #R462. Washington, DC: Institute for Women’s Policy Research. <http://www.iwpr.org/publications/pubs/status-of-women-in-the-south>.
Ashcraft, Catherine and Anthony Breitzman. 2012. Who Invents IT? Women’s Participation in Information Technology Patenting, 2012 Update. National Center for Women & Information Technology. <https://www.ncwit.org/sites/default/files/resources/2012whoinventsit_web_1.pdf> (accessed March 7, 2016).
Association of Public & Land-Grant Universities. 2015. Final Report and Recommendations: Consideration of Technology Transfer in Tenure and Promotion. <http://www.aplu.org/projects-and-initiatives/research-science-and-technology/technology-transfer/TenureTransferReport.pdf> (accessed July 25, 2016).
Beasley, Maya A. and Mary J. Fischer. 2012. “Why They Leave: The Impact of Stereotype Threat on the Attrition of Women and Minorities from Science, Math and Engineering Majors.” Social Psychology of Education 15: 427–48.
Beede, David, Tiffany Julian, David Langdon, George McKittrick, Beethika Khan, and Mark Doms. 2011. Women in STEM: A Gender Gap to Innovation. Washington, DC: U.S. Department of Commerce, Economics and Statistics Administration. <http://www.esa.doc.gov/sites/default/files/womeninstemagaptoinnovation8311.pdf> (accessed April 18, 2016).
Bercovitz, Janet and Maryann Feldman. 2007. “Academic Entrepreneurs: Organizational Change at the Individual Level.” Organization Science 19 (1): 69–89. doi:10.1287/orsc.1070.0295.
Blakemore, Erin. “Meet Mary Kies, America’s First Woman to Become a Patent Holder.” Smartnews | Smithsonian.com, May 5, 2016. <http://www.smithsonianmag.com/smart-news/meet-mary-kies-americas-first-woman-become-patent-holder-180959008/> (accessed August 1, 2016).
Blind, Knut and Andre Jungmittag. 2008. “The Impact of Patents and Standards on Macroeconomic Growth: A Panel Approach Covering Four Countries and 12 Sectors.” Journal of Productivity Analysis 29 (1): 51–60.
Bowles, Samuel and Herbert Gintis, eds. 2011. “Socialization.” In A Cooperative Species, 167–85. Princeton University Press. <http://www.jstor.org.proxygw.wrlc.org/stable/j.ctt7s72v.13> (accessed May 4, 2016).
Breitzman, Anthony and Patrick Thomas. 2015. “Inventor Team Size as a Predictor of the Future Citation Impact of Patents.” Scientometrics 103 (2): 631–47. doi:10.1007/s11192-015-1550-5.
Burack, Cynthia and Suzanne E. Franks. 2004. “Telling Stories about Engineering: Group Dynamics and Resistance to Diversity.” NWSA Journal 16 (1): 79–95.
Bystydzienski, Jill M. 2004. “(Re)Gendering Science Fields: Transforming Academic Science and Engineering.” NWSA Journal 16 (1): viii–xii.
Carley, Michael, Deepak Hegde, and Alan Marco. 2014. What Is the Probability of Receiving a US Patent? USPTO Economic Working Paper, Working Paper No. 2013-2. Office of Chief Economist, U.S. Patent and Trademark Office. <http://www.uspto.gov/ip/officechiefecon/OCE_WP_2013-2.pdf> (accessed June 27, 2016).
Clewell, Beatriz Chu and Patricia B. Campbell. 2002. “Taking Stock: Where We’ve Been, Where We Are, Where We’re Going.” Journal of Women and Minorities in Science and Engineering 8 (3&4). doi:10.1615/JWomenMinorScienEng.v8.i3-4.20.

37
Cook, Lisa D. and Chaleampong Kongcharoen. 2010. The Idea Gap in Pink and Black. Michigan State University. <https://www.msu.edu/~lisacook/pink_black_0810.pdf> (accessed August 11, 2016).
Cook, Sarah L. 2001. “Negotiating Family Accommodation Practices on Your Campus.” Women in Higher Education 10 (4): 25–26.
Davis, Shannon N. and Theodore N. Greenstein. 2009. “Gender Ideology: Components, Predictors, and Consequences.” Annual Review of Sociology 35: 87–105.
de Melo-Martín, Inmaculada. 2013. “Patenting and the Gender Gap: Should Women Be Encouraged to Patent More?” Science and Engineering Ethics 19 (2): 491–504. doi:10.1007/s11948-011-9344-5.
Delixus, Inc. and National Women’s Business Council. 2012a. Intellectual Property and Women Entrepreneurs. <http://nwbc.gov/sites/default/files/IP%20&%20Women%20Entrepreneurs.pdf> (accessed November 24, 2015).
———. 2012b. Intellectual Property and Women Entrepreneurs - Part II: Qualitative. Washington, DC. <https://www.nwbc.gov/sites/default/files/QUALITATIVE%20ANALYSIS%20REPORT%20%282%29.pdf> (accessed July 20, 2016).
Ding, Waverly W., Fiona Murray, and Toby E. Stuart. 2006. “Gender Differences in Patenting in the Academic Life Sciences.” Science, New Series, 313 (5787): 665–67.
Edmonds, Molly. “Top 10 Things That Women Invented.” HowStuffWorks: Science, January 12, 2011. <http://science.howstuffworks.com/innovation/inventions/10-things-that-women-invented.htm> (accessed August 1, 2016).
Emswiler, Kate. 2016. “4 Brilliant Ways Google Is Closing the Gender Gap.” Popsugar. November 15. <http://www.popsugar.com/career/How-Can-Companies-Close-Gender-Gap-42712742> (accessed November 28, 2016).
Fox, Mary Frank, Carolyn Fonseca, and Jinghui Bao. 2011. “Work and Family Conflict in Academic Science: Patterns and Predictors among Women and Men in Research Universities.” Social Studies of Science 41 (5): 715–35.
Franzwa, Gregg and Charles Lockhart. 1998. “The Social Origins and Maintenance of Gender: Communication Styles, Personality Types and Grid-Group Theory.” Sociological Perspectives 41 (1): 185–208. doi:10.2307/1389359.
Garber, Sarah. 2016. “Gender And The USPTO.” Above the Law. March 16. <http://abovethelaw.com/2016/03/gender-and-the-uspto/> (accessed April 4, 2016).
Gault, Barbara, Heidi Hartmann, Ariane Hegewisch, Jessica Milli, and Lindsey Reichlin. 2014. Paid Parental Leave in the United States: What the Data Tell Us about Access, Usage, and Economic and Health Benefits. Washington, DC: Institute for Women’s Policy Research. <http://www.iwpr.org/publications/pubs/paid-parental-leave-in-the-united-states-what-the-data-tell-us-about-access-usage-and-economic-and-health-benefits> (accessed December 15, 2015).
Graham, Stuart J. H., Robert P. Merges, Pamela Samuelson, and Ted M. Sichelman. 2009. “High Technology Entrepreneurs and the Patent System: Results of the 2008 Berkeley Patent Survey.” Berkeley Technology Law Journal 24 (4): 255–327.
Hall, Bronwyn H., Adam Jaffe, and Manuel Trajtenberg. 2005. “Market Value and Patent Citations.” RAND Journal of Economics 36 (1): 16–38.
Häussler, Carolin, Dietmar Harhoff, and Elisabeth Mueller. 2012. To Be Financed or Not… - The Role of Patents for Venture Capital-Financing. SSRN Scholarly Paper, ID 1393725. Rochester, NY: Social Science Research Network. <http://papers.ssrn.com/abstract=1393725> (accessed July 11, 2016).

38
Hewlett, Sylvia and Laura Sherbin. 2014. Athena Factor 2.0: Accelerating Female Talent in Science, Engineering & Technology. Center for Talent Innovation. <http://www.talentinnovation.org/_private/assets/Athena-2-ExecSummFINAL-CTI.pdf> (accessed July 28, 2016).
Hill, Catherine, Christianne Corbett, and Andresse Rose. 2010. Why So Few? Women in Science, Technology, Engineering, and Mathematics. AAUW. <http://www.aauw.org/files/2013/02/Why-So-Few-Women-in-Science-Technology-Engineering-and-Mathematics.pdf>.
Hsu, Lien-An, Kun-Hong Lee, and Chien-Chiang Lin. 2010. “A Comparison of Individual and Team Research Performance: A Study of Patents in III.” In , 6. Phuket. <http://ieeexplore.ieee.org/xpl/login.jsp?tp=&arnumber=5602085&url=http%3A%2F%2Fieeexplore.ieee.org%2Fxpls%2Fabs_all.jsp%3Farnumber%3D5602085> (accessed May 2, 2016).
Hu, Elise. “Sexism In The Tech Industry Takes Center Stage.” NPR.org, September 11, 2013. <http://www.npr.org/sections/alltechconsidered/2013/09/11/221052414/sexism-in-the-tech-industry-takes-center-stage> (accessed July 28, 2016).
Hunt, Jennifer, Jean-Philippe Garant, Hannah Herman, and David J. Munroe. 2012. Why Don’t Women Patent? National Bureau of Economic Research. <http://www.nber.org/papers/w17888.pdf> (accessed October 21, 2015).
Ibarra, Herminia. 1993. “Network Centrality, Power, and Innovation Involvement: Determinants of Technical and Administrative Roles.” The Academy of Management Journal 36 (3): 471–501. doi:10.2307/256589.
Institute for Women’s Policy Research. 2015a. IWPR Calculations of Data from the 2012 Survey of Business Owners Accessed through the U.S. Census Bureau’s American Fact Finder. Table SB1200CSA01: Statistics for All U.S. Firms by Industry, Gender, Ethnicity, and Race for the U.S., States, Metro Areas, Counties, and Places: 2012.
———. 2015b. IWPR Calculations of Data from the 2012 Survey of Business Owners Accessed through the U.S. Census Bureau’s American Fact Finder. Table SB1200CSCB13: Statistics for All U.S. Firms by Sources of Capital Used to Start or Acquire the Business by Industry, Gender, Ethnicity, Race, and Veteran Status for the U.S.: 2012.
Inventors Eye. 2016. “Organizations for Inventors.” Organizations for Inventors. <http://www.uspto.gov/custom-page/inventors-eye-network> (accessed July 29, 2016).
Kahler, Annette I. 2011. “Examining Exclusion in Woman-Inventor Patenting: A Comparison of Educational Trends and Patent Data in the Era of Computer Engineer Barbie.” Journal of Gender, Social Policy & the Law 19 (3): 773–98.
Kanter, Rosabeth Moss. 1977. Men and Women of the Corporation. New York: Basic Books. Lanjouw, Jean O. and Mark Schankermann. 2002. Research Productivity and Patent Quality:
Measurement with Multiple Indicators. Discussion Paper, EI/32. London School of Economics and Political Sciences. <http://sticerd.lse.ac.uk/dps/ei/ei32.pdf> (accessed May 13, 2016).
Lemelson-MIT Program. n.d. “Chapter 8: What Are Some Options to Commercialize My Patent?” In Inventor Handbook. <http://lemelson.mit.edu/resources/chapter-8-what-are-some-options-commercialize-my-patent> (accessed July 20, 2016).
Lucas, Jeffrey W. and Amy R. Baxter. 2012. “Power, Influence, and Diversity in Organizations.” The Annals of the American Academy of Political and Social Science 639: 49–70.
Martinez, Elisabeth D., Jeannine Botos, Kathleen M. Dohoney, Theresa M. Geiman, Sarah S. Kolla, Ana Olivera, Yi Qiu, Geetha Vani Rayasam, Diana A. Stavreva, and Orna Cohen-Fix. 2007. “Falling Off The Academic Bandwagon: Women Are More Likely To Quit at the Postdoc to Principal Investigator Transition.” EMBO Press 8: 977–81.
Meng, Yu. 2016. “Collaboration Patterns and Patenting: Exploring Gender Distinctions.” Research Policy 45 (1): 56–67. doi:10.1016/j.respol.2015.07.004.

39
Mortimer, Jeylan T. and Roberta G. Simmons. 1978. “Adult Socialization.” Annual Review of Sociology 4: 421–54.
Murray, Fiona and Leigh Graham. 2007. “Buying Science and Selling Science: Gender Differences in the Market for Commercial Science.” Industrial and Corporate Change 16 (4): 657–89. doi:10.1093/icc/dtm021.
National Academy of Engineering, Committee on Public Understanding of Engineering Messages. 2008. Changing the Conversation: Messages for Improving Public Understanding of Engineering. Washington, D.C.: National Academies Press. <http://site.ebrary.com.proxygw.wrlc.org/lib/wrlc/reader.action?docID=10246304> (accessed April 27, 2016).
Nerkar, Atul and Srikanth Paruchuri. 2005. “Evolution of R&D Capabilities: The Role of Knowledge Networks within a Firm.” Management Science 51 (5): 771–85.
Owen-Smith, Jason and Walter W. Powell. 2001. “To Patent or Not: Faculty Decisions and Institutional Success at Technology Transfer.” The Journal of Technology Transfer 26 (1–2): 99–114. doi:10.1023/A:1007892413701.
“PatentsView.” 2016. <http://www.patentsview.org/web/> (accessed May 10, 2016). Powell, Walter. 1990. “Neither Market nor Hierarchy: Network Forms of Organization.” Research in
Organizational Behavior 12: 295–336. Powell, Walter W., Douglas R. White, Kenneth W. Koput, and Jason Owen-Smith. 2005. “Network
Dynamics and Field Evolution: The Growth of Interorganizational Collaboration in the Life Sciences.” American Journal of Sociology 110 (4): 1132–1205.
Premier Quantitative Consulting, Inc. 2015. Research on Undercapitalization as a Contributor to Business Failure for Women Entrepreneurs. Orlando, FL: Premier Quantitative Consulting, Inc. <https://www.nwbc.gov/sites/default/files/Undercapitalization%20as%20a%20Contributor%20to%20Business%20Failure%20for%20Women%20Entpreneurs.pdf> (accessed February 12, 2016).
Quinn, Gene. 2014. “Getting Your Invention to Market: Licensing vs. Manufacturing| Patents & Patent Law.” IPWatchdog.com | Patents & Patent Law. August 16. <http://www.ipwatchdog.com/2014/08/16/getting-your-invention-to-market-licensing-vs-manufacturing/id=50805/> (accessed July 20, 2016).
———. 2015. “The Cost of Obtaining a Patent in the US| Patents & Patent Law.” IPWatchdog.com | Patents & Patent Law. April 4. <http://www.ipwatchdog.com/2015/04/04/the-cost-of-obtaining-a-patent-in-the-us/id=56485/> (accessed May 16, 2016).
Reagans, Ray and Ezra W. Zuckerman. 2001. “Networks, Diversity, and Productivity: The Social Capital of Corporate R&D Teams.” Organization Science 12 (4): 502–17.
Reskin, Barbara. 1993. “Sex Segregation in the Workplace.” Annual Review of Sociology 19: 241–70. Robb, Alicia. 2013. Access to Capital Among Young Firms, Minority-Owned Firms, Women-Owned
Firms, and High-Tech Firms. Washington DC: SBA Office of Advocacy. <https://www.sba.gov/sites/default/files/files/rs403tot(2).pdf> (accessed November 18, 2015).
Rosser, Sue V. 2004. “Using POWRE to ADVANCE: Institutional Barriers Identified by Women Scientists and Engineers.” NWSA Journal 16 (1): 50–78.
———. 2009. “The Gender Gap in Patenting: Is Technology Transfer a Feminist Issue?” NWSA Journal 21 (2): 65–84.
———. 2012. “The Gender Gap in Patents.” In Breaking Into the Lab: Engineering Progress for Women in Science, 150–77. NYU Press. <http://www.jstor.org.proxygw.wrlc.org/stable/j.ctt16gzpbq.9> (accessed July 20, 2016).
Rothwell, Jonathan, José Lobo, Deborah Strumsky, and Mark Muro. 2013. “Patenting Prosperity: Invention and Economic Performance in the United States and Its Metropolitan Areas.” The

40
Brookings Institution. February 1. <http://www.brookings.edu/research/reports/2013/02/patenting-prosperity-rothwell> (accessed May 13, 2016).
Sandberg, Sheryl. 2013. Lean In: Women, Work, and the Will to Lead. New York: Random House, Inc. <http://www.amazon.com/Lean-Women-Work-Will-Lead/dp/0385349947> (accessed May 9, 2016).
Snyder, Thomas D., Cristobal de Brey, and Sally A. Dillow. 2016. Digest of Education Statistics, 2014 (NCES 2016006). National Center for Education Statistics. <https://nces.ed.gov/pubsearch/pubsinfo.asp?pubid=2016006> (accessed May 24, 2016).
Spencer, Steven J., Christine Logel, and Paul G. Davies. 2016. “Stereotype Threat.” Annual Review of Psychology 67 (1): 415–37. doi:10.1146/annurev-psych-073115-103235.
Spencer, Steven J., Claude M. Steele, and Diane M. Quinn. 1999. “Stereotype Threat and Women’s Math Performance.” Journal of Experimental Social Psychology 35 (1): 4–28. doi:10.1006/jesp.1998.1373.
Stephan, Paula E. and Asmaa A. El-Ganainy. 2006. “The Entrepreneurial Puzzle: Explaining the Gender Gap.” Journal of Technology Transfer 32: 475–85.
Stevens, Ashley J., Ginger A. Johnson, and Paul R. Sanberg. 2011. “The Role of Patents and Commercialization in the Tenure and Promotion Process.” Technology & Innovation 13 (3): 241–48. doi:10.3727/194982411X13189742259479.
Sugimoto, Cassidy R., Chaoqun Ni, Jevin D. West, and Vincent Larivière. 2015. “The Academic Advantage: Gender Disparities in Patenting.” PLOS ONE 10 (5): e0128000. doi:10.1371/journal.pone.0128000.
Tsai, Wenpin and Sumantra Ghoshal. 1998. “Social Capital and Value Creation: The Role of Intrafirm Networks.” The Academy of Management Journal 41 (4): 464–76. doi:10.2307/257085.
Turk-Bicaki, Lori, Andrea Berger, and Clarisse Haxton. 2014. Leaving STEM: STEM Ph.D. Holders in Non-STEM Careers. American Institutes for Research. <http://www.air.org/sites/default/files/downloads/report/STEM%20PhDs%20in%20non-STEM%20Careers_July%202014.pdf> (accessed August 18, 2016).
United States Patent and Trademark Office. 2016. “Responding to Office Actions.” Text. <http://www.uspto.gov/patents-maintaining-patent/responding-office-actions> (accessed September 13, 2016).
U.S. Patent and Trademark Office. 1999. Buttons to Biotech: 1996 Update Report: U.S. Patenting by Women, 1977 to 1996. <http://www.uspto.gov/web/offices/ac/ido/oeip/taf/wom_98.pdf> (accessed February 10, 2016).
———. 2012. “Design Patent Application Guide.” Text. August 13. <http://www.uspto.gov/patents-getting-started/patent-basics/types-patent-applications/design-patent-application-guide> (accessed May 16, 2016).
———. 2015a. “Nonprovisional (Utility) Patent Application Filing Guide.” Text. January 28. <http://www.uspto.gov/patents-getting-started/patent-basics/types-patent-applications/nonprovisional-utility-patent#heading-4> (accessed May 16, 2016).
———. 2015b. “General Information About 35 U.S.C. 161 Plant Patents.” Text. February 20. <http://www.uspto.gov/patents-getting-started/patent-basics/types-patent-applications/general-information-about-35-usc-161> (accessed May 16, 2016).
———. 2015c. “Memorandum on the Study of Diversity Among Patent Applicants.” <http://www.uspto.gov/sites/default/files/documents/Determination%20on%20Diversity%20of%20Applicants.pdf> (accessed July 29, 2016).
———. 2016a. “U.S. Patent Statistics Chart: Calendar Years 1963-2015.” <http://www.uspto.gov/web/offices/ac/ido/oeip/taf/us_stat.htm> (accessed July 11, 2016).

41
———. 2016b. “Patent Process Overview.” Text. March 3. <http://www.uspto.gov/patents-getting-started/patent-process-overview#step1> (accessed July 20, 2016).
———. 2016c. “Types of Patents.” March 31. <https://www.uspto.gov/web/offices/ac/ido/oeip/taf/patdesc.htm> (accessed November 28, 2016).
———. 2016d. “USPTO Fee Schedule.” Text. April 9. <http://www.uspto.gov/learning-and-resources/fees-and-payment/uspto-fee-schedule> (accessed May 16, 2016).
Walsh, Mary Roth, ed. 1997. “Conversational Style: Do Women and Men Speak Different Languages?” In Women, Men, and Gender: Ongoing Debates, 79–81. New Haven, CT: Yale University Press. <http://www.jstor.org.proxygw.wrlc.org/stable/j.ctt32brbj.17> (accessed May 9, 2016).
Whittington, Kjersten Bunker. 2009. “Patterns of Male and Female Scientific Dissemination in Public and Private Science.” In Science and Engineering Careers in the United States: An Analysis of Markets and Employment, ed. Richard B. Freeman and Daniel L. Goroff, 195–228. Chicago, IL: University of Chicago Press. <http://www.nber.org/chapters/c11622> (accessed May 3, 2016).
Whittington, Kjersten Bunker and Laurel Smith-Doer. 2008. “Women Inventors In Context: Disparities in Patenting across Academia and Industry.” Gender and Society 22 (2): 194–218.
Winters, John. 2014. “Foreign and Native-Born STEM Graduates and Innovation Intensity in the United States.” IZA Discussion Papers Research Network, October. <http://ftp.iza.org/dp8575.pdf> (accessed April 29, 2016).
Wulf, William. 1998. “Diversity in Engineering.” The Bridge 28 (4). <https://www.nae.edu/Publications/Bridge/CompetitiveMaterialsandSolutions/DiversityinEngineering.aspx> (accessed August 1, 2016).

![Impact of Product Innovation in Building Brand Equity on ... · The consumer-based brand equity pyramid [27] is an answer to sequential framework as it focuses on brand ... competitive](https://static.fdocuments.us/doc/165x107/5f02cf4e7e708231d4061ef1/impact-of-product-innovation-in-building-brand-equity-on-the-consumer-based.jpg)