PLANNING ACCESSIBILITY IN THE OLD CITY ... - Access Unlimited

i
Equity in Accessibility, a Case Study of City of Sacramento
A Senior Project
presented to
Cornelius Nuworsoo of the City and Regional Planning Department
California Polytechnic State University, San Luis Obispo
In Partial Fulfillment
of the Requirements for the Degree
Bachelor of Science
By
Meredith Milam
June 2021
© 2021 Meredith Milam

ii
-- This Page Intentionally Left Blank --

iii
Approval Page
Title: Equity in Accessibility, a Case Study of City of Sacramento
Author: Meredith Milam
Date Submitted: June 2021
Cornelius Nuworsoo, Ph.D., AICP _________________________ ___________
Senior Project Advisor Signature Date
Michael Boswell, Ph.D., AICP _________________________ ___________
Department Head Signature Date

iv
-- This Page Intentionally Left Blank --

v
Acknowledgements
Thank you to Professor Cornelius Nuworsoo, my Senior Project Advisor, for sparking my
interest in transportation planning. I truly appreciate your guidance throughout the last 4
years. Thank you to Will Edmonson for your guidance and wisdom in GIS and increasing my
knowledge and interest in spatial analysis. Thank you to my friends and family for supporting
me and always pushing me to do my best. Thank you to my dad for always talking
transportation with me and inspiring me to create my own passion within the transportation
field.

vi
Contents
Acknowledgements ..................................................................................... v
List of Figures ........................................................................................... viii
List of Tables ............................................................................................. ix
Abstract ...................................................................................................... x
1. Introduction ............................................................................................. 1
1.1 Accessibility ........................................................................................................... 1
1.2 Equity ..................................................................................................................... 3
2. Premise .................................................................................................. 6
2.1 Study Purpose ....................................................................................................... 6
2.2 Study Methodology ................................................................................................ 9
3. Background ........................................................................................... 10
3.1 Suburbanization ................................................................................................... 10
3.1.1 GI Bill and the New Deal ............................................................................... 10
3.1.2 Redlining ....................................................................................................... 12
3.1.3 Automobiles .................................................................................................. 12
3.1.4 Federal-Aid Highway Act ............................................................................... 13
3.1.5 White Flight ................................................................................................... 14
4. Case Studies ........................................................................................ 16
4.1 Columbus, Ohio ................................................................................................... 16
4.1.1 Background ................................................................................................... 16
4.1.2 Key takeaways .............................................................................................. 18
4.2 Case Study: Amsterdam, Netherlands ................................................................. 18
4.2.1 Background ................................................................................................... 18
4.2.2 Step 1: Population Groups ............................................................................ 20
4.2.3 Step 2: Measuring Potential Mobility and Accessibility .................................. 22
4.2.4 Step 3: Sufficiency Thresholds ...................................................................... 24
4.2.5 Step 4: Population Groups Entitled to Accessibility Improvements ............... 24
4.2.6 Step 5: Assessing the Severity of Accessibility Deficiency ............................ 26
4.2.7 Step 6: Prioritizing Population Groups ......................................................... 29
4.3 Key Takeaways ................................................................................................... 31
vii
5. Background to Study Area .................................................................... 33
5.1 Transportation Network ....................................................................................... 33
5.1.1 Roadway Network ......................................................................................... 33
5.1.2 Bicycle Network ............................................................................................. 33
5.1.3 Transit Network ............................................................................................. 33
5.1.4 Pedestrian Activity ......................................................................................... 37
5.2 Jobs and Commuting ........................................................................................... 39
5.2.1 Distribution of Job Centers ............................................................................ 39
5.2.2 Origins and Destinations of Workers ............................................................. 40
5.2.3 Commute Time .............................................................................................. 41
5.2.4 Commute Modes ........................................................................................... 42
5.3 Sacramento Case Study ...................................................................................... 43
5.3.1 Background ................................................................................................... 43
5.3.2 Key Takeaways: ........................................................................................ 44
5.4 Analysis of Study Area ......................................................................................... 44
5.4.1 Accessibility Study ........................................................................................ 44
5.4.2 Equity Analysis .............................................................................................. 49
5.5 Considerations ..................................................................................................... 55
5.6 Potential Solutions: .............................................................................................. 56
6. Conclusion ............................................................................................ 57
7. References ........................................................................................... 59

viii
List of Figures
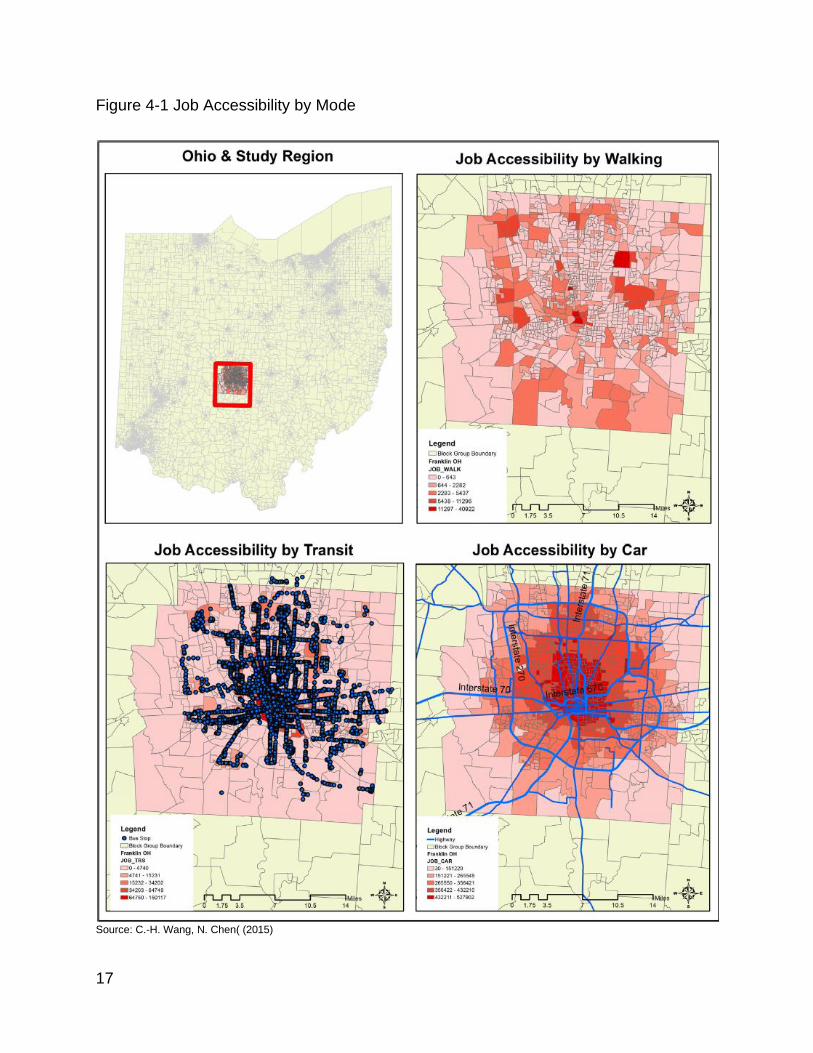
Figure 4-1 Job Accessibility by Mode ............................................................................ 17
Figure 4-2 The Rules of Transportation Planning Based on Principles of Justice ......... 19
Figure 4-3 Levels of Mobility and Accessibility by Population Groups ........................... 23
Figure 4-4 Populations dependent on Public Transport and Car ................................... 25
Figure 4-5 Accessibility Deficiency Among Transit Dependent Population Groups ....... 27
Figure 4-6 Accessibility Deficiency Among Population Groups with Access to a Car ... 28
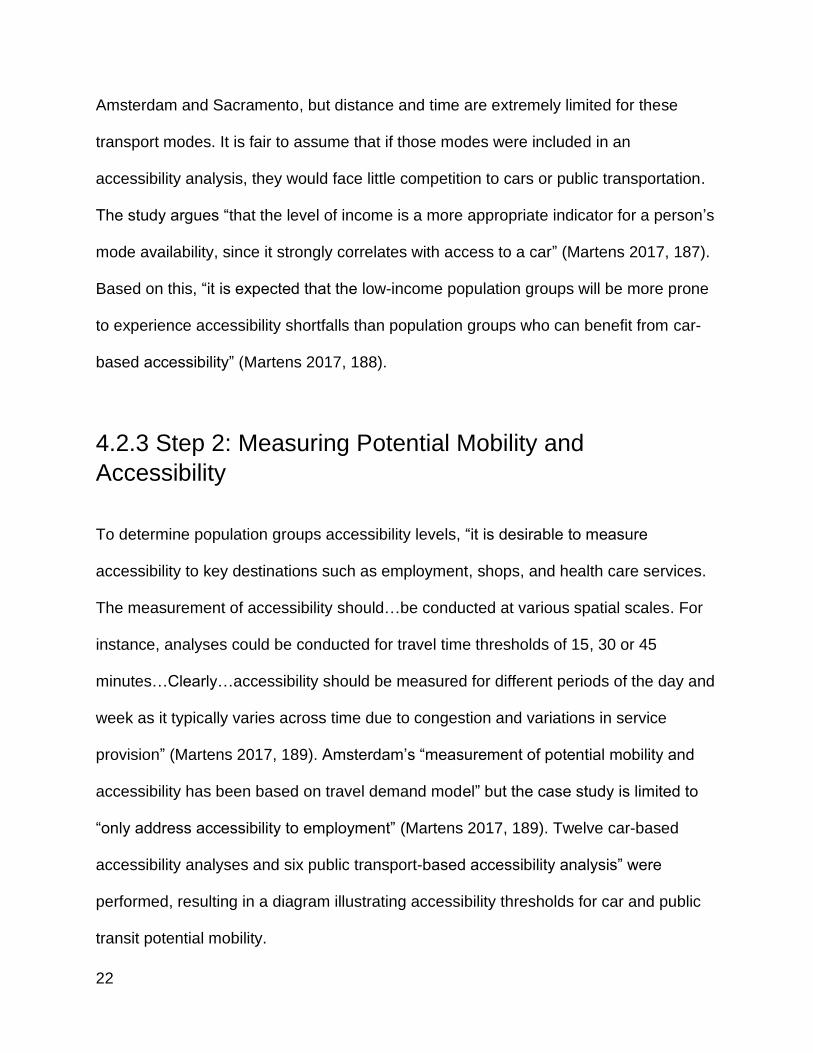
Figure 5-1 Roadway Classification and Lanes .............................................................. 34
Figure 5-2 Existing Bicycle Facilities ............................................................................. 35
Figure 5-3 Existing Transit System ............................................................................... 36
Figure 5-4 Commuters Walking to Work ....................................................................... 38
Figure 5-5 Counts and Density of All Jobs in Work Selection Area in 2018 .................. 39
Figure 5-6 Inflow/Outflow Counts of All Jobs in Sacramento Region in 2018 ................ 40
Figure 5-7 Accessibility from Sacramento Valley Station by Mode ............................... 47
Figure 5-8 Accessibility to Sacramento Valley Station by Mode .................................... 48
Figure 5-9 Vehicle Accessibility to and from Sac Valley Station .................................... 49
Figure 5-10 Percent of Population by Block Group Non-White ..................................... 52
Figure 5-11 Percent of Population by Block Group that is Below the Poverty Threshold
...................................................................................................................................... 54
Figure 5-12 Peak Travel Time Isochrones by Public Transit in the Sacramento Area .. 55

ix
List of Tables
Table 5-1 Travel Time to Work by Gender .................................................................... 41
Table 5-2 Travel Time by Commute Mode .................................................................... 42
Table 5-3 Means of Transportation to Work by Gender ................................................ 43
Table 5-4 Commute Mode by Race and Hispanic or Latino Origin ............................... 51

x
Abstract
This paper is a Geographic Information Systems (GIS) spatial analysis of the
transportation accessibility and equity in Sacramento, California. A literature review
examines discriminatory regulatory policies in the 1900s that wrote racial segregation
into law. The effects of these policies have lasting effects on spatial dispersal of people
and create barriers to accessibility and therefore result in inequitable transportation
systems. The accessibility and equity analysis in Sacramento explores demographic
data, job concentration and available modes of transportation, and commuter data. The
results of the analysis suggest that there is no “one-size-fits-all” approach when it
comes to measuring accessibility and equity. The analysis from Sacramento reveals
that car sharing programs would increase accessibility, especially for historically
disadvantaged communities due to the substantially high travel speeds of private
vehicles compared to conventional transit systems. However, long-term solutions would
include the following:
• Fundamentally altering the intensity of land use and realigning activities along
corridors that transit serves well.
• Expanding affordable housing opportunities for POCs and low-income household
in the highly accessible areas of the City.
1
1. Introduction
1.1 Accessibility
Accessibility is an important way to measure how effective the existing transportation
system is in connecting people to destinations. The greater the distance one can travel
away from or to a destination, the greater the accessibility. Someone who can travel a
much smaller distance than another in the same amount of time has lower mobility than
the other and, in turn, lower accessibility. Someone who can get to many jobs than
another in the same amount of time has higher accessibility than the other. Good
accessibility to employment, education, and community amenities such as grocery
stores, healthy food, healthcare, etc. is a measure of a community’s quality of life.
Accessibility and equity go hand in hand and can be a crucial tool in planning. Planners
can support their communities by measuring access to improve equity in the
community. Accessibility maps illustrate and can identify regions or neighborhoods with
varying degrees of access. Planners can then provide required assistance to specific
areas.
Accessibility cannot be measured finitely; Transport Justice, by Karl Martens, concludes
that a “sufficient level of accessibility” can only be determined by “a process of
democratic deliberation and selection” (Martens 2016, 143). So, how can accessibility

2
be measured and what is “sufficient accessibility”? According to Evaluating Accessibility
For Transport Planning, by Todd Litman, “Accessibility can be defined in terms of
potential (opportunities that could be reached) or in terms of activity (opportunities that
are reached). Even people who don’t currently use a particular form of access may
value having it available for possible future use, called option value” (Litman 2008, 6).
Options are extremely important because different modes of transportation have a
variability in the distances people can travel and the places that people can get to.
“Transportation options refer to the quantity and quality of transport modes and services
available in a particular situation” (Litman 2008, 10).
Walking or biking gives people the opportunity to dictate their route and where they are
going, however the quality of bicycle and pedestrian facilities may hinder the
connectivity of these network connections. Driving a personal vehicle gives the driver
the convenience and freedom to choose their route and destination. Owning a personal
vehicle has many extra costs associated with it than other modes of transportation.
These external costs include maintenance fees, car payments and insurance. The total
costs of owning a vehicle are astronomically higher than walking, biking, or transit
passes.
Todd Litman lays out how planning decisions are affected by how transportation is
evaluated. “If transportation is evaluated based on vehicle travel conditions (traffic
speeds, congestion delay, roadway Level-of-Service ratings), the only way to improve
transport system quality is to improve roadways. If transportation is evaluated based on

3
mobility (movement of people and goods), then rideshare and public transit service
improvements can also be considered. If transportation is evaluated based on
accessibility (people’s overall ability to reach desired goods, services, and activities),
additional transportation improvement options can be considered (besides roadway,
rideshare and public transit), including improved walking and cycling conditions, more
accessible land use patterns to reduce travel distances, and telecommunications and
delivery services that substitute for physical travel” (Litman 2008, 6-7).
1.2 Equity
‘“Social equity advocates for the equal distribution of resources, benefits, and services
among individuals or socially dis-advantaged group”’ (Townsend, Phillimore, & Beattie,
1988 as cited in Chen, Bouferguene, Shen, Al-Hussein 2019, 221). ‘“The goal of equity
is providing the equal distribution of resources, services, and benefits among individuals
and fair and appropriate distribution of them in society”’ (Chen, Bouferguene, Shen, &
Al-Hussein 2019 as cited in Tahmasbi, Mansourianfar, Haghshenas, Kim 2019, 1). “It is
important that the [equity] objectives and indicators, taken together, capture the multiple
dimensions of social equity, in terms of the various policy impacts that differentially
affect various groups, such as accessibility, safety, traffic noise, and transportation
expenditure and affordability” (Manaugh, Badami, El-Geneidy, 2015, 8). “Transportation
costs may include direct transportation user costs as well as environmental costs that
result from transportation related construction, maintenance, operations, and policy
changes. These environmental costs may include the direct emissions from automobile

4
use, traffic congestion, noise pollution, etc.” (Bills, Walker, 2017, 62). “In terms of
exposures to direct traffic pollution, populations that are white and have high income
have been found to be less exposed” (Stuart et al., 2009; Tian et al., 2013; Yu and
Stuart, 2013; Gurram et al 2015, as cited in Guo, Chen, Stuart, Li, Zhang, 2020, 9).
“Although socially-advantaged groups have generally been shown to enjoy greater
health benefits of transportation, locality and other factors can cause variations in this
overall trend” (Guo, Chen, Stuart, Li, Zhang, 2020, 9).
“An easy way for transportation planners to tackle equity issues is to focus on areas
with a high share of people who belong to low-income, low-education, and minority
groups” (Gaffron, 2012; Tian et al., 2013, as cited in Guo, Chen, Stuart, Li, Zhang,
2020, 9). “To improve equity of accessibility, it is essential for policy makers to provide
accessible, efficient, and affordable public transit for disadvantaged areas” (Guo, Chen,
Stuart, Li, Zhang 2020, 9). “Transportation benefits range from improvements in
accessibility, mobility, and economic vitality on the general scale, to reductions in travel
time and travel user costs” (Bills, Walker, 2017, 62). “The equity value of time is based
on an average income and is used for all travel time savings, independent of the income
level of the traveler that benefits from the time saving” (Martens 2017, 30). Incorporating
equity into transportation planning processes is just the beginning of addressing the
racist and discriminatory past that people of color (POC) have and continue to
experience.

5

6
2. Premise
2.1 Study Purpose
The purpose of this study is to assess how equitable accessibility is among various
socioeconomic groups in the Sacramento Metropolitan area of California. The following
paragraphs explain what prompted the choice of this topic.
I studied abroad in Prague during the fall of my junior year of college and in my time in
Europe, I traveled to 21 cities and 12 countries. I observed and experienced how these
cultures travel and move people and goods around. I used public transportation every
day while living in Prague and I loved the quality of life I had there because of their
mixture of land uses. I was amazed by how inexpensive and how easily accessible
public transportation was for everyone to use both in Prague and in countries I visited. I
traveled to a different city each weekend and was shocked at how easy it was to figure
out how to use their transportation network. I was also surprised by the availability of
public transportation modes.
In Prague, I had a three-month public transportation pass that I could use for buses,
trams, and the underground metro and it cost me less than one hundred dollars. The
range of options for public transportation modes made their transportation network very
expansive. The public transportation network was not confined to just the main corridors

7
of the city, it instead, reached the entire region surrounding Prague. I was able to take
public transportation to the airport about eleven miles away in about thirty to forty
minutes and it was not even the furthest depth of their public transportations network. I
never once wished I had a car to travel nor would a car have been a better option than
public transportation. When I traveled back home to America, I experienced a hard time
with culture shock due to America’s car culture.
When I finally arrived at the Sacramento International Airport, my family and my best
friend were waiting to reunite and take me home. I was so happy to greet them after my
long and exhausting twenty-four-hour journey across the world. We grabbed my
luggage and my parents said we were heading to the parking garage, where their car
was parked. I had grown accustomed to life in Prague and my way of moving around. I
was in autopilot expecting to walk out of the airport and get in line for the 109 bus that
would drop me off at the metro station. I was so disappointed when we walked across
the skywalk and into the airport’s parking garage to find our vehicle. It was the weirdest,
most unfamiliar feeling stepping into a car that was personally owned and driving away
from the airport without having to wait outside for the bus to pick me up. On that first car
ride home, all I could think about was how massive the freeway was, how spread out
everything was, and how many cars were on the road.
I drove for the first time since leaving for Europe two days after arriving home to
Rocklin, California, about twenty miles from the capitol, Sacramento. I was easily able to
adapt to driving again, but I had a hard time accepting the fact that driving my personal

8
vehicle was my only option for a mode of transportation. I quickly became frustrated
with my inability to get places. I found that in America, my options for transportation
were extremely minimal; I could walk, drive my car, or take public transit which in
Rocklin is the county bus. In Prague, the transportation modes that were available and
affordable to me were the bus, tram, underground metro, train, rideshare, bikeshare or
scooter-share, intercity bus, and airplane.
I decided then that I wanted to dive deep and learn more about how accessible and
equitable transportation is in America, but more specifically Sacramento. This led me to
become a research assistant for Fehr & Peers on an accessibility project. My role in the
project was to analyze the transportation network in the Sacramento region by mode
and find out how far a person can travel from a specified location in specific time
increments. I produced accessibility isochrone maps to illustrate the distance an
individual can travel in a specified time by walking, biking, driving, and by public transit
(city/county bus, light rail). I wanted to further continue my research on this topic, so
now it is my senior project. I chose to add the element of equity to accessibility and
analyze the results. My project aims to look at research and gather evidence on how to
successfully increase accessibility and equity in transportation in Sacramento. I used
GIS to spatially analyze data and compare those results with evidence from literature.

9
2.2 Study Methodology
This paper provides context on the history of inaccessible and inequitable transportation
in the United States and how that is applicable to inaccessibility outcomes in
Sacramento, California. ArcGIS Pro was used to spatially analyze the accessibility and
equity in the City of Sacramento by block groups. The U.S. Census American
Community Survey (ACS) 2018 5-year estimates were the table inputs to find: the
number of people who are not white by block group, percent of the population of block
groups that are Hispanic or Latino, and the percent of the population below the poverty
threshold (15%) in block groups. Open Street Map (OSM), National Data & Surveying
Services (NDS), General Transit Feed Specification (GTFS), Fehr & Peers Network
Analyst Tools and Scripts were all used to create the accessibility maps. The
accessibility analysis analyzed four modes of transportation – walk, bicycle, transit,
personal vehicle – by the distance each mode allowed an individual to travel, in 5-
minute increments.

10
3. Background
We must first understand how transportation planning has excluded populations in
American history, and then take a deeper look into Sacramento’s excluded populations.
City planning has a long history of discriminating POC, and low-income populations, so
the first step is to examine how transportation planning has limited accessibility.
The 1866 Civil Rights Act declared “housing discrimination was unconstitutional, [but] it
gave the government no powers to enforce it” (Rothstein, 2017, Preface). Section 1 of
the Thirteenth Amendment abolished slavery, “and Section 2 empowers Congress to
enforce Section 1” (Rothstein, 2017, Preface). So, housing discrimination based on race
have been unconstitutional since 1866, but policymakers still wrote racial exclusions
into federal, state, and local policies. In the mid twentieth century, policy enforced racial
segregation. Suburbanization immensely increased segregation in America. Racial
barriers blocked POC from moving to the suburbs.
3.1 Suburbanization 3.1.1 GI Bill and the New Deal
There was a major housing shortage in mid-twentieth century due to external costs of
World War II. The Great Depression and World War II dampened housing supply until
after the war when housing demand exploded and created a huge housing shortage.

11
Becky Nicolaides and Andrew Wiese state in their article, Suburbanization in the United
States after 1945 “experts estimated a shortage of 5 million homes nationwide…As late
as 1947, one-third were still living doubled up with relatives, friends, and strangers”
(Nicolaides, Wiese. 2017, 2). This led to federal funding “that revolutionized home
building and lending, subsidized home ownership, and built critical suburban
infrastructure such as the new Interstate highway system” (Hayden 2003, Hanchett
1996, Gutfreund 2005 as cited in Nicolaides, Weise, 2017, 2) that largely benefited
white people.
African Americans were excluded in federal policy even after the passing of the
Thirteenth Amendment and the Civil Rights Act of 1866. The Federal Housing
Administration (FHA) in the New Deal stated the exclusion of African Americans
explicitly in participating in growing equity in residential properties. Additionally, the G.I.
Bill gave loans to white veterans moving back to America which were low-cost, low-
interest, and aimed to go towards mortgages for single-family homes. Black veterans
returned to war and were not offered any federal assistance. “By 1960, African
Americans and other people of color had received just 2% of FHA-insured mortgages”
(Jackson, 2004 as cited in Nicolaides, Weise, 2017, 6). Jackson further explains
“Mechanisms of segregation included collusion by real estate brokers, homebuilders
and lenders, discriminatory federal housing guidelines, local neighborhood associations,
municipal land use controls, and the threat of violence” (Jackson, 2004 as cited in
Nicolaides, Weise, 2017,6). The FHA approved suburb projects on a racial basis, these

12
projects outlined the exclusion of African Americans, and was blatantly racist and
unconstitutional.
3.1.2 Redlining
“In 1933…the administration created the Homeowners’ Loan Corporation (HOLC)…The
HOLC created color coded maps of every metropolitan area in the nation with the safest
neighborhoods colored green and the riskiest colored red. A neighborhood earned of
red color if African Americans lived in it, even if it was a solid middle-class neighborhood
of single-family homes” (Rothstein 2017, 55). The red colored neighborhoods on the
maps became known as “redlined neighborhoods.”
“The extraordinary growth of California and the West in the decades following World
War II was financed on a racially restricted basis by the federal government” (Rothstein
2017, 65). Residential segregation fiscally impacted disparities in education, public
funding, public services and more. White neighborhoods were considered more affluent,
but the government provided them the resources to build their communities and equity.
3.1.3 Automobiles
American cities were dominated by the automobile and automobile companies pushed
policy makers to build more roadways. “Throughout most of the 20th century,
transportation planning goals were almost entirely mobility-based, with a focus on
congestion reduction and time savings for motorists, and safety” (Manaugh, Badami, El-

13
Geneidy 2015, 1). Karl Marten explains “the dominance of the motor car resulted in a
vast dispersal of urban functions over space, eliminating walking as a feasible
alternative for most trips as result motorized transport change rapidly from a luxury into
a necessity. Few people in industrialized societies are now able to manage their daily
lives without individualized or collective motorized transport” (Martens 2017, 55). The
reliance on car ownership data [in an accessibility analysis]… is problematic” (Martens
2017, 186) because of forced car ownership typical in suburban and rural areas and
persons with sufficient income to afford a vehicle but chose to live without a car.
In a public transport system of poor quality, “there may be a certain degree of forced car
ownership among low-income persons, especially in more suburban and rural areas
(Martens 2017, 186). Car ownership is ‘forced’ on a person or household has limited
capacity to afford the high costs of car ownership and use yet can hardly avoid these
costs because of a lack of alternative means of transportation in combination with the
spatial dispersion of out of home activities.” (Martens 2017, 186). “Also, there are
disparities in public investment among different socio-demographic populations”
(Kravetz and Noland, 2012 as cited in Guo, Chen, Stuart, Li, Zhang, 9).
3.1.4 Federal-Aid Highway Act
Nicolaides and Wiese further explain that residential suburbs were far away from the
city center and they lacked access to work, school, markets, etc. Housing and jobs were
further distances, leading to the Federal-Aid Highway Act (FAHA). Households in the
suburbs required a car to travel longer distances to their destinations. Major

14
infrastructure needed to be built to connect the suburbs to the city center. The FAHA
was “known for its role in connecting the country through the interstate highway
systems…[and was] conceptualized as a unifying, positive movement in U.S. economic
history. The new highway system facilitated economic growth, suburban expansion, as
well as improved domestic transportation of goods resulting in the expansion of several
industries including fast food, trucking, construction, and automobile production.
However, this fiscal expenditure expedited the deterioration of inner cities with large
African American populations. The economic despair in the African American
community is a rarely acknowledged outcome of the FAHA. The FAHA, one of the
largest fiscal policy decisions in the history of United States, serves as a nuanced way
of looking at race based economic principles and its contemporary implications” (King,
Finley 2015, 197). African American communities were purposely demolished for
highway infrastructure, continuing to segregate and displace communities. Highways
connected suburbs to the core urban area and jobs to cut down on commute time.
3.1.5 White Flight
“In the postwar period, black migrants settled disproportionately in central cities…If
whites have some distaste for living near blacks, black migration will be associated with
declining urban population and, in some cases, falling housing prices” (Boustan 2010,
421). White people emigrated from central cities into affluent, segregated suburbs.
Leah Platt Boustan explores black migrants impacts on city’s populations and housing
markets and causes of suburbanization. Her study showed “that cities that received

15
more black migrants from 1940 to 1970 lost a greater number of white residents”
(Boustan 2010, 438). “Black migration from the rural South to industrial cities in the
North and West coincided with the development of post war suburbs” (Boustan 2010,
437). Her “estimates suggest that the change in racial diversity associated with black
migration resulted in a 17% decline in urban population” (Boustan 2010, 438). In 1978-
79, Jan Blakeslee explained that “over the past two decades [1950s-1970s], the plight
of America's cities has become almost a commonplace of social comment, while city tax
bases are eroding and their job markets declining as companies seek cheaper, newer,
or more assessable facilities in the suburbs, their schools and services struggle against
the combined impact of inflation, unemployment, and shrinking federal assistance. The
cities are seen increasingly as deteriorating ghettos for the poor, the unemployed, and
the disadvantaged-above all, for minorities (Blakeslee 1978-79, 1). In 1973, 64% of the
metropolitan poor lived in the central cities” (US Census Bureau 2018 as cited in
Blakeslee 1978-79, 1).

16
4. Case Studies
4.1 Columbus, Ohio 4.1.1 Background
The case study of Columbus, Ohio focuses on addressing equity issues by “improving
job accessibility based on transport connectivity” (Wang, Chen 2015, 1). The
methodology of this case study includes a “GIS-based job accessibility by walking
transit and car and three transport based spatial autoregressive models [that] are used
to account for the spatial autocorrelation of job accessibility among neighboring block
groups while controlling for built environment and socioeconomic factors” (Wang, Chen
2015, 1). The goal of the case study was to identify spatial patterns and identify
accessibility and equity deficiencies to improve job accessibility and improve equity in
Columbus, Ohio.
17
Figure 4-1 Job Accessibility by Mode
Source: C.-H. Wang, N. Chen( (2015)

18
4.1.2 Key takeaways
• “The results also show that walking-accessed jobs are primarily related to
physical settings (e.g., land uses) at the local level” (Wang, Chen 2015).
• “Locations with a higher share of zero-vehicle housing units have better job
accessibility by transit” (Wang, Chen 2015, 1).
• “Locations with a higher share of single-parent households are at a disadvantage
in overall job accessibility. Due to its complex transportation needs, a society
friendly to single parents should spatially integrate accessible jobs with other
needed activities via land-use and transportation planning” (Wang, Chen 2015,
1).
• “Car-ownership programs and non-spatial social supports also might be effective
to help secure job opportunities and perform daily life activities” (Wang, Chen
2015, 1).
4.2 Case Study: Amsterdam,
Netherlands
4.2.1 Background
In this case study, Karl Marten explores the fairness of the transport land use system in
Feinstein’s The Just City ‘exemplary city’. The City region of Amsterdam was chosen as
the location of study because “it provides employment and services to a much larger
region and the City Region has held important responsibilities regarding the planning of

19
the transportation system in the entire area” (Martens 2017, 181). The case study
applies the “rules of transportation planning based on principles of justice” (Martens
2017, 150) to Amsterdam’s transportation systems.
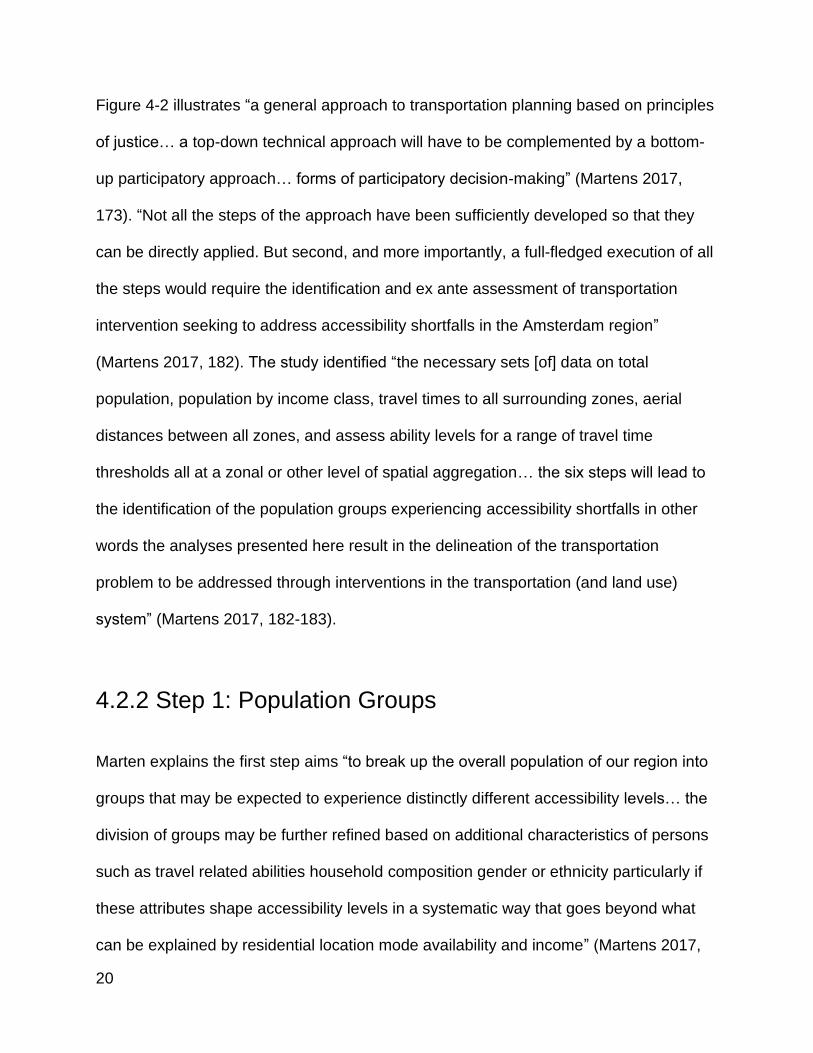
Figure 4-2 The Rules of Transportation Planning Based on Principles of Justice
Source: Martens, 2017
20
Figure 4-2 illustrates “a general approach to transportation planning based on principles
of justice… a top-down technical approach will have to be complemented by a bottom-
up participatory approach… forms of participatory decision-making” (Martens 2017,
173). “Not all the steps of the approach have been sufficiently developed so that they
can be directly applied. But second, and more importantly, a full-fledged execution of all
the steps would require the identification and ex ante assessment of transportation
intervention seeking to address accessibility shortfalls in the Amsterdam region”
(Martens 2017, 182). The study identified “the necessary sets [of] data on total
population, population by income class, travel times to all surrounding zones, aerial
distances between all zones, and assess ability levels for a range of travel time
thresholds all at a zonal or other level of spatial aggregation… the six steps will lead to
the identification of the population groups experiencing accessibility shortfalls in other
words the analyses presented here result in the delineation of the transportation
problem to be addressed through interventions in the transportation (and land use)
system” (Martens 2017, 182-183).
4.2.2 Step 1: Population Groups
Marten explains the first step aims “to break up the overall population of our region into
groups that may be expected to experience distinctly different accessibility levels… the
division of groups may be further refined based on additional characteristics of persons
such as travel related abilities household composition gender or ethnicity particularly if
these attributes shape accessibility levels in a systematic way that goes beyond what
can be explained by residential location mode availability and income” (Martens 2017,

21
183). It is important to note that “the division of groups… have to be based on data that
is typically collected for a range of administrative purposes such as taxation or through
population censuses and other surveys as well as restrictions… [on] data sources
because of privacy considerations” (Martens 2017, 184). Due to privacy restrictions, the
data in this study only accounts for “car-based and public transport-based accessibility”
(Martens 2017, 185). The lack of bicycle data is a limit of the study and it is important to
note that bicycling in the urban core of Amsterdam and bicycling combined with public
transit is a popular mode of transport. The groups distinguished in the case study are
“based on three characteristics: persons’ residential location, mode availability, and
income level” (Martens 2017, 185). Again, due to data limitations, mode availability only
refers to “persons with access to a car and persons with access to public transport
services. For reasons of simplicity, it is assumed that the accessibility levels
experienced by the former group (mode availability) is determined entirely by the road
system. The underlying reasoning here is that the car provides superior accessibility in
virtually all cases and that adding other transportation modes adds relatively little to the
accessibility levels experienced by persons with continuous access to cars” (Martens
2017, 185). Marten makes this assumption based on a “study comparing travel times by
car in public transport for the Netherlands” (Martens 2017, 185). This is a fair
assumption to conclude in Sacramento, California as well illustrated in Figure 5-9.
This study “also assume[s] that the accessibility levels experienced by most car-less
households depends mostly on the quality of the public transportation system” (Martens
2017,186). Walking or bicycling are the other most common modes of transportation in
22
Amsterdam and Sacramento, but distance and time are extremely limited for these
transport modes. It is fair to assume that if those modes were included in an
accessibility analysis, they would face little competition to cars or public transportation.
The study argues “that the level of income is a more appropriate indicator for a person’s
mode availability, since it strongly correlates with access to a car” (Martens 2017, 187).
Based on this, “it is expected that the low-income population groups will be more prone
to experience accessibility shortfalls than population groups who can benefit from car-
based accessibility” (Martens 2017, 188).
4.2.3 Step 2: Measuring Potential Mobility and
Accessibility
To determine population groups accessibility levels, “it is desirable to measure
accessibility to key destinations such as employment, shops, and health care services.
The measurement of accessibility should…be conducted at various spatial scales. For
instance, analyses could be conducted for travel time thresholds of 15, 30 or 45
minutes…Clearly…accessibility should be measured for different periods of the day and
week as it typically varies across time due to congestion and variations in service
provision” (Martens 2017, 189). Amsterdam’s “measurement of potential mobility and
accessibility has been based on travel demand model” but the case study is limited to
“only address accessibility to employment” (Martens 2017, 189). Twelve car-based
accessibility analyses and six public transport-based accessibility analysis” were
performed, resulting in a diagram illustrating accessibility thresholds for car and public
transit potential mobility.

23
Figure 4-3 Levels of Mobility and Accessibility by Population Groups
Source: Martens, 2017
“The diagram shows the vast disparities in potential mobility and accessibility in the
Amsterdam region, in spite of its relatively well-developed public transport system”
(Martens 2017, 191). The diagram further illustrates that the transport-land use system
delivers all groups assumed to be dependent on public transport have below-average
potential mobility and accessibility levels (Martens 2017, 192). Rather, the graph
“provides a powerful portrayal of the disparities between groups with and without access
to a car… suggesting that interventions in the transportation system should first and
foremost address the plight of population groups without access to a car” (Martens
2017, 192).

24
4.2.4 Step 3: Sufficiency Thresholds
Transport Justice strongly emphasizes that “sufficiency thresholds should ultimately be
the subject of democratic deliberation and selection” (Martens 2017, 194). The
Amsterdam case study uses the average level of car based potential mobility in peak
hours as the threshold for distinguishing groups entitled to improvements in the
transportation system from groups that can claim no such entitlement” (Martens 2017,
195). Transportation planning, whether based on principles of justice or not, focuses on
interventions in the transportation system; it is therefore of key importance to delineate
in which cases interventions in the transportation system are warranted and in which
case is not” (Martens 2017, 194-195).
4.2.5 Step 4: Population Groups Entitled to Accessibility
Improvements
Martens states plainly that “all population groups falling below the accessibility
sufficiency threshold and experiencing below average level of potential mobility belong
to the set of groups potentially entitled to interventions in the transportation system”
(Martens 2017, 195). This is very simply stated because accessibility is complex and
multifaceted, so further analysis must be performed. It is important to note “that
transportation planning based on principles of justice cannot be a simple cookbook
approach to identify and address transportation problems” (Martens 2017, 196). In step
four, Marten produces a graph depicting “share[s] of the population within accessibility
level below the respective sufficiency thresholds for accessibility to employment a 30-

25
minute travel time threshold accumulative opportunity measure and during peak hours”
(Martens 2017, 197).
Figure 4-4 Populations dependent on Public Transport and Car
Source: Martens, 2017
The graph in “Figure 9.3 [4-4 above] powerfully depicts the car provides a high level of
accessibility in the Amsterdam context even for persons living on the periphery... The
situation is clearly fundamentally different for persons relying on public transport as their
main mode to access places. A substantial share of this population experiences low
levels of accessibility throughout most of the day…[because] the accessibility levels
provided by the public transport system during off peak hours is at best comparable to
the levels during peak hours” (Martens 2017, 197). It can be assumed that the
accessibility levels for this share of population experiences even lower accessibility
levels at night and on weekends “when public transport services are reduced or not
available at all” (Martens 2017, 197).

26
4.2.6 Step 5: Assessing the Severity of Accessibility
Deficiency
So far, the steps have resulted in transit-dependent populations and populations with
access to a car during peak hours being prone to experience accessibility shortfalls
(Martens 2017, 197). For transit dependent population groups, “the spatial pattern of
accessibility deficiency changes fundamentally with a decrease in the sufficiency
threshold” (Martens 2017, 198). The only transit dependent population groups that have
a sufficient level of accessibility are groups residing directly in and around the city
center of Amsterdam” (Martens 2017, 198). “These population groups obviously benefit
from the high quality of the public transport system in the urban core as well as from the
proximity to jobs in both the city center” (Martens 2017, 198). Vis a vi, accessibility
deficiency remains a primarily (sub)urban phenomenon in the Amsterdam region”
(Martens 2017, 199).
“A relatively small number of population groups experience accessibility” shortfalls due
to car-based accessibility deficiency (Martens 2017, 201). “The spatial pattern of
accessibility deficiency for the groups benefiting from car-based accessibility is quite
distinct from the pattern observed for the transit dependent population groups. Figure 4-
5 and Figure 4-6 compare the accessibility deficiency spatial patterns of transit-
dependent population groups and population groups that benefits from car access.

27
Figure 4-5 Accessibility Deficiency Among Transit Dependent Population Groups

28
Source: Martens, 2017
Figure 4-6 Accessibility Deficiency Among Population Groups with Access to a Car
Source: Martens, 2017

29
These maps further illustrate the high levels of accessibility that population groups with
car access experience compared to the low accessibility that population groups that are
transit-dependent experience.
When accessibility deficiency is analyzed across the entire population, ignoring
population groups access to vehicle or not, the results show that for this case study “the
entire burden of accessibility deficiency is [still] carried by the population groups without
access to a car” (Martens 2017, 206).
4.2.7 Step 6: Prioritizing Population Groups
Each step so far in “transportation planning based on principles of justice…each
analysis generates a different pattern of access ability deficiency and suggest that a
different set of groups are experiencing the impacts of accessibility deficiency in the
region” (Martens 2017, 206). Different “way[s] of measuring accessibility will result in a
distinct pattern of contributions to overall accessibility deficiency… the moral
significance of the way in which population groups are distinguished and access ability
is measured becomes increasingly apparent the more the analysis proceeds towards
feeding the democratic decision-making process” (Martens 2017, 207-208).
The analysis of the Amsterdam case study “has been conducted of the average
contribution of each population group to total accessibility deficiency based on the data
at hand: population groups as defined by income levels; accessibility as measured at
the zonal level; the full range of accessibility measurements; and the entire set of

30
sufficiency thresholds. The results of this analysis are quite complex in nature. For each
sufficiency threshold a different ranking of population group emerges” (Martens 2017,
208). Marten then requires additional analyses “based on twelve different ways of
measuring car-based accessibility (including peak and off-peak measurement) and six
different ways of measuring transit-based accessibility (excluding off-peak
measurement). The average contribution to accessibility deficiency by population group
has been calculated by adding up the contribution by group to each type of accessibility
measurement, divided by the number of accessibility measurements” (Martens 2017,
206-207). This is in no means the definitive way to identify population groups to
prioritize, “but it does give a grasp of the extent to which a particular population group
may be affected by the accessibility deficiency in a region under various circumstances”
(Martens 2017, 207).
The results of the Amsterdam case study suggest “that more is needed to bring the
accessibility levels of population groups with and without access to a car above the
sufficiency threshold (however defined). This may well imply a further improvement of
the bus lane a higher priority for buses at intersections or a higher frequency of buses
throughout a larger part of the day” (Martens 2017, 209). These are different types of
transportation planning interventions that Martens has discussed previously.
“Improvements are also warranted to address the situation of persons with car access
as they to experience a substandard accessibility level, although the accessibility
shortfall is much less severe than for the transit dependent population” (Martens 2017,
209). The analysis is capable of identifying population groups to prioritize in each zonal

31
group, and even though the prioritized population groups in zonal groups will differ,
“interventions in the transportation system should be inclusive in nature, at least
potentially serving all population groups, i.e., groups with and without access to a car at
the same time” (Martens 2017, 209).
4.3 Key Takeaways
“The application of transportation planning based on principles of justice to the
Amsterdam region…has resulted in a preliminary identification of population groups
entitled to improvements in accessibility through interventions in the transportation
system” (Martens 2017, 213). The analysis above points out the specific limitations of
public transit as conventionally delivered. A new approach is needed where those
without vehicles ca access them at least temporarily when needed
The Amsterdam case study further emphasizes that not only is the technical analysis
involved and important, but again emphasizes the political discourse that must be
involved. Marten stresses the importance of “a transparent and well-structured
democratic deliberation and selection. Transportation planning cannot move forward
without being fed from the initial stages onward by a democratic process of decision
making” (Martens 2017, 212). This is referring to the top-down, bottom-up approach
mentioned previously in this study. Persons and their lived experiences must be at the
forefront of analyzing the fairness and accessibility deficiencies of a transportation
system. Political discourse and technical analyses must be looked at together to

32
complete the full picture to address accessibility deficiencies and fairness of a
transportation system.

33
5. Background to Study
Area 5.1 Transportation Network
5.1.1 Roadway Network
The City of Sacramento’s roadway network consists of U.S. Interstates, California State
highways, and city streets (arterial, collector, and local streets). Personal vehicle travel
dominates use of the roadway network. Figure 5-1 depicts the roadway hierarchy.
5.1.2 Bicycle Network
Figure 5-2 depicts the bicycle network. It consists of shared-use paths (Class I), bike
lanes (Class II), and shared roadways termed “sharrows” (Class III).
5.1.3 Transit Network
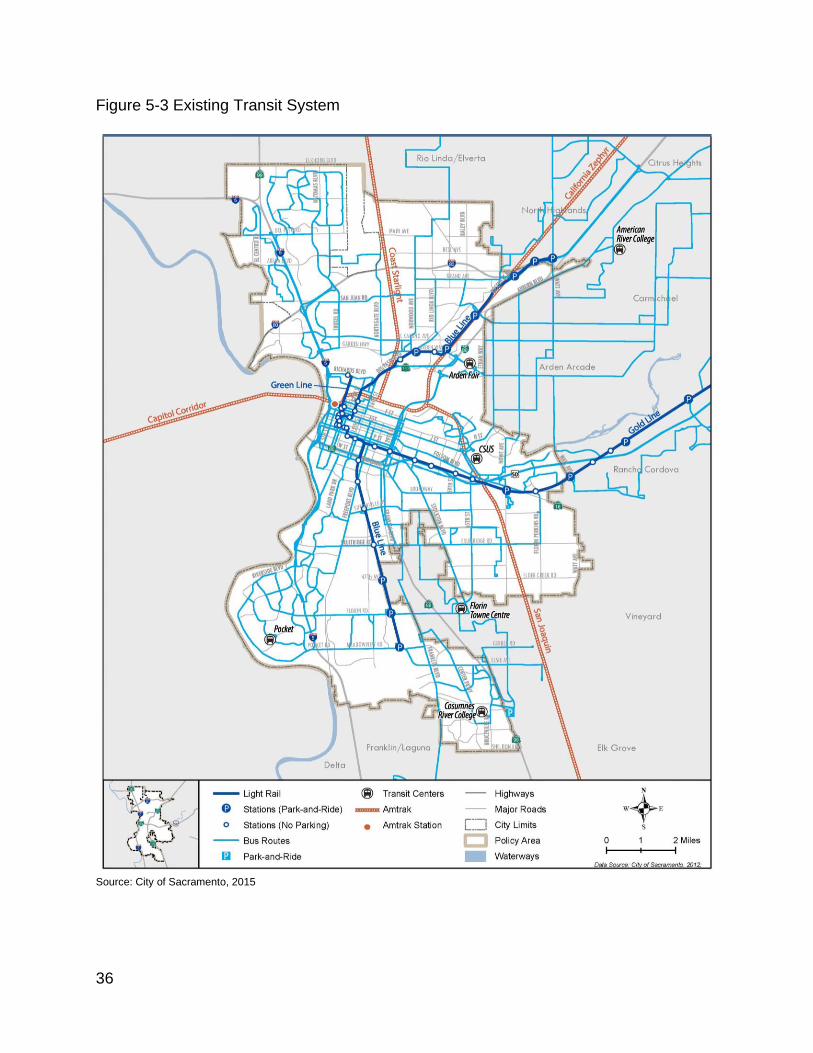
The City of Sacramento is served by local, regional, and interregional transit.
Sacramento Regional Transit (Sac RT) provides local bus and light rail services.
Greyhound, Megabus, and Amtrak provide regional and interregional services to the
City. In addition, Sac RT operates 18 Park-and-Ride lots that enable commuters to
access regional public transit by automobile (City of Sacramento, 2015). Figure 5-3
depicts the existing transit network.
34
Figure 5-1 Roadway Classification and Lanes
Source: City of Sacramento, 2015

35
Figure 5-2 Existing Bicycle Facilities
Source: City of Sacramento, 2015
36
Figure 5-3 Existing Transit System
Source: City of Sacramento, 2015

37
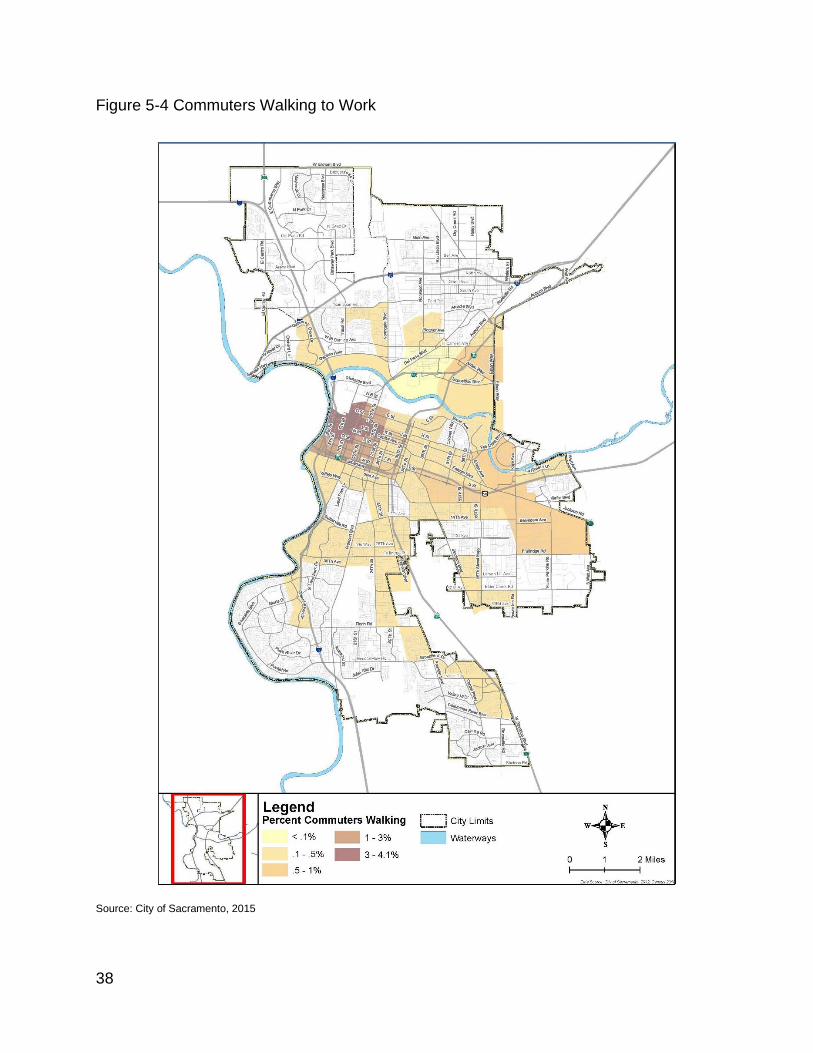
5.1.4 Pedestrian Activity The Sacramento General Plan explains that “pedestrian travel is of prime importance to
the City, and pedestrian facilities, such as enhanced crosswalks and pedestrian count-
down signals, new sidewalks, traffic calming measures, and streetscape enhancements
are continuously being implemented in the City” (City of Sacramento, 2015, 3-41).
Figure 5-4 depicts the intensity of pedestrian commuting in parts of the Metro area.
Clearly there is a concentration of pedestrian activity in the downtown core and areas
adjacent to the downtown.
38
Figure 5-4 Commuters Walking to Work
Source: City of Sacramento, 2015
39
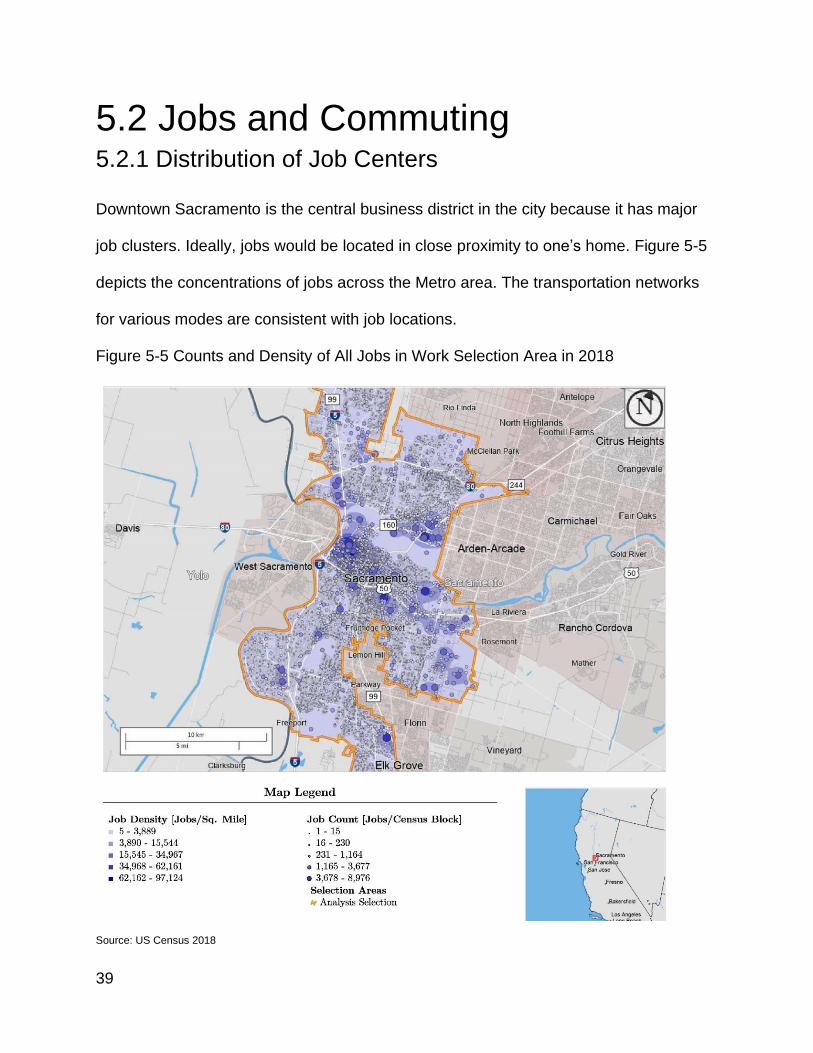
5.2 Jobs and Commuting 5.2.1 Distribution of Job Centers
Downtown Sacramento is the central business district in the city because it has major
job clusters. Ideally, jobs would be located in close proximity to one’s home. Figure 5-5
depicts the concentrations of jobs across the Metro area. The transportation networks
for various modes are consistent with job locations.
Figure 5-5 Counts and Density of All Jobs in Work Selection Area in 2018
Source: US Census 2018

40
5.2.2 Origins and Destinations of Workers Figure 5-6 depicts the inflow and outflow of workers. The figure demonstrates that
nearly twice as many people commute into Sacramento for work as those who commute
outside the City for work. This reflects the role of the City as the state capital. A modest
19% of workers live and work within the Metro area.
Figure 5-6 Inflow/Outflow Counts of All Jobs in Sacramento Region in 2018
Source: US Census 2018

41
5.2.3 Commute Time Table 5-1 states the time that it takes people to commute to work on average, by all
available modes of transportation. It takes about 35% of the working population over 30
minutes to travel to work. The mean travel time to work for the working population is
about 26 minutes.
Table 5-1 Travel Time to Work by Gender
Sacramento city, California
Total Male Female
Label Estimate Estimate Estimate
Workers 16 years and over who did not work from home 217,090 112,143 104,947
Less than 10 minutes 8.0% 7.8% 8.2%
10 to 14 minutes 13.8% 13.1% 14.6%
15 to 19 minutes 17.4% 17.6% 17.2%
20 to 24 minutes 18.3% 17.5% 19.2%
25 to 29 minutes 6.8% 6.6% 7.0%
30 to 34 minutes 16.9% 17.1% 16.8%
35 to 44 minutes 5.6% 5.3% 5.9%
45 to 59 minutes 5.9% 6.2% 5.5%
60 or more minutes 7.3% 8.9% 5.6%
Mean travel time to work (minutes) 26.2 27.5 24.9 Source: US Census 2019
Table 5-2 breaks down the travel time by auto drive-alone, carpool, and public
transportation. It is much faster to commute to work by driving alone or carpooling than
commuting by public transportation. It takes 60 or more minutes for 36.4% of people
commuting by public transportation to reach their destination compared to 6% by auto
and 10% by carpool. This helps explain why people choose to drive to work if they have
access to a car. Furthermore, for those dependent on public transportation, their
accessibility will be much lower than people with access to a private vehicle.

42
Table 5-2 Travel Time by Commute Mode
Sacramento city, California
Total Car, truck, or van --
drove alone
Car, truck, or van --
carpooled
Public transportation
(excluding taxicab)
Label Estimate Estimate Estimate Estimate
Less than 10 minutes 8.0% 7.2% 7.5% 0.7%
10 to 14 minutes 13.8% 14.0% 12.6% 1.6%
15 to 19 minutes 17.4% 18.0% 15.9% 5.5%
20 to 24 minutes 18.3% 19.4% 16.7% 8.6%
25 to 29 minutes 6.8% 7.0% 7.9% 4.3%
30 to 34 minutes 16.9% 17.3% 16.5% 22.3%
35 to 44 minutes 5.6% 5.6% 6.2% 9.2%
45 to 59 minutes 5.9% 5.6% 7.2% 11.5%
60 or more minutes 7.3% 5.9% 9.6% 36.4%
Mean travel time to work (minutes) 26.2 25.2 28.8 53.0 Source: US Census 2019
5.2.4 Commute Modes Like most other metropolitan areas in the US, the choice of transportation to work
heavily favors the automobile. As Table 5-3 shows, about 85% of commuters travel by
car as their means of transportation and three-quarters drive alone. This has
implications for equity if there are some members of the community who cannot afford
personal transportation.

43
Table 5-3 Means of Transportation to Work by Gender
Sacramento city, California
Total Male Female
Label Estimate Estimate Estimate
Workers 16 years and over 229,953 118,786 111,167
Car, truck, or van 84.9% 84.4% 85.3%
Drove alone 74.4% 74.5% 74.4%
Carpooled 10.4% 10.0% 10.9%
In 2-person carpool 7.8% 7.4% 8.2%
In 3-person carpool 1.6% 1.6% 1.5%
In 4-or-more person carpool 1.1% 1.0% 1.2%
Public transportation (excluding taxicab) 3.3% 3.3% 3.4%
Walked 2.8% 2.8% 2.8%
Bicycle 1.9% 2.2% 1.5%
Taxicab, motorcycle, or other means 1.5% 1.7% 1.4%
Worked from home 5.6% 5.6% 5.6%
5.3 Sacramento Case Study 5.3.1 Background
Housing and land use impacts transportation and transportation impacts housing and
land use. This case study looks at historical and contemporary race-based patterns of
residential segregation connected to unsustainable loans and the housing crisis. It
outlines Sacramento’s history of inaccessibility to destinations, jobs and opportunities
for low-income, minority groups and how they were segregated. It sets the stage for the
historical context of Sacramento’s housing and transportation market and motives for
current day analysis.

44
5.3.2 Key Takeaways:
The effects of discriminatory policies still shape Sacramento’s housing and
transportation network today. "Inequitable effects of the mortgage meltdown are
concentrated in non-white communities and also demonstrate how inequities remain
rooted in long-standing patterns of housing discrimination that shaped segregated
space. These historical practices of market intervention have served to reinforce a
social, economic and political segmentation that reaffirm spatial distance” (Hernandez
2012, 238). “New Deal finance policies institutionalized a social and spatial order in our
cities that produced a segregated urban core.” (Hernandez 2012, 238). Federal
regulatory policy makers “linked race to asset value [to] justify the use of race covenants
and mortgage red lining as an economic imperative- an imperative that steered capital
flows away from the nonwhite urban core under the guise of risk management”
(Hernandez 2012, 238-239).
5.4 Analysis of Study Area 5.4.1 Accessibility Study
This study measured accessibility in downtown Sacramento, California using a map-
based approach. The maps in this series measure the distance someone can travel
away from a specified location in a certain period of time, using different modes. The
process that created these maps also produces maps for the opposite direction and for
different times of day.

45
Maps were created using travel time isochrones by travel mode in ArcGIS Pro based on
Open Street Map (OSM), general transit feed specification (GTFS), and regional travel
demand model data from the Sacramento Area Council of Governments (SACOG). The
travel times are estimated based on average walking and bicycling speeds of 3 and 9
miles per hour, respectively. Transit speeds were obtained from the GTFS data and
vehicle speeds were obtained from the peak period traffic assignments from the
SACOG travel demand model. These isochrones are effective in quickly communicating
the results that are easy to understand by diverse audiences. To help demonstrate
modal differences, we produced small multiple maps of each mode’s travel time
isochrones showing the distance one can travel to/from the Sacramento Valley Station,
which is a key destination in downtown Sacramento for gaining access to the rest of the
region. The maps show the isochrones in five-minute increments (from five to twenty-
five minutes) and are complemented by the public transit isochrones during the morning
peak hour while recognizing that shifts occur by time of day depending on changes in
transit service throughout the day.
The specific modes studied in the model include bicycle, walking, public transit [with
wheelchair], and automobile. In this model, the Sacramento Valley Station is the
location that people are traveling away from or to, so the model can be used to
represent both a location-based and person-based perspective. The person-based
model measures the distance one can travel away from a location in a certain amount
of time, in this case the Sacramento Valley Station. The location-based model shows

46
the area from which people can access the desired destination within a certain amount
of time.
To demonstrate the importance of the person-based model type of accessibility
analysis and mapping is through recognition of substantial difference in travel time
isochrone sizes across modes. Individuals with access to a vehicle have a much greater
distance they can travel within the same amount of time than the other modes studied.
This difference is so great, it raises questions about how to create more equitable travel
outcomes for those who do not own private vehicles, especially in the lower income and
lower density neighborhoods that surround downtown Sacramento. Conventional
transportation planning approaches to improve access have focused on increasing
transit service. As the small multiple maps show, the transit isochrones cover an area
smaller than the bicycle isochrones. Frequent transit service is generally not feasible or
productive in low density areas. For the residents of these areas, accessibility would be
most improved by having access to higher speed vehicles when they need to make a
trip. This can be accomplished by developing and providing electric bike/scooter or car
share systems and supporting on-demand ride-hailing services. Absent the use of
multi-modal accessibility mapping, this type of recommendation might not be
considered. Figures 5-7 and 5-8 compare accessibility by mode from the Sacramento
Valley Station.

47
Figure 5-7 Accessibility from Sacramento Valley Station by Mode
Source: Fehr & Peers, Meredith Milam 2020

48
Figure 5-8 Accessibility to Sacramento Valley Station by Mode
Source: Fehr & Peers, Meredith Milam 2020

49
Figure 5-9 illustrates private vehicle accessibility in the Sacramento region. Individuals
with access to private vehicles have a widely different experience because they can
access jobs, other modes of transportation, and a much larger range of opportunities.
Figure 5-9 Vehicle Accessibility to and from Sac Valley Station
Source: Fehr & Peers, Meredith Milam 2020
5.4.2 Equity Analysis
Isochrone on small multiple maps compare the four modes of transportation
accessibility (walk, bike, transit, personal vehicle) with: percent of population by block
group that is not white, percent of population by block group that is Hispanic/Latino, and

50
percent of population by block group that is below the poverty threshold. Each analysis
uses the Sac Valley Station, as the node for downtown Sacramento which serves as the
central business district and major job center for the metropolitan area.
5.4.2.1 Hypothesis:
Traditionally, transportation planning solutions to improve quality of life and
opportunities for low-income and “persons-of-color” (POC) communities is to provide
them with transit service. The Sac Valley Station is the major mobility hub for the region
and has a range of mode options and distances one can travel. The demographic maps
show that the low income and POCs are distributed and concentrated in the outer
boundaries of the City. Figure 5-10 shows the areas with the highest concentration of
low income and non-white populations.
It is important to understand the populations that are commuting by various modes
because, as Table 5-4 illustrates, there are nuances between race and ethnicity and
commute mode. POCs are the highest percentage of public transportation users. White
and Asian populations have the highest percentage of commuters by private vehicle.
However, POCs are distributed in the outer areas where transit access is limited as
Figure 5-7 and Figure 5-8 show.

51
Table 5-4 Commute Mode by Race and Hispanic or Latino Origin
Sacramento city, California
Total Car, truck, or van --
drove alone
Car, truck, or van --
carpooled
Public transportation
(excluding taxicab)
Label Estimate Estimate Estimate Estimate
One race 94.1% 94.3% 92.3% 93.1% White 49.7% 49.7% 39.6% 45.9%
Black or African American 11.9% 11.3% 11.3% 24.1%
American Indian and Alaska Native 0.7% 0.7% 1.0% 0.6%
Asian 18.2% 18.5% 23.2% 14.4%
Native Hawaiian and Other Pacific Islander
1.8% 2.0% 1.3% 0.5%
Some other race 11.9% 12.1% 16.0% 7.7%
Two or more races 5.9% 5.7% 7.7% 6.9% Hispanic or Latino origin (of any race) 27.6% 28.2% 35.1% 19.9%
Non-Hispanic 72.4% 71.8% 64.9% 80.1%
White alone, not Hispanic or Latino 36.6% 36.1% 24.8% 36.9%
Source: US Census 2019
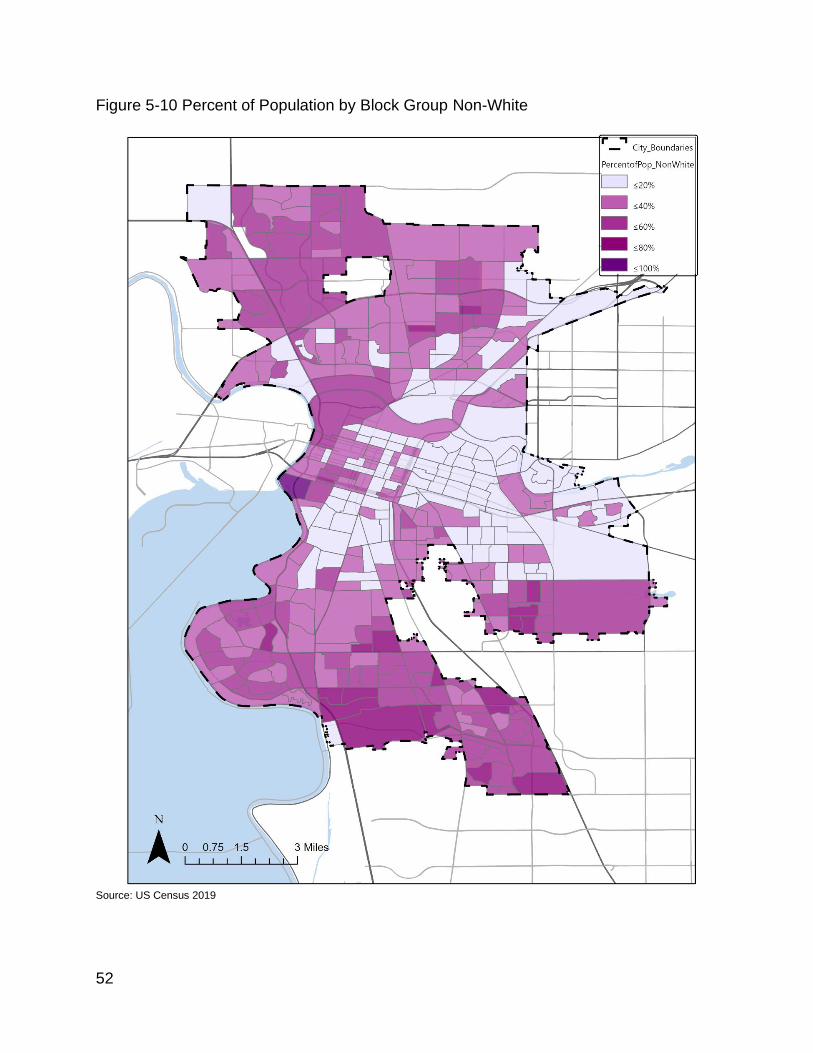
Figure 5-10 reveals that there are greater concentrations of White populations in
downtown Sacramento and in eastern Sacramento. Non-white populations are
concentrated on the outskirts near the City’s boundaries. This shows the spatial
disparities that POCs experience living further away from the main job centers.
52
Figure 5-10 Percent of Population by Block Group Non-White
Source: US Census 2019

53
Figure 5-11 displays areas where higher concentrations of the population are below the
poverty threshold ($15,000). It is essential to compare Figure 5-10 and Figure 5-11
because they show that where higher concentrations of POCs live have higher
percentages of the population that are below the poverty threshold. Households that are
below the poverty threshold most likely do not have access to a vehicle. It is expensive
to own a vehicle because it requires gasoline or electricity, maintenance, insurance, and
other fees. Higher income households have access to private vehicles, whether that
means they own one, or they have the money to obtain access to one.
Based on the maps and tables, POCs have lower access to private vehicles, which is
the essential mode in Sacramento given the low-density land use context. This means
that they have to rely on biking, walking, or transit. They cannot afford to live close to
downtown Sacramento (i.e., the job, economic, entertainment, healthcare, and
government center for the region). So, when analyzing their distribution compared to the
downtown activity center there is a clear disconnect between these communities and
this desirable destination for engaging in the economy and society. The maps in Figure
5-7 and 5-8 show that the footprint of these modes is very small because of the limited
speeds and quality of service for transit. They cannot access job/activity centers or the
transfer station if they do not own a vehicle. POCs and households under the poverty
threshold, therefore, have lower transportation accessibility, and a more inequitable
transportation system. Figure 5-12 shows how accessible public transit is by travel time
isochrones in the Sacramento Area during the morning peak hour. POCs generally live
in areas with long travel time access by public transit.

54
Figure 5-11 Percent of Population by Block Group that is Below the Poverty Threshold

55
Figure 5-12 Peak Travel Time Isochrones by Public Transit in the Sacramento Area
5.5 Considerations • The accessibility and equity maps show that the current provision of transit
service for low-income populations and POCs does not improve their access to
job centers or opportunities. Further, expanding conventional transit systems is
expensive and has not proven to be effective in improving accessibility in a land
use context like Sacramento’s.
• This is a case study, so community input was not included in the analysis.
o In practical application, community engagement should always be
included in the equity analysis. The community’s input can help shape the
alternative solutions to traditional transportation planning.

56
5.6 Potential Solutions: To improve accessibility within a land use context like Sacramento’s, people need
access to much higher travel speeds. This can be accomplished through the
introduction of sustainable yet appropriate means of sharing smaller vehicles for both
entire trips and connections to the areas transit system. These alternatives include the
following:
• Provide (electric) vehicle carshare and place carshare vehicles in neighborhoods
with higher concentrations of low-income populations and POCs.
• Increase the distribution of e-scooters and e-bikes, which can increase average
travel speeds of conventional bicycles from 9 or 10 mph to 15 mph.
• Educate community members about potential carpooling opportunities through
app-based solutions such as Waze Carpool.
Communication technologies are readily available to aid in the adoption of these novel
ideas. City officials would need to coordinate the adoption and operation of these
alternatives.
Other more long-term solutions could include the following:
• Fundamentally altering the intensity of land use and realigning them along
corridors that transit serves well.
• Expanding affordable housing opportunities for POCs and low-income household
in the highly accessible areas of the City.

57
6. Conclusion
A GIS spatial analysis of accessibility and equity combined with community input can
provide planners with a more complete picture of how the transportation system serves
different population groups and areas. By measuring accessibility by mode and
mapping it with travel time isochrones, planners can engage a community to assess
their expectations for making modifications to provide a fair and just transportation
system. Alternative solutions for access to transportation and approaching equity are
not a “one size fits all” model. To measure accessibility, all available transportation
modes should be analyzed at AM and PM peak periods on a weekday, at a minimum.
To assess equity, the accessibility mapping should be combined with key factors such
as income, race and ethnicity, transit dependency to understand the distributional
disparities in access that may exist. Distribution patterns of POCs and low-income
populations in Sacramento combined with current modal accessibility severely limits
their job and activity opportunities.
In Sacramento, getting people access to vehicles would make a substantial
improvement in equity for POCs and low-income populations. Making these vehicles
electric and shared can reduce the cost to access vehicles (i.e., only paying on a per
trip basis) and minimize the environmental impacts of their use. Additional alternatives
such as implementing e-bike/e-scooter share and informing people of carpooling
options could also increase accessibility at low costs with minimal environmental

58
impacts. While this conclusion was drawn specifically for Sacramento, it is transferable
to similar land use contexts in the U.S.

59
7. References Bills, T. S., & Walker, J. L. (2017). Looking beyond the mean for equity analysis: Examining
distributional impacts of transportation improvements. Transport Policy, 54, 61–69.
https://doi.org/10.1016/j.tranpol.2016.08.003
Blakeslee, J. (1978-79). “White Flight” To the Suburbs: A Demographic Approach. v3, 2.
Chandler, P. T., King, L. G. J., & Finley, S. Y. (2016). In Doing race in social studies: critical
perspectives. essay, Information Age Publishing.
Chen, Y., Bouferguene, A., Shen, Y., & Al-Hussein, M. (2019). Assessing accessibility-based
service effectiveness (ABSEV) and social equity for urban bus transit: A sustainability
perspective. Sustainable Cities and Society, 44, 499–510.
https://doi.org/10.1016/j.scs.2018.10.003
City of Sacramento, Sacramento 2035 general plan: adopted March 3, 2015 (n.d.).
Golub, A., & Martens, K. (2014). Using principles of justice to assess the modal equity of
regional transportation plans. Journal of Transport Geography, 41, 10–20.
https://doi.org/10.1016/j.jtrangeo.2014.07.014
Guo, Y., Chen, Z., Stuart, A., Li, X., & Zhang, Y. (2020). A systematic overview of
transportation equity in terms of accessibility, traffic emissions, and safety outcomes: From
conventional to emerging technologies. Transportation Research Interdisciplinary
Perspectives, 4. https://doi.org/10.1016/j.trip.2020.100091
Hernandez, J. C. (2012). Race, market constraints and the housing crisis: critical links to
segregation and mortgage redlining in Sacramento (dissertation). University of California,
Davis, Davis, CA.
Jackson, K. T. (2012). Crabgrass frontier: the suburbanization of the united states. OXFORD
University Press.
Lewis, E. O. C., MacKenzie, D., & Kaminsky, J. (2021). Exploring equity: How equity norms
have been applied implicitly and explicitly in transportation research and practice.
Transportation Research Interdisciplinary Perspectives, 9, 100332.
https://doi.org/10.1016/j.trip.2021.100332
Litman, T. A. (2021, April 22). Evaluating Accessibility for Transport Planning. Victoria;
Victoria Transport Policy Institute.
Manaugh, K., Badami, M. G., & El-Geneidy, A. M. (2015). Integrating social equity into urban
transportation planning: A critical evaluation of equity objectives and measures in

60
transportation plans in North America. Transport Policy, 37, 167–176.
https://doi.org/10.1016/j.tranpol.2014.09.013
Martens, K. (2017). Transport justice designing fair transportation systems. Routledge, Taylor &
Francis Group.
Nicolaides, B., & Wiese, A. (2017). Suburbanization in the United States after 1945. Oxford
Research Encyclopedia of American History.
https://doi.org/10.1093/acrefore/9780199329175.013.64
Rothstein, R. (2018). The color of law: a forgotten history of how our government segregated
America. Liveright Publishing Corporation, a division of W.W. Norton & Company.
Tahmasbi, B., Mansourianfar, M. H., Haghshenas, H., & Kim, I. (2019). Multimodal
accessibility-based equity assessment of urban public facilities distribution. Sustainable
Cities and Society, 49, 101633. https://doi.org/10.1016/j.scs.2019.101633
Wang, C.-H., & Chen, N. (2015). A GIS-based spatial statistical approach to modeling job
accessibility by transportation mode: case study of Columbus, Ohio. Journal of Transport
Geography, 45, 1–11. https://doi.org/10.1016/j.jtrangeo.2015.03.015
Wiese, A. (2005). Places of their own: African American suburbanization in the twentieth
century. University of Chicago Press.