
Equitable sharing of benefits arising from coal mining and ...
204
Supported by Planning Commission, Government of India Final Report Equitable sharing of benefits arising from coal mining and power generation among resource rich states
Transcript of Equitable sharing of benefits arising from coal mining and ...
Supported by
Planning Commission, Government of India
Final Report
Equitable sharing of benefits
arising from coal mining and
power generation among
resource rich states
Equitable sharing of benefits arising from coal mining and power generation among resource rich states
ii
© The Energy and Resources Institute 2013
Suggested format for citation
T E R I 2013
Equitable sharing of benefits arising from coal mining and power generation among
resource rich states
New Delhi: The Energy and Resources Institute. 204pp.
[Project Report No. 2012IA06]
For more information
Veena Aggarwal
T E R I Tel. 2468 2100 or 2468 2111
Darbari Seth Block E-mail [email protected]
IHC Complex, Lodhi Road Fax 2468 2144 or 2468 2145
New Delhi – 110 003 Web www.teriin.org
India India +91 • Delhi (0)11
Equitable sharing of benefits arising from coal mining and power generation among resource rich states
iii
Team members
Team leader
Ligia Noronha
Project coordinator
Veena Aggarwal
Project team
Souvik Bhattacharjya
Trishita Ray Barman
Tarun Gopalakrishnan
Arpita Khanna
Harsha Meenawat
Aastha Mehta
Nidhi Srivastava
Project advisors
Leena Srivastava, K Ramanathan and Prabir Sengupta
Secretarial assistance
Soy Joseph

Disclaimer
The views expressed in this report are that of The Energy Research Institute (TERI) and not of Planning Commission. This report is intellectual property of the Planning Commission and the same or any part thereof may not be used in any manner whatsoever, without express permission of Planning Commission in writing .
Equitable sharing of benefits arising from coal mining and power generation among resource rich states
v
Acknowledgements
We are grateful to the Planning Commission of India for giving TERI the opportunity to
examine a very complex but extremely relevant issue for the Indian economy and society.
We are extremely grateful to the stakeholders who gave their inputs and shared their
perspectives with regard to this issue and we have tried to represent these to the best of our
ability in the report. We are particularly thankful to the various departments in the states of
Odisha and Jharkhand with whom we interacted, who provided us with data and assisted
us in our work. We would like to acknowledge the incomparable support of Mr. P K Jena,
Secretary, Department of Energy, Odisha and Mr. V K Gaur, Special Secretary, Department
of Energy, Jharkhand who not only provided us with their perspectives but also coordinated
our interactions with other relevant departments in these states.
The Chairman and representatives from CIL, Chairman and officials of CMPDIL and
representative of the Association of Power Producers provided their valuable inputs and
perspectives for this study. We would like to gratefully acknowledge the feedback and
suggestions received from Mr. Ashok Sreenivas and Mr. Shripad Dharmadhikary of Prayas
Energy Group, Pune and Dr. Ajay Mathur, DG of BEE.
We are grateful to Dr. R K Pachauri for his overall guidance and support. The study greatly
benefited from inputs and suggestions from various colleagues at TERI and we
acknowledge the support of Dr. Prodipto Ghosh, Mr. R K Batra, Mr. Shri Prakash, Mr. S K
Chand, Dr. S K Dube, Mr. Shahid Hasan, Mr. Gurudeo Sinha, Mr. Anshuman, Dr. Suresh
Jain, Ms. Richa Mahtta, Ms. Anju Goel, Mr. Ramit Malhotra, Dr. Prasun Gangopadhyay, Mr.
Sumit Sharma, Mr. Jonathan Syiemlieh, Mr. R K Joshi and Mr. John Andruse. We are also
thankful for research assistance provided by Ms. Denise Fernandes.

Equitable sharing of benefits arising from coal mining and power generation among resource rich states
vii
Table of Contents
EXECUTIVE SUMMARY ........................................................................................................................ 15
Background and rationale .......................................................................................................... 15
Purpose of this study .................................................................................................................. 15
Approach and methodology ...................................................................................................... 16
Coal bearing states....................................................................................................................... 16
Assessments and analyses .......................................................................................................... 17
Study recommendations ............................................................................................................. 26
1. INTRODUCTION ............................................................................................................................ 33
Background .................................................................................................................................. 33
Objectives of this study ............................................................................................................... 36
Terms of reference ....................................................................................................................... 36
Approach and methodology ...................................................................................................... 36
A. The problem ...................................................................................................................... 36
B. Research questions ........................................................................................................... 37
C. Methodology ..................................................................................................................... 37
2. COAL RICH STATES ....................................................................................................................... 43
Socio-economic profile ................................................................................................................ 43
Minerals and coal ........................................................................................................................ 44
Power scenario in the study states ............................................................................................ 49
Installed and planned capacity expansion in the XII plan in resource rich states ....... 51
3. ASSESSMENT OF NEGATIVE EXTERNALITIES FROM COAL MINING AND COAL BASED POWER
GENERATION ................................................................................................................................. 53
Coal mining externalities ............................................................................................................ 53
Environmental externalities................................................................................................. 53
Social externalities ................................................................................................................. 66
Summary of externalities from coal mining in study states ........................................... 70
Externalities of coal transportation ........................................................................................... 72
Estimation of coal spillage and resultant fugitive emissions .......................................... 72
Externalities of coal based power generation .......................................................................... 73
Air pollution .......................................................................................................................... 73
Fly ash generation ................................................................................................................. 74
Health impacts ....................................................................................................................... 75
Stress on natural resources .................................................................................................. 76
Displacement of people ........................................................................................................ 78
4. AGENCIES, ADMINISTRATIVE EXPENSES AND REGULATORY FAILURES IN COAL MINING ... 81
Institutions involved in coal governance ................................................................................. 81
Approvals and agencies ....................................................................................................... 81
Administrative expenses towards environment protection .................................................. 87
Equitable sharing of benefits arising from coal mining and power generation among resource rich states
viii
Regulatory framework ................................................................................................................ 92
Environmental protection .................................................................................................... 93
Land acquisition .................................................................................................................... 93
Policy instruments for addressing externalities ............................................................... 94
Resettlement and rehabilitation policies ............................................................................ 95
Regulatory deficits and failures ................................................................................................. 96
Pre mining stage .................................................................................................................. 100
Measures to compensate for forest land diverted .......................................................... 101
Performance with regard to compensation for land, resettlement and rehabilitation ......................................................................................................................................... 102
Mining stage ........................................................................................................................ 105
Mine closure stage .............................................................................................................. 106
5. ESTIMATION OF COSTS OF EXTERNALITIES DUE TO COAL MINING AND COAL BASED POWER
GENERATION ............................................................................................................................... 109
Externalities across the life cycle of coal mining and TPP ............................................ 110
Key externalities covered in the cost assessment ........................................................... 111
Estimation of external costs of coal based power plants based on life cycle effects .. 114
External cost estimates available in economic literature ............................................... 116
Limitations ........................................................................................................................... 117
6. DEMAND FOR FREE POWER IN COAL RICH STATES AND ITS TARIFF IMPLICATIONS ........... 119
Existing benefits/preferential treatment to host states from central plants and IPPs: ......................................................................................................................................... 119
Emerging scenario in study states: power at variable cost/right of refusal and imposition of cess ......................................................................................................... 123
Impact of free/concessional power ................................................................................... 125
Impact on tariffs of agreeing to demands of states ........................................................ 126
7. LEGAL AND REGULATORY FRAMEWORK FOR COMPENSATION TO RESOURCE BEARING
STATES ......................................................................................................................................... 131
Constitutional scheme............................................................................................................... 131
Ownership ............................................................................................................................ 131
Legislative competence for regulation ............................................................................. 131
Fiscal competence ............................................................................................................... 132
Central legislation, subordinate legislation and policies for various payments .............. 134
Coal mining .......................................................................................................................... 134
Electricity .............................................................................................................................. 134
Environmental externality ................................................................................................. 135
Social externality ................................................................................................................. 135
State legislation, subordinate legislation and policies for various payments ................... 140
Electricity .............................................................................................................................. 140
Mining activities .................................................................................................................. 143
Equitable sharing of benefits arising from coal mining and power generation among resource rich states
ix
Environmental externality ................................................................................................. 145
Social externality ................................................................................................................. 146
8. CONCLUSIONS AND RECOMMENDATIONS .............................................................................. 151
Key observations ....................................................................................................................... 151
Recommendations............................................................................................................... 156
9. BIBLIOGRAPHY ........................................................................................................................... 167
10. ANNEXURES ................................................................................................................................ 177
Annexure A - Detailed report of the consultations at the state level ................................. 177
Odisha ................................................................................................................................... 177
Jharkhand ............................................................................................................................. 187
Annexure B – Assessment of environmental administrative costs .................................... 192
Annexure C - Analysis of water quality ................................................................................. 196
Annexure D - Estimates of emissions from coal based power plants ................................ 202
List of Tables
Table 1 Total external damage cost (using compensation to PAF based on EMP data) .......... 21
Table 2 Profile of the four selected states ........................................................................................ 43
Table 3 Key socio-economic indicators ........................................................................................... 43
Table 4 Coal mines, reserves, production in Odisha, Chhattisgarh, Jharkhand, and Madhya
Pradesh ....................................................................................................................................... 44
Table 5 Mode wise breakup (MW) .................................................................................................. 49
Table 6 Electricity shortage 2012-13 (%) .......................................................................................... 49
Table 7 Forest land diversion due to coal mining in four states between 2005 and 2011 ........ 54
Table 8 Forest land lost to coal mining and assessments of CAMPA payments ...................... 56
Table 9 Ambient air quality monitoring at different mines in Talcher coal mining area ........ 57
Table 10 Ambient air quality monitoring at different mines in Ib valley coal mining area .... 57
Table 11 District wise emissions from coal mining in Odisha ..................................................... 59
Table 12 Details of the land use/land cover changes in Singrauli during 1993-2010................ 62
Table 13 Number of abandoned coal mines in Jharkhand (as on 01.04.2012) ........................... 63
Table 14 Rehabilitation of mining land/reclamation of abandoned mines in India (2003-2004,
2005-2006, 2007-2008 and 2008-2009) ...................................................................................... 63
Table 15 Health impact in Talcher – 2004-05 .................................................................................. 67
Table 16 Social impacts of coal mining activities ........................................................................... 67
Table 17 State wise and project wise displacement ....................................................................... 68
Equitable sharing of benefits arising from coal mining and power generation among resource rich states
x
Table 18 Extent of environmental externalities due to coal mining in Odisha, Jharkhand,
Chhattisgarh and Madhya Pradesh ........................................................................................ 70
Table 19 Estimation of coal spillage and resultant fugitive emissions from in a year from the
movement of coal (2011-2012) ................................................................................................. 73
Table 20 State wise fly ash generation for the year 2010-2011 ..................................................... 75
Table 21 Resource requirement for planned IPPs in Odisha ....................................................... 77
Table 22 Estimated displacement in Chhattisgarh ........................................................................ 78
Table 23 Estimated displacement in Odisha .................................................................................. 79
Table 24 Approvals and agencies. ................................................................................................... 82
Table 25 Administrative institutions, procedures and costs ........................................................ 83
Table 26 Various establishment costs incurred for administrative processes for coal mining
by the different departments ................................................................................................... 89
Table 27 Estimates of administrative costs incurred on addressing coal mining (estimated
over 2007/8 – 2010/11) ............................................................................................................... 91
Table 28 Addressing externalities – roles and agencies ................................................................ 98
Table 29 Externalities linked to stages of life cycle and corresponding data availability...... 110
Table 30 Consolidated stages of the life cycle, the external costs and the approach .............. 111
Table 31 External costs due to coal mining (Rs/tonne) (compensated and non-compensated)
.................................................................................................................................................... 114
Table 32 External costs due to power generation from coal (Rs/kWh) .................................... 115
Table 33 Total external damage cost (using compensation to PAF based on EMP data) ...... 116
Table 34 Selected studies of external cost of coal-fired electricity using different approaches
.................................................................................................................................................... 117
Table 35 Details of NTPC plants .................................................................................................... 120
Table 36 Allocation of power to the ‘Home’ States from the NTPC projects .......................... 120
Table 37 Details of UMPPs and beneficiary States ...................................................................... 121
Table 38 Financial parameters ........................................................................................................ 127
Table 39 NPV of the revenue stream available to the state government ................................. 128
Table 40 Roles of various institutions within the administrative machinery for supporting
coal mining ............................................................................................................................... 181
Table 41 Various costs incurred for administrative processes for coal mining by the different
departments ............................................................................................................................. 182
Table 42 Departments/organizations visited in Odisha ............................................................. 186
Table 43 Description of responsibilities of select institutions .................................................... 189
Table 44 Departments/organizations visited in Jharkhand........................................................ 191
Equitable sharing of benefits arising from coal mining and power generation among resource rich states
xi
Table 45 Expenditure of environmental administrative machinery for coal mining -
Chattisgarh ............................................................................................................................... 193
Table 46 Expenditure of environmental administrative machinery for coal mining-
Jharkhand ................................................................................................................................. 193
Table 47 Expenditure of environmental administrative machinery for coal mining- Madhya
Pradesh ..................................................................................................................................... 194
Table 48 Expenditure of environmental administrative machinery for coal mining- Odisha
.................................................................................................................................................... 195
Table 49 Analysis of coal mine discharge water in Chirmiri, Bhatgaon, & Korba areas
(Chattisgarh) ............................................................................................................................ 196
Table 50 Analysis report of ground water in Chirmiri and Bhatgaon area- SECL
(Chattisgarh) ............................................................................................................................ 197
Table 51 Analysis of drain water in Chirmiri, Bhatgaon, and Korba areas (Chattisgarh) ..... 197
Table 52 Analysis of river water in Chirmiri, Bhatgaon, and Korba areas (Chattisgarh) ...... 197
Table 53 Analysis of coal mine discharge water in Pathakheda, Pench & Kanahn area of
Madhya Pradesh ...................................................................................................................... 198
Table 54 Analysis of coal mine discharge water in Sohagpur area of Madhya Pradesh ....... 199
Table 55 Analysis of ground water in Sohagpur area of SECL (Madhya Pradesh) ................ 199
Table 56 Analysis of drain water in Pathakheda, Pench, Kanahn, & Sohagpur area (Madhya
Pradesh) .................................................................................................................................... 200
Table 57 Analysis report of river water in Pathakheda, Pench, & Kanahn area (Madhya
Pradesh) .................................................................................................................................... 200
Table 58 Waste water (Mine drainage water) quality from different mines in Talcher area
(Odisha) .................................................................................................................................... 201
Table 59 Waste water (Mine drainage water) quality from different mines in Ib Valley area
(Odisha) .................................................................................................................................... 201
Table 60 Emissions from coal based generation (Scenario 1: Emission factors based on
Sharma, 2008 ............................................................................................................................ 202
Table 61 Emissions from coal based generation (Scenario 2: Emission factors based on CPCB,
1994 ............................................................................................................................................ 202
Equitable sharing of benefits arising from coal mining and power generation among resource rich states
xii
List of Figures
Figure 1 Framework for compensation of externalities from coal development ...................... 34
Figure 2 Life cycles of coal mining and coal based power production ...................................... 39
Figure 3 Major coal rich regions in Odisha .................................................................................... 45
Figure 4 Major coal rich regions in Chhattisgarh .......................................................................... 46
Figure 5 Major coal rich regions in Jharkhand ............................................................................... 47
Figure 6 Major coal rich regions in Madhya Pradesh ................................................................... 48
Figure 7 a: Installed coal based generation capacity (in MW) in the States as % of all India
coal based capacity; Figure 7 b: State-wise production of non-coking coal as % of all
India production ........................................................................................................................ 50
Figure 8 Status of existing coal based generation capacity (MW) in the states ......................... 51
Figure 9 Planned coal based thermal generation capacity during 12th Plan Period ................. 51
Figure 10 Coal mining externalities ................................................................................................. 53
Figure 11 Proposed private power projects (MoUs signed with Odisha state government) .. 77
Figure 12 Market based instruments for environmental protection, adapted from (Bradley
1998) ............................................................................................................................................ 92
Figure 13 Life cycle from coal mining to power generation ...................................................... 110
List of Boxes
Box 1 Impact of free/variable cost power on levelised tariff ........................................................ 25
Box 2 Benefits of coal washing ......................................................................................................... 65
Box 3 Summary of key polluted areas............................................................................................. 66
Box 4 Technical & fuel related parameters ................................................................................... 126
Box 5 The Right to Fair Compensation and Transparency in Land Acquisition, Rehabilitation
and Resettlement Act (LARR), 2013 ..................................................................................... 140
Box 6 Cess as an instrument to address externalities.................................................................. 160
Box 7 Two part cess on coal mining and on coal based power generation ............................. 160
Equitable sharing of benefits arising from coal mining and power generation among resource rich states
xiii
Acronyms
AEQM Area wide Environmental Quality Management
AMD Acid Mine Drainage
BCCL Bharat Coking Coal Limited
CAGR Compounded Annual Growth Rate
CAMPA Compensatory Afforestation Fund Management and Planning Authority
CCL Central Coalfields Limited
CEA Central Electrical Authority
CEPI Comprehensive Environmental Pollution Index
CERC Central Electricity Regulatory Commission
CIL Coal India Limited
CMPDI Central Mine Planning and Design Institute Ltd
COD Chemical Oxygen Demand
CPCB Central Pollution Control Board
CPSU Central Public Sector Utilities
CSE Centre for Science and Environment
DVC Damodar Valley Corporation
ECL Eastern Coalfields Limited
EMP Environment Management Plan
FCA Forest Conservation Act
FIMI Federation of Indian Mineral Industries
GIS Geographic Information System
IDCO Infrastructure Development Corporation
IPP Independent Power Project
JRDA Jharia Rehabilitation and Development Authority
LAD Local Area Development
LARR Land Acquisition and Relief Rehabilitation
MCR Mineral Concession Rules
MMDRA Mines and Mineral Development and Regulation Act
MoC Ministry of Coal
MoEF Ministry of Environment and Forest
MoU Memorandum of Understanding
Equitable sharing of benefits arising from coal mining and power generation among resource rich states
xiv
NRRP National Resettlement and Rehabilitation Policy
NTPC National Thermal Power Corporation
PAF Project Affected Families
PAP Project Affected People/Population
PM Particulate Matter
R&R Resettlement and Rehabilitation
RoE Return on Equity
RSPM Respirable Suspended Particulate Matter
SECL South Eastern Coalfield limited
SPM Suspended Particulate Matter
TPP Thermal Power Plant
UMPPs Ultra Mega Power Projects
WACC Weighted Average Cost of Capital
WTP Willingness to Pay
Equitable sharing of benefits arising from coal mining and power generation among resource rich states
15
Executive summary
Background and rationale
Coal is key to the energy security of the country and provides employment, income and
revenues to coal rich states. Coal bearing states have repeatedly aired their concerns about
the negative externalities they face in connection with coal mining and coal based power
generation. The dissatisfaction with existing payments for impacts has led states to make
demands for a greater compensation for the externalities they suffer in mining coal that is
used in the production of power that benefits other states. Towards this end, coal bearing
states have suggested various options to compensate for externalities including certain
percentage of free power and a cess on power generated in host state and sold to other
states.
The immediate rationale for this project emerges from these demands by coal bearing states,
made at a meeting held on August 8, 2012, convened by the Planning Commission to discuss
issues relating to a policy initiative for equitable sharing of benefits arising from coal mining
and power generation activities among states.
Purpose of this study
This 6 months study examines the various issues involved in these demands of coal rich
states and proposes recommendations for equitable sharing of benefits between resource rich host states and power consuming states. The specific study objectives are:
1. To arrive at a realistic assessment of the negative impact of coal mining on land
acquisition, land re-use, rehabilitation & resettlement, environmental and ecological degradation, physical infrastructure in the resource rich host state. This assessment is
based on established norms from previous research studies for some of these aspects.
2. To assess the expenditure on administrative machinery of the host state to process the approvals and address the negative impacts of coal mining as stated in point (1).
3. To study the impact of agreeing to the states proposal for either certain percentage of
free power from the coal based power plant located in host state similar to the benefits given for hydro power plant or supply of certain percentage of electricity at
variable cost.
4. To study the impact of agreeing to the states demand for first right of refusal for supply of certain percentage of electricity from such plants.
5. To examine the provisions in the present legal and regulatory framework for
imposition of tax or duties for the electricity generated in host state primarily for export to consuming states and recommend suitable amendments, if such provisions
are not there
6. To examine the provisions in the present legal and regulatory framework to impose tax or duties on mining activities beside royalty by the Central Government for
mitigation measures to address the environmental degradation in the resource rich
states.
Equitable sharing of benefits arising from coal mining and power generation among resource rich states
16
7. To study mechanisms for sharing of such taxes and duties between Central
Government, resources rich states and consuming states
Approach and methodology
Broadly, there are two sectors involved in this study – coal and electricity. The demand of
coal-bearing states is that part of the revenues accruing from electricity consumed in other
states should rightfully be theirs, since it is generated using their coal and imposes costs on
their natural and human resources. Posed this way, the central issue is not about sharing of
revenues from electricity consumed, but about being compensated for the impacts caused by
coal production. The essential policy question here is this – how are coal-bearing states and
their people compensated for the negative externalities they bear from coal mining and for
those that arise from the production of electricity?
This study examined the environmental and social externalities and costs of coal mining and
coal based thermal power generation using a life cycle approach in four major coal
producing states – Odisha, Jharkhand, Chhattisgarh and Madhya Pradesh. This assessment
is based on secondary literature, TERI’s earlier work on the subject, field visits, and the data
made available by states during the course of the field work (through EMPs, etc.) and
stakeholder consultations in the concerned states. Drawing from previous studies on
estimation of monetary costs of various externalities, this study identifies those costs which
are left unaddressed by power and coal companies.
Through a regulatory and institutional analysis, it examined the approvals and agencies for
coal mining and the various expenses that the state incurs to support coal mining, as well as
the regulatory framework to address impacts. Through a legal analysis, it examined the
possibilities available to address the inequities faced by coal rich states. An analysis is
undertaken of the impacts on tariffs and state government revenues of the various demands
made by the states for concessional/free power produced in their states.
Coal bearing states
The study states are Chhattisgarh, Jharkhand, Odisha and Madhya Pradesh. They account
for about 21% of the total geographical area and 14% of the total population of India and
around 31% of its forest cover. The states are rich in minerals, especially coal, which forms
an important constituent of the economic activities in the study states with a substantial
population of the state residing in coal mining districts. NTPC has substantial power
generation capacity housed in the identified states and a number of UMPPs are coming up
in these states.
Royalty payments are an important fiscal handle. Since 2006, the payments from royalty
have been increasing at a CAGR of about 10-12% for most of the states with the increased
mineral production rates. With a move to ad valorem rates since 2012, the fiscal position of
the coal states should improve considerably. Though these states are resource rich, they lag
behind the country on several key human development indicators. In 2009-10, 36 -48% of the
population of these states was below the poverty line. They also do poorly in water and
sanitation and in energy access. While a number of power plants are coming up in these
Executive summary
17
states, a large part of population in Odisha and Jharkhand still have no access to the
electricity, are below the poverty line and lack basic amenities.
Assessments and analyses
Assessment of impacts and costs of coal mining and coal based power generation in this
study followed a life cycle approach. This was done with a view to capture the different
externalities that result at different stages of coal mining, coal transportation and power
generation. Each of these stages is associated with some social, cultural, and environmental
impacts.
Environment related
Forests and biodiversity
Forest loss is high.as 60% of the coal resources are located in the forest areas (MoC 2005).
Out of the coal leases acquired by Coal India Limited (CIL) about 28% lie under forests
(Greenpeace 2012). Forest land diversion for coal mining in the four states studied –
Chhattisgarh, Jharkhand, Odisha and Madhya Pradesh - between 2005-2011 was about 7752
ha (Indiastats). The study found that while CAMPA funds are being collected for
compensatory afforestation and to restore some of the lost ecosystem services, the utilization
of these funds has been poor and the achievement of the objectives is questionable.
Air quality
Air pollution in the coal mining region is high. The Ministry of Environment and Forest) in
2010 declared the following coal mining districts of the country as critically polluted areas:
Korba, Angul, Talcher, Hazaribagh-Chatra, Singrauli, Chandrapur, Raigarh and Jharsuguda.
Discussions with respective state pollution control board brought out concerns regarding
deteriorating air quality in the mining region in Jharkhand and increase in SPM and fugitive
emissions in mining regions in Odisha. TERI estimated both fugitive emissions from coal
transportation in the four study states and the emissions of air pollutants for coal mining in
districts of Odisha.
Water quality
Coal mining activities have adversely affected water in the region but there was not enough
data or credible data to make a strong comment. Studies suggest that mining has degraded
the quality of water by not only lowering the pH of the surrounding water resources but
also by increasing the level of suspended particulate solids, total dissolved solids and some
heavy metals. Further, the overburden generated also contaminates the surrounding water
bodies and increases the heavy metal concentration especially of Fe, Cu, Mn and Ni which
reduces the utility of water for domestic purposes. In the data provided by CPCB 2011 for
selected mines, most of the parameters are found within limits, but the cumulative effect is
not known. These results also were at variance with what stakeholders reported in terms of
water quality.
Land quality
Land degradation is a serious concern in the mining regions. The high overburden (OB) ratio
in coal means that a high amount of OB waste is generated for every tonne of coal
Equitable sharing of benefits arising from coal mining and power generation among resource rich states
18
produced, for which land is required for dumping. In addition, large tracts of land
previously under mining are currently lying abandoned. India does not have a detailed
inventory of abandoned mines. The CAG (2011-12) reports a backlog in backfilling and
technical reclamation of 12,643 hectares of land in seven subsidiaries of CIL as on March 31,
2010.
Coal washing
Coal washing is found to be a major problem for host states although it has major benefits
otherwise both on efficiency and environmental grounds. Large amount of rejects are
generated during washing. These rejects pose serious environmental hazards as proper
disposal ground for these rejects do not exist in coalfields. They are generally dumped on
the ground and hence lead to degradation of fertile land. These rejects are also susceptible to
spontaneous combustion leading to CO, CO2, and particulate emissions.
Fly ash generated
Fly ash is one of the residues generated during the combustion of coal in thermal power
plants. It leads to the problem of air, water and soil pollution, land degradation, disrupt
ecological cycles and set off environmental hazards. Fly ash also poses radiation and arsenic
concerns, which have not been sufficiently investigated in India. The disposal of fly-ash
requires large quantities of land, water, and energy, and its fine particles, if not managed
well, can become airborne. Currently, 131 million tonnes of fly-ash are generated every year
(CEA 2011). Less than half of this is used in brick-making, cement making, land filling,
embankment etc. Ash ponds are significant contributors towards the ambient concentration
of Particulate Matter (PM) to the neighbouring regions.
Social externalities
Displacement
Displacement is a very serious issue both for coal mining and thermal power plants
(TPPs).Between 1950 and 2000, according to conservative estimates, the coal mining sector is
reported to have displaced between two and two and a half million people. As per the MoC
(2005), a minimum of 1, 70, 000 families involving over 8, 50, 000 people are likely to be
affected by future coal projects. Discussions with different experts and state officials
highlighted the fact that managing displacement is one of the biggest challenges in the case
of coal mining. The displaced people not only lose their natural livelihood options and
safety nets, but they also suffer from significant health diseases due to air and water
pollution. TERI attempted its own estimation of persons displaced in setting up of power
projects. This rough estimate indicates that there are significant differences in the actual
number of people displaced vis-à-vis numbers estimated by the project proponent.
Health impacts
Health impacts seem to be high and rising. During stakeholder consultations in Odisha and
Jharkhand, adverse health impacts on the people living in the vicinity of mines were pointed
out as a serious cause of concern. Studies do agree that there are many adverse health
impacts of mining. However, there is insufficient empirical evidence of the number of
people who have worked in coal mines and are affected by coal dust, and even less of those
impacted who live in the neighbourhood or in transportation corridors.
Executive summary
19
Thermal power plants are associated with adverse health impacts including pre-mature
deaths from lung cancer, respiratory illnesses, and heart diseases. The increased emissions of
particulate matter and other pollutants have led to increased health problems. A study by
Cropper et al (2012) estimated pre-mature deaths per tonne of particulate matter, SO2 and
NOx for 89 thermal power plants in India for the year 2008. Their estimates suggest that SO2
causes an average of 500 deaths per plant, NOx roughly 120 and PM2.5 around 30.
Stress on natural resources
Besides coal, TPPs require heavy utilization of resources, primarily water and land. TPPs
require a huge amount of water for coal washing, cooling and ash disposal. Various
estimates are available for use of water in thermal power stations. Wise, 2013 estimates that
upto 60-100 litres of water are needed per unit of electricity produced. The consumptive use
of water on coal based TPP is about 3.92 million cubic metres per 100 MW per year. (Prayas,
2011). CEA, 2012 recognises that difficulties are already being faced in siting thermal power
plants due to non-availability of water, particularly in coal bearing states like Odisha,
Jharkhand and Chhattisgarh.
Current compensation regime in India
A compensation payments regime exists, but it is not clear how adequately and fairly issues
are addressed. It does not address socio-cultural impacts sufficiently and does not create a
gain/benefit for those who have contributed in terms of land and lost livelihoods to the coal
project; it does not recognize the loss of opportunity by those who have lost land in
benefiting from enhanced land values as a result of coal development. (TERI 2007)
As per our understanding, following are the externalities that are either only partially
compensated or not compensated at all:
Loss of prime forests, species diversity and vital ecosystem services that are permanently lost and may not be restored to original state after afforestation -
Partially compensated
Cumulative impacts of water pollution of major rivers and streams even though individual mine operators may be compliant to existing standards - Not
compensated
Degradation of water streams due to waste water from coal washeries - Not compensated
Degraded water let into streams meant for agricultural use resulting in loss in
productivity - Not compensated
Cumulative impacts of air pollution from coal mining and power generation that
result in health impacts - Not compensated
Loss of agricultural productivity due to dust settlement in areas adjoining coal mines; emissions and dust settlement during transportation of coal - Not
compensated
Inadequate compensation for land, inadequate compensation for loss of homestead, conflict between existent and re-settled communities, loss of social ties if re-settled
separately, new settlements often lack facilities promised especially education and
Equitable sharing of benefits arising from coal mining and power generation among resource rich states
20
healthcare, single women denied benefits because of lack of proof, hardships faced
by project affected people who are not displaced - Partially compensated
Loss of income from land, loss of income from services used by displaced
community, disruption of shifting agriculture practiced by tribal populations, lack of
vocational training relevant to new market opportunities, one job per family ignores women’s contribution to income generation - Partially compensated
Loss of income from selling forest produce, loss of culturally significant assets, loss of
pastures/forests for cattle - Not compensated
Land degradation resulting in barren lands and waste dumps with increased risk of
contamination if not managed properly, opportunity costs of land under abandoned
mines for which the state governments do not get any revenues and cannot put to other uses - Not compensated
Damage due to collapse of ash dykes –partially compensated
Regulatory deficits and impacts
We would argue that a number of the negative externalities around coal mining would not
have occurred if there were proper rule enforcement and monitoring of activities and
impacts on the lives of local people. For the externalities that have been described in the
sections above, each has been addressed completely or at least in parts in our legal
framework. The scope of our environmental regulatory framework covers all major
externalities of forest diversion, air and water pollution, land degradation, management of
extractive activities and right of people to forest use. And yet the institutions tasked to
enforce these rules, such as the Pollution Control Boards and the Revenue Departments are
plagued with lack of staff, lack of technical capacity or finances, and politicisation. There are
also provisions for addressing social externalities that are created due to coal mining in
particular, but TERI findings show that these are not complemented with statutes making
them ineffective in addressing these externalities.
While our regulatory framework lays out the roles and responsibility of government
through various legal provisions, the fact that externalities have been created in the process
of coal mining, which have not been addressed or compensated adequately, directs our
attention to the existence of regulatory failures in the governance of this sector. The state
governments themselves identified several regulatory failures, but suggest that these have
been difficult to address in the last four decades of state led coal mining activities.
Estimates of externality costs of coal mining
Using a life cycle approach, the study sought to arrive at external costs of coal mining and
power generation. These are not exhaustive and are estimates based on limited data
obtained from the states and based on other studies. The study makes a distinction between
those costs that are compensated and uncompensated. The compensated costs are the costs
of mitigation that need to be borne by coal and power generation (as estimated from EMPs
available) and the uncompensated are the those that are the persons affected, the local or
state administration or are left unattended.
Estimates of externalities are divided into two stages:
1. Coal mine development to coal washing;
Executive summary
21
2. Coal transportation to coal combustion in power generation.
This separation is done to highlight impacts arising from coal mining per se and those due to
coal based power generation (minus the coal mining)
1. Total external costs of coal mining from coal mine development to coal washing
The total external cost of coal mining (including coal washing) is estimated to be Rs
246/tonne under the assumption that PAF receive the maximum compensation as estimated
from the data of EMPs of select coalmines in Talcher coalfields (refer section on ‘Estimation
of Social Costs’). Out of this total external cost arising from coal mining, an amount of is Rs
126.49/ tonne is compensated, while the non-compensated component is Rs 119/tonne. This
amount does not include health costs of coal mining as we were unable to obtain the
relevant data to estimate these costs.
2. Total external cost of power generation from coal transportation to coal combustion
The total external cost of power generation from coal transportation to coal mining is
estimated to be Rs 0.90/kWh. Out of this, the compensated external costs amounts to Rs
0.15/kWh, while the remaining Rs 0.75/kWh is not compensated. This does not include
carbon emission cost and cost of rehabilitation.
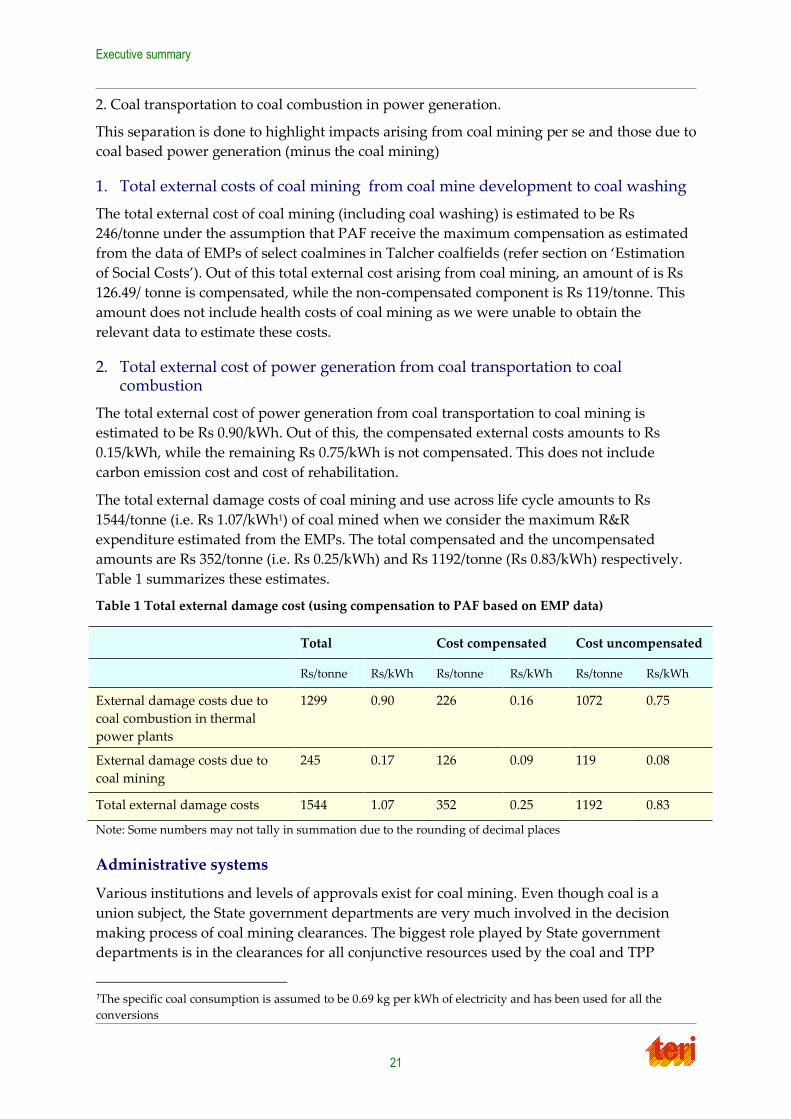
The total external damage costs of coal mining and use across life cycle amounts to Rs
1544/tonne (i.e. Rs 1.07/kWh1) of coal mined when we consider the maximum R&R
expenditure estimated from the EMPs. The total compensated and the uncompensated
amounts are Rs 352/tonne (i.e. Rs 0.25/kWh) and Rs 1192/tonne (Rs 0.83/kWh) respectively.
Table 1 summarizes these estimates.
Table 1 Total external damage cost (using compensation to PAF based on EMP data)
Note: Some numbers may not tally in summation due to the rounding of decimal places
Administrative systems
Various institutions and levels of approvals exist for coal mining. Even though coal is a
union subject, the State government departments are very much involved in the decision
making process of coal mining clearances. The biggest role played by State government
departments is in the clearances for all conjunctive resources used by the coal and TPP
1The specific coal consumption is assumed to be 0.69 kg per kWh of electricity and has been used for all the
conversions
Total Cost compensated Cost uncompensated
Rs/tonne Rs/kWh Rs/tonne Rs/kWh Rs/tonne Rs/kWh
External damage costs due to
coal combustion in thermal
power plants
1299 0.90 226 0.16 1072 0.75
External damage costs due to
coal mining
245 0.17 126 0.09 119 0.08
Total external damage costs 1544 1.07 352 0.25 1192 0.83

Equitable sharing of benefits arising from coal mining and power generation among resource rich states
22
sector. The administrative and clearance procedures have an important role in the complete
life cycle of coal mining and the goods and services that are produced thereof.
The payments made by proponents towards these procedures are mainly processing fees in
the form of application fees, permit fees, consent fees or renewal fees. Beyond these
processing fees, there are deposits to ensure that the proponent will undertake his/her
environmental and social responsibilities after the prospecting or mining activity is
completed; there are payments for the use of resources such as water cess and for
development of relevant infrastructure (common corridors) in the form of development
charges. These establishment contingency charges are meant to cover the costs incurred
during the process such as land acquisition from private owners. Beyond these charges, all
costs incurred by the state government departments are met by their budget allocations
under plan and non-plan heads for their functions. The expenditures reported by the
departments are not demarcated based on the sector it is spent on but on the function that is
performed.
The charges for administrative processes are separate from compensation that is made to the
state for the resource that is extracted and the payments made towards compensatory
activities for reducing externalities that are created as a result of the mining activity.
The administrative costs of approvals and oversight of coal mining are difficult to estimate.
From our limited exercise, it amounts to Rs. 1/tonne of coal mined. Coal mining involves
considerable expense on security. Providing security is shared between CIL, CISF and the
state police. Discussions with Coal India suggest the security cost for the company alone are
around Rs 40 per tonne.
Legal framework
Under the Constitution of India, the Centre has jurisdiction over regulation of mines and
mineral development. At the same time States are also empowered to legislate on regulation
and development of mines and mineral development, but subject to the powers of the
Centre. With respect to major minerals, states have little powers except possession, receiving
royalty and few other payments for major minerals. A mining lease is granted by the state
but in doing so the state is governed by the conditions and procedure as laid down by the
Mines and Mineral Development and Regulation Act (MMDRA) and Mineral Concession
Rules (MCR) 1960. States’ rights are even more limited in terms of coal, where the Ministry
of Coal (MoC) allocates coal blocks and the States assess mining lease applications based on
the criteria established by and approvals granted by the Ministry of Coal, Government of
India. States have the power to levy a tax on mineral rights but exercise of this power has to
be in conformity with the MMDRA.
Since electricity is a concurrent subject under the Constitution of India, both the Centre and
the States have the jurisdiction to legislate on electricity. Along with the general concurrent
powers on electricity, States have the explicit power to levy a tax on sale or consumption of
electricity. However, they do not have the competence to impose any tax on generation of
electricity, as generation amounting to production falls under the purview of the Centre. The
two most important provisions vis-à-vis export of electricity to other consuming states are
Article 286 and entry 92A of List I. The former prohibits States from levying taxes on
purchase or sale of goods outside their territory and the latter declares taxation on inter-state
Executive summary
23
sale of goods as a subject matter for the Union. Thus, States are only allowed to tax
consumption or sale of electricity which is completed within the boundaries of the State.
States have introduced several payments for electricity, coal mining and externalities from
time to time. In case of coal or minerals, levies have often been struck down by the courts as
infringing upon MMDRA. In case of electricity, legislation and subordinate legislation of
several States have provided for electricity duty, cesses, and concessional power. There are
also instances of state level levies for addressing environmental externalities.
Resettlement and rehabilitation policies
Several states, such as Andhra Pradesh, Odisha, Jharkhand, have their own policies to
address social externalities such as resettlement and rehabilitation. Some policies
incorporate provisions for including project affected people in the project benefit stream.
Coal India Limited has revised its R&R Policy in 2012 to ‘cultivate and maintain’ good
relationship with project affected people. The CIL and NTPC R & R policies also overlap
significantly with those of the Centre and the States. It is a common complaint by CIL and its
subsidiaries that the differing policies across states slow it down greatly in its purposes.
R & R policies do not capture the various dimensions of the value of land. They treat land
simply as transactable property, which is a fallacy. Firstly, land serves as a source of
livelihood and the centre of the social existence of the family. Second, the location of land in
relation to non-privately-owned common property resources such as forests, pastures and
water sources imbues it with value. Third, the re-location of a large number of land-owners
affects a significant number of land-less individuals, especially those who provide services
to the populations displaced. The amount of compensation legally due to a land-owner
under eminent domain legislation, therefore, simply addresses the beginning of the loss
caused by the involuntary acquisition of land.
Limited as the R&R policies are, following them would be the minimum expected of a land
acquiring entity. Yet, the benefits supposedly guaranteed by these policies often never
materialize. The move to make R & R policies part of the law is a welcome move. However,
the new Land Acquisition and Relief Rehabilitation (LARR) Act suffers from the same
inadequacies as its policy predecessors. It assumes that the best way to further public
interest is in the assertion of ‘eminent domain’. It is positive, however, in that the issue of
resettlement and rehabilitation are finally being addressed through legislative proposals
rather than simply policies. It is still to be seen to what extent would the new R&R
provisions as laid out under the LARR Act apply to coal bearing land.
Demands of states for free/preferential power
Coal bearing states are burdened by a number of coal externalities which are increasing on
account of power generation plants being set up in the states. From the field discussions, it
emerged that Odisha would like the Centre to have a policy framework for preferential
power so as to give the state legal right to enforce even the existing provision. While Odisha
links the demand for free power to that given to host states in case of hydro power, the
percentage of free power demanded is greater at 25% as in the state’s opinion externalities
from coal are continuous rather than one time impacts as in the case of hydro power.
Equitable sharing of benefits arising from coal mining and power generation among resource rich states
24
Jharkhand wants to be compensated not only for power produced in their state but also for
the coal that is transported outside the state. Coal being transported to other states, and the
associated washing, leads to severe environmental stress in the host state. Therefore, states
want to levy a charge on coal being transported to other states.
Coal bearing states have already negotiated preferential treatment in case of some of the
large power projects of NTPC and the UMPPs. In case of NTPC, while earlier plants
provided about 20-25% share to host states, under a new agreement of 2011, host states will
be getting a larger share of 50%. Similarly the existing/proposed UMPPs provide
significantly greater share to the host state as compared to other states. For the new
proposed UMPPs, Odisha is demanding an even greater share of 50% power. However in
these above cases, the tariff (both variable and fixed) as determined by CERC or through
competitive bidding, as the case may be, will apply. This provision ensures that the host
state will have right to access certain amount of power on a preferential basis but do not
provide any tariff rebates.
In case of Independent Power Projects (IPPs), states like Odisha, Jharkhand, and Madhya
Pradesh are demanding 10-12% power at variable cost and a cess on power exported to
other states. In addition, some states like Jharkhand are demanding right to refusal for part
of the power production by IPPs. Some states have built this provision of concessional
power into their energy or investment policy. Most states, have posed these conditionalities
in the MoUs they have signed with power developers in which the state has assured
assistance to developers in land acquisition, provision of water, maintenance of law and
order and facilitating coal linkage in return for concessional power. As these IPPs come on
stream, the states are also demanding their share and so far the provisions have not been
contested. The demand of states from the centre is for free power and Odisha has specifically
demanded 25% free power from coal based stations and 33% free power from washery
rejects coal based thermal stations. In addition, states demand a cess on power exported to
other states or a tax on power generated. Many of the coal bearing states are indeed
considering free power as a source of additional revenue for the state exchequer.
Free power: Legal perspective
In TERI’s view, at present, the state’s demand for free power from thermal power stations
has no statutory basis. These are provisions that have found their way in the policy
documents of states. In some states, free power or power at variable cost is one of the
conditions in the Memorandum of Understanding (MoU) signed with the power developers.
Thus, it is being introduced as not a statutory obligation or a fiscal measure, but a
contractual arrangement between the parties’ involved – State government and the power
developer. As long as the States seek power at variable cost or free of cost from all the power
plants, it is justifiable. However, any policy that mandates free power from only those plants
that are selling/exporting power to other states can be challenged in the court of law as
imposing restrictions on freedom of trade, commerce or intercourse among states.
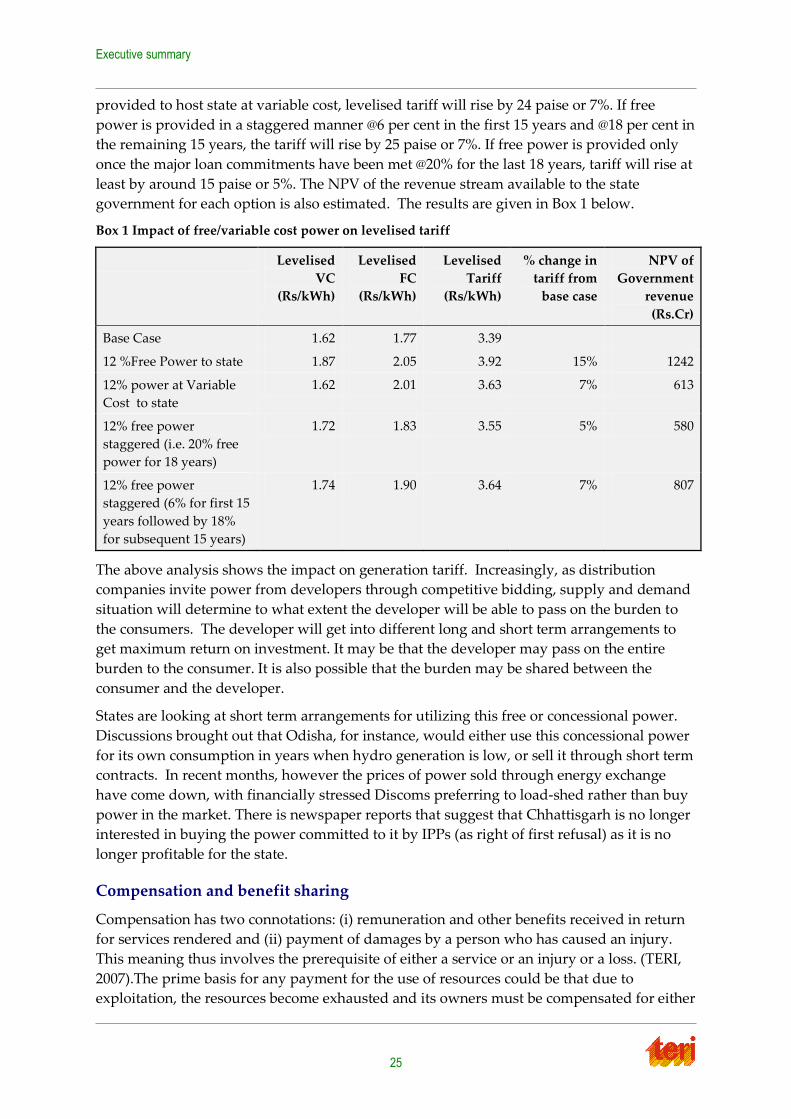
Impact on tariffs of demands for free/concessional power
The study examined the impact on tariffs of free/concessional power given by developers to
the host states. An analysis carried out for a 500 MW coal based power station shows that
12% free power will raise the levelised base tariff of Rs 3.39 by 52 paise or 15%. If power is
Executive summary
25
provided to host state at variable cost, levelised tariff will rise by 24 paise or 7%. If free
power is provided in a staggered manner @6 per cent in the first 15 years and @18 per cent in
the remaining 15 years, the tariff will rise by 25 paise or 7%. If free power is provided only
once the major loan commitments have been met @20% for the last 18 years, tariff will rise at
least by around 15 paise or 5%. The NPV of the revenue stream available to the state
government for each option is also estimated. The results are given in Box 1 below.
Box 1 Impact of free/variable cost power on levelised tariff
Levelised
VC
(Rs/kWh)
Levelised
FC
(Rs/kWh)
Levelised
Tariff
(Rs/kWh)
% change in
tariff from
base case
NPV of
Government
revenue
(Rs.Cr)
Base Case 1.62 1.77 3.39
12 %Free Power to state 1.87 2.05 3.92 15% 1242
12% power at Variable
Cost to state
1.62 2.01 3.63 7% 613
12% free power
staggered (i.e. 20% free
power for 18 years)
1.72 1.83 3.55 5% 580
12% free power
staggered (6% for first 15
years followed by 18%
for subsequent 15 years)
1.74 1.90 3.64 7% 807
The above analysis shows the impact on generation tariff. Increasingly, as distribution
companies invite power from developers through competitive bidding, supply and demand
situation will determine to what extent the developer will be able to pass on the burden to
the consumers. The developer will get into different long and short term arrangements to
get maximum return on investment. It may be that the developer may pass on the entire
burden to the consumer. It is also possible that the burden may be shared between the
consumer and the developer.
States are looking at short term arrangements for utilizing this free or concessional power.
Discussions brought out that Odisha, for instance, would either use this concessional power
for its own consumption in years when hydro generation is low, or sell it through short term
contracts. In recent months, however the prices of power sold through energy exchange
have come down, with financially stressed Discoms preferring to load-shed rather than buy
power in the market. There is newspaper reports that suggest that Chhattisgarh is no longer
interested in buying the power committed to it by IPPs (as right of first refusal) as it is no
longer profitable for the state.
Compensation and benefit sharing
Compensation has two connotations: (i) remuneration and other benefits received in return
for services rendered and (ii) payment of damages by a person who has caused an injury.
This meaning thus involves the prerequisite of either a service or an injury or a loss. (TERI,
2007).The prime basis for any payment for the use of resources could be that due to
exploitation, the resources become exhausted and its owners must be compensated for either
Equitable sharing of benefits arising from coal mining and power generation among resource rich states
26
the actual loss or the opportunity cost or both. Certain externalities vis-à-vis environmental
degradation, loss of forest cover, adverse public health, large scale displacement, loss of
livelihood are created as a result of development or exploitation of resources.
A key issue to note is that compensation for environmental and social impacts is not part of
sharing in resource wealth or benefits and should not be considered as such. This tendency
to conflate the two is responsible for a considerable amount of lack of clarity on this issue.
Negative environmental and social impacts are part of costs of the economic activity and
need to be reflected as such. Compensation for such impacts is important for economic,
ethical, fiscal and political reasons. In attention to some of these concerns that relate to a
‚using of the resources for the benefit of the other‛ or ‚cost-shifting which is not reflected in
prices‛ create a sense of environmental and social injustice, and could result in a conflict of
interests between the local, state, and national levels, also between the people of the states
(TERI, 2007). Negative externalities associated with coal development suggest that
compensation arrangements need to address both horizontal and vertical inequities.
To compensate for externalities arising out of coal mining and coal based thermal power
generation, the study has examined different options – tax, cess, and free power.
Study recommendations
The study has the following recommendations to make with regard to the sharing of benefits
and burdens based on the findings, but also to improve outcomes in the coal rich states
Recommendation 1: On shares of the power produced through free or preferential
power
We do not recommend the use of free power to cover negative externalities .Demand
for free power can have different implications for power deficit and power surplus
states. Current developments in the power sector suggest that payment in kind, i.e.
free power, may become an unpredictable source of revenue and so is not suitable as
a funding source to address environmental damage.
The demand for free power from thermal power stations does not emanate from a
statute and are more in the nature of contractual arrangements to be negotiated
between the power producer and the host state for facilitation of such projects
As long as the States seek power at variable cost or free of cost from all the power
plants, it is justifiable. However, any policy that mandates free power from only
those plants that are selling power to other states can be challenged in the court of
law as imposing restrictions on freedom of trade, commerce or intercourse among
states.
Executive summary
27
Recommendation 2: More equitable benefit sharing
We suggest that the proceeds from the sale of free or concessional power, where
agreed upon by the host state and the power producer, should be used for general
purposes as a means of sharing benefits with host states. We also suggest that this
benefit sharing should flow down to the local community. Local community should
be able to enjoy the benefits from these projects at least as much as any other region.
Prayas, 2012 suggests that around 4-5% of the power produced should be set aside
for local communities. There should be a similar process of benefit sharing with local
community in case of coal production. The Mines and Minerals (Development and
Regulation) Bill 2011 addresses this concern. It provides for 26% of profits of coal
mines to go to a District Mineral Foundation2, part of which would be used to make
recurring payments to affected people. We suggest that this provision should be
enacted at the earliest
States need to ensure that part of the enhanced royalty collected is earmarked for
development of human capital in the mineral area The case for the earmarking funds
for development of human capital in the mining region is to convert natural capital
that is used up in the form of minerals to human capital, thereby operationalizing the
weak sustainability principle.
There is need for setting up an intergenerational fund to share the benefits of this
depleting resource with future generations.(TERI, 2007)
As recommended in TERI, 2007 and Prayas, 2012 all efforts should be made to ensure
that local people and communities whose lives are disrupted by the coal mining at
various phases of their life cycle should be prime beneficiaries of resource
development. Where local people have no access to electricity, this can involve
provision of cheap or free power to the local community from the electricity
produced.
Recommendation 3: Burden sharing from coal mining and power production
Payments to resource rich states and to people in the region should serve three primary
goals, viz, compensation for externalities, correction for distributional injustice, and
deterrence or incentives for improved environmental behaviour. (Kathleen, 2002)
The most attractive legal and administrative route to address existing impacts is to
have a Union imposed, but state collected cess associated with damage costs of
impacts of coal mining or per unit electricity generated.
We suggest a two part cess linked to (i) uncompensated environmental and social
impacts of coal mining levied by the Central government on coal produced in states
and (ii) an environmental and social cess levied by the Centre on electricity
generation in a state for uncompensated impacts of coal power generation based in
states. In our estimates the cess on coal mining to be imposed on coal comes to Rs 119
per tonne of coal and cess on coal based power generation to be imposed on TPP
2 There are now discussions to provide amount equivalent to royalty for the Foundation as is the case for other
minerals.
Equitable sharing of benefits arising from coal mining and power generation among resource rich states
28
comes to Rs 0.75 per unit of electricity. If a single cess is levied linked to total
damages, then this will amount to Rs 0.83 /kWh.
This cess should replace any other existing similar cesses imposed on coal or coal
based power production for mitigating environmental impacts
The proceeds from this cess need to be earmarked for environmental and social
remediation as detailed in the subsequent recommendation.
We recognize that to avoid future impacts, stricter environmental standards and
even stricter monitoring and compliance is required. The objective ultimately is a
lower environmental and social footprint of coal mining and power generation. Any
levy cannot be a substitute for a strong enforcement of the laws and rules.
In order to incentivise improved environmental and social performance, a rebate on
cess can be announced after a period of 2 years from the introduction of the cess for
those whose environmental and social performance show improvement, and who
goes beyond compliance.
We also recognize that a
o Cess should not be seen a means for companies to avoid being more
environmental and social responsible.
o A Cess is suggested only as a short term means to compensate for the existing
impacts and to work towards a stricter regime and to drive research in
cleaner technologies and practices.
o The Cess can be withdrawn when the situation improves or a rebate on cess
can be allowed to incentivise companies that are going beyond compliance.
o Companies impose different levels of stress as a result of their activities and
should, therefore, be treated differently. Rebates can be imposed for lesser
polluting companies once a baseline is established on the current levels of
emissions, etc. or those producers that use cleaner technologies.
The cess on coal and power generation will have fiscal and equity implications. The cess
levied by the Centre may:
Be passed on in full to power consumers, and hence to the state/s where power is
consumed. Cost of power will increase across the country.
Be passed on in part to the consumer. For example, the cess on coal mining can be
absorbed by CIL and thus by the Centre. Or the state governments may reduce the rates
of electricity duty on consumption of electricity in order to reduce the burden on the end
consumers.
In a cost plus scenario, it is easier to keep a check on the extent to which the cess is
passed on to the consumer. In a competitive bidding scenario, it is more difficult to
ensure that thermal power producers do not pass on the entire cess amount to the
consumers.
Since richer states and richer consumers in all states also consume more power than the
poorer states and poor people in general, there is also an element of interstate and
interpersonal inequity in the current situation, as the coal rich states are poorer than most
Executive summary
29
states and also many of the districts where the coal is located are particularly poor and
without access to basic amenities and services. The people impacted most by coal mining
and power generation are also those living in these districts. A cess that is imposed,
collected and utilized to address these inequities will result in greater fairness across states
and their people.
Recommendation 4: Setting up a coal environmental and social remediation fund/
thermal power plant environment and social impacts mitigation fund
Our policy suggestions call for an approach to burden sharing that goes beyond interstate
transactions, but which also includes local communities and areas. To do this we suggest the
setting up of Funds to address the needs of impacted people
We recommend the setting up of Fund/Funds with clear allocation rules or guidelines for
the use of funds obtained from the cess imposed on coal and power production. The money
from the cess collected should go into a state level Fund/Funds. The design of the Fund
should reflect objectives and the purpose for which it is being set up. The key objective of
this Fund will be the redressal of past environmental problems and social displacement
arising from coal mining activity, and to assist future mining to be conducted in an
environmentally safe and socially acceptable manner even as it contributes to economic
growth, job generation and local development in the state. It is important to be clear what
the cess money can be used for and what it should not be used for.
The Fund money should not be used for the following:
Afforestation, as CAMPA already covers that
In preventive and remedial activities of coal and power companies that they are
legally expected to address
Activities covered under the Clean Energy Cess on Coal
Fund utilization
‚Because suffering is localized, compensation also needs to be localized‛ this was the
message from the coal rich states. The amount collected in the proposed Funds has to be
used to address uncompensated environmental and social externalities arising out of coal
mining and coal based power generation. It aims at improving the lives of local people
affected by impacts of coal mining and power production.
The cess is not a substitute for enforcement of existing rules and compliance with the norms
in place. The cess would complement the current regime of approvals, monitoring and
compliance. It would support activities to mitigate externalities associated with coal mining
and coal based thermal power generation, and distributes the burden and benefits more
equitably. More specifically, the fund can/should support the following:
Remediate cumulative environmental damages in the coal mining regions.
Support efforts to reduce the coal dust problem
Support efforts to improve quality of water bodies
Support efforts at dump management
Equitable sharing of benefits arising from coal mining and power generation among resource rich states
30
Support programmes for the rehabilitation of abandoned mine sites. Creative models
exist internationally to convert closed mines to productive economic assets or some
other appropriate after mine use options. This should be standard procedure for all
mines.
Clean up of all critically polluted areas. This can be done with research institutes,
NGOs, etc. in the region
Encourage continual monitoring and improvement in environmental management
and reduced social footprint through creation of platforms involving developer,
states and local people
Promote research, education, training and the exchange of information on
environmental management, science and technology issues related to coal mining
and power production
Promote exchange of best practices in mining and thermal power generation
Recognise environmental excellence through awards, both at an individual and
corporate level, but also of well-run coal districts.
Provide directly or support expertise to the mining industry to carry out competent
EIAs
Set up a cell in each taluk of the coal mining region to address R & R issues and also
monitor PAP in all, but especially, R & R hot spots
o Set up ways to assist rehabilitated families to manage the compensation money
received
o Develop educational initiatives, support balwadis, women’s education
o Support local initiatives at enhancing local capacity and skills, training centres
o Support/ contribute to other programmes that promote community
development in the locality or region
A special concern in all coal mining areas which is often not sufficiently addressed is
the health of communities (other than coal mine workers) living in the region. While
clearly improved oversight and enforcement of environmental laws and rules is
necessary, there should be mechanisms in place to ensure that mining communities
have access to medical insurance and well-functioning facilities for treatment in case
they are affected. Companies and the state government can jointly support the
medical care.
Strengthen institutions of oversight such as SPCBs, departments of mines,
environment, land revenues, etc., though investment in human capacity locally to
monitor environmental and social issues.
Staffing
The Fund should have Core staff consisting of:
A paid Director; two senior professionals with environmental and social
backgrounds; a research associate, administrative support
Executive summary
31
The oversight should be provided by a Board or Committee with multi stakeholder
governance, comprising 8 members:
o 2 State Government Representatives; 2 Local community Representatives;
CIL representative; Representative of Publicly owned TPPS (NTPC/ DVC/
state generation companies); Representative of IPP; Representative of key
research institute in the state
Recommendation 5: Improved environmental and coal governance is a must to
reduce ecological and social stress in coal rich states
The MOEF, the MOC and the State bodies need to strengthen institutional
coordination before giving mining and environmental clearances.
o Government departments should also give clearances in time wherever such
applications have been filed in compliance with all laws etc. Delays in
obtaining genuine clearances also mask the regular v/s irregular operators.
o The Government should make available all the documents pertaining to the
proposed coal mining to concerned stakeholders and villagers affected by the
mining operation well in advance.
o Free prior and informed consent is key to improving social acceptability of
projects
Proactive disclosure of information in connection with RTI;
o Spatial data bases should be created.
o The websites of the all concerned government departments that regulate coal
mining and power production in the States should be uploaded regularly, at
least once in 6 months.
Effective implementation of EPA, FCA, PESA and other acts that will improve actual
functioning on the ground
Clearly there is a need for far stricter monitoring of power plants and mines for
emissions and other environmental impacts.
o A multi-stakeholder committee, such as suggested by Prayas, 2012 could be
set up including independent experts, representatives of the SPCB, local self-
government institutions and citizens.
o Need of capacity and resources for monitoring impacts;
o Strengthen local panchayat capacity in environmental governance; Empower
local panchayats in mining regions financially by sharing royalty with them
o No mine or power producer should be allowed to continue operations if
environmental rules and social obligations are flouted;
o Recognize and incentivise good corporate behaviour
o Local people should be involved in monitoring and reporting any illegalities
so as to correct in time.
o Social audits & participatory monitoring of impacts should be encouraged
Equitable sharing of benefits arising from coal mining and power generation among resource rich states
32
o Natural resource and environmental accounts for the coal sector should be
developed
Recommendation 6: Reduce social and ecological stress by keeping within
carrying capacity of the region
Cumulative impact studies and carrying capacity studies need to be carried out
given the large volume of mining and planned power capacity expansion
o Such studies are especially required in ecologically sensitive river basins
o The existing conditions found in particular areas as obtained through the
CEPI should be paramount in decision making for opening new mines or
locating new plants
Reduce environmental footprint through use of green technologies and improved
practices
Pricing of water and land right to ensure more efficient resource use in coal
development and power generation
There is need of a detailed study to examine the impacts of coal mining on surface
water and ground water in the region
Recommendation 7: Improving health in coal mining regions
Improve surveillance and monitoring of diseases and disorders in the mining regions
in the states
Get coal mining and power industry to partner with Panchayats and primary health
centres to provide both diagnostics and treatments that are industry linked
Reduce air pollution in road and freight corridors. Greater control of sulphur dioxide
as a pollutant is required.
More careful assessment of health risks of arsenic and radioactivity in fly ash is
required to ensure more informed decisions on fly ash utilization.
Set up hospitals with speciality facilities on coal related diseases and mechanisms in
place to ensure that local communities have access to medical insurance and well-
functioning facilities for treatment in case of ill health due to degraded environment
Equitable sharing of benefits arising from coal mining and power generation among resource rich states
33
1. Introduction
Background
As the country moves towards an all India market for power with open access and
increasing participation of merchant power plants, not only coal but also power is being
transported out of resource rich states and being consumed in other states. The states selling
power in their state get remunerated from the revenue of sale of electricity and electricity
duty. The coal bearing states, however, complain of nominal revenues and limited
employment opportunities. In case of power generation, besides coal, other natural
resources such as land and water also get utilised in the host states. In addition, these
resource rich states bear the additional burden of mitigating the externalities of coal mining
and power generation, as well as the administrative costs involved in the entire process of
coal mining and power generation. Coal bearing states have repeatedly aired their concerns
about the externalities they face in connection with coal mining and power generation. In the
case of coal bearing areas, royalty and in some cases, cess is considered to be compensation
to states. For many years, and especially since coal prices started rising in 2004, the issue for
coal rich states was the payment of royalty at ad valorem instead of specific rates. When coal
prices were rising, maintaining specific rates meant that coal producing states were not
benefitting from rising revenues. In 2012, coal royalty was moved to ad valorem rates, but
after considerable policy negotiation. The Cabinet Committee for Economic Affairs
approved the switch from unit-based to ad valorem rates (eg. 14 % of pit-head value of coal)
of royalty on coal and lignite, which would ensure that revenues accruing to coal-bearing
states would better reflect the market value of the mined coal. At current prices, this means
a significant increase in coal royalty revenue for these states.
Royalty, however, is payment for the use of the resource, and if appropriately charged, can
reflect depletion costs. But there are other externalities associated with coal mining that are
not captured by royalty payments and which have been demanded by states. In 2006, TERI
was asked by the Inter State Council to undertake a study to examine compensation issues
being demanded by coal rich states. In that context, TERI prepared a comprehensive listing
of main externalities associated with coal development, the existing framework for
compensation, and also the externalities for which currently no compensation mechanism
exists. (Figure 1) This framework was updated to reflect current developments and new
understanding. The adequacy or suitability of the compensation payments is a separate
issue. The social cultural impacts are highlighted to indicate that no compensation
mechanism really exists for this type of externality.
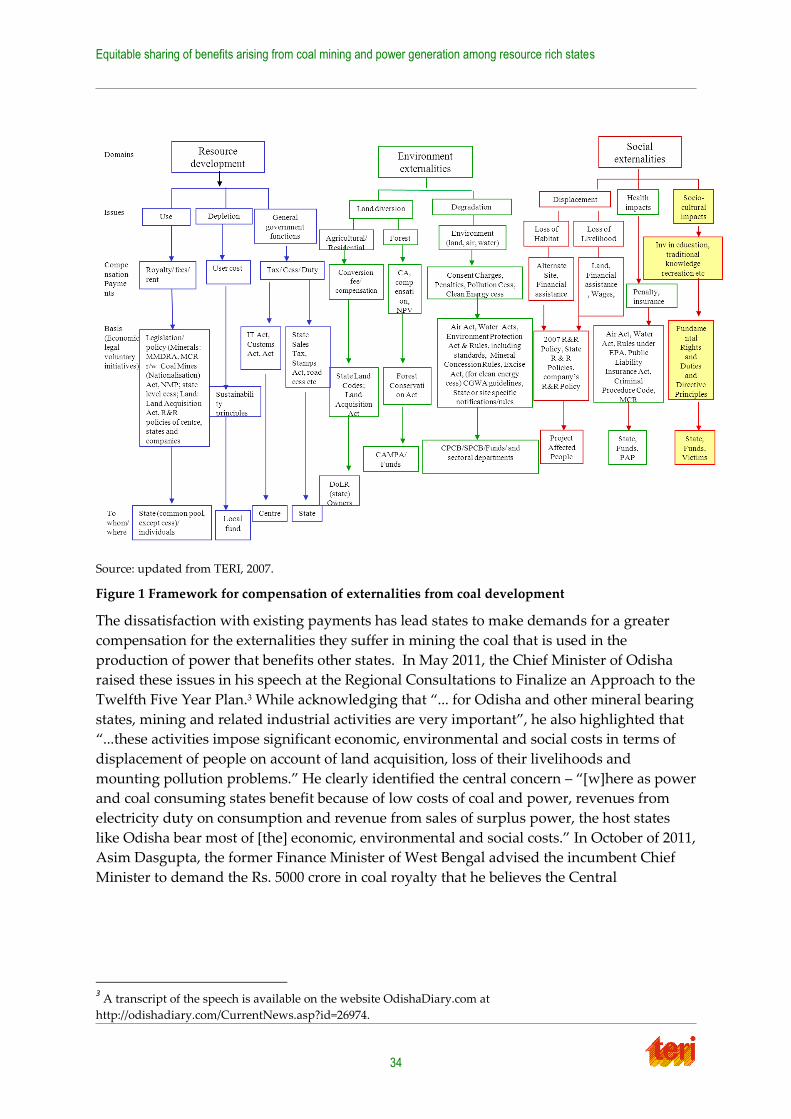
Equitable sharing of benefits arising from coal mining and power generation among resource rich states
34
Source: updated from TERI, 2007.
Figure 1 Framework for compensation of externalities from coal development
The dissatisfaction with existing payments has lead states to make demands for a greater
compensation for the externalities they suffer in mining the coal that is used in the
production of power that benefits other states. In May 2011, the Chief Minister of Odisha
raised these issues in his speech at the Regional Consultations to Finalize an Approach to the
Twelfth Five Year Plan.3 While acknowledging that ‚... for Odisha and other mineral bearing
states, mining and related industrial activities are very important‛, he also highlighted that
‚...these activities impose significant economic, environmental and social costs in terms of
displacement of people on account of land acquisition, loss of their livelihoods and
mounting pollution problems.‛ He clearly identified the central concern – ‚*w+here as power
and coal consuming states benefit because of low costs of coal and power, revenues from
electricity duty on consumption and revenue from sales of surplus power, the host states
like Odisha bear most of *the+ economic, environmental and social costs.‛ In October of 2011,
Asim Dasgupta, the former Finance Minister of West Bengal advised the incumbent Chief
Minister to demand the Rs. 5000 crore in coal royalty that he believes the Central
3 A transcript of the speech is available on the website OdishaDiary.com at
http://odishadiary.com/CurrentNews.asp?id=26974.
1. Introduction
35
Government owes Bengal for coal mined since 1991.4 In August 2012, Jharkhand’s Chief
Minister Arjun Munda said the coal reserves of the state were both a ‚boon and a bane‛. 5
Another demand that has been made is the demand for ‚free power‛. This is a relatively
recent position taken by coal-bearing states that draws from the National Policy for Hydro
Power Development. The Chief Minister of Chhattisgarh, for example, has urged that this
policy should be extended to coal-bearing states as well. The Government of Odisha seeks to
advocate a demand of as much as thirty three percent free power in an Eastern Zonal
Council meet. In fact, the Odisha government provides for preferential treatment to the state
with respect to energy generated from the power plants based in the state.
With regard to Concessional/preferential procurement of electricity by the host state, CERC
in its advice to the Central Government has stated that it finds the provisions of such
policies issued by state government as ‘not consistent with the statutory Tariff Policy under
the Electricity Act 2003’. In CERC’s view concessional sale of power to host state would lead
to increase in cost of electricity to distribution utilities of other states. It would also impact
competition in the electricity market’.
The immediate rationale for this study emerges from these demands by coal bearing states,
reiterated at a meeting held on August 8, 2012, convened by the Planning Commission to
discuss issues relating to a policy initiative for equitable sharing of benefits arising from coal
mining and power generation activities among states.
Coal rich States, despite their contribution to the country’s GDP and energy security, lag
behind the national average on key indicators related to income, life expectancy, literacy and
access to basic services like health and drinking water. Coal produced in these States serves
as an important input in meeting the energy demands of other States. However, the States
feel that the benefits and burden that accrue out of coal mining are not distributed equitably.
According to these States, they bear all the negative environmental and social externalities
associated with coal mining but are left out of the benefits. The mandatory washing of coal
for transport to states, further aggravates the externalities in the host state while the
receiving state benefits from cleaner power. Externalities on account of coal washing are
becoming a major concern with host states.
Coal rich states contend that the current mechanism for sharing of benefits arising out of
coal mining and power generation does not take into account adequately the costs incurred
by them for these externalities and the administrative costs of facilitating various clearances
for coal mining. The TERI framework for compensation in Figure 1 also shows that there are
certain gaps in the current compensation regime.
The overall legal and regulatory regime for compensation in the form of various payments
for coal and electricity is discussed in Chapter 7. The main benefit to which the coal bearing
States are entitled by law is in the form of royalty and a few other payments on coal. Unlike
other minerals, coal bearing lands are acquired by the Centre and deprive States of surface
rent. In terms of electricity, States are only allowed to tax consumption or sale of electricity
which is completed within the boundaries of the State. Thus their primary source of revenue
4 ‚Demand coal royalty from Centre, Left’s Asim tells Govt.‛ (Indian Express: October 25, 2011). Retrieved from
http://www.indianexpress.com/news/demand-coal-royalty-from-centre-left-s-asim-tells-govt/865093. 5 ‚Coal Royalty Gets State 5834 Crore in Five Years‛ (Jharkhand State News: August 14, 2012) Retrieved from
http://www.jharkhandstatenews.com/coal-royalty-gets-jharkhand-rs-5834-crore-in-five-years/
Equitable sharing of benefits arising from coal mining and power generation among resource rich states
36
from electricity is Electricity Duty on consumption. States have introduced several payments
for electricity, coal mining and externalities from time to time. In case of coal or minerals,
levies have often been struck down by the courts as infringing upon the MMDR Act. In case
of electricity, legislation, subordinate legislation and policies of several States have provided
for electricity duty, cesses, and concessional power. In recent times, there have been
instances of state level levies for addressing environmental externalities.
Objectives of this study
To study the various issues involved in the equitable sharing of benefits arising from coal
mining and power generation in resource rich states and propose recommendations for equitable sharing of benefits between resource rich host states and consuming states.
Terms of reference
The Terms of Reference as specified in Annexure 1 of study sanction letter M-12026/5/2007 –Coal dated 5th March 2013 are listed here with:
I. Realistic assessment of the negative impact of coal mining on land acquisition, land
re-use, rehabilitation & resettlement, environmental and ecological degradation, physical infrastructure in the resource rich host state. This assessment will be based
on previous research studies for some of these aspects.
II. Expenditure on Administrative machinery of the host state to process the approvals
and address the negative impacts of coal mining as stated in point (1).
III. Impact of agreeing to the states proposal for either certain percentage of free power from the coal based power plant located in host state similar to the benefits given for
hydro power plant or supply of certain percentage of electricity at variable cost.
IV. Impact of agreeing to the states demand for first right of refusal for supply of certain
percentage of electricity from such plants.
V. Provisions in the present legal and regulatory framework for imposition of tax or duties for the electricity generated in host state primarily for export to consuming
states and recommend suitable amendments, if such provisions are not there
VI. Similarly provisions in the present legal and regulatory framework to impose tax or
duties on mining activities beside royalty by the Central Government for mitigation
measures to address the environmental degradation in the resource rich states.
VII. Mechanism for sharing of such taxes and duties between Central Government,
resources rich states and consuming states
Approach and methodology
A. The problem
Broadly, there are two sectors involved in this study – coal and electricity. There is a
significant body of research which supports the conclusion that coal-bearing states have
1. Introduction
37
been bearing a number of externalities that have not been sufficiently compensated. (TERI,
2007). The complaint of coal-bearing states is that part of the revenues accruing from electricity consumed in other states should rightfully be theirs, since it is generated using
their coal and imposes costs on their natural and human resources.6 The central issue,
however, is not about sharing of revenues from electricity consumed, but about being compensated for the externalities caused by coal production. The essential policy question
here is this – how are coal-bearing states compensated for the externalities from coal mining
and those from electricity production?
B. Research questions
Some of the key questions that emerge to address the ToR are as follows:
What is a realistic assessment that we can arrive at of selected impacts of coal mining
- land acquisition, land re-use, rehabilitation & resettlement, environmental and
ecological degradation, physical infrastructure?
To what extent are the states already compensated for these externalities through
existing rules and regulations, both national and state specific?
What are the aspects of externalities that are not addressed?
What are the additional administrative costs incurred by the state in terms of
approvals and addressing the negative impacts? Are administrative costs of
approvals not covered by existing fees, etc.?
What are the existing provisions for ‘free power’ or concessions to host state from
power generation and what are concerns/implications for power consuming states?
What will be the impact of the following demands/proposals by host states on
average cost of power generation and state revenues:
o Share of a certain percentage of free power from the coal based power plant
located in host state or
o Supply of certain percentage of electricity at variable cost.
o First right of refusal for supply of certain percentage of electricity from such
plants.
To what extent do these demands have a legal justification?
What legal and policy avenues are available to coal-bearing states to be
compensated?
C. Methodology
Given that this was a short term, 6 month study, original and extensive field based estimates
of environment or social externalities were not undertaken.The research work relied heavily
on the analysis of data and figures available through secondary sources. The analysis is also
6 As outlined in their representations to the Power & Energy Division of the Planning Commission. Document M-
12026/05/2007-Coal.
Equitable sharing of benefits arising from coal mining and power generation among resource rich states
38
based on the data on air and water quality collected from State Pollution Control Boards of
Jharkhand and Odisha. Inputs obtained through consultations with Department of Water,
Department of Energy, Department of Mines, Department of Forests and Department of
Revenue in the two states has also been incorporated in the analysis (A detailed report of the
consultations at the state level is provided in Annex A).
An air modeling exercise was carried out to estimate district wise emissions from coal mines
in case of Odisha. In 2011, TERI had conducted field surveys in Jharkhand to understand
social impacts of coal mining activities.7 The results of the field survey have also been
incorporated in the report.
The following section lists out the research methodology used to address each task of the
Terms of Reference.
ToR I
An assessment of the negative impacts of coal mining on land acquisition, land reuse,
rehabilitation & resettlement, environmental and ecological degradation, physical
infrastructure in four key coal rich states: Jharkhand, Odisha, Chhattisgarh and Madhya
Pradesh (selected in consultation with the Planning Commission) was undertaken. While the
TOR did not refer to social and environmental impacts of power production, it was felt that
the argument for benefits and burden sharing from coal based power production would be
incomplete, if these impacts were not considered. The assessment of impacts and costs
followed a life cycle approach of coal mining and coal based electricity generation.
Comprehensive assessments of environmental and social externalities require the
consideration of all stages of the life cycle of a product. In such a Life Cycle Assessment
(LCA), there is a need to assess raw material inputs into the production process as well as
conjunctive resources used, such as land, water, energy. In general, there are three phases –
production, operation/use, and disposal. Figure 2 provides an illustration of the main stages
of the life cycle of coal mining, and another of a coal based power plant. It is obvious that the
life cycle of the latter includes the former, and they are separated here only for purposes of
doing the impact assessments.
The assessment involved the following:
1. A review of the secondary literature on coal mining impacts in India and especially in
the selected states – government reports, sectoral studies, etc.
2. An examination of the EMP and EIAs of selected mines in districts (those to which
access was provided or found on the internet.)
3. Consultations with state government officials from State Pollution Control Boards,
Department of Land and Revenue, Department of water, the mining company officials.
4. Estimation of emissions for coal mining and related health impacts in Odisha as a case-
study
7Under the project titled ‚Responsible sovereignty and Energy Resources‛ supported by Konrad Adenauer
Stiftung (KAS)(TERI 2011)

1. Introduction
39
Figure 2 Life cycles of coal mining and coal based power production
ToR II
Expenditure on Administrative machinery of the host state to process the approvals and
address the negative impacts of coal mining as stated in ToR I.
The approach to study the expenditure on administrative machinery were divided into two
distinct heads of costs borne by the state governments -
A. The costs incurred by the host state during administrative procedures for approvals
and clearances of coal mining in the state
B. The costs incurred by the host state to address the negative impacts of coal mining or
negative externalities during the coal mining processes
To follow this approach, the study listed all the clearances undertaken by the state
government for facilitating coal mining. This was followed by mapping the processes which
the state administration goes through for coal mining clearances. This was done in
consultation with state level officials involved in clearances and approvals.
Based on the findings of ToR I, the direct negative externalities arising from coal mining
were listed along the different stages of the coal life cycle. After understanding the impacts
of these externalities, the study assessed the actual expenditure related to some of these
externalities– based on expenditure statements of government departments, but somewhat
focused. Thus, for example, the study sought to assess the administrative costs of addressing
the following:
Forest land cleared (costs of addressing CAMPA requirements)
Coal mining
Coal based thermal power plant
Equitable sharing of benefits arising from coal mining and power generation among resource rich states
40
Implementing and enforcement of R & R plans
Ecological Rehabilitation
Cleaning water impacted by mining
Land remediation costs (if abandoned)
Creation and maintenance of road infrastructure
ToR III & IV
Impact of agreeing to the states proposal for either certain percentage of free power
from the coal based power plant located in host state similar to the benefits given for
hydro power plant or supply of certain percentage of electricity at variable cost.
Impact of agreeing to the states demand for first right of refusal for supply of certain
percentage of electricity from such plants
Methodology
Under this task, the impact of free power/power at variable cost/right of refusal on the cost
of generation was examined. Scenarios were generated to examine the impact on state
revenues from different % of free and variable cost power electricity. The methodology used
includes:
1. Review of the existing state government policies or provisions providing for free
power/right of refusal to state government and actual implementation of these
policies. This was undertaken through literature review and interaction with
concerned state departments and power utilities.
2. The impact of free/additional power through right of refusal (wherever applicable)
was studied on the generation tariff of a hypothetical plant
3. Stakeholder interactions with project developers to understand issues of viability
and other concerns on account of free power
ToR V
Present legal and regulatory framework for imposition of tax or duties for the electricity
generated in host state primarily for export to consuming states (and recommend suitable
amendments, if such provisions are not there)
Methodology
In this ToR, the legal and regulatory framework for various levies on electricity was studied
to assess the extent to which a tax, duty or cess can be levied on electricity generated for
consumption in other states. The methodology involved:
1. Review of Constitutional provisions, Acts, rules, policies at the level of Centre and
identified states.
a. An analysis was carried out of the abovementioned instruments in public
domain and obtained through consultation with state departments.
b. Rulings of the courts and regulatory commissions were reviewed, where
applicable.
1. Introduction
41
2. Based on the analysis above and findings from ToR III and IV, recommendations
have been made with respect to the space that host states have as per the current
regime to levy a charge on generation of electricity meant for consumption in other
states.
a. Examine the validity and feasibility (legal) of the demands made by states.
ToR VI
Present legal and regulatory framework to impose tax or duties on mining activities beside
royalty by the Central Government for mitigation measures to address the environmental
degradation in the resource rich states
Methodology
In this ToR, the legal and regulatory framework for various levies on mining of coal was
studied to examine how different environmental externalities are compensated for to
different entities, especially to the resource rich states. The methodology and approach is
similar to the ToR on the legal and regulatory framework for electricity. It includes:
I. A review of Constitutional provisions, Acts, rules, policies at the level of Centre and
identified states. Rulings of the Supreme Court, High Courts and the Green Tribunal
will be reviewed, where applicable.
II. Mapping the legal space available to states to be compensated for environmental
externalities caused by mining of coal and highlighting any gaps therein.
III. Examining the validity and feasibility (legal) of the demands made by resource rich
states in the context of environmental degradation.
ToR VII
Mechanism for sharing of such taxes and duties between Central Government, resources
rich states and consuming states
Methodology
Based on the analysis and findings from earlier tasks under TOR I to VI, and stakeholder
discussions, a mechanism to share the compensation and its utilisation is proposed.

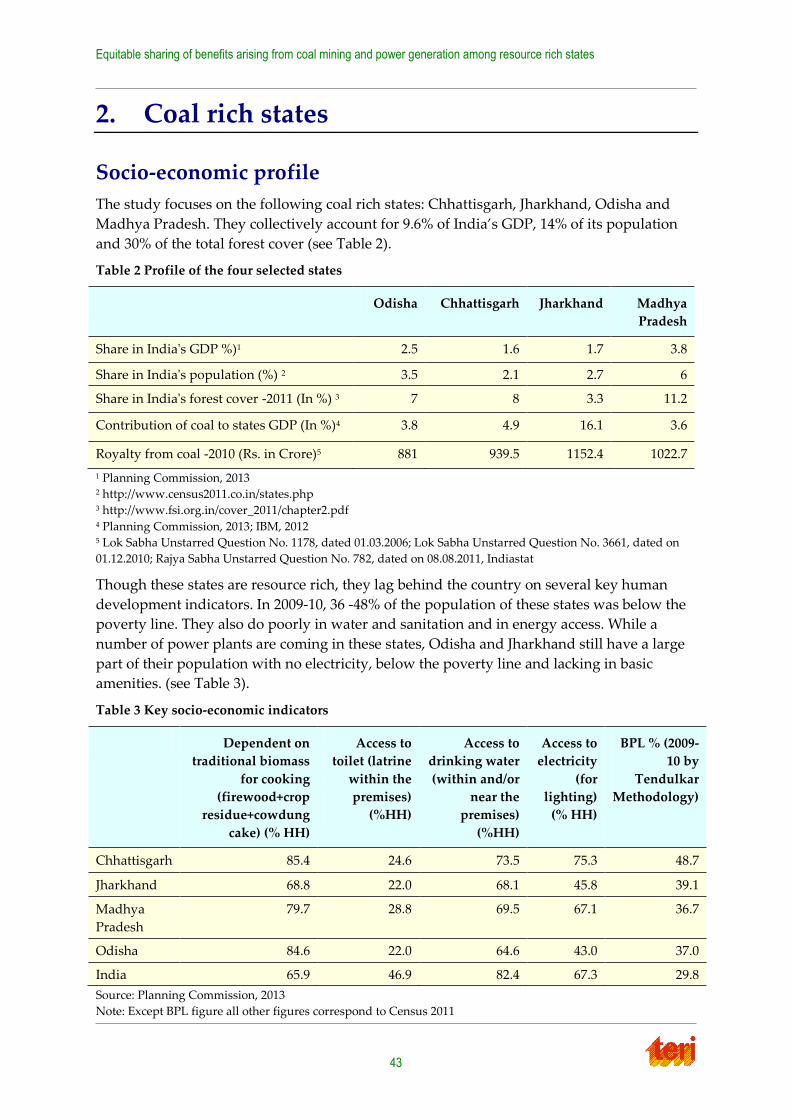
Equitable sharing of benefits arising from coal mining and power generation among resource rich states
43
2. Coal rich states
Socio-economic profile
The study focuses on the following coal rich states: Chhattisgarh, Jharkhand, Odisha and
Madhya Pradesh. They collectively account for 9.6% of India’s GDP, 14% of its population
and 30% of the total forest cover (see Table 2).
Table 2 Profile of the four selected states
Odisha Chhattisgarh Jharkhand Madhya
Pradesh
Share in India's GDP %)1 2.5 1.6 1.7 3.8
Share in India's population (%) 2 3.5 2.1 2.7 6
Share in India's forest cover -2011 (In %) 3 7 8 3.3 11.2
Contribution of coal to states GDP (In %)4 3.8 4.9 16.1 3.6
Royalty from coal -2010 (Rs. in Crore)5 881 939.5 1152.4 1022.7
1 Planning Commission, 2013 2 http://www.census2011.co.in/states.php 3 http://www.fsi.org.in/cover_2011/chapter2.pdf 4 Planning Commission, 2013; IBM, 2012 5 Lok Sabha Unstarred Question No. 1178, dated 01.03.2006; Lok Sabha Unstarred Question No. 3661, dated on
01.12.2010; Rajya Sabha Unstarred Question No. 782, dated on 08.08.2011, Indiastat
Though these states are resource rich, they lag behind the country on several key human
development indicators. In 2009-10, 36 -48% of the population of these states was below the
poverty line. They also do poorly in water and sanitation and in energy access. While a
number of power plants are coming in these states, Odisha and Jharkhand still have a large
part of their population with no electricity, below the poverty line and lacking in basic
amenities. (see Table 3).
Table 3 Key socio-economic indicators
Dependent on
traditional biomass
for cooking
(firewood+crop
residue+cowdung
cake) (% HH)
Access to
toilet (latrine
within the
premises)
(%HH)
Access to
drinking water
(within and/or
near the
premises)
(%HH)
Access to
electricity
(for
lighting)
(% HH)
BPL % (2009-
10 by
Tendulkar
Methodology)
Chhattisgarh 85.4 24.6 73.5 75.3 48.7
Jharkhand 68.8 22.0 68.1 45.8 39.1
Madhya
Pradesh
79.7 28.8 69.5 67.1 36.7
Odisha 84.6 22.0 64.6 43.0 37.0
India 65.9 46.9 82.4 67.3 29.8
Source: Planning Commission, 2013
Note: Except BPL figure all other figures correspond to Census 2011
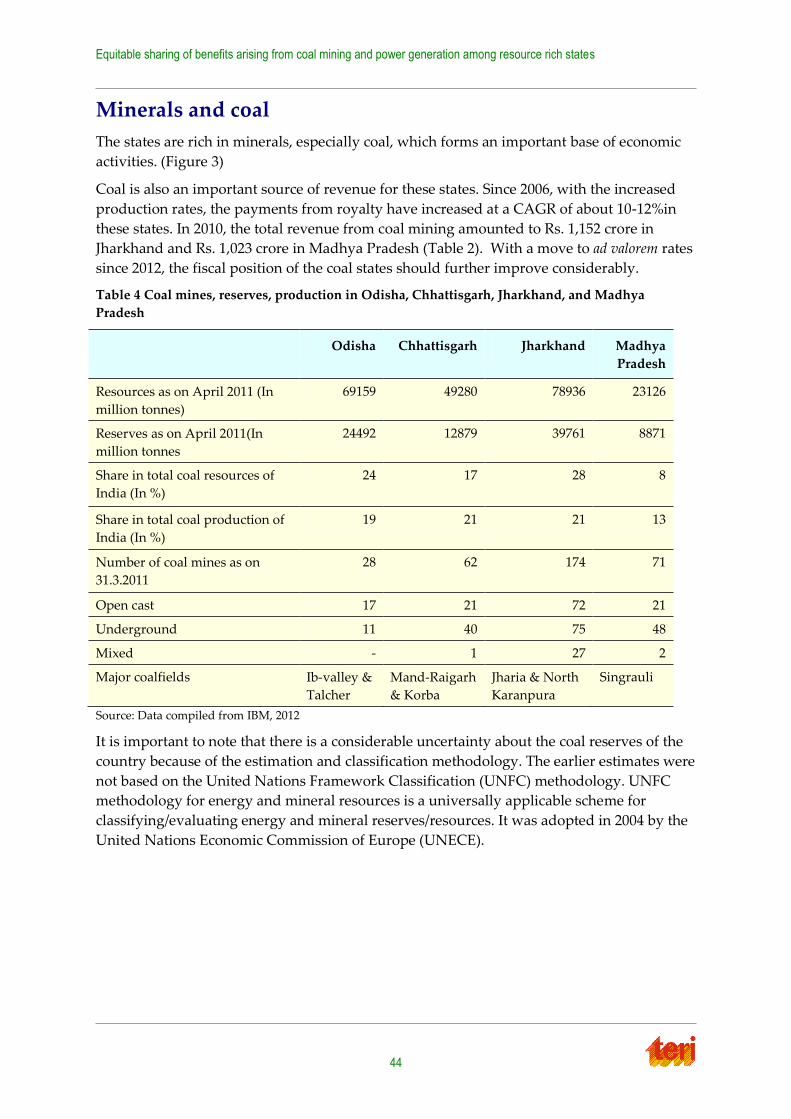
Equitable sharing of benefits arising from coal mining and power generation among resource rich states
44
Minerals and coal
The states are rich in minerals, especially coal, which forms an important base of economic
activities. (Figure 3)
Coal is also an important source of revenue for these states. Since 2006, with the increased
production rates, the payments from royalty have increased at a CAGR of about 10-12%in
these states. In 2010, the total revenue from coal mining amounted to Rs. 1,152 crore in
Jharkhand and Rs. 1,023 crore in Madhya Pradesh (Table 2). With a move to ad valorem rates
since 2012, the fiscal position of the coal states should further improve considerably.
Table 4 Coal mines, reserves, production in Odisha, Chhattisgarh, Jharkhand, and Madhya
Pradesh
Odisha Chhattisgarh Jharkhand Madhya
Pradesh
Resources as on April 2011 (In
million tonnes)
69159 49280 78936 23126
Reserves as on April 2011(In
million tonnes
24492 12879 39761 8871
Share in total coal resources of
India (In %)
24 17 28 8
Share in total coal production of
India (In %)
19 21 21 13
Number of coal mines as on
31.3.2011
28 62 174 71
Open cast 17 21 72 21
Underground 11 40 75 48
Mixed - 1 27 2
Major coalfields Ib-valley &
Talcher
Mand-Raigarh
& Korba
Jharia & North
Karanpura
Singrauli
Source: Data compiled from IBM, 2012
It is important to note that there is a considerable uncertainty about the coal reserves of the
country because of the estimation and classification methodology. The earlier estimates were
not based on the United Nations Framework Classification (UNFC) methodology. UNFC
methodology for energy and mineral resources is a universally applicable scheme for
classifying/evaluating energy and mineral reserves/resources. It was adopted in 2004 by the
United Nations Economic Commission of Europe (UNECE).
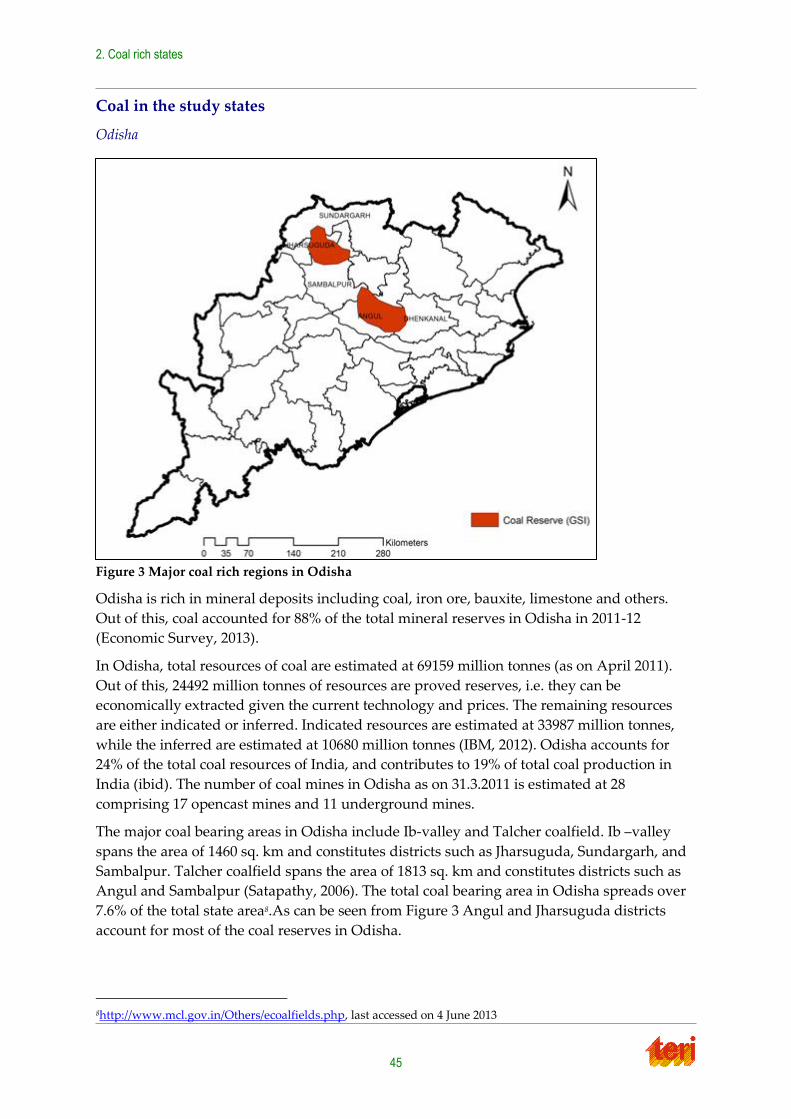
2. Coal rich states
45
Coal in the study states
Odisha
Figure 3 Major coal rich regions in Odisha
Odisha is rich in mineral deposits including coal, iron ore, bauxite, limestone and others.
Out of this, coal accounted for 88% of the total mineral reserves in Odisha in 2011-12
(Economic Survey, 2013).
In Odisha, total resources of coal are estimated at 69159 million tonnes (as on April 2011).
Out of this, 24492 million tonnes of resources are proved reserves, i.e. they can be
economically extracted given the current technology and prices. The remaining resources
are either indicated or inferred. Indicated resources are estimated at 33987 million tonnes,
while the inferred are estimated at 10680 million tonnes (IBM, 2012). Odisha accounts for
24% of the total coal resources of India, and contributes to 19% of total coal production in
India (ibid). The number of coal mines in Odisha as on 31.3.2011 is estimated at 28
comprising 17 opencast mines and 11 underground mines.
The major coal bearing areas in Odisha include Ib-valley and Talcher coalfield. Ib –valley
spans the area of 1460 sq. km and constitutes districts such as Jharsuguda, Sundargarh, and
Sambalpur. Talcher coalfield spans the area of 1813 sq. km and constitutes districts such as
Angul and Sambalpur (Satapathy, 2006). The total coal bearing area in Odisha spreads over
7.6% of the total state area8.As can be seen from Figure 3 Angul and Jharsuguda districts
account for most of the coal reserves in Odisha.
8http://www.mcl.gov.in/Others/ecoalfields.php, last accessed on 4 June 2013
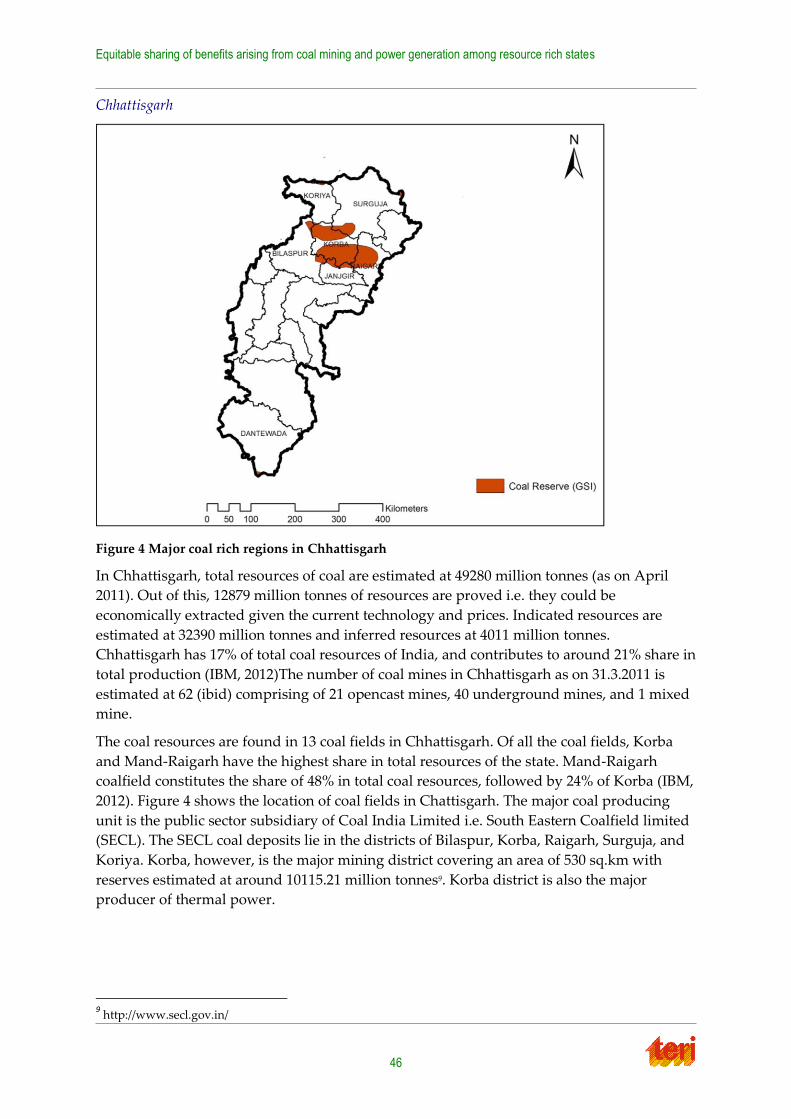
Equitable sharing of benefits arising from coal mining and power generation among resource rich states
46
Chhattisgarh
Figure 4 Major coal rich regions in Chhattisgarh
In Chhattisgarh, total resources of coal are estimated at 49280 million tonnes (as on April
2011). Out of this, 12879 million tonnes of resources are proved i.e. they could be
economically extracted given the current technology and prices. Indicated resources are
estimated at 32390 million tonnes and inferred resources at 4011 million tonnes.
Chhattisgarh has 17% of total coal resources of India, and contributes to around 21% share in
total production (IBM, 2012)The number of coal mines in Chhattisgarh as on 31.3.2011 is
estimated at 62 (ibid) comprising of 21 opencast mines, 40 underground mines, and 1 mixed
mine.
The coal resources are found in 13 coal fields in Chhattisgarh. Of all the coal fields, Korba
and Mand-Raigarh have the highest share in total resources of the state. Mand-Raigarh
coalfield constitutes the share of 48% in total coal resources, followed by 24% of Korba (IBM,
2012). Figure 4 shows the location of coal fields in Chattisgarh. The major coal producing
unit is the public sector subsidiary of Coal India Limited i.e. South Eastern Coalfield limited
(SECL). The SECL coal deposits lie in the districts of Bilaspur, Korba, Raigarh, Surguja, and
Koriya. Korba, however, is the major mining district covering an area of 530 sq.km with
reserves estimated at around 10115.21 million tonnes9. Korba district is also the major
producer of thermal power.
9 http://www.secl.gov.in/
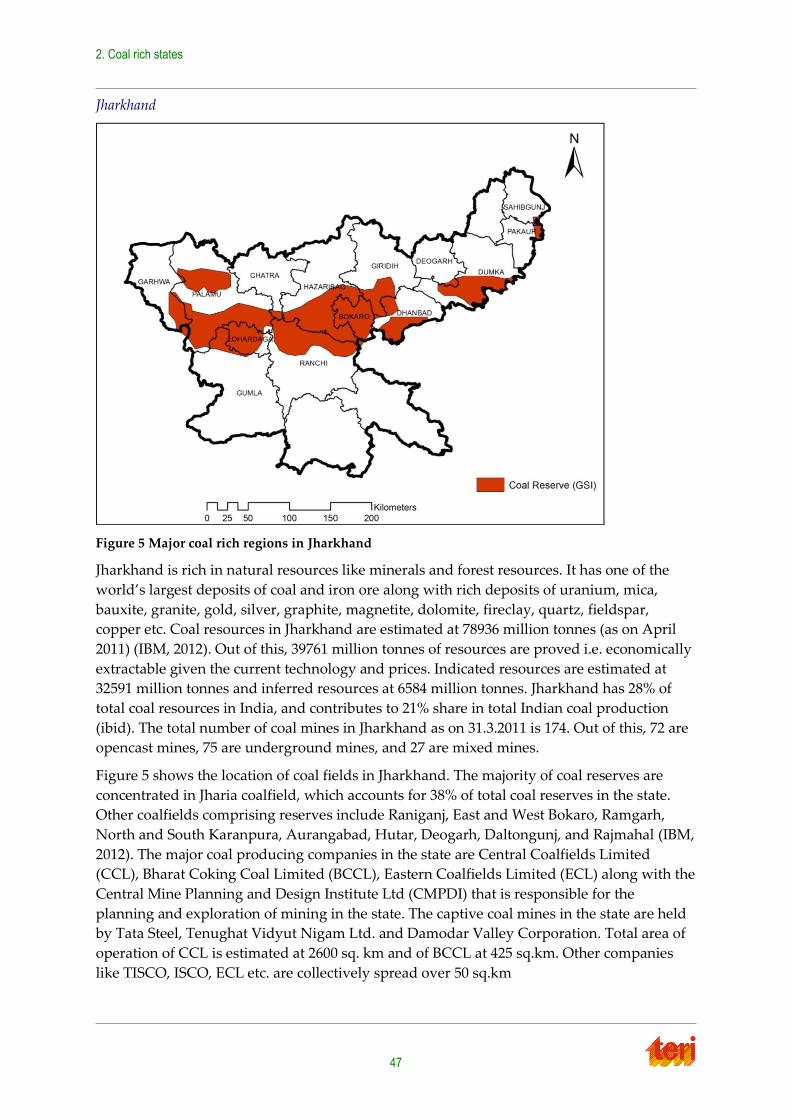
2. Coal rich states
47
Jharkhand
Figure 5 Major coal rich regions in Jharkhand
Jharkhand is rich in natural resources like minerals and forest resources. It has one of the
world’s largest deposits of coal and iron ore along with rich deposits of uranium, mica,
bauxite, granite, gold, silver, graphite, magnetite, dolomite, fireclay, quartz, fieldspar,
copper etc. Coal resources in Jharkhand are estimated at 78936 million tonnes (as on April
2011) (IBM, 2012). Out of this, 39761 million tonnes of resources are proved i.e. economically
extractable given the current technology and prices. Indicated resources are estimated at
32591 million tonnes and inferred resources at 6584 million tonnes. Jharkhand has 28% of
total coal resources in India, and contributes to 21% share in total Indian coal production
(ibid). The total number of coal mines in Jharkhand as on 31.3.2011 is 174. Out of this, 72 are
opencast mines, 75 are underground mines, and 27 are mixed mines.
Figure 5 shows the location of coal fields in Jharkhand. The majority of coal reserves are
concentrated in Jharia coalfield, which accounts for 38% of total coal reserves in the state.
Other coalfields comprising reserves include Raniganj, East and West Bokaro, Ramgarh,
North and South Karanpura, Aurangabad, Hutar, Deogarh, Daltongunj, and Rajmahal (IBM,
2012). The major coal producing companies in the state are Central Coalfields Limited
(CCL), Bharat Coking Coal Limited (BCCL), Eastern Coalfields Limited (ECL) along with the
Central Mine Planning and Design Institute Ltd (CMPDI) that is responsible for the
planning and exploration of mining in the state. The captive coal mines in the state are held
by Tata Steel, Tenughat Vidyut Nigam Ltd. and Damodar Valley Corporation. Total area of
operation of CCL is estimated at 2600 sq. km and of BCCL at 425 sq.km. Other companies
like TISCO, ISCO, ECL etc. are collectively spread over 50 sq.km
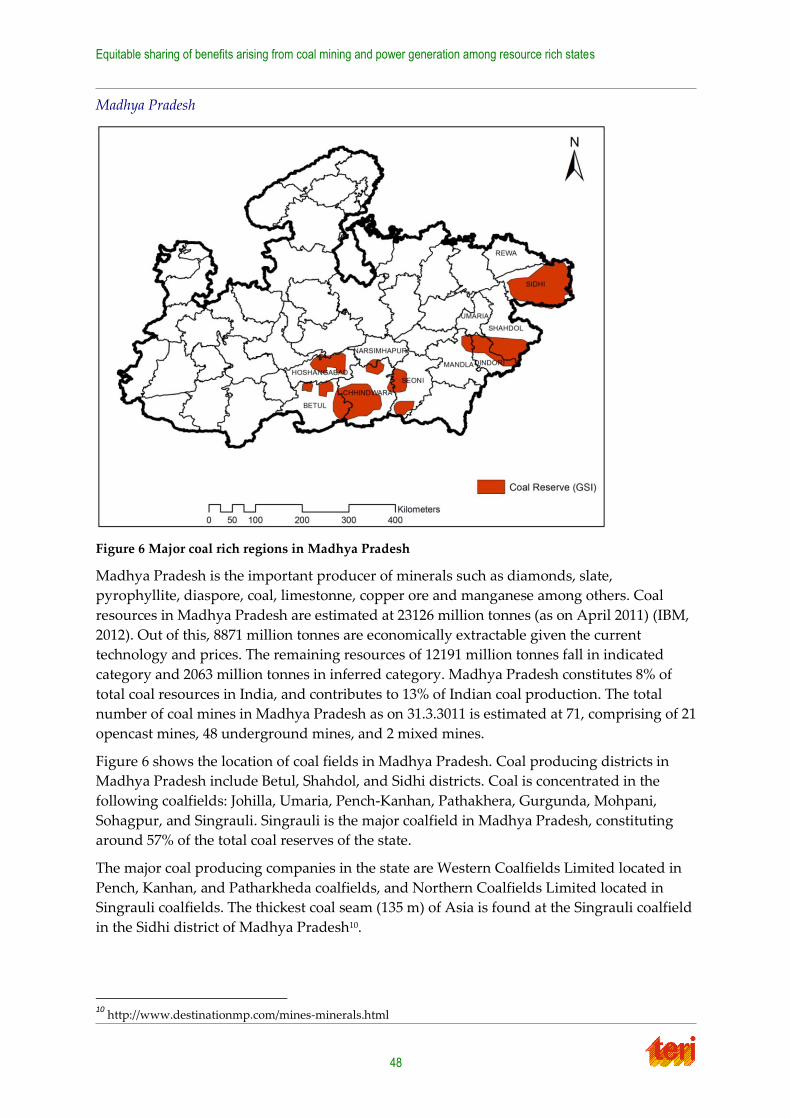
Equitable sharing of benefits arising from coal mining and power generation among resource rich states
48
Madhya Pradesh
Figure 6 Major coal rich regions in Madhya Pradesh
Madhya Pradesh is the important producer of minerals such as diamonds, slate,
pyrophyllite, diaspore, coal, limestonne, copper ore and manganese among others. Coal
resources in Madhya Pradesh are estimated at 23126 million tonnes (as on April 2011) (IBM,
2012). Out of this, 8871 million tonnes are economically extractable given the current
technology and prices. The remaining resources of 12191 million tonnes fall in indicated
category and 2063 million tonnes in inferred category. Madhya Pradesh constitutes 8% of
total coal resources in India, and contributes to 13% of Indian coal production. The total
number of coal mines in Madhya Pradesh as on 31.3.3011 is estimated at 71, comprising of 21
opencast mines, 48 underground mines, and 2 mixed mines.
Figure 6 shows the location of coal fields in Madhya Pradesh. Coal producing districts in
Madhya Pradesh include Betul, Shahdol, and Sidhi districts. Coal is concentrated in the
following coalfields: Johilla, Umaria, Pench-Kanhan, Pathakhera, Gurgunda, Mohpani,
Sohagpur, and Singrauli. Singrauli is the major coalfield in Madhya Pradesh, constituting
around 57% of the total coal reserves of the state.
The major coal producing companies in the state are Western Coalfields Limited located in
Pench, Kanhan, and Patharkheda coalfields, and Northern Coalfields Limited located in
Singrauli coalfields. The thickest coal seam (135 m) of Asia is found at the Singrauli coalfield
in the Sidhi district of Madhya Pradesh10.
10
http://www.destinationmp.com/mines-minerals.html
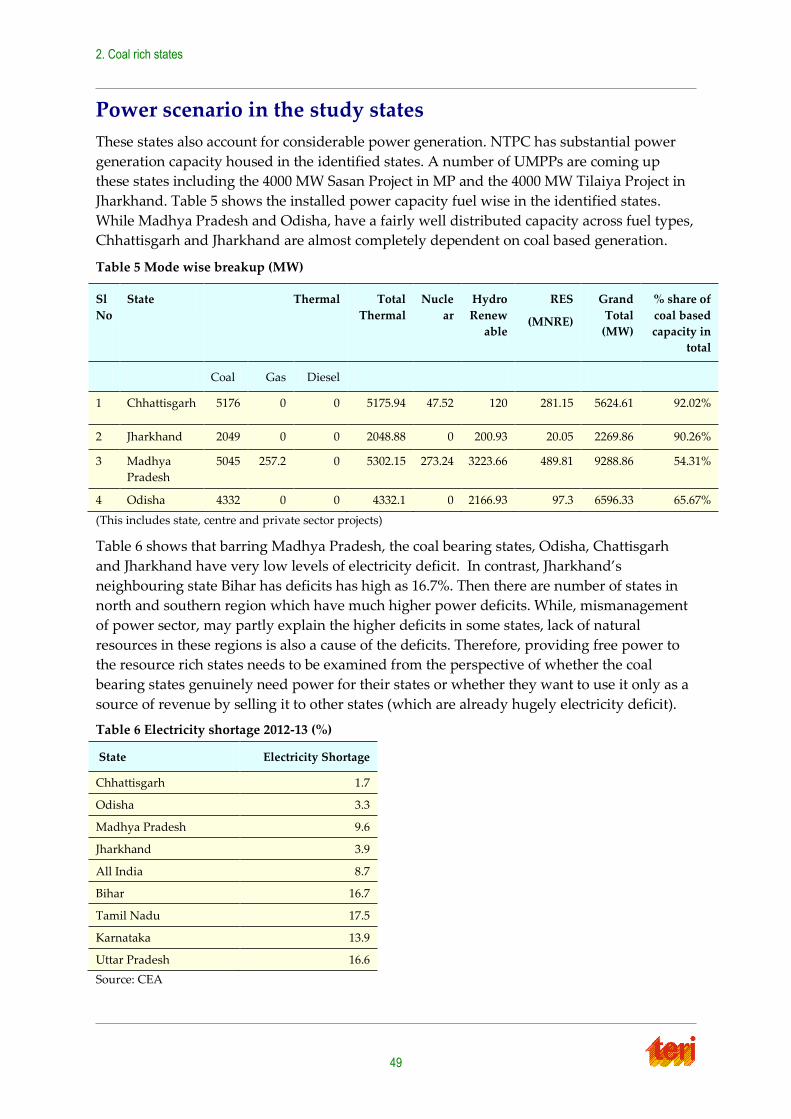
2. Coal rich states
49
Power scenario in the study states
These states also account for considerable power generation. NTPC has substantial power
generation capacity housed in the identified states. A number of UMPPs are coming up
these states including the 4000 MW Sasan Project in MP and the 4000 MW Tilaiya Project in
Jharkhand. Table 5 shows the installed power capacity fuel wise in the identified states.
While Madhya Pradesh and Odisha, have a fairly well distributed capacity across fuel types,
Chhattisgarh and Jharkhand are almost completely dependent on coal based generation.
Table 5 Mode wise breakup (MW)
Sl
No
State Thermal Total
Thermal
Nucle
ar
Hydro
Renew
able
RES
(MNRE)
Grand
Total
(MW)
% share of
coal based
capacity in
total
Coal Gas Diesel
1 Chhattisgarh 5176 0 0 5175.94 47.52 120 281.15 5624.61 92.02%
2 Jharkhand 2049 0 0 2048.88 0 200.93 20.05 2269.86 90.26%
3 Madhya
Pradesh
5045 257.2 0 5302.15 273.24 3223.66 489.81 9288.86 54.31%
4 Odisha 4332 0 0 4332.1 0 2166.93 97.3 6596.33 65.67%
(This includes state, centre and private sector projects)
Table 6 shows that barring Madhya Pradesh, the coal bearing states, Odisha, Chattisgarh
and Jharkhand have very low levels of electricity deficit. In contrast, Jharkhand’s
neighbouring state Bihar has deficits has high as 16.7%. Then there are number of states in
north and southern region which have much higher power deficits. While, mismanagement
of power sector, may partly explain the higher deficits in some states, lack of natural
resources in these regions is also a cause of the deficits. Therefore, providing free power to
the resource rich states needs to be examined from the perspective of whether the coal
bearing states genuinely need power for their states or whether they want to use it only as a
source of revenue by selling it to other states (which are already hugely electricity deficit).
Table 6 Electricity shortage 2012-13 (%)
State Electricity Shortage
Chhattisgarh 1.7
Odisha 3.3
Madhya Pradesh 9.6
Jharkhand 3.9
All India 8.7
Bihar 16.7
Tamil Nadu 17.5
Karnataka 13.9
Uttar Pradesh 16.6
Source: CEA
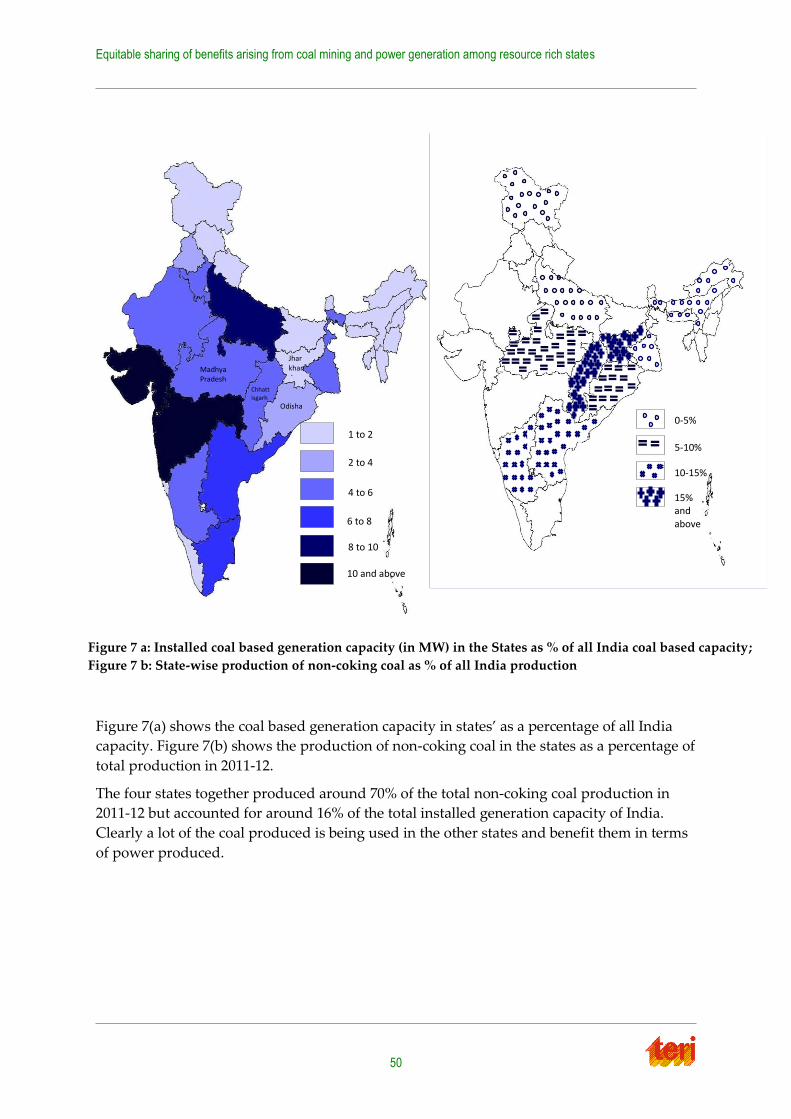
Equitable sharing of benefits arising from coal mining and power generation among resource rich states
50
Figure 7(a) shows the coal based generation capacity in states’ as a percentage of all India
capacity. Figure 7(b) shows the production of non-coking coal in the states as a percentage of
total production in 2011-12.
The four states together produced around 70% of the total non-coking coal production in
2011-12 but accounted for around 16% of the total installed generation capacity of India.
Clearly a lot of the coal produced is being used in the other states and benefit them in terms
of power produced.
Figure 7 a: Installed coal based generation capacity (in MW) in the States as % of all India coal based capacity;
Figure 7 b: State-wise production of non-coking coal as % of all India production
Madhya Pradesh
Chhattisgarh
Odisha
Jharkhand
1 to 2
2 to 4
4 to 6
6 to 8
8 to 10
10 and above
10-15%
0-5%
5-10%
15% and above
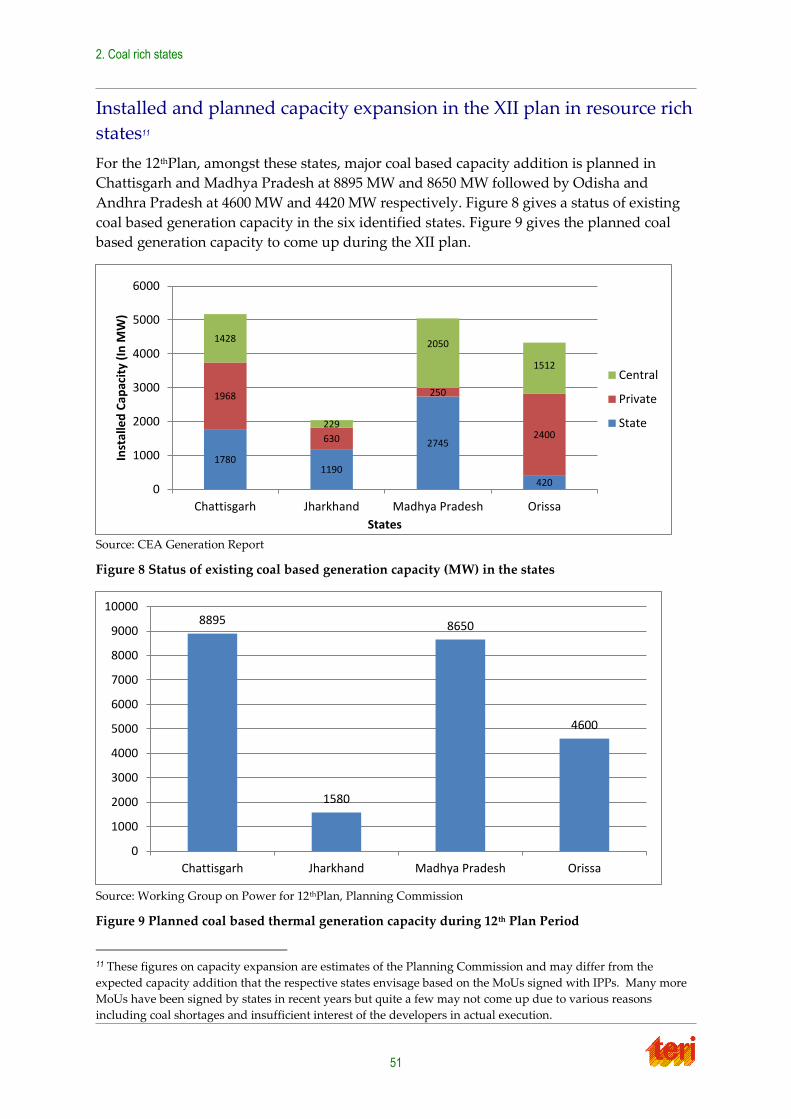
2. Coal rich states
51
Installed and planned capacity expansion in the XII plan in resource rich
states11
For the 12thPlan, amongst these states, major coal based capacity addition is planned in
Chattisgarh and Madhya Pradesh at 8895 MW and 8650 MW followed by Odisha and
Andhra Pradesh at 4600 MW and 4420 MW respectively. Figure 8 gives a status of existing
coal based generation capacity in the six identified states. Figure 9 gives the planned coal
based generation capacity to come up during the XII plan.
Source: CEA Generation Report
Figure 8 Status of existing coal based generation capacity (MW) in the states
Source: Working Group on Power for 12thPlan, Planning Commission
Figure 9 Planned coal based thermal generation capacity during 12th Plan Period
11 These figures on capacity expansion are estimates of the Planning Commission and may differ from the
expected capacity addition that the respective states envisage based on the MoUs signed with IPPs. Many more
MoUs have been signed by states in recent years but quite a few may not come up due to various reasons
including coal shortages and insufficient interest of the developers in actual execution.
1780 1190
2745
420
1968
630
250
2400
1428
229
2050
1512
0
1000
2000
3000
4000
5000
6000
Chattisgarh Jharkhand Madhya Pradesh Orissa
Inst
alle
d C
apac
ity
(In
MW
)
States
Central
Private
State
8895
1580
8650
4600
0
1000
2000
3000
4000
5000
6000
7000
8000
9000
10000
Chattisgarh Jharkhand Madhya Pradesh Orissa

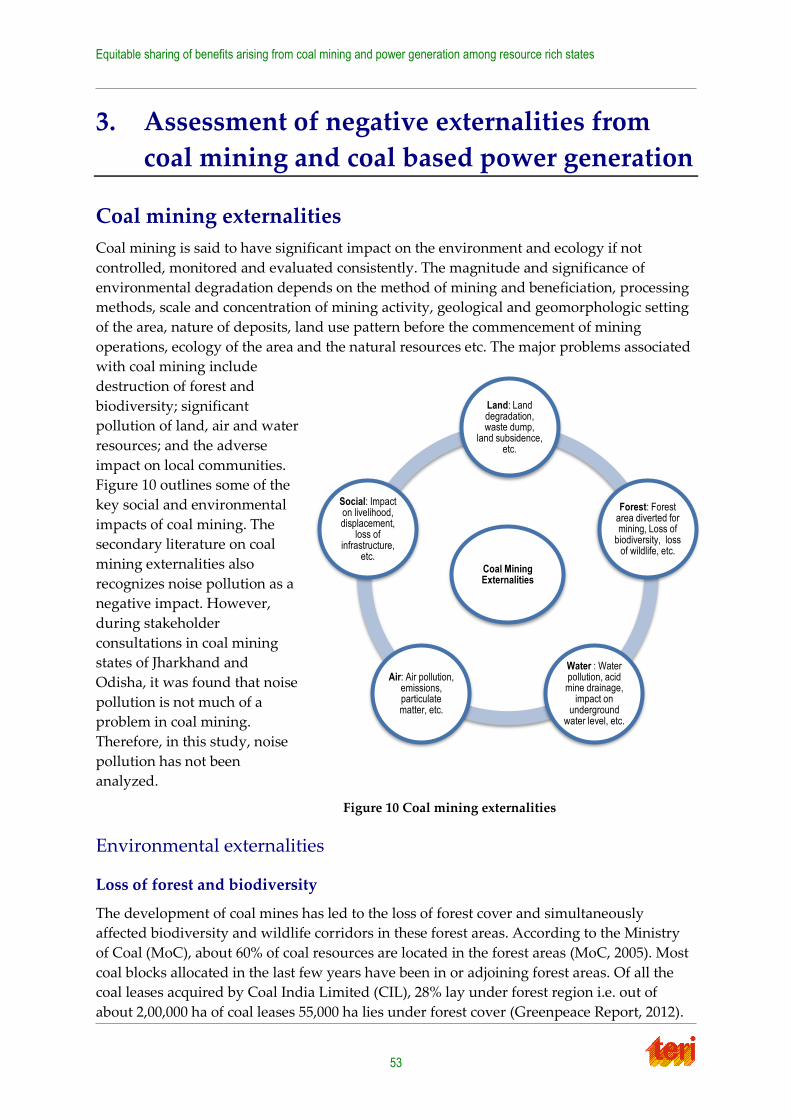
Equitable sharing of benefits arising from coal mining and power generation among resource rich states
53
Coal Mining Externalities
Land: Land degradation, waste dump,
land subsidence, etc.
Forest: Forest area diverted for mining, Loss of
biodiversity, loss of wildlife, etc.
Water : Water pollution, acid mine drainage,
impact on underground
water level, etc.
Air: Air pollution, emissions, particulate matter, etc.
Social: Impact on livelihood, displacement,
loss of infrastructure,
etc.
3. Assessment of negative externalities from
coal mining and coal based power generation
Coal mining externalities
Coal mining is said to have significant impact on the environment and ecology if not
controlled, monitored and evaluated consistently. The magnitude and significance of
environmental degradation depends on the method of mining and beneficiation, processing
methods, scale and concentration of mining activity, geological and geomorphologic setting
of the area, nature of deposits, land use pattern before the commencement of mining
operations, ecology of the area and the natural resources etc. The major problems associated
with coal mining include
destruction of forest and
biodiversity; significant
pollution of land, air and water
resources; and the adverse
impact on local communities.
Figure 10 outlines some of the
key social and environmental
impacts of coal mining. The
secondary literature on coal
mining externalities also
recognizes noise pollution as a
negative impact. However,
during stakeholder
consultations in coal mining
states of Jharkhand and
Odisha, it was found that noise
pollution is not much of a
problem in coal mining.
Therefore, in this study, noise
pollution has not been
analyzed.
Figure 10 Coal mining externalities
Environmental externalities
Loss of forest and biodiversity
The development of coal mines has led to the loss of forest cover and simultaneously
affected biodiversity and wildlife corridors in these forest areas. According to the Ministry
of Coal (MoC), about 60% of coal resources are located in the forest areas (MoC, 2005). Most
coal blocks allocated in the last few years have been in or adjoining forest areas. Of all the
coal leases acquired by Coal India Limited (CIL), 28% lay under forest region i.e. out of
about 2,00,000 ha of coal leases 55,000 ha lies under forest cover (Greenpeace Report, 2012).
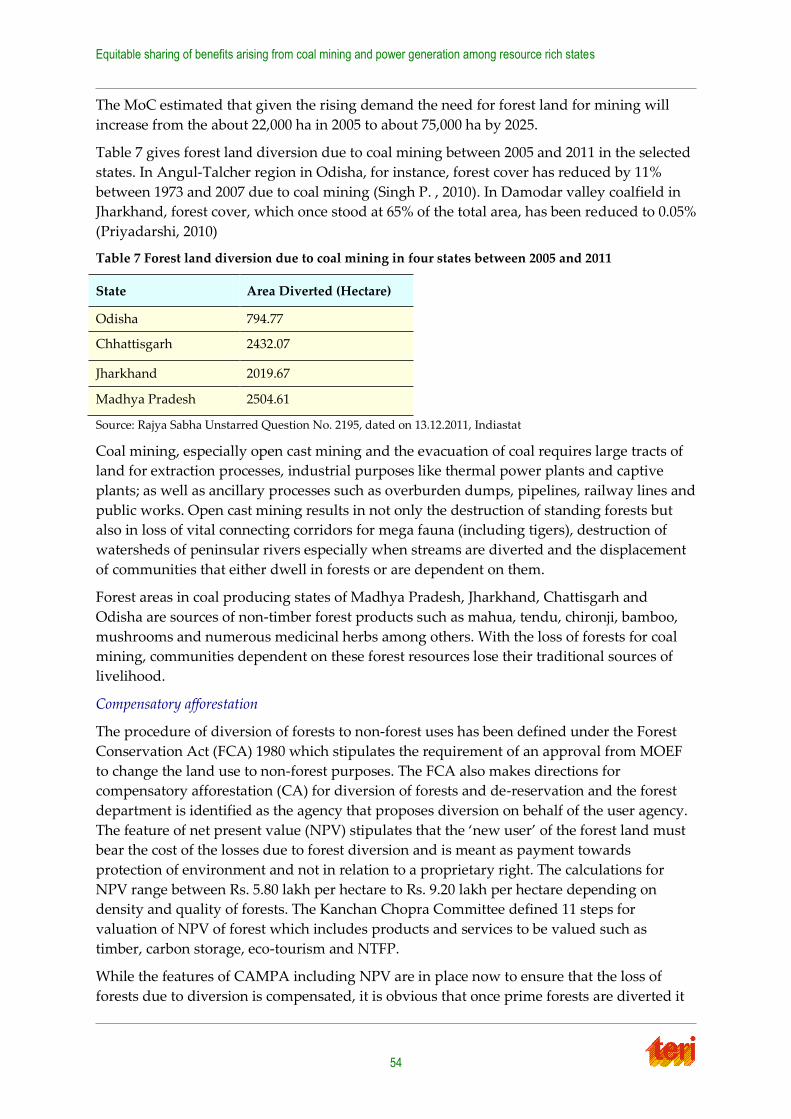
Equitable sharing of benefits arising from coal mining and power generation among resource rich states
54
The MoC estimated that given the rising demand the need for forest land for mining will
increase from the about 22,000 ha in 2005 to about 75,000 ha by 2025.
Table 7 gives forest land diversion due to coal mining between 2005 and 2011 in the selected
states. In Angul-Talcher region in Odisha, for instance, forest cover has reduced by 11%
between 1973 and 2007 due to coal mining (Singh P. , 2010). In Damodar valley coalfield in
Jharkhand, forest cover, which once stood at 65% of the total area, has been reduced to 0.05%
(Priyadarshi, 2010)
Table 7 Forest land diversion due to coal mining in four states between 2005 and 2011
State Area Diverted (Hectare)
Odisha 794.77
Chhattisgarh 2432.07
Jharkhand 2019.67
Madhya Pradesh 2504.61
Source: Rajya Sabha Unstarred Question No. 2195, dated on 13.12.2011, Indiastat
Coal mining, especially open cast mining and the evacuation of coal requires large tracts of
land for extraction processes, industrial purposes like thermal power plants and captive
plants; as well as ancillary processes such as overburden dumps, pipelines, railway lines and
public works. Open cast mining results in not only the destruction of standing forests but
also in loss of vital connecting corridors for mega fauna (including tigers), destruction of
watersheds of peninsular rivers especially when streams are diverted and the displacement
of communities that either dwell in forests or are dependent on them.
Forest areas in coal producing states of Madhya Pradesh, Jharkhand, Chattisgarh and
Odisha are sources of non-timber forest products such as mahua, tendu, chironji, bamboo,
mushrooms and numerous medicinal herbs among others. With the loss of forests for coal
mining, communities dependent on these forest resources lose their traditional sources of
livelihood.
Compensatory afforestation
The procedure of diversion of forests to non-forest uses has been defined under the Forest
Conservation Act (FCA) 1980 which stipulates the requirement of an approval from MOEF
to change the land use to non-forest purposes. The FCA also makes directions for
compensatory afforestation (CA) for diversion of forests and de-reservation and the forest
department is identified as the agency that proposes diversion on behalf of the user agency.
The feature of net present value (NPV) stipulates that the ‘new user’ of the forest land must
bear the cost of the losses due to forest diversion and is meant as payment towards
protection of environment and not in relation to a proprietary right. The calculations for
NPV range between Rs. 5.80 lakh per hectare to Rs. 9.20 lakh per hectare depending on
density and quality of forests. The Kanchan Chopra Committee defined 11 steps for
valuation of NPV of forest which includes products and services to be valued such as
timber, carbon storage, eco-tourism and NTFP.
While the features of CAMPA including NPV are in place now to ensure that the loss of
forests due to diversion is compensated, it is obvious that once prime forests are diverted it
3. Assessment of negative externalities from coal mining and coal based power generation
55
is almost impossible to restore the same level of species diversity, canopy cover, carbon
sequestration potential, wildlife habitats and watershed capacities among other
characteristics that are unique to a forest area. In some cases the contrast between diverted
forests and the compensatory afforestation areas is stark especially when the diverted forest
was dense forest and the new afforestation includes plantations that may not be appropriate
for those watersheds and climatic zones (such as the Eucalyptus plantations by NCL in MP).
Moreover, there is a lack of assessment of the biodiversity created and ecosystem services
generated in the afforested areas. It has been pointed out that diversion of forest land for
compensatory afforestation has social impacts as it results in dual displacement of two
different sets of people from their common lands without consultation, compensation, or the
provision of alternatives. 12
Coal blocks are allocated by the Ministry of Coal (MoC) and the role of Ministry of
Environment and Forest (MoEF) and state departments has been limited to approvals and
clearances for mining purposes instead of being one of the deciding entities for the allocation
of forest land to industrial purposes. The outcomes of forested coal block allocation seem to
be based on political and strategic factors instead of scientific principles. For instance, if the
plant which is to be linked with the coal mine gets commissioned before the mining
operations go live, there is an automatic pressure on the state administrative machinery as
well as the forest clearance system to expedite procedures and give an approval despite loss
of forests to avoid sunk costs of the public or private investments.
Utilization of CAMPA funds
As per TERI’s calculation based on forest land diversion, rates of compensatory
afforestation, and rate of contribution towards NPV, a total of Rs. 4.7 billion should have
been made available to the four states during 2005 and 2011 to compensate for the losses
resulting from forest diversion due to coal mining (see Table 8). However, there are
questions being raised with respect to the availability of these funds to the state and their
utilization to address the losses.
Stakeholder consultations in states of Odisha and Jharkhand have revealed that the biggest
challenge for states to undertake compensatory afforestation is the non-availability of land
to afforest especially in the vicinity of existing forest areas (which is the stipulation by the
FCA) and even in other districts where afforestation could be possible.
12 Madhu Sarin, background paper of the Task Force on Natural Resources, Centre state Relations Committee
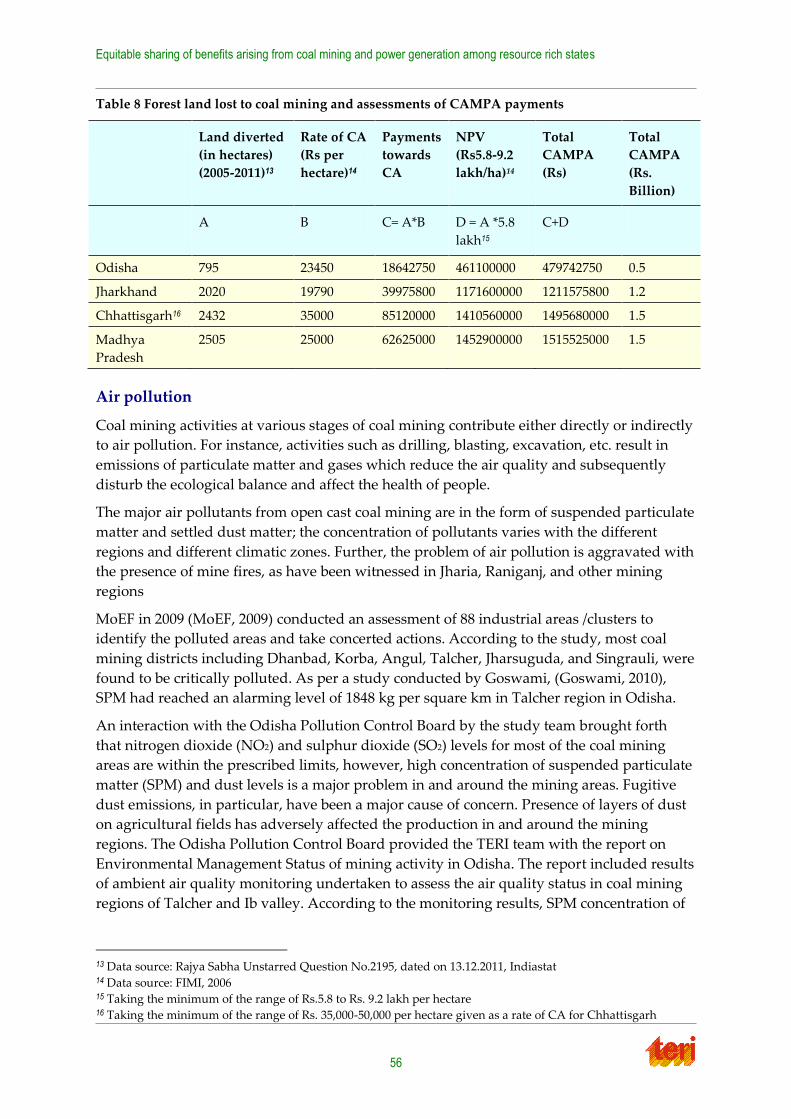
Equitable sharing of benefits arising from coal mining and power generation among resource rich states
56
Table 8 Forest land lost to coal mining and assessments of CAMPA payments
Land diverted
(in hectares)
(2005-2011)13
Rate of CA
(Rs per
hectare)14
Payments
towards
CA
NPV
(Rs5.8-9.2
lakh/ha)14
Total
CAMPA
(Rs)
Total
CAMPA
(Rs.
Billion)
A B C= A*B D = A *5.8
lakh15
C+D
Odisha 795 23450 18642750 461100000 479742750 0.5
Jharkhand 2020 19790 39975800 1171600000 1211575800 1.2
Chhattisgarh16 2432 35000 85120000 1410560000 1495680000 1.5
Madhya
Pradesh
2505 25000 62625000 1452900000 1515525000 1.5
Air pollution
Coal mining activities at various stages of coal mining contribute either directly or indirectly
to air pollution. For instance, activities such as drilling, blasting, excavation, etc. result in
emissions of particulate matter and gases which reduce the air quality and subsequently
disturb the ecological balance and affect the health of people.
The major air pollutants from open cast coal mining are in the form of suspended particulate
matter and settled dust matter; the concentration of pollutants varies with the different
regions and different climatic zones. Further, the problem of air pollution is aggravated with
the presence of mine fires, as have been witnessed in Jharia, Raniganj, and other mining
regions
MoEF in 2009 (MoEF, 2009) conducted an assessment of 88 industrial areas /clusters to
identify the polluted areas and take concerted actions. According to the study, most coal
mining districts including Dhanbad, Korba, Angul, Talcher, Jharsuguda, and Singrauli, were
found to be critically polluted. As per a study conducted by Goswami, (Goswami, 2010),
SPM had reached an alarming level of 1848 kg per square km in Talcher region in Odisha.
An interaction with the Odisha Pollution Control Board by the study team brought forth
that nitrogen dioxide (NO2) and sulphur dioxide (SO2) levels for most of the coal mining
areas are within the prescribed limits, however, high concentration of suspended particulate
matter (SPM) and dust levels is a major problem in and around the mining areas. Fugitive
dust emissions, in particular, have been a major cause of concern. Presence of layers of dust
on agricultural fields has adversely affected the production in and around the mining
regions. The Odisha Pollution Control Board provided the TERI team with the report on
Environmental Management Status of mining activity in Odisha. The report included results
of ambient air quality monitoring undertaken to assess the air quality status in coal mining
regions of Talcher and Ib valley. According to the monitoring results, SPM concentration of
13 Data source: Rajya Sabha Unstarred Question No.2195, dated on 13.12.2011, Indiastat 14 Data source: FIMI, 2006 15 Taking the minimum of the range of Rs.5.8 to Rs. 9.2 lakh per hectare 16 Taking the minimum of the range of Rs. 35,000-50,000 per hectare given as a rate of CA for Chhattisgarh
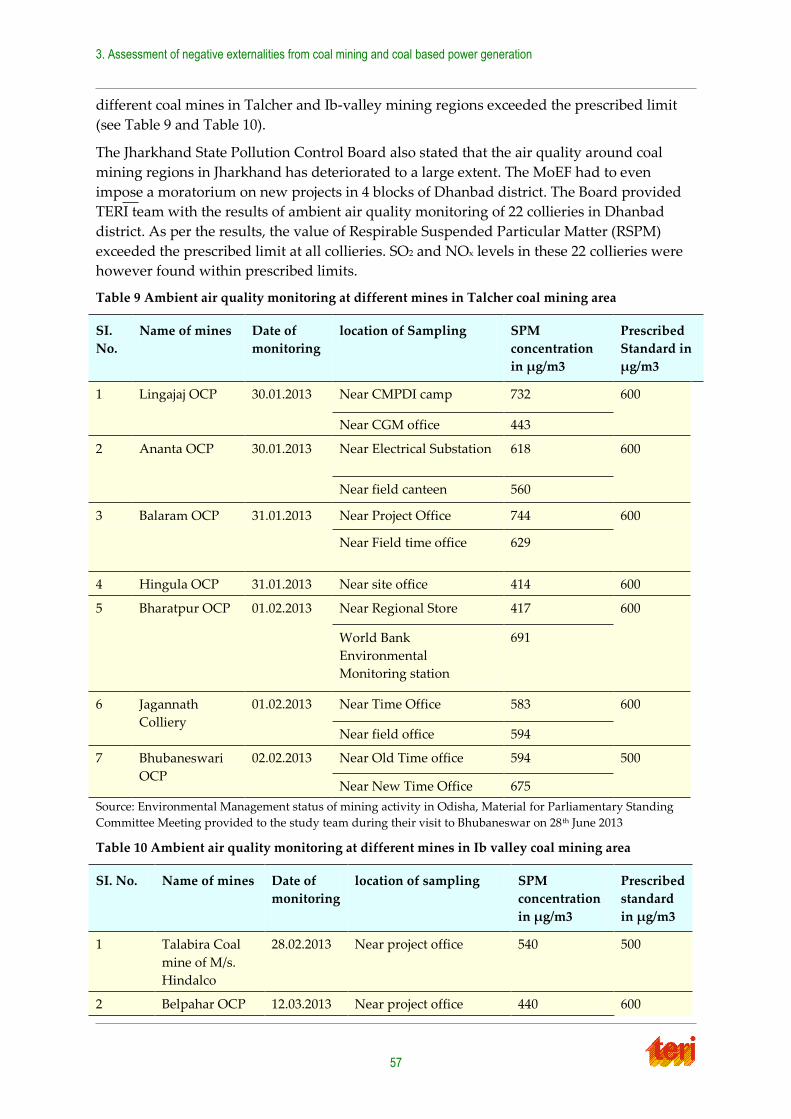
3. Assessment of negative externalities from coal mining and coal based power generation
57
different coal mines in Talcher and Ib-valley mining regions exceeded the prescribed limit
(see Table 9 and Table 10).
The Jharkhand State Pollution Control Board also stated that the air quality around coal
mining regions in Jharkhand has deteriorated to a large extent. The MoEF had to even
impose a moratorium on new projects in 4 blocks of Dhanbad district. The Board provided
TERI team with the results of ambient air quality monitoring of 22 collieries in Dhanbad
district. As per the results, the value of Respirable Suspended Particular Matter (RSPM)
exceeded the prescribed limit at all collieries. SO2 and NOx levels in these 22 collieries were
however found within prescribed limits.
Table 9 Ambient air quality monitoring at different mines in Talcher coal mining area
SI.
No.
Name of mines Date of
monitoring
location of Sampling SPM
concentration
in µg/m3
Prescribed
Standard in
µg/m3
1 Lingajaj OCP 30.01.2013 Near CMPDI camp 732 600
Near CGM office 443
2 Ananta OCP 30.01.2013 Near Electrical Substation 618 600
Near field canteen 560
3 Balaram OCP 31.01.2013 Near Project Office 744 600
Near Field time office 629
4 Hingula OCP 31.01.2013 Near site office 414 600
5 Bharatpur OCP 01.02.2013 Near Regional Store 417 600
World Bank
Environmental
Monitoring station
691
6 Jagannath
Colliery
01.02.2013 Near Time Office 583 600
Near field office 594
7 Bhubaneswari
OCP
02.02.2013 Near Old Time office 594 500
Near New Time Office 675
Source: Environmental Management status of mining activity in Odisha, Material for Parliamentary Standing
Committee Meeting provided to the study team during their visit to Bhubaneswar on 28th June 2013
Table 10 Ambient air quality monitoring at different mines in Ib valley coal mining area
SI. No. Name of mines Date of
monitoring
location of sampling SPM
concentration
in µg/m3
Prescribed
standard
in µg/m3
1 Talabira Coal
mine of M/s.
Hindalco
28.02.2013 Near project office 540 500
2 Belpahar OCP 12.03.2013 Near project office 440 600
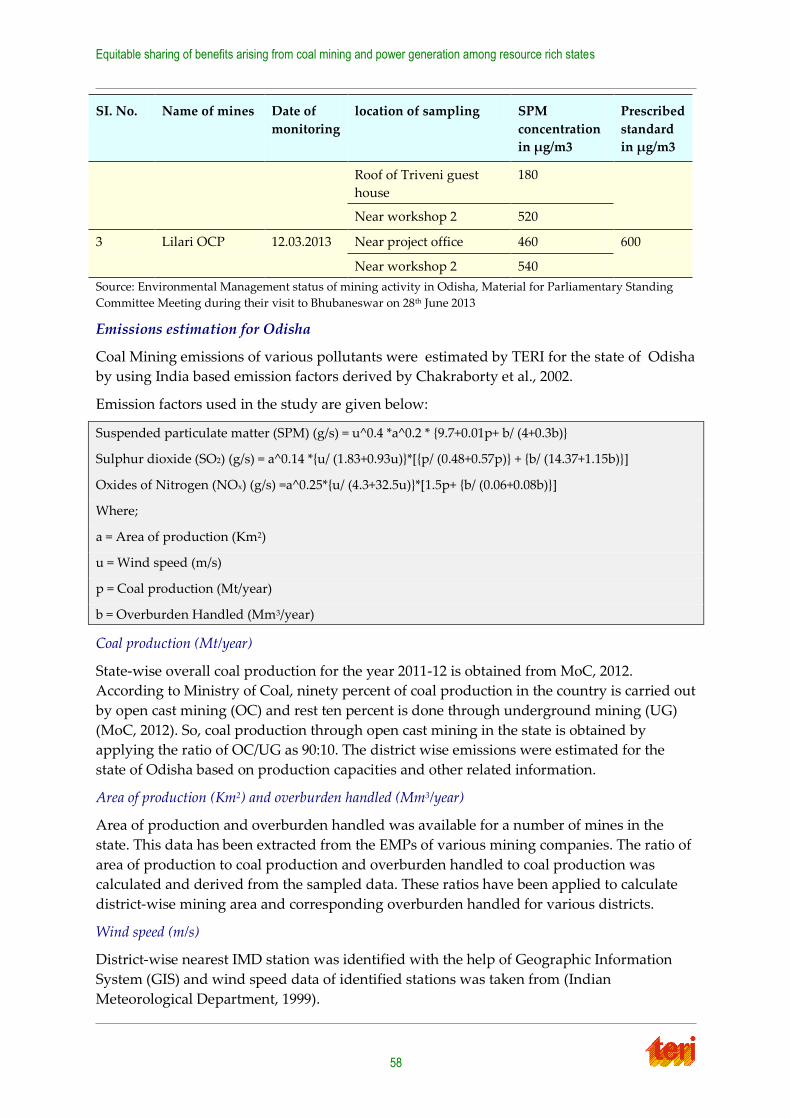
Equitable sharing of benefits arising from coal mining and power generation among resource rich states
58
SI. No. Name of mines Date of
monitoring
location of sampling SPM
concentration
in µg/m3
Prescribed
standard
in µg/m3
Roof of Triveni guest
house
180
Near workshop 2 520
3 Lilari OCP 12.03.2013 Near project office 460 600
Near workshop 2 540
Source: Environmental Management status of mining activity in Odisha, Material for Parliamentary Standing
Committee Meeting during their visit to Bhubaneswar on 28th June 2013
Emissions estimation for Odisha
Coal Mining emissions of various pollutants were estimated by TERI for the state of Odisha
by using India based emission factors derived by Chakraborty et al., 2002.
Emission factors used in the study are given below:
Suspended particulate matter (SPM) (g/s) = u^0.4 *a^0.2 * {9.7+0.01p+ b/ (4+0.3b)}
Sulphur dioxide (SO2) (g/s) = a^0.14 *{u/ (1.83+0.93u)}*[{p/ (0.48+0.57p)} + {b/ (14.37+1.15b)}]
Oxides of Nitrogen (NOx) (g/s) =a^0.25*{u/ (4.3+32.5u)}*[1.5p+ {b/ (0.06+0.08b)}]
Where;
a = Area of production (Km2)
u = Wind speed (m/s)
p = Coal production (Mt/year)
b = Overburden Handled (Mm3/year)
Coal production (Mt/year)
State-wise overall coal production for the year 2011-12 is obtained from MoC, 2012.
According to Ministry of Coal, ninety percent of coal production in the country is carried out
by open cast mining (OC) and rest ten percent is done through underground mining (UG)
(MoC, 2012). So, coal production through open cast mining in the state is obtained by
applying the ratio of OC/UG as 90:10. The district wise emissions were estimated for the
state of Odisha based on production capacities and other related information.
Area of production (Km2) and overburden handled (Mm3/year)
Area of production and overburden handled was available for a number of mines in the
state. This data has been extracted from the EMPs of various mining companies. The ratio of
area of production to coal production and overburden handled to coal production was
calculated and derived from the sampled data. These ratios have been applied to calculate
district-wise mining area and corresponding overburden handled for various districts.
Wind speed (m/s)
District-wise nearest IMD station was identified with the help of Geographic Information
System (GIS) and wind speed data of identified stations was taken from (Indian
Meteorological Department, 1999).
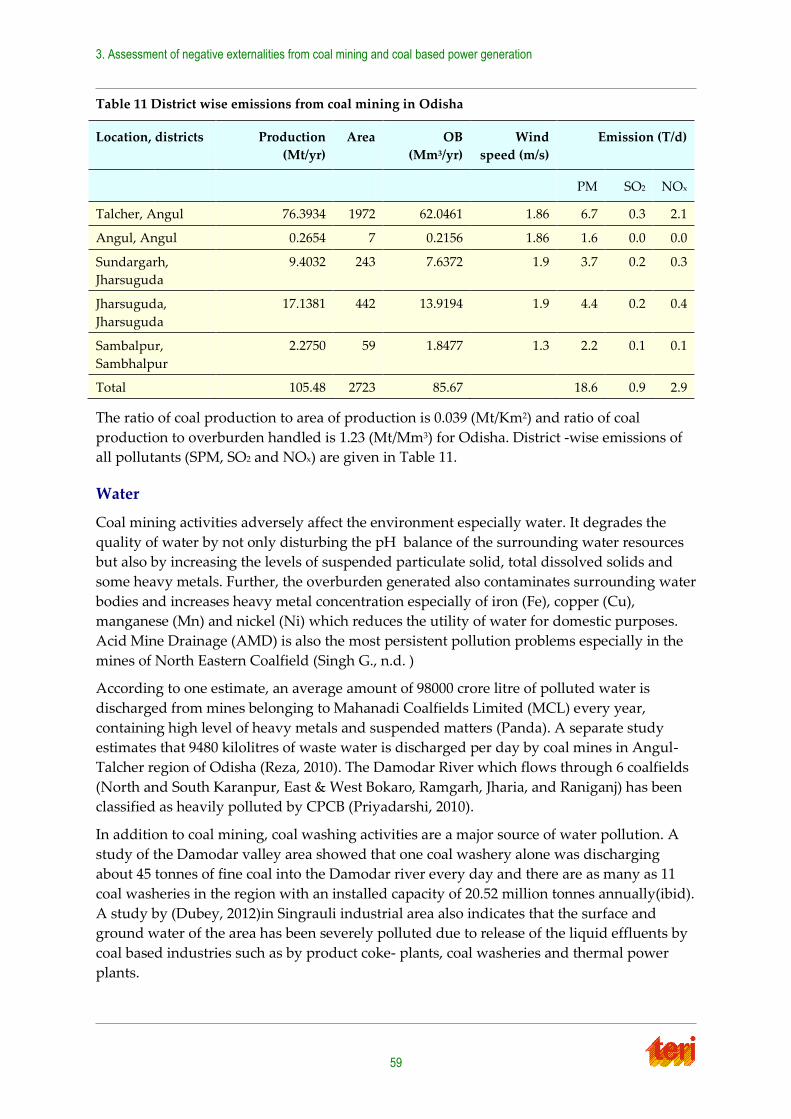
3. Assessment of negative externalities from coal mining and coal based power generation
59
Table 11 District wise emissions from coal mining in Odisha
Location, districts Production
(Mt/yr)
Area OB
(Mm3/yr)
Wind
speed (m/s)
Emission (T/d)
PM SO2 NOx
Talcher, Angul 76.3934 1972 62.0461 1.86 6.7 0.3 2.1
Angul, Angul 0.2654 7 0.2156 1.86 1.6 0.0 0.0
Sundargarh,
Jharsuguda
9.4032 243 7.6372 1.9 3.7 0.2 0.3
Jharsuguda,
Jharsuguda
17.1381 442 13.9194 1.9 4.4 0.2 0.4
Sambalpur,
Sambhalpur
2.2750 59 1.8477 1.3 2.2 0.1 0.1
Total 105.48 2723 85.67 18.6 0.9 2.9
The ratio of coal production to area of production is 0.039 (Mt/Km2) and ratio of coal
production to overburden handled is 1.23 (Mt/Mm3) for Odisha. District -wise emissions of
all pollutants (SPM, SO2 and NOx) are given in Table 11.
Water
Coal mining activities adversely affect the environment especially water. It degrades the
quality of water by not only disturbing the pH balance of the surrounding water resources
but also by increasing the levels of suspended particulate solid, total dissolved solids and
some heavy metals. Further, the overburden generated also contaminates surrounding water
bodies and increases heavy metal concentration especially of iron (Fe), copper (Cu),
manganese (Mn) and nickel (Ni) which reduces the utility of water for domestic purposes.
Acid Mine Drainage (AMD) is also the most persistent pollution problems especially in the
mines of North Eastern Coalfield (Singh G., n.d. )
According to one estimate, an average amount of 98000 crore litre of polluted water is
discharged from mines belonging to Mahanadi Coalfields Limited (MCL) every year,
containing high level of heavy metals and suspended matters (Panda). A separate study
estimates that 9480 kilolitres of waste water is discharged per day by coal mines in Angul-
Talcher region of Odisha (Reza, 2010). The Damodar River which flows through 6 coalfields
(North and South Karanpur, East & West Bokaro, Ramgarh, Jharia, and Raniganj) has been
classified as heavily polluted by CPCB (Priyadarshi, 2010).
In addition to coal mining, coal washing activities are a major source of water pollution. A
study of the Damodar valley area showed that one coal washery alone was discharging
about 45 tonnes of fine coal into the Damodar river every day and there are as many as 11
coal washeries in the region with an installed capacity of 20.52 million tonnes annually(ibid).
A study by (Dubey, 2012)in Singrauli industrial area also indicates that the surface and
ground water of the area has been severely polluted due to release of the liquid effluents by
coal based industries such as by product coke- plants, coal washeries and thermal power
plants.
Equitable sharing of benefits arising from coal mining and power generation among resource rich states
60
Pollution of water due to coal mining activities has resulted in severe impact on local
communities. In the Singrauli district of Madhya Pradesh, for instance, a high incidence of
white spots, skin infections and lumps of dead skin has been reported. A high percentage of
gastro-intestinal parasitic infection has also been found in the focal sample of cattle in the
village affected by effluents from coal based industries and coal mining (Dubey, 2012).
Availability of water is also a concern as mining activities require large quantities of water.
According to (Reza, 2010), an average of 86.26 million cubic meters per annum is drawn
from the river for industry/mining activity in Angul-Talcher region of Odisha. Many coal
mining regions are reported to confront the problem of over exploitation of ground water
resources resulting in alarming lowering of water table. However, these findings are in
contrast to inputs drawn from consultations with Department of Water in Odisha. As per
the department, ground water consumption for coal mining activities is quite low as
compared to other industrial activities. They also pointed out that coal mines are prohibited
to use ground water and have to source water from other available sources of surface water.
This, however, does not take into account ground water extraction which accumulates in
unconfined aquifers which result in loss of water in surrounding wells.
The interactions with the water department and other stakeholders in Odisha however
brought forth the problem of generation of waste water and pollution of adjoining water
bodies as a result of coal mining. Similar concerns of water pollution were also raised during
interaction with SPCB of Jharkhand.
Jharkhand State Pollution Control Board provided the TERI team with reports on water
quality of 13 rivers for the month of February, March, and April and reports of drain water
of 37 sampling locations. In the case of river water analysis report, most of the parameters
determining the quality of river were found within prescribed limits. Only in the case of
Garga River near Telmucho Bridge, Bokaro in Jharkhand, the BOD level was found beyond
the prescribed limit of 3 mg/l for the month of March and April 2013. In the month of March,
it was estimated at 7.2 mg/l and for April, it was estimated at 6.4 mg/l. The final report on
abatement of pollution of Damodar River System shows a clear need for treatment of water
in all the drains flowing into the Damodar, although most of these drains carry waste from
the mine area as well as domestic waste. Therefore, attributing water pollution to only from
mines in these cases could be misleading. The report reproduces in the Annexure. However,
in case of thermal power stations like Patratu, Bokaro, Santhaldih and Durgapur TPS JSPCB
report clearly mentions need for treatment of water which is released from these stations on
account of out-of-range levels of BOD, COD and TS.
Odisha Pollution Control Board provided the study team with the report on Environmental
Management Status of mining activity in Odisha. The report entailed results from the
monitoring of waste water quality of different coal mines in Talcher and Ib-valley area.
According to the findings, all the 3 parameters determining water quality of mine drainage-
pH level, suspended solids, and oil and grease level, were found within the prescribed limits
set by CPCB. However, information on the other parameters is absent. The tables showing
this information are reproduced in Table 58 and Table 59 in Annexure C.
CPCB in 2011 (CPCB, 2011) conducted an analysis based on monitoring water samples
collected from different coal mines in different areas of Madhya Pradesh and Chhattisgarh.
These samples were analysed for general parameters like pH, conductivity, chemical oxygen
3. Assessment of negative externalities from coal mining and coal based power generation
61
demand (COD), total suspended solids, total solids, fluoride, chloride, sulphate and nitrate.
Heavy metals like Lead (Pb), Chromium (Cr), Copper (Cu), Nickel (Ni), Cadmium, Zinc (Zn)
and Manganese (Mn) were also analysed. In addition, drain water samples were collected
and analysed. The impact of coal mine discharge on ground water and river water was
evaluated by collecting the representative samples from rivers and bore wells. The results of
the analysis of coal mine discharge water, ground water, drain water, and river water for
selected areas in Chhattisgarh are given in Table 49, Table 50, Table 51 and Table 52 (see
Annexure C Analysis of Water Quality) respectively. Similar results for Madhya Pradesh
and presented in Table 53, Table 54, Table 55, Table 56 and Table 57 (given in Annexure C).
According to the CPCB analysis, most of the parameters determining the quality of
discharge water, ground water, and river water were found within the prescribed limits. In
Chattisgarh, only the TSS exceeded the prescribed limit for few of the mines. In Madhya
Pradesh, only the sulphate, manganese, and fluoride exceeded the limit set for coal mining
discharge water (See Table 53 and Table 54 in Annexure C). Presence of heavy metals such
as lead, chromium, copper, nickel, cadmium, zinc, and manganese were also analysed, but
were found below the detection limit.
Thus, according to the monitoring data made available by SPCBs and CPCB, most of the
parameters determining the quality of water are within prescribed limits. However, this
contrasts with inputs drawn from primary consultations of the study team which point
towards a deterioration in quality of water due to coal mining. Given these contradictions,
nothing conclusively can be said about the state of water quality in coal mining regions in
the 4 states. A detailed water quality study in the coal belt is clearly required.
Land degradation
Mining activities create long lasting impact on the landscape. Open cast mining and allied
activities have been found to degrade the land significantly. The activities including
excavation, stacking of waste dumps, discharge from workshops, construction of tailing
ponds, etc. destroy the top soil and leave behind large tracts of degraded land. Coal mining
activities require big areas of land resulting in shrinking of cultivable lands and degradation
of local environment and ecology. Long period of opencast mining has created mountains of
over burden in these areas resulting in degradation of fertile land and also deterioration of
air quality/water quality and deposit of silt in the river bed.
Generation of large quantities of overburden waste leads to severe degradation of land. In
Dhanpuri open cast mine in the Shahdol district of Madhya Pradesh, for instance, coal
mining has led to large scale degradation of land primarily due to large overburden
generation. The large overburden generation is due to the availability of coal at higher
depths and the absence of use of underground mining technology to extract them.
Consequently, opencast mining technology is used, leading to large amounts of waste
generation.
The waste land in Angul region in Odisha has increased from 5% in 1973 to 28% in 2011
(Panwar, 2011). Another study by (Khan & Javed, 2012)shows that land use/land cover has
changed drastically during 1993-2010 in open cast mining area of Singrauli region due to
mining and industrial activities. Area under dense forest has declined by 6.7%, under
cultivable land by 2.9%, and under water bodies by 3%. The results of the study are given in
Table-7. In Jharia, a total of 75.77 square km area of land has been affected due to fire (17.32
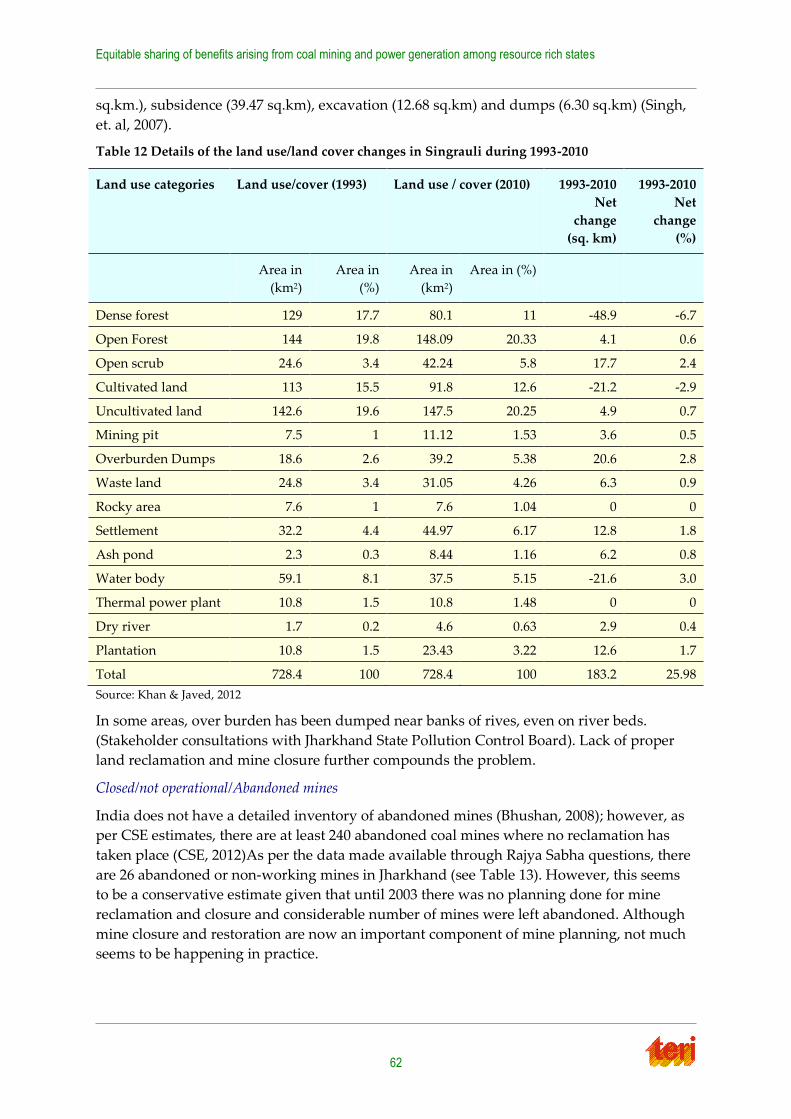
Equitable sharing of benefits arising from coal mining and power generation among resource rich states
62
sq.km.), subsidence (39.47 sq.km), excavation (12.68 sq.km) and dumps (6.30 sq.km) (Singh,
et. al, 2007).
Table 12 Details of the land use/land cover changes in Singrauli during 1993-2010
Land use categories Land use/cover (1993) Land use / cover (2010) 1993-2010
Net
change
(sq. km)
1993-2010
Net
change
(%)
Area in
(km2)
Area in
(%)
Area in
(km2)
Area in (%)
Dense forest 129 17.7 80.1 11 -48.9 -6.7
Open Forest 144 19.8 148.09 20.33 4.1 0.6
Open scrub 24.6 3.4 42.24 5.8 17.7 2.4
Cultivated land 113 15.5 91.8 12.6 -21.2 -2.9
Uncultivated land 142.6 19.6 147.5 20.25 4.9 0.7
Mining pit 7.5 1 11.12 1.53 3.6 0.5
Overburden Dumps 18.6 2.6 39.2 5.38 20.6 2.8
Waste land 24.8 3.4 31.05 4.26 6.3 0.9
Rocky area 7.6 1 7.6 1.04 0 0
Settlement 32.2 4.4 44.97 6.17 12.8 1.8
Ash pond 2.3 0.3 8.44 1.16 6.2 0.8
Water body 59.1 8.1 37.5 5.15 -21.6 3.0
Thermal power plant 10.8 1.5 10.8 1.48 0 0
Dry river 1.7 0.2 4.6 0.63 2.9 0.4
Plantation 10.8 1.5 23.43 3.22 12.6 1.7
Total 728.4 100 728.4 100 183.2 25.98
Source: Khan & Javed, 2012
In some areas, over burden has been dumped near banks of rives, even on river beds.
(Stakeholder consultations with Jharkhand State Pollution Control Board). Lack of proper
land reclamation and mine closure further compounds the problem.
Closed/not operational/Abandoned mines
India does not have a detailed inventory of abandoned mines (Bhushan, 2008); however, as
per CSE estimates, there are at least 240 abandoned coal mines where no reclamation has
taken place (CSE, 2012)As per the data made available through Rajya Sabha questions, there
are 26 abandoned or non-working mines in Jharkhand (see Table 13). However, this seems
to be a conservative estimate given that until 2003 there was no planning done for mine
reclamation and closure and considerable number of mines were left abandoned. Although
mine closure and restoration are now an important component of mine planning, not much
seems to be happening in practice.
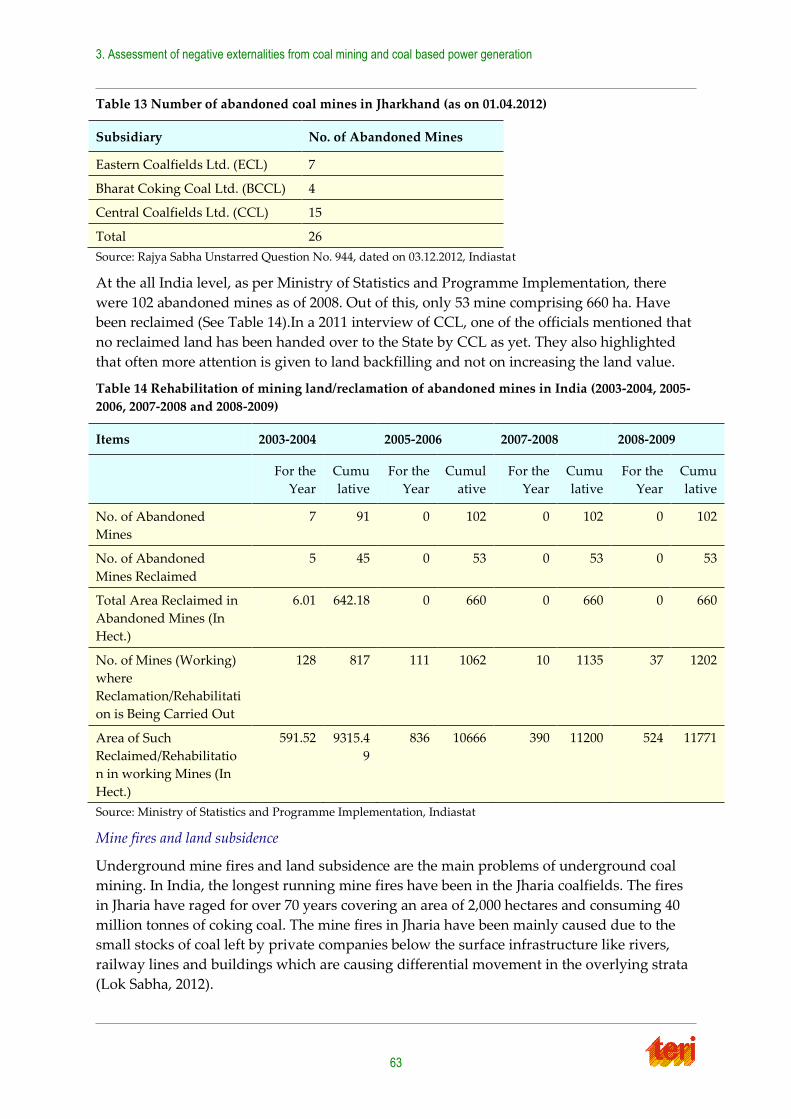
3. Assessment of negative externalities from coal mining and coal based power generation
63
Table 13 Number of abandoned coal mines in Jharkhand (as on 01.04.2012)
Subsidiary No. of Abandoned Mines
Eastern Coalfields Ltd. (ECL) 7
Bharat Coking Coal Ltd. (BCCL) 4
Central Coalfields Ltd. (CCL) 15
Total 26
Source: Rajya Sabha Unstarred Question No. 944, dated on 03.12.2012, Indiastat
At the all India level, as per Ministry of Statistics and Programme Implementation, there
were 102 abandoned mines as of 2008. Out of this, only 53 mine comprising 660 ha. Have
been reclaimed (See Table 14).In a 2011 interview of CCL, one of the officials mentioned that
no reclaimed land has been handed over to the State by CCL as yet. They also highlighted
that often more attention is given to land backfilling and not on increasing the land value.
Table 14 Rehabilitation of mining land/reclamation of abandoned mines in India (2003-2004, 2005-
2006, 2007-2008 and 2008-2009)
Items 2003-2004 2005-2006 2007-2008 2008-2009
For the
Year
Cumu
lative
For the
Year
Cumul
ative
For the
Year
Cumu
lative
For the
Year
Cumu
lative
No. of Abandoned
Mines
7 91 0 102 0 102 0 102
No. of Abandoned
Mines Reclaimed
5 45 0 53 0 53 0 53
Total Area Reclaimed in
Abandoned Mines (In
Hect.)
6.01 642.18 0 660 0 660 0 660
No. of Mines (Working)
where
Reclamation/Rehabilitati
on is Being Carried Out
128 817 111 1062 10 1135 37 1202
Area of Such
Reclaimed/Rehabilitatio
n in working Mines (In
Hect.)
591.52 9315.4
9
836 10666 390 11200 524 11771
Source: Ministry of Statistics and Programme Implementation, Indiastat
Mine fires and land subsidence
Underground mine fires and land subsidence are the main problems of underground coal
mining. In India, the longest running mine fires have been in the Jharia coalfields. The fires
in Jharia have raged for over 70 years covering an area of 2,000 hectares and consuming 40
million tonnes of coking coal. The mine fires in Jharia have been mainly caused due to the
small stocks of coal left by private companies below the surface infrastructure like rivers,
railway lines and buildings which are causing differential movement in the overlying strata
(Lok Sabha, 2012).
Equitable sharing of benefits arising from coal mining and power generation among resource rich states
64
The fires in Jharia have increased the threat of land subsidence, development of fissures,
land collapse, and formation of deep holes in the area. As per a BCCL report, some of the
fires had endangered production outlets, surface structures, railway lines, roads and
drainage channels (Priyadarshi, 2010). The fires have also resulted in gas poisoning, difficult
geo-mining conditions, sterilization of coal, and hindrance to production, explosions, and
damage to structure and adjacent properties (Singh, 2006).
As per a CSE 2008 report, 35000 houses in the town of Jharia are under ‘immediate threat’
from mine fires. In 2002, the Chief Minister of state mentioned that relocation of nearly 0.3
million people with approximately 0.1 million houses and other buildings had become
inevitable.
The Jharia Rehabilitation and Development Authority (JRDA) had been set up to facilitate
the rehabilitation. Total number of houses to be constructed is estimated at 79159 requiring
1504.99 ha. of land and the requirement of fund is estimated at Rs. 4780.60 crores. However,
it is reported that the residents of the place refused to shift to the new relocation sites as the
houses were small and there were no jobs available in the new sites as the people living near
the mine fire sites were dependent on the illegal trade that takes place there17.
Coal washing
Coal washing has various economic as well as environmental benefits. This has resulted in
increased demand for washed coal. Box-2 gives the various benefits that result from coal
washing and the policies adopted by the government to encourage the activity. However,
coal washing also results in negative environmental impacts locally. A large amount of
rejects are generated during washing. These rejects pose serious environmental hazards as
proper disposal grounds for these rejects do not exist in coalfields. The rejects are generally
dumped on the ground and hence lead to degradation of fertile land. These rejects are also
susceptible to spontaneous combustion leading to CO, CO2, and particulate emissions.
Moreover, wet washing is the most commonly adopted technology and is highly water
intensive. Coal washing plants with the capacity of 10 million tonnes per annum (mtpa)
generally require 2.5 million liters per day (MLD). By 2017, for a coal washing capacity of
100 mtpa, water requirements will rise up to be 25 MLD; sufficient for a population of
125,000 (Dutta & Pandey, 2011). In addition, water once used becomes highly polluted with
coal dust making disposal a problem. Effluents when discharged into water bodies may
cause serious harm to the local environment. This has been a major problem in the Damodar
River in Jharkhand and West Bengal.
Coal producing states argue that the burden of washing of coal and the consequent
environmental damage is for the coal bearing state to bear alone. The importing states, on
the other hand, it is argued, will have low smoke and low ash content coal to burn, resulting
in an environmental injustice to the former. The resource producing state is left to bear the
effects of pollution from washeries and/or from producing power from the rejected coal.
Coal washing also results in depletion of ground water and pollution from ash. The study
team was asked
17http://www.bloomberg.com/news/2013-01-09/india-said-to-speed-plan-to-save-300-billion-burning-coal-
mine.html
3. Assessment of negative externalities from coal mining and coal based power generation
65
‚If coal is a national resource, why are these 4-5 states left to bear the burden of all the ash? Let us
distribute the pollution also equitably.‛
Box 2 Benefits of coal washing
Coal washing helps improve the quality of coal, and thereby improve overall efficiency of power
plants. Washing helps in removing mud and stone, which otherwise would be transported along with
the coal, leading to higher transportation and greater particulate & other emissions. The Central Fuel
Research Institute in 2001 estimated that a reduction of ash content from 40% to 34% through
washing can help reduce fly ash by 8 million tonnes (Chand, 2008). Various studies have been done
to estimate the impact of coal washing on CO2 emissions in India:
A study by US DoE has estimated CO2 emission to reduce by as much as 11% due to use of washed
coal in India (Zamuda & Sharpe, 2007)
A 10% reduction in ash will reduce CO2 by 190 kg/kWh, which amounts to saving of 13 million tonnes
of carbon from existing plants and another 8 million tonnes when applied to plan capacity growth in
next 20 years (Mark, 2011).
CFRI has estimated that if coal is washed & ash content is reduced from 40% to 34%, CO2 emissions
would reduce by 23 million tonnes (Chand, 2008).
Current Scenario:
Use of washed thermal coal has increased many folds over the last 10 years. However, it is still a
small proportion of the total coal produced in India. As per MOSPI statistics, total installed capacity
of washeries in the country is around 131.24 Million tonne per year (MTY) a total of 52 washeries,
both PSUs and Private, were operating in the country.
Drivers of coal washing:
The Government of India has notified that that coal containing more than 34 per cent of ash needs to
be washed. The notification stipulates that unwashed coal cannot be transported beyond 1000 km.
Much of the washing capacity has been installed in response to regulation promulgated in 2001 by
MoEF.
Super critical steam parameters based power plants requiring lower ash coal are being set up.
Integrated mine washery projects are being encouraged, and the Government soon plans to introduce
the policy of washing all coal.
Washing of coal to produce cleaner power results in a distribution of environmental costs
from those living around power plants and consumers of power to those around coal mines
where the workers are located. This spatial allocation of environmental burdens is not
sufficiently discussed in debates on why CIL should be providing cleaner coal to power
plants. Critical Environment Pollution Index (CEPI) is a number given to the environmental
quality in a location. The index developed by CPCB in 2009 captures various dimensions of
environment quality including air, water and land in industrial areas. This index was
intended to act as an early warning tool that would help in categorizing the industrial
clusters/areas in terms of priority of planning needs for interventions for SPCBs.
We see from Box 3 below that a number of critically polluted areas occur in the 4 states
studies. However, many of the proposed TPPs are coming up in critically polluted clusters
(CEPI > 70, MOEF 2009) or in their vicinity. (Prayas, 2011))
Equitable sharing of benefits arising from coal mining and power generation among resource rich states
66
Box 3 Summary of key polluted areas
Social externalities
On discussing the impacts on local lives by specific externalities caused by coal mining with
the study team, the representatives of the various departments summarized the situation
follows:
“The effects of externalities differ from person to person and area to area.”
Social externalities from coal mining primarily include displacement of people, loss of
livelihood, and negative impact on the health of communities residing near the mining
regions.
Health and safety
Coal mining operations pose safety and health hazards for mine workers and communities
at large, some of which include inhalation of dust, toxic fumes and gases; exposure to
radiation and toxic metals; noise induced hearing loss; heat stroke; exhaustion etc. Local
communities residing near mining regions suffer from environmental impact of coal mining
activities including water scarcity, air pollution, water pollution, etc. Most of the coal mining
regions are found to be critically polluted as per the study conducted by MoEF in 2009
(MoEF, 2009). These environmental impacts lead to severe health implications for
communities residing near the area. People in coal mining areas suffer from air/water borne
diseases like diarrhoea, skin complications, asthma, typhoid, etc. and also from some more
critical ailments such as tuberculosis, cancer and bronchitis.
In Odisha, pollution due to fluoride has led to increased incidence of spots over the body,
incurable skin infections and lumps of dead skin (Panda, n.d). Some of the diseases caused
by air and water pollution in the Talcher mining area in Odisha are given in Table 15. In
Chhattisgarh, the impact of pollution on health has been so adverse that local communities
have been forced to migrate in many cases (Chhattisgarh Human Development Report,
2005).
Singrauli, Madhya Pradesh
Critically polluted area with Critical Environment Pollution Index (CEPI) of 81.73, (MOEF) ground
water pollution in coal mining, almost all coal blocks allocated are located in forest areas
Talcher, Odisha
Critically polluted area with Critical Environment Pollution Index of 82.09, (MOEF) Detrimental to
land use pattern – significant decrease in forest cover and agricultural land due to mining, barren
land has increased, Wildlife corridor threatened – Tiger reserves
Jharia, Jharkhand
Orphan mines, land degradation, mine fire, Coal theft & Illegal mining, and Water pollution
(Tiwary and Dhar 2006, Field observations)
Korba, Chhattisgarh
Critically polluted area with Critical Environment Pollution Index of 83, (MOEF) Displacement of
indigenous population, air pollution
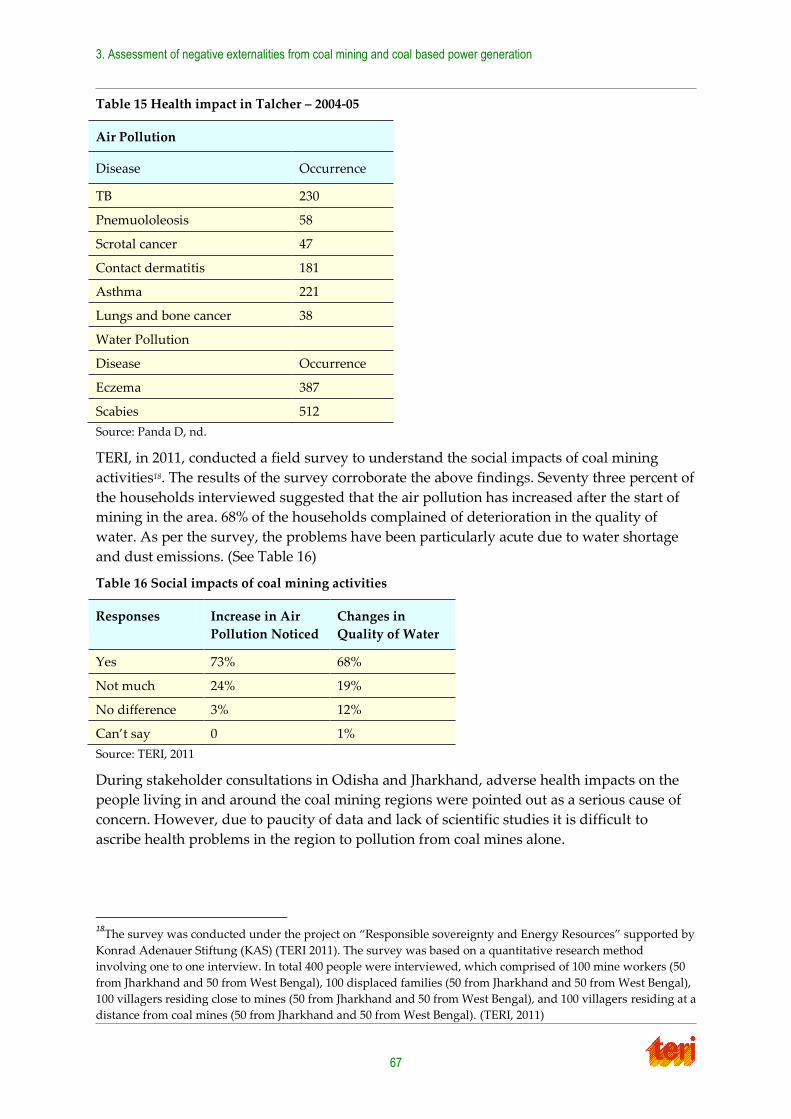
3. Assessment of negative externalities from coal mining and coal based power generation
67
Table 15 Health impact in Talcher – 2004-05
Air Pollution
Disease Occurrence
TB 230
Pnemuololeosis 58
Scrotal cancer 47
Contact dermatitis 181
Asthma 221
Lungs and bone cancer 38
Water Pollution
Disease Occurrence
Eczema 387
Scabies 512
Source: Panda D, nd.
TERI, in 2011, conducted a field survey to understand the social impacts of coal mining
activities18. The results of the survey corroborate the above findings. Seventy three percent of
the households interviewed suggested that the air pollution has increased after the start of
mining in the area. 68% of the households complained of deterioration in the quality of
water. As per the survey, the problems have been particularly acute due to water shortage
and dust emissions. (See Table 16)
Table 16 Social impacts of coal mining activities
Responses Increase in Air
Pollution Noticed
Changes in
Quality of Water
Yes 73% 68%
Not much 24% 19%
No difference 3% 12%
Can’t say 0 1%
Source: TERI, 2011
During stakeholder consultations in Odisha and Jharkhand, adverse health impacts on the
people living in and around the coal mining regions were pointed out as a serious cause of
concern. However, due to paucity of data and lack of scientific studies it is difficult to
ascribe health problems in the region to pollution from coal mines alone.
18
The survey was conducted under the project on ‚Responsible sovereignty and Energy Resources‛ supported by
Konrad Adenauer Stiftung (KAS) (TERI 2011). The survey was based on a quantitative research method
involving one to one interview. In total 400 people were interviewed, which comprised of 100 mine workers (50
from Jharkhand and 50 from West Bengal), 100 displaced families (50 from Jharkhand and 50 from West Bengal),
100 villagers residing close to mines (50 from Jharkhand and 50 from West Bengal), and 100 villagers residing at a
distance from coal mines (50 from Jharkhand and 50 from West Bengal). (TERI, 2011)
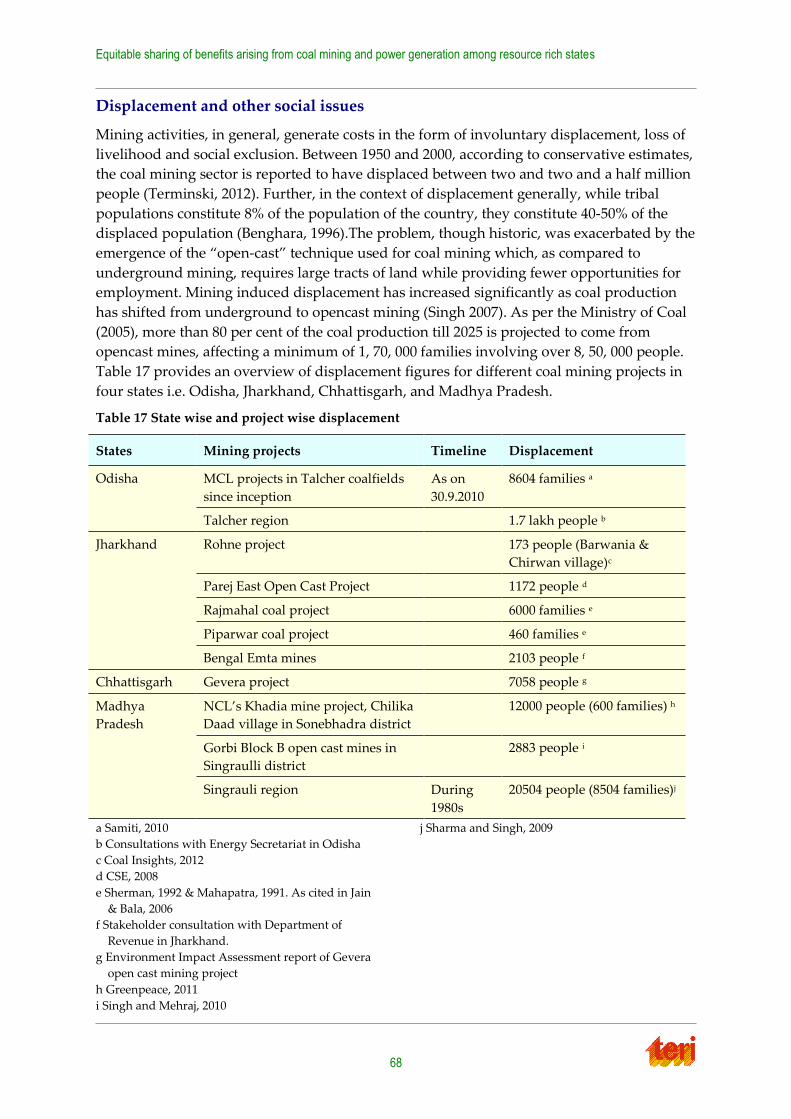
Equitable sharing of benefits arising from coal mining and power generation among resource rich states
68
Displacement and other social issues
Mining activities, in general, generate costs in the form of involuntary displacement, loss of
livelihood and social exclusion. Between 1950 and 2000, according to conservative estimates,
the coal mining sector is reported to have displaced between two and two and a half million
people (Terminski, 2012). Further, in the context of displacement generally, while tribal
populations constitute 8% of the population of the country, they constitute 40-50% of the
displaced population (Benghara, 1996).The problem, though historic, was exacerbated by the
emergence of the ‚open-cast‛ technique used for coal mining which, as compared to
underground mining, requires large tracts of land while providing fewer opportunities for
employment. Mining induced displacement has increased significantly as coal production
has shifted from underground to opencast mining (Singh 2007). As per the Ministry of Coal
(2005), more than 80 per cent of the coal production till 2025 is projected to come from
opencast mines, affecting a minimum of 1, 70, 000 families involving over 8, 50, 000 people.
Table 17 provides an overview of displacement figures for different coal mining projects in
four states i.e. Odisha, Jharkhand, Chhattisgarh, and Madhya Pradesh.
Table 17 State wise and project wise displacement
States Mining projects Timeline Displacement
Odisha MCL projects in Talcher coalfields
since inception
As on
30.9.2010
8604 families a
Talcher region 1.7 lakh people b
Jharkhand Rohne project 173 people (Barwania &
Chirwan village)c
Parej East Open Cast Project 1172 people d
Rajmahal coal project 6000 families e
Piparwar coal project 460 families e
Bengal Emta mines 2103 people f
Chhattisgarh Gevera project 7058 people g
Madhya
Pradesh
NCL’s Khadia mine project, Chilika
Daad village in Sonebhadra district
12000 people (600 families) h
Gorbi Block B open cast mines in
Singraulli district
2883 people i
Singrauli region During
1980s
20504 people (8504 families)j
a Samiti, 2010
b Consultations with Energy Secretariat in Odisha
c Coal Insights, 2012
d CSE, 2008
e Sherman, 1992 & Mahapatra, 1991. As cited in Jain
& Bala, 2006
f Stakeholder consultation with Department of
Revenue in Jharkhand.
g Environment Impact Assessment report of Gevera
open cast mining project
h Greenpeace, 2011
i Singh and Mehraj, 2010
j Sharma and Singh, 2009
3. Assessment of negative externalities from coal mining and coal based power generation
69
Moreover, the effect of the ‚resource curse‛ is well established in coal mining regions.
Shahdol in Madhya Pradesh, Dhanbad in Jharkhand, Sambalpur in Odisha and Karimnagar
in Andhra Pradesh are among the top coal-producing districts in the country. Yet each one
of these districts was identified as one of the 250 most impoverished districts in the country
in 2006; they all continue to receive assistance from the Backward Regions Grant Fund
Programme. As per a TERI perception survey conducted in 2011 in coal mining regions of
Jharkhand and West Bengal19, only around one fourth of the total households interviewed
witnessed an increase in income. Thirty percent witnessed no impact on the income levels,
while forty six percent suffered a decline in income.
This is a result of inadequate delivery of resettlement and rehabilitation benefits. In Odisha,
for instance, out of 8604 families which are displaced due to MCL projects in Talcher
coalfield, only about 5542 families i.e. about 64 % of the total have received any resettlement
benefits as of 30.9.2010 (Samiti 2010). Similarly, in Singrauli (Madhya Pradesh), out of 8504
families displaced during 1980s due to various coal mining and power projects, only 4563
families (i.e. 55% of the total) have received resettlement benefits (Sharma and Singh 2009).
According to the TERI perception survey of 2011, displaced communities had to wait 13
years, on average, for compensation.
Moreover, mining leads to destruction of common property resources (common grazing
land, common pond etc.) which are the basis for survival of village people, landless tribes,
women and other groups. No attempts are made to enumerate these resources, value them,
establish income from them, or provide a basis for compensation. The neglect of these issues
has created space for coal theft, pilferages, and illegal mining. There are various instances
where people who earlier depended on common property resources for their livelihoods,
have now turned to scavenging, stealing, and pilfering of coal due to
destruction/degradation of these resources due to coal mining. Conversion of land for
afforestation purposes under CAMPA can also led to loss of common lands as pointed out
before.
One of the most egregious legacies of coal mining displacement is that it results in the
worsening of the condition of already vulnerable groups. Women and children are more
adversely affected than men, who are more mobile and manage to get employment
elsewhere. The larger share of people displaced in coal rich states are tribal populations as
they comprise large shares of the population of these states; this, despite estimates of the
effect on tribal populations being incomplete and despite tribal land ownership ostensibly
receiving special Constitutional and legislative protection. In response to a Lok Sabha
question in December 2012, the mines given in Box-3 were identified as having dislocated
local /tribal people.
Discussions with state government officials revealed that a District Collector spends 12-14
hours each week dealing with coal-related social issues. A lot of time is spent in convincing
people to relocate. The issues relating to dealing with people are not only because they have
lost their natural livelihood options but they also suffer from significant health diseases due
to air and water pollution. As an estimate, the team was told, mining projects need
approximately 10-15% more managerial time and effort than other projects
19 TERI, 2011
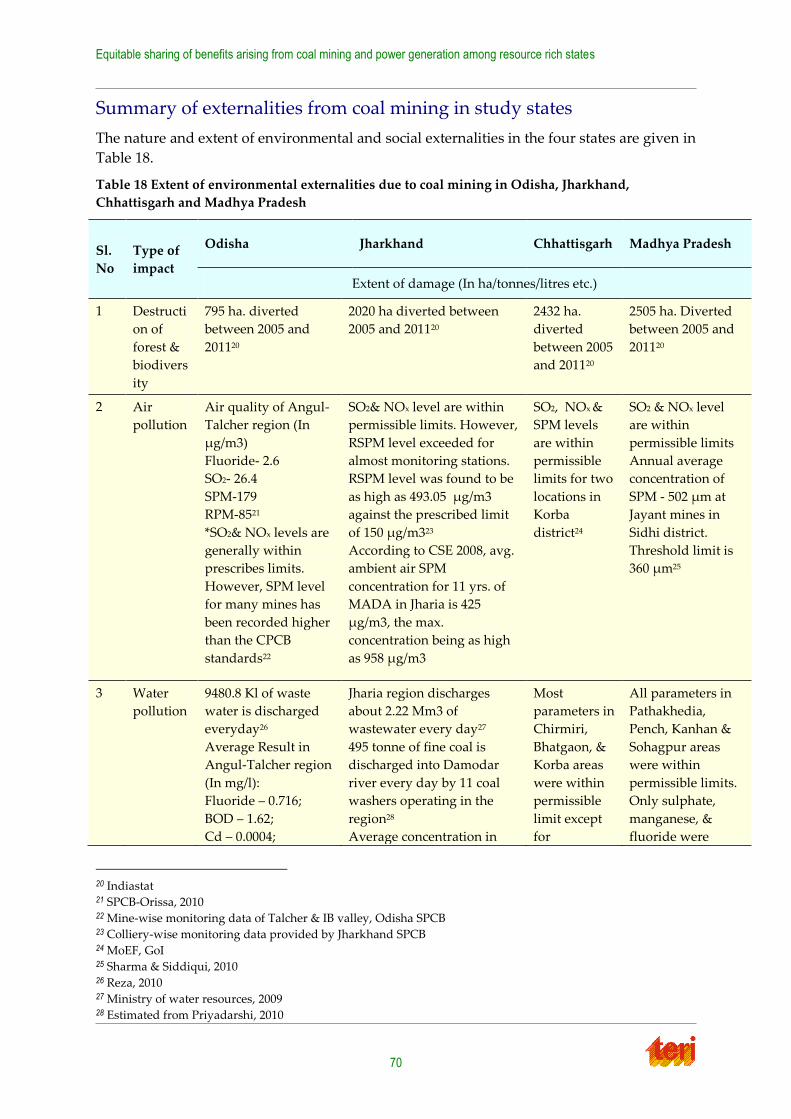
Equitable sharing of benefits arising from coal mining and power generation among resource rich states
70
Summary of externalities from coal mining in study states
The nature and extent of environmental and social externalities in the four states are given in
Table 18.
Table 18 Extent of environmental externalities due to coal mining in Odisha, Jharkhand,
Chhattisgarh and Madhya Pradesh
Sl.
No
Type of
impact
Odisha Jharkhand Chhattisgarh Madhya Pradesh
Extent of damage (In ha/tonnes/litres etc.)
1 Destructi
on of
forest &
biodivers
ity
795 ha. diverted
between 2005 and
201120
2020 ha diverted between
2005 and 201120
2432 ha.
diverted
between 2005
and 201120
2505 ha. Diverted
between 2005 and
201120
2 Air
pollution
Air quality of Angul-
Talcher region (In
µg/m3)
Fluoride- 2.6
SO2- 26.4
SPM-179
RPM-8521
*SO2& NOx levels are
generally within
prescribes limits.
However, SPM level
for many mines has
been recorded higher
than the CPCB
standards22
SO2& NOx level are within
permissible limits. However,
RSPM level exceeded for
almost monitoring stations.
RSPM level was found to be
as high as 493.05 µg/m3
against the prescribed limit
of 150 µg/m323
According to CSE 2008, avg.
ambient air SPM
concentration for 11 yrs. of
MADA in Jharia is 425
µg/m3, the max.
concentration being as high
as 958 µg/m3
SO2, NOx &
SPM levels
are within
permissible
limits for two
locations in
Korba
district24
SO2 & NOx level
are within
permissible limits
Annual average
concentration of
SPM - 502 µm at
Jayant mines in
Sidhi district.
Threshold limit is
360 µm25
3 Water
pollution
9480.8 Kl of waste
water is discharged
everyday26
Average Result in
Angul-Talcher region
(In mg/l):
Fluoride – 0.716;
BOD – 1.62;
Cd – 0.0004;
Jharia region discharges
about 2.22 Mm3 of
wastewater every day27
495 tonne of fine coal is
discharged into Damodar
river every day by 11 coal
washers operating in the
region28
Average concentration in
Most
parameters in
Chirmiri,
Bhatgaon, &
Korba areas
were within
permissible
limit except
for
All parameters in
Pathakhedia,
Pench, Kanhan &
Sohagpur areas
were within
permissible limits.
Only sulphate,
manganese, &
fluoride were
20 Indiastat 21 SPCB-Orissa, 2010 22 Mine-wise monitoring data of Talcher & IB valley, Odisha SPCB 23 Colliery-wise monitoring data provided by Jharkhand SPCB 24 MoEF, GoI 25 Sharma & Siddiqui, 2010 26 Reza, 2010 27 Ministry of water resources, 2009 28 Estimated from Priyadarshi, 2010
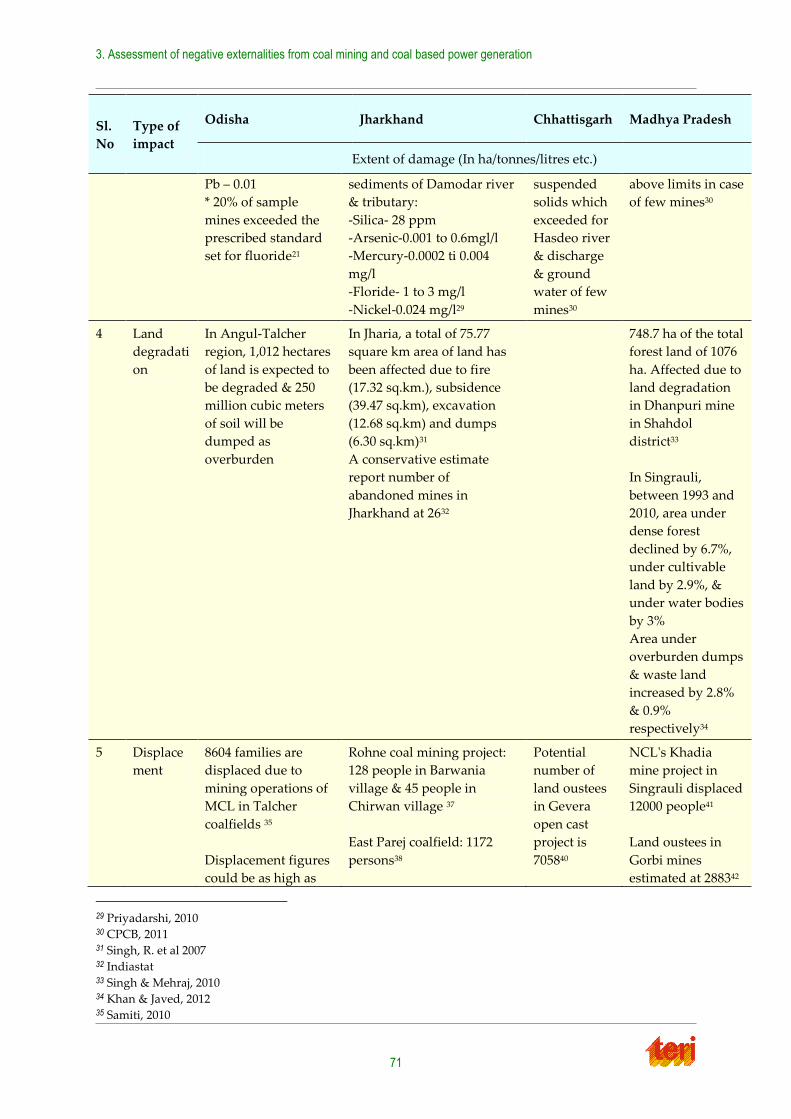
3. Assessment of negative externalities from coal mining and coal based power generation
71
Sl.
No
Type of
impact
Odisha Jharkhand Chhattisgarh Madhya Pradesh
Extent of damage (In ha/tonnes/litres etc.)
Pb – 0.01
* 20% of sample
mines exceeded the
prescribed standard
set for fluoride21
sediments of Damodar river
& tributary:
-Silica- 28 ppm
-Arsenic-0.001 to 0.6mgl/l
-Mercury-0.0002 ti 0.004
mg/l
-Floride- 1 to 3 mg/l
-Nickel-0.024 mg/l29
suspended
solids which
exceeded for
Hasdeo river
& discharge
& ground
water of few
mines30
above limits in case
of few mines30
4 Land
degradati
on
In Angul-Talcher
region, 1,012 hectares
of land is expected to
be degraded & 250
million cubic meters
of soil will be
dumped as
overburden
In Jharia, a total of 75.77
square km area of land has
been affected due to fire
(17.32 sq.km.), subsidence
(39.47 sq.km), excavation
(12.68 sq.km) and dumps
(6.30 sq.km)31
A conservative estimate
report number of
abandoned mines in
Jharkhand at 2632
748.7 ha of the total
forest land of 1076
ha. Affected due to
land degradation
in Dhanpuri mine
in Shahdol
district33
In Singrauli,
between 1993 and
2010, area under
dense forest
declined by 6.7%,
under cultivable
land by 2.9%, &
under water bodies
by 3%
Area under
overburden dumps
& waste land
increased by 2.8%
& 0.9%
respectively34
5 Displace
ment
8604 families are
displaced due to
mining operations of
MCL in Talcher
coalfields 35
Displacement figures
could be as high as
Rohne coal mining project:
128 people in Barwania
village & 45 people in
Chirwan village 37
East Parej coalfield: 1172
persons38
Potential
number of
land oustees
in Gevera
open cast
project is
705840
NCL's Khadia
mine project in
Singrauli displaced
12000 people41
Land oustees in
Gorbi mines
estimated at 288342
29 Priyadarshi, 2010 30 CPCB, 2011 31 Singh, R. et al 2007 32 Indiastat 33 Singh & Mehraj, 2010 34 Khan & Javed, 2012 35 Samiti, 2010
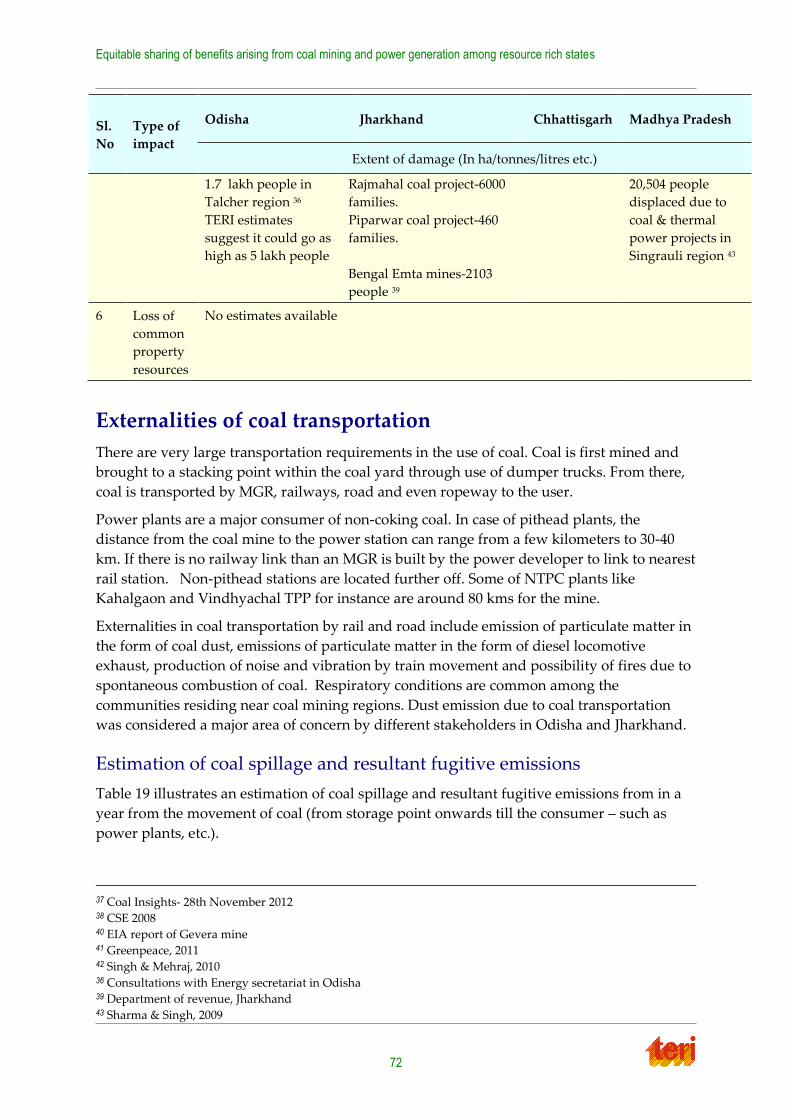
Equitable sharing of benefits arising from coal mining and power generation among resource rich states
72
Sl.
No
Type of
impact
Odisha Jharkhand Chhattisgarh Madhya Pradesh
Extent of damage (In ha/tonnes/litres etc.)
1.7 lakh people in
Talcher region 36
TERI estimates
suggest it could go as
high as 5 lakh people
Rajmahal coal project-6000
families.
Piparwar coal project-460
families.
Bengal Emta mines-2103
people 39
20,504 people
displaced due to
coal & thermal
power projects in
Singrauli region 43
6 Loss of
common
property
resources
No estimates available
Externalities of coal transportation
There are very large transportation requirements in the use of coal. Coal is first mined and
brought to a stacking point within the coal yard through use of dumper trucks. From there,
coal is transported by MGR, railways, road and even ropeway to the user.
Power plants are a major consumer of non-coking coal. In case of pithead plants, the
distance from the coal mine to the power station can range from a few kilometers to 30-40
km. If there is no railway link than an MGR is built by the power developer to link to nearest
rail station. Non-pithead stations are located further off. Some of NTPC plants like
Kahalgaon and Vindhyachal TPP for instance are around 80 kms for the mine.
Externalities in coal transportation by rail and road include emission of particulate matter in
the form of coal dust, emissions of particulate matter in the form of diesel locomotive
exhaust, production of noise and vibration by train movement and possibility of fires due to
spontaneous combustion of coal. Respiratory conditions are common among the
communities residing near coal mining regions. Dust emission due to coal transportation
was considered a major area of concern by different stakeholders in Odisha and Jharkhand.
Estimation of coal spillage and resultant fugitive emissions
Table 19 illustrates an estimation of coal spillage and resultant fugitive emissions from in a
year from the movement of coal (from storage point onwards till the consumer – such as
power plants, etc.).
37 Coal Insights- 28th November 2012 38 CSE 2008 40 EIA report of Gevera mine 41 Greenpeace, 2011 42 Singh & Mehraj, 2010 36 Consultations with Energy secretariat in Odisha 39 Department of revenue, Jharkhand 43 Sharma & Singh, 2009
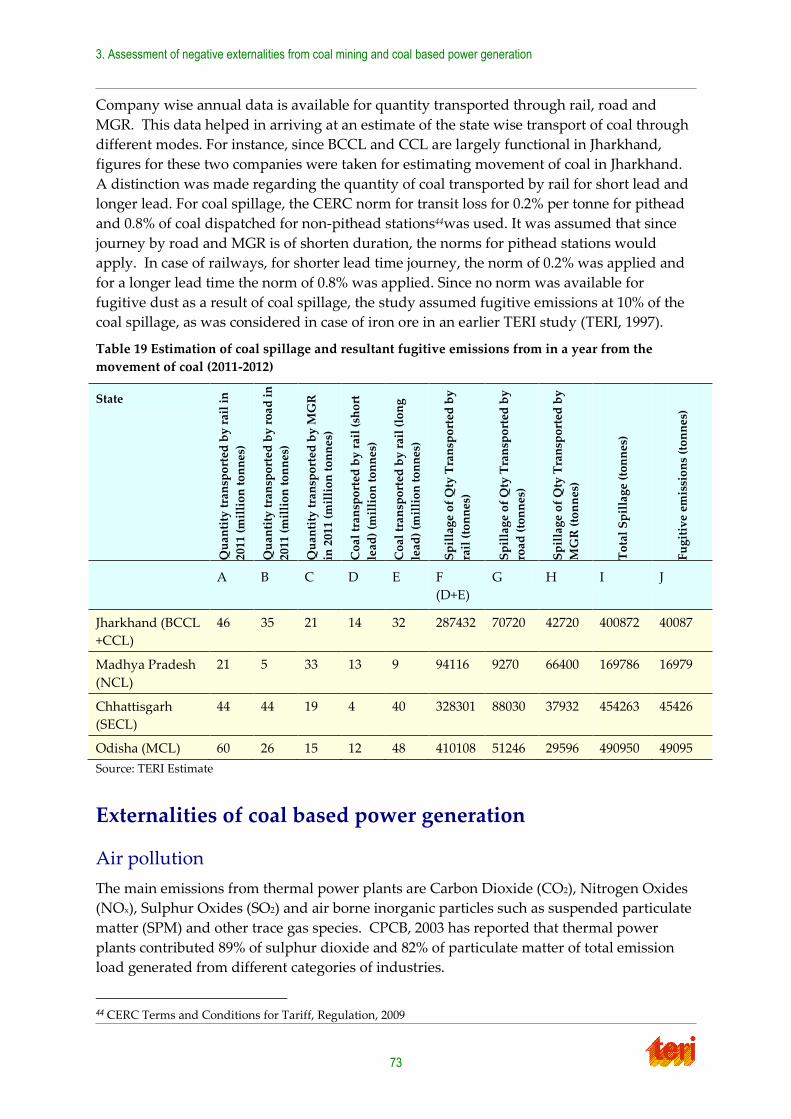
3. Assessment of negative externalities from coal mining and coal based power generation
73
Company wise annual data is available for quantity transported through rail, road and
MGR. This data helped in arriving at an estimate of the state wise transport of coal through
different modes. For instance, since BCCL and CCL are largely functional in Jharkhand,
figures for these two companies were taken for estimating movement of coal in Jharkhand.
A distinction was made regarding the quantity of coal transported by rail for short lead and
longer lead. For coal spillage, the CERC norm for transit loss for 0.2% per tonne for pithead
and 0.8% of coal dispatched for non-pithead stations44was used. It was assumed that since
journey by road and MGR is of shorten duration, the norms for pithead stations would
apply. In case of railways, for shorter lead time journey, the norm of 0.2% was applied and
for a longer lead time the norm of 0.8% was applied. Since no norm was available for
fugitive dust as a result of coal spillage, the study assumed fugitive emissions at 10% of the
coal spillage, as was considered in case of iron ore in an earlier TERI study (TERI, 1997).
Table 19 Estimation of coal spillage and resultant fugitive emissions from in a year from the
movement of coal (2011-2012)
State
Qu
anti
ty t
ran
spo
rted
by
rai
l in
2011
(m
illi
on
to
nn
es)
Qu
anti
ty t
ran
spo
rted
by
ro
ad i
n
2011
(m
illi
on
to
nn
es)
Qu
anti
ty t
ran
spo
rted
by
MG
R
in 2
011
(mil
lio
n t
on
nes
)
Co
al t
ran
spo
rted
by
rai
l (s
ho
rt
lead
) (m
illi
on
to
nn
es)
Co
al t
ran
spo
rted
by
rai
l (l
on
g
lead
) (m
illi
on
to
nn
es)
Sp
illa
ge
of
Qty
Tra
nsp
ort
ed b
y
rail
(to
nn
es)
Sp
illa
ge
of
Qty
Tra
nsp
ort
ed b
y
road
(to
nn
es)
Sp
illa
ge
of
Qty
Tra
nsp
ort
ed b
y
MG
R (
ton
nes
)
To
tal
Sp
illa
ge
(to
nn
es)
Fu
git
ive
emis
sio
ns
(to
nn
es)
A B C D E F
(D+E)
G H I J
Jharkhand (BCCL
+CCL)
46 35 21 14 32 287432 70720 42720 400872 40087
Madhya Pradesh
(NCL)
21 5 33 13 9 94116 9270 66400 169786 16979
Chhattisgarh
(SECL)
44 44 19 4 40 328301 88030 37932 454263 45426
Odisha (MCL) 60 26 15 12 48 410108 51246 29596 490950 49095
Source: TERI Estimate
Externalities of coal based power generation
Air pollution
The main emissions from thermal power plants are Carbon Dioxide (CO2), Nitrogen Oxides
(NOx), Sulphur Oxides (SO2) and air borne inorganic particles such as suspended particulate
matter (SPM) and other trace gas species. CPCB, 2003 has reported that thermal power
plants contributed 89% of sulphur dioxide and 82% of particulate matter of total emission
load generated from different categories of industries.
44 CERC Terms and Conditions for Tariff, Regulation, 2009
Equitable sharing of benefits arising from coal mining and power generation among resource rich states
74
The study estimated emissions of SO2, NOx and CO2 from coal based power plants in the
states based on emissions factors arrived at CPCB, 2003 and NPL, 2008. These are given in
Annexure D.
A 2012 study by Mittal, 2012 estimates that the total CO2 emissions from thermal power
plants increased from 323474.85 Gg in 2001-02 to 498655.78 Gg in 2009-10. Similarly the SO2
emissions increased from 2519.93 Gg to 3840.44 Gg and NO emissions from 1502.07 Gg to
2314.95 Gg during this period. The study, by considering the estimates of coal consumption
projected by Planning Commission in 2002 projects that the CO2 emission by 2020-21 will
increase to 850,000 Gg, SO2 to about 6000 Gg and NO to about 4500 Gg during the same time
period.
A number of studies have estimated emissions from thermal power stations and also
quantified damages in monetary terms. Bhattacharya, 1997 estimated the cost of damage
per unit of electricity to be small at around 0.012 US Cents. Kumar and Rao, 2001 have
estimated willingness to pay for improved quality at Rs 1.45 per person per year based on a
study around the Panipat Thermal power station in Haryana.
In case of power generation, emissions become a major concern also as power plants tend to
get concentrated around the region where coal is available. Prayas 2011 suggests that two
districts in Chattisgarh, Janjgir-Champa (30470 MW) and Raigarh (24380 MW) have the
highest concentration of proposed thermal power stations in the country. Many of these
regions are generating power for export to other states and are bearing pollution while
benefits of electricity go to other states.
Relhan, 2011 estimated that for 2002-03, Chattisgarh was exporting half of its power to other
states and hence half the total emissions of the state were on account of meeting
requirements of other states. On similar lines, the study estimated that 13% of pollution load
from power plants in Madhya Pradesh and 9% in Odisha were attributable to generation for
export.
Fly ash generation
Indian coal has very high ash content, ranging from 35-50%, but low sulphur, chlorine as
well as trace metal content. When coal is combusted it produces about 40% fly ash. The
generation of fly-ash leads to the problem of air, water and soil pollution, disrupt ecological
cycles and set off environmental hazards. The disposal of fly-ash requires large quantities of
land, water, and energy, and its fine particles, if not managed well, can become airborne.
Currently, 131 million tonnes of fly-ash generated every year (CEA, 2011). Such a huge
quantity poses challenging problems, in the form of land usage, health hazards, and
environmental dangers. The following table gives details of ash generated in 2010-11 based
on reporting made by select thermal stations in a few state to CEA.
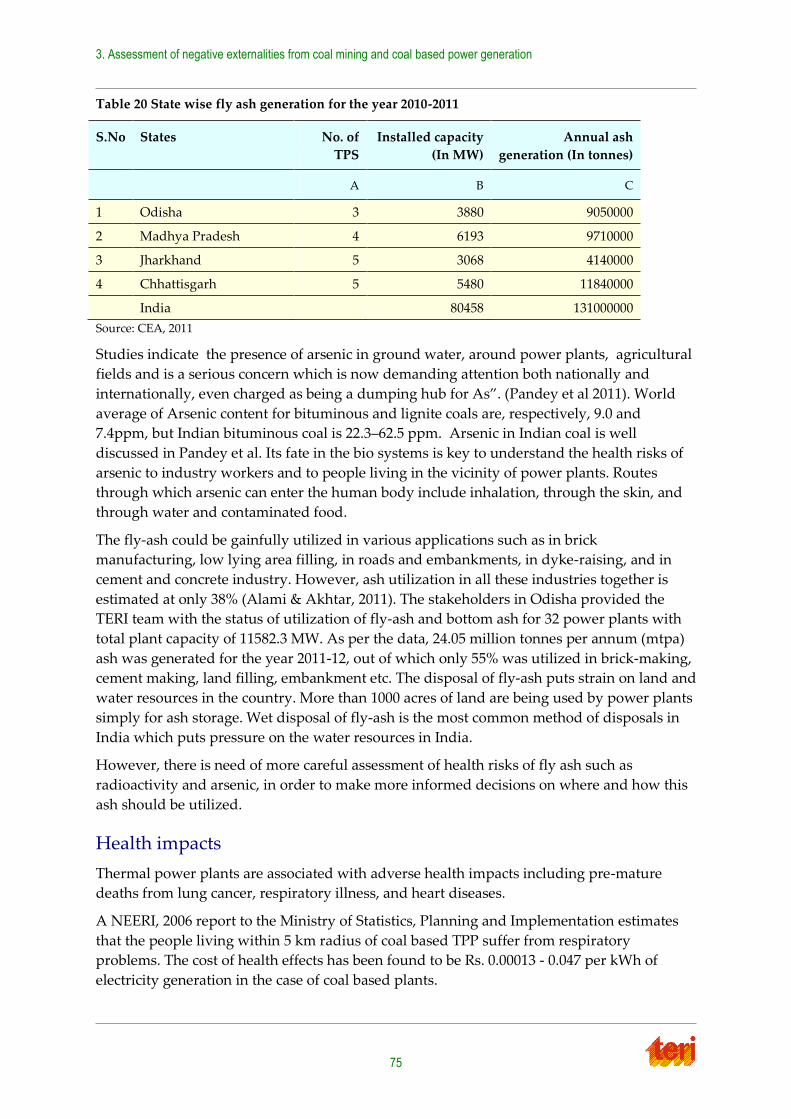
3. Assessment of negative externalities from coal mining and coal based power generation
75
Table 20 State wise fly ash generation for the year 2010-2011
S.No States No. of
TPS
Installed capacity
(In MW)
Annual ash
generation (In tonnes)
A B C
1 Odisha 3 3880 9050000
2 Madhya Pradesh 4 6193 9710000
3 Jharkhand 5 3068 4140000
4 Chhattisgarh 5 5480 11840000
India 80458 131000000
Source: CEA, 2011
Studies indicate the presence of arsenic in ground water, around power plants, agricultural
fields and is a serious concern which is now demanding attention both nationally and
internationally, even charged as being a dumping hub for As‛. (Pandey et al 2011). World
average of Arsenic content for bituminous and lignite coals are, respectively, 9.0 and
7.4ppm, but Indian bituminous coal is 22.3–62.5 ppm. Arsenic in Indian coal is well
discussed in Pandey et al. Its fate in the bio systems is key to understand the health risks of
arsenic to industry workers and to people living in the vicinity of power plants. Routes
through which arsenic can enter the human body include inhalation, through the skin, and
through water and contaminated food.
The fly-ash could be gainfully utilized in various applications such as in brick
manufacturing, low lying area filling, in roads and embankments, in dyke-raising, and in
cement and concrete industry. However, ash utilization in all these industries together is
estimated at only 38% (Alami & Akhtar, 2011). The stakeholders in Odisha provided the
TERI team with the status of utilization of fly-ash and bottom ash for 32 power plants with
total plant capacity of 11582.3 MW. As per the data, 24.05 million tonnes per annum (mtpa)
ash was generated for the year 2011-12, out of which only 55% was utilized in brick-making,
cement making, land filling, embankment etc. The disposal of fly-ash puts strain on land and
water resources in the country. More than 1000 acres of land are being used by power plants
simply for ash storage. Wet disposal of fly-ash is the most common method of disposals in
India which puts pressure on the water resources in India.
However, there is need of more careful assessment of health risks of fly ash such as
radioactivity and arsenic, in order to make more informed decisions on where and how this
ash should be utilized.
Health impacts
Thermal power plants are associated with adverse health impacts including pre-mature
deaths from lung cancer, respiratory illness, and heart diseases.
A NEERI, 2006 report to the Ministry of Statistics, Planning and Implementation estimates
that the people living within 5 km radius of coal based TPP suffer from respiratory
problems. The cost of health effects has been found to be Rs. 0.00013 - 0.047 per kWh of
electricity generation in the case of coal based plants.
Equitable sharing of benefits arising from coal mining and power generation among resource rich states
76
Relhan 2011 estimated the health costs from power generation in Korba district. The study
estimated health damage cost (long term mortality cost and morbidity costs) at Rs 100.5 to
11759.6 million rupees. Since about 53% of power from this region was exported out in 2002-
03, the health damage cost to the host state due to export was estimated in the range of at Rs
53.18 million to Rs 6232 million based on the methodology used.
A study by (Cropper et al, 2012) estimated pre-mature deaths per tonne of particulate
matter, SO2 and NOx for 89 thermal power plants in India for the year 2008. According to the
results of the study, an average of 23 people die per 1,000 tonnes of particulate matter
emitted. By comparison, an average of 10 people die per 1,000 tonnes of SO2 emitted, and 9
people die per 1,000 tonnes of NOx emitted. However, though the health impacts are greater
in the case of particulate matter, the total number of deaths due to SO2 and NOx are higher
owing to the larger amount of SO2 being emitted. SO2 causes an average of 500 deaths per
plant, NOx roughly 120 and particulate matter about 9 deaths per plant. The authors suggest
that Indian coal being low in sulphur, emissions from sulphur dioxide are less of a concern
here, and hence less control are in place contributing to large number of deaths per plant
relative to particulate emissions. (Cropper et al, 2012)
Stress on natural resources
Besides coal, thermal power plants require large amounts of resources, primarily water and
land. Coal TPPs require a huge amount of water for coal washing, cooling and ash disposal
(NEERI, 2006). For power plants located on main land, the raw water is generally drawn
from fresh water source such as river, lake, canal, reservoir, and barrage. For power plants
located in coastal areas, water for cooling of condenser and auxiliaries is drawn from the sea
or creek which provides for water requirement of the wet ash handling system (CEA, 2012).
Various estimates are available for use of water in thermal power stations. Wise (2013)
estimates that upto 60-100 litres of water are needed per unit of electricity produced. The
consumptive use of water by coal based TPP is about 3.92 million cubic meters per 100 MW
per year (Prayas, 2011). Water is fast emerging as a key issue in the production of power.
CEA, 2012 recognizes that difficulties are already being faced in siting thermal power plants
due to non-availability of water, particularly in coal bearing states like Odisha, Jharkhand
and Chhattisgarh.
The requirements of coal and land are equally substantial. As per TERI estimates a 500 MW
plant would require around 0.5 million tonnes of coal per year (assuming 85% PLF and
calorific value of coal at 3500 Kcal/kg).CEA, 2007 estimates that the total land requirement
of a 2x500 MW power plant based on indigenous coal as 1420 acres. This includes 600 acres
for the power plant, 500 acres for ash dyke, 100 acres for township and 200 acres for facilities
outside the plant area.
As per data made available by the Odisha Energy Department, around 10500 MW of power
capacity being developed by IPPs is expected to be commissioned within the 12th Plan
period. The following table illustrates requirement for land, water and coal for these
stations. The planned capacity of 10500 MW will require 8380 acre of land, 374.5 Cusec of
water and 53.85 MTPA of coal. Overall Odisha has signed MoUs for 38270 MW of power
which will require 30073 acre of land, 1339.31 Cusec of water, and 200.7 MTPA of coal.
Clearly, this will put a lot of stress on the state for resources.
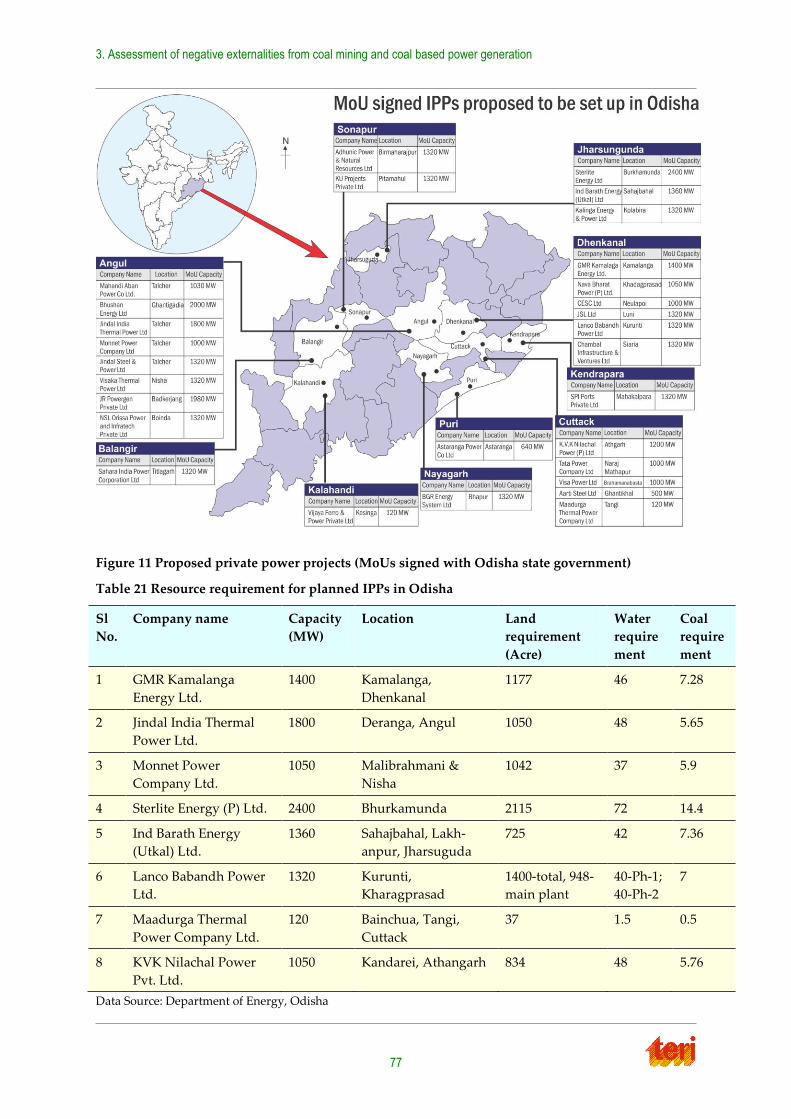
3. Assessment of negative externalities from coal mining and coal based power generation
77
Figure 11 Proposed private power projects (MoUs signed with Odisha state government)
Table 21 Resource requirement for planned IPPs in Odisha
Sl
No.
Company name Capacity
(MW)
Location Land
requirement
(Acre)
Water
require
ment
Coal
require
ment
1 GMR Kamalanga
Energy Ltd.
1400 Kamalanga,
Dhenkanal
1177 46 7.28
2 Jindal India Thermal
Power Ltd.
1800 Deranga, Angul 1050 48 5.65
3 Monnet Power
Company Ltd.
1050 Malibrahmani &
Nisha
1042 37 5.9
4 Sterlite Energy (P) Ltd. 2400 Bhurkamunda 2115 72 14.4
5 Ind Barath Energy
(Utkal) Ltd.
1360 Sahajbahal, Lakh-
anpur, Jharsuguda
725 42 7.36
6 Lanco Babandh Power
Ltd.
1320 Kurunti,
Kharagprasad
1400-total, 948-
main plant
40-Ph-1;
40-Ph-2
7
7 Maadurga Thermal
Power Company Ltd.
120 Bainchua, Tangi,
Cuttack
37 1.5 0.5
8 KVK Nilachal Power
Pvt. Ltd.
1050 Kandarei, Athangarh 834 48 5.76
Data Source: Department of Energy, Odisha
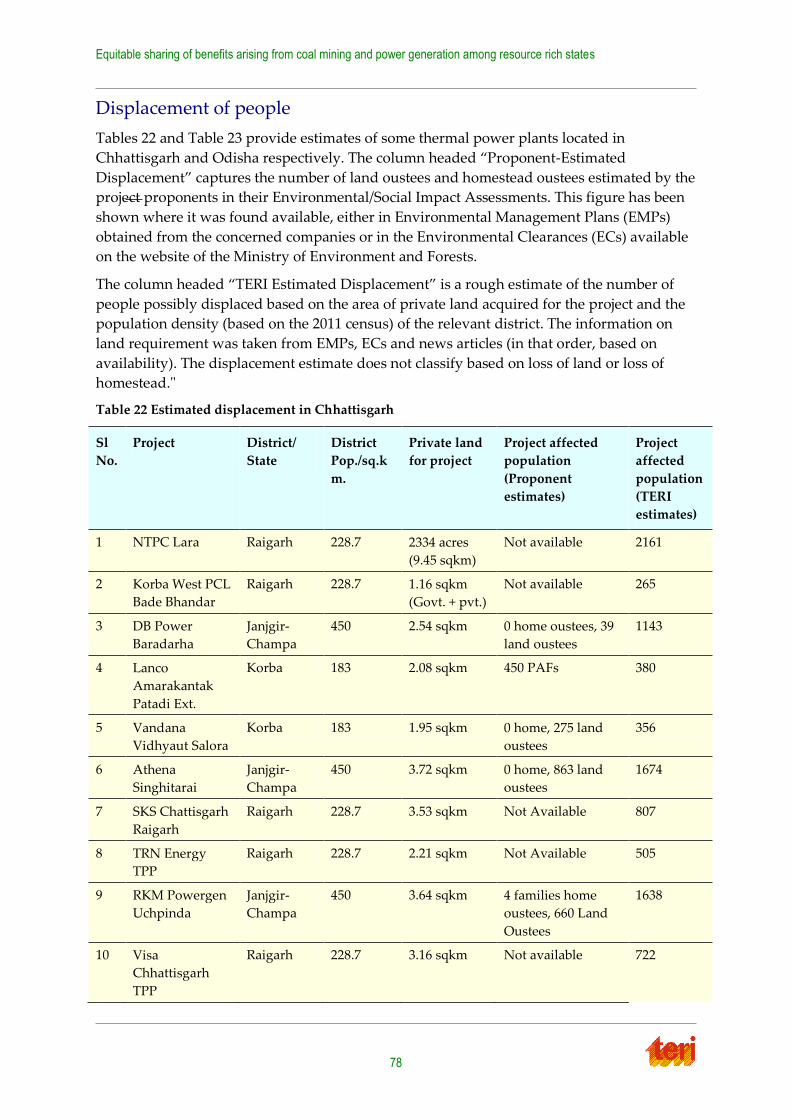
Equitable sharing of benefits arising from coal mining and power generation among resource rich states
78
Displacement of people
Tables 22 and Table 23 provide estimates of some thermal power plants located in
Chhattisgarh and Odisha respectively. The column headed ‚Proponent-Estimated
Displacement‛ captures the number of land oustees and homestead oustees estimated by the
project proponents in their Environmental/Social Impact Assessments. This figure has been
shown where it was found available, either in Environmental Management Plans (EMPs)
obtained from the concerned companies or in the Environmental Clearances (ECs) available
on the website of the Ministry of Environment and Forests.
The column headed ‚TERI Estimated Displacement‛ is a rough estimate of the number of
people possibly displaced based on the area of private land acquired for the project and the
population density (based on the 2011 census) of the relevant district. The information on
land requirement was taken from EMPs, ECs and news articles (in that order, based on
availability). The displacement estimate does not classify based on loss of land or loss of
homestead."
Table 22 Estimated displacement in Chhattisgarh
Sl
No.
Project District/
State
District
Pop./sq.k
m.
Private land
for project
Project affected
population
(Proponent
estimates)
Project
affected
population
(TERI
estimates)
1 NTPC Lara Raigarh 228.7 2334 acres
(9.45 sqkm)
Not available 2161
2 Korba West PCL
Bade Bhandar
Raigarh 228.7 1.16 sqkm
(Govt. + pvt.)
Not available 265
3 DB Power
Baradarha
Janjgir-
Champa
450 2.54 sqkm 0 home oustees, 39
land oustees
1143
4 Lanco
Amarakantak
Patadi Ext.
Korba 183 2.08 sqkm 450 PAFs 380
5 Vandana
Vidhyaut Salora
Korba 183 1.95 sqkm 0 home, 275 land
oustees
356
6 Athena
Singhitarai
Janjgir-
Champa
450 3.72 sqkm 0 home, 863 land
oustees
1674
7 SKS Chattisgarh
Raigarh
Raigarh 228.7 3.53 sqkm Not Available 807
8 TRN Energy
TPP
Raigarh 228.7 2.21 sqkm Not Available 505
9 RKM Powergen
Uchpinda
Janjgir-
Champa
450 3.64 sqkm 4 families home
oustees, 660 Land
Oustees
1638
10 Visa
Chhattisgarh
TPP
Raigarh 228.7 3.16 sqkm Not available 722
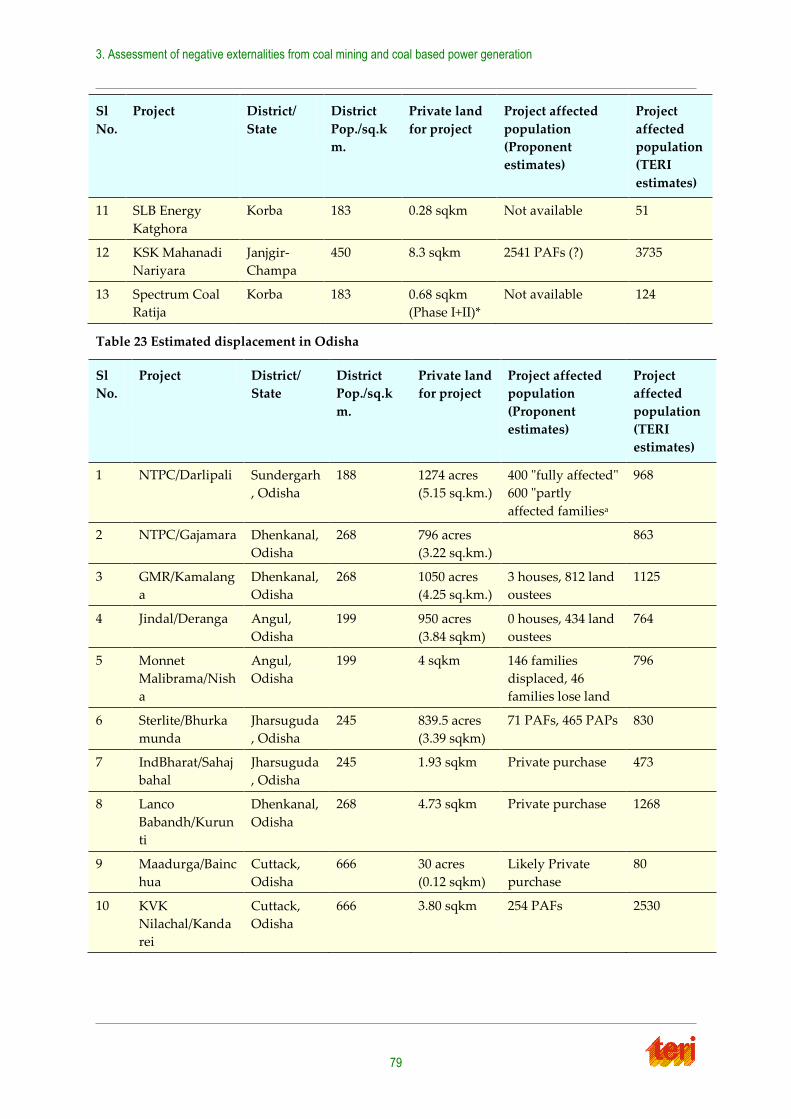
3. Assessment of negative externalities from coal mining and coal based power generation
79
Sl
No.
Project District/
State
District
Pop./sq.k
m.
Private land
for project
Project affected
population
(Proponent
estimates)
Project
affected
population
(TERI
estimates)
11 SLB Energy
Katghora
Korba 183 0.28 sqkm Not available 51
12 KSK Mahanadi
Nariyara
Janjgir-
Champa
450 8.3 sqkm 2541 PAFs (?) 3735
13 Spectrum Coal
Ratija
Korba 183 0.68 sqkm
(Phase I+II)*
Not available 124
Table 23 Estimated displacement in Odisha
Sl
No.
Project District/
State
District
Pop./sq.k
m.
Private land
for project
Project affected
population
(Proponent
estimates)
Project
affected
population
(TERI
estimates)
1 NTPC/Darlipali Sundergarh
, Odisha
188 1274 acres
(5.15 sq.km.)
400 "fully affected"
600 "partly
affected familiesa
968
2 NTPC/Gajamara Dhenkanal,
Odisha
268 796 acres
(3.22 sq.km.)
863
3 GMR/Kamalang
a
Dhenkanal,
Odisha
268 1050 acres
(4.25 sq.km.)
3 houses, 812 land
oustees
1125
4 Jindal/Deranga Angul,
Odisha
199 950 acres
(3.84 sqkm)
0 houses, 434 land
oustees
764
5 Monnet
Malibrama/Nish
a
Angul,
Odisha
199 4 sqkm 146 families
displaced, 46
families lose land
796
6 Sterlite/Bhurka
munda
Jharsuguda
, Odisha
245 839.5 acres
(3.39 sqkm)
71 PAFs, 465 PAPs 830
7 IndBharat/Sahaj
bahal
Jharsuguda
, Odisha
245 1.93 sqkm Private purchase 473
8 Lanco
Babandh/Kurun
ti
Dhenkanal,
Odisha
268 4.73 sqkm Private purchase 1268
9 Maadurga/Bainc
hua
Cuttack,
Odisha
666 30 acres
(0.12 sqkm)
Likely Private
purchase
80
10 KVK
Nilachal/Kanda
rei
Cuttack,
Odisha
666 3.80 sqkm 254 PAFs 2530

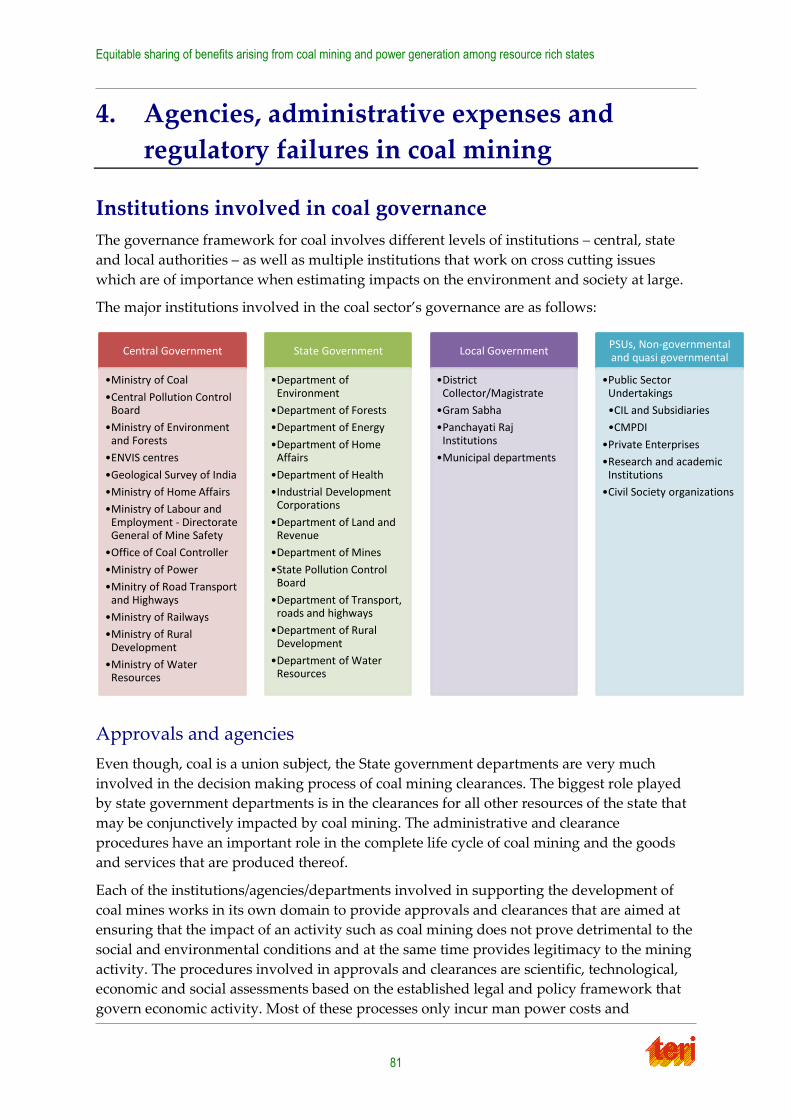
Equitable sharing of benefits arising from coal mining and power generation among resource rich states
81
4. Agencies, administrative expenses and
regulatory failures in coal mining
Institutions involved in coal governance
The governance framework for coal involves different levels of institutions – central, state
and local authorities – as well as multiple institutions that work on cross cutting issues
which are of importance when estimating impacts on the environment and society at large.
The major institutions involved in the coal sector’s governance are as follows:
Approvals and agencies
Even though, coal is a union subject, the State government departments are very much
involved in the decision making process of coal mining clearances. The biggest role played
by state government departments is in the clearances for all other resources of the state that
may be conjunctively impacted by coal mining. The administrative and clearance
procedures have an important role in the complete life cycle of coal mining and the goods
and services that are produced thereof.
Each of the institutions/agencies/departments involved in supporting the development of
coal mines works in its own domain to provide approvals and clearances that are aimed at
ensuring that the impact of an activity such as coal mining does not prove detrimental to the
social and environmental conditions and at the same time provides legitimacy to the mining
activity. The procedures involved in approvals and clearances are scientific, technological,
economic and social assessments based on the established legal and policy framework that
govern economic activity. Most of these processes only incur man power costs and
Central Government
•Ministry of Coal
•Central Pollution Control Board
•Ministry of Environment and Forests
•ENVIS centres
•Geological Survey of India
•Ministry of Home Affairs
•Ministry of Labour and Employment - Directorate General of Mine Safety
•Office of Coal Controller
•Ministry of Power
•Minitry of Road Transport and Highways
•Ministry of Railways
•Ministry of Rural Development
•Ministry of Water Resources
State Government
•Department of Environment
•Department of Forests
•Department of Energy
•Department of Home Affairs
•Department of Health
•Industrial Development Corporations
•Department of Land and Revenue
•Department of Mines
•State Pollution Control Board
•Department of Transport, roads and highways
•Department of Rural Development
•Department of Water Resources
Local Government
•District Collector/Magistrate
•Gram Sabha
•Panchayati Raj Institutions
•Municipal departments
PSUs, Non-governmental and quasi governmental
•Public Sector Undertakings
•CIL and Subsidiaries
•CMPDI
•Private Enterprises
•Research and academic Institutions
•Civil Society organizations
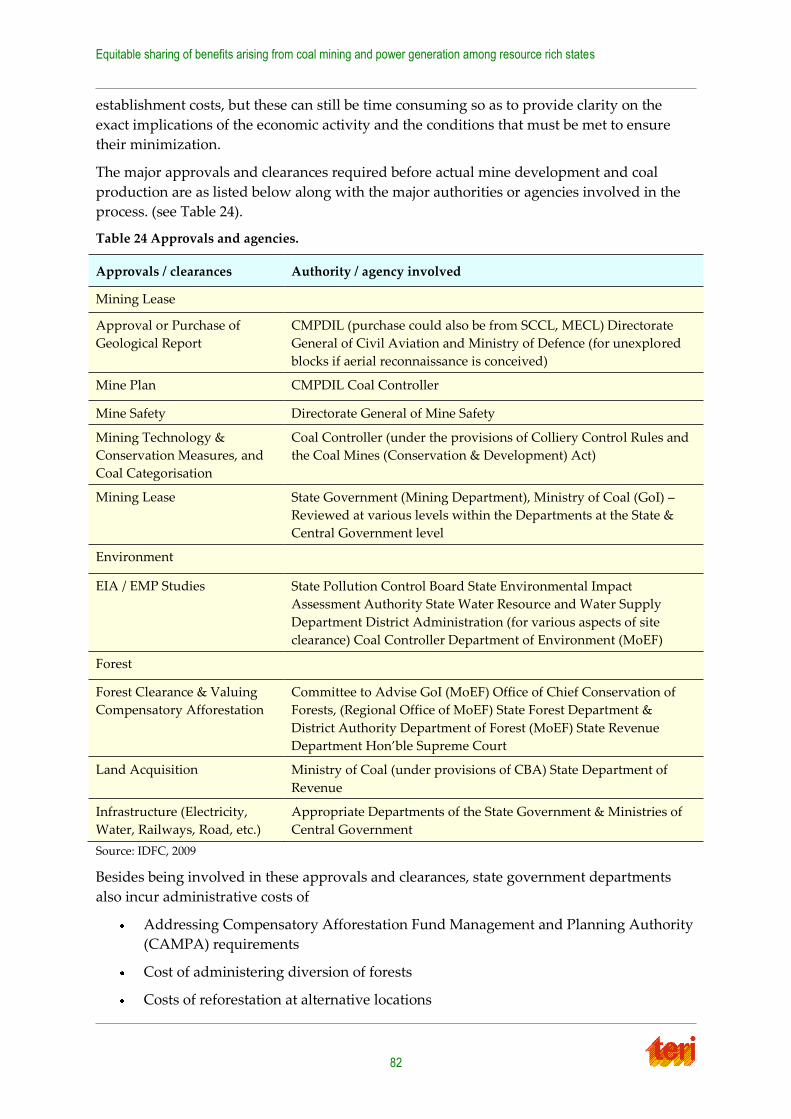
Equitable sharing of benefits arising from coal mining and power generation among resource rich states
82
establishment costs, but these can still be time consuming so as to provide clarity on the
exact implications of the economic activity and the conditions that must be met to ensure
their minimization.
The major approvals and clearances required before actual mine development and coal
production are as listed below along with the major authorities or agencies involved in the
process. (see Table 24).
Table 24 Approvals and agencies.
Approvals / clearances Authority / agency involved
Mining Lease
Approval or Purchase of
Geological Report
CMPDIL (purchase could also be from SCCL, MECL) Directorate
General of Civil Aviation and Ministry of Defence (for unexplored
blocks if aerial reconnaissance is conceived)
Mine Plan CMPDIL Coal Controller
Mine Safety Directorate General of Mine Safety
Mining Technology &
Conservation Measures, and
Coal Categorisation
Coal Controller (under the provisions of Colliery Control Rules and
the Coal Mines (Conservation & Development) Act)
Mining Lease State Government (Mining Department), Ministry of Coal (GoI) –
Reviewed at various levels within the Departments at the State &
Central Government level
Environment
EIA / EMP Studies State Pollution Control Board State Environmental Impact
Assessment Authority State Water Resource and Water Supply
Department District Administration (for various aspects of site
clearance) Coal Controller Department of Environment (MoEF)
Forest
Forest Clearance & Valuing
Compensatory Afforestation
Committee to Advise GoI (MoEF) Office of Chief Conservation of
Forests, (Regional Office of MoEF) State Forest Department &
District Authority Department of Forest (MoEF) State Revenue
Department Hon’ble Supreme Court
Land Acquisition Ministry of Coal (under provisions of CBA) State Department of
Revenue
Infrastructure (Electricity,
Water, Railways, Road, etc.)
Appropriate Departments of the State Government & Ministries of
Central Government
Source: IDFC, 2009
Besides being involved in these approvals and clearances, state government departments
also incur administrative costs of
Addressing Compensatory Afforestation Fund Management and Planning Authority
(CAMPA) requirements
Cost of administering diversion of forests
Costs of reforestation at alternative locations
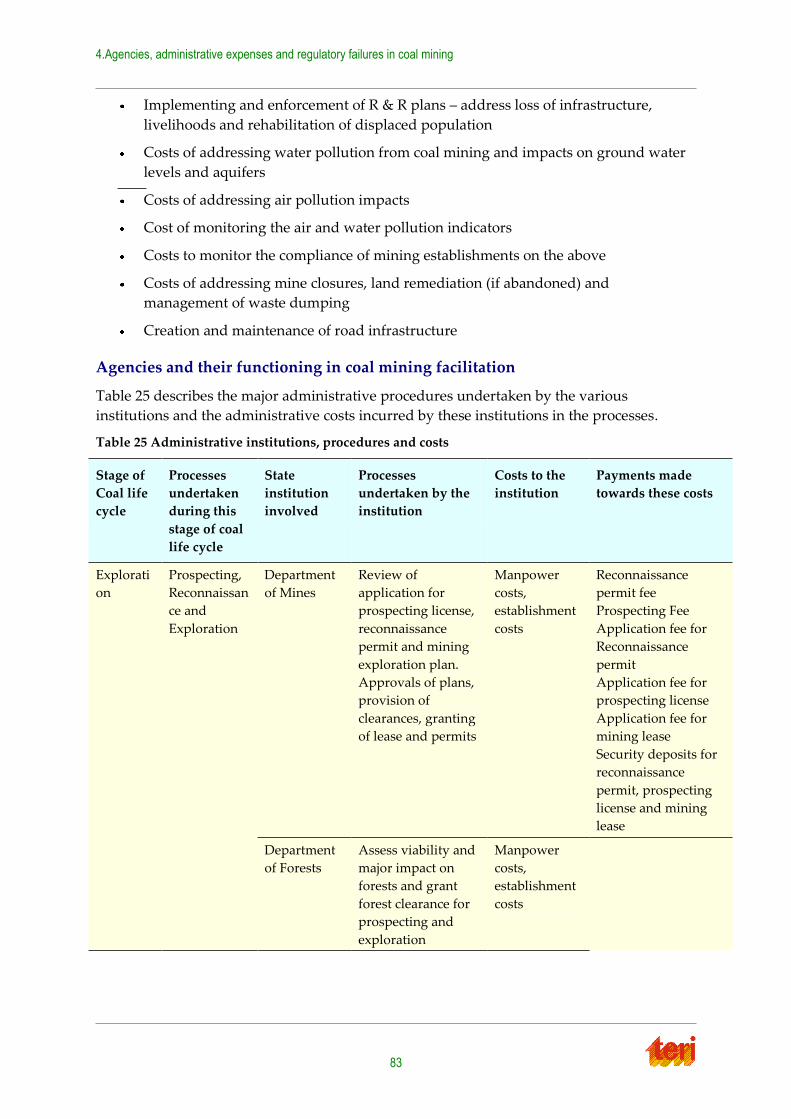
4.Agencies, administrative expenses and regulatory failures in coal mining
83
Implementing and enforcement of R & R plans – address loss of infrastructure,
livelihoods and rehabilitation of displaced population
Costs of addressing water pollution from coal mining and impacts on ground water
levels and aquifers
Costs of addressing air pollution impacts
Cost of monitoring the air and water pollution indicators
Costs to monitor the compliance of mining establishments on the above
Costs of addressing mine closures, land remediation (if abandoned) and
management of waste dumping
Creation and maintenance of road infrastructure
Agencies and their functioning in coal mining facilitation
Table 25 describes the major administrative procedures undertaken by the various
institutions and the administrative costs incurred by these institutions in the processes.
Table 25 Administrative institutions, procedures and costs
Stage of
Coal life
cycle
Processes
undertaken
during this
stage of coal
life cycle
State
institution
involved
Processes
undertaken by the
institution
Costs to the
institution
Payments made
towards these costs
Explorati
on
Prospecting,
Reconnaissan
ce and
Exploration
Department
of Mines
Review of
application for
prospecting license,
reconnaissance
permit and mining
exploration plan.
Approvals of plans,
provision of
clearances, granting
of lease and permits
Manpower
costs,
establishment
costs
Reconnaissance
permit fee
Prospecting Fee
Application fee for
Reconnaissance
permit
Application fee for
prospecting license
Application fee for
mining lease
Security deposits for
reconnaissance
permit, prospecting
license and mining
lease
Department
of Forests
Assess viability and
major impact on
forests and grant
forest clearance for
prospecting and
exploration
Manpower
costs,
establishment
costs
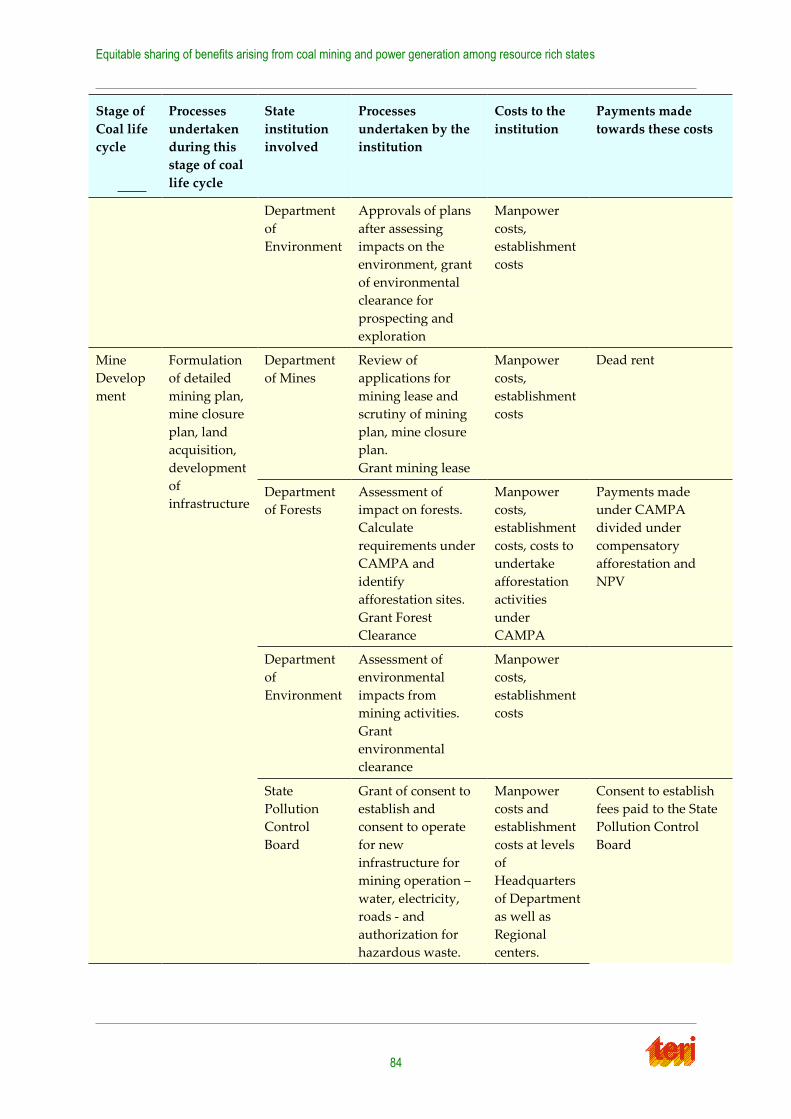
Equitable sharing of benefits arising from coal mining and power generation among resource rich states
84
Stage of
Coal life
cycle
Processes
undertaken
during this
stage of coal
life cycle
State
institution
involved
Processes
undertaken by the
institution
Costs to the
institution
Payments made
towards these costs
Department
of
Environment
Approvals of plans
after assessing
impacts on the
environment, grant
of environmental
clearance for
prospecting and
exploration
Manpower
costs,
establishment
costs
Mine
Develop
ment
Formulation
of detailed
mining plan,
mine closure
plan, land
acquisition,
development
of
infrastructure
Department
of Mines
Review of
applications for
mining lease and
scrutiny of mining
plan, mine closure
plan.
Grant mining lease
Manpower
costs,
establishment
costs
Dead rent
Department
of Forests
Assessment of
impact on forests.
Calculate
requirements under
CAMPA and
identify
afforestation sites.
Grant Forest
Clearance
Manpower
costs,
establishment
costs, costs to
undertake
afforestation
activities
under
CAMPA
Payments made
under CAMPA
divided under
compensatory
afforestation and
NPV
Department
of
Environment
Assessment of
environmental
impacts from
mining activities.
Grant
environmental
clearance
Manpower
costs,
establishment
costs
State
Pollution
Control
Board
Grant of consent to
establish and
consent to operate
for new
infrastructure for
mining operation –
water, electricity,
roads - and
authorization for
hazardous waste.
Manpower
costs and
establishment
costs at levels
of
Headquarters
of Department
as well as
Regional
centers.
Consent to establish
fees paid to the State
Pollution Control
Board
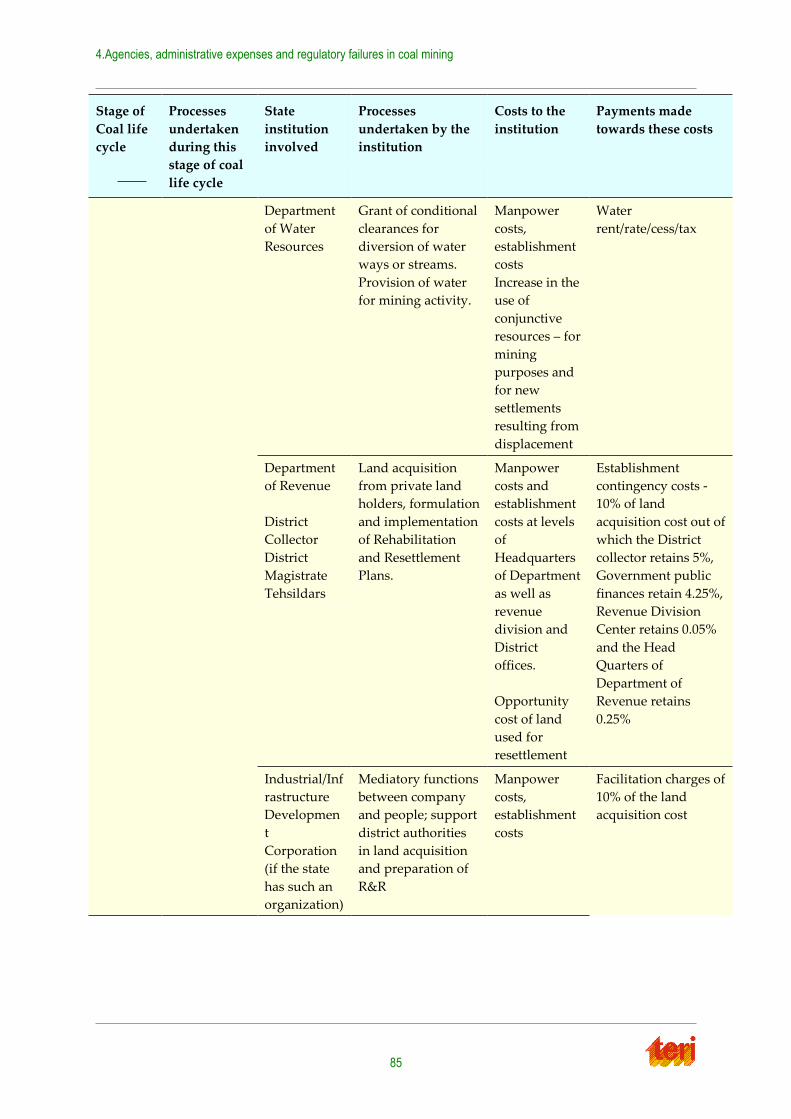
4.Agencies, administrative expenses and regulatory failures in coal mining
85
Stage of
Coal life
cycle
Processes
undertaken
during this
stage of coal
life cycle
State
institution
involved
Processes
undertaken by the
institution
Costs to the
institution
Payments made
towards these costs
Department
of Water
Resources
Grant of conditional
clearances for
diversion of water
ways or streams.
Provision of water
for mining activity.
Manpower
costs,
establishment
costs
Increase in the
use of
conjunctive
resources – for
mining
purposes and
for new
settlements
resulting from
displacement
Water
rent/rate/cess/tax
Department
of Revenue
District
Collector
District
Magistrate
Tehsildars
Land acquisition
from private land
holders, formulation
and implementation
of Rehabilitation
and Resettlement
Plans.
Manpower
costs and
establishment
costs at levels
of
Headquarters
of Department
as well as
revenue
division and
District
offices.
Opportunity
cost of land
used for
resettlement
Establishment
contingency costs -
10% of land
acquisition cost out of
which the District
collector retains 5%,
Government public
finances retain 4.25%,
Revenue Division
Center retains 0.05%
and the Head
Quarters of
Department of
Revenue retains
0.25%
Industrial/Inf
rastructure
Developmen
t
Corporation
(if the state
has such an
organization)
Mediatory functions
between company
and people; support
district authorities
in land acquisition
and preparation of
R&R
Manpower
costs,
establishment
costs
Facilitation charges of
10% of the land
acquisition cost
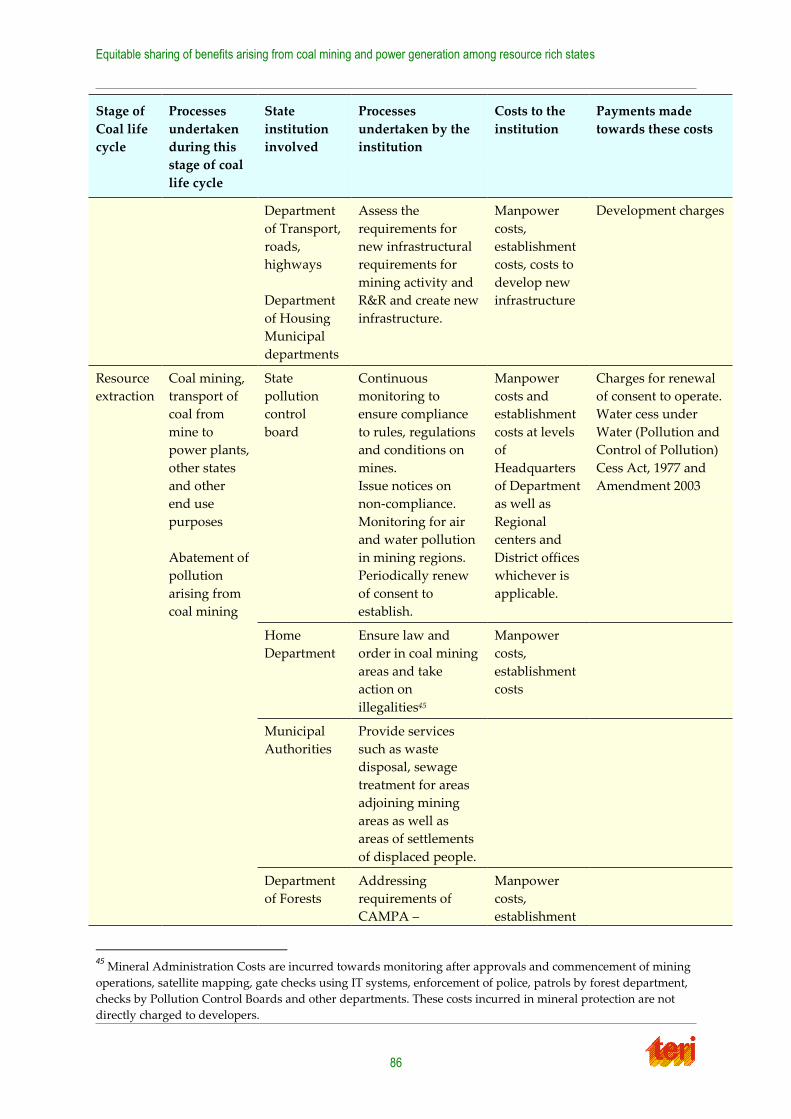
Equitable sharing of benefits arising from coal mining and power generation among resource rich states
86
Stage of
Coal life
cycle
Processes
undertaken
during this
stage of coal
life cycle
State
institution
involved
Processes
undertaken by the
institution
Costs to the
institution
Payments made
towards these costs
Department
of Transport,
roads,
highways
Department
of Housing
Municipal
departments
Assess the
requirements for
new infrastructural
requirements for
mining activity and
R&R and create new
infrastructure.
Manpower
costs,
establishment
costs, costs to
develop new
infrastructure
Development charges
Resource
extraction
Coal mining,
transport of
coal from
mine to
power plants,
other states
and other
end use
purposes
Abatement of
pollution
arising from
coal mining
State
pollution
control
board
Continuous
monitoring to
ensure compliance
to rules, regulations
and conditions on
mines.
Issue notices on
non-compliance.
Monitoring for air
and water pollution
in mining regions.
Periodically renew
of consent to
establish.
Manpower
costs and
establishment
costs at levels
of
Headquarters
of Department
as well as
Regional
centers and
District offices
whichever is
applicable.
Charges for renewal
of consent to operate.
Water cess under
Water (Pollution and
Control of Pollution)
Cess Act, 1977 and
Amendment 2003
Home
Department
Ensure law and
order in coal mining
areas and take
action on
illegalities45
Manpower
costs,
establishment
costs
Municipal
Authorities
Provide services
such as waste
disposal, sewage
treatment for areas
adjoining mining
areas as well as
areas of settlements
of displaced people.
Department
of Forests
Addressing
requirements of
CAMPA –
Manpower
costs,
establishment
45
Mineral Administration Costs are incurred towards monitoring after approvals and commencement of mining
operations, satellite mapping, gate checks using IT systems, enforcement of police, patrols by forest department,
checks by Pollution Control Boards and other departments. These costs incurred in mineral protection are not
directly charged to developers.
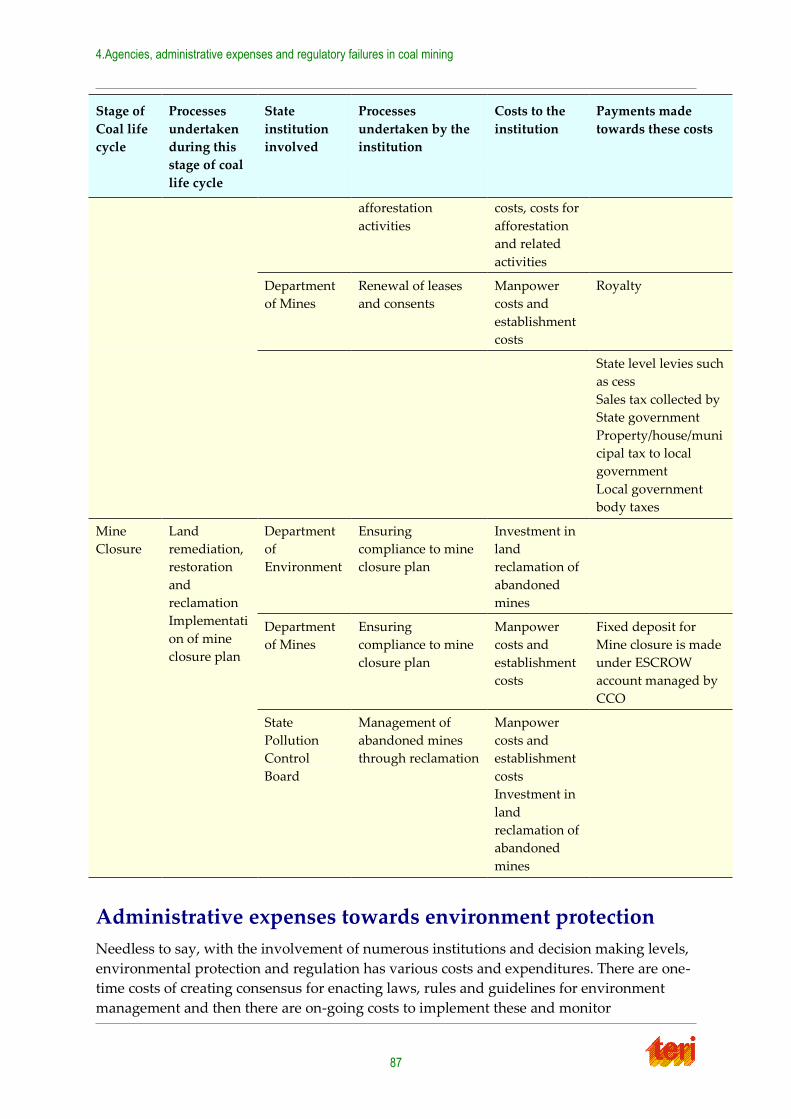
4.Agencies, administrative expenses and regulatory failures in coal mining
87
Stage of
Coal life
cycle
Processes
undertaken
during this
stage of coal
life cycle
State
institution
involved
Processes
undertaken by the
institution
Costs to the
institution
Payments made
towards these costs
afforestation
activities
costs, costs for
afforestation
and related
activities
Department
of Mines
Renewal of leases
and consents
Manpower
costs and
establishment
costs
Royalty
State level levies such
as cess
Sales tax collected by
State government
Property/house/muni
cipal tax to local
government
Local government
body taxes
Mine
Closure
Land
remediation,
restoration
and
reclamation
Implementati
on of mine
closure plan
Department
of
Environment
Ensuring
compliance to mine
closure plan
Investment in
land
reclamation of
abandoned
mines
Department
of Mines
Ensuring
compliance to mine
closure plan
Manpower
costs and
establishment
costs
Fixed deposit for
Mine closure is made
under ESCROW
account managed by
CCO
State
Pollution
Control
Board
Management of
abandoned mines
through reclamation
Manpower
costs and
establishment
costs
Investment in
land
reclamation of
abandoned
mines
Administrative expenses towards environment protection
Needless to say, with the involvement of numerous institutions and decision making levels,
environmental protection and regulation has various costs and expenditures. There are one-
time costs of creating consensus for enacting laws, rules and guidelines for environment
management and then there are on-going costs to implement these and monitor
Equitable sharing of benefits arising from coal mining and power generation among resource rich states
88
performance against these rules. Some of these costs can be classified as expenditures and
the outlay for them measured in monetary terms; but some of these costs cannot be directly
measured.46Most of these expenditures and costs vary on a case by case basis dependent on
spatial factors (specific to location), temporal factors (specific to time frames) and factors
related to the actors and institutions involved; making it extremely difficult to estimate the
costs and expenditures of environmental regulation.
It is assumed that there is no such thing as costless environmental regulation because the
premise is that in a market economy, any new expenditure on regulation represents a loss
because it diverts resources away from things that consumers have chosen for themselves.
(Ackerman, 2006) On estimating the cost of environmental regulation, industry has
highlighted fears that environmental regulations (especially new regulations) impose
significant costs, slow productivity growth and hinder competitiveness by reducing
margins. (Jaffe et. al, 1995) Some of the theoretical arguments for this claim have been
presented in (Arthur D. Little, 2002), (Mercer Management Consulting, 2003), (McGuire,
1982), (Rudiger, 1975), (Siebert, 1977) and (Yohe, 1979).
Contrary to these arguments, a more recent view of regulatory costs is more benign
postulating that environmental regulation either has a net positive impact on the
competitiveness of the economy or that these costs are too small to matter or that a reduction
in these costs may not be as beneficial as promised. (Porter & van der Linde, 1995), (Porter
M. , 1990), (Jaffe et. al, 1995), (Ackerman, 2006) Discussing the debate over the costs of
environmental regulatory programs, (Harringtonne et. Al, 1999), point out that there are two
facets in this debate – one is whether all cost elements have been included in the estimates;
and the other is systematic errors during the estimation of regulatory costs result in
differences between ex post and ex ante comparisons of environmental regulation.
In order to assess the administrative expenditures and costs borne by the state governments
and their various institutions for coal mining, this study listed the processes undertaken by
the institutions to facilitate coal mining corresponding to each step of the coal mining
lifecycle.
It should be kept in mind that while the units of these administrative/institutional costs can
be person hours, actual quantification is not attempted here. Public institutions and their
spending are financed by public finance mechanisms and not by market revenue. While the
institutions may charge processing fees to cover some establishment costs incurred for a
particular purpose (as described in the table above), the costs of providing services and
public goods are met by budgetary transfers between levels of government.
Payments towards administrative costs
The payments made by proponents towards these procedures are mainly processing fees in
the form of application fees, permit fees, consent fees or renewal fees. Beyond these
processing fees, there are deposits to ensure that the proponent will undertake its
environmental and social responsibilities after the prospecting or mining activity is
completed; there are payments for the use of resources such as water cess and for
46
In management parlance, expenditures are defined as cash outlays that do not have any expected benefits (but
may be unavoidable); while costs are defined as outlays that are expected to have benefits or returns from its
spending.
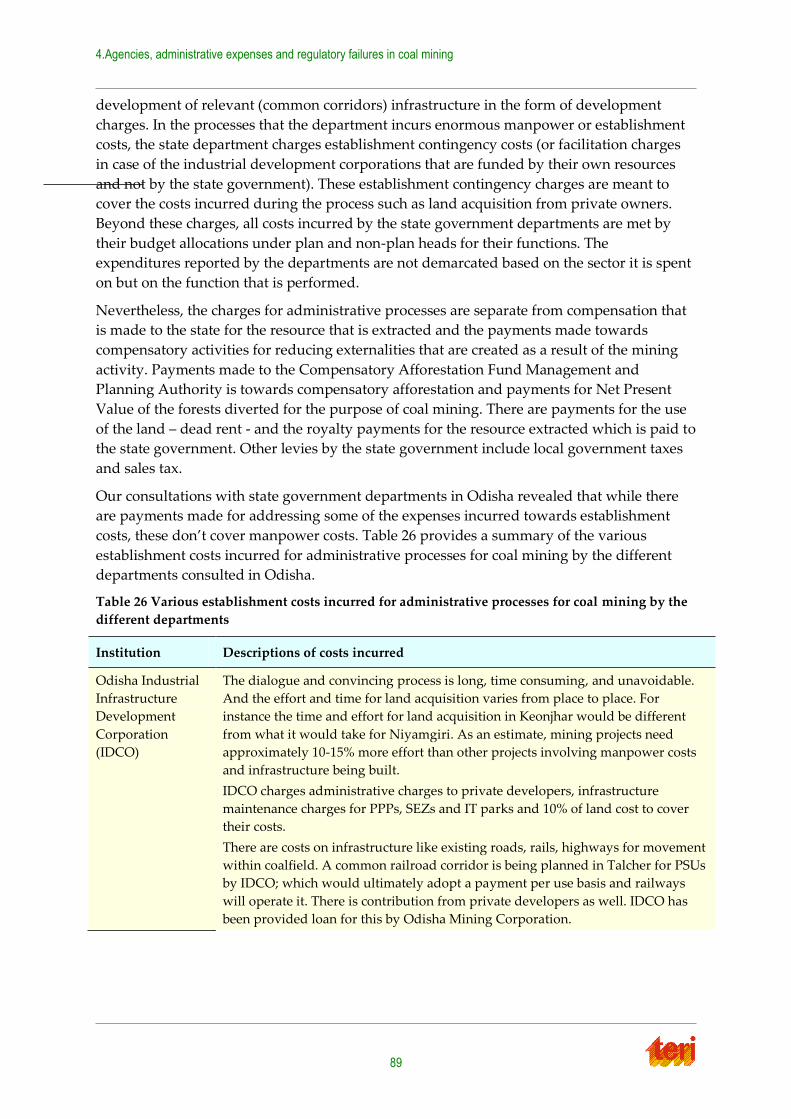
4.Agencies, administrative expenses and regulatory failures in coal mining
89
development of relevant (common corridors) infrastructure in the form of development
charges. In the processes that the department incurs enormous manpower or establishment
costs, the state department charges establishment contingency costs (or facilitation charges
in case of the industrial development corporations that are funded by their own resources
and not by the state government). These establishment contingency charges are meant to
cover the costs incurred during the process such as land acquisition from private owners.
Beyond these charges, all costs incurred by the state government departments are met by
their budget allocations under plan and non-plan heads for their functions. The
expenditures reported by the departments are not demarcated based on the sector it is spent
on but on the function that is performed.
Nevertheless, the charges for administrative processes are separate from compensation that
is made to the state for the resource that is extracted and the payments made towards
compensatory activities for reducing externalities that are created as a result of the mining
activity. Payments made to the Compensatory Afforestation Fund Management and
Planning Authority is towards compensatory afforestation and payments for Net Present
Value of the forests diverted for the purpose of coal mining. There are payments for the use
of the land – dead rent - and the royalty payments for the resource extracted which is paid to
the state government. Other levies by the state government include local government taxes
and sales tax.
Our consultations with state government departments in Odisha revealed that while there
are payments made for addressing some of the expenses incurred towards establishment
costs, these don’t cover manpower costs. Table 26 provides a summary of the various
establishment costs incurred for administrative processes for coal mining by the different
departments consulted in Odisha.
Table 26 Various establishment costs incurred for administrative processes for coal mining by the
different departments
Institution Descriptions of costs incurred
Odisha Industrial
Infrastructure
Development
Corporation
(IDCO)
The dialogue and convincing process is long, time consuming, and unavoidable.
And the effort and time for land acquisition varies from place to place. For
instance the time and effort for land acquisition in Keonjhar would be different
from what it would take for Niyamgiri. As an estimate, mining projects need
approximately 10-15% more effort than other projects involving manpower costs
and infrastructure being built.
IDCO charges administrative charges to private developers, infrastructure
maintenance charges for PPPs, SEZs and IT parks and 10% of land cost to cover
their costs.
There are costs on infrastructure like existing roads, rails, highways for movement
within coalfield. A common railroad corridor is being planned in Talcher for PSUs
by IDCO; which would ultimately adopt a payment per use basis and railways
will operate it. There is contribution from private developers as well. IDCO has
been provided loan for this by Odisha Mining Corporation.
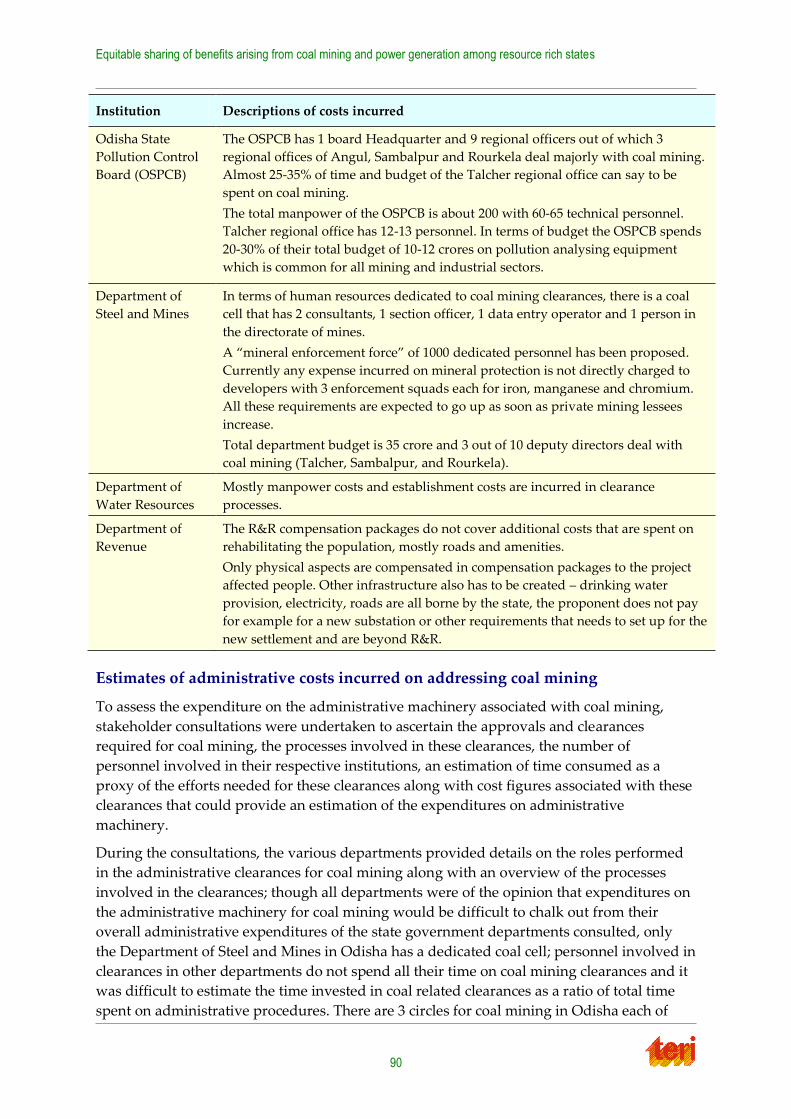
Equitable sharing of benefits arising from coal mining and power generation among resource rich states
90
Institution Descriptions of costs incurred
Odisha State
Pollution Control
Board (OSPCB)
The OSPCB has 1 board Headquarter and 9 regional officers out of which 3
regional offices of Angul, Sambalpur and Rourkela deal majorly with coal mining.
Almost 25-35% of time and budget of the Talcher regional office can say to be
spent on coal mining.
The total manpower of the OSPCB is about 200 with 60-65 technical personnel.
Talcher regional office has 12-13 personnel. In terms of budget the OSPCB spends
20-30% of their total budget of 10-12 crores on pollution analysing equipment
which is common for all mining and industrial sectors.
Department of
Steel and Mines
In terms of human resources dedicated to coal mining clearances, there is a coal
cell that has 2 consultants, 1 section officer, 1 data entry operator and 1 person in
the directorate of mines.
A ‚mineral enforcement force‛ of 1000 dedicated personnel has been proposed.
Currently any expense incurred on mineral protection is not directly charged to
developers with 3 enforcement squads each for iron, manganese and chromium.
All these requirements are expected to go up as soon as private mining lessees
increase.
Total department budget is 35 crore and 3 out of 10 deputy directors deal with
coal mining (Talcher, Sambalpur, and Rourkela).
Department of
Water Resources
Mostly manpower costs and establishment costs are incurred in clearance
processes.
Department of
Revenue
The R&R compensation packages do not cover additional costs that are spent on
rehabilitating the population, mostly roads and amenities.
Only physical aspects are compensated in compensation packages to the project
affected people. Other infrastructure also has to be created – drinking water
provision, electricity, roads are all borne by the state, the proponent does not pay
for example for a new substation or other requirements that needs to set up for the
new settlement and are beyond R&R.
Estimates of administrative costs incurred on addressing coal mining
To assess the expenditure on the administrative machinery associated with coal mining,
stakeholder consultations were undertaken to ascertain the approvals and clearances
required for coal mining, the processes involved in these clearances, the number of
personnel involved in their respective institutions, an estimation of time consumed as a
proxy of the efforts needed for these clearances along with cost figures associated with these
clearances that could provide an estimation of the expenditures on administrative
machinery.
During the consultations, the various departments provided details on the roles performed
in the administrative clearances for coal mining along with an overview of the processes
involved in the clearances; though all departments were of the opinion that expenditures on
the administrative machinery for coal mining would be difficult to chalk out from their
overall administrative expenditures of the state government departments consulted, only
the Department of Steel and Mines in Odisha has a dedicated coal cell; personnel involved in
clearances in other departments do not spend all their time on coal mining clearances and it
was difficult to estimate the time invested in coal related clearances as a ratio of total time
spent on administrative procedures. There are 3 circles for coal mining in Odisha each of
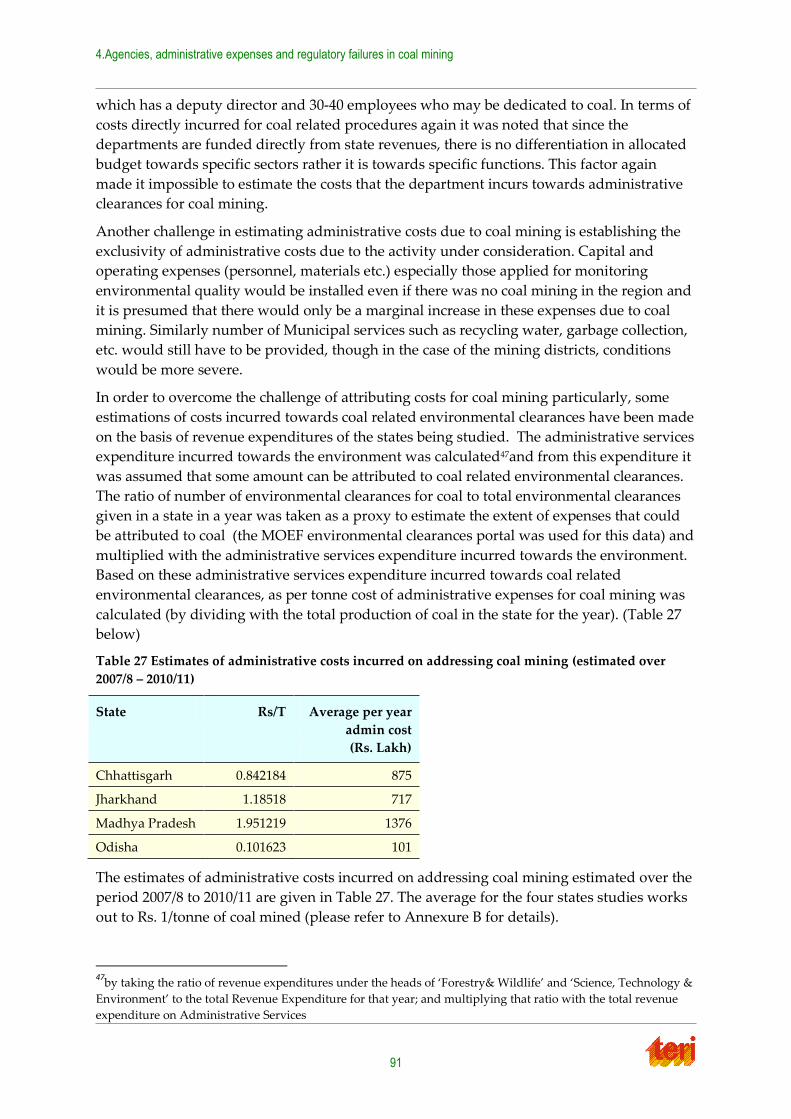
4.Agencies, administrative expenses and regulatory failures in coal mining
91
which has a deputy director and 30-40 employees who may be dedicated to coal. In terms of
costs directly incurred for coal related procedures again it was noted that since the
departments are funded directly from state revenues, there is no differentiation in allocated
budget towards specific sectors rather it is towards specific functions. This factor again
made it impossible to estimate the costs that the department incurs towards administrative
clearances for coal mining.
Another challenge in estimating administrative costs due to coal mining is establishing the
exclusivity of administrative costs due to the activity under consideration. Capital and
operating expenses (personnel, materials etc.) especially those applied for monitoring
environmental quality would be installed even if there was no coal mining in the region and
it is presumed that there would only be a marginal increase in these expenses due to coal
mining. Similarly number of Municipal services such as recycling water, garbage collection,
etc. would still have to be provided, though in the case of the mining districts, conditions
would be more severe.
In order to overcome the challenge of attributing costs for coal mining particularly, some
estimations of costs incurred towards coal related environmental clearances have been made
on the basis of revenue expenditures of the states being studied. The administrative services
expenditure incurred towards the environment was calculated47and from this expenditure it
was assumed that some amount can be attributed to coal related environmental clearances.
The ratio of number of environmental clearances for coal to total environmental clearances
given in a state in a year was taken as a proxy to estimate the extent of expenses that could
be attributed to coal (the MOEF environmental clearances portal was used for this data) and
multiplied with the administrative services expenditure incurred towards the environment.
Based on these administrative services expenditure incurred towards coal related
environmental clearances, as per tonne cost of administrative expenses for coal mining was
calculated (by dividing with the total production of coal in the state for the year). (Table 27
below)
Table 27 Estimates of administrative costs incurred on addressing coal mining (estimated over
2007/8 – 2010/11)
State Rs/T Average per year
admin cost
(Rs. Lakh)
Chhattisgarh 0.842184 875
Jharkhand 1.18518 717
Madhya Pradesh 1.951219 1376
Odisha 0.101623 101
The estimates of administrative costs incurred on addressing coal mining estimated over the
period 2007/8 to 2010/11 are given in Table 27. The average for the four states studies works
out to Rs. 1/tonne of coal mined (please refer to Annexure B for details).
47
by taking the ratio of revenue expenditures under the heads of ‘Forestry& Wildlife’ and ‘Science, Technology &
Environment’ to the total Revenue Expenditure for that year; and multiplying that ratio with the total revenue
expenditure on Administrative Services
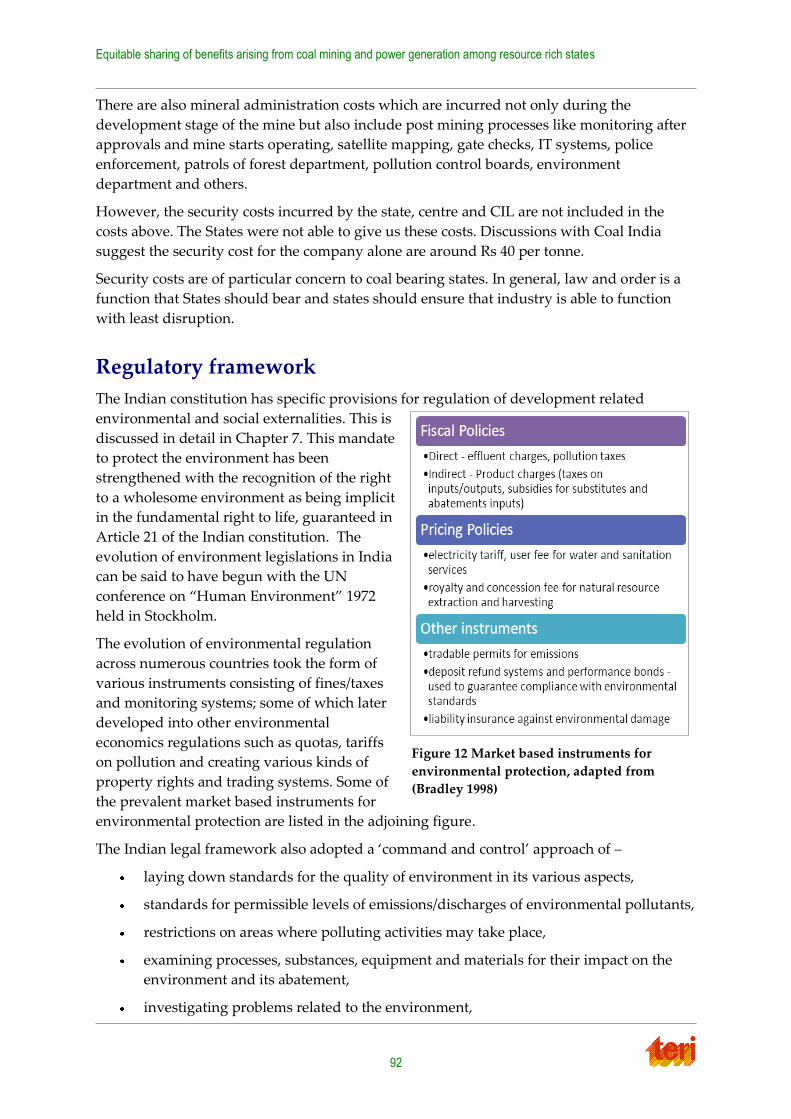
Equitable sharing of benefits arising from coal mining and power generation among resource rich states
92
There are also mineral administration costs which are incurred not only during the
development stage of the mine but also include post mining processes like monitoring after
approvals and mine starts operating, satellite mapping, gate checks, IT systems, police
enforcement, patrols of forest department, pollution control boards, environment
department and others.
However, the security costs incurred by the state, centre and CIL are not included in the
costs above. The States were not able to give us these costs. Discussions with Coal India
suggest the security cost for the company alone are around Rs 40 per tonne.
Security costs are of particular concern to coal bearing states. In general, law and order is a
function that States should bear and states should ensure that industry is able to function
with least disruption.
Regulatory framework
The Indian constitution has specific provisions for regulation of development related
environmental and social externalities. This is
discussed in detail in Chapter 7. This mandate
to protect the environment has been
strengthened with the recognition of the right
to a wholesome environment as being implicit
in the fundamental right to life, guaranteed in
Article 21 of the Indian constitution. The
evolution of environment legislations in India
can be said to have begun with the UN
conference on ‚Human Environment‛ 1972
held in Stockholm.
The evolution of environmental regulation
across numerous countries took the form of
various instruments consisting of fines/taxes
and monitoring systems; some of which later
developed into other environmental
economics regulations such as quotas, tariffs
on pollution and creating various kinds of
property rights and trading systems. Some of
the prevalent market based instruments for
environmental protection are listed in the adjoining figure.
The Indian legal framework also adopted a ‘command and control’ approach of –
laying down standards for the quality of environment in its various aspects,
standards for permissible levels of emissions/discharges of environmental pollutants,
restrictions on areas where polluting activities may take place,
examining processes, substances, equipment and materials for their impact on the
environment and its abatement,
investigating problems related to the environment,
Figure 12 Market based instruments for
environmental protection, adapted from
(Bradley 1998)
4.Agencies, administrative expenses and regulatory failures in coal mining
93
And laid down the procedures and safeguards for prevention of accidents that may
lead to environmental pollution as well as guidelines for prevention, control and
abatement of negative impacts on the environment
The implementation of this command and control approach is through a network of
institutions at multiple levels that have been established with the goal of ensuring
environmental stewardship to support economic activities. This network of institutions
interfaces with a larger governance framework within any sector which is also multilevel
and covers multiple domains within environmental, social and economic realms.
To implement the recommendations, the government of India enacted several Acts on
environment. Environment Protection Act (EPA) 1986 is, however, an umbrella legislation,
which has precedence over the pollution control Acts
Environmental protection
The Environmental Protection Act 1986 defines that it is the responsibility of the person
carrying out industry operations to prevent and mitigate environmental of the prescribed
standards described by the Central government. In the case of a discharge of environmental
pollution in excess to the standards prescribed, the relevant authorities and agencies are
required to take remedial measures necessary to prevent and mitigate environmental
pollution. Project proponents are required to undertake all possible measures to abate water
and air pollution. Since 2003, restoration schemes and land reclamation have become
important components of mine planning. The project proponents are now required to
submit closure plans and give details of corpus funds to MoEF five years in advance of
closure. Also, they are mandated to follow various practices for effective land reclamation.
This includes the practice of preservation of top soil for the subsequent use in reclamation.
The different state departments have the responsibility of monitoring and ensuring
compliance.
With regard to conservation of forests, Forest Conservation Act (FCA) enacted in 1980 plays
an important role. It restricts the powers of state governments in respect of de-reservation of
forests and use of forest land for non-forest purposes without prior approval of the Central
government. The Act stipulates that, for any area of forest lost due to development, the
proponents have to pay for purchase of an equivalent area of non-forest land as near as
possible to the site of diversion, or twice the degraded forest area. The land is then
transferred to state forest department and is declared as protected forest. The mining
companies also need to fund compensatory afforestation (CA) on these lands, along with
payments equivalent to the estimated net present value (NPV) of diverted forest land. Both
CA and NPV are deposited to Compensatory Afforestation Fund Management and Planning
Authority (CAMPA) under the state forest department, which is then realized for
implementation under forest management plan. Advisory Committee headed by the
Inspector General of Forests in the Ministry of Environment and Forest (MoEF) is
responsible for overseeing the implementation of statute.
Land acquisition
The first piece of the legal framework was the Land Acquisition Act of 1894. It established
the Government’s power of ‚eminent domain‛ - all land within the borders of a nation
Equitable sharing of benefits arising from coal mining and power generation among resource rich states
94
belonged primarily to the state. A colonial legislation in the most literal sense, it has
nevertheless survived to the present day, having once been substantially amended in 1984.
As it stands, the 1894 Act allows the Government to acquire any land, against the wishes of
the ‘owner’, so long as the acquisition fulfils a public purpose and compensation is paid.
Post 1984, it also allows the Government to acquire land on behalf of the private sector.
While the 1894 Act is a general legislation, legislation more specific to the coal sector – the
Coal Bearing Areas (Acquisition and Development) Act - came into force in 1957. The Act
allows the Central Government to prospect for coal on any land and then, if it chooses, to
acquire the land after notifying the owner and allowing time for a hearing of objections. The
Government can, at the time of acquisition, nominate a public company (such as Coal India
Limited and/or its subsidiaries) in which the rights to the land shall vest.
One of the most controversial features of both acts is their (identically worded) provisions
regarding compensation to the land owner. Compensation is calculated based on the market
value of the land, but does not reflect even partially the value of minerals present under it.
The fact that the mineral would not be accessible unless such access is provided via the land
is not recognized. This market value of the land is calculated based on the date of the
notification of the Government’s intention to acquire the land.
Policy instruments for addressing externalities
As has been established in this study and various other studies on the creation of social and
environmental externalities, no particular form of policy instrument from government –
command and control based or market based – can be appropriate to address all
environmental problems simultaneously. The nature and characteristics of the externality
created along with the socio-economic and political factors decides which instruments are
appropriate to implement.
Market based instruments are regulations that encourage and incentivize behaviour through
market, price and economic signals rather than through explicit directives to reduce or
eliminate environmental externalities. (Stavins, 1998) (Wikipedia) If well designed and
implemented appropriately, these instruments create incentives that encourage environment
friendly behaviour rather than forcing firms to share burdens of reducing externalities
regardless of the relative costs to each of them.
Command and control instruments include emission standards, technological specifications
such as for processes and equipment, limits of allowable pollution units, requirements for
compliance reporting and audits for performance. Command and control regulations as are
implemented by our regulatory framework specify standards for performance – most
notably for limits of allowable units of pollution in a particular time period. In practice, there
are high costs of limiting pollution to a certain level at the firms’ side – because of large
investments required to control and adhere to the standards – and at the regulators’ side –
because of the requirement of constant monitoring; failing which firms get incentives to
forego any pollution control activity rendering the whole regime ineffective. Market based
instruments also give the liberty to firms of choosing the best way to reduce externalities
and employing technological solutions in innovative ways.
Prevalent market based instruments include pollution charges and environmental taxes,
tradable permits or licenses, market barrier reductions and reductions in government
4.Agencies, administrative expenses and regulatory failures in coal mining
95
subsidies. Environmental taxes particularly aim to fix the costs of controlling externalities
and also create opportunities to transfer resources from private to public domains. In a
scenario of technological advancement, these taxes would lead to an increase in the level of
controlling externalities. Also, a tax or cess on the creation of environmental externality
makes the costs on firms and consumers from its implementation obvious to both these
parties but at the same time does not provide a lot of scope for strategic behaviour especially
from firms. (Stavins, 1998)
However, environmental taxes may not automatically adjust for inflation and their
transaction costs may drive up actual costs of compliance. The efficiency of environmental
taxes is directly dependent on the marginal benefit and marginal cost functions from the
introduction of the tax. (Stavins, 1998)
The overall effectiveness in the form of mitigation of externalities from environmental tax
and cess is in fact dependent on the utilization of the tax revenue and the primary
justification of an environmental tax should be the benefit that will be derived from its
implementation and not just the introduction of a tax regime for itself.
Resettlement and rehabilitation policies
As recognized in the Preamble to the National Resettlement and Rehabilitation Policy, 2007,
land acquisition en masse under the eminent domain paradigm causes ‚<involuntary
displacement of people, depriving them of their land, livelihood and shelter; restricting their
access to traditional resource base, and uprooting them from their socio-cultural
environment<‛. This necessitates ‚<a broader concerted effort on the part of the planners
to include in the displacement, rehabilitation and resettlement process framework not only
those who directly lose land and other assets but also those who are affected by such
acquisition of assets.‛
These statements reveal an advanced understanding, at least, of the fallacy of perceiving
land simply as transactable property. First, land serves as a source of livelihood and the
centre of the social existence of the family. Second, the location of land in relation to non-
privately-owned common property resources such as forests, pastures and water sources
imbues it with value. Third, the re-location of a large number of land-owners affects a
significant number of lands-less individuals, especially those who provide services to the
populations displaced.
The amount of compensation legally due to a land-owner under eminent domain legislation,
therefore, simply addresses the beginning of the loss caused by the involuntary acquisition
of land.
Interaction between Policies
Resettlement and Rehabilitation (R&R) Policies have been promulgated at the National,
State and PSU level. While R&R was usually addressed on a project specific basis, the 1990s
saw the introduction of general policies directed at R&R across coal mining projects. Coal
India Limited published its first R&R policy in 1994; it was most recently updated in 2012. A
National R&R Policy (NRRP) was introduced in 2003 and updated last in 2007. Specific to
coal-rich states, Odisha (2006) and Jharkhand (2008) have also introduced policies of their
own.
Equitable sharing of benefits arising from coal mining and power generation among resource rich states
96
R&R policies typically deal with displacement caused by several types of development
projects, including mining. Therefore, Central and State policies have a significant portion of
overlap. This overlap, however, is simply resolved by the question of which is the
‘appropriate Government’ with regard to any particular project.
According to the NRRP 2007, in the case of i) acquisition of land for the purposes of the
Union and ii) a project which is executed by a Central Government agency or on the orders
and instructions of the Central Government, the appropriate Government is the Central
Government. In all other cases, the State Government is the appropriate Government. The
appropriate Government is responsible for appointing an Administrator and/or
Commissioner for R&R as the case may be, conducting an audit of the areas proposed to be
acquired, conducting a Social Impact Assessment, drawing up an R&R Plan and ensuring
disbursement of benefits, among other administrative duties.
The second relevant party is the ‘requiring body’, i.e. the entity which is acquiring the land,
or on behalf of which the land is being acquired. This may be the Central or State
Governments themselves, public sector undertakings (such as Coal India Limited) or even
private companies.48All R&R policies identify the requiring body as the one which must bear
the cost of the resettlement and rehabilitation package.
The CIL and NTPC policies also overlap significantly with those of the Centre and the States.
CIL’s R&R Policy of 2008 addressed this overlap by stating that the CIL Policy would be
updated as and when the Centre and/or the States issued new guidelines. The latest CIL
policy states in its Preamble that it has been drafted keeping in mind the NRRP 2007 and the
practices followed across different states.
However, it is a common complaint by CIL and its subsidiaries that the differing policies
across states slow it down greatly in its purposes.
Regulatory deficits and failures
The governance of the coal sector in India is not just between government and its related
entities as it may seem; it is very much the relationship between central government (and its
entities-executive branches and institutions) and state governments; between government
and citizens or society; increasingly between government and the private sector and market
forces; and finally the relationship of all these entities with the environment
Despite the existence of a policy and legislative framework, environmental and social
conditions in and around the mining areas has continued to deteriorate over the years, as
seen in the previous sections and there have been serious lapses in the management of social
externalities.49 These negative environmental externalities have led to health impacts for the
communities residing in and around the mining regions while social externalities have led to
inequity and unrest among the population that has been displaced but not compensated
adequately. Table 28 gives the different externalities, the responsibility of the state and
48
While land cannot be acquired on behalf of private companies under the Coal Bearing Land (Development &
Acquisition) Act, 1957, it can be acquired in public interest on behalf of a private company under the Land
Acquisition Act, 1894. 49
This section builds on the work done In TERI 2011
4.Agencies, administrative expenses and regulatory failures in coal mining
97
project proponents with regard to addressing the externalities, and the impacts resulting
from externalities that are not addressed adequately.
An analysis of the laws and policies and an evaluation of their effectiveness through various
stakeholder consultations suggest that much of the problem with coal mining in India is due
to the poor enforcements of different regulations at various stages of the life cycle of coal
mining.
While the regulatory framework describes the actions of the government through various
legal provisions, the fact that externalities have been created in the process of coal mining
which have not been addressed or compensated adequately, directs our attention to the
existence of regulatory failures in the governance of this sector. Several regulatory failures
have been identified by the state governments themselves and while these may seem to be
the low hanging fruits in administrative responsibility, these have been most difficult to
address in the last four decades of state led coal mining activities.
For the externalities that have been described in the sections above, each has been addressed
completely or at least in parts in our legal framework. The scope of the environmental
regulatory framework covers all major externalities of forest diversion, air and water
pollution, land degradation, management of extractive activities and rights of people to
forest use. There are also provisions for addressing social externalities that are created due to
coal mining in particular but as the study findings show there are lacunae in the current
legal framework to address these externalities.
While the legal framework has been able to demarcate property rights to resources (such as
coal) and responsibilities to ensure the upholding of these property rights, it has been unable
to institute efficiency on the part of the administrative machinery towards the creation of
public goods and services. Increasingly the lack of efficiency or adequate implementation of
regulation has been blamed on the lack of resources and capacity of the administrative
machinery and to the fact that there is little communication between institutions that
function in the same area or domain matter resulting in a lack of coordination among them.
Beyond these it is clear that the coal sector suffers from an overlap and discrepancy in the
roles and responsibilities of the institutions involved which ultimately results in a lack of
regulatory efficiency. In the case of resettlement and rehabilitation for people affected by
coal mining, there is a proliferation of policies in the absence of a national legal framework
that has provided a pretext for the planning of R&R to be ambiguous thus creating
numerous social externalities that are either inadequately compensated or not addressed at
all.
Finally two of the biggest regulatory failures are those that are most difficult to legislate –
the failure of leadership or political will power to take decisive action in mitigating social
and environmental externalities; and the failure of public and private business entities to
self-regulate in a way that creates minimum social and environmental externalities.
Table 28 lists the externalities that are created during the various stages of the coal cycle and
also describes some of the gaps in addressing these various externalities and the impacts
that are not adequately addressed by the current sharing of responsibility among the project
proponent and the government.
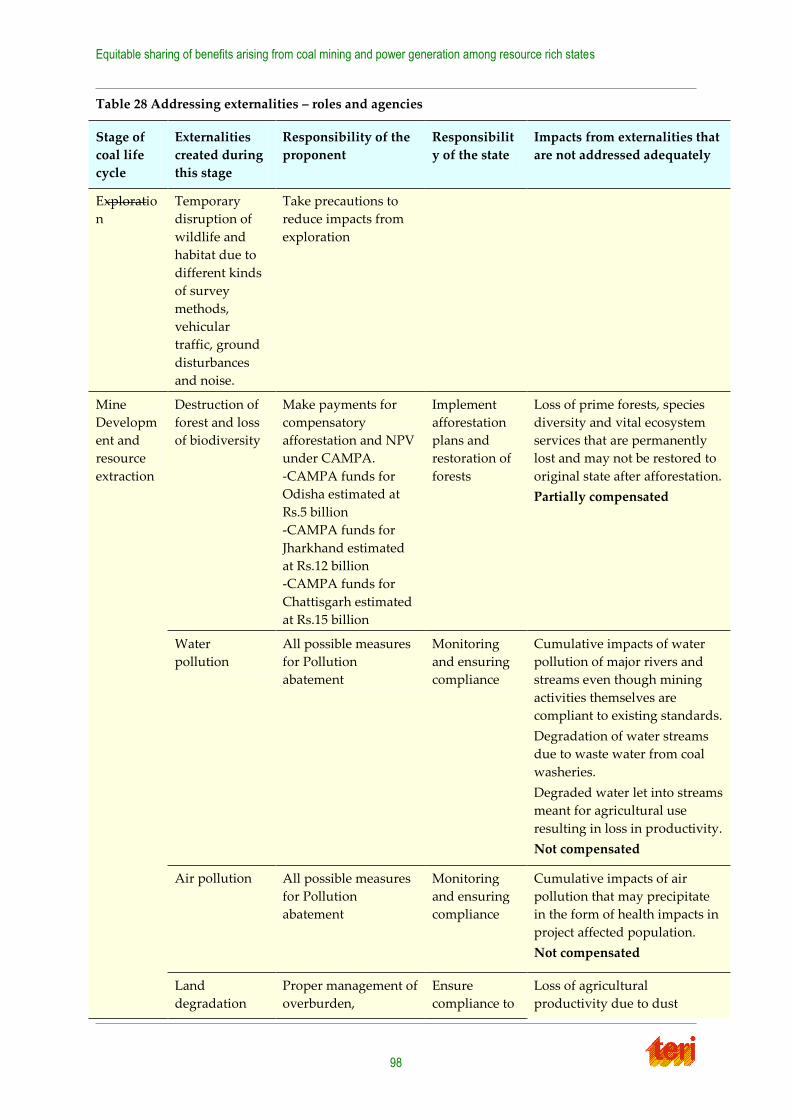
Equitable sharing of benefits arising from coal mining and power generation among resource rich states
98
Table 28 Addressing externalities – roles and agencies
Stage of
coal life
cycle
Externalities
created during
this stage
Responsibility of the
proponent
Responsibilit
y of the state
Impacts from externalities that
are not addressed adequately
Exploratio
n
Temporary
disruption of
wildlife and
habitat due to
different kinds
of survey
methods,
vehicular
traffic, ground
disturbances
and noise.
Take precautions to
reduce impacts from
exploration
Mine
Developm
ent and
resource
extraction
Destruction of
forest and loss
of biodiversity
Make payments for
compensatory
afforestation and NPV
under CAMPA.
-CAMPA funds for
Odisha estimated at
Rs.5 billion
-CAMPA funds for
Jharkhand estimated
at Rs.12 billion
-CAMPA funds for
Chattisgarh estimated
at Rs.15 billion
Implement
afforestation
plans and
restoration of
forests
Loss of prime forests, species
diversity and vital ecosystem
services that are permanently
lost and may not be restored to
original state after afforestation.
Partially compensated
Water
pollution
All possible measures
for Pollution
abatement
Monitoring
and ensuring
compliance
Cumulative impacts of water
pollution of major rivers and
streams even though mining
activities themselves are
compliant to existing standards.
Degradation of water streams
due to waste water from coal
washeries.
Degraded water let into streams
meant for agricultural use
resulting in loss in productivity.
Not compensated
Air pollution All possible measures
for Pollution
abatement
Monitoring
and ensuring
compliance
Cumulative impacts of air
pollution that may precipitate
in the form of health impacts in
project affected population.
Not compensated
Land
degradation
Proper management of
overburden,
Ensure
compliance to
Loss of agricultural
productivity due to dust
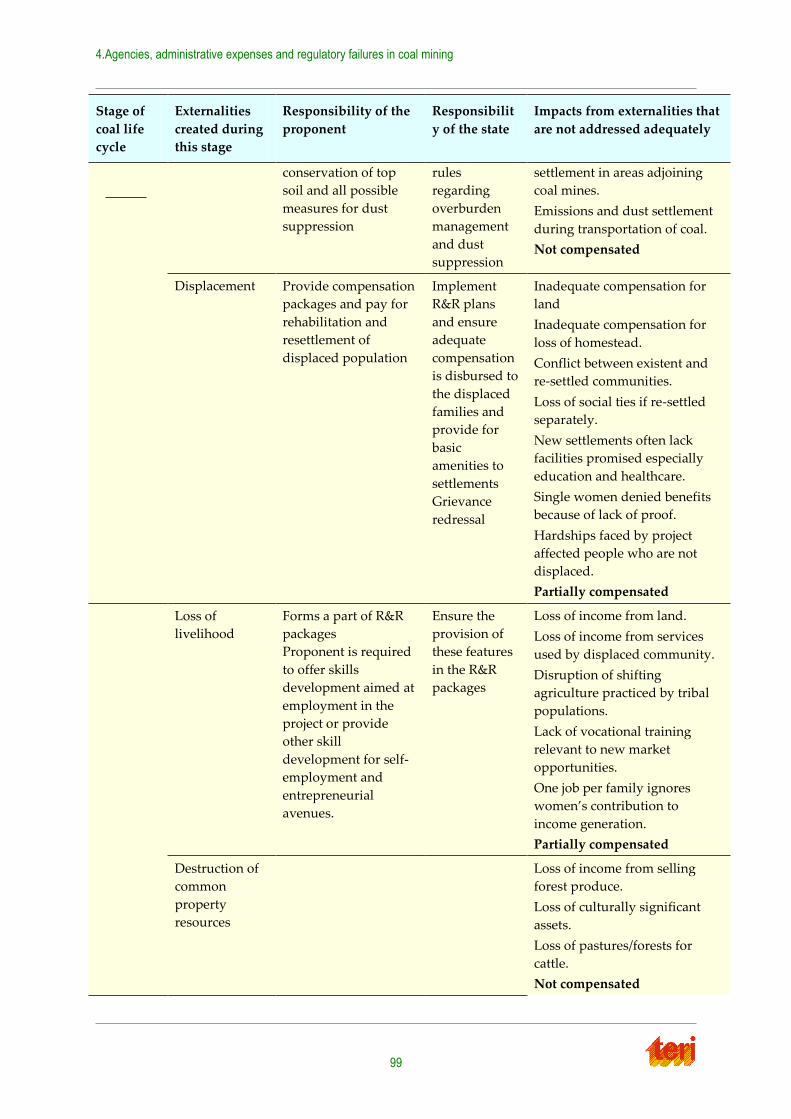
4.Agencies, administrative expenses and regulatory failures in coal mining
99
Stage of
coal life
cycle
Externalities
created during
this stage
Responsibility of the
proponent
Responsibilit
y of the state
Impacts from externalities that
are not addressed adequately
conservation of top
soil and all possible
measures for dust
suppression
rules
regarding
overburden
management
and dust
suppression
settlement in areas adjoining
coal mines.
Emissions and dust settlement
during transportation of coal.
Not compensated
Displacement Provide compensation
packages and pay for
rehabilitation and
resettlement of
displaced population
Implement
R&R plans
and ensure
adequate
compensation
is disbursed to
the displaced
families and
provide for
basic
amenities to
settlements
Grievance
redressal
Inadequate compensation for
land
Inadequate compensation for
loss of homestead.
Conflict between existent and
re-settled communities.
Loss of social ties if re-settled
separately.
New settlements often lack
facilities promised especially
education and healthcare.
Single women denied benefits
because of lack of proof.
Hardships faced by project
affected people who are not
displaced.
Partially compensated
Loss of
livelihood
Forms a part of R&R
packages
Proponent is required
to offer skills
development aimed at
employment in the
project or provide
other skill
development for self-
employment and
entrepreneurial
avenues.
Ensure the
provision of
these features
in the R&R
packages
Loss of income from land.
Loss of income from services
used by displaced community.
Disruption of shifting
agriculture practiced by tribal
populations.
Lack of vocational training
relevant to new market
opportunities.
One job per family ignores
women’s contribution to
income generation.
Partially compensated
Destruction of
common
property
resources
Loss of income from selling
forest produce.
Loss of culturally significant
assets.
Loss of pastures/forests for
cattle.
Not compensated
Equitable sharing of benefits arising from coal mining and power generation among resource rich states
100
Stage of
coal life
cycle
Externalities
created during
this stage
Responsibility of the
proponent
Responsibilit
y of the state
Impacts from externalities that
are not addressed adequately
Mine
Closure
Land
degradation
All possible measures
for remediation and
reclamation of
degraded land and
return it to original
state
Ensure
compliance to
rules and
ensure
restoration of
land to
original state
Land degradation resulting in
barren lands and waste dumps
with increased risk of
contamination if not managed
properly.
Opportunity costs of land
under abandoned mines for
which the state governments do
not get any revenues and
cannot put to other uses.
Not compensated
Loss of
livelihood
Loss of job on closure of mine
and lack of opportunities for
unskilled workers.
The sub sections below highlight some of these regulatory deficits:
Pre mining stage
Environmental clearances
Problems of implementation have been found with regard to environment clearances as
mandated under the EPA. As reported by the (CAG, 2012) 239 coal projects have been found
operating without clearances. During stakeholder consultations with Jharkhand State
Pollution Control Board, it was found that many coal mining companies in Jharkhand are
operating without environmental clearances. Out of 60 CCL mines, only 35 mines were
reported to have environmental clearance. Similarly, in case of ECL, out of 17-18 mines, only
3-4 had environmental clearance. The process of EIA comprising mandatory screening,
scoping and public consultations is also fraught with certain inherent challenges.
A workshop conducted by TERI in 2011- ‚Making Minerals Development Work for the
People‛, brought forward issues highlighted by stakeholders in the EIA and its processes.
Some of the issues discussed were –
Collection of data is inaccurate & the methodology adopted for EIA is unscientific
There is a conflict of interest as the project proponents themselves get the EIA
conducted
Fabrication, reproducing old information, or avoiding crucial facts from the EIA
document is common
Process of public hearings/consultations is almost farcical; often government officials
collude with company to intimidate those attending the public hearing and voice is
snuffed.
4.Agencies, administrative expenses and regulatory failures in coal mining
101
In absence of cumulative impact assessments, many lease areas comprising smaller
areas (less than 5 hectares) are excluded from the requirement of an EIA, leading to
unchecked mining and exploitation
Most of the assessments are conducted during summer season when the land is drier
and meaner. As a result, water courses are generally neglected in EIAs.
Issue of implementation and inadequate capacity of the appraising as well as
monitoring authorities make the EIA process a mere administrative formality50
Measures to compensate for forest land diverted
During stakeholder consultations with officials in the forest department in Ranchi,
Jharkhand51, it was found that compensatory afforestation has also not been done for many
mining projects. The stakeholders in the forest department informed that coal mining
companies generally transfer funds to CAMPA in time; however, the follow up action of
implementing the program by the state government is not done. Non- release of funds from
CAMPA due to lack of co-ordination between central and state governments has been the
major reason behind the lag. Also, it was reported that in the projects in which CA has been
done, no emphasis was given to restoring the original ecological order and biodiversity of
the area. It was done more for the sake of meeting the policy requirement.
A recent report by the CAG focused on the activities of CAMPA highlighted numerous
shortcomings on the operationalization of compensatory afforestation and unauthorized
diversion of forest land which is a violation of the environmental regime. Some of these are
shortcomings are summarized below –
Only 27% of non-forest land was received by the government for compensatory
afforestation and only 7% of land was actually under compensatory afforestation.
48% of the non-forest land received for the purpose of CA was actually transferred to
Forest departments and only 14% of this land received was declared as Reserve
forest.
The CAG noted that there is poor data collection and maintenance by regional offices
of MOEF and the state forest departments. There is an absence of MIS and
consolidated databases for monitoring of activities.
The report particularly mentions that there has been unauthorized renewal of mining
leases in Rajasthan and Odisha without approval from central government. There
has been arbitrariness in forestry clearances, unauthorized renewal of leases, cases of
illegal mining, projects operating without environmental clearances and an
unauthorized change in the status of forest lands. In terms of action, only 3 instances
have been noted that too to the extent of show cause notice.
The CAG noted a significant non-recovery and under-assessment of NPV and CA
(penal or additional) in states of Odisha, Jammu & Kashmir, Madhya Pradesh,
Tripura, Assam, Uttarakhand, Gujarat, Jharkhand, Manipur and Chattisgarh.
50
Stakeholder workshop conducted by TERI on ‚Making Minerals Development Work for the People‛, held on
December 2, 2011 51
These consultations were made in 2011 under the project on Responsible sovereignty and Energy Resources‛
supported by Konrad Adenauer Stiftung (KAS) during 2011
Equitable sharing of benefits arising from coal mining and power generation among resource rich states
102
Adhoc CAMPA was ineffective in ensuring complete and timely transfer of money
collected by states and UTs.
Only 61% of the funds released for CA have been utilized due to delay in APO
preparation and delay in release of funds.
Expenditures incurred by Adhoc CAMPA and state CAMPA have been without
legislature authorization and there have been no reports of incomes and outgoing
expenditures. (Comptroller and Auditor General of India, 2013)
Also land that is taken up for compensatory afforestation is often common lands taken from
people without prior consent or compensation. This land is then transferred to the Forest
Department, becomes protected forest once afforested, alienating people from their use.
Performance with regard to compensation for land, resettlement and
rehabilitation
According to an official at the Odisha Department of Revenue -
“Compensation for land is a long drawn process and even circle rates change before
compensation is awarded. There are challenges in handing over as well. We have had some
cases where the land was paid for but the company did not take possession which created
problems for the department.” (Taradutt, 2013)
In Odisha, arbitrary differences are observed in the amount of compensation for
quantitatively and qualitatively similar land (Nari Surakhshya Samiti, 2010). Worse, in
Jharkhand, ten years after the original acquisition took place; oustees in Parej East have still
not received any compensation (The Hindu, 2003).
At the other extreme, land compensation often works as a lump-sum wind-fall for the
displaced individual, which is then spent indiscriminately (Garada, 2013). According to the
same official at the Odisha Department of Revenue, there is a real need for wealth
management advice to be available to displaced individuals (Taradutt, 2013).
Homestead compensation
The loss of homestead is often the only ‚landlessness‛ contemplated for compensation in the
R&R plans. This is negated, for example, in the village of Agaria Tola (Jharkhand) by the
Government acquiring land around 18 houses, rendering them virtually unliveable without
entitling them to any benefits (Imam, 2007).
In Talcher (Odisha), from the inception of Mahanadi Coalfields Limited’s open cast
operations up until 2010, 65% of the project affected families have not received homesteads
or homestead compensation. Out of those who have received benefits, only 17% have
received a homestead plot. Neither the details of the plots nor the methodology of
determination of cash compensation are freely available (Nari Surakhshya Samiti, 2010).
Moreover, rehabilitation progress statements issued by the company have been shown to
not tally with the pace of house construction at resettlement sites in Jharkhand (Imam, 2007).
4.Agencies, administrative expenses and regulatory failures in coal mining
103
Employment/compensation in lieu of employment
While the policies offer, in the understanding of the displaced, an option between
employment and compensation against livelihood from land, this is circumvented by the
inclusion of terms in the policy such as ‚as far as possible‛. On the ground, this translates as
a ‚statement of options, rather than an intention‛; PAPs almost always receive
compensation rather than a job (Imam, 2007). Further, CIL representatives’ propensity to
create the false expectation of a job in CIL has been criticized by the World Bank’s Inspection
Committee (Herbert & Lahiri-Dutt, 2004).
In Talcher, from inception to 2010, around a fifth of the families identified as PAFs have
received neither employment nor compensation. (Nari Surakhshya Samiti, 2010). In Parej
East, income from land plus forest produce plus agricultural labour, annually, stood at Rs.
9,600/- a year. Under the supervision of the World Bank, the projects offered jobs to PAFs
which paid just over Rs. 9,000/- a year. Factoring in the cost of buying food rather than
growing, net income inflows actually decreased as a result of the project (Bhushan & Suneja,
2012).
The discretionary nature of the grant of jobs means that jobs usually go to educated males
from upper castes, thus widening socio-economic gaps in these areas (Fernandes W. , Mines,
Mining and Displacement in India, 2007).
Worst of all, employment, when granted, was used as a bargaining chip against the family.
In Handidhua (Odisha), families were threatened that if they do not comply without protest
in evacuation, the job-holder would be transferred to some far off place (Somayaji S. , 2012).
Self-employment and entrepreneurship
Self-employment is supposed to be the major driver in rehabilitating the landless affected
population. Success, however, has been less than stellar. Under the World Bank’s CSESMP,
1660 people were trained for self-employment between 1998 and 2001; many did not even
turn up out of the fear that accepting the training would mean forfeiting the promise of a
job. Out of 1660, only 946 are recorded as earning a livelihood out of self-employment
(Bhattacharya, 2004).
Anecdotal evidence from East Parej about the entrepreneurial attempts of displaces bears
out this mixed record of self-employment –
“…Shikari Manjhi tried to open a Gumti - shop near the coal dump but it failed. Merilal tried
a poultry farm and that too failed. Kallu also tried a poultry farm and that too failed. Beniram
bought a tracer -407 (8 to 10 seater jeep normally used as a shared taxi) with the
compensation money, but he was forced to sell it at a low price, because it didn’t work.
Dhaniram bought a car which is sitting in his garage. Mehilal Murmu started a bicycle repair
shop, as it didn’t work, and he has ended up raising pigs. Anil Hembrom from Lopongtandi
has started a grocery shop but he is hardly there in his shop.” (Mundu, 2003)
In addition, cane-basket weaving, which was a successful initiative that blended the
traditional skills of the Turi tribes with economic opportunity, fell into mis-management
when the company failed to provide a stable supply of raw materials and refused to buy the
baskets in violation of the original understanding between the displaces and the company
(Mundu, 2003).
Equitable sharing of benefits arising from coal mining and power generation among resource rich states
104
In the words of the Inspection Committee of the World Bank, these aspirations to self-
employment schemes ‚<relied almost entirely on non-farm self-employment as the strategy
to regain standards of living, without assessing its feasibility for income restoration...‛
(World Bank Inspection Panel, 2002). It also considered the World Bank’s expectations for
entrepreneurship development to pay dividends within five years to be ‚unrealistic‛. The
Committee concluded that rehabilitation in Parej East fell well short as a result of these
planning failures.
Tribal/indigenous population
Tribal populations are often excluded from the scope of the R&R policy because they cannot
prove legal ownership of land. For tribal populations, the route to proving ownership is
through the registration of community rights under the Scheduled Tribes and Other
Traditional Forest Dwellers (Recognition of Forest Rights) Act. However, evidence from the
Singrauli region reveals that applications for community ownership are few and actual
completed registration of community rights over land are practically non-existent
(Greenpeace India). Further, in Chhattisgarh, the processing rate for such applications is
disappointing; with officials still uncertain about how many un-addressed applications exist.
Several of these applications are in relation to lands proposed to be acquired for coal mining
(Sethi, 2011).
The R&R policies require that common property resources be re-created in the new
settlement area. The village of Hansdiha (West Bengal) originally included 6% of forest land
in its total area with bamboo, mango and mahua trees, among others. The forest was a
source of vegetables, fruits, firewood, oil, even a local alcoholic drink used in community
rituals. In the rehabilitation site, however, there is no forest at all. This has had significant
impacts on the day-to-day existence and the cultural identity of the displaced communities
(Mourya & Chakraborty, 2012).
Under the terms of the World Bank’s CSESMP, CIL and its subsidiaries were required to
draft tailor-made Indigenous People Rehabilitation Plans, taking into account the specifics of
the population in each mining area. They instead got approval for a generic IPRP, which was
then re-utilised across locations without any adjustment. Moreover, the Annual Report on
the implementation of the IPRP was often copied verbatim from year to year as well as
between regions (World Bank Inspection Panel, 2002). Some distance remains, therefore,
between requiring that the issue of indigenous populations be addressed and actually
addressing them in an effective manner.
Resettlement facilities
Considering that the land and homestead in resettlement colonies are necessarily limited
compared to what displaced populations were used to, facilities such as water, roads,
electricity, medical supplies/advice and education can make the difference between
stagnation and progress. Though the R&R policies prescribe that resettlement must be
accompanied by such facilities, the actual provision of them is haphazard.
In Hanumanpur (Odisha), despite R&R policies guaranteeing the same, there was no
cremation ground, grazing ground, temple, health facilities, proper road, drinking water, or
drainage system. To the displaced individuals, all the guarantees seemed like a farce (World
Bank Inspection Panel, 2002).
4.Agencies, administrative expenses and regulatory failures in coal mining
105
In Parej East (Jharkhand), Central Coalfields Limited built a school which was left without a
teacher. CCL insisted that it was the State Government’s responsibility to provide one;
however, the Inspection Committee of the World Bank found that promises to the contrary
were made by CCL when originally convincing the population to move (World Bank
Inspection Panel, 2002).
Around Talcher (Odisha), for example, resettlement colonies suffer from defunct water
pipelines. The potable water issue has developed into a women’s movement in Odisha,
under the leadership of the Mahila Jagaran Manch. They are outraged that women have to
trudge miles to fetch water from natural streams and consider it Mahanadi Coalfields
Limited’s moral responsibility in light of its usurpation of their lands (Choudhury et al.,
2012). The district Government has stepped in to remedy the situation (for which the
population is appreciative) but MCL is seen as having failed in its original responsibility to
provide potable water (Choudhury et al., 2012).
In addition to sometimes covering for lapses by the project proponent, the State Government
also has to provide these resettled populations with documentation such as income
certificates, domiciles, proof of address, APL, BPL cards, insurance schemes. This is a
challenging proposition because, for example, in Jharkhand – a Scheduled Area State – many
individuals do not have this documentation in the first place (Rastogi, 2013). Moreover,
according to officials of the Odisha Department of Steel & Mines, the proponent does not
pay anything beyond what is explicitly required by the R&R policy, such as a new
substation or other requirements needed to set up the new settlement (Verma, 2013).
Mining stage
Impact monitoring and rule enforcement during mining operations
The problems of co-ordination across various government departments and institutions
have resulted in various problems and have been identified as a major concern among
stakeholders during consultations52. For instance, various problems related to dust, coal
spill-outs and other environmental externalities have resulted due to lack of co-ordination
between SPCBs, which have responsibility of ensuring that trucks carrying coal are covered
with tarpaulin, and state transport departments which are responsible for regulating
overloading of coal in trucks or trains. The problem of co-ordination between DGMS and
local police with respect to mining accidents also came out during discussions. In addition to
co-ordination issues, overlaps among jurisdictions have been observed, which create
problems and reduces effectiveness of regulations. Regional office of MoEF and SPCBs, for
instance, have similar roles and responsibilities of monitoring and enforcing various laws
applicable to air, water, and land.
There is an obvious conflict in policy decisions that results in the development and
continuation of mining activities in critically polluted areas such as Korba (CEPI 83.0) in
Chattisgarh, Dhanbad (CEPI 78.63) in Jharkhand and Angul Talcher (CEPI 82.09), Ib Valley
(CEPI 74.0) and Jharsuguda (CEPI 73.34) in Odisha.53 Moreover the policy decisions directed
52
These consultations were made in 2011 under the project on Responsible sovereignty and Energy Resources‛
supported by Konrad Adenauer Stiftung (KAS) (TERI 2011) 53http://pib.nic.in/newsite/erelease.aspx?relid=59156
Equitable sharing of benefits arising from coal mining and power generation among resource rich states
106
towards increasing the efficiency of thermal power plants across the country and reduce
transportation costs – only washed coal to be transported beyond 1000 kms – has resulted in
coal washing activities being sited in these critically polluted areas within coal bearing states
that exacerbates the problems of ash, water pollution and increases the demand for water.
Planning for coal mine closure
With regard to mine closure and restoration, for instance, the companies have been found
not adhering to practices as mandated by the policies, and there have been no stringent
actions taken in this regard. As per (CAG, 2012) no mine closure plans have been prepared
for mines which are to be closed within 2 to 4 years. A backlog in backfilling and technical
reclamation of 12,643 hectare land has been found in seven subsidiaries of CIL as on March
31, 2010. Also, the policy of preserving and re-using top soil for reclamation is not followed
in practice. Out of 18 open cast mines covered in CAG audit, top soil was found to be
preserved in only 5 mines. Also, it has been reported that in mines where restoration and
reclamation were observed, the methods did not confirm to national standards.
The regulatory bodies are clearly ineffective in regulating and monitoring the different
aspects of coal development to ensure that the developer keeps the environmental and social
footprint to a minimum. While mining will have an impacts on the environment and
people, good governance and rule enforcement can ensure more responsible mining
practices.
Major factors that were reported for their ineffectiveness are shortages of skilled manpower
and inadequate availability of equipment. These factors have been highlighted during
discussions with various regulatory bodies that include SPCBs, DGMS, State transport
department, State forest department etc. In addition, political influence has been reported to
be the major factor behind no or inadequate responsiveness of the regulatory bodies to the
observed fallacies. In many cases, loopholes in implementations are deliberately ignored
given the importance of coal for electricity generation and the grave impact on the economy
as a result of any disruptions in the coal supply.
Mine closure stage
Land degradation and abandoned mines
The issue of land degradation is not limited to a certain stage of the coal mining process but
is a challenge across all stages of mine development, operation and closing. The issue gains
importance in the mine closure stage as actual remediation and reclamation are meant to be
initiated in this stage and are the biggest expenses incurred by the mine operator as well as
regulatory agencies. The externality of land degradation is created to due overburden stacks
and lack of mine waste management which may result in leaching of heavy metals into soil
and deterioration of nearby forest and productive land because of dust from overburden
dumps. As has been mentioned in sections above, top soil management is lacking in coal
mines of our country and the mine waste management by mine operators has been
unsatisfactory.
There is a lack of proper planning and assessment of waste generation and management on
the part of the operators as well as the regulatory bodies of MOEF, Ministry of Coal and the
respective state departments at the time of approvals and clearances for developing a mine.

4.Agencies, administrative expenses and regulatory failures in coal mining
107
The purpose of the approvals and clearances is to estimate the damages that may be caused
during and after the productive life of a mine and not only provide guidelines for
management but also ensure that the resulting costs are not higher than the benefits. Beyond
these there is also a lack of monitoring on the performance on mine closure plans by the
respective state departments for environment and mines.
The issue of abandoned mines is even more critical as they signify lack of safeguards and
abatement from the mine developers’ side and the onus for management, closure,
remediation and reclamation falls with the state departments.

Equitable sharing of benefits arising from coal mining and power generation among resource rich states
109
5. Estimation of costs of externalities due to
coal mining and coal based power generation
External costs refer to cost of damage imposed on the environment and society but are not
accounted for in market price of the resource. Coal mining and electricity production have
various affects like impact on health due to air and water pollution, impact on agriculture,
forests and global warming potential, occupational disease and accidents etc. While some of
the costs may be internalized as per the EIA guidelines, certain external costs may still go
unaccounted for. On the basis of the principle, that the polluter needs to pay the full price of
the product (here electricity production) the use of life cycle cost as an approach for
estimation of above externalities is increasingly being used for valuing true cost of electricity
generation.
There are many approaches to the estimation of external costs due to coal mining and TPP.
They can broadly be classified as (i) top down and (ii) bottom-up. The top down approach
was extensively used by Hohmeyer (1988) for the first time to arrive at the external costs of
all major fuels used in electricity generation in Germany and relied on secondary macro
level estimates related to total damages. In the early 1990s, Bernow and Marron used the
cost of pollution control as a proxy for possible valuation of environmental externalities for
energy planning and operations. The economic principle behind the use of cost of pollution
control as estimation of external cost is that the marginal abatement cost of emissions is
equal to the marginal damage cost.
Bottom up approaches on the other hand; use both primary and secondary data, that
project/location specific, in estimating the external cost. For example, Ottinger, et.al (1990) in
estimating the environmental costs of electricity and, Pearce (1992) in estimating the social
cost of fuel cycle has used the bottom up approach using secondary information. Despite
enjoying certain advantages due to better results, there are challenges associated with
collection of primary data. For instance, primary data collection may be time consuming
because it involves the employment of dose–response functions to track the emission path
way from the source to the receptor (D. Mahapatra et al, 2011). Other concerns include
consequent monetization of the impacts, difficulty in learning the project specific social
impacts in the form of displacement and loss of livelihood and finally, the involvement of
multidisciplinary teams.
In this study the overall approach adopted is the life cycle analysis for estimating the
environmental and social impacts of production of electricity from conventional coal based
power generation systems. It is important to note that the external costs estimated in this
chapter have mostly been based on collection and analysis of secondary data collected from
varied literature. While the estimates cover the types of impacts at different stages of the life
cycle of coal mining and coal based power generation highlighted in Chapter 2, the study
does not attempt to actually value the total damages discussed there. That would require
much more detailed assessment on the field, data, and more time. Key phases in the life
cycle approach include:
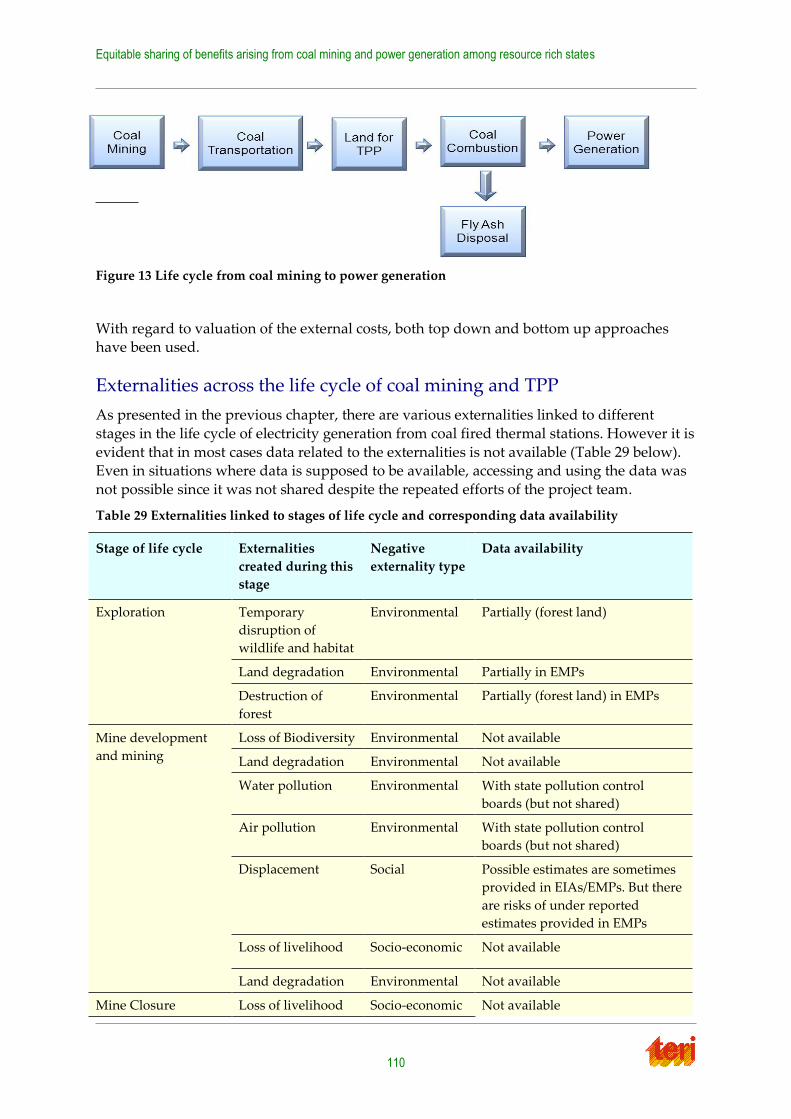
Equitable sharing of benefits arising from coal mining and power generation among resource rich states
110
Figure 13 Life cycle from coal mining to power generation
With regard to valuation of the external costs, both top down and bottom up approaches have been used.
Externalities across the life cycle of coal mining and TPP
As presented in the previous chapter, there are various externalities linked to different
stages in the life cycle of electricity generation from coal fired thermal stations. However it is
evident that in most cases data related to the externalities is not available (Table 29 below). Even in situations where data is supposed to be available, accessing and using the data was
not possible since it was not shared despite the repeated efforts of the project team.
Table 29 Externalities linked to stages of life cycle and corresponding data availability
Stage of life cycle Externalities
created during this
stage
Negative
externality type
Data availability
Exploration Temporary
disruption of
wildlife and habitat
Environmental Partially (forest land)
Land degradation Environmental Partially in EMPs
Destruction of
forest
Environmental Partially (forest land) in EMPs
Mine development
and mining
Loss of Biodiversity Environmental Not available
Land degradation Environmental Not available
Water pollution Environmental With state pollution control
boards (but not shared)
Air pollution Environmental With state pollution control
boards (but not shared)
Displacement Social Possible estimates are sometimes
provided in EIAs/EMPs. But there
are risks of under reported
estimates provided in EMPs
Loss of livelihood Socio-economic Not available
Land degradation Environmental Not available
Mine Closure Loss of livelihood Socio-economic Not available
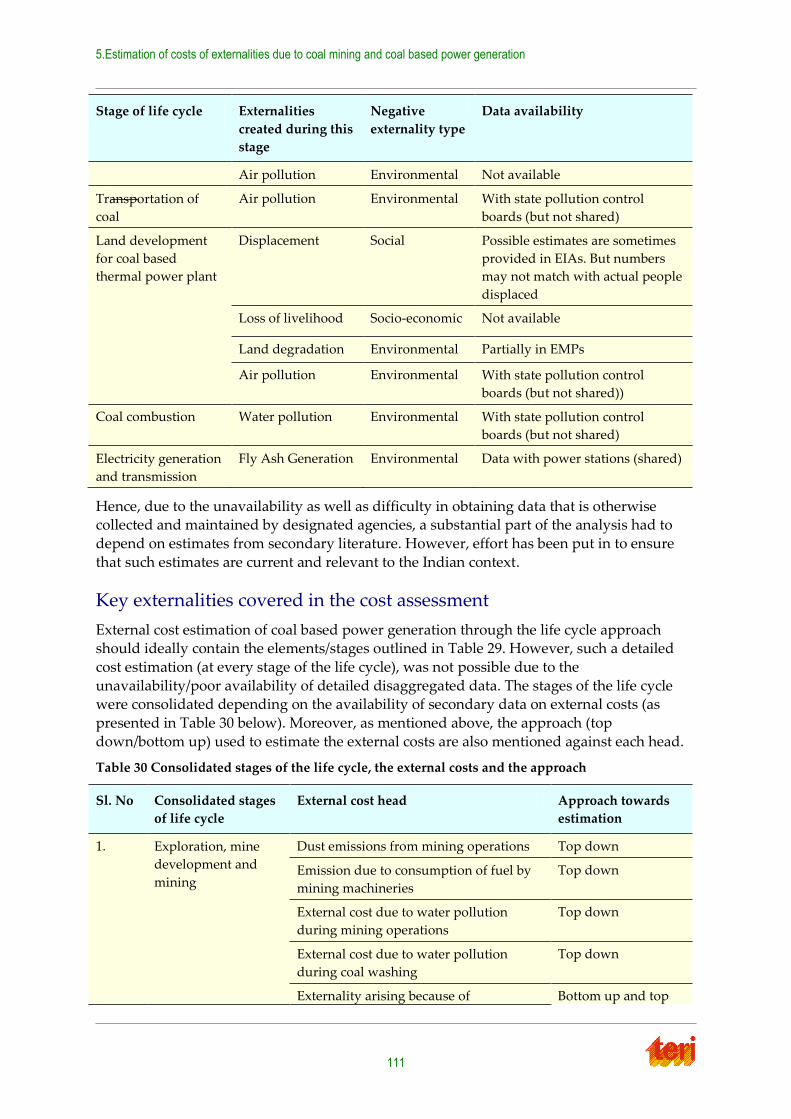
5.Estimation of costs of externalities due to coal mining and coal based power generation
111
Stage of life cycle Externalities
created during this
stage
Negative
externality type
Data availability
Air pollution Environmental Not available
Transportation of
coal
Air pollution Environmental With state pollution control
boards (but not shared)
Land development
for coal based
thermal power plant
Displacement Social Possible estimates are sometimes
provided in EIAs. But numbers
may not match with actual people
displaced
Loss of livelihood Socio-economic Not available
Land degradation Environmental Partially in EMPs
Air pollution Environmental With state pollution control
boards (but not shared))
Coal combustion Water pollution Environmental With state pollution control
boards (but not shared)
Electricity generation
and transmission
Fly Ash Generation Environmental Data with power stations (shared)
Hence, due to the unavailability as well as difficulty in obtaining data that is otherwise collected and maintained by designated agencies, a substantial part of the analysis had to
depend on estimates from secondary literature. However, effort has been put in to ensure
that such estimates are current and relevant to the Indian context.
Key externalities covered in the cost assessment
External cost estimation of coal based power generation through the life cycle approach should ideally contain the elements/stages outlined in Table 29. However, such a detailed
cost estimation (at every stage of the life cycle), was not possible due to the
unavailability/poor availability of detailed disaggregated data. The stages of the life cycle were consolidated depending on the availability of secondary data on external costs (as
presented in Table 30 below). Moreover, as mentioned above, the approach (top
down/bottom up) used to estimate the external costs are also mentioned against each head.
Table 30 Consolidated stages of the life cycle, the external costs and the approach
Sl. No Consolidated stages
of life cycle
External cost head Approach towards
estimation
1. Exploration, mine
development and
mining
Dust emissions from mining operations Top down
Emission due to consumption of fuel by
mining machineries
Top down
External cost due to water pollution
during mining operations
Top down
External cost due to water pollution
during coal washing
Top down
Externality arising because of Bottom up and top
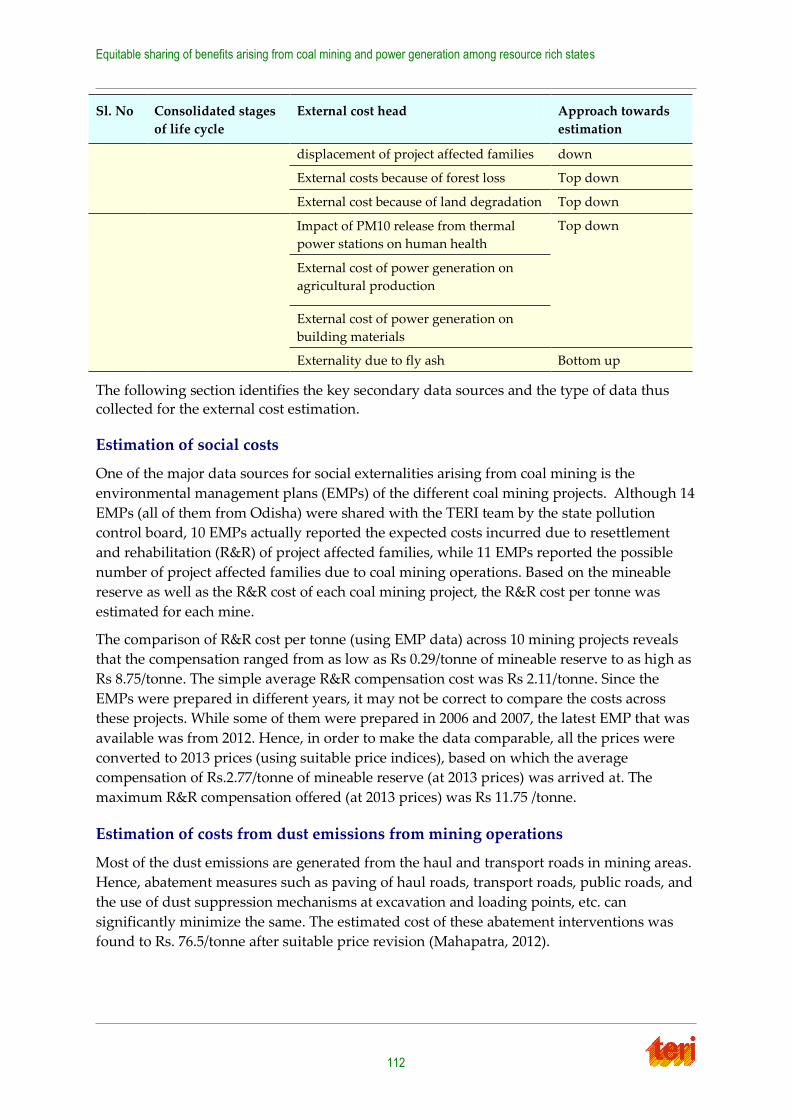
Equitable sharing of benefits arising from coal mining and power generation among resource rich states
112
Sl. No Consolidated stages
of life cycle
External cost head Approach towards
estimation
displacement of project affected families down
External costs because of forest loss Top down
External cost because of land degradation Top down
Impact of PM10 release from thermal
power stations on human health
Top down
External cost of power generation on
agricultural production
External cost of power generation on
building materials
Externality due to fly ash Bottom up
The following section identifies the key secondary data sources and the type of data thus
collected for the external cost estimation.
Estimation of social costs
One of the major data sources for social externalities arising from coal mining is the
environmental management plans (EMPs) of the different coal mining projects. Although 14
EMPs (all of them from Odisha) were shared with the TERI team by the state pollution
control board, 10 EMPs actually reported the expected costs incurred due to resettlement
and rehabilitation (R&R) of project affected families, while 11 EMPs reported the possible
number of project affected families due to coal mining operations. Based on the mineable
reserve as well as the R&R cost of each coal mining project, the R&R cost per tonne was
estimated for each mine.
The comparison of R&R cost per tonne (using EMP data) across 10 mining projects reveals
that the compensation ranged from as low as Rs 0.29/tonne of mineable reserve to as high as
Rs 8.75/tonne. The simple average R&R compensation cost was Rs 2.11/tonne. Since the
EMPs were prepared in different years, it may not be correct to compare the costs across
these projects. While some of them were prepared in 2006 and 2007, the latest EMP that was
available was from 2012. Hence, in order to make the data comparable, all the prices were
converted to 2013 prices (using suitable price indices), based on which the average
compensation of Rs.2.77/tonne of mineable reserve (at 2013 prices) was arrived at. The
maximum R&R compensation offered (at 2013 prices) was Rs 11.75 /tonne.
Estimation of costs from dust emissions from mining operations
Most of the dust emissions are generated from the haul and transport roads in mining areas.
Hence, abatement measures such as paving of haul roads, transport roads, public roads, and
the use of dust suppression mechanisms at excavation and loading points, etc. can
significantly minimize the same. The estimated cost of these abatement interventions was
found to Rs. 76.5/tonne after suitable price revision (Mahapatra, 2012).
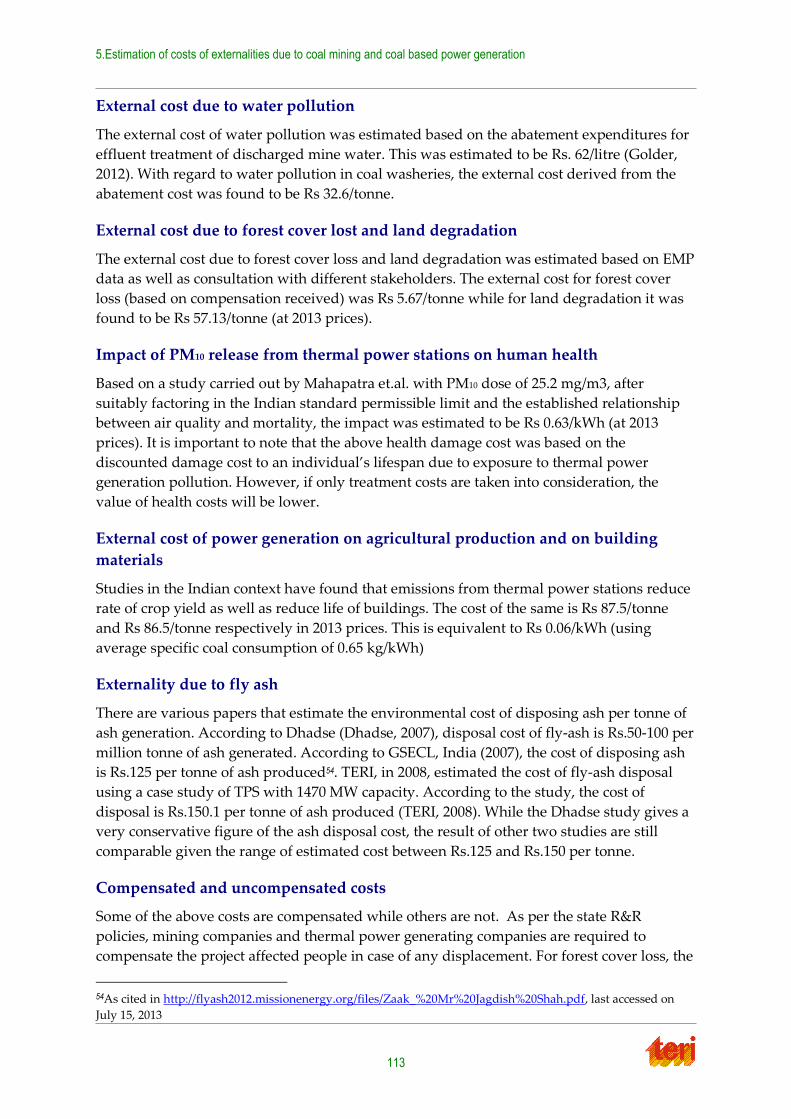
5.Estimation of costs of externalities due to coal mining and coal based power generation
113
External cost due to water pollution
The external cost of water pollution was estimated based on the abatement expenditures for
effluent treatment of discharged mine water. This was estimated to be Rs. 62/litre (Golder,
2012). With regard to water pollution in coal washeries, the external cost derived from the
abatement cost was found to be Rs 32.6/tonne.
External cost due to forest cover lost and land degradation
The external cost due to forest cover loss and land degradation was estimated based on EMP
data as well as consultation with different stakeholders. The external cost for forest cover
loss (based on compensation received) was Rs 5.67/tonne while for land degradation it was
found to be Rs 57.13/tonne (at 2013 prices).
Impact of PM10 release from thermal power stations on human health
Based on a study carried out by Mahapatra et.al. with PM10 dose of 25.2 mg/m3, after
suitably factoring in the Indian standard permissible limit and the established relationship
between air quality and mortality, the impact was estimated to be Rs 0.63/kWh (at 2013
prices). It is important to note that the above health damage cost was based on the
discounted damage cost to an individual’s lifespan due to exposure to thermal power
generation pollution. However, if only treatment costs are taken into consideration, the
value of health costs will be lower.
External cost of power generation on agricultural production and on building
materials
Studies in the Indian context have found that emissions from thermal power stations reduce
rate of crop yield as well as reduce life of buildings. The cost of the same is Rs 87.5/tonne
and Rs 86.5/tonne respectively in 2013 prices. This is equivalent to Rs 0.06/kWh (using
average specific coal consumption of 0.65 kg/kWh)
Externality due to fly ash
There are various papers that estimate the environmental cost of disposing ash per tonne of
ash generation. According to Dhadse (Dhadse, 2007), disposal cost of fly-ash is Rs.50-100 per
million tonne of ash generated. According to GSECL, India (2007), the cost of disposing ash
is Rs.125 per tonne of ash produced54. TERI, in 2008, estimated the cost of fly-ash disposal
using a case study of TPS with 1470 MW capacity. According to the study, the cost of
disposal is Rs.150.1 per tonne of ash produced (TERI, 2008). While the Dhadse study gives a
very conservative figure of the ash disposal cost, the result of other two studies are still
comparable given the range of estimated cost between Rs.125 and Rs.150 per tonne.
Compensated and uncompensated costs
Some of the above costs are compensated while others are not. As per the state R&R
policies, mining companies and thermal power generating companies are required to
compensate the project affected people in case of any displacement. For forest cover loss, the
54As cited in http://flyash2012.missionenergy.org/files/Zaak_%20Mr%20Jagdish%20Shah.pdf, last accessed on
July 15, 2013
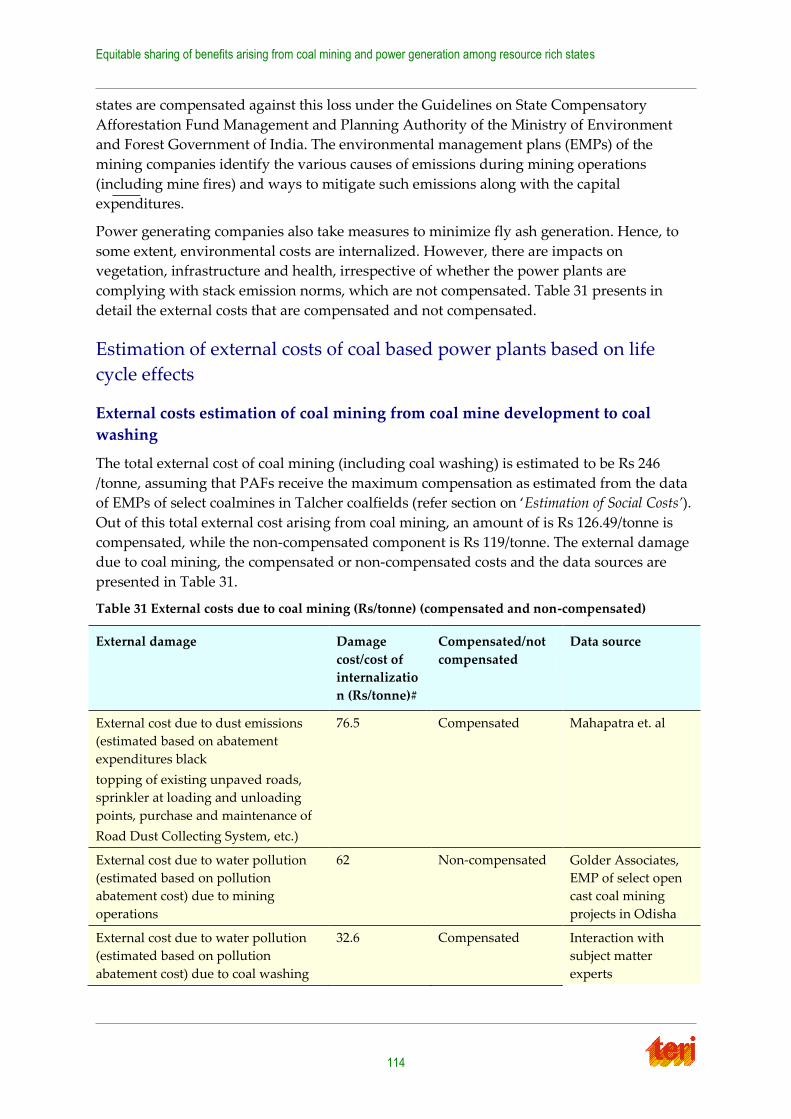
Equitable sharing of benefits arising from coal mining and power generation among resource rich states
114
states are compensated against this loss under the Guidelines on State Compensatory
Afforestation Fund Management and Planning Authority of the Ministry of Environment
and Forest Government of India. The environmental management plans (EMPs) of the
mining companies identify the various causes of emissions during mining operations
(including mine fires) and ways to mitigate such emissions along with the capital
expenditures.
Power generating companies also take measures to minimize fly ash generation. Hence, to
some extent, environmental costs are internalized. However, there are impacts on
vegetation, infrastructure and health, irrespective of whether the power plants are
complying with stack emission norms, which are not compensated. Table 31 presents in
detail the external costs that are compensated and not compensated.
Estimation of external costs of coal based power plants based on life
cycle effects
External costs estimation of coal mining from coal mine development to coal
washing
The total external cost of coal mining (including coal washing) is estimated to be Rs 246
/tonne, assuming that PAFs receive the maximum compensation as estimated from the data
of EMPs of select coalmines in Talcher coalfields (refer section on ‘Estimation of Social Costs’).
Out of this total external cost arising from coal mining, an amount of is Rs 126.49/tonne is
compensated, while the non-compensated component is Rs 119/tonne. The external damage
due to coal mining, the compensated or non-compensated costs and the data sources are
presented in Table 31.
Table 31 External costs due to coal mining (Rs/tonne) (compensated and non-compensated)
External damage Damage
cost/cost of
internalizatio
n (Rs/tonne)#
Compensated/not
compensated
Data source
External cost due to dust emissions
(estimated based on abatement
expenditures black
topping of existing unpaved roads,
sprinkler at loading and unloading
points, purchase and maintenance of
Road Dust Collecting System, etc.)
76.5 Compensated Mahapatra et. al
External cost due to water pollution
(estimated based on pollution
abatement cost) due to mining
operations
62 Non-compensated Golder Associates,
EMP of select open
cast coal mining
projects in Odisha
External cost due to water pollution
(estimated based on pollution
abatement cost) due to coal washing
32.6 Compensated Interaction with
subject matter
experts
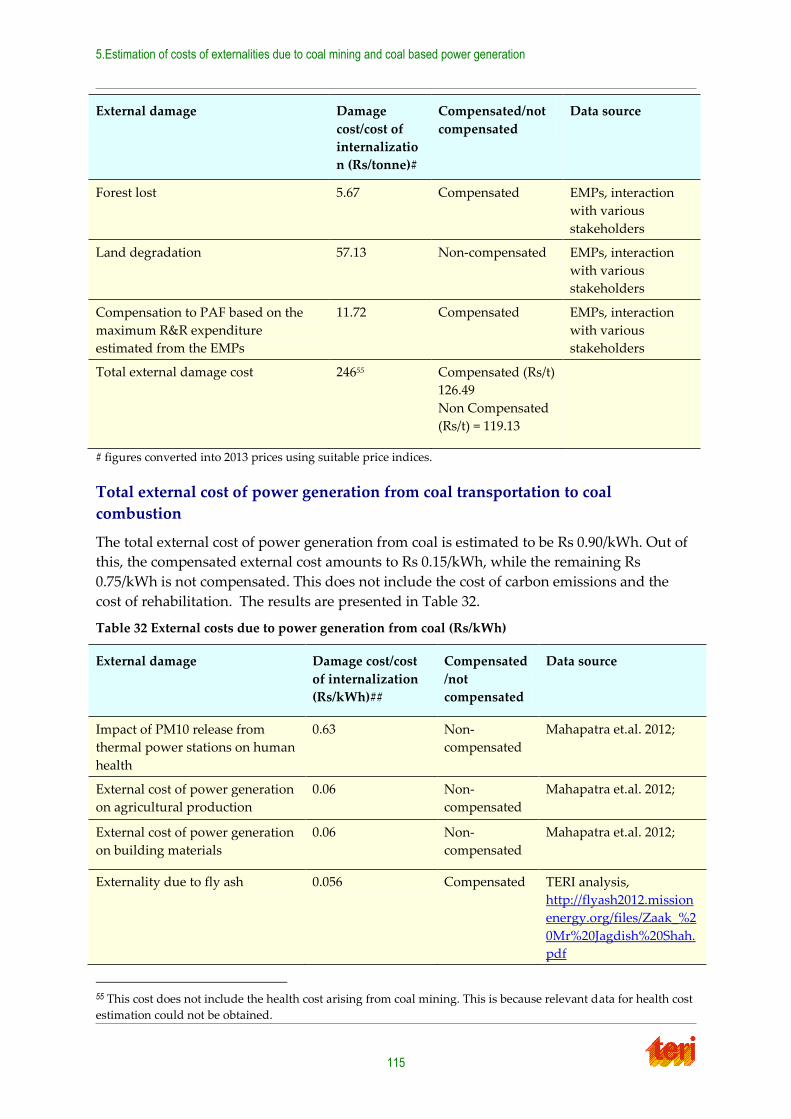
5.Estimation of costs of externalities due to coal mining and coal based power generation
115
External damage Damage
cost/cost of
internalizatio
n (Rs/tonne)#
Compensated/not
compensated
Data source
Forest lost 5.67 Compensated EMPs, interaction
with various
stakeholders
Land degradation 57.13 Non-compensated EMPs, interaction
with various
stakeholders
Compensation to PAF based on the
maximum R&R expenditure
estimated from the EMPs
11.72 Compensated EMPs, interaction
with various
stakeholders
Total external damage cost 24655 Compensated (Rs/t)
126.49
Non Compensated
(Rs/t) = 119.13
# figures converted into 2013 prices using suitable price indices.
Total external cost of power generation from coal transportation to coal
combustion
The total external cost of power generation from coal is estimated to be Rs 0.90/kWh. Out of
this, the compensated external cost amounts to Rs 0.15/kWh, while the remaining Rs
0.75/kWh is not compensated. This does not include the cost of carbon emissions and the
cost of rehabilitation. The results are presented in Table 32.
Table 32 External costs due to power generation from coal (Rs/kWh)
External damage Damage cost/cost
of internalization
(Rs/kWh)##
Compensated
/not
compensated
Data source
Impact of PM10 release from
thermal power stations on human
health
0.63 Non-
compensated
Mahapatra et.al. 2012;
External cost of power generation
on agricultural production
0.06 Non-
compensated
Mahapatra et.al. 2012;
External cost of power generation
on building materials
0.06 Non-
compensated
Mahapatra et.al. 2012;
Externality due to fly ash 0.056 Compensated TERI analysis,
http://flyash2012.mission
energy.org/files/Zaak_%2
0Mr%20Jagdish%20Shah.
55 This cost does not include the health cost arising from coal mining. This is because relevant data for health cost
estimation could not be obtained.
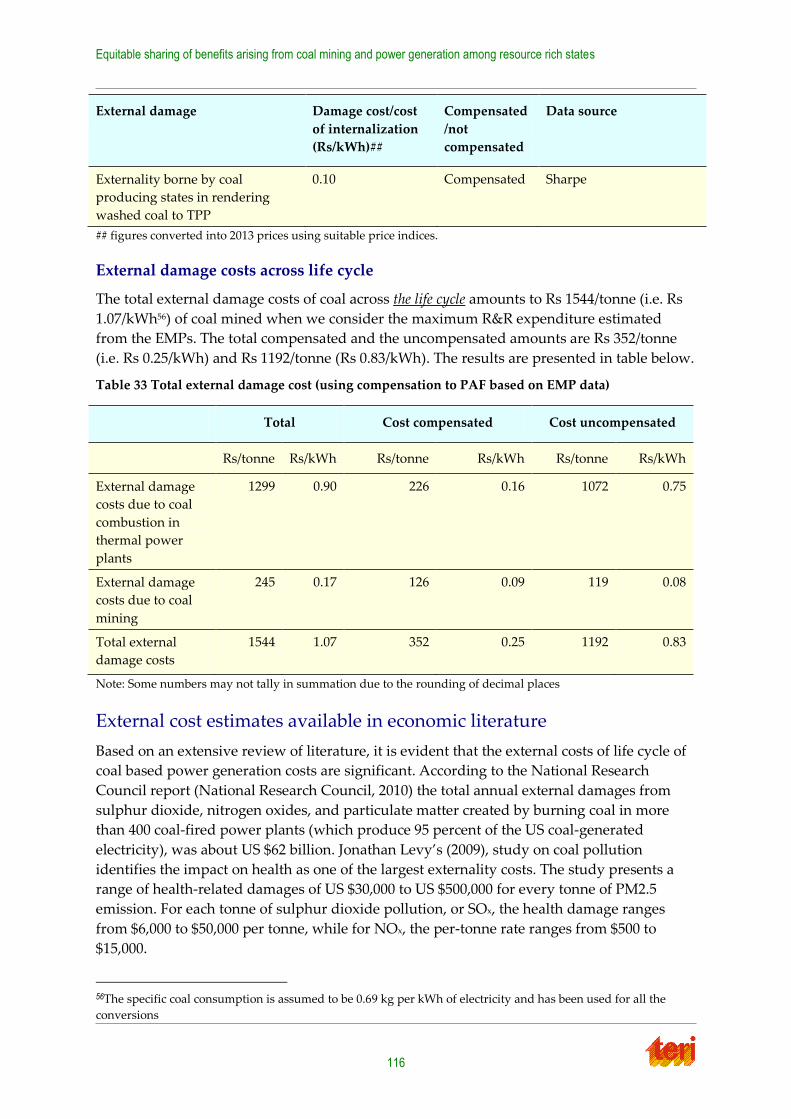
Equitable sharing of benefits arising from coal mining and power generation among resource rich states
116
External damage Damage cost/cost
of internalization
(Rs/kWh)##
Compensated
/not
compensated
Data source
Externality borne by coal
producing states in rendering
washed coal to TPP
0.10 Compensated Sharpe
## figures converted into 2013 prices using suitable price indices.
External damage costs across life cycle
The total external damage costs of coal across the life cycle amounts to Rs 1544/tonne (i.e. Rs
1.07/kWh56) of coal mined when we consider the maximum R&R expenditure estimated
from the EMPs. The total compensated and the uncompensated amounts are Rs 352/tonne
(i.e. Rs 0.25/kWh) and Rs 1192/tonne (Rs 0.83/kWh). The results are presented in table below.
Table 33 Total external damage cost (using compensation to PAF based on EMP data)
Note: Some numbers may not tally in summation due to the rounding of decimal places
External cost estimates available in economic literature
Based on an extensive review of literature, it is evident that the external costs of life cycle of
coal based power generation costs are significant. According to the National Research
Council report (National Research Council, 2010) the total annual external damages from
sulphur dioxide, nitrogen oxides, and particulate matter created by burning coal in more
than 400 coal-fired power plants (which produce 95 percent of the US coal-generated
electricity), was about US $62 billion. Jonathan Levy’s (2009), study on coal pollution
identifies the impact on health as one of the largest externality costs. The study presents a
range of health-related damages of US $30,000 to US $500,000 for every tonne of PM2.5
emission. For each tonne of sulphur dioxide pollution, or SOx, the health damage ranges
from $6,000 to $50,000 per tonne, while for NOx, the per-tonne rate ranges from $500 to
$15,000.
56The specific coal consumption is assumed to be 0.69 kg per kWh of electricity and has been used for all the
conversions
Total Cost compensated Cost uncompensated
Rs/tonne Rs/kWh Rs/tonne Rs/kWh Rs/tonne Rs/kWh
External damage
costs due to coal
combustion in
thermal power
plants
1299 0.90 226 0.16 1072 0.75
External damage
costs due to coal
mining
245 0.17 126 0.09 119 0.08
Total external
damage costs
1544 1.07 352 0.25 1192 0.83
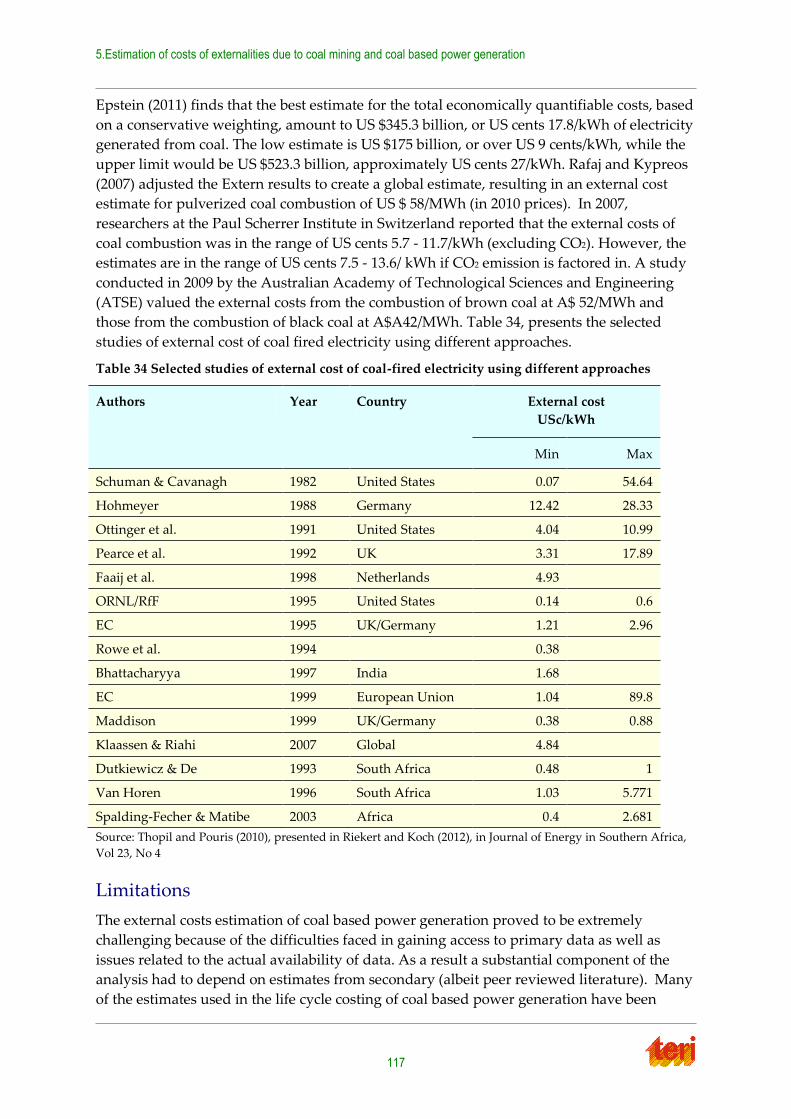
5.Estimation of costs of externalities due to coal mining and coal based power generation
117
Epstein (2011) finds that the best estimate for the total economically quantifiable costs, based
on a conservative weighting, amount to US $345.3 billion, or US cents 17.8/kWh of electricity
generated from coal. The low estimate is US $175 billion, or over US 9 cents/kWh, while the
upper limit would be US $523.3 billion, approximately US cents 27/kWh. Rafaj and Kypreos
(2007) adjusted the Extern results to create a global estimate, resulting in an external cost
estimate for pulverized coal combustion of US $ 58/MWh (in 2010 prices). In 2007,
researchers at the Paul Scherrer Institute in Switzerland reported that the external costs of
coal combustion was in the range of US cents 5.7 - 11.7/kWh (excluding CO2). However, the
estimates are in the range of US cents 7.5 - 13.6/ kWh if CO2 emission is factored in. A study
conducted in 2009 by the Australian Academy of Technological Sciences and Engineering
(ATSE) valued the external costs from the combustion of brown coal at A$ 52/MWh and
those from the combustion of black coal at A$A42/MWh. Table 34, presents the selected
studies of external cost of coal fired electricity using different approaches.
Table 34 Selected studies of external cost of coal-fired electricity using different approaches
Authors Year Country External cost
USc/kWh
Min Max
Schuman & Cavanagh 1982 United States 0.07 54.64
Hohmeyer 1988 Germany 12.42 28.33
Ottinger et al. 1991 United States 4.04 10.99
Pearce et al. 1992 UK 3.31 17.89
Faaij et al. 1998 Netherlands 4.93
ORNL/RfF 1995 United States 0.14 0.6
EC 1995 UK/Germany 1.21 2.96
Rowe et al. 1994 0.38
Bhattacharyya 1997 India 1.68
EC 1999 European Union 1.04 89.8
Maddison 1999 UK/Germany 0.38 0.88
Klaassen & Riahi 2007 Global 4.84
Dutkiewicz & De 1993 South Africa 0.48 1
Van Horen 1996 South Africa 1.03 5.771
Spalding-Fecher & Matibe 2003 Africa 0.4 2.681
Source: Thopil and Pouris (2010), presented in Riekert and Koch (2012), in Journal of Energy in Southern Africa,
Vol 23, No 4
Limitations
The external costs estimation of coal based power generation proved to be extremely
challenging because of the difficulties faced in gaining access to primary data as well as
issues related to the actual availability of data. As a result a substantial component of the
analysis had to depend on estimates from secondary (albeit peer reviewed literature). Many
of the estimates used in the life cycle costing of coal based power generation have been
Equitable sharing of benefits arising from coal mining and power generation among resource rich states
118
sourced from secondary literature whose findings are based on data collected for specific
coal fired thermal power plants. Hence, one of the key limitations of the conclusions on
external costs is that the assumptions made in those studies are being implicitly made here,
possibly resulting in certain biases in the external costs. Moreover, since these studies where
undertaken in the past, certain price indices were used in order to ensure that the costs are
representative of the current levels; it is important to note that such indices are more in the
nature of macro-level numbers and may not capture the true cost change over time, in the
specific sectors being analysed, at every stage of the life cycle.
The external costs estimates are divided into compensated as well as uncompensated costs.
As identified in the previous section of the chapter, such categorization was based on the
discussion with experts concerned as well as provisions under the law. However, in reality,
there may be under or over-compliance. In other words, the nature of pollution
abatement/defensive expenditures incurred along the life cycle may fail to internalize the
actual external damages caused, due to violation of norms or negligence. There can also be
partial compensation of the external damages incurred in the normal compliance process
that are otherwise not mandated to be internalized.
Nevertheless, the numbers derived using the life cycle analysis broadly provides indicative
estimates of the external damage caused and what proportion of the cost is supposed to be
compensated as per the law. Moreover, they also helped to highlight the issues related to
availability of data and difficulty in accessing them. Such limitations call for not only
revising periodically the external costs to capture change and the benefits of technological
improvement to aid in minimizing environmental and social damages but also improves our
understanding of how external costs can effectively be minimized through complying with
environmental and social standards, thus nullifying the costs arising from mis-governance.
Equitable sharing of benefits arising from coal mining and power generation among resource rich states
119
6. Demand for free power in coal rich states
and its tariff implications
The demand of coal rich states is for free power from the coal based power generated in the
states. This demand draws from the National Policy for Hydro Power Development, 57which
assures that twelve percent of the power generated by Central Sector as well as Joint
Venture hydro power projects (between State Electricity Boards or Public Sector Units and
private sector companies) will be provided free of cost to the State in which the project is
located. The underlying rationale is that since the non-exhaustive use of a state’s water
resources cannot attract any royalty payment, an alternative compensatory paradigm is
required.
The genesis of free power in the hydro sector can be traced back to 1982, when in addition to
royalty at 1.5p/unit; the home state was being allocated 10% of the generation capacity. This
provision was amended in 1985 with approval of the Cabinet Committee on Economic
Affairs (CCEA), when the ‘free power’ (12% of power generated) provision was first
introduced, replacing the previous royalty arrangement. A review was conducted in 1990
by the CCEA under which 12% ‘free power’ was to be provided to those states of the region
(including the state where the project is located) where ‘distress was caused by setting up
the project at the specific site.’ As per the policy guidelines, the revenues generated through
free power was to be used for LAD and mitigation of hardship caused to PAPs.
Many coal bearing states are already demanding variable cost power or right of refusal to a
certain amount of power generated by private developers in their states. The provision for
concessional power has either been introduced as a policy by some states or has been
introduced only in the MoUs signed with the IPPs in exchange for facilitating coal based
thermal power projects.
This chapter examines these demands for free/concessional power from the perspective of
different states and assesses their impact on tariffs and state government revenues.
Existing benefits/preferential treatment to host states from central plants
and IPPs:
Based on ownership type, power Projects can be classified broadly into three categories:
centrally owned (CPSU – NTPC in this case), State Owned and private (including UMPPS).
In this section, the existing provisions of preferential treatment to host states for supply of
power from power stations are discussed.
Case of centrally owned projects: (NTPC)
NTPC has about 40% of its total capacity housed in the identified states (13300 MW of 31355
MW58). The details of NTPC plants in these states are given in Table 35, below:
57
Copy of the Policy available at bhttp://www.powermin.nic.in/whats_new/pdf/new_hydro_policy.pdf
58 As in April 2013
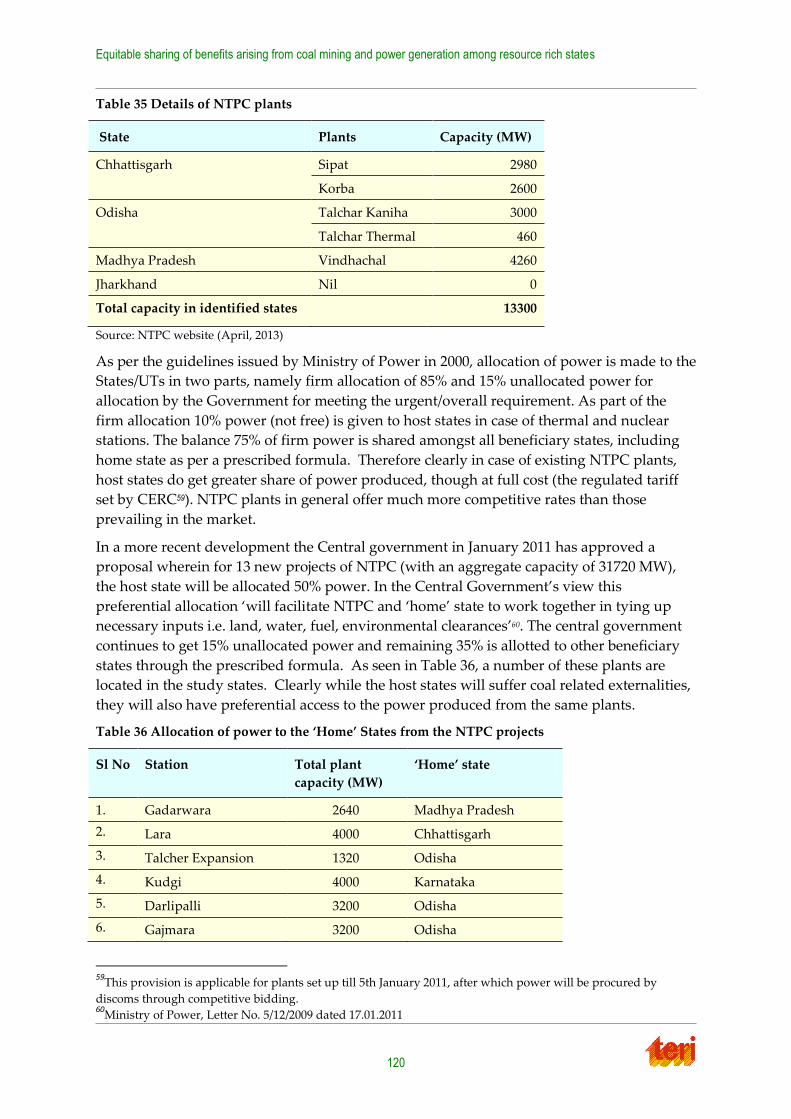
Equitable sharing of benefits arising from coal mining and power generation among resource rich states
120
Table 35 Details of NTPC plants
State Plants Capacity (MW)
Chhattisgarh Sipat 2980
Korba 2600
Odisha Talchar Kaniha 3000
Talchar Thermal 460
Madhya Pradesh Vindhachal 4260
Jharkhand Nil 0
Total capacity in identified states 13300
Source: NTPC website (April, 2013)
As per the guidelines issued by Ministry of Power in 2000, allocation of power is made to the
States/UTs in two parts, namely firm allocation of 85% and 15% unallocated power for
allocation by the Government for meeting the urgent/overall requirement. As part of the
firm allocation 10% power (not free) is given to host states in case of thermal and nuclear
stations. The balance 75% of firm power is shared amongst all beneficiary states, including
home state as per a prescribed formula. Therefore clearly in case of existing NTPC plants,
host states do get greater share of power produced, though at full cost (the regulated tariff
set by CERC59). NTPC plants in general offer much more competitive rates than those
prevailing in the market.
In a more recent development the Central government in January 2011 has approved a
proposal wherein for 13 new projects of NTPC (with an aggregate capacity of 31720 MW),
the host state will be allocated 50% power. In the Central Government’s view this
preferential allocation ‘will facilitate NTPC and ‘home’ state to work together in tying up
necessary inputs i.e. land, water, fuel, environmental clearances’60. The central government
continues to get 15% unallocated power and remaining 35% is allotted to other beneficiary
states through the prescribed formula. As seen in Table 36, a number of these plants are
located in the study states. Clearly while the host states will suffer coal related externalities,
they will also have preferential access to the power produced from the same plants.
Table 36 Allocation of power to the ‘Home’ States from the NTPC projects
Sl No Station Total plant
capacity (MW)
‘Home’ state
1. Gadarwara 2640 Madhya Pradesh
2. Lara 4000 Chhattisgarh
3. Talcher Expansion 1320 Odisha
4. Kudgi 4000 Karnataka
5. Darlipalli 3200 Odisha
6. Gajmara 3200 Odisha
59
This provision is applicable for plants set up till 5th January 2011, after which power will be procured by
discoms through competitive bidding. 60
Ministry of Power, Letter No. 5/12/2009 dated 17.01.2011
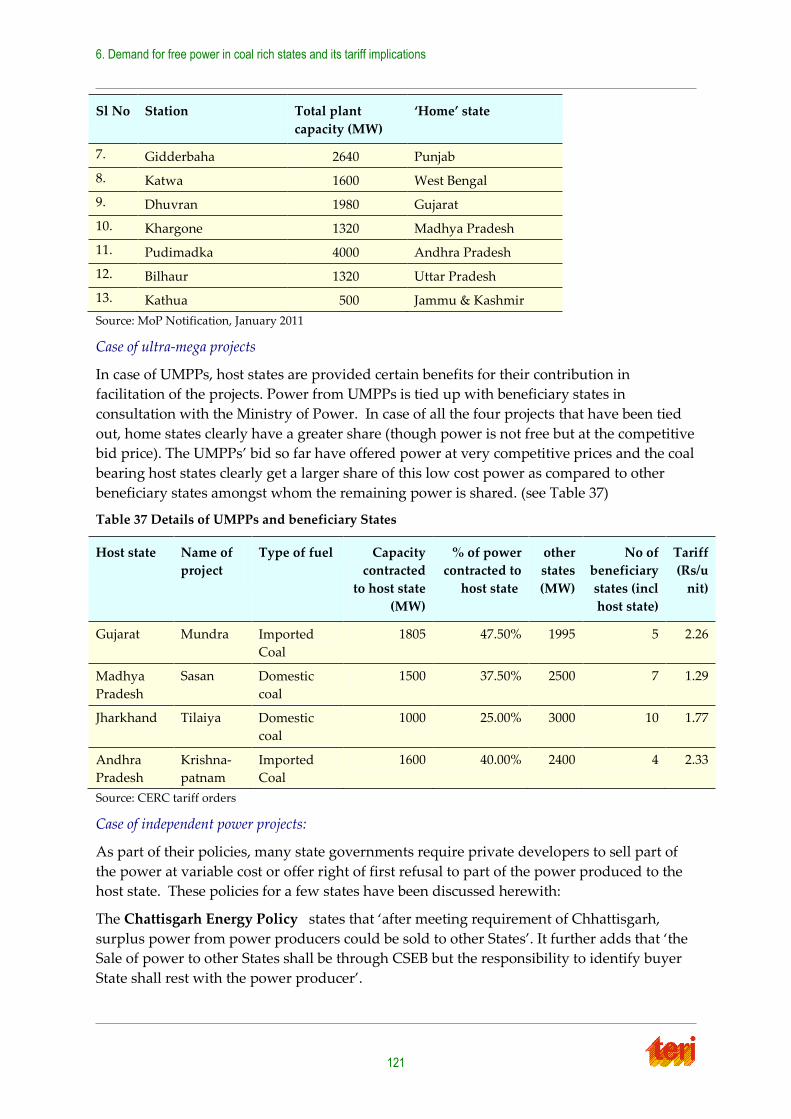
6. Demand for free power in coal rich states and its tariff implications
121
Sl No Station Total plant
capacity (MW)
‘Home’ state
7. Gidderbaha 2640 Punjab
8. Katwa 1600 West Bengal
9. Dhuvran 1980 Gujarat
10. Khargone 1320 Madhya Pradesh
11. Pudimadka 4000 Andhra Pradesh
12. Bilhaur 1320 Uttar Pradesh
13. Kathua 500 Jammu & Kashmir
Source: MoP Notification, January 2011
Case of ultra-mega projects
In case of UMPPs, host states are provided certain benefits for their contribution in
facilitation of the projects. Power from UMPPs is tied up with beneficiary states in
consultation with the Ministry of Power. In case of all the four projects that have been tied
out, home states clearly have a greater share (though power is not free but at the competitive
bid price). The UMPPs’ bid so far have offered power at very competitive prices and the coal
bearing host states clearly get a larger share of this low cost power as compared to other
beneficiary states amongst whom the remaining power is shared. (see Table 37)
Table 37 Details of UMPPs and beneficiary States
Host state Name of
project
Type of fuel Capacity
contracted
to host state
(MW)
% of power
contracted to
host state
other
states
(MW)
No of
beneficiary
states (incl
host state)
Tariff
(Rs/u
nit)
Gujarat Mundra Imported
Coal
1805 47.50% 1995 5 2.26
Madhya
Pradesh
Sasan Domestic
coal
1500 37.50% 2500 7 1.29
Jharkhand Tilaiya Domestic
coal
1000 25.00% 3000 10 1.77
Andhra
Pradesh
Krishna-
patnam
Imported
Coal
1600 40.00% 2400 4 2.33
Source: CERC tariff orders
Case of independent power projects:
As part of their policies, many state governments require private developers to sell part of
the power at variable cost or offer right of first refusal to part of the power produced to the
host state. These policies for a few states have been discussed herewith:
The Chattisgarh Energy Policy states that ‘after meeting requirement of Chhattisgarh,
surplus power from power producers could be sold to other States’. It further adds that ‘the
Sale of power to other States shall be through CSEB but the responsibility to identify buyer
State shall rest with the power producer’.
Equitable sharing of benefits arising from coal mining and power generation among resource rich states
122
Odisha’s Energy Policy provides for certain percentage of power at variable cost from IPPs.
In case of UMPPs, state government has right to purchase upto 50% of power from UMPPs
at the bid price. Besides these, there are provisions for government to purchase infirm
power at variable cost and also provision for a cess. The provisions are listed below:
Odisha state government (order no 8960/ E, dated -8-2008) makes the following provisions:
(i) For future IPPs: A nominated agency(s) authorized by the State Govt. will have the
right to purchase 14% of the power sent out from the Thermal Power Plant at
variable cost from the IPPs who have been allocated coal blocks within the State.
Others will provide 12% power at variable cost. The tariff for such power will be
determined by the OERC.
(ii) For existing IPPs: 7% power at variable cost will be made available to the state by the
IPPs who have been allocated coal blocks within the State. Others will provide 5%
power at variable cost. The variable cost will be determined by the OERC
(iii) UMPPS: A nominated agency(s) authorized by the State Govt. will have the right to
purchase upto 50% of power from the UMPPs to be set up through competitive
biddings, at the lowest bid price only.
(iv) Infirm power will be made available to the State at variable cost from all IPPs,
barring UMPPs
(v) An annual contribution @6 paise per unit of the energy sent out, from the plant, but
not sold in the State to be made by the developer towards Environment Management
Fund. This applies to all IPPs but not UMPPs and CPSUs
(vi) UMPP and CPSU should contribute 5% from the profit for peripheral development
fund.
Under the Madhya Pradesh (Investment in Power Generation Projects) Policy 2012, it is
mandatory for the developer to sell 10% of the total power generated (ex-bus) to the state
government at variable cost as determined by the regulatory commission. The policy also
introduced a ‘contribution of 6 paise per unit per unit for electricity sent outside the state’.
Notable, this clause however was however rolled back through an amendment in October
2012.
The Jharkhand Energy Policy provides for supply of power to the State under first right of
refusal limited to 25% of the installed capacity at price to be decided by Jharkhand State
Regulatory Commission (JSERC). In practice, Jharkhand demands 12% power at variable
cost and right of refusal for 13% power from IPPs. This is however a provision incorporated
in the MoUs but not part of any policy of the state.
6. Demand for free power in coal rich states and its tariff implications
123
Emerging scenario in study states: power at variable cost/right of refusal
and imposition of cess
This following section emerges from the discussion with the Energy Departments on free
power with the states visited, i.e. Odisha and Jharkhand.
Odisha
Existing provisions for private projects, IPPs and centrally owned plants
A number of coal based power plants are set to come up in Odisha and are under various
stages of progress. The state government has already negotiated with these IPPs to provide
the state with 25% power at regulated rates (for IPPs where MoU was signed in 2006) and
12-14% variable cost power (as determined by OERC) where MoUs were signed in 2009 and
beyond. In addition, the state charges Rs 6 paise per unit for power exported outside the
state towards an environment management fund. The 6 paise cess is not directly linked to
cost of externalities from coal based stations. It is rate negotiated with developers. The state
is expected to benefit from 6141 MW concessional power cut of a total capacity of 37440 MW
new plant capacity to come up in the state in the course of XII and XIII plan.
Till June 2013, two IPPs have started operations and the state is receiving power from
Sterlite Energy (25% at regulated full rate determined by OERC, provisional fixed at Rs 2.75
per unit by OERC for 2013-14) and Aarti Steel (12% at variable cost determined by OERC,
provisionally fixed at Rs 1.75 by OERC for 2013-14.). The state has collected about Rs 30
Crore towards the Environmental Management Fund (@6 paise per unit of power sold
outside the state) but has yet to come up with clear guidelines on the administration of this
fund.
From the centrally owned plants and the UMPPs, Odisha has not so far asked for power at
variable cost but is asking to be given right to 50% of power produced from these plants at
the tariff discovered through competitive bidding. There are three UMPPs planned in
Odisha of which, the plant at Sundargarh has achieved some progress. Odisha state
government and the Central government have agreed to provide a share of 1300 MW to the
state from the Sundargarh 4000 MW project. From the other two UMPPs planned in Bhadrak
and Kalahandi, the state is demanding 50% power. These plants are however at a
conceptual stage and the power sharing agreement has to be worked out.
Similarly from the NTPC plants, the state is asking for 50% power at the regulated tariff
determined by CERC. There are two NTPC plants of 3200 MW each coming up in Odisha.
The Government of India has agreed to allow 50% of power from these stations to the host
state61. In addition, an extension to TTPS, Talcher is expected to add another 660 MW to the
state capacity. Odisha is not demanding any cess towards the Environment Management
Fund from the UMPPs or the NTPC plants.
With this major capacity expansion planned in the state, it is likely that in the coming years,
the state will become power surplus. As per the state’s own estimate it will be power surplus
by 2014-15. During the course of the discussion with the TERI team, the Energy Department
stated that the state will utilize the free/variable power depending on the situation within
61
Order No 5/12/2009 dated 17.01.2011 –‘Allocation of Power from Fourteen Upcoming Power Projects of NTPC’
Equitable sharing of benefits arising from coal mining and power generation among resource rich states
124
the state. In years, when hydro generation is lower due to lower rainfalls, it could use the
free power for itself but in other years it will trade the power in the market to earn revenues.
In the tariff order for GRIDCO for 2013-14, the OERC has also suggested that GRIDCO
should ‘procure maximum power from CGPs and IPPS of the state and trade the surplus
after meeting the state need’. This additional income from trading is seen as a way for
GRIDCO to make up for its deficits caused by late/non-payment by state Discoms.
Demand of state government from central government
From the field discussions, it emerged that Odisha would like the Centre to come up with a
policy framework on preferential power so as to give the state legal right to demand power
at concessional rates. At present, the state is apprehensive that the IPPs may not abide by the
conditions for providing power at variable cost once the plant becomes operational. While,
the state, links back the demand for free power to the provision made for host state in case of
hydro power, the percentage of free power asked is greater at 25% as in the state’s opinion
externalities from coal are continuous rather than one time as in case of hydro.
From the Central government, Odisha’s demand is as follows:
1. At least 25% of power generated by coal based plants should be allocated free of cost
to the host state
2. For coal rejects based power plants a higher percentage of free power, i.e. 33% power
and compulsory ash utilization mechanism
3. Electricity duty to be levied at the point of generation rather than point of
consumption
4. States may be allowed to levy an environmental tax to mitigate/compensate the
environmental impacts of coal mining.
Jharkhand
So far Jharkhand has been able to attract limited number private developers in the state. The
three major players are Abhijeet Group 1080 MW (Corporate Power), Adhunik Power 540
MW and Essar Power 1200 MW. Jharkhand has not specifically incorporated provision in its
energy policy for concessional power but in the MoUs that it has signed with these
developers, it has demanded 12 % power at variable cost and a right of refusal for another
13% power at full price as determined by JSERC. So far, one unit of Abhijeet Group has
come up but the JSERC is yet to determine its tariff. As of now it has provisionally allowed
the tariff proposed by the Group – Rs 1.95 as variable charge and Rs 5.01 as total charge.
The state has also included a clause providing 6 paise per unit on power sent out of the
station towards an Environment Management Fund. It has however not enforced this
condition on the developers.
The state is also host to the Tilaiya UMPP from which it would get 25% of the power, i.e.
1000 MW at the bid price of Rs 1.77 per unit. The state does not have any NTPC plants
housed in the state does but gets a share from NTPC plants stationed in other states. It also
gets power from the inter-state agency Damodar Valley Corporation Project (DVC) which
has coal based stations in Jharkhand and West Bengal. However the tariffs from both these
sources are very high at Rs 4.81 per unit from NTPC plants and Rs 4.66 per unit from DVC
plants.
6. Demand for free power in coal rich states and its tariff implications
125
States demand from the central government
Jharkhand wants to be compensated not only for power produced in their state but also for
the coal that is transported outside the state. Coal washing and coal transportation leads to
severe environmental stress in the host state. Therefore, states want to levy a charge on coal
being transported to other states. The department argued that in case of petroleum, Gujarat
and Rajasthan gets far more revenue through the production sharing contracts than coal
bearing states get from coal. In addition to variable cost, the State also wants to consider a
levy on power generation.
The Energy Department has demanded policy provision for free power from the Centre. In
its view, tariff as being determined by JSERC both fixed and variable (for the host state
share), could be much higher than the tariff being determined through competitive bidding.
For instance, through the cost plus approach power from the first unit of Abhijeet Group has
provisionally been approved at over Rs 5 per unit. At the same time, the Essar Group (1200
MW plant in Jharkhand) has contracted 560 MW capacity from its plant based in Jharkhand
to Bihar state electricity board at a levelled tariff of Rs 3.28 per unit through the competitive
bidding process.
Impact of free/concessional power
Impact of free power can be studied at various levels:
1. Impact on developer: Free or concessional power would impact generation tariff for
the remaining power and hence the competitiveness of the project. (A simple
example for instance would be if 100 units of power are sold at Rs 1 per unit, the
revenue would be Rs 100. If 10 units from this project are given free of cost then the
revenue of Rs 100 would have to be recovered from the remaining 90 units raising
the tariff to Rs 1.1 per unit). In a competitive market, how much the developer is
able to recover from the remaining (90 units in this case) depends on the prevailing
demand and supply scenario, which could decide what tariff he can command from
long term and short term contracts. He may have to absorb some of the revenue loss
himself on account of free power.
2. Impact on State government revenues: The host state gets additional revenue
through:
Additional electricity duty if power free power is consumed within the state
(electricity duty is levied on consumption and cannot be imposed on power sold
outside the state)
Revenue by way of sale of electricity either to state’s own utility or to other states
In case, the utility is state owned, it may be assumed that the state government would sell it
at the price it buys from the project developer (for instance the variable cost) or the average
cost of power purchase of the disco from coal based generation62. In case, the host state sells
to other states, it could sell at a profit margin, through trading, and possibly earn more
revenue than it would if it sold power to its discom.
62
The tariff (variable for total) is determined by the SERCs in such cases
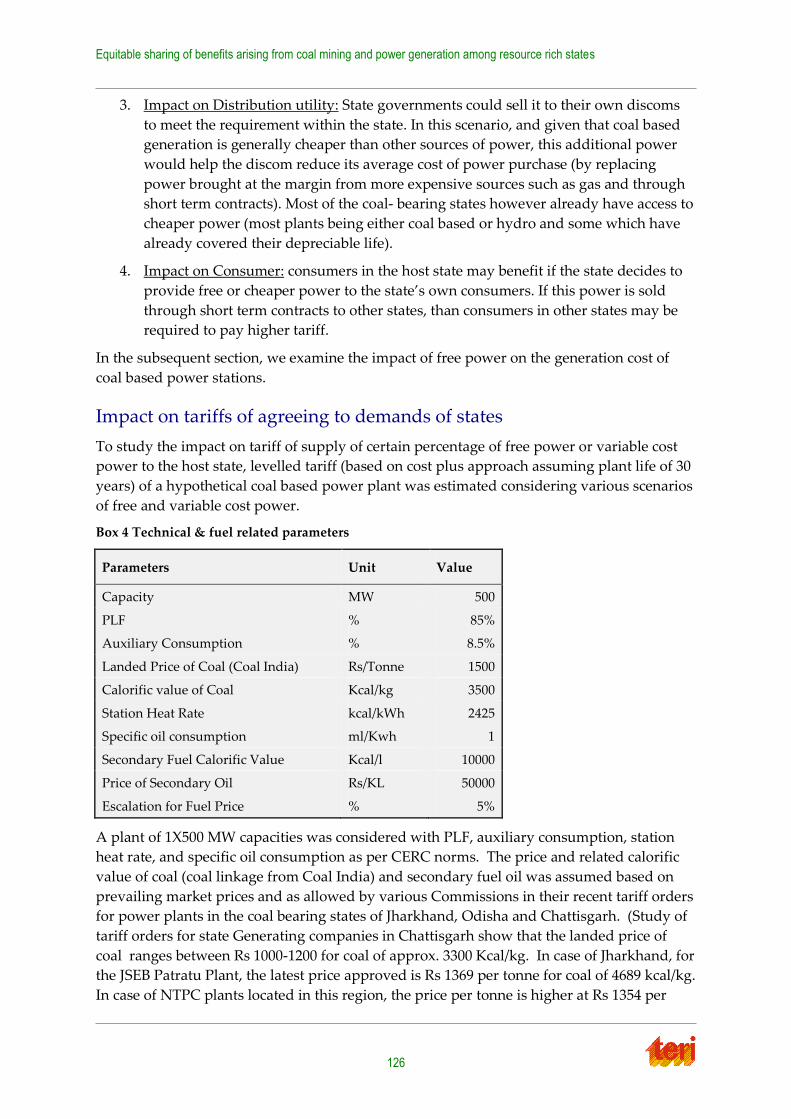
Equitable sharing of benefits arising from coal mining and power generation among resource rich states
126
3. Impact on Distribution utility: State governments could sell it to their own discoms
to meet the requirement within the state. In this scenario, and given that coal based
generation is generally cheaper than other sources of power, this additional power
would help the discom reduce its average cost of power purchase (by replacing
power brought at the margin from more expensive sources such as gas and through
short term contracts). Most of the coal- bearing states however already have access to
cheaper power (most plants being either coal based or hydro and some which have
already covered their depreciable life).
4. Impact on Consumer: consumers in the host state may benefit if the state decides to
provide free or cheaper power to the state’s own consumers. If this power is sold
through short term contracts to other states, than consumers in other states may be
required to pay higher tariff.
In the subsequent section, we examine the impact of free power on the generation cost of
coal based power stations.
Impact on tariffs of agreeing to demands of states
To study the impact on tariff of supply of certain percentage of free power or variable cost
power to the host state, levelled tariff (based on cost plus approach assuming plant life of 30
years) of a hypothetical coal based power plant was estimated considering various scenarios
of free and variable cost power.
Box 4 Technical & fuel related parameters
Parameters Unit Value
Capacity MW 500
PLF % 85%
Auxiliary Consumption % 8.5%
Landed Price of Coal (Coal India) Rs/Tonne 1500
Calorific value of Coal Kcal/kg 3500
Station Heat Rate kcal/kWh 2425
Specific oil consumption ml/Kwh 1
Secondary Fuel Calorific Value Kcal/l 10000
Price of Secondary Oil Rs/KL 50000
Escalation for Fuel Price % 5%
A plant of 1X500 MW capacities was considered with PLF, auxiliary consumption, station
heat rate, and specific oil consumption as per CERC norms. The price and related calorific
value of coal (coal linkage from Coal India) and secondary fuel oil was assumed based on
prevailing market prices and as allowed by various Commissions in their recent tariff orders
for power plants in the coal bearing states of Jharkhand, Odisha and Chattisgarh. (Study of
tariff orders for state Generating companies in Chattisgarh show that the landed price of
coal ranges between Rs 1000-1200 for coal of approx. 3300 Kcal/kg. In case of Jharkhand, for
the JSEB Patratu Plant, the latest price approved is Rs 1369 per tonne for coal of 4689 kcal/kg.
In case of NTPC plants located in this region, the price per tonne is higher at Rs 1354 per
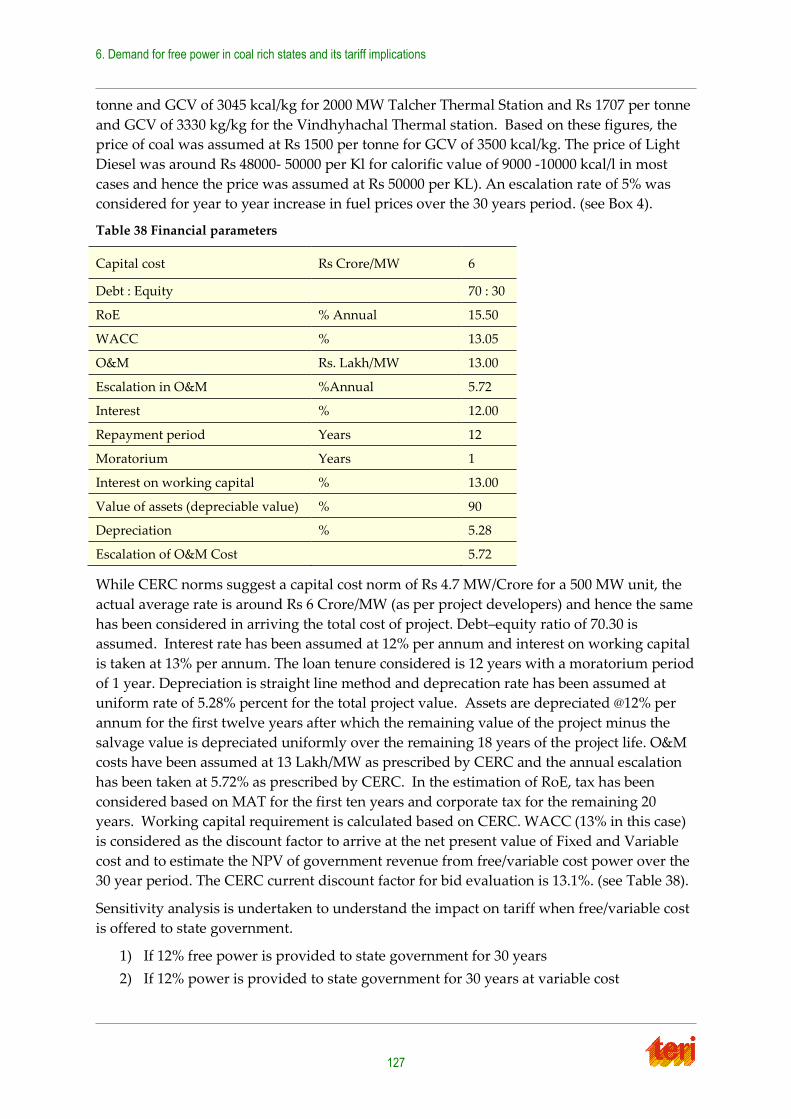
6. Demand for free power in coal rich states and its tariff implications
127
tonne and GCV of 3045 kcal/kg for 2000 MW Talcher Thermal Station and Rs 1707 per tonne
and GCV of 3330 kg/kg for the Vindhyhachal Thermal station. Based on these figures, the
price of coal was assumed at Rs 1500 per tonne for GCV of 3500 kcal/kg. The price of Light
Diesel was around Rs 48000- 50000 per Kl for calorific value of 9000 -10000 kcal/l in most
cases and hence the price was assumed at Rs 50000 per KL). An escalation rate of 5% was
considered for year to year increase in fuel prices over the 30 years period. (see Box 4).
Table 38 Financial parameters
Capital cost Rs Crore/MW 6
Debt : Equity 70 : 30
RoE % Annual 15.50
WACC % 13.05
O&M Rs. Lakh/MW 13.00
Escalation in O&M %Annual 5.72
Interest % 12.00
Repayment period Years 12
Moratorium Years 1
Interest on working capital % 13.00
Value of assets (depreciable value) % 90
Depreciation % 5.28
Escalation of O&M Cost 5.72
While CERC norms suggest a capital cost norm of Rs 4.7 MW/Crore for a 500 MW unit, the
actual average rate is around Rs 6 Crore/MW (as per project developers) and hence the same
has been considered in arriving the total cost of project. Debt–equity ratio of 70.30 is
assumed. Interest rate has been assumed at 12% per annum and interest on working capital
is taken at 13% per annum. The loan tenure considered is 12 years with a moratorium period
of 1 year. Depreciation is straight line method and deprecation rate has been assumed at
uniform rate of 5.28% percent for the total project value. Assets are depreciated @12% per
annum for the first twelve years after which the remaining value of the project minus the
salvage value is depreciated uniformly over the remaining 18 years of the project life. O&M
costs have been assumed at 13 Lakh/MW as prescribed by CERC and the annual escalation
has been taken at 5.72% as prescribed by CERC. In the estimation of RoE, tax has been
considered based on MAT for the first ten years and corporate tax for the remaining 20
years. Working capital requirement is calculated based on CERC. WACC (13% in this case)
is considered as the discount factor to arrive at the net present value of Fixed and Variable
cost and to estimate the NPV of government revenue from free/variable cost power over the
30 year period. The CERC current discount factor for bid evaluation is 13.1%. (see Table 38).
Sensitivity analysis is undertaken to understand the impact on tariff when free/variable cost
is offered to state government.
1) If 12% free power is provided to state government for 30 years
2) If 12% power is provided to state government for 30 years at variable cost
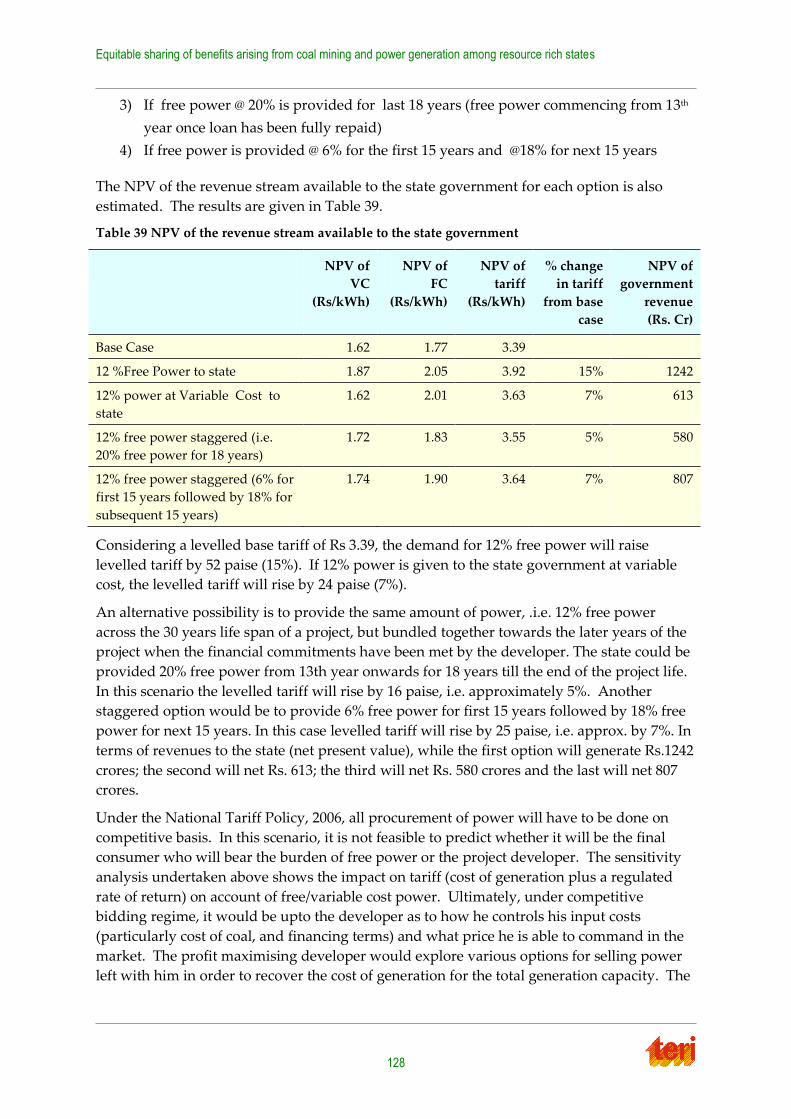
Equitable sharing of benefits arising from coal mining and power generation among resource rich states
128
3) If free power @ 20% is provided for last 18 years (free power commencing from 13th
year once loan has been fully repaid)
4) If free power is provided @ 6% for the first 15 years and @18% for next 15 years
The NPV of the revenue stream available to the state government for each option is also
estimated. The results are given in Table 39.
Table 39 NPV of the revenue stream available to the state government
NPV of
VC
(Rs/kWh)
NPV of
FC
(Rs/kWh)
NPV of
tariff
(Rs/kWh)
% change
in tariff
from base
case
NPV of
government
revenue
(Rs. Cr)
Base Case 1.62 1.77 3.39
12 %Free Power to state 1.87 2.05 3.92 15% 1242
12% power at Variable Cost to
state
1.62 2.01 3.63 7% 613
12% free power staggered (i.e.
20% free power for 18 years)
1.72 1.83 3.55 5% 580
12% free power staggered (6% for
first 15 years followed by 18% for
subsequent 15 years)
1.74 1.90 3.64 7% 807
Considering a levelled base tariff of Rs 3.39, the demand for 12% free power will raise
levelled tariff by 52 paise (15%). If 12% power is given to the state government at variable
cost, the levelled tariff will rise by 24 paise (7%).
An alternative possibility is to provide the same amount of power, .i.e. 12% free power
across the 30 years life span of a project, but bundled together towards the later years of the
project when the financial commitments have been met by the developer. The state could be
provided 20% free power from 13th year onwards for 18 years till the end of the project life.
In this scenario the levelled tariff will rise by 16 paise, i.e. approximately 5%. Another
staggered option would be to provide 6% free power for first 15 years followed by 18% free
power for next 15 years. In this case levelled tariff will rise by 25 paise, i.e. approx. by 7%. In
terms of revenues to the state (net present value), while the first option will generate Rs.1242
crores; the second will net Rs. 613; the third will net Rs. 580 crores and the last will net 807
crores.
Under the National Tariff Policy, 2006, all procurement of power will have to be done on
competitive basis. In this scenario, it is not feasible to predict whether it will be the final
consumer who will bear the burden of free power or the project developer. The sensitivity
analysis undertaken above shows the impact on tariff (cost of generation plus a regulated
rate of return) on account of free/variable cost power. Ultimately, under competitive
bidding regime, it would be upto the developer as to how he controls his input costs
(particularly cost of coal, and financing terms) and what price he is able to command in the
market. The profit maximising developer would explore various options for selling power
left with him in order to recover the cost of generation for the total generation capacity. The

6. Demand for free power in coal rich states and its tariff implications
129
options would include long term PPA with power deficit states, trading in the short term
market (through the power exchange or through traders), etc.
In case of right of first refusal to host state, the appropriate electricity regulatory commission
(generally the SERC) is required to determine the tariff at which the host state will buy
power. The impact on the tariff of the remaining power will depend on this regulated tariff.
If the tariff is equivalent to the cost of generation (as it should be under a cost plus
approach), then the tariff for the remaining power will not be affected.

Equitable sharing of benefits arising from coal mining and power generation among resource rich states
131
7. Legal and regulatory framework for
compensation to resource bearing states
In order to understand the issues involved in equitable sharing of benefits arising from coal
mining and power generation among resource rich states and in order to arrive at options
for equitable sharing of benefits between resource rich host States and consuming States, it is
imperative to review the Constitutional and legal regime for existing payments and other
compensation for coal bearing States. This Chapter provides an overview of the competence
of States to regulate and levy a charge on coal mining and electricity. It then provides a
summary of laws and policies introduced by the host States for payments from electricity,
coal mining and externalities. The chapter also discusses the legal position with respect to
three main demands being made by the host states, that is, inter-state tax on generation, free
power, and cess to address externalities.
Constitutional scheme
Ownership
With the commencement of the Constitution of India, ownership of all the property and
assets vested in the Crown was transferred to the Union and State Governments along with
all the existing rights, liabilities and obligations. The rights transferred to the Indian Union
and States included the power of the Executive in holding and disposal of the property63. A
combined reading of Articles 294-297 of the Constitution of India suggests that States own
all the subsoil resources located within their territory in cases where they have proprietary
rights over land64. Civil appeal no. 4549 OF 2000. SC order dated July 8th 2013. This
ownership is subject to the legislation governing regulation and control of mining enacted
by the Parliament65.
The Mines and Mineral Development and Regulation (MMDR) Act, 1957 confers upon the
State Governments the right to allow exploitation of minerals by way of granting licence and
lease. However, any permission or lease is to be granted in accordance with the MMDR Act
and its Rules as enacted and notified by the Central Government. Therefore, although a state
may be an owner of minerals, effective control over these minerals lies with the Centre.
Legislative competence for regulation
The constitution of India assigns functions, legislative competence, and fiscal powers for
different subject to both the Centre and the States. Schedule VII, read with Article 246,
assigns powers through three Lists: List I, the Union List, covers subjects that serve at a
national level; List II, the State List, sets out those areas which are a State’s exclusive
jurisdiction, subject to other clauses; List III, the Concurrent List, identifies areas where both
the Parliament and a State legislature can make laws, subject to central laws prevailing in
63Article 298, Constitution of India 64 See Threesiamma Jacob & others Versus Geologist, Department of Mining & Geology & others 65 Regulation and development of minerals is a state subject also but it has to be in conformity with the central
legislation
Equitable sharing of benefits arising from coal mining and power generation among resource rich states
132
case of a conflict where there is no scope for a harmonious reading of the provisions. Only
Parliament has the residuary power to make laws on matters not included in the three lists.
Coal resources
The Centre has jurisdiction over regulation of mines and mineral development, oil fields and
mineral oil resources.66 At the same time States are also empowered to legislate on
regulation and development of mines and mineral development, but subject to the powers
of the Union under List I.67 Hence, even though the states may own the mineral resources,
effectively the legislative control over minerals lies with the Union as declared by the Mines
and Minerals Development and Regulation Act. (TERI, 2007)
With respect to major minerals, states have little powers except possession, receiving royalty
and few other payments for major minerals. A mining lease is granted by the state but in
doing so the state is governed by the conditions and procedure as laid down by the MMDR
Act and Mineral Concession Rules (MCR) 1960. States’ rights are even more limited in the
case of coal, where the Ministry of Coal (MoC) allocates coal blocks and the States assess
mining lease applications based on the criteria established by, and approvals granted by the
Ministry of Coal, Government of India.
Electricity
Electricity is a concurrent subject under the Constitution of India. Therefore, both the Centre
and the States have the jurisdiction to legislate on electricity. However, as with other
concurrent matters in the Indian model of federalism, in case of any overlap or conflict
between central and state legislation the law passed by the Parliament would prevail.
Externalities
Environmental externalities in the nature of loss of ecology and pollution of environment
have been discussed in Chapter 3. Environment does not feature in the Indian Constitution
as a separate entry under the Schedule demarcating legislative rights. However,
environment protection is clearly provided for in the Indian Constitution as a directive
principle of state policy and judicial interpretation over the years has further strengthened
this mandate. Although environment is not a distinct item for legislative and administrative
purposes, different components of the environment with a direct or indirect implication for
the environment, such as forest, wildlife, water, fisheries and land are distributed between
the Centre and the States. Since residuary power vests with the Centre, any environmental
subject not listed in schedule VII, is Centre’s prerogative. Therefore, land and water are
state subjects, forests and wildlife are concurrent and environment in general is a residuary
subject and any externality related to these would fall under the respective domains of the
Centre or states.
Fiscal competence
The Seventh Schedule which demarcates the domains of legislation between the Union and
the States deals with powers of taxation separately as a power to tax cannot be deduced
from a general legislative entry. The relevant taxation related entries include non-
agricultural income tax, insurance, taxes on interstate trade and commerce, and excise duties
66
Item 53 & 54, List I, Schedule VII, Constitution of India 67
Item 23, List II, Schedule VII, Constitution of India
7.Legal and regulatory framework for compensation to resource bearing states
133
for the Union and land revenue, taxes on mineral rights, tax on sale and consumption of
electricity for the States. Union and States have the power to levy a fee on matters of their
general competence.
Power of 'regulation and control' is separate and distinct from the power of taxation and so
are the two fields for purposes of legislation. A charge can be levied both in exercise of a
State’s power to regulate as well as tax. Cooley on Taxation has stated that ‘if the primary
purpose of the legislative body in imposing the charge is to regulate, the charge is not a tax
even if it produces revenue for the public’ (Cooley 1924). In such a case, the charge would
become a fee. There is no generic difference between tax and fees as both are compulsory
exertion of money by public authorities. However, a tax is imposed for public purposes and
is not, and need not be supported by any consideration of service rendered in return; on the
other hand, a fee is levied essentially for purposes rendered and as such there is an element
of quid pro quo between the person who pays the fee and the public authority which
imposes it.68
Coal resources
One of the most direct entries with respect to mining is taxation on mineral rights vested in
the States.69However, this power with the States is not absolute and is subject to any
limitations imposed by any law enacted by the Parliament. Hence, when mineral rights are
taxed, they have to be in Conformity with the Mines and Mineral Development and
Regulation Act legislated by the Centre. Under Entry 84 of the Union List, duties of excise on
goods manufactured or produced in India are under the competence of the Central
government.
Environmental externalities
Under the Constitution, there is no specific entry on fiscal matters related to environment or
its key components. Therefore it does not provide for levying a tax on environmental
externalities by either the Centre or States. Centre can however, relying on residuary
powers, impose such a tax. Another important entry in the Constitution is with respect to
fees. Fees on any of the matters specified in the Union, State or Concurrent Lists are within
the respective jurisdictions of Centre, States or both. Most of the environment related levies,
either introduced by the Centre or States are in the nature of fees.
Electricity
Along with the general concurrent powers on electricity, States have the explicit power to
levy a tax on sale or consumption of electricity70. However, the arrangement of fiscal powers
with respect to electricity is a little complex. While the States can legislate on sale or
consumption of electricity, they do not have the competence to impose any tax on
generation of electricity, as generation amounting to production falls under the Union List
I71and hence under the purview of the Centre.
68
State of West Bengal v Kesoram Industries AIR 2005 SC 1646 69
Entry 50, List II 70
Entry 53 list II 71
Entry 84, List I
Equitable sharing of benefits arising from coal mining and power generation among resource rich states
134
Inter-State trade and commerce is the legislative prerogative of Union.72 Since a general
entry does not imply taxation powers, a new entry for taxes on the sale or purchase of goods
in the course of inter-State trade or commerce73 was added vide the sixth amendment to the
Constitution in 1956. The two most important provisions vis-à-vis export of electricity to
other consuming states are Article 286 and entry 92A of List I. The former prohibits States
from levying taxes on purchase or sale of goods outside their territory and the latter declares
taxation on inter-state sale of goods as a subject matter for the Union. Thus, States are only
allowed to tax consumption or sale of electricity which is completed within the boundaries
of the State.
Central legislation, subordinate legislation and policies for
various payments
Coal mining
Further to its Constitutional prerogative, the Union has enacted the Mines and Minerals
Development and Regulation Act. The MMDR Act (MMDRA) 1957, read with the Mineral
Concession Rules, regulate the exploration and exploitation of all the major minerals in the
country.
Besides laying down the procedure for granting of licences and lease, the Act also provides
for the various charges that are payable to the governments, both Central and State, at
different stages of exploration and exploitation. These include a security deposit, a permit
fee for reconnaissance and prospecting fee74, surface rent75, dead rent76, royalties77. Several of
these payments are received by the States. However, they are imposed and affixed by the
Centre. In 1974, Coal Mines (Conservation and Development) Act was enacted to provide
for conservation of coal and development of coalmines. The Act provides for imposition of
excise duties on all coal raised and dispatched. The excise duty levied and collected is
disbursed by the Central Government to the owners, agents or managers of the coalmines.
Electricity
Electricity Act, 2003 is the primary legislation for regulation of electricity in India. The Act
consolidates all the laws of electricity relating to generation, transmission, distribution and
trading of electricity. It replaced the existing laws for electricity supply industry, setting up
of State Electricity Boards and Regulatory Commissions. The central Act deals with
generation, lays down the procedure for licensing entities to transmit, distribute and trade in
electricity. The Central Transmission Utilities and the State Transmission Utilities are
72
Entry 42, List I 73
Entry 92A, List I 74
7 & 14 of Mineral Concession Rules, 1960 75
When land is acquired by the Central government under the Coal Bearing Areas (Acquisition and
Development Act, States do not receive surface rent as the rights over land are acquired by the Centre for coal
mining. 76
Section 9A MMDRA 77
Section 9 MMDRA
7.Legal and regulatory framework for compensation to resource bearing states
135
enjoined with a responsibility to facilitate inter-state and intra state transmission
respectively on payment of transmission charge.
Further to the powers of Central government under the Electricity Act, the Tariff Policy has
been formulated by the Centre. The Tariff Policy of 2006 aims at ensuring availability of
electricity at competitive rates, promote competition and efficiency in the sector, and
‘promote transparency, consistency and predictability in regulatory approaches across
jurisdictions.’ Inter alia, it lays down a framework for arriving at performance based cost of
service regulation in respect of generation, transmission and distribution.78 In the deductions
for arriving at the total saleable design energy, the Policy recognizes 13% of free power to
the State Government, and Energy corresponding to 100 units of electricity to be provided
free of cost every month to every Project Affected Family notified by the State Government
in the designated resettlement area/ projects area for a period of ten years.79
Environmental externality
As mentioned above, there is no entry with respect to taxation of components of
environment. Most levies are in the nature of fees meant to provide a service. Following are
the main charges that have been imposed by the laws enacted by the Centre in relation to
getting environmental approvals or management of externalities associated with coal
mining and other development projects. A list of charges paid to the government is also
given in Table 25.
The Water Pollution Act 1974 vests the authority in Central and State Pollution Control
Boards to establish and enforce effluent standards in mines and processing plants. For
obtaining consent to establish a unit prescribed amount of consent charge is to be paid to the
State Pollution Control Boards.
The Water (Prevention & Control of Pollution) Cess Act, 1977 provides for levy and collection of
a cess on water consumed by industries.
Forest Conservation Act of 1980 and the rules, executive orders and Supreme Court rulings
relating to the Act provide for compensation in monetary terms for any diversion of forest
land for non-forest activities, including mining. Mining entities have to provide money for
compensatory afforestation and the net present value of the forest lost due to the mining
activity.
A Clean Energy Cess has been introduced by the Government of India in 2010. Under the
new notification, a Clean Energy Cess at the rate of Rs.100 per tonne is levied as a duty of
excise on raw coal, lignite or peat raised and dispatched from a coal mine.80
Social externality
Although not a part of the terms of reference of this study initially, social externalities have
emerged as an important issue in our research and consultations with the stakeholders in
coal bearing states. Figure 1 depicts how of all the different kinds of compensation, the
compensation for social externalities is least adequate. Many of these costs are not met
78
No.23/2/2005-R&R(Vol.III) 79
Para 5.1 (e) (iii); Amended vide Ministry of Power Resolution, dated 31st March, 2008 80Notification No. 3/2010-CEC dated 22.06.2010
Equitable sharing of benefits arising from coal mining and power generation among resource rich states
136
directly by the state but are met by the project affected people. However, these externalities
do put a burden on the state machinery.
The Land Acquisition Act, Coal Bearing Land (Acquisition and Development) Act, the
National Resettlement and Rehabilitation Policy, State R&R Policies together comprise the
framework for addressing social externalities arising out of a coal mining project. Since land
acquisition and R&R is a complex, albeit often ignored, issue it needs to be looked at in
greater detail. There is merit in delving into details of different laws and policies relating to
land acquisition and R & R. Since Coal India Limited is the main entity operating in the coal
extraction sector, it is useful to review the company policy of CIL towards addressing social
externalities associated with coal mining. The study also analyses R&R Policy of National
Thermal Power Corporation (NTPC) in detail.
The main cause of social externalities in mining is rooted in acquisition of land. The
legislation for land acquisition is based on the principle of eminent domain and pays little
attention to mitigation of losses resulting out of mining. Successive R&R Policies have tried
to move closer towards addressing the different kinds of losses caused by the acquisition of
land. Broadly speaking, all policies now try to categorize into compensation for -
- Land as property,
- Land as livelihood
- Livelihood deprivation of landless individuals
- Destruction of tribal lands
Land as property
Land-for-land
On the face of it, the most comprehensive compensation for land acquired is to allot land to
the owner elsewhere. The monetary compensation can then be directed toward making up
for differences in the quality of the land and availability of surrounding resources. This
approach is recommended, to some extent, in the NRRP 2007. The NRRP, in paragraph 7.4.1,
provides that when agricultural land has been acquired, land may be allotted up to a
maximum of 1 hectare or irrigated, or 2 hectares of un-irrigated land. This is, however,
subject to the availability of land to allot. Non-availability of land is often an impediment in
ensuring land for land compensation. As reported by the Ministry of Coal in the context of
rehabilitation and resettlement by Coal India limited, ‘land acquisition for both mining and
associated infrastructure development purposes is very difficult’ owing to scarcity of land.
(StandingCommittee, 2010) Accordingly, the 2012 CIL Policy bears no reference to land-for-
land compensation.
The NTPC policy for R&R suffers from the same infirmities as the NRRP since it conditions
land-for-land compensation on the availability of land. However, on a positive note, the
NTPC policy also briefly outlines a process to facilitate land purchase in surrounding areas
on a consensual basis. It also provides that the amount payable under the LAA 1894 will be
adjusted against such purchase. This adjustment excludes the amount awarded as solatium,
the calculation for which is (in contrast to the CIL policy) not explicitly provided for. In cases
where land-for-land is not possible either through Government land or facilitating private
7.Legal and regulatory framework for compensation to resource bearing states
137
deals, employment (under para. 2.3.2.) or a Rehabilitation Grant (under para. 2.3.3.) is to be
provided.
Monetary compensation
Monetary compensation for land is a legal requirement under the LA Act and the CBA Act.
These acts allow for compensation to be adjusted against the amount of land allotted as
compensation. Where some part of land-for-land compensation is awarded, therefore, the
amount of monetary compensation legally due would be accordingly reduced. Since it is a
requirement under the law, monetary compensation does not find a place in most policies.
The CIL Policy of 2012 is an exception. It deals explicitly with monetary compensation for
land. In paragraph 8.1. (i).A, the policy states that compensation for land will be paid in
accordance with the relevant legislation or State Government notification. In addition, the
CIL Policy contemplates solatium and escalation to be paid on and in excess of the
compensation amount. The solatium and the escalation, therefore, is the only amount that
CIL is paying out in excess of its legal obligation under the land acquisition legislation.
There is a fundamental problem with monetary compensation for land under the existing
law. The ‘market value’ of the land is ascertained at the time at which the Government
notifies the public of its intention to acquire the land. In most cases, entire years lapse
between this notification and actual acquisition of the land.81 In this time, the price of land
around the area of proposed acquisition appreciates significantly. Thus, the compensation is
completely inadequate for the erstwhile land-owner to acquire a similar plot of land in this
inflated market (Fernandes W. , 2005).
This is added to the fact that the formula for calculating the ‘market value’ is based on
averaging out the value of land transactions in that area in the past three years. It is a well-
documented problem that the values of land transactions are routinely misrepresented in
order to reduce the stamp duty payable on the purchase. (Fernandes W. , 2005) This
discrepancy was exposed, for example, in our meeting with the Jharkhand Department of
Revenue where it was acknowledged that the ‘registration rate’ of land was determined by
the State Government at around Rs. 20,000/- per acre, but actual compensation went as high
as Rs. 4-5 lakh per acre (Rastogi, 2013).
Therefore, monetary compensation for land-as-property under the existing legislations
suffers from a flawed formula for its calculation. Monetary compensation needs to be based
on the replacement value of land and not its out-dated, misrepresented market value.
There is an additional burden imposed upon the state machinery when the Collector has to
talk to the local population and convince them to move. From our meeting with the Odisha
Energy Department, the Collector spends 10-12 hours in trying to achieve this result.
Moreover, companies are often unwilling to pay the sums demanded by the land owners (P
K Jena & Ors., 2013). Planning for this process is difficult since the time required varies
across locations and communities (Vishal Dev & Ors., 2013).
Compensation for homestead and homestead land
There is significant variance across policies in the way homestead and homestead land is
compensated for. The NRRP 2007 compensates for acquiring homestead land by allotment
81
One study puts the figure at 7-8 years for the entire land acquisition process to be completed.
Equitable sharing of benefits arising from coal mining and power generation among resource rich states
138
of alternate land, subject to a cap. It offers nothing, however, for the cost of the homestead
itself, except in the case of families below the poverty line. The CIL Policy of 2012, on the
other hand, offers only a uniform lump sum monetary compensation to buy an alternate
home-site, to shift, and to construct sheds. It compensates the cost of the homestead itself
based on the requirements of the Land Acquisition Act.
The NTPC policy encourages ‘self-resettlement’ by providing for enhancement of homestead
compensation by 500% over the amount calculated under the LAA, 1894. Where self-
resettlement is not preferred by the displaced, the policy provides for the setting up of a
Resettlement Colony where homestead land shall be allotted. It makes a somewhat crude
distinction, guaranteeing 200 square metres of land to those who lose up to that amount but
only 250 sqm for anything above that amount.
The section of the NTPC Policy dealing with RGs displays nuances not found in other RRPs.
While the minimum amount is fixed (depending on status as land owner or non-landed
affected person), it recognises that the RG to be based on a variety of factors – per acre, on
the basis of slabs etc. It also allows for the RG to be paid out as an annuity. It goes a step
further to state that a PAP must refuse an annuity and show an affidavit confirming the
intention to purchase assets before a one-time lumpsum payment can be authorized. This
potentially addresses, to a great extent, the documented problems of PAPs who are do not
manage large one time payouts well.
Land as livelihood
The effect of converting a large amount of rural land into industrial projects without
adequate land compensation is to create a large pool of former land-owners and agricultural
labour whose skills are no longer usable. The lack of integration of this workforce into a new
economic paradigm is one of the harshest legacies of coal mining displacement.
Mandatory employment or compensation in lieu of employment
In the 1990s, R&R policies like that of CIL followed the TN Singh formula which required
one person to be employed per displaced family. This norm has fallen into almost complete
disuse, especially by CIL, since it now finds itself with a highly bloated workforce. The latest
CIL Policy ties employment to size of land holding, allowing for families to club their land
holdings in order to claim one job. This leads to a situation in which multiple families are
supposed to benefit from one individual’s income.
Most policies, in one way or the other, speak of preference to be given to displaced
individuals for employment in the project. However, this preference in employment is
almost always limited (as in the case of NRRP 2007 and Odisha RRP 2006) to the one
nominated member per displaced family. The latest CIL policy does not contemplate
preference in employment at all.
The NTPC Policy’s section on employment opportunities is one of the strongest among R&R
policies in India. It recognises a variety of areas in which PAPs may be gainfully employed.
The terms in which this commitment is framed are more mandatory than discretionary.
Hence, for example, ‚All unskilled jobs will be generally reserved for PAPs subject to
reservation policies of GOI<‛ and ‚<NTPC Project will reserve 50% of the shops and 100%
kiosks for allotment to PAPs / land oustees<. rent charged will be 10% of that charged to
non-PAPs‛ *emphasis added+ The policy also makes reasonably strong commitment to
7.Legal and regulatory framework for compensation to resource bearing states
139
include clauses in contracts with sub-contractors to employ 80% of their unskilled labour
requirement from the PAPs. The NTPC frames employment as an alternative to land for
land, rather than a complementary rehabilitation measure.
Land-less individuals
This category comprises two types of individuals – rural service providers such as artisans
and non-landed agricultural labour such as share-croppers. Under the NTPC Policy, landless
individuals are compensated against employment at a lower rate than landed PAPs. There is
no distinction made in the policy between land losers and landless PAPs in terms of access
to employment opportunities and CSR measures under the NTPC’s Community
Development Initiatives. For PAPs who were previously self-employed, a one-time cash
assistance of Rs. 31,000/- is provided.
Most RRPs provide for a one-time cash grant to establish a new workshop. They also
provide for the institution of self-employment schemes and vocational training schemes.
These schemes have historically had underwhelming results. The earliest CIL Policies
projected that the displaced individuals would be accommodated in the dairy and poultry
sectors. In 1996, the Jharkahand Janadhikar Manch in its critique of the then R&R policies
clearly identified that this was not feasible since the sectors themselves could not
accommodate such a load and because the displaced much preferred stable salaried
employment (Benghara, 1996). Observations of this poor response continue to this day even
as CIL has to induce displaced individuals to even attend its vocational training.
(Bhattacharya, 2004).
Conclusion
R&R Policies suffer from two fundamental flaws – they lack cohesion and are not legally
binding. To have a legal instrument for land acquisition and merely policy instruments for
R&R priorities is unsustainable. Hence, the 2011 Bill passed into an Act in 2013 (Box 5).
Equitable sharing of benefits arising from coal mining and power generation among resource rich states
140
Box 5 The Right to Fair Compensation and Transparency in Land Acquisition, Rehabilitation and
Resettlement Act (LARR), 2013
State legislation, subordinate legislation and policies for
various payments
Electricity
As discussed in the preceding sections, generation of electricity amounts to production and
any tax on that would amount to excise. Hence, it is outside the purview of the states.
Electricity as a general entry is a concurrent subject shared between Centre and States. Tax
on consumption and sale of electricity is however explicitly under the purview of states.
Following is an overview of the legal and regulatory framework for imposition of different
This Act takes what it believes is an extremely generous approach to R&R. It requires the consent of
80% of the affected population for a project to go ahead and completely prohibits the acquisition of
irrigated multi-cropped land. In addition, it lays out compensation for land and livelihood with
generous multipliers applied to the ‘market value’. It combines various other forms of compensation
such as annuities, subsistence allowance, homestead compensation and the sharing of appreciation
in land value. It also guarantees employment per family or compensation in lieu of employment.
The LARR 2013 has, effectively, taken the best of the R&R policies and laid out an R&R package that
far exceeds any of them. As a result, therefore, it suffers from many of the same flaws. This is
particularly true in the case of coal mining.
The most important advancement made by the Bill – the 80% consent required from the affected
families – does not affect coal mining at all. It is only required when land is acquired for private
companies. Since the major acquirer here is CIL, a public sector undertaking, prior informed consent
is still not required. Social Impact Assessment is required only when more than a 100 families are
displaced. Even when it does need to be conducted, the Gram Sabha is merely to be consulted.
The issue of compensation for land has been decided in the most arbitrary of ways – by applying a
multiplier to a slightly modified version of an already discredited formula. Naturally, land-for-land
compensation is still unavailable other than for irrigation projects.
The definition regarding project affected persons still requires three years’ residence. The issue of
tribal mobility, hence, will continue to place them beyond the eligibility for these benefits.
Finally, the effect of the definitions of ‘public purpose’ and urgency means that the Government can
continue to acquire land indiscriminately. Worse, while the Bill requires that unused land be
returned after five years, this requirement is circumvented by transferring the land for another
public purpose. Potentially, this could simply create a circulation of land ownership among
Government departments/instrumentalities.
In sum, the LARR Bill suffers from the same inadequacies as its policy predecessors. It assumes that
the best way to further public interest is in the unilateral assertion of ‘eminent domain’. It is positive,
however, that the issue of resettlement and rehabilitation are finally being addressed through
legislative proposals rather than simply policies.
7.Legal and regulatory framework for compensation to resource bearing states
141
kinds of levy on electricity, resource (coal), environment and social externalities at the level
of States.
Electricity duty
Since taxation on sale and consumption of electricity is clearly in the domain of States, the
States levy a duty on certain sales and consumption of electricity by various consumers.
Most states have classified consumers of electricity into different categories and fixed the
rates of duty accordingly.
Andhra Pradesh Electricity Duty Act, 1939 provides for levy of duty on certain classes of sales
and consumption of electricity by licensees in the State of Andhra Pradesh.82 Under the said
Act, every licensee in the State of Andhra Pradesh is liable to pay to the State Government a
duty on and in respect of all sales of energy. There are some exemptions however. For
example, sale to government, railways etc. are excluded in most states. All agricultural
consumers are exempted from this electricity duty. 83
Madhya Pradesh Electricity Duty Act, 1949 requires every distributor and producer of
electrical energy to pay a duty to the State Government based on the units of electrical
energy sold or supplied to a consumer or consumed by himself for his own purposes.
After its creation, the State of Jharkhand adopted the Bihar Electricity Duty Act of1948 in
2000.84 According to the Act, an electricity duty is levied on any person who is supplied with
electricity for his own consumption by a licensee or a government agency. This duty is
affixed periodically by State Government. The Bihar Act provided for an additional duty at
the rate of two paise per unit consumed or sold. However, this provision was deleted by
Jharkhand through an amendment in 2011.85
Under the Odisha Electricity (Duty) Act, 1961, any consumer who is supplied with energy by
a licensee, a Board or the government, is charged with an electricity duty payable to the
State government. A licensee or the state board is required to collect duty from the
consumers and paid to the State government.86
Different categories of consumption are charged at different rates revised from time to time
in the respective states. For instance, in Odisha, the main classes of consumption for the
purposes of levying an electricity duty are (i) rate charged on a monthly basis, (ii) minimum
rate charged, (iii) rate charged on the basis of maximum demand, (iv) in case of unmetered
supply, and (v) in case of two part tariff. The electricity duty is payable even by those
consumers who generate energy for their own consumption. 87
Cess and other charges
Under the Madhya Pradesh Upkar Adhiniyam, 1981 (as amended upto 2001), one paise per unit
Energy Development Cess is levied on the total units of electrical energy consumed, or sold
or supplied to a consumer.88 It must be noted that initially the Act sought to impose a cess on
82
Madras Act 5 of 1939 made applicable to the State of Andhra Pradesh 83
Department of Energy (Power) Government of Andhra Pradesh, G.O.Ms.No.82, Dated 7 July 2003. 84
vide S.O. Number 117 dated 15 December 2000 85
vide Jharkhand Duty (Amendment) Act, 2011 dated 24 June 2011 86
Section 5, Odisha Electricity (Duty) Act 1961 87
Section 3, Odisha Electricity (Duty) Act 1961 88
Section 3 (1) Madhya Pradesh Upkar Adhiniyam, 1981 (Act no. 1 OF 1982) as amended upto 2001
Equitable sharing of benefits arising from coal mining and power generation among resource rich states
142
mineral bearing land too. However, the cess on mineral bearing lands was struck down as
ultra vires in M.P. Lime Manufactures Association v. State of M.P.89As per the Madhya
Pradesh Act, the cess is first credited to the Consolidated Fund of the State, which then
transfers the amount to a dedicated Energy Development Fund.90The Fund is meant to be
utilized for purposes such as research and development; improving the efficiency of
generation, transmission and distribution; energy conservation programmes; improving
capacity and infrastructure; and transfer of technology.91
Besides the Act, Madhya Pradesh (investment in Power Generation Projects) Policy, 2012 enjoins a
responsibility on the developer to pay 6 paise on per unit of energy sent out of the State from
any thermal power plant situated within MP.92
The Madhya Pradesh Act was extended to the State of Chhattisgarh and amended in 2004.
Chhattisgarh Upkar (Sanshodhan) Adhiniyam 2004 levies a cess of five paise per unit on the
total units of electrical energy sold or supplied to a consumer in the State of Chhattisgarh.
Although Jharkhand does not have a law as yet for any additional cess on power being sold
outside the state, the State has entered into MoUs with developers that require them to pay a
6 paise cess from power plants per unit of energy sold outside the state.
Concessional power and first right of refusal
Requirement to sell power at variable cost to the host states is another form in which the
States seek benefits out of thermal power plants situated in their states. Although
contractual in nature, some state policies have incorporated this as a condition for signing
MOUs between the developers and States.
Odisha State Energy Policy states that ‚<*a+ nominated agency authorized by the State
Government will have the right to purchase 14% of the power sent out from the Thermal
Power Plant at variable cost from the IPPs who have been allocated coal blocks within the
State.‛
Chhattisgarh Energy Policy is in line with Chhattisgarh’s aim of becoming India’s ‘power hub’.
It aims at encouraging investments by other State Governments, Public Undertakings and
private sector to set-up power projects. According to the policy, ‘after meeting requirement
of Chhattisgarh, surplus power from power producers could be sold to other States’.
Jharkhand Energy Policy, 2012 also contains similar provisions whereby it envisages that
‘After meeting the requirement of the State, the surplus power could also be sold to other
States and State Government shall extend all possible support in this regard.’
Madhya Pradesh (investment in Power Generation Projects) Policy, 2012 makes it binding on the
IPP developers to sell up to 10 per cent of power generated to the state of MP at a variable
cost approved by MP Electricity Regulatory Commission. The 2010 version of the policy also
reserved the government’s first right to refuse for up to 30 per cent of power generated, in
addition to the 10 per cent power at variable cost.93 However, the 2012 version of the policy
89
AIR 1989 MP 264 90
Section 3 (2) Madhya Pradesh Upkar Adhiniyam, 1981 (Act no. 1 OF 1982) as amended upto 2001 91
Section 3 (3) Madhya Pradesh Upkar Adhiniyam, 1981 (Act no. 1 OF 1982) as amended upto 2001 92
Para 4.2012 Policy No. F – 1- 01/09/XIII 93
Para 3, 2010 Policy No. F- 1- 01/ 09 / XIII
7.Legal and regulatory framework for compensation to resource bearing states
143
dropped the right to refusal provision and added a responsibility on the developer to pay a
6 paisa per unit of energy sent out of the State from the Thermal Power plant.94
Mining activities
States’ right to regulate mines and mineral development is subject to the Union’s powers,
hence, the MMDR Act. Owing to their ownership of the mineral resources, States receive the
royalty and other rents accruing from mining but on a rate and in a manner fixed by the
Union under the MMDR Act. However, they cannot levy a tax on coal produced as that
would impinge upon the Centre’s jurisdiction.
Time and again states have tried to levy charges on mining since they have the right to
legislate on taxation of mineral rights. However, on most occasions they have been
challenged and struck down by the courts. The exception is in case a cess is levied in a
manner that it does not impinge upon the regulation by the Centre under MMDR Act.
In 1952, Odisha enacted the Odisha Mining Areas Development Fund Act. Section 3 of the
Act empowered the State Government to designate ‘mining areas’ which required particular
attention in development. Section 4 dealt with the imposition and collection of cess at a rate
not exceeding 5 per centum of the valuation of the minerals at the pit’s mouth. The proceeds
of the cess were to be collected in the Odisha Mining Areas Development Fund. In 1960, the
Act was challenged before the Supreme Court in Hingir Rampur Coal Company Ltd. v. State of
Odisha.95The Supreme Court held that the State legislation operated within a field already
occupied by the Central Government. However, the Court held that the declaration in the
Preamble to the Act (which was not technically made by Parliament since it was a pre-
Independence Act) was not sufficient to constitute a declaration for the purposes of Entry 54.
As a result, the State Act was allowed to stand on a ground that, from a policy standpoint,
seems a technicality. The same Act, inevitably was challenged again before the Supreme
Court in 1963, in the case of J.M. Tulloch v. State of Odisha96. The difference was that the
Minerals and Mining Development and Regulation Act, 1957 had come into force by this
time. It contained a clear declaration by Parliament as to the necessity of Central control of
coal mining and conferred even wider powers upon Parliament than the 1948 Act. The
Supreme Court thus held the impugned legislation to be outside the legislative power of the
State.
In 1989, in India Cements v. State of Tamil Nadu97, the Madras Panchayats Act, 1958 was in the
Supreme Court’s crosshairs. The Act levied a local cess at the rate of 45 paise on every rupee
of land revenue payable in every Panchayat development block. An explanation to the
offending section included royalty paid on minerals as ‚land revenue‛, on which cess was
payable. The cess was thus sought to be justified under Entry 49 of List II which authorises
the State to levy cesses on land revenue. Alternatively, it was sought to be justified under
Entry 50 of List II, which authorises the State to levy taxes on mineral rights.
The Supreme Court insisted that first, there is a distinction between land revenue and
royalty and hence, the conflation of the two in the Act could not justify the taxation under
94
Para 4.2012 Policy No. F – 1- 01/09/XIII 95
1961 AIR 459. 96
1964 AIR 1284. 97
1989 SCR Supl. (1) 692
Equitable sharing of benefits arising from coal mining and power generation among resource rich states
144
Entry 49. Thus, the taxation was essentially one on minerals under either Entry 23 or Entry
50 of List II. Both those Entries, however, are subject to the Centre not exercising its
competence under Entry 54 of List I. Since the Centre had exercised its competence through
enactment of the MMDR Act, 1957, the State legislation was ultra vires. An interesting side
note here is Justice Oza’s observation that if the State merely had the sense to draft the
explanation to cover dead rent instead of royalty, all the trouble could have been avoided.
This helpful suggestion ignores the fact, of course, that the massive difference in revenue
between taxing rent on land and taxing royalty on actual mineral produce is what drives the
States to such innovative solutions in the first place.
In 1991, the Supreme Court was called upon again to decide on the issue of coal taxation at
the State level. The legislations of three States were challenged in Odisha Cement Ltd. v. State
Of Odisha98 - the Bengal Cess Act, 1880 (as applicable to the State of Bihar), the Odisha Cess
Act, 1962 and the Madhya Pradesh Upkar Adhiniyam, 1982. Under Section 4 of the Odisha
Act, all lands are made liable to the payment of cess to be determined and payable as
provided in the Act. A 1976 amendment clarified that mineral-bearing lands were not
exempt. While the original act simply provided for a levy of twenty five percent on the
annual value of the land, by 1989, amendments to the Act had brought it to the point where
it defined precisely how the value of mineral bearing land particularly was to be calculated.
The calculation was based on royalties. Section 7 of the Act defined annual value of the land
as ‚the rent payable by *the lessee+ to the land-lord immediately under whom he holds the
land.‛
The State sought to contend that the cess was being imposed on land generally, not just on
mineral-bearing land and that royalty was merely the basis for calculation of value in the
case of mineral-bearing land. The Court, however, read right through the contention, posing
the question – ‚... what is it that is really being taxed by the Legislature?‛ In the opinion of
the Court, the change in the scheme of taxation in 1976, the importance and magnitude of
the revenue by way of royalties received by the State, the charge of the cess as a percentage
of royalty and the collection of the cess along with and as a part of the royalties were
circumstances which go to show that the legislation in this regard is with respect to royalty
rather than with respect to land. The royalty had ceased to be a mere measure or yardstick of
the tax and had become the very subject matter.
In Bihar, the Bengal Cess Act, in section 5 stated that all immovable property would be liable
to a local cess. Section 6 provided for the levy to be based on the annual value of lands and
sale value of other immovable properties, and based the cess on royalty from mines and
quarries. Again, the Supreme Court opined that ‚*i+n other words, the cess are levied
directly on royalties from mines and quarries...‛ and considered it to be indistinguishable
from India Cement.
In Madhya Pradesh, Part IV of the Madhya Pradesh Upkar Adhiniyam, 1981 (as amended in
1987) levied a cess only on land held in connection with mineral rights. Under section 9 the
proceeds were to be utilised for the general development of mineral - bearing areas. The
Court agreed with the Madhya Pradesh High Court’s opinion on the same Act i.e. since
under the Act, value of the land or of the minerals produced does not play any part in the
levy of cess, the levy could not be held to be a tax on land within the competence of the State
98
1991 AIR 1617.
7.Legal and regulatory framework for compensation to resource bearing states
145
under Entry 49 of the State List. The Madhya Pradesh Act, unlike its Odisha and Bihar
counterparts, calculated cess based on tonnage, not on royalty. Hence, the Court’s opinion
on all three legislations, taken cumulatively, suggests that whether a cess is on tonnage or
royalties, it is likely to be interpreted as a tax on mining rather than land.
This decision, though, exhibited the increased refinement in the attempts of States to tax coal
mining. By presenting ‚mineral-bearing land‛ as a mere subset of a larger scheme to tax all
land, the States were able to change the Court’s position on mining cesses. From declaring
royalty-based taxation to be outside the State’s power, the Court was also led to refine its
position – royalty could be used as a basis for determining the land’s value, but could not be
the basis for taxation itself.
The distinction was to prove important in the 2004 decision of the Supreme Court in State of
West Bengal v. Kesoram Industries.99 West Bengal had chosen to levy multiples cesses which
were variously calculated based on production of coal as well as annual value of land based
on the sale value of coal from mineral bearing lands. Again, the issue of conflict between
Entries 23 and 50 of the State List and Entry 54 of the Union List was in question. The Court,
however, reached a new conclusion. It began with the observation that a definition of a
regulatory field did not automatically grant the power to tax. Only entries which specifically
conferred a power to tax could do so. When a broad regulatory field was defined, however,
it was for the Government to legislate in the field. The extent to which the Centre legislated
was occupied; the rest was still available for the State to operate in. The Court then drew
what it saw as a crucial distinction between the 1948 and the 1957 MMRD Acts. While the
former, in section 9, specifically listed the power to levy taxes and fees as one aspect of the
regulatory field that was covered by the Union, the 1957 Act has no such provision. Hence,
the State was free to levy fees and taxes on mineral bearing lands. The Court still set store by
the prohibition on States taxing royalties since that, in its opinion, would constitute a tax on
income, which is simply not allowed to the States. This is why the Court was comfortable
upholding its decisions in Odisha Cement and India Cement, which prohibited cesses on
royalties. The logic in those cases, however, could not be extended to taxes on annual value
of mineral-bearing land which were not in essence taxes on royalties.
TERI, 2007 summarizes the position as,
‚Ownership right in minerals of States is a qualified and conditional one. While the States
have a right to the share of revenues from mining in the form of royalties and dead rents to
reflect ownership, it (a) has no right to decide on the method of fixation of royalty its rate or
its periodic revision (b) has no right to decide on the granting of mining leases in cases of
Schedule I minerals without prior clearances from the Central Government and (c) is unable
to tax minerals in any way they see fit.‛
Environmental externality
Land and water are state subjects, forests and wildlife are concurrent and environment in
general is a residuary subject. Therefore, States’ power for levying a tax, duty or cess relating
to environment is limited. They do receive proceeds from compensatory mechanisms levied
by the Centre, for example the proceeds of the CAMPA fund. Thus the States do not have an
explicit power to tax environmental matters in general. They can however levy in other
99
Judgment of 15th January 2004. Retrieved from http://indiankanoon.org/doc/879535/.
Equitable sharing of benefits arising from coal mining and power generation among resource rich states
146
forms, such as cess in the nature of fees, on subject matters that are within their domain,
such as land, forest, eater, electricity. It must be noted that irrespective of the valuation of a
tax or a cess, the subject matter must not infringe upon the domains of the Union. Here are
some examples of state level cess applicable on electricity or coal bearing lands.
The Chhattisgarh (Adhosanrachna Vikas Evam Paryavaran) Upkar Adhiniyam, 2005 provides for
an environment cess to provide for additional resources for improvement of environment in
the State. The environment cess is be levied and collected at the rate of five per cent on land
on which the land revenue or land rent is to be collected. For land under coal mining lease,
the cess is calculated at the rate of Rupees 5 per tonne of coal dispatched.100Proceeds of the
Cess are to be credited into an Environment Fund, which would then be utilised by the state
government on environmental projects.101
As per the policy of Government of Odisha on Energy, under any MOU signed with a
power producer, an annual contribution at the rate of 6 paise per unit is leviable on the
energy sent out to other states and not sold within the host state. This amount goes towards
an Environment Management Fund. The Fund has been created as a registered trust and
collected around 30 crores of rupees. However, the money has not yet been utilized as the
operation of this Fund is yet to be finalized. Two areas being considered for utilizing this
fund are environmental regeneration and livelihood regeneration. In 2011, the State of
Odisha also proposed to levy a forest development tax on minerals extracted from forest
areas.102However that proposal did not materialise.
The procedure for granting of approvals for coal mining, in the form of lease or prospecting
lease, is governed by the MMDR Act. However, states can impose certain additional
conditions with respect to compensation for damage to the land, felling of trees and
restrictions of surface operations.103
Social externality
Land, being a State subject, is even a bigger issue at the level of States. Even though payment
for land is paid to the owners of the land or people displaced or affected, state’s role is
crucial in land acquisition and associated R&R.
Several states, such as Andhra Pradesh, Odisha, Jharkhand, have their own policies for
resettlement and rehabilitation. As mentioned in the section on Central legislation and
policies for social externalities, successive R&R Policies have tried to move closer towards
addressing the different kinds of losses caused by the acquisition of land. Some policies
incorporate provisions for including project affected people in the project benefit stream. For
example, the Odisha Resettlement & Rehabilitation Policy, 2006gives families affected or
displaced by mining projects the option of getting upto 50 per cent of the one-time cash
assistance in the form of convertible preference shares. Similarly, the Jharkhand
Rehabilitation and Resettlement Policy allow affected families entitled to get compensation
to take 50 per cent of the compensation in the form of shares or debentures.
100
Section 4, read with Schedule II, Chhattisgarh (Adhosanrachna Vikas Evam Paryavaran) Upkar Adhiniyam 101
Section 6 102
: http://www.indianexpress.com/news/Odisha-plans-to-levy-forest-development-tax-on-
minerals/892044/#sthash.NkFoisXp.dpuf 103
27(2) Mineral Concession Rules 1960
7.Legal and regulatory framework for compensation to resource bearing states
147
Land as property
When land is treated as a property one of the simplest forms of compensating loss of land is
providing alternate land. Provisions for providing land in lieu of land acquired exist in the
R&R policies of Odisha, Jharkhand, and Andhra Pradesh. Similar to the National Policy,
land for land compensation is highly dependent on availability of land. As noticed in the
case of Coal India projects, evidence from Odisha indicates that the land-for-land norm
cannot be fulfilled in most cases. (Mohanty, 2011)
The Jharkhand Rehabilitation and Resettlement Policy, 2008also provides for allotment of
homestead land subject to a cap of 10 decimals in rural areas. This, however, has been
criticized as far too little compared to the requirement of a rural household (Barla, 2009).
Land as livelihood
Land acquisition does not result in mere loss of habitat but has several other implications,
including loss of livelihood. Besides providing habitat, land often performs the important
function of providing livelihood. In the study team’s meeting with the Jharkhand
Department of Energy, it was recognized that the entire topography of Jharkhand has
changed due to mining and that overall agricultural production has reduced because the
area under cultivation has reduced. (Gaur & Ors., 2013) An official at the Odisha
Department of Revenue observed that ‘land itself may not have much value but sometimes it is
the only source of income and security for people. It provides them employment round the year… If
you are educated, you can adjust anywhere, but if you are not educated or don’t have skills than it is
difficult after you get uprooted. Without education there are very little opportunities for the
displaced.’ (Taradutt, 2013)
The Andhra Pradesh Policy on the Resettlement & Rehabilitation of Project Affected
Families, Odisha Resettlement and Rehabilitation Policy, 2006, Jharkhand Rehabilitation
and Resettlement Policy, 2008, NRRP 2007, and CIL RRP 2012 all envisage monetary
compensation in lieu of employment. However, there is a lack of standardization across
policies. In some cases, this compensation is framed in terms of minimum agricultural
wages for a prescribed number of days - 750 days in the case of the NRRP 2007. In others, it
is framed as an annuity – the Jharkhand Policy contemplates a monthly payment of not less
than R. 1000/- per acre of acquired land for a period of thirty years.
One policy that takes a particularly convoluted approach to compensation in lieu of
employment is the Odisha R& R Policy. It places families in five categories in order of the
percentage of agricultural land and homestead land they have lost. These categories then get
a graded amount of lump sum payment, the maximum possible being five lakhs. This
creates gross false equivalencies between agricultural land and homestead land as well as
between different sizes of land holdings.
In terms of preferential employment to displaced people, the Jharkhand policy is the only
encouraging one, which mandates preference in employment for displaced people in the
project as a general principle.
Land in tribal areas
Tribal populations ostensibly benefit from a high level of Constitutional protection. The Fifth
Schedule to the Constitution of India empowers the President of India to declare certain
Equitable sharing of benefits arising from coal mining and power generation among resource rich states
148
areas as Scheduled Areas. The Governor of a State is empowered to declare that certain laws
will not apply to these areas and can also promulgate Regulations to govern these areas.
These Regulations can regulate, even prohibit, certain types of land transfers.
The Fifth Schedule has been used to declare several tracts of forest land as Scheduled Areas,
in order to protect the local tribal populations. Although tribes arguably have the strongest
historic claims over these forest lands, they possess pattas (legally recognised land
ownership documents) for a minuscule amount of these lands. In tribal-dominated districts
in Odisha, for example, the Government owns 84% of the land (United Nations
Development Programme, 2008). Despite the protection of the Fifth Schedule, however, land
transfers to non-tribes were and are occurring with impunity.
The Supreme Court’s 1997 judgment in Samatha v. State of Andhra Pradesh104is considered to
be a land mark in the protection of tribal rights. The Court was dealing with State
Government transfers of scheduled forest land to private miners. The three judge Bench
concluded that such transfers were null and void since they violated the Andhra Pradesh
Scheduled Areas Land Transfer Regulation, 1959, promulgated under the authority of the 5th
Schedule to the Constitution of India. However, two characteristics of the judgment render it
ineffective in the case of coal mining. Firstly, the Andhra Pradesh regulation was framed in
such a manner as to prohibit transfers by any person - not just a member of a Scheduled
Tribe - to a non-member. The Court interpreted ‚any person‛ to include the State
Government. Not every State regulation shares this language. The Odisha Scheduled Areas
Transfer of Immovable Property Regulation, 1956, for example, simply prohibits transfers by
a member of a Scheduled Tribe, leaving room for the Government to make such transfers.
Even the Supreme Court came across this problem subsequently in BALCO Employees Union
v. Union of India105, where, on a seemingly similar point of scheduled land transfer, it had to
disregard the Samatha judgment because the Andhra Pradesh regulation was not in pari
matria with the Madhya Pradesh regulation. The pervasive Government ownership of
Scheduled Area lands is thus placed in context here – where the state-specific regulation
only curtails the ability of a Scheduled Tribe member to transfer land, it is ignoring the much
larger problem of Scheduled Land available to the Government to indiscriminately transfer.
The decision does not result in a prohibition on the Government transferring land to one of
its own instrumentalities –
‚It is seen that in one case, the transfer was claimed to have been made in favour of the State
instrumentalities, i.e., A.P.S.M.D. Corporation Ltd. It has already been held that transfer of
the Government land in favour of its instrumentalities, in the eye of law, is not a transfer but
one of entrustment of its property for public purpose. Since, admittedly, a public
Corporation acts in public interest and not for private gain, such transfer stands excluded
from the prohibition under para. 5(2) (b) of the Fifth Schedule and Section 3(1) (a) of the
Regulation. Such transfer or lease, therefore, stands.‛(Samatha judgment, para. 117)
[Emphasis added.]
Thus, since CIL is a public sector undertaking, the Samatha judgment does not operate to
prohibit transfer of Government land to CIL.
104AIR 1997 SC 3297 105
2002 (2) SCC 333.
7.Legal and regulatory framework for compensation to resource bearing states
149
The issue of transfer of Scheduled Lands to private parties is only the latter part of a larger
problem. Acquisition does not fall under the definition of ‘transfer’ for the purposes of these
Fifth Schedule-based Regulations. Therefore, land acquisition by the Government of lands in
Scheduled Areas is still an available option. This is limited only by the procedure prescribed
in the Panchayats (Extension to Scheduled Areas) Act, 1996. The Act requires that the Gram
Sabha of a Scheduled Area be consulted whenever land is proposed to be acquired in the
area. ‘Consult’, however, does not necessarily require ‘consent’, meaning that the local
population’s views can be ignored (Sethi, 2011).
As a result of these glaring loop-holes in seemingly strong protections, the issue of tribal
lands - such as Santhal lands in Jharkhand - is one that even the state’s Revenue Department
recognizes as having no easy answers (Rastogi, 2013). Despite the attempt to keep tribal
lands beyond the reach of extractive industrialisation, they are still the worst impacted by
coal mining displacement. Hence, there is a need to protect tribal populations under the
R&R policies.
On paper, tribal populations are entitled to preferential terms under the various R&R
policies. Across different plans, they are entitled to land-for-land compensation, 25% higher
R&R benefits, resettlement in a compact area and compensation for loss of access to forest
produce. In reality, though, several impediments lie in the way of rehabilitation for tribal
populations. To begin with, because of their mobile nature, they often fall outside the
definition of Project Affected Persons. These definitions require proof of residence for a
certain period of time preceding notification of the project. Moreover, considering their
cultivation of land under traditional rights, it is difficult for any tribal family to prove land
ownership, hence depriving them of the benefits of land compensation as well.
Demands made by states for improved compensation
Tax on interstate trade of electricity
Entry 92-A of List I places all taxes on inter-state sale of goods within the competence of the
Union. However, Article 269 provides for certain kinds of taxes that can be levied and
collected by the Union but assigned to the States. This includes taxes on the sale or purchase
of goods taken place in the course of inter-state trade or commerce. Proceeds of any tax
levied under this Article can be assigned to the States within which that duty or tax is
leviable instead of being credited to the Consolidated Fund of India.
A State Legislature cannot pass a law imposing a tax on the sale or purchase of goods taken
place outside its own territory.106 Either the Centre or the State has the power to make a law
giving preference to one State over another, or discriminating between two states in exercise
of power on trade and commerce.107 However, a State legislature may enact a law imposing
reasonable restrictions on the freedom of trade, commerce or intercourse with that State in
public interest.108 Such reasonable restriction has to be in ‘public interest’. The Supreme
Court has held that an imposition of a tax which is purely fiscal in its object is not a
reasonable restriction.109 Public interest should be the object of such a levy. Mere increase in
106
Article 286, Constitution of India 107
Article 303, Constitution of India 108
Article 304 (b), Constitution of India 109
Kalyani Stores v. State of Odisha
Equitable sharing of benefits arising from coal mining and power generation among resource rich states
150
‘revenue of a State and its utilisation for the public’ was not regarded as adequate for public
interest.110
Thus inter-state tax on electricity to address the externalities in host States can be explored in
a scenario where the Centre levies such a tax and assigns it to coal bearing States directly
(not via Consolidated Fund of India).
Free and variable cost power
Free Power has its roots in the benefit sharing mechanism for hydro power. Free power is a
share of the produce – hydroelectricity- and is a share that has been agreed to by the Centre
on the output, i.e. electricity. Over the years, the states started using it as a revenue source
instead of using it exclusively for the specified purpose of local area development. In 2008,
the National Hydro Power Policy added another 1 per cent to the existing 12 per cent free
power, specifically earmarked for local area development and matched by an additional 1
per cent by the host state.111
Recently, the demand for free power has been made with respect to coal based thermal
power generation too. Coal rich States like Odisha have been asking for free power from coal
based thermal power stations since 2010. Recently, the State of Chhattisgarh has also made a
similar demand in tune of 12 per cent free power for coal producing states.112 The state of
Odisha has however been demanding a much higher share of free power at the rate of 25 per
cent from coal based projects and 33 per cent from thermal power plants based on coal
washeries rejects.113Recent State level energy or power policies also include provisions that
could result in an obligation to sell power at variable costs too.
At present, the demand for free power from thermal power stations does not emanate from
a statute. These are provisions that have found their way in the policy documents of the
States. In some states, free power or power at variable cost is one of the conditions in the
Memorandum of Understanding (MOU) signed with the power developers. Thus, it is being
introduced as not a statutory obligation or a fiscal measure, but a contractual provision.
Moreover, it must be noted that at this stage only MOUs have been signed. Legally, MOUs
are usually treated as letters of intent and do not create any rights or obligations for parties
as such and precedes a more definitive agreement. There are, however, instances where
MOUs can be seen as definitive agreements as well114. Nevertheless, these MOUs will still be
a contractual arrangement between the parties’ involved – State government and the power
developer.
110
Shri Digvijay Cement Co. v. State of Rajasthan (1997) 5SCC 406 111
2008 National Hydro Policy, para 8.3.5 112
‚Chhattisgarh Demands 100 % Per Cent From Nearby Mines for Coal-Bearing States‛ (July 17, 2012).
http://dprcg.gov.in/delhinews-17.07.12. 113
http://www.indianexpress.com/news/Odisha-s-plan-to-use-coal-rejectbased-power-put-on-hold/922503/ 114
Old World Hospitality v. Indian Habitat Center, 73 (1998) DLT 374; Kollipara Sriramulu v. T. Aswatha
Narayana, AIR 1968 SC 102
Equitable sharing of benefits arising from coal mining and power generation among resource rich states
151
8. Conclusions and recommendations
This study involved two sectors– coal and coal based electricity. Coal producing states have
been arguing that they bear the burden of coal and power development, do not get a share
in benefits that accrue to consuming states that have no burdens from coal but benefit from
this tax on sales. The central issue here is not about augmenting of revenues from electricity
consumed, but about being compensated for the externalities caused by coal and power
production. In other words, it is a demand for sharing of the burdens of coal and power
production. And as the Odisha Chief Minister said, and we quoted earlier, the impacts are
not just on the state but also on people’s lives, livelihoods, and ecosystems. This larger
understanding going beyond the state to people of the states and their environs means that
the recommendations need to be not just about sharing the burden of states, but also that of
people affected within the states. Different stakeholder groups – the Centre, the coal rich
States, the power producing and consuming States and the people of these States – have a
share in the various benefits from developing coal – the revenues, the power produced, the
jobs created.
The study sought to do a realistic assessment of selected impacts of coal mining, examine the
extent to which the states are already compensated for these externalities through existing
rules and regulations, both national and state specific and identify the aspects of
externalities that are not addressed. It also sought to identify the additional administrative
costs incurred by the state in terms of approvals and addressing the negative impacts. Given
that there is a demand for free power to compensate the states for the impacts of coal mining
and coal based generation, the study sought to examine free power as an instrument of
benefit sharing and/or compensation, and also examined the impacts of various scenarios of
shares of free power or variable cost power on tariffs115. Further it also analysed the
legislative and fiscal framework that lays down the sharing of powers between the Centre
and the states for coal and electricity.
In this concluding chapter, we pull out our key observations on these issues and then make
some recommendations.
Key observations
Sharing of legislative and fiscal powers in coal and electricity between the centre
and the states
Even though the states may own the mineral resources, effectively the legislative control
over them lies with the Union as declared by the Mines and Minerals Development and
Regulation Act (MMDR) (TERI, 2007). States’ rights are even more limited in terms of coal,
where the Ministry of Coal (MoC) allocates coal blocks and the States assess mining lease
applications based on the criteria established by and approvals granted by the Ministry of
Coal, Government of India. When mineral rights are taxed, they have to be in Conformity
with the Mines and Mineral Development and Regulation Act legislated by the Centre.
115 Tariff here refers to the generation tariff i.e. the cost of power generated and not retail tariffs
Equitable sharing of benefits arising from coal mining and power generation among resource rich states
152
Under Entry 84 of the Union List, duties of excise on goods manufactured or produced in
India are under the competence of the Central government.
Since electricity is a concurrent subject under the Constitution of India, both the Centre and
the States have the jurisdiction to legislate on electricity. Along with the general concurrent
powers on electricity, States have the explicit power to levy a tax on sale or consumption of
electricity. However, they do not have the competence to impose any tax on generation of
electricity, as generation amounting to production falls under the purview of the Centre.
Land, being a State subject, is a bigger issue at the level of States. Even though payment for
land is paid to the owners of the land or people displaced or affected, state’s role is crucial in
land acquisition and associated R&R. Several states, such as Andhra Pradesh, Odisha,
Jharkhand, have their own policies for resettlement and rehabilitation. Successive R&R
Policies have tried to move closer towards addressing the different kinds of losses caused by
the acquisition of land. Some policies incorporate provisions for including project affected
people in the project benefit stream. The Land Acquisition Act, Coal Bearing Land
(Acquisition and Development) Act, the National Resettlement and Rehabilitation Policy,
State R&R Policies together comprise the framework for addressing social externalities
arising out of a coal mining project. Since land acquisition and R&R is a complex, albeit often
ignored, this was analysed in great detail in this study. R&R Policies the study observed
suffer from two fundamental flaws – they lack cohesion and are not legally binding. To have
a legal instrument to address land acquisition and R&R priorities was the logic behind the
Land acquisition, Rehabilitation and Resettlement Act (LARR), 2013.
Externalities and compensation payments
The study found that there are considerable negative externalities around coal mining
beyond the positive ones of wealth creation for the states, a source of revenues, jobs and
input for power generation and for other industry. The study has tried to cost these impacts
from the public perspective with a view to arrive at what the polluter needs to pay.
The extent and costs of impacts derived using the life cycle analysis broadly provide
indicative estimates of the external damage caused and what proportion of the cost is
supposed to be compensated as per the law. It is clear that some of the damage is due to
practices that are not regulated. In other cases, compensation exists but is either inadequate
or not paid. Payments in cash cannot compensate fully or even in substantial part for loss of
life or ill health or morbidity; neither can, as we have seen payments made for forest
diverted, actually compensate for valuable ecosystems goods and services lost either
because the funds so collected are not used as required, or the implementation creates other
externalities (as in the case of people using common lands losing such lands).
Similarly, R & R policies do not capture well the various dimensions of the value of land.
They treat land simply as transactable property, which is a fallacy. Firstly, land serves as a
source of livelihood and the centre of the social existence of the family. Second, the location
of land in relation to non-privately-owned common property resources such as forests,
pastures and water sources imbues it with value. Third, the re-location of a large number of
land-owners affects a significant number of lands-less individuals, especially those who
provide services to the populations displaced. The amount of compensation legally due to a
land-owner under eminent domain legislation, therefore, simply addresses the beginning of
the loss caused by the involuntary acquisition of land.
8. Conclusions and recommendations
153
Compensation payments for the impacts of development are but a way of recognizing that
the costs of such production are not just the direct costs of machinery used, labour and the
resource, but also the unaccounted costs that comprise the loss to the environment and to
people’s lives and livelihoods. They represent a lower limit to share the burden of
development between those whose lives are affected by development and those who benefit
from it.
Figure 1 in Chapter 1 summarized our findings about what revenue sharing arrangements
and compensation payments exist for coal development, identified the basis for the
payments, and indicated to whom or where the funds are supposed to go. In 2007, when we
first developed this figure we had highlighted areas of compensation that needed to be
addressed. These related to depletion in the case of coal resources, and dealing with socio-
cultural impacts from resource development. Since 2012, the increased rate of royalty and
the movement to ad valorem rates suggest that this fact of depletion is being taken care of.
For states to be compensated for these costs, we have to also consider the responsibility and
accountability of the coal rich state in monitoring environmental and social externalities and
in enforcing the law. Many of these costs could have been avoided, and have emerged as a
result of regulatory failure and the inability of the state to ensure that impacts are kept to a
minimum.
Administrative costs
The administrative costs of environmental approvals and oversight of coal mining is
difficult to estimate. From our limited exercise, it amounts to Rs. 1/tonne of coal mined.
Better data would no doubt improve our estimates. Coal mining involves considerable
expense on security and is shared between CIL, CISF and the state police. Discussions with
Coal India suggest the security cost for the company alone are around Rs 40 per tonne. The
center and state government need to address this issue frontally as environmental and social
governance failures are part of the reasons for security problems in coal rich states.
Demands for free power by coal rich states
At present, state’s demand for free power or power at variable cost from thermal power
stations has no statutory basis. These are provisions that have found their way in the policy
documents of states. Thus, it is being introduced as not a statutory obligation or a fiscal
measure, but a contractual provision. As long as states seek variable cost or free power from
all the power plants, it may not be questioned. However any policy that mandates free
power from only those plants that are selling/exporting power to other states can be
challenged in the court of law as imposing restrictions on freedom of trade, commerce or
intercourse among states.
In recent years, we have seen the demand for power go down at the energy exchanges, with
financially stressed discoms preferring load shedding to purchasing power. As a result
prices of power have fluctuated and power surplus states are finding it difficult to sell
power. Chhattisgarh, for instance, has reportedly refused to buy power from a number of
IPPs with which it had recently signed PPAs for first right to refusal for proportion of the
power. Apparently the state planned to sell this power in the market at a profit but with
Equitable sharing of benefits arising from coal mining and power generation among resource rich states
154
increased coal prices, it is not finding this viable116. Similarly, Himachal Pradesh, which
receives 12% free power from hydel projects in the states, is finding it difficult to sell this
power. It is reportedly selling some of this power to West Bengal and Punjab at rates lower
than what the board itself buy free or concessional power may therefore be an unpredictable
source of revenue.
We did however; undertake analysis of the impact of free power/variable costs power on
tariffs and revenues. States can decide, depending on their circumstances and negotiating
positions on what arrangement to have with the power producer. Shares in power produced
in the state by the host state could be increased in a staggered manner based on milestones
in a typical project cash flow. The increase in free power in such cases would allow the state
government to capture part of the higher revenue share in the later years. Our study on
impact of various shares of free power suggest that from a multiple stakeholder view point,
a 12% staggered free power arrangement that has 6% free power in the first 15 years, and a
18% after the 15 year will be the best from the consumer, government, and the developer’s
view point.
Compensation and Benefit sharing
Different people mean different things by the term benefit sharing and compensation. The
most easily understood is that benefit sharing refers to mechanisms by which a portion of
profits and other benefits from coal and power produced are shared with others who have
a legal, ethical, political or economic claim to it (TERI, 2007).
Both the centre and States collect revenue from coal through different taxes and levies
imposed on minerals under different legislations. As we saw in Chapter 4, States collect
revenue through royalty, dead rent, cess, sales tax, environmental protection fees,
prospecting and mining lease fees and so on. The Centre collects revenue in the form of
excise duty, forest conservation charges, corporate taxes, and so on. Apart from the taxes, we
have noted several cesses already being levied by States on coal bearing land for various
purposes. Electricity is a concurrent subject. States cannot impose any taxes on generation,
but can on sales or consumption.
So far the low price of coal was an implicit transfer from the Centre to power consuming
states. (Chawla Committee, 2011) But this transfer posed a double burden to coal rich states
and its people. Low coal prices meant low royalty and hence low income from a depleting
asset. It also implies less funds to address environmental and social externalities from coal
mining, since costs of impacts are not reflected in coal prices. When such burdens to coal
states and their people are not compensated for and reflected in the revenue streams as
costs, the profit shares to the Centre from centrally owned generation companies and coal
companies’ rise at the expense of the coal states. The consuming states pay a lower price for
power which does not reflect these externalities.
Compensation has two connotations: (i) remuneration and other benefits received in return
for services rendered and (ii) payment of damages by a person who has caused an injury.
This meaning thus involves the prerequisite of either a service or an injury or a loss. (TERI,
2007).The prime basis for any payment for the use of resources could be that due to
exploitation, the resources become exhausted and its owners must be compensated for either
116 16/news/41417764_1_db-power-power-purchase-agreements-power-producers
8. Conclusions and recommendations
155
the actual loss or the opportunity cost or both. Certain externalities vis-à-vis environmental
degradation, loss of forest cover, adverse public health, large scale displacement, loss of
livelihood are created as a result of development or exploitation of resources.
A key issue to note, thus, is that compensation for environmental and social impacts is not
part of sharing in resource wealth or benefits and should not be considered as such. This
tendency to conflate the two is responsible for a considerable amount of lack of clarity on
this issue. Negative environmental and social impacts are part of costs of the economic
activity and need to be reflected as such. Compensation for such impacts is important for
economic, ethical, fiscal and political reasons. Inattention to some of these concerns that
relate to a ‚using of the resources for the benefit of the other‛ or ‚cost-shifting which is not
reflected in prices‛ create a sense of environmental and social injustice117, and could result
in a conflict of interests between the local, state , and national levels, also between the
people of the states.(TERI 2007). Negative externalities associated with coal development
suggest that compensation arrangements need to address both horizontal and vertical
inequities.
To compensate for externalities arising out of coal mining and coal based thermal power
generation, the study has examined different options – tax, cess and free power.
Cesses, broadly speaking, are useful when the proceeds from them are a) clearly distinct
from general revenue, b) designated for a clearly defined purpose and applied exclusively
for their stated purpose and c) fully fund the purpose without over-funding it. Cesses ensure
a stabilization of revenue for a particular government priority, thus insulating it from the
vagaries of budget allocation and facilitating long term planning. They offer a guarantee to
the public of accountability in government expenditure. Politically, they signal the
government’s emphasis on a particular issue. There are criticisms too on the use of cesses.
One criticism is that the conversion of taxation to cesses holds public spending hostage to
narrow political interests and removes the room for government to address problems at the
macro level. It has also been argued that a continual increase in ‘soft’ earmarked taxation
(i.e. earmarks which do not impose defined boundaries on intended expenditure and do not
fully fund their purpose) leads to less accountability in and planning of general tax
expenditure and a misrepresentation to the public of the true cost of what they are paying
for.
Notwithstanding these criticisms, we still feel that in this particular case, legally and
administratively, the most feasible route to addressing inequity in burden and benefit
sharing is through impositions of cesses rather than taxes. Free power, if imposed uniformly,
is not in contravention of any law or rights of the States. However, in comparison to a cess, it
is a more complex arrangement for the purposes of valuation, levy, collection and
utilisation. Given the fluctuations in pricing and differing needs of additional power
amongst states, free or concessional power will be an unpredictable source of revenue and
may or may not be able to fully make up for environmental externalities created. Therefore,
the most attractive legal and administrative route is to have a Union imposed, but state
collected cess associated with damage costs of impacts of coal mining or per unit electricity
117
By ‘environmental injustice’ is meant the disproportionate burden of environmental degradation and
disruption faced by the more marginalized sections of society - the poor, the socially disadvantaged, and women
- who do not fight back due to lack of economic, political and social voice.
Equitable sharing of benefits arising from coal mining and power generation among resource rich states
156
generated. The proceeds from this cess need to be earmarked for environmental and social
remediation as detailed subsequently in order recommendations.
Regulatory deficits and accountability
While the regulatory framework describes the actions of the government through various
legal provisions, the fact that externalities have been created in the process of coal mining
which have not been addressed or compensated adequately, directs our attention to the
existence of regulatory failures in the governance of this sector. For the externalities that
have been described in the sections above, each has been addressed completely or at least in
parts in our legal framework. Beyond these it is clear that the coal sector suffers from an
overlap and discrepancy in the roles and responsibilities of the institutions involved which
ultimately results in a lack of regulatory efficiency. In the case of resettlement and
rehabilitation for people affected by coal mining, there is a proliferation of policies in the
absence of a national legal framework that has provided a pretext for the planning of R&R to
be ambiguous thus creating numerous social externalities that are either inadequately
compensated or not addressed at all.
In Chapters 4 and 5, the study did highlight both the regulatory deficits and the
unsatisfactory compensation for environmental externalities; land acquisition, health and
displacement impacts. It attempted to arrive at an estimate of how much per tonne of this
impact is actually uncompensated. The study team acknowledges that these figures can be
improved on and have their limitations. However, in such costing of externalities, we need
to make a start. In case of social issues such as land acquisition, displacement and R & R, the
new Act is far more progressive as discussed earlier and will improve the stakes for those
who contribute to the project through their land. However, its relevance to coal mining is
still not clear.
There are many questions being raised, for example, with respect to utilization of the
CAMPA funds, which are supposed to address forest and biodiversity losses. Stakeholder
consultations in states of Odisha and Jharkhand have revealed that the biggest challenge for
states to undertake compensatory afforestation is the non-availability of land to afforest
especially in the vicinity of existing forest areas (which is the stipulation by the FCA) and
even in other districts where afforestation could be possible. This raises questions as to
whether CAMPA is serving the purpose for which it was set up, i.e. restoring some of the
lost forests in area extent at least, since replacement of ecological integrity and biodiversity
value would not be possible.
Discussions with different experts and state officials highlighted the fact that managing
displacement is one of the biggest challenges in the case of coal mining. Tribal people are
more heavily impacted in coal regions and face several impediments in rehabilitation. Apart
from free, prior and informed consent prior to displacement, those who are displaced need
to be significantly better off as a result of the project.
Recommendations
The study has the following recommendations to make with regard to the sharing of benefits
and burdens based on the findings, but also to improve outcomes in the coal rich states
8. Conclusions and recommendations
157
Recommendation 1: On shares of the power produced through free or preferential
power
We do not recommend the use of free power to cover negative externalities. Demand
for free power can have different implications for power deficit and power surplus
states. Current developments in the power sector suggest that payment in kind, i.e.
free power, may become an unpredictable source of revenue. The dynamics of the
power market creates uncertainty about revenues from the sale of this power and so
is not suitable as a funding source to address environmental damage.
The demand for free power from thermal power stations does not emanate from a
statute and are more in the nature of contractual arrangements to be negotiated
between the power producer and the host state for facilitation of such projects
As long as the States seek power at variable cost or free of cost from all the power
plants, it is justifiable. However, any policy that mandates free power from only
those plants that are selling power to other states can be challenged in the court of
law as imposing restrictions on freedom of trade, commerce or intercourse among
states.
Recommendation 2: More equitable benefit sharing
We suggest that the proceeds from the sale of free or concessional power, where
agreed upon, should be used for general purposes as a means of sharing benefits
with host states. We also suggest that this benefit sharing should flow down to the
local community. Local community should be able to enjoy the benefits from these
projects at least as much as any other region. Prayas, 2012 suggests that around 4-5%
of the power produced should be set aside for local communities. There should be a
similar process of benefit sharing with local community in case of coal production.
The Mines and Minerals (Development and Regulation) Bill2011 addresses this
concern. It provides for 26% of profits of coal mines to go to a District Mineral
Foundation118, part of which would be used to make recurring payments to affected
people. We suggest that this provision should be enacted at the earliest.
States need to ensure that part of the enhanced royalty collected is earmarked for
development of human capital in the mineral area. The case for the earmarking funds
for development of human capital in the mining region is to convert natural capital
that is used up in the form of minerals to human capital, thereby operationalizing the
weak sustainability principle.
There is need for setting up an intergenerational fund to share the benefits of this
depleting resource with future generations (TERI, 2007)
As recommended in TERI 2007 and Prayas 2012 all efforts should be made to ensure
that local people and communities whose lives are disrupted by the coal mining at
various phases of their life cycle should be prime beneficiaries of resource
development. Where local people have no access to electricity, this can involve
118 There are now discussions to provide amount equivalent to royalty for the Foundation as is the case for other
minerals.
Equitable sharing of benefits arising from coal mining and power generation among resource rich states
158
provision of cheap or free power to the local community from the electricity
produced.
Recommendation 3: Burden sharing from coal mining and power production
Payments to resource rich states and to people in the region should serve three primary
goals, viz, compensation for externalities, correction for distributional injustice, and
deterrence or incentives for improved environmental behaviour (Kathleen, 2002).
The most attractive legal and administrative route to address existing impacts is to have a
Union imposed, but state collected cess associated with damage costs of impacts of coal
mining or per unit electricity generated. Box 6 discusses cess in the Indian context.
We suggest a two part cess linked to (i) uncompensated environmental and social
impacts of coal mining levied by the Central government on coal produced in states
and (ii) an environmental and social cess levied by the Centre on electricity
generation in a state for uncompensated impacts of coal power generation based in
states. In our estimates the cess on coal mining to be imposed on coal comes to Rs 119
per tonne of coal and cess on coal based power generation to be imposed on TPP
comes to Rs 0.75 per unit of electricity. If a single cess is levied linked to total
damages, then this will amount to Rs 0.83 /kWh (see Box 7).
This cess would replace any other existing similar cesses imposed on coal or coal based power production for mitigating environmental impacts
The proceeds from this cess need to be earmarked for environmental and social
remediation as detailed in the subsequent sections.
We recognize that to avoid future impacts, stricter environmental standards and
even stricter monitoring and compliance is required. The objective ultimately is a
lower environmental and social footprint of coal mining and power generation. Any
levy cannot be a substitute for a strong enforcement of the laws and rules.
In order to incentivise improved environmental and social performance, a rebate on
cess can be announced after a period of 2 years from the introduction of the cess for
those whose environmental and social performance show improvement, and who go
beyond compliance.
We also recognize that a
o Cess should not be seen a means for companies to avoid being more
environmental and social responsible.
o A Cess is suggested only as a short term means to compensate for the existing
impacts and to work towards a stricter regime and to drive research in
cleaner technologies and practices.
o The Cess can be withdrawn when the situation improves or a rebate on cess
can be allowed to incentivise companies that are going beyond compliance.
o Companies impose different levels of stress as a result of their activities and
should, therefore, be treated differently. Rebates can be imposed for lesser
polluting companies once a baseline is established on the current levels of
emissions, etc. or those producers that use cleaner technologies.

8. Conclusions and recommendations
159
The cess on coal and power generation will have fiscal and equity implications. The cess
levied by the Centre may:
Be passed on in full to the consumers, i.e. the power sector and hence to the state/s where
power is consumed (cess on coal will also ultimately get passed on to electricity
consumers). Cost of power generated will increase across the country.
Be passed on in part to the consumer. For example, the cess on coal mining can be
absorbed by CIL and thus by the Centre. The balance of the incidence of cess may be
borne either by (i) The centre as it also benefits from profits of the centrally owned coal
and power companies. Or (ii) The state governments may reduce the rates of electricity
duty on consumption of electricity in order to reduce the burden on the end consumers, .
In a cost plus scenario, it is easier to keep a check on the extent to which the cess is
passed on to the consumer. In a competitive bidding scenario, it is more difficult to
ensure that thermal power producers do not pass on the entire cess amount to the
consumers.
Since richer states and richer consumers in all states also consume more power than the
poorer states and poor people in general, there is also an element of interstate and
interpersonal inequity in all of this, as the coal rich states are poorer than most states and
also many of the districts where the coal is located are particularly poor and without access
to basic amenities and services. The people impacted most by coal mining and power
generation are also those living in these districts. A cess that is imposed, collected and
utilized to address these inequities will result in a greater fairness across states and their
people.
Equitable sharing of benefits arising from coal mining and power generation among resource rich states
160
Box 6 Cess as an instrument to address externalities
The term ‘cess’, in the Indian context, is used to refer to
a) a tax, the proceeds from which are ear-marked for a particular purpose or
b) a ‘fee’ which is imposed by the Government for provision of a particular public service.
For our purposes, we deal with the term in the first sense - the concept is known elsewhere as an
‘ear-marked tax’. Cesses are already extensively used in India. For example, the Water Cess Act,
1977 imposes a tax on water consumption which, although credited to the Consolidated Fund of
India, must be utilized for purposes under the Water (Prevention and Control of Pollution) Act,
1974. The Education Cess levied by the Finance Act, 2004 is to be used to provide and finance
quality universalized basic education. Since the earmarked tax is being collected for a particular
purpose, once that purpose is fulfilled, the rationale for the tax will also cease to exist. In this
sense, it is ‘temporary’ taxation.
The Government’s power to impose an ear-marked tax arises out of its legislative power
recognized by Article 246 of the Constitution of India. It is limited by the scheme of distribution of
powers in Schedule VII of the Constitution; i.e. the Central Government can only impose an ear-
marked tax if such power is recognized as falling within its legislative area (List I or List III in
Schedule VII). There are no other Constitutional limitations per se on the concept of ear-marked
taxation. In the case of minerals, the power of taxation of mineral rights falls within the State List
(Entry 23, List II); however, it is explicitly limited by the power of the Centre to regulate mines
and mineral development (Entry 54, List I).
The concept itself does not dictate any particular form or design that a law is supposed to follow.
Thus, the water cess is imposed as a percentage on the value of water consumed, whereas the
education cess takes the form of a percentage levy on the amount paid as income tax (and a basket
of other taxes); in other words, a tax calculated on a tax. There are also a variety of theories on
whom to impose an ear-marked tax (or indeed any taxation) on – the ‘benefit’ principle states that
tax should be collected proportionately from the beneficiaries of public expenditure whereas in a
welfare economy such as India’s, taxation plays an important role as a tool of re-distribution.
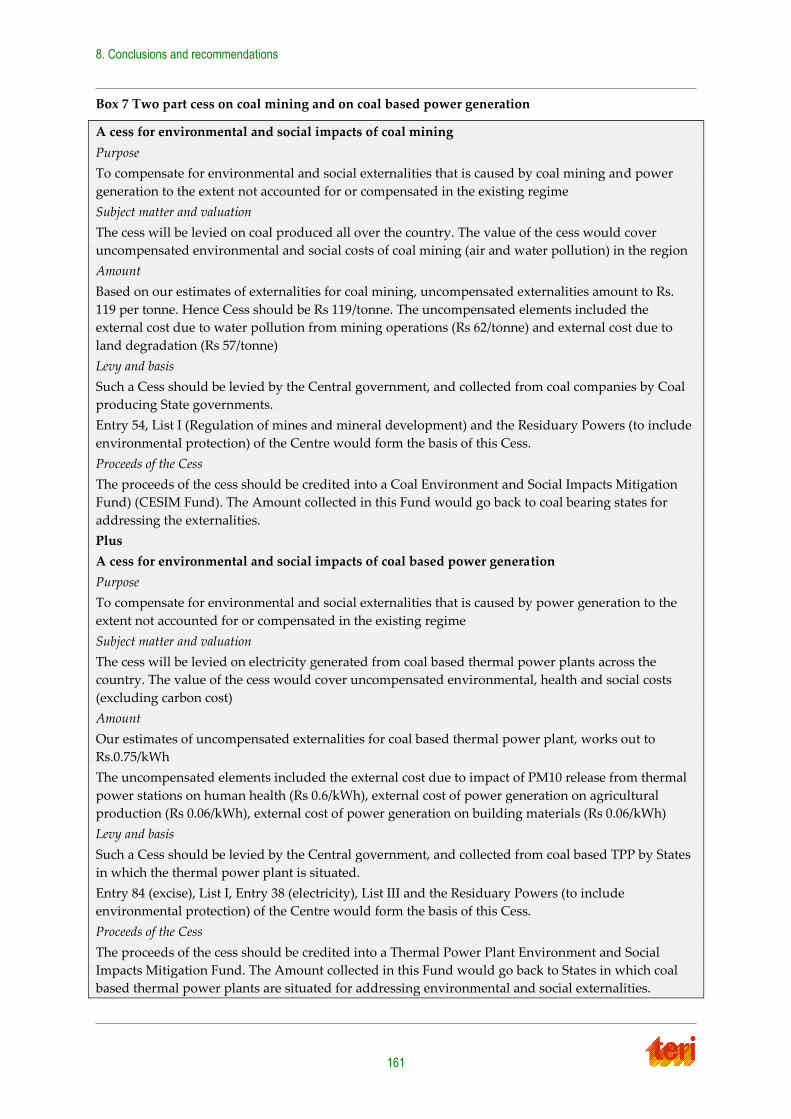
8. Conclusions and recommendations
161
Box 7 Two part cess on coal mining and on coal based power generation
A cess for environmental and social impacts of coal mining
Purpose
To compensate for environmental and social externalities that is caused by coal mining and power
generation to the extent not accounted for or compensated in the existing regime
Subject matter and valuation
The cess will be levied on coal produced all over the country. The value of the cess would cover
uncompensated environmental and social costs of coal mining (air and water pollution) in the region
Amount
Based on our estimates of externalities for coal mining, uncompensated externalities amount to Rs.
119 per tonne. Hence Cess should be Rs 119/tonne. The uncompensated elements included the
external cost due to water pollution from mining operations (Rs 62/tonne) and external cost due to
land degradation (Rs 57/tonne)
Levy and basis
Such a Cess should be levied by the Central government, and collected from coal companies by Coal
producing State governments.
Entry 54, List I (Regulation of mines and mineral development) and the Residuary Powers (to include
environmental protection) of the Centre would form the basis of this Cess.
Proceeds of the Cess
The proceeds of the cess should be credited into a Coal Environment and Social Impacts Mitigation
Fund) (CESIM Fund). The Amount collected in this Fund would go back to coal bearing states for
addressing the externalities.
Plus
A cess for environmental and social impacts of coal based power generation
Purpose
To compensate for environmental and social externalities that is caused by power generation to the
extent not accounted for or compensated in the existing regime
Subject matter and valuation
The cess will be levied on electricity generated from coal based thermal power plants across the
country. The value of the cess would cover uncompensated environmental, health and social costs
(excluding carbon cost)
Amount
Our estimates of uncompensated externalities for coal based thermal power plant, works out to
Rs.0.75/kWh
The uncompensated elements included the external cost due to impact of PM10 release from thermal
power stations on human health (Rs 0.6/kWh), external cost of power generation on agricultural
production (Rs 0.06/kWh), external cost of power generation on building materials (Rs 0.06/kWh)
Levy and basis
Such a Cess should be levied by the Central government, and collected from coal based TPP by States
in which the thermal power plant is situated.
Entry 84 (excise), List I, Entry 38 (electricity), List III and the Residuary Powers (to include
environmental protection) of the Centre would form the basis of this Cess.
Proceeds of the Cess
The proceeds of the cess should be credited into a Thermal Power Plant Environment and Social
Impacts Mitigation Fund. The Amount collected in this Fund would go back to States in which coal
based thermal power plants are situated for addressing environmental and social externalities.
Equitable sharing of benefits arising from coal mining and power generation among resource rich states
162
Recommendation 4: setting up a Coal Environmental and Social remediation
Fund/ Thermal Power Plant Environment and Social Impacts Mitigation Fund
Our policy suggestions call for an approach to burden sharing that goes beyond interstate
transactions, but which also includes local communities and areas. To do this we suggest the
setting up of Funds to address the needs of impacted people
We recommend the setting up of Fund/Funds with clear allocation rules or guidelines for
the use of funds obtained from cess imposed on coal and power production. The money
from the cess collected should go into a state level Fund/Funds. The design of the Fund
should reflect objectives and the purpose for which it is being set up. The key objective of
this Fund will be the redressal of past environmental problems and social displacement
arising from coal mining activity, and to assist future mining to be conducted in an
environmentally safe and socially acceptable manner even as it contributes to economic
growth, job generation and local development in the state. It is important to be clear what
the cess money can be used for and what it should not be used for.
The Fund money should not be used for the following:
o Afforestation, as CAMPA already covers that
o In preventive and remedial activities of coal and power companies that they are
legally expected to address
o Activities covered under the Clean Energy Cess on Coal
Fund utilization
‚Because suffering is localized, compensation also needs to be localized‛ this was the
message from the coal rich states. The amount collected in the proposed Funds has to be
used to address uncompensated environmental and social externalities arising out of coal
mining and coal based power generation. It aims at improving the lives of local people
affected by impacts of coal mining and power production. The cess is not a substitute for
enforcement of existing rules and compliance with the norms in place. The cess would
complement the current regime of approvals, monitoring and compliance. It would support
activities to mitigate externalities associated with coal mining and coal based thermal power
generation, and distributes the burden and benefits more equitably. More specifically, the
fund can/should support the following:
Remediate cumulative environmental damages in the coal mining regions.
Support efforts to reduce the coal dust problem
Support efforts to improve quality of water bodies
Support efforts at dump management
Support programmes for the rehabilitation of abandoned mine sites. Creative
models exist internationally to convert closed mines to productive economic
assets or some other appropriate after mine use options. This should be standard
procedure for all mines
Clean up of all critically polluted areas. This can be done with research institutes,
NGOs, etc. in the region
8. Conclusions and recommendations
163
Encourage continual monitoring and improvement in environmental
management and reduced social footprint through creation of platforms
involving developer, states and local people
Promote research, education, training and the exchange of information on
environmental management, science and technology issues related to coal mining
and power production
Promote exchange of best practices in mining and thermal power generation
Recognise environmental excellence through awards, both at an individual and
corporate level, but also of well-run coal districts.
Provide directly or support expertise to the mining industry to carry out
competent EIAs
Set up a cell in each taluk of the coal mining region to address R & R issues and
also monitor PAP in all but specially R & R hot spots
o Set up ways to assist rehabilitated families to manage the compensation
money received
o Develop educational initiatives, support balwadis, women’s education
o Support local initiatives at enhancing local capacity and skills, training
centres
o Support/ contribute to other programmes that promote community
development in the locality or region
A special concern in all coal mining areas which is often not sufficiently
addressed is the health of communities (other than coal mine workers) living in
the region. While clearly improved oversight and enforcement of environmental
laws and rules is necessary, there should be mechanisms in place to ensure that
mining communities have access to medical insurance and well-functioning
facilities for treatment in case they are affected. Companies and the state
government can jointly support the medical care.
Strengthen institutions of oversight such as SPCBs, departments of mines,
environment, land revenues, etc., though investment in human capacity locally to
monitor environmental and social issues
Staffing
The Fund should have Core staff consisting of:
A paid Director; two senior professionals with environmental and social
backgrounds; a research associate, administrative support
The oversight should be provided by a Board or Committee with multi
stakeholder governance, comprising 8 members:
o 2 State Government Representatives; 2 Local community Representatives;
CIL representative; Representative of Publicly owned TPPS (NTPC/ DVC/
state generation companies); Representative of IPP; Representative of key
research institute in the state

Equitable sharing of benefits arising from coal mining and power generation among resource rich states
164
Recommendation 5: Improved environmental and coal governance is a must to
reduce ecological and social stress in coal rich states
The MOEF, the MOC and the State bodies need to strengthen institutional
coordination before giving mining and environmental clearances.
o Government departments should also give clearances in time wherever such
applications have been filed in compliance with all laws etc. Delays in
obtaining genuine clearances also mask the regular v/s irregular operators.
o The Government should make available all the documents pertaining to the
proposed coal mining to concerned stakeholders and villagers affected by the
mining operation well in advance.
o Free, prior and informed consent is key to improving social acceptability of
projects
Proactive disclosure of information in connection with RTI;
o Spatial data bases should be created.
o The websites of the all concerned government departments that regulate coal
mining and power production in the States should be uploaded regularly, at
least once in 6 months.
Effective implementation of EPA, FCA, PESA and other acts that will improve actual
functioning on the ground
Clearly there is a need for far stricter monitoring of power plants and mines for
emissions and other environmental impacts.
o A multi-stakeholder committee, such as suggested by Prayas, 2012 could be
set up including independent experts, representatives of the SPCB, local self-
government institutions and citizens.
o Need of capacity and resources for monitoring impacts;
o Strengthen local panchayat capacity in environmental governance; Empower
local panchayats in mining regions financially by sharing royalty with them
o No mine or power producer should be allowed to continue operations if
environmental rules and social obligations are flouted;
o Recognize and incentivise good corporate behaviour
o Local people should be involved in monitoring and reporting any illegalities
so as to correct in time.
o Social audits & participatory monitoring of impacts should be encouraged
o Natural resource and environmental accounts for the coal sector should be
developed
8. Conclusions and recommendations
165
Recommendation 6: Reduce social and ecological stress by keeping within
carrying capacity of the region
Cumulative impact studies and carrying capacity studies need to be carried out
given the large volume of mining and planned power capacity expansion
o Such studies are especially required in ecologically sensitive river basins
o The existing conditions found in particular areas as obtained through the
CEIP should be paramount in decision making for opening new mines or
locating new plants
Reduce environmental footprint through use of green technologies and improved
practices
Pricing of water and land right to ensure more efficient resource use in coal
development and power generation
There is need of a detailed study to examine the impacts of coal mining on surface
water and ground water in the region.
Recommendation 7: Improving health in coal mining regions
Improve surveillance and monitoring of diseases and disorders in the mining regions
in the states
Get coal mining and power industry to partner with Panchayats and primary health
centres to provide both diagnostics and treatments that are industry linked
Reduce air pollution in road and freight corridors. Greater control of sulphur dioxide
as a pollutant is required.
More careful assessment of health risks of arsenic and radioactivity in fly ash is
required to ensure more informed decisions on fly ash utilization.
Set up hospitals with speciality facilities on coal related diseases and mechanisms in
place to ensure that local communities have access to medical insurance and well-
functioning facilities for treatment in case of ill health due to degraded environment

Equitable sharing of benefits arising from coal mining and power generation among resource rich states
167
9. Bibliography
Ackerman, F. (2006). The Unbearable Lightness of Regulatory Costs. Tufts University, Global
Development and Environment Institute Working Paper No. 06-02.
Ahmed & Lahiri-Dutt, N. &. (2006). Engendering Mining Communities: Examining the
Missing Gender Concerns in Coal Mining Displacement and Rehabilitation in India.
Gender, Technology & Development, 313-339.
Alami, J., & Akhtar, M. (2011). Fly ash utilization in different sectors in Indian scenario.
International journals of emerging trends in Engineering and Development, 1(I).
Arora, T. (2011). FICCI Reaction on Draft MMDR Act. Retrieved July 25, 2013, from FICCI:
http://www.ficci.com/SEdocument/20157/press-release1.pdf
Arthur D. Little. (2002). Economic Effects of the EU Subsances Policy. Weisbaden.
ATSE. (2009). The Hidden Costs of Electricity: Externalities of Power Generation in Australia.
Available at:
http://apo.org.au/sites/default/files/ATSE_Report_Hidden_Costs_Electricity_2009.pd
f, Australian Academy of Technological Sciences and Engineering, Ian McLennan
House, 197 Royal Parade, Parkville, Victoria 3052.
Baliga. (1994). Displacement Due to Mining’ in Jharkhand. Economic and Political Weekly, 31,
1524-1528.
Barla, D. (2009). Retrieved July 25, 2013, from Protests Against Displacement in Jharkhand:
http://save-adivasis.blogspot.in/2009/08/analysis-of-relief-and-rehabilitation.html
Benghara, R. (1996). Coal Mining Displacement. Economic & Political Weekly, 647-649.
Bernow, S., & Marron, D. (1990). The Treatment of Environmental Impacts in Electric Resource
Evaluation: A Case Study in Vermont. Tellus Institute, Boston, MA.
Bhattacharya, B. C. (2004). Experience Gathered and Lessons Learned During the
Implementation of a Social Mitigation Project in Indian Coalfields. Proceedings of the
Fifth Asia Pacific Industrial Engineering and Management Systems Conference 2004 (pp.
20.2.1-20.2.14). Asia Pacific Engineering and Management Society.
Bhattacharyya, S. (1997). An estimation of environmental costs of coal-based thermal power
Generation of India. International Journal of Energy Res, 21, 289-298.
Bhushan & Suneja. (2012). Mining, People and the Environment: The Implications of the EU-India
Free Trade Agreement. Dublin: Comhlamh et al.,.
Bhushan. (2008). Rich Lands, Poor People: the socio-environmental challenges of mining in India.
Retrieved from http://bdsnetwork.cbs.dk/publications/chandra.pdf
Cabinet Secretariat, GOI. (2011). Report of the Committee on allocation of natural resources.
Chawla Committee Report.
CAG. (2012). Performance Audit of Coal India Limited Corporate Social Responsibility. Retrieved
from Comptroller and Auditor General of India:
Equitable sharing of benefits arising from coal mining and power generation among resource rich states
168
http://saiindia.gov.in/english/home/Our_Products/Audit_Report/Government_Wise/
union_audit/recent_reports/union_performance/2011_2012/Commercial/Report_No_
9/Report_No_9.html
Cairncross, E., John, J., & Zunckel, M. (2007). A novel air pollution index based on the
relative risk of daily mortality associated with short-term exposure to common air
pollutants. In Atmospheric Environment (Vol. 38, pp. 8442-8454).
CEA. (2011). Report on Fly-ash generation at coal / lignite based thermal power stations and its
utilization in the contry for the year 2010-11. Central Electricity Authority.
CEA. (2012). Report on minimization of power requirement for thermal based plants. CEA.
Centre for Science & Environment. (2011). Sharing the Wealth of Minerals: A Report on Profit
Sharing with Local Communities. New Delhi: Centre for Science & Environment.
CERC. (2010). D.O.No. 9/7/2010-2010 - Reg. AFF-GC/MoP/CERC. Retrieved from CERC:
www.cerc.nic.in
Chakraborty, M., Ahmad, M., Singh, R., Pal, D., Bandopadhyay, C., & Chaulya, S. (2002).
Determination of emission rate from various open cast mining operations. In
Environmental Modeling and Software 17 (pp. 467-480).
Chand, S. (2008). The Coal Dilemma. New Delhi, India: The Energy and Resources Institute
and WWF-India.
Chhattisgarh Human Development. (2005). Chhattisgarh Human Development Report 2005.
Retrieved August 13, 2013, from Government of Chhattisgarh:
http://chhattisgarh.nic.in/book/hdr.pdf
Choudhury et al. (2012). Water Conflicts in Odisha: A Compendium of Case Studies. Pune:
Forum for Policy Dialogue on Water Conflicts in India.
Coal Insights. (2012). Rohne Coal Project to cut off link between Palamau, Hazaribaugh
Tiger Reserves. Coal Insights Magazine- From Mining to Igniting, 7(4).
Comptroller and Auditor General of India. (2013). Report of the Comptroller and Auditor
General of India on Compensatory Afforestation in India (Report no. 21).
Cooley, & McIntyre, T. (1924). The law of taxation (4th ed.). Chicago : Callaghan: pp.98-99
cited in Calcutta Municipal Corporation & Others v M/s Shrey Mercantile
Pvt.Ltd.&Others, SC judgment dated 9 March 2005 [Appeal (civil) 5631 of 2000].
CPCB. (1994). Development of emission factor for thermal power plants. New Delhi: Report
submitted by Environment Engineers Consortium to Central Pollution Control
Board.
CPCB. (2011). Impact of coal mine waste water discharge on surroundings with reference to heavy
metals. Retrieved from Central Pollution Control Board website:
http://www.cpcb.nic.in/coalmineww2011.pdf
Cropper, M., Gamkhar, S., Malik, K., Limonov, A., & Partridge, I. (2012). The Health Effects of
Coal Electricity Generation in India. Washington, DC: Resources for the Future.
CSE. (2008). Rich Lands Poor People- Is Sustainable Mining Possible. Centre for Science and
Environment, New Delhi.
9. Bibliography
169
CSE. (2012). Retrieved July 10, 2013, from
http://www.cseindia.org/userfiles/02Coal%20mining.pdf
Debnath, & Ors. (2013, June 24). Meeting with Representatives of the Central Mine Planning
& Design Institute. (T. Team, Interviewer)
Dhadse, S. (2007). Fly ash characterization, utilization, and Government initiatives in India-
A review. Scientific and Industrial Research, 67, 11-18.
Dubey. (2012). Effect of Coal Based Industries on Surface Water Quality of Singrauli
Industrial Area of M.P. (India). IOSR Journal of Applied Chemistry (IOSRJAC), I(4), 31-
33.
Dutta, S., & Pandey, A. (2011). Evaluation of Cost-benefit Analysis of Washed Coal for
Power Sector.
Economic Survey. (2013). Planning & Coordination Department, Directorate of Economics &
Statistics, Government of Odisha.
Fernandes, D. (2013). The Study of displacement, resettlement and rehabilitation (R&R) of people
affected due to coal mining in India. Major Project Report, TERI University, New Delhi.
Fernandes, W. (2005). Rehabilitation as a Right: Where is the Policy? Social Action, 123-137.
Fernandes, W. (2007). Mines, Mining and Displacement in India. Proceedings of 1st
International Conference on Managing the Social and Environmental Consequences of Coal
Mining in India (pp. 333-344). Dhanbad: Indian School of Mines University.
FIMI. (2006). Study on NPV calculations for diversion of forest land for mining purpose. Retrieved
from Federation of Indian Mineral Industries:
http://www.fedmin.com/upload/npvf.pdf
Garada, R. (2013). Contextualizing the Emerging Issues and Dilemmas of Displaced
Ecosystem People: A Case of Coal Mining Industry at Talcher, Odisha (India). IOSR
Journal Of Humanities And Social Science, 22-31.
Gaur & Ors. (2013, June 20). Meeting with Representatives of Department of Energy,
Jharkhand, with presence of other department representatives. (T. Team,
Interviewer)
Ghose, M. (2007). Characteristics of Hazardous Airborne Dust Around an Indian Surface
Coal Mining Area. Environ Monit Assess.
Golder Associates. (2001). Basis of cost estimate for water treatment with commingling.
USA.
Goswami, S. (2010). Environmental degradation due to exploitation of mineral resources : A
scenario in Orissa. An International Quarterly Journal of Life Sciences, 2(Special Issue),
295 – 304.
Greenpeace. (2011). Singrauli: The Coal Curse – A fact finding report on the impact of coal mining
on the people and environment of Singrauli. Retrieved July 10, 2013, from Greenpeace
India Society: http://www.cseindia.org/userfiles/02Coal%20mining.pdf
Equitable sharing of benefits arising from coal mining and power generation among resource rich states
170
Greenpeace India. (n.d.). Singrauli: The Coal Curse . Retrieved July 25, 2013, from
Greenpeace.org: http://www.greenpeace.org/india/Global/india/report/Fact-finding-
report-Singrauli-Report.pdf
Greenpeace Report. (2012). How mining is thrashing Tiger Land-2012. Retrieved from
www.greenpeace.org/.../How-Coal-mining-is-Trashing-Tigerland.pdf
Gurjar, B., Jain, A., Sharma, A., Agarwal, A., Gupta, P., Nagpure, A., et al. (2010). Human
health risks in megacities due to air pollution. In Atmospheric Environment (Vol. 44,
pp. 4606–4613).
Guthrie. (2010). Basic research methods: an entry to social science research. SAGE
Publication.
Harringtonne, W., Morgenstern, R., & Nelson, P. (1999). On the Accuracy of Regulatory Cost
Estimates. Discussion Paper 99-18, Resources for the Future.
HEI International Scientific Oversight Committee. (2010). Outdoor Air Pollution and Health in
the Developing Countries of Asia: A Comprehensive Review. Boston, MA: Health Effects
Institute.
Herbert & Lahiri-Dutt. (2004). Coal Sector Loans and Displacement of Indigenous
Populations: Lessons from Jharkhand. Economic & Political Weekly, 2403-2409.
Hohmeyer, O. (1988). Social costs of energy consumption: External effects of electricity generation
in the Federal Republic of Germany. Berlin: Springer –Verlag.
IBM. (2011). State Reviews-Indian Minerals Yearbook. Ministry of Mines, Government of India.
IBM. (2012). State Reviews-Indian Minerals Yearbook. Ministry of Mines, Government of India.
IDFC. (2009). Captive Coal Mining by Private Power Developers – Issues and Road Ahead:
Summary of Recommendations.
Imam, G. (2007). Case Study No. 7. Retrieved July 25, 2013, from Artisanal & Small Scale
Mining in the Asia Pacific: http://www.asmasiapacific.org/uploads/91.pdf
Indian Meteorological Department. (1999). Climatological tables of observatories in India,
1951-1981. New Delhi.
Jaffe, A., Peterson, S., Portney, P., & Stavins, R. (1995, March). Environmental Regulation
and the Competitiveness of US Manufacturing: What Does the Evidence Tell Us?
Economic Literature, 33(1), 132-163.
Jonathan, L., Joel, S., & Lisa, B. K. (2009). Uncertainty and Variability in Health-Related
Damages from Coal-Fired Power Plants in the United States. Risk Analysis.
Kadekodi, G. (1988). Planning for Coal Sector. New Delhi: B.R Publishing Corporation.
Kathleen, S. (2002). Economics and Liability for Environmental Problems. United Kingdom:
Ashgate Pub Ltd.
Khan, & Javed. (2012). Spatio-Temporal Land Cover Dynamics in Open Cast Coal Mine Area
of Singrauli, M.P. India. Geographic Information System(4), 521-529.
Khanna, A. (2013). Governance in coal mining: Issues and challenges. TERI- NFA working paper
series.
9. Bibliography
171
Kumar, & Rao. (2001). Valuing The Beneficts of Air Pollution Abatement Using a Health
Production Function A Case Study of Panipat Thermal Power Station . Environmental
& Resource Economics, 20(2), 91-102.
Kumari, N., Anshumal, & Singh, G. (2007). Impact of coal mining on ponds of Jharia Town,
Dhanbad, Jharkhand. First International Conference on MSECCMI. New Delhi, India.
Lahiri-Dutt et al., K. (2012). Captive Coal Mining in Jharkhand. Economic & Political Weekly,
39-45.
Lahiri-Dutt et al., K. (2012). Land Acquisition and Dispossession: Private Coal Companies in
Jharkhand. Economic & Political Weekly.
Lahiri-Dutt, K. (2007). Illegal Coal Mining in Eastern India: Rethinking Legitimacy and
Limits of Justice.
Logue, J., Price, P., Sherman, M., & Singer, B. (2012). A Method to Estimate the Chronic
Health Impact of Air Pollutants. In Health (pp. 216–222). San Francisco.
Lok Sabha. (2012). Starred Question- No. 363-2/5/2012 to Ministry of Coal.
Lok Sabha questions. http://164.100.47.132/LssNew/psearch/qsearch15.aspx. (n.d.).
Mahapatra, D. (2012). External cost of coal based electricity generation: A tale of Ahmedabad
city. Energy Policy(49), 253 – 265.
Mark, S. A. (2011). Computer simulations to evaluate the benefits of clean coal for thermal
power generation. US ‐ India Coal Working Group. New Delhi: Available at:
http://www.coal.nic.in/VALUE%20OF%20WASHED%20COAL.
McGuire, M. (1982). Regulation, Factor Rewards and International Trade. Public Economics,
17(3), 335-54.
Mercer Management Consulting. (2003). Study of the Impact of the Future Chemicals Policy:
Final Report. French Union of Chemical Industries (UIC).
Mittal, M. (2012). Estimates of Emissions from Coal Fired Thermal Power Plants in India.
MoC. (2005). Coal Vision 2025. Retrieved December 11, 2012, from
http://www.greenpeace.org/india/Global/india/report/How-Coal-mining-is-
Trashing-Tigerland.pdf
MoC. (2012). Provisional coal statistics, 2011-12. Kolkata.
MoEF. (n.d.). Retrieved August 16, 2013, from Ministry of Environment & Forest:
http://www.districtsofindia.com/index.aspx
MoEF. (2004). India’s initial national communication to the United Nations Framework Convention
on Climate Change. Ministry of Environment and Forests, Government of India.
MoEF. (2009). Comprehensive Environmental Assessment of Industrial Clusters. Retrieved from
Ministry of Environment and Forest: http://moef.nic.in/downloads/public-
information/Industrial%20Clusters_env_assessment.pdf
Mohanty, R. (2011). Impact of Development Project on the Displaced Tribals: A Case Study
of A Development Project in Eastern India. Orissa Review, 67-73.
Equitable sharing of benefits arising from coal mining and power generation among resource rich states
172
Mourya & Chakraborty. (2012). Displacement And Resettlement In Coal Mining Area Of
Raniganj: A Review On Social Problems - A Case Study Of Hansdiha Village,
Raniganj, West Bengal. Geo-Analyst.
Mundu, B. (2003, April 14-15). India Case Study Presented at the workshop on Indigenous Peoples,
the Extractive Industries and the World Bank The case of East Parej Coal Mines Open Cast
Project in Jharkland, India. Retrieved July 25, 2013, from Forest Peoples Programme:
http://www.forestpeoples.org/sites/fpp/files/publication/2010/08/eirinternatwshopin
diacaseengapr03.pdf
Nari Surakhshya Samiti. (2010). Lingering Impact of reckless mining /industrialization in Angul
District on Dalit Segment of Population with special reference to Talcher & Chhendipada
Blocks during 2000-2010: A Pilot Study. Retrieved July 25, 2013, from Chitta Behera:
http://chittabehera.com/MiscWork/Consolidated%20Report%20of%20Angul%20Stud
y.pdf
National Research Council. (2010). Hidden Costs of Energy: Unpriced Consequences of Energy
Production and Use. Washington, DC: The National Academies Press.
NEERI. (2006). Post-Clearance Environmental Impacts and Cost-benefit Analysis of Power
Generation in India. New Delhi: Ministry of Statistics and Programme
Implementation.
Ostro, B. (1994). Estimating the Health Effects of Air Pollution: A Method with an Application to
Jakarta. Policy Research Working Paper, World Bank.
Ottinger. (1990). Environmental Costs of Electricity. Oceana: Pace University Center for
Environmental Legal Studies.
P K Jena & Ors. (2013, June 18). Meeting with Representatives from Department of Energy,
Orissa. (T. Team, Interviewer)
Panda, D. (n.d.). Industrialization & Environmental Pollution in Talcher Belt of Orissa. Retrieved
June 5, 2013, from ftp://ftp.solutionexchange.net.in/public/wes/cr/res03070702.doc
Pandey, V., Singh, J., Singh, R., Singh, N., & Yunu, M. (2011, July-August). Arsenic hazards
in coal fly ash and its fate in Indian scenario In Resources. Conservation and Recycling,
55(9-10), 819–835.
Panwar, S. (2011). Time sequential surface change analysis of TalcherAngul region of Orissa
using Remote Sensing and GIS. International Journal of Geomatics And Geosciences.
Paul, E. R., Jonathan, B. J., Kevin, E., Michael, H., Benjamin, S. M., Richard, H., et al. (2011).
Full cost accounting for the life cycle of coal. (C. Robert, L. Karin, & K. Ida, Eds.)
Ecological Economics Reviews, 73-98.
Pearce. (1992). Energy and Social Health Integrating Quantity and Quality in Energy Planning.
University College London and University of East Anglia, Centre for Social and
Economic Research on the Global Environment (CSERGE), Norwich.
Peter, R., & Socrates, K. (n.d.). Internalisation of external cost in the power generation sector:
Analysis with Global Multi-regional MARKAL. Energy Policy, 35(2), 828:843.
Planning Commission. (2013). Databook for DCH.
9. Bibliography
173
Porter, M. (1990). The competitive advantage of nations. New York: Free Press.
Porter, M., & van der Linde, C. (1995). Towards a New Conception of the Environment-
Competitveness Relationship. Economic Perspectives, 9(4), 97-118.
Prayas. (2011). Thermal power plants on the anvil: Implications and Need for
Rationalisation.
Prayas. (2012). Role of Thermal Power Plants and Coal Mining in Local Area Development and
Addressing Regional Imbalance: Conditions and Processes. Report by Prayas submitted to
Maharashtra Government.
Priyadarshi, N. (2010). Effects of mining on environment in the state of Jharkhand, India- Mining
has caused severe damage to the land resources. Retrieved from
http://www.ismenvis.nic.in/WriteReadData/CMS/156EFFECTS%20OF%20MINING.p
d
Rastogi, A. K. (2013, June 22). Meeting with Representative of Department of Revenue,
Jharkhand. (T. Team, Interviewer)
Relhan, N. (2011). Air pollution and health implications of regional electricity transfer at
generational centre and design of compensation mechanism. Ph.D. Thesis submitted to
TERI University.
Reza, R. (2010). Impact of industrial development on surface water resources in Angul
region of Orissa. International Journal of Environmental Sciences, I(4).
Rudiger, P. (1975). Pollution, Welfare and Environmental Policy in the Theory of
Comparative Advantage. Environmental Economics and Management, 2, 160-69.
Sahu. (2011). Land Degradation due to Mining in India and its Mitigation Measures. Second
International Conference on Environmental Science and Technology. Singapore.
Samiti, N. (2010). Lingering Impact of reckless mining /industrialization in Angul District on Dalit
Segment of Population with special reference to Talcher & Chhendipada Blocks during 2000-
2010: A Pilot Study. Retrieved June 7, 2010, from Chittabehera:
http://www.chittabehera.com/MiscWork/Consolidated%20Report%20of%20Angul%
20Study.pdf
Satapathy, R. (2006). Mineral Potential of Orissa State : A Kaleidoscopic Review. Retrieved June 4,
2013, from Orissa Government: http://orissa.gov.in/e-
magazine/Orissareview/may2006/engpdf/or-may-06.pdf
Sethi, A. (2011). Chhattisgarh Coal Blocks a Test Case for Acquiring Tribal Lands. Retrieved July
25, 2013, from The Hindu: http://www.thehindu.com/news/national/chhattisgarh-
coal-blocks-a-test-case-for-acquiring-tribal-lands/article2465047.ece
Sharma, & Siddiqui. (2010). Assessment of air quality for an open cast coal mining area.
Indian J.Sci.Res, 47-55.
Sharma, c. (2008). 'Emission Inventory: Emission Factors & Methodology'. GURME-
International Workshop (GURME-2008) on “Air Quality Forecasting” held at Indian
Institute of Tropical Meteorology, 8 -12, December’ 2008. based on a study undertaken by
the NPL.
Equitable sharing of benefits arising from coal mining and power generation among resource rich states
174
Sharma, R., & Singh, S. (2009). Displacement in Singrauli Region: Entitlements and
Rehabilitation. Economic & Political Weekly, xliv(51).
Siebert, H. (1977). Environmental Quality and the Gains from Trade. Kyklos, 30(4), 657-73.
Singh, & Mehraj. (2010). To Study the Status of Compliance of Approval Conditionalities for Forest
Land Diversion due to Coal Mining. Summer Internship Report, Ministry of
Environment and Forest, Regional Office Bhopal.
Singh, G. (2006). Environmental and Social Challenges facing the coal Industry. International
Coal Congress and Expo December 2006. New Delhi.
Singh, G. (2007). Mitigating environmental and social impacts of coal mining in India. 1st
International Conference on Managing the Social & Environmental Consequence of Coal
Mining in India. New Delhi.
Singh, G. (n.d.). Environmental Issues with best management practice of coal mining in India.
Retrieved from http://testsite.teriin.org/events/docs/gurdeep.pdf
Singh, P. (2010). Impact of coal mining and industrial activities on land use pattern in Angul
– Talcher region of Orissa, India. International Journal of Engineering Science and
Technology, 2(12), 7771-7784.
Singh, R., Singh, P., & Singh, G. (2007). Evaluation of land degradation due to coal mining-A
vibrant issue. First International Conference on MSECCMI. New Delhi, India.
Somayaji. (2008). Man made disasters: Displacement, resettlement, and rehabilitation in
Orissa- Reflections from the field. Social Change, 38(4), 689-704.
Somayaji, S. (2012). Man-made Disasters: Displacement, Resettlement and Rehabilitation in Odisha
– Reflections from Field. Retrieved July 25, 2013, from The Humanist Voice:
http://humanistvoice.in/join-hv/item/254-manmade-disasters.html
SPCB-Orissa. (2010). Abatement of Pollution in Critically Polluted Industrial Clusters. State
Pollution Control Board – Orissa, Bhubaneswar.
StandingCommittee, C. a.-2. (2010). Rehabilitation and Resettlement by Coal India Limited:
Seventh Report. Ministry of Coal.
Stavins, R. N. (1998). Market Based Environmental Policies. Washington D.C.: Resources for the
Future.
Strukova, E., Golub, A., & Markandya, A. (2006). Air Pollution Costs in Ukraine. Working
Paper 92, Fondazione Eni Enrico Mattei.
Taradutt. (2013, June 20). Meeting with Representative of Department of Revenue, Orissa.
(T. Team, Interviewer)
TERI. (1997). Area wide Environmental Quality Management (AEQM) Plan for the Mining Belt of
Goa.
TERI. (2007). Compensation to Resource Bearing States. Report to the Inter State Council, New
Delhi.
TERI. (2008). Policy, institutional, and legal barriers to economic utilization of fly-ash. Prepared for
Ministry of Environment and Forests, Government of India.
9. Bibliography
175
TERI. (2011). 'Responsible Sovereignty' and Energy Resources. Konrad Adenauer Foundation.
Terminski, B. (2012). Mining-Induced Displacement And Resettlement: Social Problem And
Human Rights Issue (A Global Perspective. Retrieved July 25, 2013, from Social Science
Research Network: http://papers.ssrn.com/sol3/papers.cfm?abstract_id=2028490
The Hindu. (2003, April 24). Tribals displaced by coal mines seek compensation. Retrieved July 25,
2013, from The Hindu: http://hindu.com/2003/04/24/stories/2003042403061200.htm
UNEP. (1972). Declaration of the United Nations Conference on the Human Environment.
Retrieved March 29, 2013, from
http://www.unep.org/Documents.Multilingual/Default.asp?documentid=97&articlei
d=1503
United Nations Development Programme. (2008). Land Rights and Ownership in Orissa.
UNDP.
USEPA. (2010). Guidelines for Preparing Economic Analyses. National Center for
Environmental Economics, Office of Policy. U.S. Environmental Protection Agency.
Verma. (2013, June 19). Meeting with Representative of Department of Steel and Mines,
Orissa. (T. Team, Interviewer)
Vishal Dev & Ors. (2013, June 18). Meeting with Representatives of Orissa Industrial
Infrastructure Development Corporation. (T. Team, Interviewer)
WHO. (1999). Monitoring Ambient Air Quality for Health Impact Assessment . World Health
Organization Regional Office for Europe. Copenhagen: WHO Regional Publications;
European series.
Wikipedia. (n.d.). Retrieved September 2013, from Market-based environmental policy
instruments: http://en.wikipedia.org/wiki/Market-
based_environmental_policy_instruments
Wise. (2013). Future of Coal electricity in India and sustainable alternatives. Pune: Word Institute
of Sustainable Energy.
World Bank Inspection Panel. (2002). India: Coal Sector Environmental and Social Mitigation
Project: Investogation Report. World Bank.
Yohe, G. (1979). The Backward Incidence of Pollution Control - Some Comparative Statics in
General Equilibrium. Environmenal Economics and Management, 6(3), 187-98.
Zamuda, & Sharpe. (2007). A Case for Enhanced Use of Clean Coal in India: An Essential
Step towards Energy Security and Environmental Protection. Presented at Workshop on
Coal Beneficiation and Utilization of Rejects. Ranchi, India.

Equitable sharing of benefits arising from coal mining and power generation among resource rich states
177
10. Annexures
Annexure A - Detailed report of the consultations at the state
level
Stakeholder consultations were conducted with various departments in Odisha and
Jharkhand in June 2013 to understand externalities arising from coal mining, the costs
incurred by state departments to address these and the demands for compensation made by
the states. Following is a summary of the discussion and main findings from the stakeholder
consultations conducted in Odisha and Jharkhand. (All figures/numbers quoted are as
provided by stakeholders).
Odisha
ToR 1:– Realistic assessment of the negative impact of coal mining on land acquisition,
land re-use, rehabilitation & resettlement, environmental and ecological degradation,
physical infrastructure in the resource rich host state.
Coal is site specific, limited to a few states and mining has to take place only in these states
while power plants can be located here or outside the state. The question usually asked is
that since there is a royalty for a national resource, what else needs to be compensated. Two
locations in Odisha contain 27% of the country’s coal – Talcher and Brahmani river region.
CIL extracts 100 million tonnes from these locations and in future with increased efficiency
there is scope of mining up to 500 million tonnes. Besides the extraction of resource, there
are numerous externalities that are created as a result of coal mining in Odisha. On
discussing specific externalities caused by coal mining, the representatives of the various
departments highlighted numerous issues which are summarized as follows –
“The effects of externalities differ from person to person and area to area.”
Fly ash and washing of coal
The Government of India has notified that that coal containing more than 34 per cent of ash
needs to be washed. The notification stipulates that unwashed coal cannot be transported
beyond 1000 km and so the burden of washing of coal and the consequent environmental
damage is for the coal bearing state to bear. The other states, on the other hand, will have
low smoke and low ash content coal to burn. The coal available in Odisha has very high ash
content (40% implying 40 tonnes out of 100 tonnes coal mined is ash) and is suitable only for
power plants. Whether the coal is transported to other states or combusted in the host state,
the host states have to deal with the problem of fly ash.
It is the responsibility of the developer to utilize the fly ash. There are varying figures made
available on the utilization of fly ash ranging from 50 per cent to 2 percent. Even for usage in
the construction industry the requirement is of dry ash and there is a requirement of trucks,
trains or pipelines to transport the ash. About 4 mine wards have been approved for storing
fly ash but increasingly environmental clearance for utilizing fly ash by storing it in mine
seams of closed mines is a problem – clearances have not been obtained due to risks of
ground water contamination. There are attempts to use fly ash to fill up mine bores by
Equitable sharing of benefits arising from coal mining and power generation among resource rich states
178
NALCO (in Bharatpur area), 1 plant of Bhushan steel and power and 2 NTPC sites in
Talcher. Only one of the NTPC sites has actually started doing it using high density slurry.
There are a few abandoned mines in Odisha and some of them are being re-filled with fly
ash.
There was a directive to assign 1.5 acres of land for dumping ash for every 1 MW produced.
This requirement has been reduced to 0.25 acres. At the moment the state produces 8000
MW per year which results in 18 million tonnes of fly ash per year which then requires
almost 10,000 acres of land only for fly ash disposal; and this production capacity is expected
to grow up to 45,000 MW and expected to produce 100 million tonnes of fly ash per year.
Since there is so much of ash content there is a need for washeries. Though the rejects left
back from the washeries contains up to 30% of coal content, there is even greater fly ash
generation on power production. Around 70 tonne of ash is generated from 100 tonne of
coal. The resource producing state is left to bear the effects of pollution either from
washeries or from producing power from the rejected coal. Coal washing also results in
depletion of ground water and pollution from ash. Unfortunately, the government so far has
not conducted any organized study regarding the impact of various air pollution caused by
coal mining, transport and washing.
“If coal is a national resource, why are these 4-5 states left to bear the burden of all the ash? Let us
distribute the pollution also equitably.”
Forests and land degradation
Coal mining has resulted in loss of forest cover for Odisha. Forests are lost in developing
hydro power as well but in those projects, the loss of forest cover is one time and then
compensatory afforestation can take place after the project is developed. In coal mining,
forests are lost during the development stage of the mine and throughout the life of the mine
the dust settlement degrades forests and other agricultural lands. There is a lot of
accumulation of dust on crops, fields, trees etc. which results in substantial loss of
agricultural production.
There is the provision of CAMPA for compensatory afforestation for coal mining but
experience shows that it is a time consuming process; the afforestation may not be done in
the same district; and CAMPA funds at times are unutilized due to the unavailability of land
to afforest. The compensation of royalty does not compensate the loss of forests from coal
extraction. Also, CAMPA has numerous other objectives to fulfil and it is not possible to
recreate the positive externalities of forests through afforestation.
“Let’s distribute the pollution also equitably”
Air pollution
Along with the problem of dust settlement on various surfaces adjoining the coal mines, the
transportation of coal in open trucks and trains spreads the problem of dust settlement to
larger area. Keonjhar district is particularly affected by this problem. Transportation of coal
has externalities that are difficult to attribute directly to it and these environmental issues in
mining are dynamic. Coal mining has also led to rise in ambient temperature of areas such
as Talcher. Noise pollution is not much of a problem in coal mining and neither are SOx and
NOx; the main problematic issue is of suspended particulate matter.
10. Annexures
179
Water pollution
Power plants use substantial quantity of water, around 36 cusecs for 1000MW. In the future
coal washeries will require even larger quantities of water. Coal mines are prohibited from
using ground water and are required to source from the nearby surface water, but mine
water is allowed to be used for sprinkling purposes to settle dust. Due to the notification
regarding transportation of washed coal, other states where Odisha’s coal is transported get
washed coal and Odisha is left with rejects and ash. Currently 6 out of 314 blocks are critical
because of saline water intrusion.
Health related impacts
Health related problems due to high suspended particulate matter in air are common
though no comprehensive studies have been conducted to assess health impacts due to air
pollution. It is extremely important to consider the cumulative health related impacts but
also very difficult to ascribe health problems to pollution from coal mines.
Displacement and associated costs of R&R
Land acquisition for coal mining results in displacement of people and there are high
associated costs of resettlement and rehabilitation. Unlike other industries, coal is site
specific and hence displacement cannot be avoided.
Usually if government land is acquired there is little displacement of people, but in the case
of land acquisition from private owners there can be a lot of difference in the return on the
land versus the compensation awarded. For instance, the POSCO land was valued at 50,000
– 2 lakhs/acre but was eventually acquired for 19 lakh/acre.
In terms of productivity, a farmer can grow approximately 15 quintal of rice/acre; if the MSP
for rice is assumed at around Rs. 1600-2000/quintal then the farmer earns 24,000-30,000 for
his produce. Rice cultivation has a lot of inputs and needs approximately 200-220 man days
of labour (RS. 22,000) and he will also spend up to 8000/- on inputs which on adding up
comes to almost the same as what he earns. So in these terms, land acquisition is good
economics for the land loser. But there are numerous issues beyond economics that creates
challenges to rehabilitate displaced people.
Past experiences of displacement have demonstrated that there is a lot of resistance from
people because displacing people from these areas debars them from pursuing their natural
livelihood options. The land itself may not have much value but sometimes it is the only
source of income and security of employment round the year. If the person displaced is
educated she/he might adjust anywhere but if the affected person/family is not educated or
does not have necessary skills than it is difficult to make a living uprooted from traditional
livelihood options. Without education there are very little opportunities for the displaced.
Displacement particularly affects women and children harder as compared to men who are
more mobile and manage to get employment elsewhere. Also, the compensation made to
the land owner is one time and the persons are not able to hold on their savings or reinvest
for future needs.
At the moment, much of mining takes place in Talcher district and out of the 25 blocks
allocated it is expected that about 1.7 lakh people will be displaced from upcoming projects.
In fact, displacement also happens in phases so at any point of time one may not get to know
Equitable sharing of benefits arising from coal mining and power generation among resource rich states
180
the total number of people that actually get displaced due to a project. Coal mining also
results in serious law and order problem. It is estimated that 12-14 hours of district DC’s
time every week goes into coal activities. A lot of time is required for talking to people and
convincing them to relocate.
Maintenance of infrastructure
Resettlement of displaced population requires a lot of land and supporting infrastructure
like roads, sanitations, water etc. which is the state’s responsibility. Maintenance of
infrastructure is another big challenge. Roads in the mining regions suffer from intense wear
and tear and require constant repair. IDCO undertakes the building of multipurpose
infrastructure in common corridors, though any infrastructure built on the allotted land is
done by the company itself.
ToR 2:– Expenditure on Administrative machinery of the host state to process the
approvals and address the negative impacts of coal mining
To assess the expenditure on the administrative machinery associated with coal mining, the
stakeholders were asked about the approvals and clearances required for coal mining, the
processes involved in these clearances, the number of personnel involved in their respective
institutions, an estimation of time consumed as a proxy of the efforts needed for these
clearances along with cost figures associated with these clearances that could provide an
estimation of the expenditures on administrative machinery.
The various departments provided details on the roles they perform in the administrative
clearances for coal mining along with an overview of the processes involved in the
clearances; though all departments were of the opinion that expenditures on the
administrative machinery for coal mining would be difficult to chalk out from their overall
administrative expenditures. Except the Steel and Mines department that has a dedicated
coal cell, personnel involved in clearances in other departments do not spend all their time
on coal mining clearances and it was difficult to estimate the time invested in coal related
clearances as a ratio of total time spent on administrative procedures. In terms of costs
directly incurred for coal related procedures again it was noted that since the departments
are funded directly from state revenues, there is no differentiation in allocated budget
towards specific sectors rather it is towards specific functions. This factor again made it
impossible to estimate the costs that the department incurs towards administrative
clearances for coal mining. However, some qualitative estimation for these costs was
discussed with stakeholders and these have been summarized below.
There are numerous approvals and clearances that are required before a coal mine project
can commence such as forest and environment clearance from respective departments;
approval of mine closure plan and approval from Directorate General of Mine Safety;
development and approval of resettlement and rehabilitation plans by the Revenue
Department with assistance from IDCO; approvals and consent from State Pollution Control
Board to establish and operate; clearances from Water resources department for water
provision and diversion of water streams. After the various clearances are obtained, mining
companies organize an application and mining lease is granted by the department of Steel
and Mines after ensuring that all other clearances have been provided and the respective
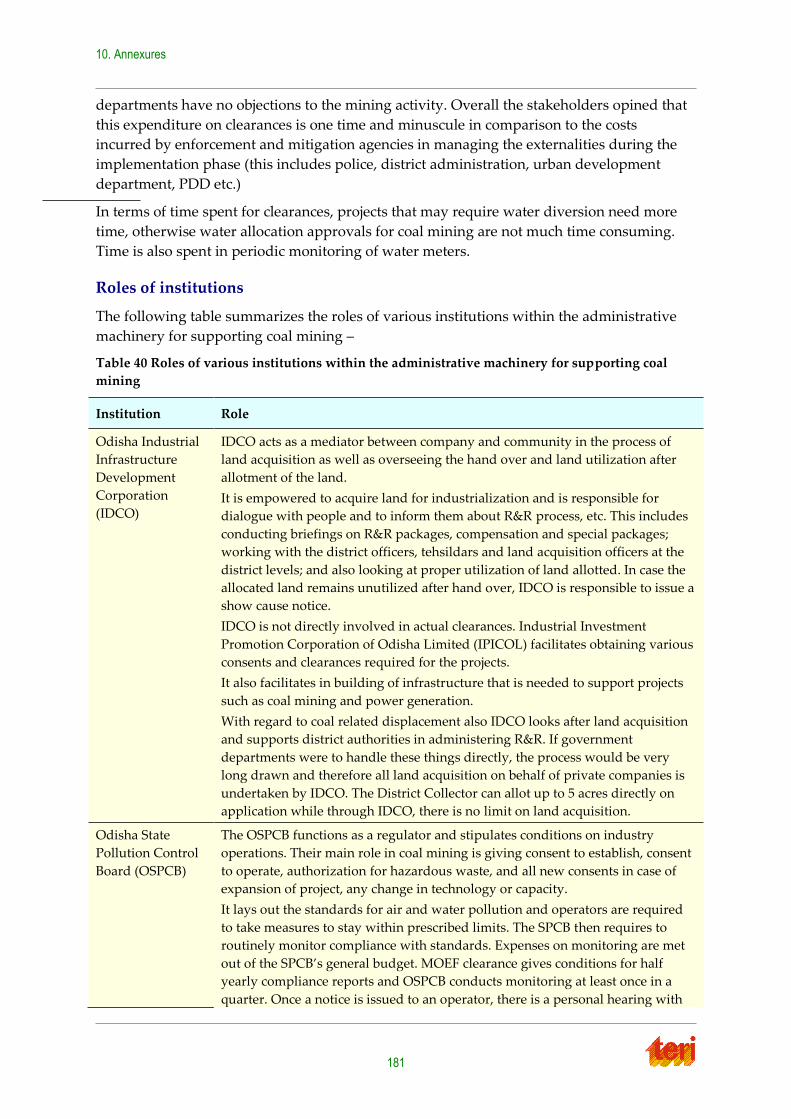
10. Annexures
181
departments have no objections to the mining activity. Overall the stakeholders opined that
this expenditure on clearances is one time and minuscule in comparison to the costs
incurred by enforcement and mitigation agencies in managing the externalities during the
implementation phase (this includes police, district administration, urban development
department, PDD etc.)
In terms of time spent for clearances, projects that may require water diversion need more
time, otherwise water allocation approvals for coal mining are not much time consuming.
Time is also spent in periodic monitoring of water meters.
Roles of institutions
The following table summarizes the roles of various institutions within the administrative
machinery for supporting coal mining –
Table 40 Roles of various institutions within the administrative machinery for supporting coal
mining
Institution Role
Odisha Industrial
Infrastructure
Development
Corporation
(IDCO)
IDCO acts as a mediator between company and community in the process of
land acquisition as well as overseeing the hand over and land utilization after
allotment of the land.
It is empowered to acquire land for industrialization and is responsible for
dialogue with people and to inform them about R&R process, etc. This includes
conducting briefings on R&R packages, compensation and special packages;
working with the district officers, tehsildars and land acquisition officers at the
district levels; and also looking at proper utilization of land allotted. In case the
allocated land remains unutilized after hand over, IDCO is responsible to issue a
show cause notice.
IDCO is not directly involved in actual clearances. Industrial Investment
Promotion Corporation of Odisha Limited (IPICOL) facilitates obtaining various
consents and clearances required for the projects.
It also facilitates in building of infrastructure that is needed to support projects
such as coal mining and power generation.
With regard to coal related displacement also IDCO looks after land acquisition
and supports district authorities in administering R&R. If government
departments were to handle these things directly, the process would be very
long drawn and therefore all land acquisition on behalf of private companies is
undertaken by IDCO. The District Collector can allot up to 5 acres directly on
application while through IDCO, there is no limit on land acquisition.
Odisha State
Pollution Control
Board (OSPCB)
The OSPCB functions as a regulator and stipulates conditions on industry
operations. Their main role in coal mining is giving consent to establish, consent
to operate, authorization for hazardous waste, and all new consents in case of
expansion of project, any change in technology or capacity.
It lays out the standards for air and water pollution and operators are required
to take measures to stay within prescribed limits. The SPCB then requires to
routinely monitor compliance with standards. Expenses on monitoring are met
out of the SPCB’s general budget. MOEF clearance gives conditions for half
yearly compliance reports and OSPCB conducts monitoring at least once in a
quarter. Once a notice is issued to an operator, there is a personal hearing with
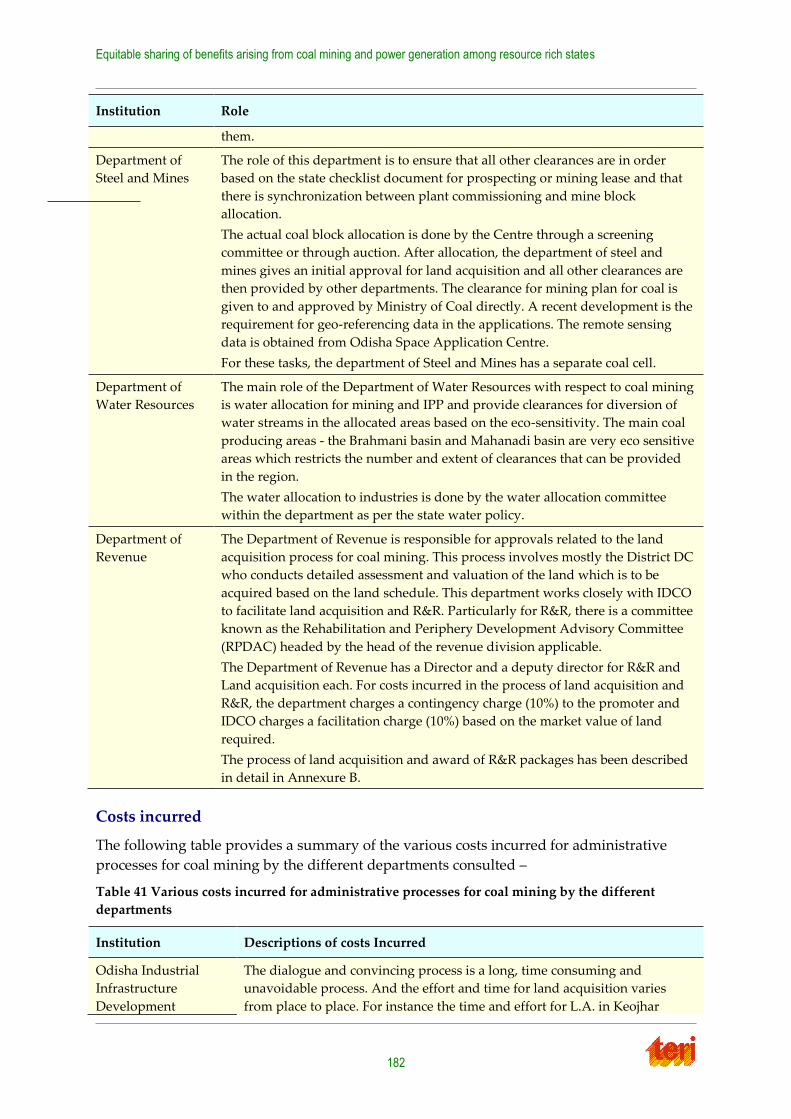
Equitable sharing of benefits arising from coal mining and power generation among resource rich states
182
Institution Role
them.
Department of
Steel and Mines
The role of this department is to ensure that all other clearances are in order
based on the state checklist document for prospecting or mining lease and that
there is synchronization between plant commissioning and mine block
allocation.
The actual coal block allocation is done by the Centre through a screening
committee or through auction. After allocation, the department of steel and
mines gives an initial approval for land acquisition and all other clearances are
then provided by other departments. The clearance for mining plan for coal is
given to and approved by Ministry of Coal directly. A recent development is the
requirement for geo-referencing data in the applications. The remote sensing
data is obtained from Odisha Space Application Centre.
For these tasks, the department of Steel and Mines has a separate coal cell.
Department of
Water Resources
The main role of the Department of Water Resources with respect to coal mining
is water allocation for mining and IPP and provide clearances for diversion of
water streams in the allocated areas based on the eco-sensitivity. The main coal
producing areas - the Brahmani basin and Mahanadi basin are very eco sensitive
areas which restricts the number and extent of clearances that can be provided
in the region.
The water allocation to industries is done by the water allocation committee
within the department as per the state water policy.
Department of
Revenue
The Department of Revenue is responsible for approvals related to the land
acquisition process for coal mining. This process involves mostly the District DC
who conducts detailed assessment and valuation of the land which is to be
acquired based on the land schedule. This department works closely with IDCO
to facilitate land acquisition and R&R. Particularly for R&R, there is a committee
known as the Rehabilitation and Periphery Development Advisory Committee
(RPDAC) headed by the head of the revenue division applicable.
The Department of Revenue has a Director and a deputy director for R&R and
Land acquisition each. For costs incurred in the process of land acquisition and
R&R, the department charges a contingency charge (10%) to the promoter and
IDCO charges a facilitation charge (10%) based on the market value of land
required.
The process of land acquisition and award of R&R packages has been described
in detail in Annexure B.
Costs incurred
The following table provides a summary of the various costs incurred for administrative
processes for coal mining by the different departments consulted –
Table 41 Various costs incurred for administrative processes for coal mining by the different
departments
Institution Descriptions of costs Incurred
Odisha Industrial
Infrastructure
Development
The dialogue and convincing process is a long, time consuming and
unavoidable process. And the effort and time for land acquisition varies
from place to place. For instance the time and effort for L.A. in Keojhar
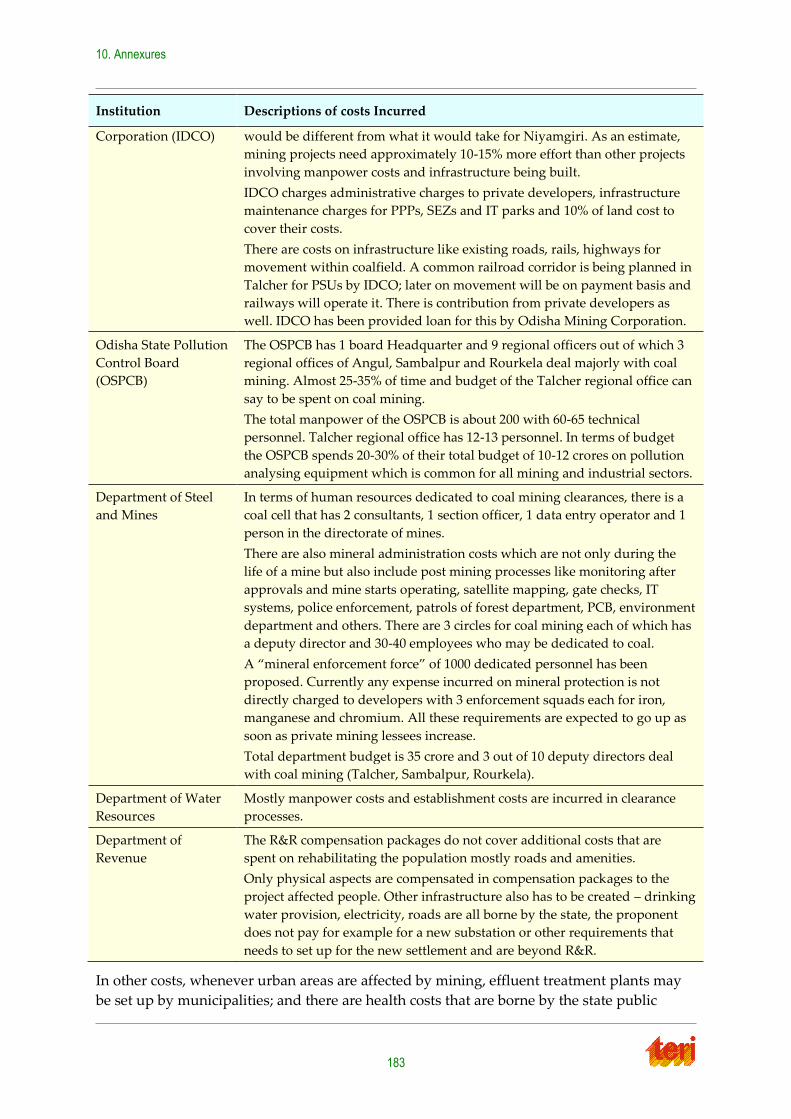
10. Annexures
183
Institution Descriptions of costs Incurred
Corporation (IDCO)
would be different from what it would take for Niyamgiri. As an estimate,
mining projects need approximately 10-15% more effort than other projects
involving manpower costs and infrastructure being built.
IDCO charges administrative charges to private developers, infrastructure
maintenance charges for PPPs, SEZs and IT parks and 10% of land cost to
cover their costs.
There are costs on infrastructure like existing roads, rails, highways for
movement within coalfield. A common railroad corridor is being planned in
Talcher for PSUs by IDCO; later on movement will be on payment basis and
railways will operate it. There is contribution from private developers as
well. IDCO has been provided loan for this by Odisha Mining Corporation.
Odisha State Pollution
Control Board
(OSPCB)
The OSPCB has 1 board Headquarter and 9 regional officers out of which 3
regional offices of Angul, Sambalpur and Rourkela deal majorly with coal
mining. Almost 25-35% of time and budget of the Talcher regional office can
say to be spent on coal mining.
The total manpower of the OSPCB is about 200 with 60-65 technical
personnel. Talcher regional office has 12-13 personnel. In terms of budget
the OSPCB spends 20-30% of their total budget of 10-12 crores on pollution
analysing equipment which is common for all mining and industrial sectors.
Department of Steel
and Mines
In terms of human resources dedicated to coal mining clearances, there is a
coal cell that has 2 consultants, 1 section officer, 1 data entry operator and 1
person in the directorate of mines.
There are also mineral administration costs which are not only during the
life of a mine but also include post mining processes like monitoring after
approvals and mine starts operating, satellite mapping, gate checks, IT
systems, police enforcement, patrols of forest department, PCB, environment
department and others. There are 3 circles for coal mining each of which has
a deputy director and 30-40 employees who may be dedicated to coal.
A ‚mineral enforcement force‛ of 1000 dedicated personnel has been
proposed. Currently any expense incurred on mineral protection is not
directly charged to developers with 3 enforcement squads each for iron,
manganese and chromium. All these requirements are expected to go up as
soon as private mining lessees increase.
Total department budget is 35 crore and 3 out of 10 deputy directors deal
with coal mining (Talcher, Sambalpur, Rourkela).
Department of Water
Resources
Mostly manpower costs and establishment costs are incurred in clearance
processes.
Department of
Revenue
The R&R compensation packages do not cover additional costs that are
spent on rehabilitating the population mostly roads and amenities.
Only physical aspects are compensated in compensation packages to the
project affected people. Other infrastructure also has to be created – drinking
water provision, electricity, roads are all borne by the state, the proponent
does not pay for example for a new substation or other requirements that
needs to set up for the new settlement and are beyond R&R.
In other costs, whenever urban areas are affected by mining, effluent treatment plants may
be set up by municipalities; and there are health costs that are borne by the state public
Equitable sharing of benefits arising from coal mining and power generation among resource rich states
184
health system. Major cost heads include transport (rail and road), pollution abatement,
health and land acquisition and R&R.
Other issues
Respondents felt that there is multiplicity of agencies which leads to lack of
coordination and there is little cohesion between central and the state government.
Especially in allocation –
o There is joint allocation of coal for state and private end users. While the coal
producing states are 3-4, there is a lack of synergy in allocation. For instance,
Odisha’s coal is transported as far away as Kerala and UP and even
Chattisgarh that is a coal producing state itself.
o There may be up to 6 private sector companies allotted in 1 block at different
stages which creates challenges in processing mining lease applications.
There are directives for the rehabilitation of mines after the resources are exploited
but the enforcement of law is weak.
The use of Information Technology has helped in facilitating processes - land records
are being digitized currently, systems are being put in place for real time monitoring
of rivers – but these are expenses incurred for the department as a whole and not
only coal related processes.
Compensation for land is a long drawn process and even circle rates change before
compensation is awarded.
ToR: 3&4 Impact of agreeing to the states proposal for either certain percentage of free
power from the coal based power plant located in host state. Impact of agreeing to the
states demand for first right of refusal for supply of certain percentage of electricity from
such plants
Odisha does not have the high grade of coal, but coal with a very high ash content and low
calorific value, making it suitable only for power plants. Hence, the state has attracted a
large number of coal based thermal plants. As of now power tariff in Odisha is very low,
because of two factors: first, good hydro capacity (the average hydropower plant tariff is 69
paisa/unit in the state), and access to cheaper coal based thermal stations, both state owned
and those owned by NTPC (the average plant tariff from coal based station is Rs 1.86
paisa/unit in the state). However the private plants now coming up in the state are asking
for much higher tariffs.
The state may require some of the power from the new stations for its own consumption
particularly at times when hydro generation is lower (due to variation in rainfall). It
however expects to sell power to other states from the new stations at a margin through
short term trading. The state hopes to get earn some revenue through this sale which it can
use for additional spending on state’s own infrastructure and social development.
From the Central government, Odisha’s demand is as follows:
1. At least 25% of power generated by coal based plants should be allocated free of cost
to the host state
10. Annexures
185
2. For Coal rejects based power plants a higher percentage of free power, i.e. 33%
power and compulsory ash utilization mechanism
3. Electricity duty to be levied at the point of generation rather than point of
consumption
4. States may be allowed to levy an environmental tax to mitigate/compensate the
environmental impacts of coal mining.
The state has already negotiated with a large number of IPPs to provide them 25% power at
regulated rates (for IPPs where MoU was signed in 2006) and 12-14% variable cost power (as
determined by OERC) where MoUs were signed in 2009 and beyond. In addition, the state
charges Rs 6 paise per unit for power exported outside the state towards an environment
management fund. Till June 2013, two IPPs have started operations and the state is
receiving power from Sterlite Energy (25% at regulated full rate determined by OERC) and
Aarti Steel (12% at variable cost determined by OERC). The state has collected about Rs 30
Crore towards the Environmental Management Fund but has yet to come up with clear
guidelines on the administration of this fund. From the new power stations, owned by
NTPC, the state is not demanding variable power but has negotiated to get 50% of power at
the regulated rate as determined by CERC. The state is also not demanding contribution
from NTPC plants towards environmental management fund.
While the state has signed MoUs for power at variable cost, it would like the central to come
out with a policy on free power. This will provide the state, necessary legal powers to
demand free power. At present, the state is apprehensive that the IPPs may not abide by
these conditions once there is plant is set up and running.
ToR – 5 & 6: Present legal and regulatory framework to impose tax or duties on mining
activities beside royalty by the Central Government for mitigation measures to address
the environmental degradation in the resource rich states.
Present legal and regulatory framework for imposition of tax or duties for the electricity
generated in host state primarily for export to consuming states
According to the policy of the State of Odisha, any power produced by an IPP and exported
to another state is subject to a levy of cess at the rate of 6 paisa per unit. The collections are
meant to be credited into an Environment Fund. A trust has been registered and
independent fund has been created to this effect.
As of now, rupees 30 crores have been collected as cess for the Environment Fund. The
money has not yet been utilized as the operation of this Fund is yet to be finalized. So far
there seems to be no clarity on how to use this money. Recently a top level meeting was held
in the State to discuss on how to utilize the cess accumulated in the Fund. Although yet to be
finalized, the Fund is most likely to be administered by the Department of Forests and
Environment.
Two areas being considered for utilizing the Fund are environmental regeneration and
livelihood regeneration. It has also been proposed that public health aspects could be
covered and a good chest disease hospital be established. Since, health issues due to
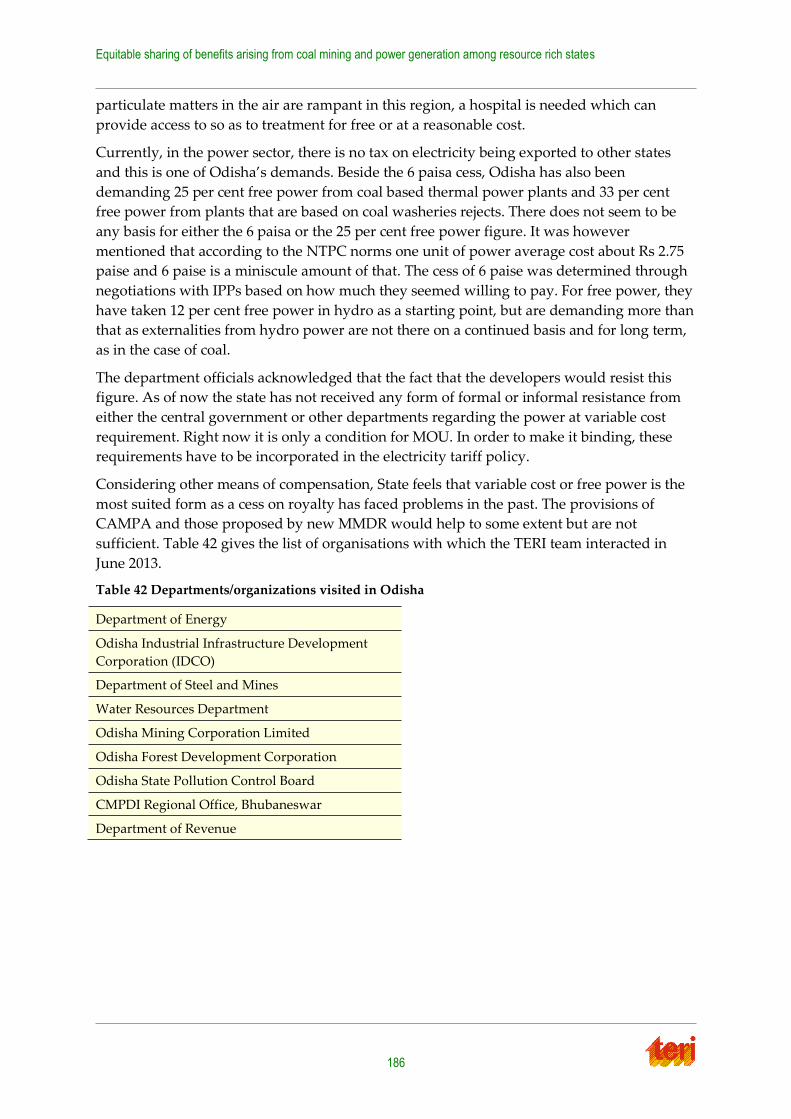
Equitable sharing of benefits arising from coal mining and power generation among resource rich states
186
particulate matters in the air are rampant in this region, a hospital is needed which can
provide access to so as to treatment for free or at a reasonable cost.
Currently, in the power sector, there is no tax on electricity being exported to other states
and this is one of Odisha’s demands. Beside the 6 paisa cess, Odisha has also been
demanding 25 per cent free power from coal based thermal power plants and 33 per cent
free power from plants that are based on coal washeries rejects. There does not seem to be
any basis for either the 6 paisa or the 25 per cent free power figure. It was however
mentioned that according to the NTPC norms one unit of power average cost about Rs 2.75
paise and 6 paise is a miniscule amount of that. The cess of 6 paise was determined through
negotiations with IPPs based on how much they seemed willing to pay. For free power, they
have taken 12 per cent free power in hydro as a starting point, but are demanding more than
that as externalities from hydro power are not there on a continued basis and for long term,
as in the case of coal.
The department officials acknowledged that the fact that the developers would resist this
figure. As of now the state has not received any form of formal or informal resistance from
either the central government or other departments regarding the power at variable cost
requirement. Right now it is only a condition for MOU. In order to make it binding, these
requirements have to be incorporated in the electricity tariff policy.
Considering other means of compensation, State feels that variable cost or free power is the
most suited form as a cess on royalty has faced problems in the past. The provisions of
CAMPA and those proposed by new MMDR would help to some extent but are not
sufficient. Table 42 gives the list of organisations with which the TERI team interacted in
June 2013.
Table 42 Departments/organizations visited in Odisha
Department of Energy
Odisha Industrial Infrastructure Development
Corporation (IDCO)
Department of Steel and Mines
Water Resources Department
Odisha Mining Corporation Limited
Odisha Forest Development Corporation
Odisha State Pollution Control Board
CMPDI Regional Office, Bhubaneswar
Department of Revenue
10. Annexures
187
Jharkhand
ToR 1:– Realistic assessment of the negative impact of coal mining on land acquisition,
land re-use, rehabilitation & resettlement, environmental and ecological degradation,
physical infrastructure in the resource rich host state.
The main coal producing districts in Jharkhand are Palam, Latehar, Ranchi, Chatra,
Hazaribagh, Ramgarh, Bokaro, Dhanbad, Giridih and some new developments are being
made in Devghar, Dumka, pakud and Godda. It is estimated that almost 90% of coal
reserves are in the divisions of Ramgarh, Bokaro, and Dhanbad. The main companies
mining coal are CCL, BCCL and ECL. Besides these, there are some private mines.
Environmental and social externalities
Like Odisha, there are numerous externalities caused by coal mining in the state of
Jharkhand. Some of these externalities were highlighted by the stakeholders consulted in the
various departments of the state. These have been summarized here –
It was noted that there are several mines in Jharkhand that are operating without
proper environmental clearances – under CCL, only 35 out of 60 mines have
environmental clearance and under ECL only 4 out of 17 mines have environmental
clearance. Beyond this, there are several mines for which EIA have not been
conducted.
The stakeholders highlighted that there has been no proper practice of disposing fly
ash. In many locations, the fly ash has been dumped indiscriminately into the
Damodar River as a result of which the river ecology has been affected.
It was pointed out that till today, no coal mine in Jharkhand has been closed which is
problematic for the state. Land needs to be reclaimed because it is a fixed asset for
the state. The entire topography of Jharkhand has changed due to mining -
agricultural production has reduced in the state in the last few years because area
under cultivation has reduced as a result of diversion.
There is very little soil management especially of the top soil and overburden
resulting in loss of the original nature of land. Dhanbad and Jharia action plans have
been devised for these districts that especially focus on land subsidence issues. These
plans are focused specifically on regions with coal mine fires that require relocation
of people into new townships.
The central government has declared complete districts under the Coal Bearing
Areas Acquisition and Development Act that includes all kinds of land. Relocation
also requires creation of a lot of infrastructure. Building of new infrastructure and
other activities are usually done on non-coal bearing lands which puts extra
demands on the state. Another challenge is the issue of non-transferable land which
cannot be traded especially in Santhal region where only residential land is
transferable.
Most coal blocks are in plateau areas and most of the hilly areas are forest land. Since
coal seams are continuous, it results in distorting drainage systems which impacts
downstream regions and barren areas also increase because of loss of the drainage
system, therefore the area that gets affected is much more than the mine area.
Equitable sharing of benefits arising from coal mining and power generation among resource rich states
188
Currently, 29.6% of area of Jharkhand is forest area, 21% is wasteland and around
30% is agricultural land.
There is water pollution from washeries when there is no proper disposal of the
rejects. The Damodar River is polluted with coal slurry resulting in a rise in the river
bed due to deposits. This has resulted in reduction of water retention in the river.
Forest loss has also resulted in a reduction in the water table. Once water streams are
disturbed, the natural catchment loses its properties and downstream villages and
areas get affected most due to a decrease in the total run off of water.
Mine water is not usable in any sector though it is diverted to sectors like agriculture.
It can only be used to suppress dust. Groundwater is a problem in the state and there
are 12 critical blocks currently.
Some coal producing districts have visible health impacts as well. In Dhanbad
district, people eat jaggery every evening to clear congestion. A lot of health impacts
are difficult to assess because people make out of pocket expenses. At the same time,
health infrastructure is a major issue in coal mining regions.
There are numerous issues arising from displacement of people. Displaced people
lose their identity which is connected to their land. While for the displaced, this can
be emotionally challenging, the state departments have to deal with challenges in
providing them with certificates of income, domiciles, proof of address, APL, BPL
cards, insurance schemes.
The Jharkhand R&R policy was introduced in 2008 and before that the CIL R&R
policy was applicable. Every revenue village has a unique identification and a
definite boundary; to resettle somewhere else or create a new locality is difficult. The
R&R policy in its present form, deals with involuntary land acquisition. It should be
applicable to voluntary acquisition as well.
Other than these stakeholder views, there were several other contradicting views regarding
creation of externalities when stakeholders stated that ‘coal mining is not damaging the
environment and is in fact creating environmental resources.’ Land degradation is the prima
facie problem because forests are lost and there is a lot of dust created. The dust hazard can
be minimized by limiting the movement of trucks. The Office of Coal Controller (CCO)
maintains a mine closure fund where the mining companies deposit money for the closure
of the mine. CIL has taken some measures to reduce the impacts of externalities such as
planting of 78 million trees which is more than the stipulated requirement which has
resulted in an increase in forest cover in the last 2 years. Excess mine water meets 70% of
water demand in CIL and its subordinates. The sulphur content in all Indian coal mines
(except 1 or 2) is very minimal and hence the problems of acid mine water is reduced. Mine
water is used for irrigation and let out in water ways. Coal washeries should be closed
circuit processes but that has not been the case of washeries in the country so far. All
demands under the R&& packages developed by the states are met by the PSUs and CIL has
also developed infrastructure in the land allotted to them. A significant amount of money is
provided by mining companies for mining closure and there is no dearth of funds to restore
ecological systems. There is a thumb rule for mine closure costs which are 6 lakhs per
hectare for opencast mines and 1 lakh per hectare for underground mines.
10. Annexures
189
ToR 2:- Expenditure on Administrative machinery of the host state to process the
approvals and address the negative impacts of coal mining as stated in point (1).
The roles of and process followed by the various departments with regard to coal mining are
similar to those outlined for Odisha. While there are several departments involved in aspects
of coal mining, including the Pollution Control Board, Mining Department, Forest
Department, Department of Revenue and Department of Water Resources, following is the
description of responsibilities of select institutions with which the team was able to interact
on their role in the mining lifecycle.
Table 43 Description of responsibilities of select institutions
Institution Role and costs incurred
Department of Water
Resources
The water resources department has a facilitation role under 2 heads –
a. If there are any natural resources (water) in the coal block that get
disturbed due to the mining activity, the proponent gives a proposal for
diversion of waterway and on certain conditions defined by the MOEF
the department gives clearance for water diversion.
b. Provision of water for mining in the preliminary stage or for drinking
purpose. After the mining starts, the operators get ground water from the
mines so demand for water reduces. This ground water cannot be used
for industrial purposes. The Central Ground Water Board gives a permit
or NOC for the usage of this water.
The water department does not levy any charges from the proponent for the
approval or clearance process. It only charges a water tariff based on usage
that goes to state revenues. In terms of costs borne by the department, the
only costs are establishment costs and manpower costs. Establishment costs
are huge for the water department because the secondary data generated by
the department takes up a lot of resources and this has to be done annually
funded from plan budget and sometimes from non-plan budget.
Department of
Revenue
The role of the department includes land identification, verification and
making of compensation award. The award for land includes value of land +
30% soletium + 12% per annum simple interest for 2-3 years + valuation of
other immovable property such as constructed structures, tress etc. The land
can also be acquired on mutually agreeable terms and the rates for that
cannot be less than the circle rates. In terms of the registration rate, the price
determined by the state government is around 20,000/- per acre but actual
compensation can be as high as 4-5 lakh/acre.
The time period set aside for land acquisition is 290 days but the process
generally does not get completed in that time. The most time consuming
activity is verification of ownership of land. Land tracts have been divided
into many pieces since the 1931-32 records. It takes a minimum of 600-700
days to clear 1 coal mine acquisition because the areas that need to be
acquired are large.
The department charges 5% of total land acquisition cost as admin expenses.
Jharkhand also had an industrial development corporation entity called
JIDCO (similar to IDCO of Odisha) but it was not successful.
Equitable sharing of benefits arising from coal mining and power generation among resource rich states
190
ToR 3 & 4:- Impact of agreeing to the states proposal for either certain percentage of free
power from the coal based power plant located in host state similar to the benefits given
for hydro power plant or supply of certain percentage of electricity at variable cost.
Impact of agreeing to the states demand for first right of refusal for supply of certain
percentage of electricity from such plants
While the state provides coal and other resources for power production and houses many
power plants, the state still buys power at very expensive rates. This is also partly because
the state has not gone in for purchase of power through competitive rates.
Jharkhand has signed a series of MoUs with private players in which it has demanded 12 %
power at variable cost and a right of refusal for another 13% power at full price as
determined by JSERC. So far, one plant of Abhijeet Group has come up but the JSERC is yet
to determine its tariff. As of now it has provisionally allowed the tariff proposed by the
Group – Rs 1.95 as variable charge and Rs 5.01 as total charge. The state has also included
a clause providing 6 paise per unit on power sent out of the station towards an Environment
Management Fund. It has however not enforced this condition on the developers.
The State of Jharkhand wants to be compensated not only for power produced in their state
but also for the coal that is transported outside the state. Coal being transported to other
states, and the associated washing, leads to severe environmental stress in the host state.
Therefore, states want to levy a charge on coal being transported to other states. The
department argued that in case of petroleum, Gujarat and Rajasthan claim a lot of revenue
from resource extracted. The same is not the case of coal. If the calorific value of each source
was to be compared, the compensation in case of coal is not adequate In addition to variable
cost; the State also wants to consider a levy on power generation.
ToR 5 & 6:- Present legal and regulatory framework to impose tax or duties on mining
activities beside royalty by the Central Government for mitigation measures to address
the environmental degradation in the resource rich states.
The state does not have any legal provision (policy or notification/government order)
allowing for concessionary power from the IPPs. The state has built this provision only in
the MoUs with the IPPs. The state is of the view that at the MoU stage, IPPs may agree to the
state’s demand for free power as during the preparatory stage, IPPs require government
support. The IPPs may however at a later date, not abide with the MoU. The state therefore
wants the Centre to incorporate the provision of free power the National Electricity
Policy/National Tariff Policy.
The State wants to use the free power or variable cost power in a way it deems fit. It wants
to be left with the option to decide whether this power is to be used for State’s own
consumption or as additional revenue. The Department of Energy does not seem agreeable
that this source of revenue goes to another department which actually handles the
externality (forest department for instance).
The State of Jharkhand showed discontent over the way Coal Bearing Areas (Acquisition
and Development) Act is being administered. The State felt that they are not getting
adequately compensated as the Centre is declaring entire district as coal bearing land for
acquisition.
10. Annexures
191
The State tried to charge royalty on washed coal but it was challenged and was struck down
by the High Court. Table 44 gives the list of organisations with which the TERI team
interacted in June 2013.
Table 44 Departments/organizations visited in Jharkhand
Department of Energy
Jharkhand State Pollution Control Board
Water Resources Department
Department of Mines
Department of Revenue
Department of Forests
CMPDI
Equitable sharing of benefits arising from coal mining and power generation among resource rich states
192
Annexure B – Assessment of environmental administrative
costs
In order to overcome the challenge of attributing costs for coal mining particularly, some
estimations of costs incurred towards coal related environmental clearances have been made
on the basis of revenue expenditures of the states being studied. The administrative services
expenditure incurred towards the environment was calculated (by taking the ratio of
revenue expenditures under the heads of ‘Forestry& Wildlife’ and ‘Science, Technology &
Environment’ to the total Revenue Expenditure for that year; and multiplying that ratio with
the total revenue expenditure on Administrative Services) and from this expenditure it was
assumed that some amount can be attributed to coal related environmental clearances. The
ratio of number of environmental clearances for coal to total environmental clearances given
in a state in a year was taken as a proxy to estimate the extent of expenses that could be
attributed to coal (the MOEF environmental clearances portal was used for this data) and
multiplied with the administrative services expenditure incurred towards the environment.
Based on these administrative services expenditure incurred towards coal related
environmental clearances, a per tonne cost of administrative expenses for coal mining was
calculated (by dividing with the total production of coal in the state for the year). Table 45 to
Table 48 below).
This methodology has some shortcomings. Firstly, the assumption that all expenditure
towards the environment is covered under the two heads taken from the Revenue
Expenditure statements of the state may or not may be applicable to all states. These
expenditures are aggregated on the basis of departmental statements and the scope of these
departments may differ in states. In fact it is possible that some quintessential environment
related expenditure is not accounted for in these heads. A similar drawback exists in taking
the ratio of these expenditures to total revenue expenditure as representative of all
environment related costs. Secondly, the assumption that the ratio of revenue expenditure
on environment can be used to ascertain the administrative services expenditure on
environment may not hold in all the states. This has an underlying supposition that all
departments and public policy activities incur administrative expenditure proportional to
their scope of work which may not be the case in reality. Thirdly and lastly, while taking the
proxy for attributing expenditure to coal related environmental clearances, ratio of number
of environmental clearances for coal to total environmental clearances given in a state in a
year only takes into account the clearances that have been given in a year and not those that
are under processing. Administrative costs for coal clearances could be incurred on a
continuous basis, and it would be more effective to take the number of applications for coal
related environmental clearances as a ratio of total applications for environmental
clearances, though the data were not available to take this approach.
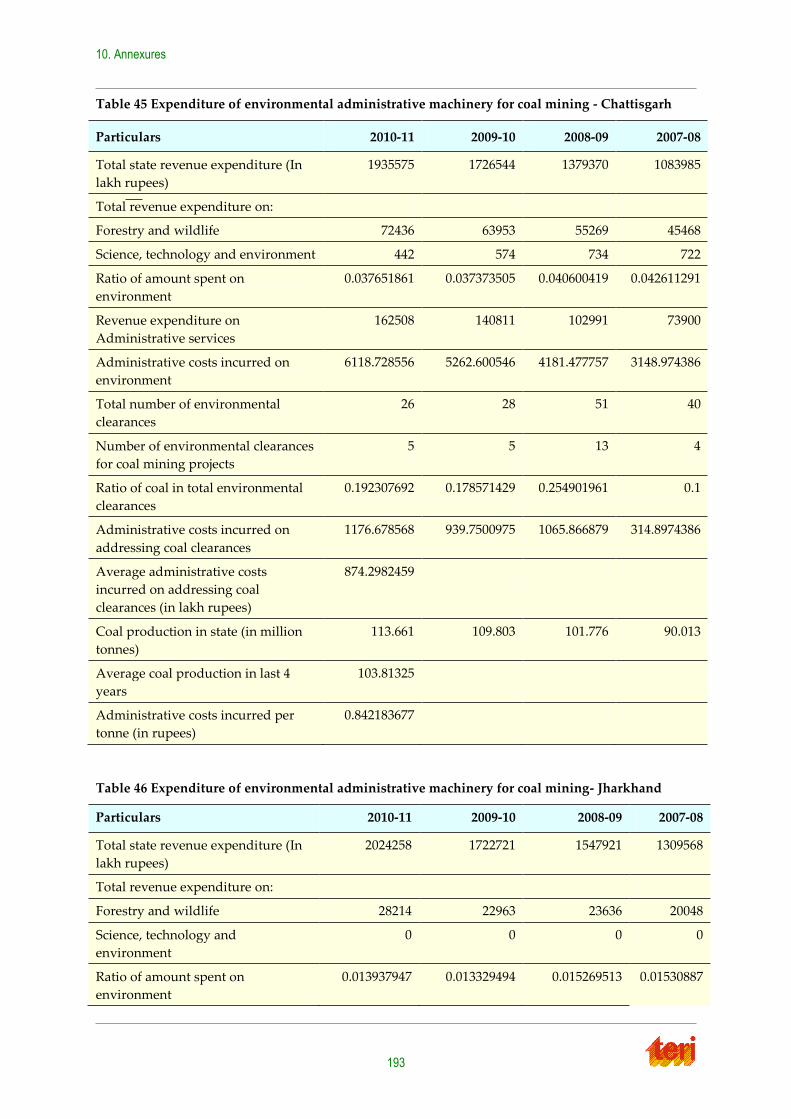
10. Annexures
193
Table 45 Expenditure of environmental administrative machinery for coal mining - Chattisgarh
Particulars 2010-11 2009-10 2008-09 2007-08
Total state revenue expenditure (In
lakh rupees)
1935575 1726544 1379370 1083985
Total revenue expenditure on:
Forestry and wildlife 72436 63953 55269 45468
Science, technology and environment 442 574 734 722
Ratio of amount spent on
environment
0.037651861 0.037373505 0.040600419 0.042611291
Revenue expenditure on
Administrative services
162508 140811 102991 73900
Administrative costs incurred on
environment
6118.728556 5262.600546 4181.477757 3148.974386
Total number of environmental
clearances
26 28 51 40
Number of environmental clearances
for coal mining projects
5 5 13 4
Ratio of coal in total environmental
clearances
0.192307692 0.178571429 0.254901961 0.1
Administrative costs incurred on
addressing coal clearances
1176.678568 939.7500975 1065.866879 314.8974386
Average administrative costs
incurred on addressing coal
clearances (in lakh rupees)
874.2982459
Coal production in state (in million
tonnes)
113.661 109.803 101.776 90.013
Average coal production in last 4
years
103.81325
Administrative costs incurred per
tonne (in rupees)
0.842183677
Table 46 Expenditure of environmental administrative machinery for coal mining- Jharkhand
Particulars 2010-11 2009-10 2008-09 2007-08
Total state revenue expenditure (In
lakh rupees)
2024258 1722721 1547921 1309568
Total revenue expenditure on:
Forestry and wildlife 28214 22963 23636 20048
Science, technology and
environment
0 0 0 0
Ratio of amount spent on
environment
0.013937947 0.013329494 0.015269513 0.01530887
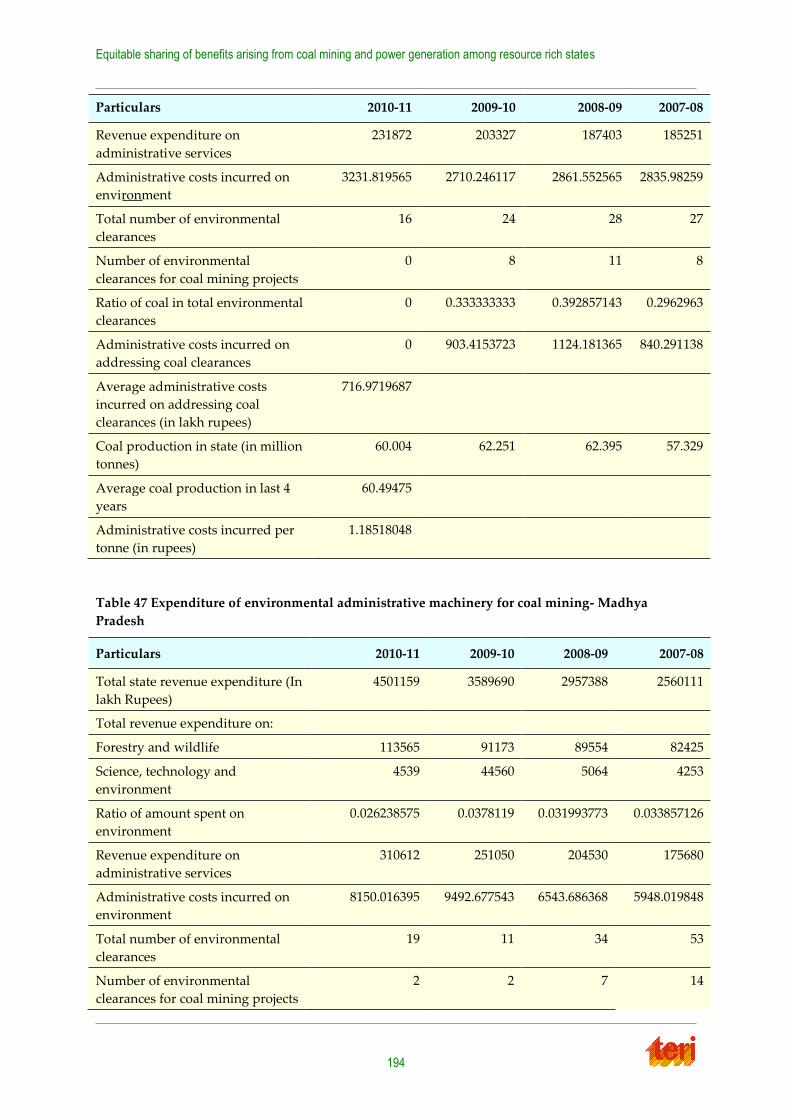
Equitable sharing of benefits arising from coal mining and power generation among resource rich states
194
Particulars 2010-11 2009-10 2008-09 2007-08
Revenue expenditure on
administrative services
231872 203327 187403 185251
Administrative costs incurred on
environment
3231.819565 2710.246117 2861.552565 2835.98259
Total number of environmental
clearances
16 24 28 27
Number of environmental
clearances for coal mining projects
0 8 11 8
Ratio of coal in total environmental
clearances
0 0.333333333 0.392857143 0.2962963
Administrative costs incurred on
addressing coal clearances
0 903.4153723 1124.181365 840.291138
Average administrative costs
incurred on addressing coal
clearances (in lakh rupees)
716.9719687
Coal production in state (in million
tonnes)
60.004 62.251 62.395 57.329
Average coal production in last 4
years
60.49475
Administrative costs incurred per
tonne (in rupees)
1.18518048
Table 47 Expenditure of environmental administrative machinery for coal mining- Madhya
Pradesh
Particulars 2010-11 2009-10 2008-09 2007-08
Total state revenue expenditure (In
lakh Rupees)
4501159 3589690 2957388 2560111
Total revenue expenditure on:
Forestry and wildlife 113565 91173 89554 82425
Science, technology and
environment
4539 44560 5064 4253
Ratio of amount spent on
environment
0.026238575 0.0378119 0.031993773 0.033857126
Revenue expenditure on
administrative services
310612 251050 204530 175680
Administrative costs incurred on
environment
8150.016395 9492.677543 6543.686368 5948.019848
Total number of environmental
clearances
19 11 34 53
Number of environmental
clearances for coal mining projects
2 2 7 14

10. Annexures
195
Particulars 2010-11 2009-10 2008-09 2007-08
Ratio of coal in total environmental
clearances
0.105263158 0.181818182 0.205882353 0.264150943
Administrative costs incurred on
addressing coal clearances
857.8964627 1725.941371 1347.229546 1571.175054
Average administrative costs
incurred on addressing coal
clearances (in lakh rupees)
1375.560609
Coal production in state (in million
tonnes)
70.701 73.529 70.595 67.165
Average coal production in last 4
years
70.4975
Administrative costs incurred per
tonne (in rupees)
1.951218992
Table 48 Expenditure of environmental administrative machinery for coal mining- Odisha
Particulars 2010-11 2009-10 2008-09 2007-08
Total State revenue expenditure (In lakh
rupees)
2936794 2529159 2119012 1772327
Total revenue expenditure on:
Forestry and wildlife 34572 30770 29253 21484
Science, technology and environment 3168 2994 3272 1844
Ratio of amount spent on environment 0.012850748 0.013349892 0.015349134 0.013162357
Revenue expenditure on administrative
services
211812 180079 147588 111212
Administrative costs incurred on
environment
2721.942663 2404.035237 2265.348049 1463.812003
Total number of environmental
clearances
21 37 57 68
Number of environmental clearances for
coal mining projects
2 0 2 3
Ratio of coal in total environmental
clearances
0.095238095 0 0.035087719 0.044117647
Administrative costs incurred on
addressing coal clearances
259.2326345 0 79.48589646 64.57994131
Average administrative costs incurred
on addressing coal clearances (in lakhs)
100.8246181
Coal production in state (in million
tonnes)
102.565 106.409 98.402 89.482
Average coal production in last 4 years 99.2145
Administrative costs incurred per tonne
(in rupees)
0.101622866
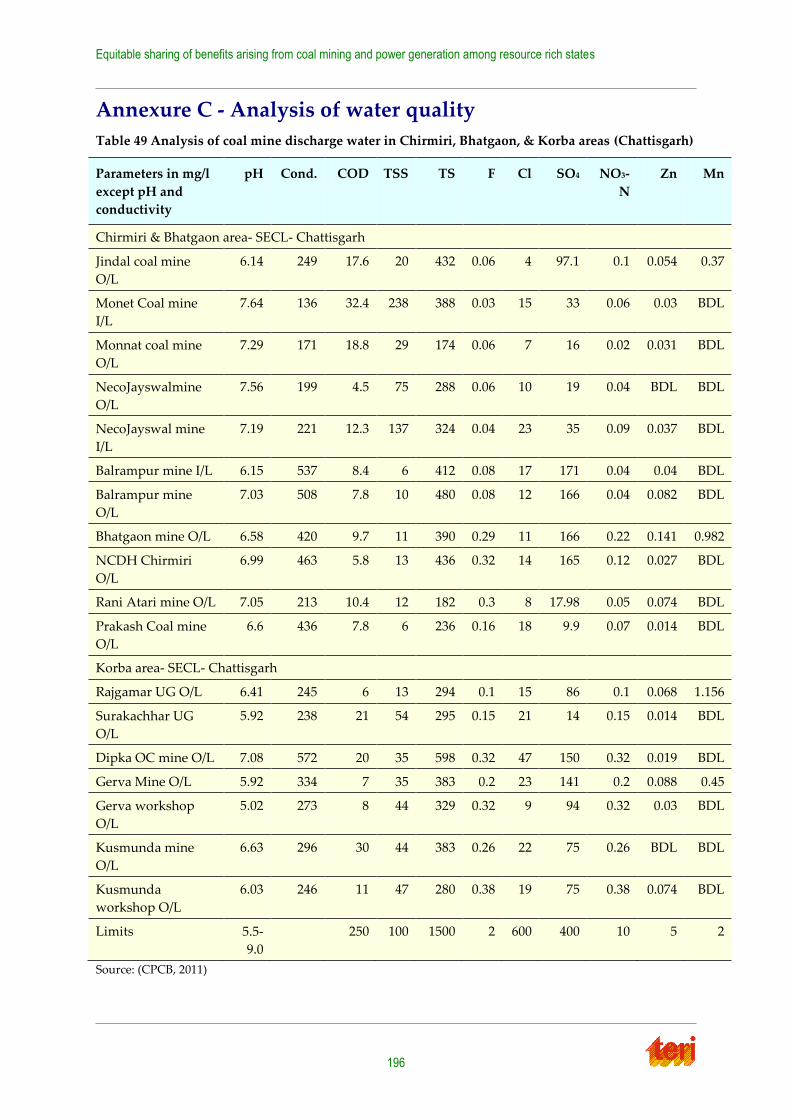
Equitable sharing of benefits arising from coal mining and power generation among resource rich states
196
Annexure C - Analysis of water quality
Table 49 Analysis of coal mine discharge water in Chirmiri, Bhatgaon, & Korba areas (Chattisgarh)
Parameters in mg/l
except pH and
conductivity
pH Cond. COD TSS TS F Cl SO4 NO3-
N
Zn Mn
Chirmiri & Bhatgaon area- SECL- Chattisgarh
Jindal coal mine
O/L
6.14 249 17.6 20 432 0.06 4 97.1 0.1 0.054 0.37
Monet Coal mine
I/L
7.64 136 32.4 238 388 0.03 15 33 0.06 0.03 BDL
Monnat coal mine
O/L
7.29 171 18.8 29 174 0.06 7 16 0.02 0.031 BDL
NecoJayswalmine
O/L
7.56 199 4.5 75 288 0.06 10 19 0.04 BDL BDL
NecoJayswal mine
I/L
7.19 221 12.3 137 324 0.04 23 35 0.09 0.037 BDL
Balrampur mine I/L 6.15 537 8.4 6 412 0.08 17 171 0.04 0.04 BDL
Balrampur mine
O/L
7.03 508 7.8 10 480 0.08 12 166 0.04 0.082 BDL
Bhatgaon mine O/L 6.58 420 9.7 11 390 0.29 11 166 0.22 0.141 0.982
NCDH Chirmiri
O/L
6.99 463 5.8 13 436 0.32 14 165 0.12 0.027 BDL
Rani Atari mine O/L 7.05 213 10.4 12 182 0.3 8 17.98 0.05 0.074 BDL
Prakash Coal mine
O/L
6.6 436 7.8 6 236 0.16 18 9.9 0.07 0.014 BDL
Korba area- SECL- Chattisgarh
Rajgamar UG O/L 6.41 245 6 13 294 0.1 15 86 0.1 0.068 1.156
Surakachhar UG
O/L
5.92 238 21 54 295 0.15 21 14 0.15 0.014 BDL
Dipka OC mine O/L 7.08 572 20 35 598 0.32 47 150 0.32 0.019 BDL
Gerva Mine O/L 5.92 334 7 35 383 0.2 23 141 0.2 0.088 0.45
Gerva workshop
O/L
5.02 273 8 44 329 0.32 9 94 0.32 0.03 BDL
Kusmunda mine
O/L
6.63 296 30 44 383 0.26 22 75 0.26 BDL BDL
Kusmunda
workshop O/L
6.03 246 11 47 280 0.38 19 75 0.38 0.074 BDL
Limits 5.5-
9.0
250 100 1500 2 600 400 10 5 2
Source: (CPCB, 2011)
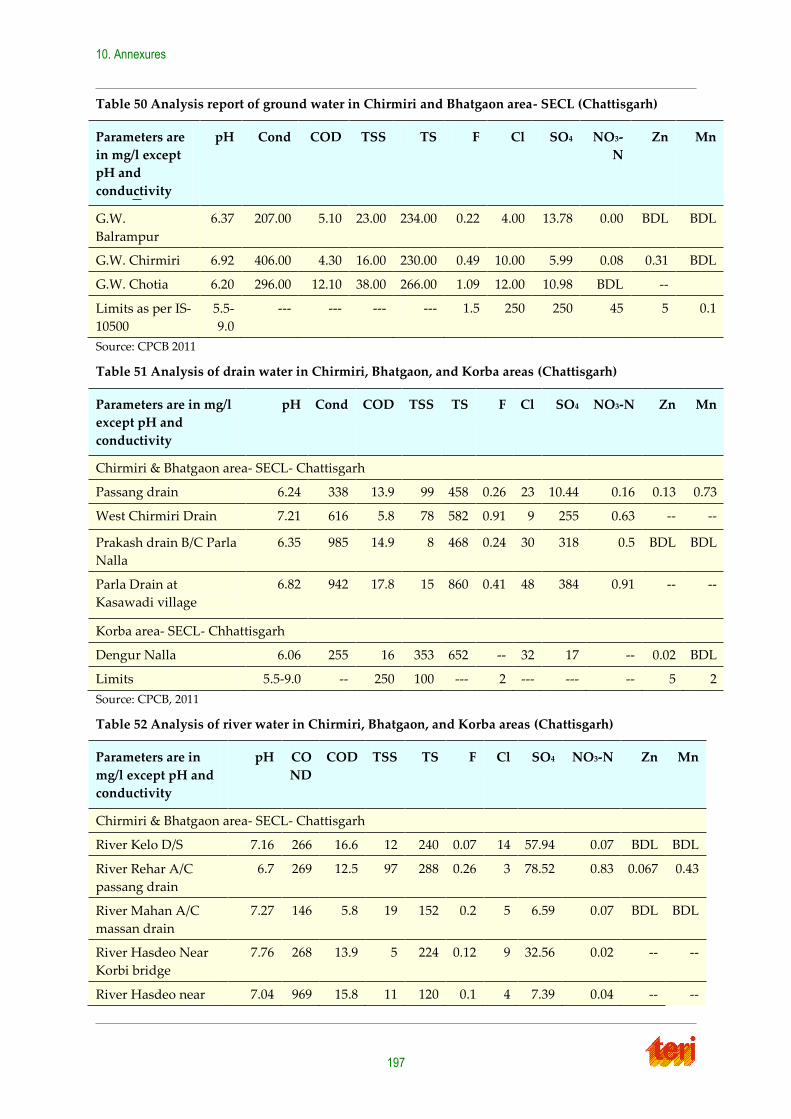
10. Annexures
197
Table 50 Analysis report of ground water in Chirmiri and Bhatgaon area- SECL (Chattisgarh)
Parameters are
in mg/l except
pH and
conductivity
pH Cond COD TSS TS F Cl SO4 NO3-
N
Zn Mn
G.W.
Balrampur
6.37 207.00 5.10 23.00 234.00 0.22 4.00 13.78 0.00 BDL BDL
G.W. Chirmiri 6.92 406.00 4.30 16.00 230.00 0.49 10.00 5.99 0.08 0.31 BDL
G.W. Chotia 6.20 296.00 12.10 38.00 266.00 1.09 12.00 10.98 BDL --
Limits as per IS-
10500
5.5-
9.0
--- --- --- --- 1.5 250 250 45 5 0.1
Source: CPCB 2011
Table 51 Analysis of drain water in Chirmiri, Bhatgaon, and Korba areas (Chattisgarh)
Parameters are in mg/l
except pH and
conductivity
pH Cond COD TSS TS F Cl SO4 NO3-N Zn Mn
Chirmiri & Bhatgaon area- SECL- Chattisgarh
Passang drain 6.24 338 13.9 99 458 0.26 23 10.44 0.16 0.13 0.73
West Chirmiri Drain 7.21 616 5.8 78 582 0.91 9 255 0.63 -- --
Prakash drain B/C Parla
Nalla
6.35 985 14.9 8 468 0.24 30 318 0.5 BDL BDL
Parla Drain at
Kasawadi village
6.82 942 17.8 15 860 0.41 48 384 0.91 -- --
Korba area- SECL- Chhattisgarh
Dengur Nalla 6.06 255 16 353 652 -- 32 17 -- 0.02 BDL
Limits 5.5-9.0 -- 250 100 --- 2 --- --- -- 5 2
Source: CPCB, 2011
Table 52 Analysis of river water in Chirmiri, Bhatgaon, and Korba areas (Chattisgarh)
Parameters are in
mg/l except pH and
conductivity
pH CO
ND
COD TSS TS F Cl SO4 NO3-N Zn Mn
Chirmiri & Bhatgaon area- SECL- Chattisgarh
River Kelo D/S 7.16 266 16.6 12 240 0.07 14 57.94 0.07 BDL BDL
River Rehar A/C
passang drain
6.7 269 12.5 97 288 0.26 3 78.52 0.83 0.067 0.43
River Mahan A/C
massan drain
7.27 146 5.8 19 152 0.2 5 6.59 0.07 BDL BDL
River Hasdeo Near
Korbi bridge
7.76 268 13.9 5 224 0.12 9 32.56 0.02 -- --
River Hasdeo near 7.04 969 15.8 11 120 0.1 4 7.39 0.04 -- --
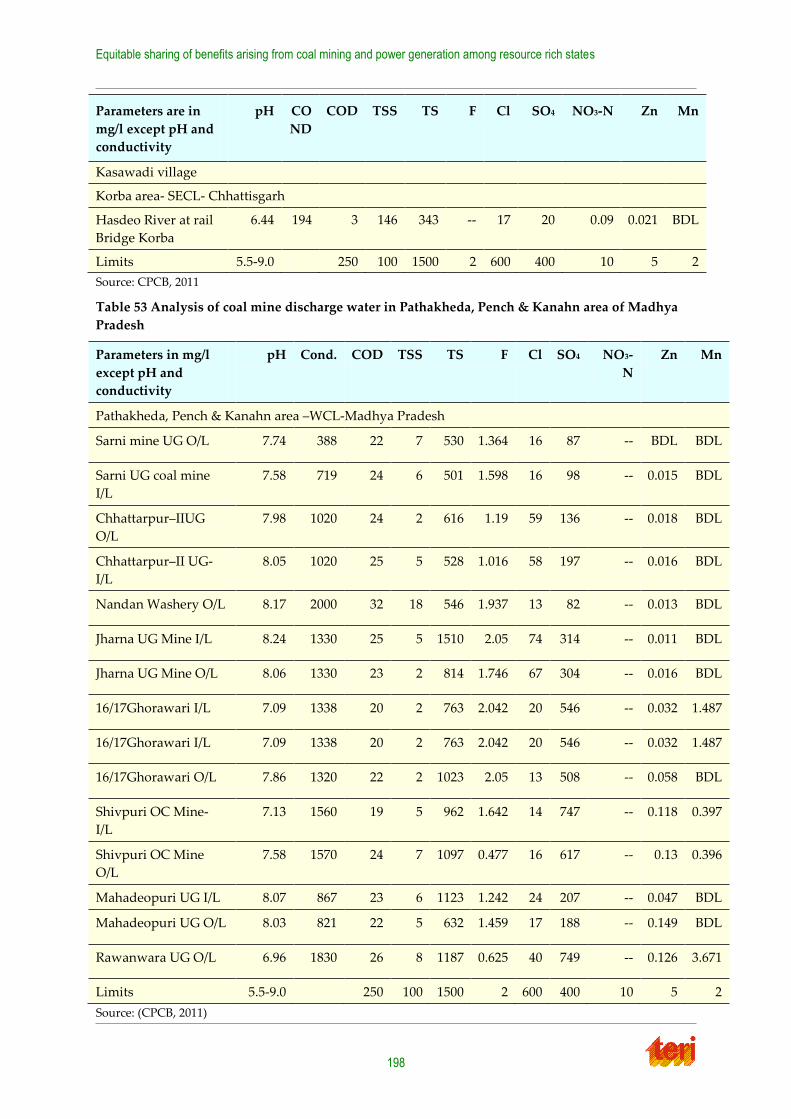
Equitable sharing of benefits arising from coal mining and power generation among resource rich states
198
Parameters are in
mg/l except pH and
conductivity
pH CO
ND
COD TSS TS F Cl SO4 NO3-N Zn Mn
Kasawadi village
Korba area- SECL- Chhattisgarh
Hasdeo River at rail
Bridge Korba
6.44 194 3 146 343 -- 17 20 0.09 0.021 BDL
Limits 5.5-9.0 250 100 1500 2 600 400 10 5 2
Source: CPCB, 2011
Table 53 Analysis of coal mine discharge water in Pathakheda, Pench & Kanahn area of Madhya
Pradesh
Parameters in mg/l
except pH and
conductivity
pH Cond. COD TSS TS F Cl SO4 NO3-
N
Zn Mn
Pathakheda, Pench & Kanahn area –WCL-Madhya Pradesh
Sarni mine UG O/L 7.74 388 22 7 530 1.364 16 87 -- BDL BDL
Sarni UG coal mine
I/L
7.58 719 24 6 501 1.598 16 98 -- 0.015 BDL
Chhattarpur–IIUG
O/L
7.98 1020 24 2 616 1.19 59 136 -- 0.018 BDL
Chhattarpur–II UG-
I/L
8.05 1020 25 5 528 1.016 58 197 -- 0.016 BDL
Nandan Washery O/L 8.17 2000 32 18 546 1.937 13 82 -- 0.013 BDL
Jharna UG Mine I/L 8.24 1330 25 5 1510 2.05 74 314 -- 0.011 BDL
Jharna UG Mine O/L 8.06 1330 23 2 814 1.746 67 304 -- 0.016 BDL
16/17Ghorawari I/L 7.09 1338 20 2 763 2.042 20 546 -- 0.032 1.487
16/17Ghorawari I/L 7.09 1338 20 2 763 2.042 20 546 -- 0.032 1.487
16/17Ghorawari O/L 7.86 1320 22 2 1023 2.05 13 508 -- 0.058 BDL
Shivpuri OC Mine-
I/L
7.13 1560 19 5 962 1.642 14 747 -- 0.118 0.397
Shivpuri OC Mine
O/L
7.58 1570 24 7 1097 0.477 16 617 -- 0.13 0.396
Mahadeopuri UG I/L 8.07 867 23 6 1123 1.242 24 207 -- 0.047 BDL
Mahadeopuri UG O/L 8.03 821 22 5 632 1.459 17 188 -- 0.149 BDL
Rawanwara UG O/L 6.96 1830 26 8 1187 0.625 40 749 -- 0.126 3.671
Limits 5.5-9.0 250 100 1500 2 600 400 10 5 2
Source: (CPCB, 2011)
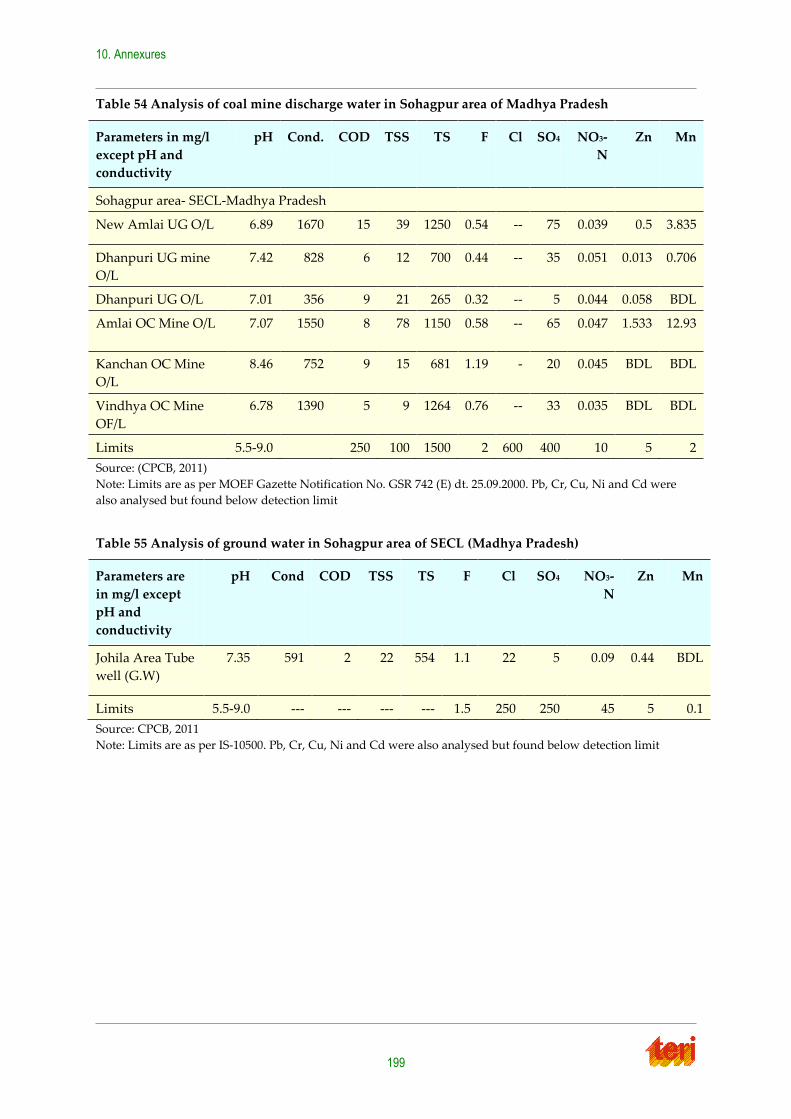
10. Annexures
199
Table 54 Analysis of coal mine discharge water in Sohagpur area of Madhya Pradesh
Parameters in mg/l
except pH and
conductivity
pH Cond. COD TSS TS F Cl SO4 NO3-
N
Zn Mn
Sohagpur area- SECL-Madhya Pradesh
New Amlai UG O/L 6.89 1670 15 39 1250 0.54 -- 75 0.039 0.5 3.835
Dhanpuri UG mine
O/L
7.42 828 6 12 700 0.44 -- 35 0.051 0.013 0.706
Dhanpuri UG O/L 7.01 356 9 21 265 0.32 -- 5 0.044 0.058 BDL
Amlai OC Mine O/L 7.07 1550 8 78 1150 0.58 -- 65 0.047 1.533 12.93
Kanchan OC Mine
O/L
8.46 752 9 15 681 1.19 - 20 0.045 BDL BDL
Vindhya OC Mine
OF/L
6.78 1390 5 9 1264 0.76 -- 33 0.035 BDL BDL
Limits 5.5-9.0 250 100 1500 2 600 400 10 5 2
Source: (CPCB, 2011)
Note: Limits are as per MOEF Gazette Notification No. GSR 742 (E) dt. 25.09.2000. Pb, Cr, Cu, Ni and Cd were
also analysed but found below detection limit
Table 55 Analysis of ground water in Sohagpur area of SECL (Madhya Pradesh)
Parameters are
in mg/l except
pH and
conductivity
pH Cond COD TSS TS F Cl SO4 NO3-
N
Zn Mn
Johila Area Tube
well (G.W)
7.35 591 2 22 554 1.1 22 5 0.09 0.44 BDL
Limits 5.5-9.0 --- --- --- --- 1.5 250 250 45 5 0.1
Source: CPCB, 2011
Note: Limits are as per IS-10500. Pb, Cr, Cu, Ni and Cd were also analysed but found below detection limit
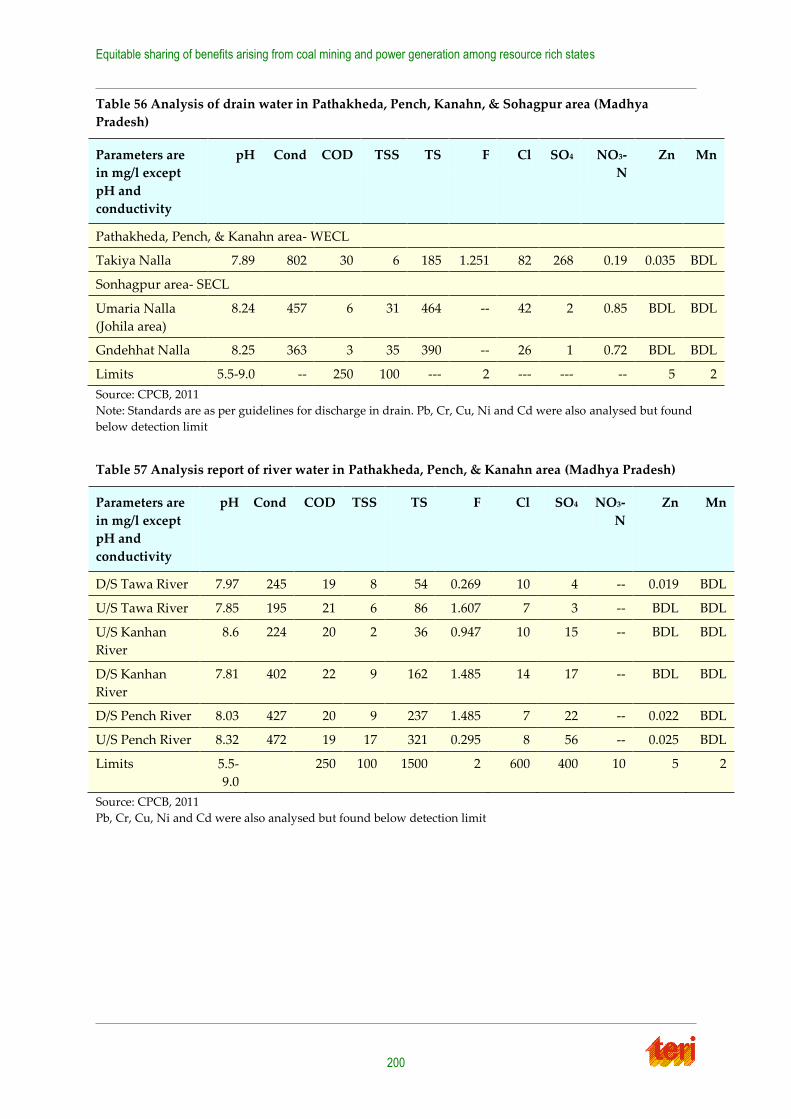
Equitable sharing of benefits arising from coal mining and power generation among resource rich states
200
Table 56 Analysis of drain water in Pathakheda, Pench, Kanahn, & Sohagpur area (Madhya
Pradesh)
Parameters are
in mg/l except
pH and
conductivity
pH Cond COD TSS TS F Cl SO4 NO3-
N
Zn Mn
Pathakheda, Pench, & Kanahn area- WECL
Takiya Nalla 7.89 802 30 6 185 1.251 82 268 0.19 0.035 BDL
Sonhagpur area- SECL
Umaria Nalla
(Johila area)
8.24 457 6 31 464 -- 42 2 0.85 BDL BDL
Gndehhat Nalla 8.25 363 3 35 390 -- 26 1 0.72 BDL BDL
Limits 5.5-9.0 -- 250 100 --- 2 --- --- -- 5 2
Source: CPCB, 2011
Note: Standards are as per guidelines for discharge in drain. Pb, Cr, Cu, Ni and Cd were also analysed but found
below detection limit
Table 57 Analysis report of river water in Pathakheda, Pench, & Kanahn area (Madhya Pradesh)
Parameters are
in mg/l except
pH and
conductivity
pH Cond COD TSS TS F Cl SO4 NO3-
N
Zn Mn
D/S Tawa River 7.97 245 19 8 54 0.269 10 4 -- 0.019 BDL
U/S Tawa River 7.85 195 21 6 86 1.607 7 3 -- BDL BDL
U/S Kanhan
River
8.6 224 20 2 36 0.947 10 15 -- BDL BDL
D/S Kanhan
River
7.81 402 22 9 162 1.485 14 17 -- BDL BDL
D/S Pench River 8.03 427 20 9 237 1.485 7 22 -- 0.022 BDL
U/S Pench River 8.32 472 19 17 321 0.295 8 56 -- 0.025 BDL
Limits 5.5-
9.0
250 100 1500 2 600 400 10 5 2
Source: CPCB, 2011
Pb, Cr, Cu, Ni and Cd were also analysed but found below detection limit
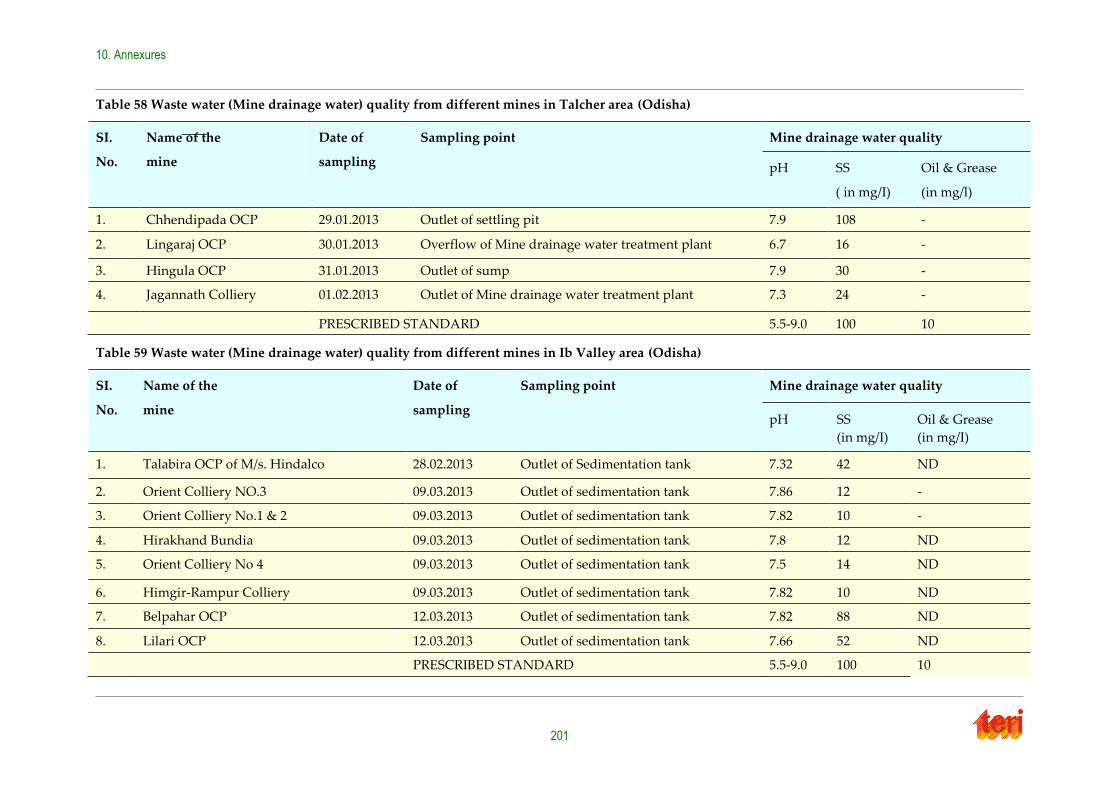
10. Annexures
201
Table 58 Waste water (Mine drainage water) quality from different mines in Talcher area (Odisha)
SI.
No.
Name of the
mine
Date of
sampling
Sampling point Mine drainage water quality
pH SS
( in mg/I)
Oil & Grease
(in mg/l)
1. Chhendipada OCP 29.01.2013 Outlet of settling pit 7.9 108 -
2. Lingaraj OCP 30.01.2013 Overflow of Mine drainage water treatment plant 6.7 16 -
3. Hingula OCP 31.01.2013 Outlet of sump 7.9 30 -
4. Jagannath Colliery 01.02.2013 Outlet of Mine drainage water treatment plant 7.3 24 -
PRESCRIBED STANDARD 5.5-9.0 100 10
Table 59 Waste water (Mine drainage water) quality from different mines in Ib Valley area (Odisha)
SI.
No.
Name of the
mine
Date of
sampling
Sampling point Mine drainage water quality
pH SS
(in mg/I)
Oil & Grease
(in mg/I)
1. Talabira OCP of M/s. Hindalco 28.02.2013 Outlet of Sedimentation tank 7.32 42 ND
2. Orient Colliery NO.3 09.03.2013 Outlet of sedimentation tank 7.86 12 -
3. Orient Colliery No.1 & 2 09.03.2013 Outlet of sedimentation tank 7.82 10 -
4. Hirakhand Bundia 09.03.2013 Outlet of sedimentation tank 7.8 12 ND
5. Orient Colliery No 4 09.03.2013 Outlet of sedimentation tank 7.5 14 ND
6. Himgir-Rampur Colliery 09.03.2013 Outlet of sedimentation tank 7.82 10 ND
7. Belpahar OCP 12.03.2013 Outlet of sedimentation tank 7.82 88 ND
8. Lilari OCP 12.03.2013 Outlet of sedimentation tank 7.66 52 ND
PRESCRIBED STANDARD 5.5-9.0 100 10
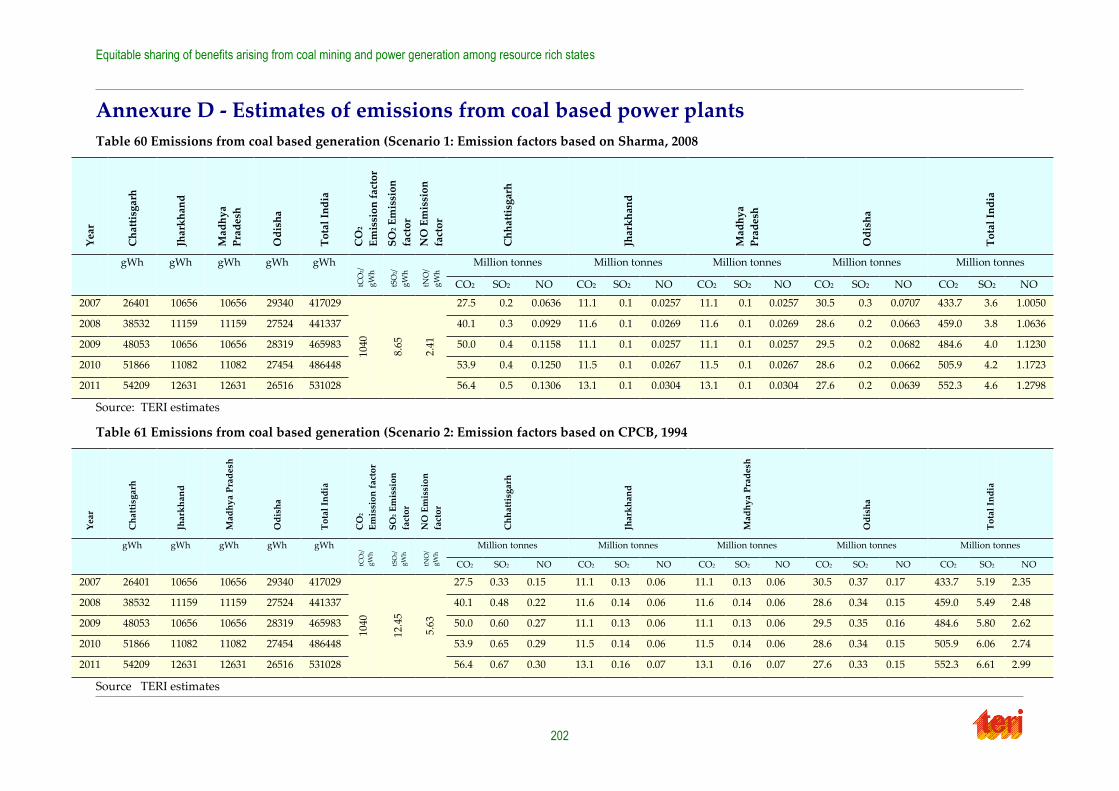
Equitable sharing of benefits arising from coal mining and power generation among resource rich states
202
Annexure D - Estimates of emissions from coal based power plants
Table 60 Emissions from coal based generation (Scenario 1: Emission factors based on Sharma, 2008
Yea
r
Ch
atti
sgar
h
Jhar
kh
and
Mad
hy
a
Pra
des
h
Od
ish
a
To
tal
Ind
ia
CO
2
Em
issi
on
fac
tor
SO
2 E
mis
sio
n
fact
or
NO
Em
issi
on
fact
or
Ch
hat
tisg
arh
Jhar
kh
and
Mad
hy
a
Pra
des
h
Od
ish
a
To
tal
Ind
ia
gWh gWh gWh gWh gWh
tCO
2/
gW
h
tSO
2/
gW
h
tNO
/
gW
h
Million tonnes Million tonnes Million tonnes Million tonnes Million tonnes
CO2 SO2 NO CO2 SO2 NO CO2 SO2 NO CO2 SO2 NO CO2 SO2 NO
2007 26401 10656 10656 29340 417029
1040
8.65
2.41
27.5 0.2 0.0636 11.1 0.1 0.0257 11.1 0.1 0.0257 30.5 0.3 0.0707 433.7 3.6 1.0050
2008 38532 11159 11159 27524 441337 40.1 0.3 0.0929 11.6 0.1 0.0269 11.6 0.1 0.0269 28.6 0.2 0.0663 459.0 3.8 1.0636
2009 48053 10656 10656 28319 465983 50.0 0.4 0.1158 11.1 0.1 0.0257 11.1 0.1 0.0257 29.5 0.2 0.0682 484.6 4.0 1.1230
2010 51866 11082 11082 27454 486448 53.9 0.4 0.1250 11.5 0.1 0.0267 11.5 0.1 0.0267 28.6 0.2 0.0662 505.9 4.2 1.1723
2011 54209 12631 12631 26516 531028 56.4 0.5 0.1306 13.1 0.1 0.0304 13.1 0.1 0.0304 27.6 0.2 0.0639 552.3 4.6 1.2798
Source: TERI estimates
Table 61 Emissions from coal based generation (Scenario 2: Emission factors based on CPCB, 1994
Yea
r
Ch
atti
sgar
h
Jhar
kh
and
Mad
hy
a P
rad
esh
Od
ish
a
To
tal
Ind
ia
CO
2
Em
issi
on
fac
tor
SO
2 E
mis
sio
n
fact
or
NO
Em
issi
on
fact
or
Ch
hat
tisg
arh
Jhar
kh
and
Mad
hy
a P
rad
esh
Od
ish
a
To
tal
Ind
ia
gWh gWh gWh gWh gWh
tCO
2/
gW
h
tSO
2/
gW
h
tNO
/
gW
h
Million tonnes Million tonnes Million tonnes Million tonnes Million tonnes
CO2 SO2 NO CO2 SO2 NO CO2 SO2 NO CO2 SO2 NO CO2 SO2 NO
2007 26401 10656 10656 29340 417029
1040
12.4
5
5.63
27.5 0.33 0.15 11.1 0.13 0.06 11.1 0.13 0.06 30.5 0.37 0.17 433.7 5.19 2.35
2008 38532 11159 11159 27524 441337 40.1 0.48 0.22 11.6 0.14 0.06 11.6 0.14 0.06 28.6 0.34 0.15 459.0 5.49 2.48
2009 48053 10656 10656 28319 465983 50.0 0.60 0.27 11.1 0.13 0.06 11.1 0.13 0.06 29.5 0.35 0.16 484.6 5.80 2.62
2010 51866 11082 11082 27454 486448 53.9 0.65 0.29 11.5 0.14 0.06 11.5 0.14 0.06 28.6 0.34 0.15 505.9 6.06 2.74
2011 54209 12631 12631 26516 531028 56.4 0.67 0.30 13.1 0.16 0.07 13.1 0.16 0.07 27.6 0.33 0.15 552.3 6.61 2.99
Source TERI estimates


Equitable sharing of benefits arising from coal mining and power generation among resource rich states


![The ABS Compliant Biotrade in South(ern) Africa Project · Objective “…. the fair and equitable sharing of the benefits arising from the utilization [R&D] of genetic resources,](https://static.fdocuments.us/doc/165x107/5f752885345e8561bd20609f/the-abs-compliant-biotrade-in-southern-africa-project-objective-aoe-the-fair.jpg)