Equilibrium Constant.pdf
12
Experiment 3 DETERMINATION OF THE EQUILIBRIUM CONSTANT FOR A CHEMICAL REACTION When chemical substances react, the reaction typically does not go to completion. Rather, the system goes to some intermediate state in which both the reactants and products have concentrations that do not change with time. Such a system is said to be in chemical equilibrium. When in equilibrium at a particular temperature, a reaction mixture obeys the Law of Mass Action (or the Law of Chemical Equilibrium), which imposes a specific condition on the concentrations of reactants and products that is expressed by the equilibrium constant for the reaction. In this experiment, the reaction between iron(III) ion (Fe 3+ ), and thiocyanate ion (SCN - ), will be studied. When solutions containing Fe 3+ and SCN - are mixed, a reaction occurs forming the FeSCN 2+ complex ion that has a deep red color. The reaction may be written: Fe 3+ (aq) + SCN - (aq) FeSCN 2+ (aq) (1) The reaction between iron(III) ion and thiocyanate ion does not go to completion. Instead, equilibrium is established at some intermediate state where both the reactants and products have concentrations that do not change with time. As a result of the reaction, the amounts of Fe 3+ and SCN - at equilibrium will be less than the amount of each present before the reaction occurred. From the balanced chemical equation, we can see for every mole of FeSCN 2+ that is formed, one mole of Fe 3+ and one mole of SCN - will be consumed. According to the Law of Mass Action, the equilibrium constant (K c ), for Equation (1) may be formulated as shown in the following expression: Kc = FeSCN 2+ Fe 3+ SCN - , (2) where the molar concentrations of FeSCN 2+ , Fe 3+ , and SCN - are measured at equilibrium. The value of K c in Equation (2) is constant at a given temperature. As a result, mixtures containing Fe 3+ and SCN - will react until Equation (2) is satisfied. Additionally, the same value of K c will be obtained no matter what initial amounts of Fe 3+ and SCN - were used. The purpose of this experiment is to measure K c for several mixtures of Fe 3+ and SCN - made up in different ways. The mixtures will be prepared by mixing solutions containing known concentrations of iron(III) nitrate [Fe(NO 3 ) 3 ], and potassium thiocyanate (KSCN). The reaction between iron(III) ion and thiocyanate ion is a particularly good one to study because the value of K c is of a convenient magnitude and the intense color of the FeSCN 2+ complex ion makes the determination of its equilibrium concentration quite simple. Knowing the initial composition of a mixture and the equilibrium concentration of FeSCN 2+ , the equilibrium concentrations of the rest of the pertinent species may be calculated and then used to determine K c .
-
Upload
3cutelittlebirdies -
Category
Documents
-
view
32 -
download
2
Transcript of Equilibrium Constant.pdf
Experiment 3
DETERMINATION OF THE EQUILIBRIUM CONSTANT FOR A CHEMICAL REACTION
When chemical substances react, the reaction typically does not go to completion. Rather, the system
goes to some intermediate state in which both the reactants and products have concentrations that do not change
with time. Such a system is said to be in chemical equilibrium. When in equilibrium at a particular temperature,
a reaction mixture obeys the Law of Mass Action (or the Law of Chemical Equilibrium), which imposes a
specific condition on the concentrations of reactants and products that is expressed by the equilibrium constant
for the reaction.
In this experiment, the reaction between iron(III) ion (Fe3+), and thiocyanate ion (SCN-), will be studied.
When solutions containing Fe3+ and SCN- are mixed, a reaction occurs forming the FeSCN2+ complex ion that has
a deep red color. The reaction may be written:
Fe3+ (aq) + SCN- (aq) FeSCN2+ (aq) (1)
The reaction between iron(III) ion and thiocyanate ion does not go to completion. Instead, equilibrium is
established at some intermediate state where both the reactants and products have concentrations that do not
change with time. As a result of the reaction, the amounts of Fe3+ and SCN- at equilibrium will be less than the
amount of each present before the reaction occurred. From the balanced chemical equation, we can see for
every mole of FeSCN2+ that is formed, one mole of Fe3+ and one mole of SCN- will be consumed.
According to the Law of Mass Action, the equilibrium constant (Kc), for Equation (1) may be formulated
as shown in the following expression:
Kc = FeSCN2+
Fe3+ SCN- ,
(2)
where the molar concentrations of FeSCN2+, Fe3+, and SCN- are measured at equilibrium. The value of Kc in
Equation (2) is constant at a given temperature. As a result, mixtures containing Fe3+ and SCN- will react
until Equation (2) is satisfied. Additionally, the same value of Kc will be obtained no matter what initial amounts of
Fe3+ and SCN- were used.
The purpose of this experiment is to measure Kc for several mixtures of Fe3+ and SCN- made up in
different ways. The mixtures will be prepared by mixing solutions containing known concentrations of iron(III)
nitrate [Fe(NO3)3], and potassium thiocyanate (KSCN). The reaction between iron(III) ion and thiocyanate ion is a
particularly good one to study because the value of Kc is of a convenient magnitude and the intense color of the
FeSCN2+ complex ion makes the determination of its equilibrium concentration quite simple. Knowing the initial
composition of a mixture and the equilibrium concentration of FeSCN2+, the equilibrium concentrations of the rest
of the pertinent species may be calculated and then used to determine Kc.
2
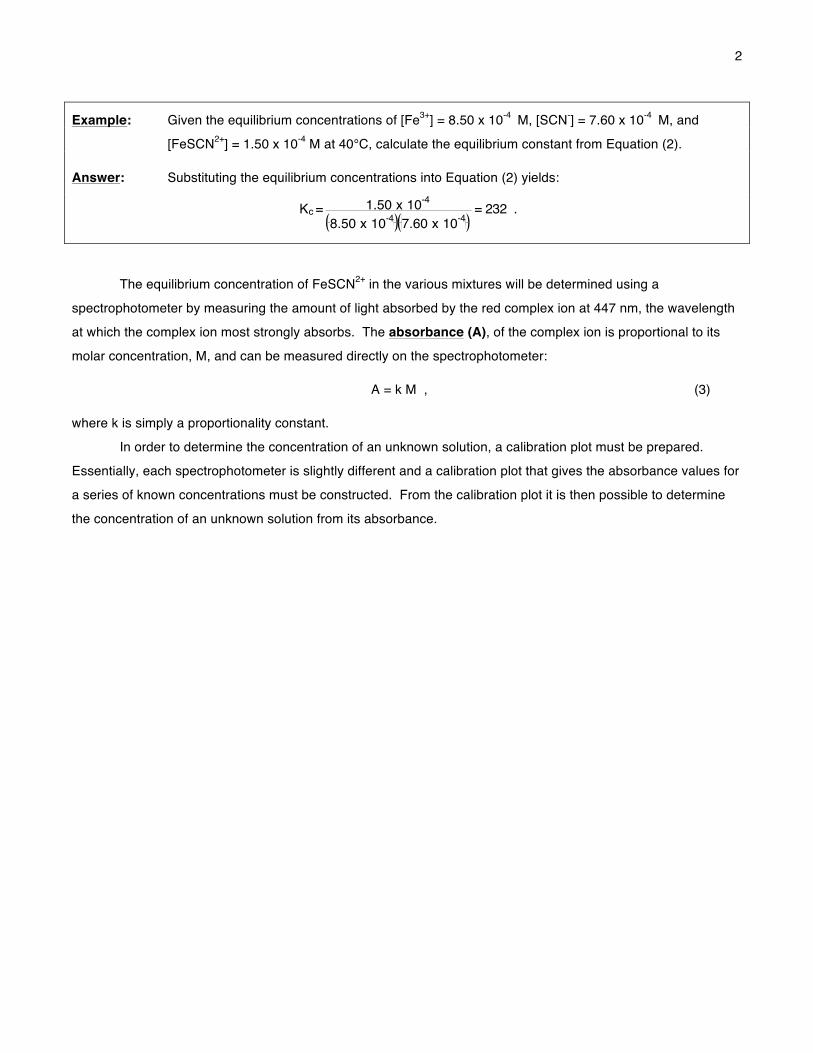
Example: Given the equilibrium concentrations of [Fe3+] = 8.50 x 10⁻⁴ M, [SCN-] = 7.60 x 10⁻⁴ M, and
[FeSCN2+] = 1.50 x 10⁻⁴ M at 40°C, calculate the equilibrium constant from Equation (2).
Answer: Substituting the equilibrium concentrations into Equation (2) yields:
Kc = 1.50 x 10⁻⁴
8.50 x 10⁻⁴ 7.60 x 10-4 = 232 .
The equilibrium concentration of FeSCN2+ in the various mixtures will be determined using a
spectrophotometer by measuring the amount of light absorbed by the red complex ion at 447 nm, the wavelength
at which the complex ion most strongly absorbs. The absorbance (A), of the complex ion is proportional to its
molar concentration, M, and can be measured directly on the spectrophotometer:
A = k M , (3)
where k is simply a proportionality constant.
In order to determine the concentration of an unknown solution, a calibration plot must be prepared.
Essentially, each spectrophotometer is slightly different and a calibration plot that gives the absorbance values for
a series of known concentrations must be constructed. From the calibration plot it is then possible to determine
the concentration of an unknown solution from its absorbance.

3
Example: Given the calibration data in the table below, calculate the equilibrium concentration of FeSCN2+,
if the absorbance is 0.405.
[FeSCN2+] Absorbance 0.250 x 10⁻⁴ 0.121 0.500 x 10⁻⁴ 0.243 1.00 x 10⁻⁴ 0.475 1.60 x 10⁻⁴ 0.786
Answer: In order to determine the concentration of FeSCN2+, a calibration plot must first be constructed
as shown in the graph below.
0.100
0.200
0.300
0.400
0.500
0.600
0.700
0.800
Abso
rban
ce
0.00E+00 2.50E-05 5.00E-05 7.50E-05 1.00E-04 1.25E-04 1.50E-04 1.75E-04 2.00E-04
y = 4906.034x - 0.005 r2 = 0.999
From the calibration data, a least squares analysis was performed and the best straight line fitting
the data was drawn. The equation for the line is given at the top of the plot:
y = 4906.034x - 0.005 r2 = 0.999 .
The concentration of FeSCN2+ can be determined by substituting the value of the absorbance into
the equation for the least squares line and solving for the concentration.
x =
0.405+ 0.0054906.034 = 8.36x 10⁻⁵ M
Calibration Plot for FeSCN2+
[FeSCN2+]

4
In preparing a calibration plot, in addition to the equation for the least squares line, the correlation
coefficient (r2) is also determined. The correlation coefficient indicates how well the data fits the equation for a
straight line. A value of 1.000 indicates a perfect fit. The farther the correlation coefficient is from 1.000 indicates
that the data is less well represented by a straight line. From the example above, the correlation coefficient of
0.999 indicates that the data is linear.
In the preceding example, the assumption was made that the reaction that occurred was given by
Equation (1). There is no inherent reason why the reaction might not have been
Fe3+ (aq) + 2SCN- (aq) Fe(SCN2+ )2 (aq) (4)
for which the equilibrium constant would be given by the expression:
Kc = Fe(SCN)2
+
Fe3+ SCN- 2 .
(5)
The obvious question to be answered is how is it possible to determine whether we are actually observing the
reaction given in Equation (1) or the reaction given in Equation (4)? The line of reasoning by which we can
accomplish this task is that if the reaction in Equation (1) is the one that is occurring, the Kc value for that reaction,
as we calculate it, should remain constant for different reagent mixtures. If however, the reaction given in
Equation (4) is the one that is occurring, the Kc value, as calculated for that reaction, should remain constant.
Thus a determination can be made as to which reaction is occurring by comparing the constancy in the values of
the equilibrium constants for the two reactions.
The operation of the optical system of a typical spectrophotometer is shown schematically in the Figure 1.
White light emitted by the tungsten lamp is focused by the field lens on the entrance slit. The objective lens
focuses the image of the entrance slit at the exit slit after it has been dispersed and reflected by the diffraction
grating (the diffraction grating acts like a prism).
Lamp Field lensEntrance slit
Objective lens
Grating
Wavelength cam
Light control
Occluder
Exit slit
Sample
Filter
Measuring phototube
Figure 1. Optical system of a typical spectrophotometer.
5
When setting the wavelength, a cam positions the grating so that only the desired wavelength passes
through the exit slit. The monochromatic light that passes through the exit slit continues on through the sample
contained in a cuvette placed in the light path. Finally, the monochromatic light beam terminates at the measuring
phototube, where the light energy is converted to an electrical signal. When the sample is removed from the
instrument, an occluder automatically falls into the light path so that the zero light level (total absence of light) may
be set automatically. A light control is provided to set the 100% transmittance/0 absorbance with a reference
solution in the sample holder.
EXPERIMENTAL PROCEDURE
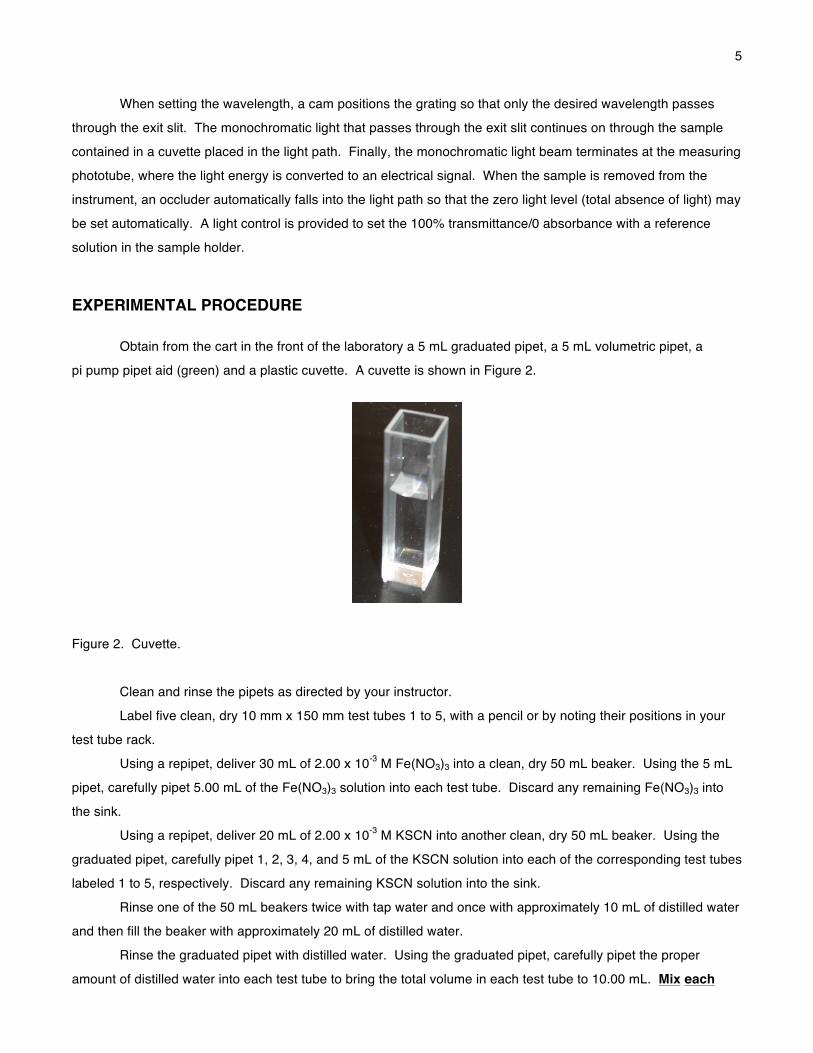
Obtain from the cart in the front of the laboratory a 5 mL graduated pipet, a 5 mL volumetric pipet, a
pi pump pipet aid (green) and a plastic cuvette. A cuvette is shown in Figure 2.
Figure 2. Cuvette.
Clean and rinse the pipets as directed by your instructor.
Label five clean, dry 10 mm x 150 mm test tubes 1 to 5, with a pencil or by noting their positions in your
test tube rack.
Using a repipet, deliver 30 mL of 2.00 x 10⁻³ M Fe(NO3)3 into a clean, dry 50 mL beaker. Using the 5 mL
pipet, carefully pipet 5.00 mL of the Fe(NO3)3 solution into each test tube. Discard any remaining Fe(NO3)3 into
the sink.
Using a repipet, deliver 20 mL of 2.00 x 10⁻³ M KSCN into another clean, dry 50 mL beaker. Using the
graduated pipet, carefully pipet 1, 2, 3, 4, and 5 mL of the KSCN solution into each of the corresponding test tubes
labeled 1 to 5, respectively. Discard any remaining KSCN solution into the sink.
Rinse one of the 50 mL beakers twice with tap water and once with approximately 10 mL of distilled water
and then fill the beaker with approximately 20 mL of distilled water.
Rinse the graduated pipet with distilled water. Using the graduated pipet, carefully pipet the proper
amount of distilled water into each test tube to bring the total volume in each test tube to 10.00 mL. Mix each

6
solution thoroughly with a glass stirring rod. Improper mixing is a large source of error in this experiment. Be
sure to dry the stirring rod with a paper towel after mixing each solution. The volumes of reagents to be added to
each test tube are summarized in Table 1.
Table 1. Composition of test tube mixtures
Test Tube Number 1 2 3 4 5 ______ ______ ______ ______ ______ Volume Fe(NO3)3 solution (mL) 5.00 5.00 5.00 5.00 5.00 Volume KSCN solution (mL) 1.00 2.00 3.00 4.00 5.00 Volume H2O (mL) 4.00 3.00 2.00 1.00 0.00
Using a Turner Spectrophotometer Model SP-830, measure the absorbance at 447 nm of each of the five
solutions. Rinse the cuvette with a small portion of the solution to be measured. Be sure to fill the cuvette over
half full with solution.
Preparation of Calibration Standards
Each group at a lab bench will prepare one of the calibration standards. If there are fewer than four
groups at a lab bench, groups will make up more than one standard. The standards are to be shared by all of the
groups at a lab bench. 100 mL of each standard will be prepared. Be sure to label the concentration of each of
the solutions.
Preparation directions for calibration standards:
a. 1.00 x 10⁻⁴ FeSCN2+ (in 0.5 M HNO3) [Using a 10 mL buret, deliver 5.00 mL of the 2.00 x 10⁻³ M KSCN
solution into a 100 mL volumetric flask dilute to the mark with 0.200 M Fe(NO3)3 (in 0.5 M HNO3)].
b. 0.750 x 10⁻⁴ FeSCN2+ (in 0.5 M HNO3) [Using a 10 mL buret, deliver 3.75 mL of the 2.00 x 10⁻³ M KSCN
solution into a 100 mL volumetric flask dilute to the mark with 0.200 M Fe(NO3)3 (in 0.5 M HNO3)].
c. 0.500 x 10⁻⁴ FeSCN2+ (in 0.5 M HNO3) [Using a 10 mL buret, deliver 2.50 mL of the 2.00 x 10⁻³ M KSCN
solution into a 100 mL volumetric flask dilute to the mark with 0.200 M Fe(NO3)3 (in 0.5 M HNO3)].
d. 0.250 x 10⁻⁴ FeSCN2+ (in 0.5 M HNO3) [Using a 10 mL buret, deliver 1.25 mL of the 2.00 x 10⁻³ M KSCN
solution into a 100 mL volumetric flask dilute to the mark with 0.200 M Fe(NO3)3 (in 0.5 M HNO3)].
Using one of the sets of calibration standards, each group will determine the absorbance at 447 nm of
each of the four standard solutions on the same spectrophotometer that you used to measured the absorbance of
your unknown solutions. The standard solutions of [FeSCN2+] are 1.00 x 10⁻⁴ M, 0.750 x 10⁻⁴ M, 0.500 x 10⁻⁴ M,
and 0.250 x 10⁻⁴ M. Record the calibration data on the laboratory report. Also, be sure to record the number of
the instrument you used on the laboratory report.

7
Return the equipment to the cart upon completion of the experiment.
Before leaving the laboratory, enter the data into the computer. Failure to enter your data into the
computer will result in a one letter grade deduction. Since you will work in pairs on thus experiment and
the data is the same for both partners, the data only needs to be inputted once.
Graphing Instructions Copy the Excel spreadsheet on the laboratory website for the Equilibrium Constant lab and prepare a calibration plot of absorbance versus concentration for your data. The graph should look very much like that shown in the example in the laboratory Print a copy of the graph and tape it to the laboratory report as directed.
8
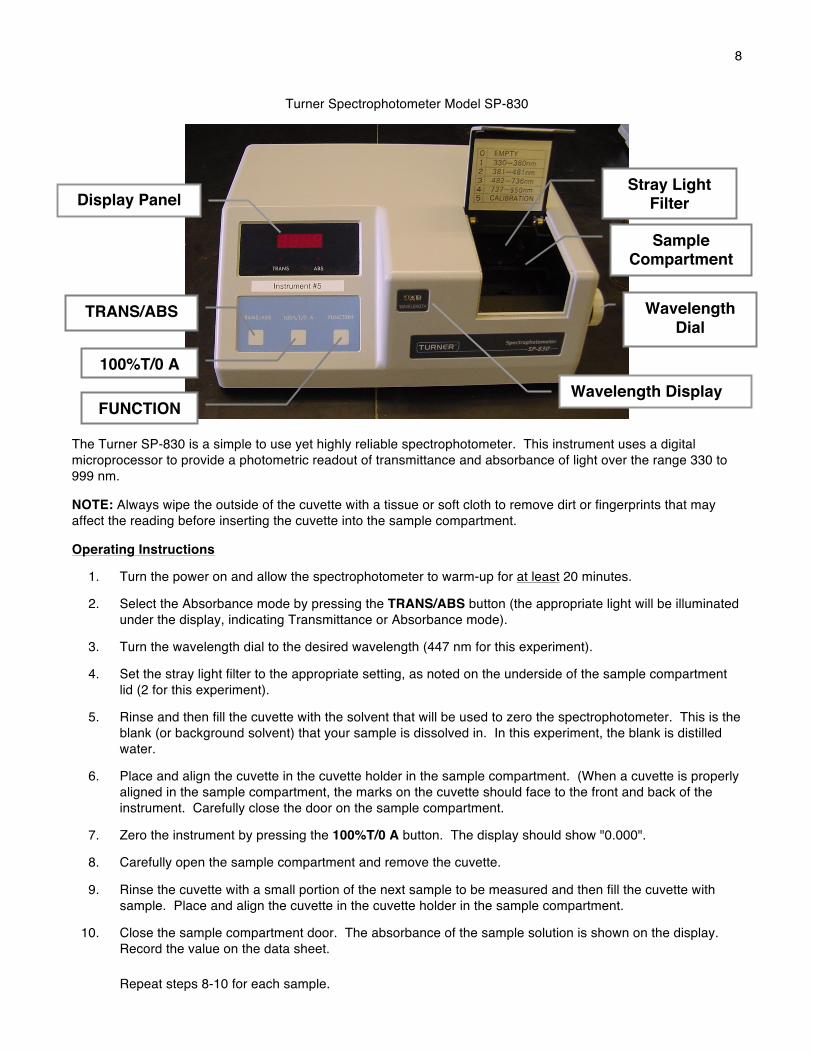
Turner Spectrophotometer Model SP-830
The Turner SP-830 is a simple to use yet highly reliable spectrophotometer. This instrument uses a digital microprocessor to provide a photometric readout of transmittance and absorbance of light over the range 330 to 999 nm. NOTE: Always wipe the outside of the cuvette with a tissue or soft cloth to remove dirt or fingerprints that may affect the reading before inserting the cuvette into the sample compartment. Operating Instructions 1. Turn the power on and allow the spectrophotometer to warm-up for at least 20 minutes. 2. Select the Absorbance mode by pressing the TRANS/ABS button (the appropriate light will be illuminated
under the display, indicating Transmittance or Absorbance mode). 3. Turn the wavelength dial to the desired wavelength (447 nm for this experiment). 4. Set the stray light filter to the appropriate setting, as noted on the underside of the sample compartment
lid (2 for this experiment). 5. Rinse and then fill the cuvette with the solvent that will be used to zero the spectrophotometer. This is the
blank (or background solvent) that your sample is dissolved in. In this experiment, the blank is distilled water.
6. Place and align the cuvette in the cuvette holder in the sample compartment. (When a cuvette is properly
aligned in the sample compartment, the marks on the cuvette should face to the front and back of the instrument. Carefully close the door on the sample compartment.
7. Zero the instrument by pressing the 100%T/0 A button. The display should show "0.000". 8. Carefully open the sample compartment and remove the cuvette. 9. Rinse the cuvette with a small portion of the next sample to be measured and then fill the cuvette with
sample. Place and align the cuvette in the cuvette holder in the sample compartment. 10. Close the sample compartment door. The absorbance of the sample solution is shown on the display.
Record the value on the data sheet.
Repeat steps 8-10 for each sample.
TRANS/ABS
100%T/0 A
FUNCTION
Sample Compartment
Stray Light Filter
Wavelength Dial
Display Panel
Wavelength Display

9
Ex. 3 Name ________________________________________ Section _______ Drawer _______
PRELABORATORY ASSIGNMENT: EQUILIBRIUM CONSTANT DETERMINATION 1. A student mixes 5.00 mL of 2.00 x 10⁻³ M Fe(NO3)3, 4.00 mL of 2.00 x 10⁻³ M KSCN, and 1.00 mL of distilled
water and finds that in the equilibrium mixture the concentration of FeSCN2+ is 1.31 x 10⁻⁴ M.
Fe3+ (aq) + SCN- (aq) FeSCN2+ (aq)
a. Find the number of moles of Fe3+ and SCN- initially present.
___________ moles Fe3+
___________ moles SCN- b. How many moles of FeSCN2+ are in the mixture at equilibrium?
___________ moles FeSCN2+ c. How many moles of Fe3+ and SCN- are used up in making the FeSCN2+?
___________ moles Fe3+
___________ moles SCN- d. How many moles of Fe3+ and SCN- remain in the solution at equilibrium?
___________ moles Fe3+
___________ moles SCN- e. What are the concentrations of Fe3+, SCN-, and FeSCN2+ at equilibrium?
[Fe3+] = ___________ M
[SCN-] = ___________ M
[FeSCN2+] = ___________ M f. What is the value of Kc for the reaction?
Kc = ___________

10
2. Given the calibration data in the table below, construct a calibration plot using the excel worksheet from the laboratory website.
[FeSCN2+] Absorbance
0.250 x 10⁻⁴ 0.120
0.500 x 10⁻⁴ 0.240
1.00 x 10⁻⁴ 0.481
1.60 x 10⁻⁴ 0.770
Cut out the graph and tape it here.
3. From the least squares line from the calibration plot, calculate the equilibrium concentration of [FeSCN2+] if
the absorbance is 0.460. [FeSCN2+] = ___________ M
11
Ex. 3 Name ________________________________________ Section _______ Drawer _______
LABORATORY REPORT: EQUILIBRIUM CONSTANT DETERMINATION DATA Mixture Absorbance Calibration Data: Instrument # _______
1 ___________ [FeSCN2+] Absorbance
2 ___________ 0.250 x 10⁻⁴ ___________
3 ___________ 0.500 x 10⁻⁴ ___________
4 ___________ 0.750 x 10⁻⁴ ___________
5 ___________ 1.00 x 10⁻⁴ ___________
CALCULATIONS 1. Construct a calibration plot for your instrument using the excel worksheet from the laboratory website.
Tape calibration plot here.
2. Using the least squares line, determine the concentration of FeSCN2+ for each mixture. Mixture [FeSCN2+]
1 ___________
2 ___________
3 ___________
4 ___________
5 ___________

CA
LC
UL
AT
ION
S
A.
Cal
cula
tion
of K
c ass
umin
g th
e re
actio
n: F
e3+ (a
q) +
SC
N- (
aq)
FeS
CN
2+ (a
q) .
Mix
ture
In
itial
No.
Mol
es
Equ
ilibr
ium
No.
Mol
es
Equ
ilibr
ium
Con
cent
ratio
n
Fe3
+S
CN
-F
e3+
SC
N-
FeS
CN
2+
[Fe3
+]
[SC
N- ]
[FeS
CN
2+]
K c
1_
__
__
__
__
__
__
__
__
__
__
__
__
__
__
__
__
__
__
__
__
__
__
__
__
__
__
__
__
__
__
__
__
__
__
__
__
__
__
__
__
2_
__
__
__
__
__
__
__
__
__
__
__
__
__
__
__
__
__
__
__
__
__
__
__
__
__
__
__
__
__
__
__
__
__
__
__
__
__
__
__
__
3_
__
__
__
__
__
__
__
__
__
__
__
__
__
__
__
__
__
__
__
__
__
__
__
__
__
__
__
__
__
__
__
__
__
__
__
__
__
__
__
__
4_
__
__
__
__
__
__
__
__
__
__
__
__
__
__
__
__
__
__
__
__
__
__
__
__
__
__
__
__
__
__
__
__
__
__
__
__
__
__
__
__
5_
__
__
__
__
__
__
__
__
__
__
__
__
__
__
__
__
__
__
__
__
__
__
__
__
__
__
__
__
__
__
__
__
__
__
__
__
__
__
__
__
B.
Cal
cula
tion
of K
c ass
umin
g th
e re
actio
n: F
e3+ (a
q) +
2S
CN
- (aq
) F
e(S
CN
) 2+
(aq)
.
NO
TE
:B
ecau
se o
f the
pro
cedu
re u
sed
for
calib
ratin
g th
e sp
ectr
opho
tom
eter
, [F
e(S
CN
) 2+] w
ill e
qual
one
-hal
f the
[FeS
CN
2+] o
btai
ned
for
each
sol
utio
n in
Par
t A.
Als
o no
te th
at tw
o m
oles
of S
CN
- are
nee
ded
to fo
rm o
ne m
ole
of F
e(S
CN
) 2+.
Mix
ture
In
itial
No.
Mol
es
Equ
ilibr
ium
No.
Mol
es
Equ
ilibr
ium
Con
cent
ratio
n
Fe3
+S
CN
-F
e3+
SC
N-
Fe(
SC
N) 2
+
[Fe3
+]
[SC
N- ]
[Fe(
SC
N) 2
+]
K c
1_
__
__
__
__
__
__
__
__
__
__
__
__
__
__
__
__
__
__
__
__
__
__
__
__
__
__
__
__
__
__
__
__
__
__
__
__
__
__
__
__
2_
__
__
__
__
__
__
__
__
__
__
__
__
__
__
__
__
__
__
__
__
__
__
__
__
__
__
__
__
__
__
__
__
__
__
__
__
__
__
__
__
3_
__
__
__
__
__
__
__
__
__
__
__
__
__
__
__
__
__
__
__
__
__
__
__
__
__
__
__
__
__
__
__
__
__
__
__
__
__
__
__
__
4_
__
__
__
__
__
__
__
__
__
__
__
__
__
__
__
__
__
__
__
__
__
__
__
__
__
__
__
__
__
__
__
__
__
__
__
__
__
__
__
__
5_
__
__
__
__
__
__
__
__
__
__
__
__
__
__
__
__
__
__
__
__
__
__
__
__
__
__
__
__
__
__
__
__
__
__
__
__
__
__
__
__
QU
ES
TIO
NS
1.
On
the
basi
s of
the
resu
lts in
Par
ts A
and
B, w
hat w
ould
you
con
clud
e ab
out t
he fo
rmul
a of
the
iron
(III)
thio
cyan
ate
com
plex
ion?
2.
Wha
t val
ue w
ould
you
rep
ort f
or K
c? E
xpla
in h
ow y
ou o
btai
ned
this
val
ue.