Equatorial Guinea - 2013-2017 Country Strategy …...AFRICAN DEVELOPMENT BANK REPUBLIC OF EQUATORIAL...
36
AFRICAN DEVELOPMENT BANK REPUBLIC OF EQUATORIAL GUINEA COUNTRY STRATEGY PAPER 2013-2017 CSP Preparation Team M. Kanga, Director, ORCE A. Bernoussi, Lead Economist, ORCE C. Mollinedo, Principal Country Economist, ORCE Regional Centre Department (ORCE) June 2013
Transcript of Equatorial Guinea - 2013-2017 Country Strategy …...AFRICAN DEVELOPMENT BANK REPUBLIC OF EQUATORIAL...

AFRICAN DEVELOPMENT BANK
REPUBLIC OF EQUATORIAL GUINEA COUNTRY STRATEGY PAPER 2013-2017
CSP Preparation Team
M. Kanga, Director, ORCE A. Bernoussi, Lead Economist, ORCE C. Mollinedo, Principal Country Economist, ORCE
Regional Centre Department (ORCE)
June 2013

TABLE OF CONTENTS
ACRONYMS AND ABBREVIATIONS iii
EXECUTIVE SUMMARY iv
I. INTRODUCTION 1
II. COUNTRY CONTEXT AND OUTLOOK 1
2.1 Political, Economic and Social Context 1
2.2 Strategic Options 10
2.3 Recent Developments in Aid Coordination 11
2.4 Bank Positioning in Equatorial Guinea 12
III. BANK GROUP STRATEGY FOR EQUATORIAL GUINEA 14
3.1 Rationale for Bank Group’s Intervention 14
3.2 CSP Strategic Objectives and Pillars 14
3.3 Lending and Non-lending Activities Programme 15
3.4 Expected Outcomes 16
3.5 Monitoring and Evaluation 17
3.6 Country Dialogue 17
3.7 Consultations with Stakeholders 18
3.8 Key Risks and Mitigation Measures 18
IV. CONCLUSION AND RECOMMENDATION 18
LIST OF GRAPHS
Graph 1: Political Context, 2010
Graph 2: Active Portfolio Distribution by Sector
LIST OF TABLES
Table 1: GDP by Sector
Table 2: Trends in Key Macro-economic Indicators
Table 3: Ease of Doing Business in 2013
Table 4: On-going Operations and 2013-2014 Indicative Lending Programme
Table 5: On-going Activities and 2013-2015 Indicative Non-lending Programme
LIST OF BOXES
Box 1: Trends in the Oil and Gas Sector
Box 2: Public Finance Management (PFM) Reform Programme
Box 3: Equatorial Guinea and the Extractive Industries Transparency Initiative (EITI)
Box 4: Characteristics of Equatorial Guinea’s Private Sector
Box 5: Vocational Training Reform
Box 6: Vision 2020: Equatorial Guinea’s Long-term Objectives
Box 7: Lessons Learned from the 2012 Portfolio Review
Box 8: Lessons Learned from CSP 2008-2012 Implementation

i
LIST OF ANNEXES
Annex 1: CSP 2013-2017 Outcomes Matrix
Annex 2: Active Projects in Equatorial Guinea as at 31 March 2013
Annex 3: Linkages between the NESDP 2008-2020 and the CSP 2013-2017
Annex 4: Progress towards NESDP Implementation
Annex 5: Summary of the Combined CSP 2008-2012 and CPPR 2011 Completion Report
Annex 6: Intervention Sectors of Equatorial Guinea’s Development Partners
Annex 7: March 2013 Updated Review of 2012 Portfolio Performance
Annex 8: Key Economic and Financial Indicators
Annex 9: Progress towards Achieving the MDGs
Annex 10: Map of Equatorial Guinea

ii
ACRONYMS AND ABBREVIATIONS
AfDB African Development Bank
BEAC Bank of Central African States
CBFF Congo Basin Forest Fund
CEDAW Convention on the Elimination of All Forms of Discrimination Against Women
CEMAC Central African Economic and Monetary Community
CET Common External Tariff
CFA African Financial Community
COBAC Central African Banking Commission
CPI Corruption Perception Index
CPPR Country Portfolio Performance Review
CSP Country Strategy Paper
DHS Demographic and Health Survey
DPEG Democratic Party of Equatorial Guinea
ECCAS Economic Community of Central African States
EITI Extractive Industries Transparency Initiative
EIU Economic Intelligence Unit
FAO Food and Agriculture Organization of the United Nations
FDI Foreign Direct Investment
GDP Gross Domestic Product
GGFR Global Gas Flaring Reduction Partnership
GOV Government
HDI Human Development Index
ILO International Labour Organization
IMF International Monetary Fund
INSESO Social Security Institute
LNG Liquefied Natural Gas
LPG Liquefied Petroleum Gas
MDG
Millennium Development Goal
MIC Middle-Income Country
MW Megawatt
NA National Assembly
NESDP National Economic and Social Development Plan
NSDS National Statistics Development Strategy
OECD Organisation for Economic Cooperation and Development
ORCE Country Regional Centre Department
PAGFP Public Finance Management Support Project
PEFA Public Expenditure and Financial Accountability
PFM Public Finance Management
PIU Project Implementation Unit
PP Problematic Project
PPP Potentially Problematic Project
REC Regional Economic Community
REG Republic of Equatorial Guinea
RISP Regional Integration Strategy Paper
SBA Skills-Based Approach

iii
SME Small- and Medium-Size Enterprise
SMI Small- and Medium-Size Industry
TI Transparency International
UA Unit of Account
UNDP United Nations Development Programme
UNFPA United Nations Population Fund
UNICEF United Nations Children’s Fund
UNO United Nations Organization
USA United States of America
WHO World Health Organization
WTO World Trade Organization
CURRENCY EQUIVALENTS (in May 2013)
UA 1 = CFAF 757.22
UA 1 = EUR 1.15
UA 1 = USD 1.51
FISCAL YEAR: 1 January – 31 December

iv
Executive Summary
1. Country Context. The Republic of
Equatorial Guinea (REG) is one of Africa’s
major oil producing countries. Oil production
during the last two decades has raised
Equatorial Guinea to a middle-income country
(MIC), with the highest per capita income in
sub-Saharan Africa. Hydrocarbons exports have
also helped Equatorial Guinea’s economy to
register rapid and sustained growth since 1991.
2. Development Challenges. Equatorial
Guinea’s major challenge is to use its oil wealth
to achieve sustainable and more inclusive
growth so as to improve the country’s social
status. Despite sustained growth and its huge
natural resources, the country is lagging behind
on the improvement of social indicators. Three
quarters of its population are considered poor,
job creation in the private non-oil sector is low
and the country’s institutional capacity is
limited. To meet this challenge, the
Government prepared its “Vision 2020” and its
National Economic and Social Development
Plan (NESDP) 2008-2020.
3. National Strategic Development
Framework. The main objective of NESDP
2008-2020, backed by a broad national
consensus, is to transform Equatorial Guinea
into an emerging economy by 2020. To achieve
this objective, NESDP is hinged on the
following four thrusts: (i) building world-class
infrastructure; (ii) building human capital and
improving the quality of life for each citizen;
(iii) diversifying the economy through the
private sector; and (iv) instituting good
governance at the service of the citizen.
4. Bank Group Strategy for the Period
2013-2017. The main objective of the Country
Strategy Paper (CSP) is to back the Republic of
Equatorial Guinea’s (REG) economic and
social transformation through human capital
development promotion and inclusive,
sustainable growth. Consequently, the CSP is
hinged on the following single pillar: Promote
Human Capital Development and Capacity
Building for Economic Transformation. This
pillar is closely aligned with the strategic
objectives of the second phase of NESDP. It is
also in line with the Bank’s operational
priorities outlined in its 2013-2022 Strategy and
its Regional Integration Strategy Paper (RISP)
2011-2015 for Central Africa, as well as the
guidelines of its 2013-2017 Private Sector
Development Strategy being finalized. The CSP
is also based on the guidelines of the 2008
Strategic Framework for Strengthening Bank
Group’s Support to MICs.
5. Lessons from the CSP 2008-2012.
The country’s limited project implementation
capacity did not allow for significant progress
under the previous CSP. Not satisfied with the
Bank’s complex procedures, the Government
decided to finance part of the projects from own
resources. The current strategy is largely
inspired by lessons drawn from implementing
the previous CSP, including recommendations
that future Bank assistance should give priority
to: (i) the completion of active projects; (ii) the
strengthening of policy dialogue, which is
indispensable for securing the Government’s
commitment and trust; and (iii) the exploration
of non-sovereign investment opportunities.
Consequently, the strategy is designed to be
more selective and centred on the accelerated
implementation of on-going operations which
have started producing positive outcomes, and
the selective exploration of anchor investment
financing opportunities, particularly from the
private sector window, given the need to
diversify the economy and create more
economic opportunities for the people. This
approach, agreed upon with the Government,
will help to step up the consolidation of recent
achievements that have rekindled
Government’s trust in and adhesion to the
Bank’s assistance programme, and increased
the strategy’s chances of success. Therefore,
CSP programming was focused on the period
2013-2015. The mid-term review slated for
2015 will provide the opportunity to examine
the reinforcement of the strategy through
complementary operations that are better
informed by the outcomes of studies to be
conducted before 2015.

v
6. Strengthening of Dialogue and
Advisory Support. The Bank will also take
advantage of the new momentum of
cooperation with the country to reinforce its
dialogue with the authorities. This CSP is
coming at a time when the Bank and REG are
revitalizing their partnership. Dialogue with the
Government during the period 2010-2012
contributed to the effective start-up of Bank
operations which have begun producing visible
outcomes. Hence, the Bank will intensify
dialogue with the Government to reinforce
increased political interest on the part of the
authorities, essential for the success of the
strategy. Such dialogue will be backed by a
selective programme of economic and sector
work that has also been designed to prepare the
lending programme for 2015-2017.
7. Bank’s Physical Presence. The assessment
of the previous strategy showed that greater
Bank presence in the field is necessary to
ensure satisfactory implementation of its
assistance programme. Recent improvements
observed in portfolio performance following
the deployment of technical assistance on the
spot are a perfect illustration. Based on this
experience and at the Government’s request,
the Bank will, within the decentralization
framework, ensure permanent presence in REG
through the deployment of an international staff
in Malabo.
8. Major CSP Outcomes. Bank assistance will
contribute to diversified and inclusive growth,
and to poverty reduction. Specifically, it will
help to achieve the following outcomes: (i)
human resource and institutional capacity
building; (ii) improvement of access to basic
social services by the population; (iii) job
creation, notably for youths; (iv) improvement
of budget programming, execution and
monitoring; and (v) national statistical capacity
building.

1
I. INTRODUCTION
1.1 This Country Strategy Paper (CSP)
presents the Bank’s cooperation programme
with the Republic of Equatorial Guinea
(REG) for the period 2013-2017. It is aligned
with the Government’s National Economic and
Social Development Plan (NESDP) 2008-2020,
which seeks to diversify the economy beyond
oil production and transform Equatorial Guinea
into an emerging economy by 2020. It comes at
a time when the Bank and REG are revitalizing
their partnership. The CSP’s main objective is
to back the country’s economic and social
transformation through the development of
human capital, and the promotion of inclusive
and sustainable growth. This objective is in line
with the operational priorities of the 2013-2022
Strategy, which seeks to maintain the Bank at
the centre of Africa’s transformation and the
2011-2015 Regional Integration Strategy Paper
(RISP) for Central Africa.
1.2 This strategy is based on the lessons
learned from the previous CSP. The CSP
2008-2012 was hinged on capacity building and
public infrastructure development. While
confirming the relevance of the strategic thrusts
adopted, the CSP completion report concluded
that the strategy was too optimistic with respect
to the Government’s political will and support,
and did not sufficiently take into account the
ownership level and the country’s human and
institutional capacity. These factors led to
considerable delays in the start-up of projects
that impacted the achievement of the strategy’s
objectives. Consequently, its evaluation
recommended that future Bank assistance
should focus on: (i) the completion of on-going
projects that had started producing positive
outcomes; (ii) the strengthening of policy
dialogue, indispensable for securing the
Government’s political commitment; and (iii)
the exploration of private sector activities.
1.3 Therefore, this strategy is designed
to be more selective and centred on the
implementation of on-going operations
aligned with NESDP priorities and the
consolidation of recent achievements. The
CSP is based on the reinforcement of the
outcomes of on-going projects and
Government’s renewed trust and political
interest. In mutual agreement with the
authorities, the Bank will, during the period
2013-2014, focus its efforts on implementing
on-going projects and consider the possibility
of financing projects for 2015-2017 during the
2015 mid-term review. However, in compliance
with recommendations following the evaluation
of the previous strategy and considering the
challenges of significantly reducing
unemployment, the Bank will step up efforts
aimed at enhancing non-sovereign investments
to develop the private sector, in order to create
more job opportunities, notably for women and
youths. The strategy also pays special attention
to studies to increase Bank advisory support
and help prepare potential operations during the
second phase of the CSP. Lastly, the Bank will
ensure its presence in the field, which is
essential for the success of the proposed
assistance programme.
II. COUNTRY CONTEXT AND
OUTLOOK
2.1 Political, Economic and Social
Context
Political Context
2.1.1 During the November 2009
presidential election, the candidate of the
Democratic Party of Equatorial Guinea
(DPEG), Teodoro Obiang Nguema Mbasogo,
was re-elected President of the Republic and
Head of State for another seven-year term.
To improve political governance, constitutional
reform setting up new institutions was
approved by a large majority in a referendum in
November 2011. The ruling party won the
legislative elections held in May 2013. Stable
institutions and political progress
notwithstanding, there is still need for
improvement, notably with respect to the
enhancement of civil rights and liberties.
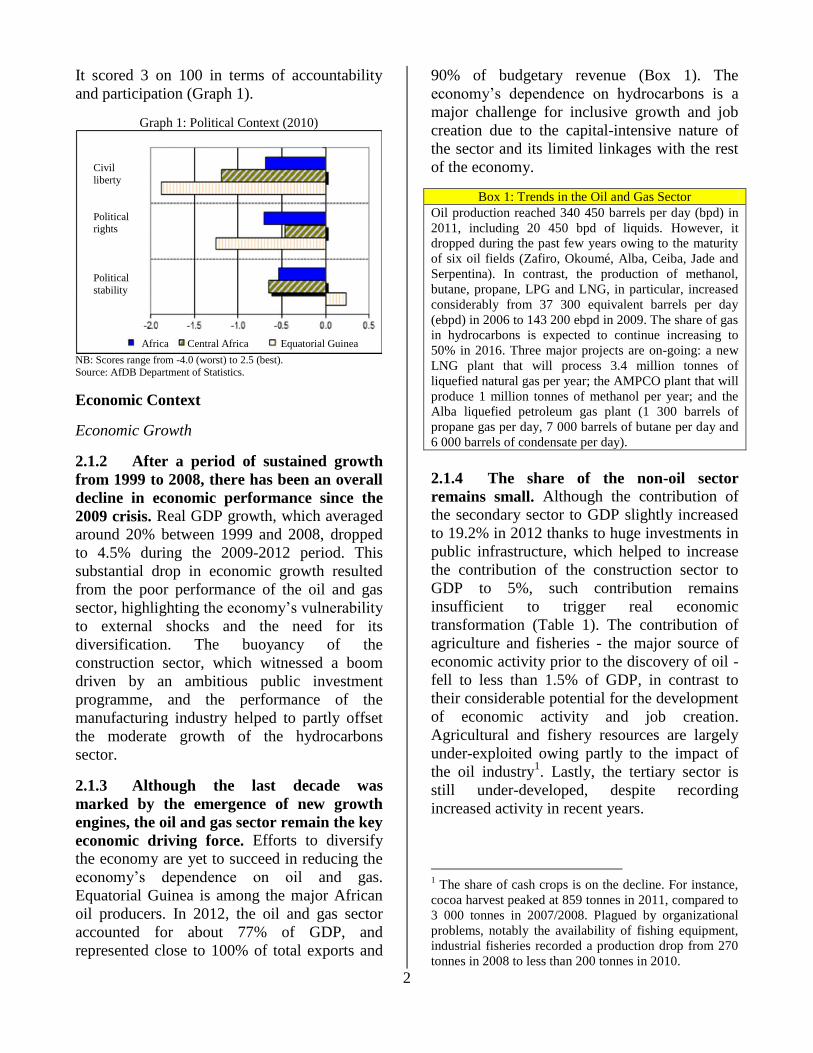
According to the World Bank’s 2011 World
Governance Indicators, REG scored 44 on 100
in terms of political stability and non-violence.
2
It scored 3 on 100 in terms of accountability
and participation (Graph 1).
Graph 1: Political Context (2010)
NB: Scores range from -4.0 (worst) to 2.5 (best).
Source: AfDB Department of Statistics.
Economic Context
Economic Growth
2.1.2 After a period of sustained growth
from 1999 to 2008, there has been an overall
decline in economic performance since the
2009 crisis. Real GDP growth, which averaged
around 20% between 1999 and 2008, dropped
to 4.5% during the 2009-2012 period. This
substantial drop in economic growth resulted
from the poor performance of the oil and gas
sector, highlighting the economy’s vulnerability
to external shocks and the need for its
diversification. The buoyancy of the
construction sector, which witnessed a boom
driven by an ambitious public investment
programme, and the performance of the
manufacturing industry helped to partly offset
the moderate growth of the hydrocarbons
sector.
2.1.3 Although the last decade was
marked by the emergence of new growth
engines, the oil and gas sector remain the key
economic driving force. Efforts to diversify
the economy are yet to succeed in reducing the
economy’s dependence on oil and gas.
Equatorial Guinea is among the major African
oil producers. In 2012, the oil and gas sector
accounted for about 77% of GDP, and
represented close to 100% of total exports and
90% of budgetary revenue (Box 1). The
economy’s dependence on hydrocarbons is a
major challenge for inclusive growth and job
creation due to the capital-intensive nature of
the sector and its limited linkages with the rest
of the economy.
Box 1: Trends in the Oil and Gas Sector
Oil production reached 340 450 barrels per day (bpd) in
2011, including 20 450 bpd of liquids. However, it
dropped during the past few years owing to the maturity
of six oil fields (Zafiro, Okoumé, Alba, Ceiba, Jade and
Serpentina). In contrast, the production of methanol,
butane, propane, LPG and LNG, in particular, increased
considerably from 37 300 equivalent barrels per day
(ebpd) in 2006 to 143 200 ebpd in 2009. The share of gas
in hydrocarbons is expected to continue increasing to
50% in 2016. Three major projects are on-going: a new
LNG plant that will process 3.4 million tonnes of
liquefied natural gas per year; the AMPCO plant that will
produce 1 million tonnes of methanol per year; and the
Alba liquefied petroleum gas plant (1 300 barrels of
propane gas per day, 7 000 barrels of butane per day and
6 000 barrels of condensate per day).
2.1.4 The share of the non-oil sector
remains small. Although the contribution of
the secondary sector to GDP slightly increased
to 19.2% in 2012 thanks to huge investments in
public infrastructure, which helped to increase
the contribution of the construction sector to
GDP to 5%, such contribution remains
insufficient to trigger real economic
transformation (Table 1). The contribution of
agriculture and fisheries - the major source of
economic activity prior to the discovery of oil -
fell to less than 1.5% of GDP, in contrast to
their considerable potential for the development
of economic activity and job creation.
Agricultural and fishery resources are largely
under-exploited owing partly to the impact of
the oil industry1. Lastly, the tertiary sector is
still under-developed, despite recording
increased activity in recent years.
1 The share of cash crops is on the decline. For instance,
cocoa harvest peaked at 859 tonnes in 2011, compared to
3 000 tonnes in 2007/2008. Plagued by organizational
problems, notably the availability of fishing equipment,
industrial fisheries recorded a production drop from 270
tonnes in 2008 to less than 200 tonnes in 2010.
Civil
liberty
Political rights
Political
stability
Africa Central Africa Equatorial Guinea

3
Table 1: GDP by Sector (%)
2012
Hydrocarbons, mining and quarries 76.7
Construction 5.2
Agriculture, forestry and fisheries 1.2
Public administration 0.9
Electricity and water 0.7
Hotels and restaurants 0.7
Financial services 0.8
Other services 0.3
Manufacturing industries 13.3
Transport and communications 0.2
Total 100
Source: AfDB Department of Statistics.
Macro-economic Management
2.1.5 Although the major internal and
external balances have been maintained on
the whole, they are still fragile. After
conducting an expansionary fiscal policy in
recent years characterized by a high increase in
capital expenditure resulting from a political
will to reduce the infrastructure deficit, the
Government in 2012 embarked on a policy shift
towards the gradual reduction of pressure on
public investment spending and public finance
balancing. As a result, the investment rate,
which had reached 34% of GDP in 2010,
dropped to 31.4% in 2012. This drop in capital
expenditure, coupled with increased oil
revenue, enabled the Government to achieve a
budget surplus of 6.0% of GDP in 2012, against
0.9% in 2011 (Table 2). However, such
improvement remains fragile due to the high
level of public investment commitments being
executed. The regional monetary and exchange
rate policy implemented by BEAC is still
guided by the desire to maintain price stability
within the framework of the CFAF to Euro
fixed exchange rate system. The cautious
orientation of monetary policy, coupled with
the relative drop in transport, education and
communication costs, helped to contain
inflation at around 4.5% in 2012. However, this
rate remains higher than the 3% CEMAC
convergence threshold. In contrast, the impact
of oil revenue on income generation and the
cost of production factors increased the cost of
living and reduced economic competitiveness2.
2.1.6 The country’s external position has
also improved. The current account deficit of
6.0% of GDP in 2011 was transformed into a
surplus of 3.5% of GDP in 2012 as a result of a
drop in imports and international reserves,
which represented more than 8 months of
imports of goods and services. Public debt was
estimated at less than 10% of GDP in 2012.
Debt sustainability should be preserved in the
medium term, thanks to a low debt ratio, the
accumulation of substantial foreign exchange
reserves and significant oil revenue. By
concluding consultations in January 2013 with
Equatorial Guinea pursuant to Article IV, the
IMF Executive Board encouraged the
authorities to continue to improve public
finance management so as to maintain long-
term budgetary sustainability, improve the
investment climate and redirect public
expenditure towards social sectors.
Table 2: Trends in Key Macro-economic Indicators (in %
of GDP, unless otherwise indicated )
2
009
2010
2011
2012
(e)
2013
(p)
2014
(p
)
GDP Growth (%) 5.7 -0.8 7.7 5.5 4.9 -2.0
Inflation (%) 7.2 7.5 4.8 4.5 3.1 3.5
Budget Balance -7.9 -4.8 0.9 6.0 3.6 3.5
Current External
Position -17.1 -24 -6.0 3.5 2.0 -1.0
Source: AfDB Department of Statistics.
2.1.7 Equatorial Guinea’s economic
outlook should confirm the slow-down in
economic growth rate. Real GDP should
increase by 4.9% in 2013 against 5.5% in 2012,
and probably record negative growth in 2014.
2Equatorial Guinea has started experiencing the early
effects of the Dutch Disease: oil export earnings have
resulted in an increase in imports, as limited domestic
supply of non-tradable goods is unable to meet demand.
Consequently, there has been a rise in the real exchange
rate, which cannot be offset by nominal exchange rate
adjustments as the country is a CEMAC member, a
dilemma reflected in the inflation gaps between
Equatorial Guinea and the other countries of the
community.

4
The major factor of this growth recession is
linked to the gradual drop in crude oil
production. However, natural gas exploitation
could enable the country to offset the drop in
oil production on condition that the productivity
of such exploitation is increased. Inflation
should remain moderate for the period 2013-
2014, averaging at around 3.3%. Stable world
oil prices and reduced public spending should
contribute to maintaining the budget surplus at
around 3.5% of GDP on average over the
period 2013-2014.
Governance and Transparency
2.1.8 Despite some progress in public
finance management transparency and
quality, there are weaknesses with respect to
the budget, procurement and internal and
external auditing. The budget is subject to a
double management system which separates the
recurrent budget from the investment budget.
Budget planning and programming lack
coordination between the ministries and an
economic classification system that does not
allow for efficient allocation of resources
between the sectors and according to strategic
objectives. Budgetary discipline is undermined
by numerous recurrent overruns, and the
limited use of information technologies
considerably reduces the efficiency of the
financial information system. The budget is
executed manually on a cash accounting basis.
Moreover, the monitoring and programming of
the public investment plan should be improved,
especially with the high increase in public
investments. The ministries lack efficient
internal audit services. However, the
establishment of the Audit Court responsible
for external auditing following the 2011
referendum is a major step towards the
reinforcement of budgetary control and
accountability. The efficiency of the
procurement process is limited by the
inexistence of a legal and institutional
framework, and the use of single tender as a
standard for public procurement.
2.1.9 With Bank support through the
Public Finance Management Support
Project (PAGFP), the Government is
implementing its public finance management
reform programme. Thanks to the project, a
diagnostic study on the management of public
finance in the REG was recently conducted
(Box 2). It will be used as an analytical basis
for deepening reforms and assistance from
partners in the area. Lastly, the performance of
the national statistics system is a major
impediment to the Government’s capacity to
assess the impact of its programmes and the
transition to a results-based management
culture.
Box 2 : Public Finance Management(PFM) Reform
Programme In Equatorial Guinea, the 2003 Law on public finance
management is still used as the public finance legal and
institutional framework. Within the framework of the Public
Finance Management Support Project, an assessment of the
public finance management system was recently conducted
using the PEFA methodology. It shows that the major
challenges in budgetary management concern the use of the
budget as a real tool for implementing public policies and the
lack of skilled human resources. A 2009 World Bank study of
public expenditure had also highlighted these challenges.
2.1.10 Reducing corruption remains a
challenge for the country. Transparency
International’s 2012 Corruption Perception
Index (CPI) ranked Equatorial Guinea 163rd
out
of 176 countries, with a score of 20 on 100
(100 being maximum transparency).
Transparency International pointed out
endemic corruption in the public sector and the
lack of transparency in the oil sector. Under
such circumstances, the Government’s decision
to re-submit its candidature for adhesion to the
Extractive Industries Transparency Initiative
(EITI) and the setting up of the Audit Office are
considered as positive signs of its will to
improve public finance management and
transparency (Box 3).

5
Box 3 : Equatorial Guinea and the Extractive
Industries Transparency Initiative (EITI) The Republic of Equatorial Guinea applied for adhesion to
EITI in 2004. With the help of the World Bank, a national
commission made up of representatives of the Government,
oil companies and civil society was established in May 2005
to implement EITI. In February 2008, the EITI Board
admitted Equatorial Guinea as “candidate country”.
However, Equatorial Guinea was unable to accede to the
status of “compliant country”. The implementation of EITI
was hindered by limited institutional capacity, notably a
disorganized civil society that lacks the technical capacity to
fully participate in the initiative. Also, delays in the
application of transparency rules relating to the production,
marketing and use of oil revenue led in March 2010 to the
rejection of REG’s candidature by the EITI Board. The
country re-submitted its candidature in 2011 but is still not
considered a country implementing the EITI.
Competitiveness and Business Climate
2.1.11 Major infrastructure investments in
recent years have laid the foundation for
stronger growth but the non-oil sector is still
to benefit from this foundation. This situation
can be explained by the persistence of serious
weaknesses that inhibit economic
competitiveness. According to the 20123 Bank
study on the private investment environment in
Equatorial Guinea, the emergence of the non-
oil sector is hampered by the poor business
climate and the scarcity of a skilled labour
force, notably in the sectors identified by the
Government for economic diversification. The
study also revealed that salary costs are
relatively higher compared to neighbouring
countries, particularly those of the Central
African Economic and Monetary Community
(CEMAC). In addition, Heritage Foundation
2009 Index of Economic Freedom showed that
the non-salary costs of recruiting a salaried
employee are higher. The costs related to
infrastructure services are also substantial
owing to the inefficient and complex
procedures, notably those of the customs.
According to the World Bank’s 2013 Doing
Business Report, it takes 29 days to export
goods, against 20 in Gabon and 23 in
Cameroon.
3Private Investment Environment in the Republic of
Equatorial Guinea, Central Africa Regional Department,
AfDB, 2012.
2.1.12 The above-mentioned hindrances
contribute to maintaining Equatorial
Guinea’s competitiveness level below the
regional average despite the huge public
investments undertaken to modernize
infrastructure. They could be an impediment
to the realization of the Government’s ambition
of turning the country into an exporter of value-
added products. Furthermore, very few local
entrepreneurs are willing to bear such costs, the
consequence being that most of them tend to
operate in the informal sector. That is why the
authorities have started to address
competitiveness-related difficulties, notably
through the establishment of a one-stop shop
for investors.
Box 4 : Characteristics of Equatorial Guinea’s Private
Sector
According to sources quoted by the Bank study on the
REG’s private sector environment, about 1 000 companies
are registered at the Chamber of Trade, barely 200 at the
Employers’ Association and 350 at the Ministry of Labour.
These companies can be grouped into four categories: (i)
off-shore oil companies, American, Chinese and South
African for the most part; (ii) foreign construction
companies from France, Italy, Serbia, Morocco, Lebanon,
Egypt and China involved in major public infrastructure
projects; (iii) companies that directly benefit from oil
revenue in the telecommunications, banking and retail
distribution sectors; and (iv) local SMEs and micro-
enterprises that control a small share of the market, mainly
in traditional crop farming (timber, cocoa), port activities,
hotel industry, services and retail imports.
2.1.13 Despite recent progress, the business
climate remains poor. The 2013 Doing
Business Report ranks Equatorial Guinea 162nd
out of 185 countries. With such a result,
Equatorial Guinea occupies a better rank than
Gabon, the Democratic Republic of Congo, the
Republic of Congo and the Central African
Republic, but additional efforts must be made
to improve the country’s position on the
continent. Its regional and world ranking reveal
an unfavourable business climate perception
and serious weaknesses. As highlighted by the
Bank’s study on the private investment
environment in the REG, the major factors
impeding private sector development are: (i)
administrative formalities and the costs of
starting a business; (ii) high labour costs and a
rigid labour legislation; (iii) poor execution of

6
contracts and inadequate legislation to protect
investors’ interests; and (iv) lack of public-
private dialogue. It takes an average of 135
days, costing 98% of per capita income, to set
up a company. Taxation is neither transparent
nor uniformly applied, and customs duties are
high. Inversely, the country has achieved better
results with respect to electricity connection in
2013 thanks to huge investments by the
Government during the last three years (Table
3). The unattractive business climate explains
the small size of the private sector, the
inadequate diversification of the economy and
the high unemployment rate, particularly
among youths. (Box 4).
Table 3 : Ease of Doing Business in 2013 Item Rank
2013
Rank
2012
Improvement
Status
Ease of doing business 162 159 ▼
Starting a business 182 180 ▼
Getting a building permit 107 103 ▼
Electricity connection 86 87 ▲
Transfer of property 103 102 ▼
Getting credit 104 97 ▼
Investment protection 150 147 ▼
Payment of taxes and levies 173 169 ▼
Trading across borders 136 137 ▲
Enforcing contracts 61 59 ▼
Closing a business 185 - Note: ▲indicates improvement; ▼ indicates deterioration, and – indicates no
change.
Source: 2013 World Bank Doing Business Report.
Financial Sector
2.1.14 The financial system remains sound
and liquid, but access to financial services is
a major obstacle for private sector
development. The financial system comprises
four banks, three of which are international
bank subsidiaries. Two new, not yet operational
banks should soon join the market. Bank
portfolio quality is sound as illustrated by
compliance with CEMAC prudential ratios. In
fact, the Central African Banking Commission
(COBAC) has mentioned the good conduct of
banks in Equatorial Guinea in terms of risks
reflected notably in the reduction of the
proportion of doubtful debts to less than 5%
and increased return on assets and equity. On
the contrary, volatility remains a major concern,
reflecting the short-term lending of bank
resources. The sound financial system and the
economy’s substantial financing potential
notwithstanding, access to financing is a
particularly serious obstacle for SMEs4. They
are faced with the lack of long-term loans and
high financing costs, despite the liberalization
of the banking sector. In addition to substantial
loan charges, interest rates paid by private
companies stand at about 15%, whereas the
Central Bank’s bank refinancing cost is about
4%. Furthermore, loans granted are mostly
short term and mainly to construction
companies working in public infrastructure
projects, as banks are unwilling to finance local
companies not involved in government
procurement. Charges paid on external
transactions are high, well above regional
averages. Such low performance explains why
the country’s Doing Business access to credit
indicator ranking has dropped from 97th
in 2012
to 104th
in 2013.
2.1.15 The non-banking financial sector is
not developed. The development of the
insurance sector, made up of three insurance
companies and one reinsurance company, is
hindered by inadequate regulations and
compliance mechanisms. Faced with the near
total absence of micro-finance and the recent
introduction of leasing, most entrepreneurs find
it difficult to secure financing to expand their
activities.
Regional Integration and Trade
2.1.16 Equatorial Guinea is striving to
position itself as a regional electricity
transportation and supply centre. To that
end, the country has greatly improved its port
and airport facilities with a view to becoming a
port and airport hub for regional goods and
passenger transport. The Malabo port, for
example, has been developed to receive 16 m-
draught and 10 000 container loading capacity
vessels. It can serve as stop-over for vessels
from Asia and Europe heading for West and
Central Africa. In the energy sector, the 120
MW Djibloho hydro-electric plant is
4Most multi-national companies involved in the oil and
gas sector receive external financing.

7
operational and the 200 MW Sendjede hydro-
electric plant is expected to be commissioned
by 2015 and generate surplus energy for export
to Cameroon and Gabon. The updating of
national infrastructure and the investment
programme contained in the RISP should
enable the country to make use of the potential
offered by the regional market of more than 135
million people within the Economic
Community of Central African States and its
comparative advantages in the energy and
transport sectors. However, to take advantage
of these opportunities, the country will have to
overcome a number of persistent obstacles and,
most of all, ensure a healthier business climate,
one that gives more assurance to private sector
operators.
2.1.17 Equatorial Guinea has made major
strides towards the consolidation of regional
integration during the past few years. As an
active member of CEMAC whose parliament
was set up in Malabo in 2010, as well as
ECCAS, Equatorial Guinea has promoted
regional initiatives to strengthen economic
relations between member States of the zone. It
has notably carried out reform of its taxation
and customs systems, including tariff reduction
and the elimination of quantitative restrictions.
In particular, REG applies the CEMAC
Customs Code and instruments on the Common
External Tariff (CET) and General Preferential
Tariff (GPT) introduced in 1993. CET
comprises four rates for four categories of
goods: a 5% duty on essential goods, 10% on
capital goods and inputs, 20% on intermediate
goods and 30% on consumer goods.
Nonetheless, efforts are still required with
respect to the free movement of people and
goods, including CEMAC nationals. Moreover,
Equatorial Guinea is striving to speed up and
modernize customs clearance procedures, but
the persistent discretionary application of
legislation and high costs related to inefficient
customs processes remain a major challenge.
Environment and Climate Change
2.1.18 Although Equatorial Guinea is still to
complete its climate change adaptation
strategy, it participates in all international
discussions on the issue. As a member of the
Global Gas Flaring Reduction Initiative
(GGFR), REG has considerably reduced its
greenhouse gas emissions, notably in the Alba
off-shore oil field, thanks to the implementation
of a gas deposit management plan to eliminate
flaring.
2.1.19 Equatorial Guinea has adopted a
modern legal framework for protected areas,
forestry, fishery and biodiversity regulation,
but its implementation remains a challenge.
REG shares the Congo Basin forest. The
country has 13 protected areas (20% of the
national territory), but its surveillance capacity
is limited. The public has limited access to
environmental information and data. To
reinforce the country’s climate change
resilience, the Government took a number of
measures in 2011, particularly: (i) public
investment projects now include large-scale
environmental impact assessments; (ii) the
national biodiversity strategy and action plan
are being implemented; (iii) the number of
forest exploitation concessions has been
reduced; and (iv) the completion of the 120
MW Djibloho hydro-electric plant is a step
towards clean energy development.
Social Context
Poverty and Social Inclusion
2.1.20 Human development improvement
remains a major challenge despite a
relatively small population and a high GDP
per capita. The most recent estimates show
that three quarters of the population live on an
income of less than USD 2 a day. The most
affected categories are those of the 15 to 24 age
group, unmarried women and large single-
parent families with at least six children. These
categories make up 79% of households and
89% of the population. In addition, Equatorial
Guinea’s human development index has
dropped, with the country moving from 115th
out of 176 countries in 2008 to 136th
out of 187
countries in 2012.

8
2.1.21 Only one of the eight Millennium
Development Goals (MDGs) could be
achieved by 2015. According to the most
recent MDG report published in 2009,
Equatorial Guinea is about to achieve Universal
Primary Education by 2015, with a 76% net
primary enrolment ratio, while the literacy rate
stood at 89%. However, the low school
completion rate, estimated at 50%, shows that
the quality of education remains a concern.
Nineteen per cent (19%) of under-five children
suffer from malnutrition. According to
UNICEF, the under-five mortality rate, which
was 93 deaths per 1 000 live births, and
maternal mortality rate of 280 deaths per 100
000 live births, were above regional averages in
2010. Endemic diseases such as HIV/AIDS and
tuberculosis are a cause for concern, with a
prevalence rate of 3.4% and 135 per 100 000,
respectively. The Government has set up a
programme for free distribution of anti-
retroviral drugs. Significant improvement of
social indicators, notably in the health and
education sectors, is a major challenge and will
require sustained growth and substantial
improvement in public service provision
efficiency and financing.
Health
2.1.22 Communicable diseases remain a
major public health problem in Equatorial
Guinea. According to the World Health
Organization, 85% of medical consultations are
related to communicable diseases, particularly
malaria, severe respiratory infections and
diarrhoea. These diseases are the main cause of
death among under-five children, 19% of whom
suffer from malnutrition and only 76% enjoy
regular immunization coverage. To improve the
health sector’s performance, the country has set
up basic services, but the results achieved are
moderate due particularly to insufficient human
resources.
2.1.23 The health sector’s weak human and
institutional capacity is an impediment to
economic and social transformation, despite
the improvements made. Progress made
during the past five years concerned: (i) the
construction and modernization of health care
infrastructure; (ii) the expansion of
immunization coverage and the preparation of a
road map for maternal mortality rate reduction;
and (iii) the implementation in 2011 of a
malaria control strategy. However, there are
still many challenges, notably the lack of
skilled human resources, the low rate of
implementation of national health programmes
and the weaknesses of the health and statistical
information system. Although the public health
care budget has increased in recent few years, it
is still well below the African Union’s 11%
target. Furthermore, budgetary resource
allocation is inequitable and inefficient, giving
preference to service provision in urban
hospitals rather than preventive primary health
care, particularly in rural areas. The Bank
contributes to the development of the sector
through its participation in the financing of the
country’s first Demographic and Health Survey
(DHS) and in the Project for the Development
of Health Services (PDSS) which lays emphasis
on strengthening human resources and the
establishment of a health care information
system. The continued implementation of the
PDSS will help to consolidate these
achievements.
Education
2.1.24 Equatorial Guinea has made progress
in the education sector in recent years. An
illiteracy reduction strategy was launched while
pre-school education is now compulsory and
the basic structure of the teaching programme is
being modernized. At the secondary school
level, Government’s action programme was
finalized, thereby increasing education offer.
Lastly, an in-depth reform of vocational
training is currently being carried out through
the implementation of new projects in the area
and revision of the teaching programme to
adapt it to labour market needs.
2.1.25 Such progress notwithstanding,
many weaknesses must be remedied at all
levels of education. In basic education,
although the gross primary enrolment ratio

9
increased to 97% in 2011, the repeater rate is
still high at 20%, while only half of the pupils
completed the primary cycle in 2011. The
secondary school enrolment rate is 31% (40%
for boys and 23% for girls). At the higher
education level, the enrolment rate is below
10%. Despite increased enrolment at the
University of Equatorial Guinea during the past
few years, the student population is low. Only
5% of the State budget is allocated to
education, the greatest part of which is
earmarked for the financing of university
studies. Lastly, technical and vocational
education is the poor relation in terms of budget
allocation as it receives only 10% of the
education budget. The sector’s major
challenges are: (i) the lack of reliable statistical
information; (ii) the scarcity of skilled human
resources (teaching and support staff); and (iii)
defective teaching infrastructure, notably in
technical and vocational training schools, as
well as in vocational and technical training
centres and teaching laboratories. The Bank
contributes to reducing these constraints,
particularly with respect to financing the
Middle and Senior Management Training
Programme.
Youth Employment
2.1.26 The absorption of the 25 000 to
50 0005 youths who were supposed to join
the labour market each year between 2010
and 2020 is one of Equatorial Guinea’s
major challenges. About 60% of the
population are below 25 years of age. However,
employment opportunities are very limited
owing notably to the small size of the non-oil
sector and the fact that the dominant oil sector
absorbs only 4% of the active population. This
highlights the need to diversify the economy to
create sustainable jobs. Besides, most of the
youths are not skilled, do not fulfil the criteria
for entry into the labour market and lack access
to information on employment opportunities.
Technical and vocational education is suffering
5 Source: World Bank. The bracket is derived from the
difference in UNFPA and Government demographic data
estimates.
from dysfunctions at several levels, notably
insufficient suitable training programmes to
meet the needs of the market and shortage of
pedagogical tools. Consequently, the State
authorizes the entry of foreign workers into the
country and encourages the setting up of
specialized training centres within major
companies. The Government is also focusing
efforts on the training of middle and senior
management to offset the current gaps and
increase youth school-to-work transition
capacity. To back these efforts, a training
programme co-financed by the Bank is being
implemented, thanks to which the General
Directorate of Vocational Training was
established in 2012 (Box 5). The acceleration of
that programme within the framework of this
CSP will contribute to overcoming one of the
major constraints to economic transformation
and reduction of youth unemployment.
Box 5: Vocational Training Reform
• Technical and vocational training in Equatorial Guinea is
not developed. The private sector, which recently made
inroads into the niche, offers training based mostly on
business management.
•Vocational training reform seeks to: (i) modernize training
and equipment; (ii) build capacity and management
methods; and (iii) expand and diversify training
opportunities.
Gender Issue
2.1.27 Despite equal rights and
opportunities guaranteed by national law,
women are still disadvantaged in terms of
access to economic opportunities and
decision-making. Gender equality is enshrined
in Equatorial Guinea’s Constitution and the
country has ratified the Convention on the
Elimination of All Forms of Discrimination
Against Women (CEDAW). However, much
remains to be done as attested to by the low
representation of women in decision-making
bodies. In 2011, women made up only 10% of
ministers and 14% of members of Parliament.
Equatorial Guinea has ensured equal access to
primary education, but boys stand almost twice
the chance of attending secondary school than
girls. Women’s low education level does not
allow them to fully enjoy their rights. Although
they have the legal right to do business,

10
economic activity is de facto dominated by
men. Poverty and job insecurity are also higher
among women: two-thirds of people with an
income of less than 2 dollars a day are women
and the unemployment rate among women is
30% against 22% among men. Lastly, there is
no legal discrimination against women with
respect to land ownership or access to bank
loan, but in practice, there is a form of
structural discrimination against them.
2.2 Strategic Options
National Strategic Development Framework
2.2.1 Equatorial Guinea’s long-term
development objectives are the subject of a
consensus between administration officials
and private sector players. These objectives
as outlined in “Vision 2020” and NESDP 2008-
2020 specifically involves diversifying the
economy and transforming Equatorial Guinea
into an emerging economy by 2020 (Box 6).
Box 6: Vision 2020 - Equatorial Guinea’s Long-term
Objectives
• The National Economic and Social Development Plan
(NESDP) 2008-2020 seeks to diversify the economy
beyond oil production.
• NESDP highlights sectors with strong growth potential,
notably energy, fisheries, agriculture, tourism, financial
services, processing and mineral exploitation. It also
stresses the need for improvement in several critical
areas such as governance, corruption and the business
environment.
• The plan is hinged on the following four strategic
objectives: (i) build world-class infrastructure; (ii) build
human capital and improve the quality of life of every
citizen; (iii) diversify the economy through the private
sector; and (iv) institute good governance at the service
of the citizen.
• Its implementation is structured in two phases: (i) Phase
I (2008-2012) lays emphasis on the acceleration of
investments in economic, social and administrative
infrastructure; and (ii) Phase II (2012-2020) focuses on
the development of human capital and the building of
institutional capacity at all levels of public
administration.
2.2.2 The formal assessment of the first
phase of NESDP is hampered by lack of
reliable socio-economic data, but available
information shows moderate outcomes with
respect to its implementation. In 2008, the
Government established the institutional
framework for implementing the said
programme with the creation of:(i) a National
Council chaired by the President of the
Republic; (ii) a National Monitoring and
Evaluation Commission chaired by the Prime
Minister; and (iii) the 2020 Agency for the
Implementation and Monitoring of NESDP and
the Public Investment Programme. However,
no formal assessment of public investment
project implementation outcomes was
published and sector indicators are scarce.
Nonetheless, available information shows that
appreciable outcomes were achieved in the area
of infrastructure, while social achievements
were more moderate.
2.2.3 In conformity with the first phase of
NESDP, the Government focused its efforts
on transport and energy infrastructure
development. The country’s road and
electricity networks were improved, and the
major ports and airports modernized. In
addition, major investments were made to host
international events and improve Equatorial
Guinea’s brand image, notably the 2011
African Union Summit and the 2012 Africa
Cup of Nations. Annex 4 presents a summary
of NESDP achievements.
2.2.4 In contrast, budgetary orientation
during NESDP Phase I was not in favour of
pro-poor expenditure. Social infrastructure
projects were certainly implemented, but they
are still to benefit the poor owing to the
insufficient budgetary resources allocated to
social sectors. Primary social spending peaked
at 14% of the budget in 2010, far from the 20%
target set for 2020 by the Copenhagen Social
Summit. Moreover, the 2009 World Bank
public expenditure review shows that public
expenditure execution, notably in the health and
education sectors, was limited by the poor
public finance management system. Continued
concerted efforts by the Government and
development partners in this area are therefore
essential for significant improvement of basic
public service provision and social indicators.
11
Constraints and Challenges
Poverty, inequalities and youth
unemployment remain high: close to three
out of four persons are poor, and the
contrast between high per capita income
and inequalities is a serious threat to social
stability. The high youth unemployment
rate worsens the poverty problem.
Governance remains a major challenge:
the public sector is inefficient with respect
to both the formulation and implementation
of public policies, and the accomplishment
of its redistribution mission. Corruption is
endemic and attempts to improve
transparency are yet to produce results
despite the will to adhere to EITI.
Transparency in public resource
management is also limited by the absence
of reliable and updated statistics. These
weaknesses also hamper the monitoring of
budget execution and the assessment of the
effectiveness of public policies and their
impact, notably on the poor.
Insufficient human capital is a serious
constraint on the country’s economic and
social transformation: low education level
is a major hindrance not only for private
sector development but also for public
service provision. In addition, endemic
diseases such as HIV/AIDS, tuberculosis
and malaria, continue to be a cause for
concern.
The economy is heavily dependent on oil
and gas: hydrocarbons production accounts
for 77% of GDP. The processing of oil and
gas by-products has developed
considerably, but the sector’s sustainability
is uncertain after the exhaustion of oil
reserves by 2035. This could be a serious
impediment to the financing of the
country’s inclusive development
programme.
The unconducive business climate is a
setback to private investment: overall,
investing in Equatorial Guinea remains a
long and costly process. The unattractive
business environment is a major constraint
on economic transformation.
Strengths and Opportunities
Abundant Natural Resources: apart from
oil and gas, the country has untapped solar
energy and biofuel potential. The fisheries
sector has an enormous potential with the
national maritime territory representing
nine-tenth of Equatorial Guinea’s total
surface area. The country’s fertile lands
could also guarantee food security for the
entire population.
Modern Infrastructure: the country’s
public infrastructure has undergone great
improvements, which have laid the
foundation for sustainable growth beyond
oil production and for private sector
development.
Regional Integration Opportunities:
increased energy production as well as the
availability of new competitive ports offer
the possibility of exploiting the country’s
comparative advantages in trade and
energy.
2.3 Recent Developments in Aid
Coordination
2.3.1 The intervention of development
partners in the country is very limited and
explains the inexistence of a formal aid
harmonization and coordination mechanism.
Thanks to the huge oil revenue that contributes
to the State budget, the Government does not
need to borrow money from outside.
Development partners tend to intervene in
capacity building activities on an ad hoc basis.
In the health sector, the key partners are
USAID, Cuba, UNDP, Spain, France, China,
UNFPA, WHO and AfDB. The Bank is also
one of the major actors in the education sector
alongside Spain and China. The latter also
supports the development of agriculture,
together with FAO. The public finance
management reform programme is backed
12
mainly by France, the Bank and the World
Bank, which provide technical assistance for
the preparation of macro-economic projections
and the national accounting system. In addition,
the World Bank assists the Government in its
request for adhesion to EITI. Lastly, UNFPA,
ILO, the Bank and FAO support the
development of statistics and, to that end, have
prepared a proposal to conduct a combined
household, employment and agricultural
survey. The intervention matrix of partners is
presented in Annex 6.
2.3.2 Given the level of its national
resources, REG does not have a solid official
development assistance coordination
tradition. The country is still to adhere to the
Paris Declaration on Aid Effectiveness.
However, some partners have started to
organize themselves into three working groups
under UNDP coordination: Education (under
UNDP and USAID supervision); HIV/AIDS
(under WHO supervision); and Millennium
Development Goals (under UNDP supervision).
The Bank’s decision to be physically present in
the field will enable it to actively participate in
these working groups. Meanwhile, it is ensuring
close coordination of its activities with UNFPA
in the areas of statistics and health, and with
WHO in activities aimed at reducing the
incidence of communicable diseases.
2.4 Bank Positioning in Equatorial Guinea
Bank Portfolio
Portfolio Composition
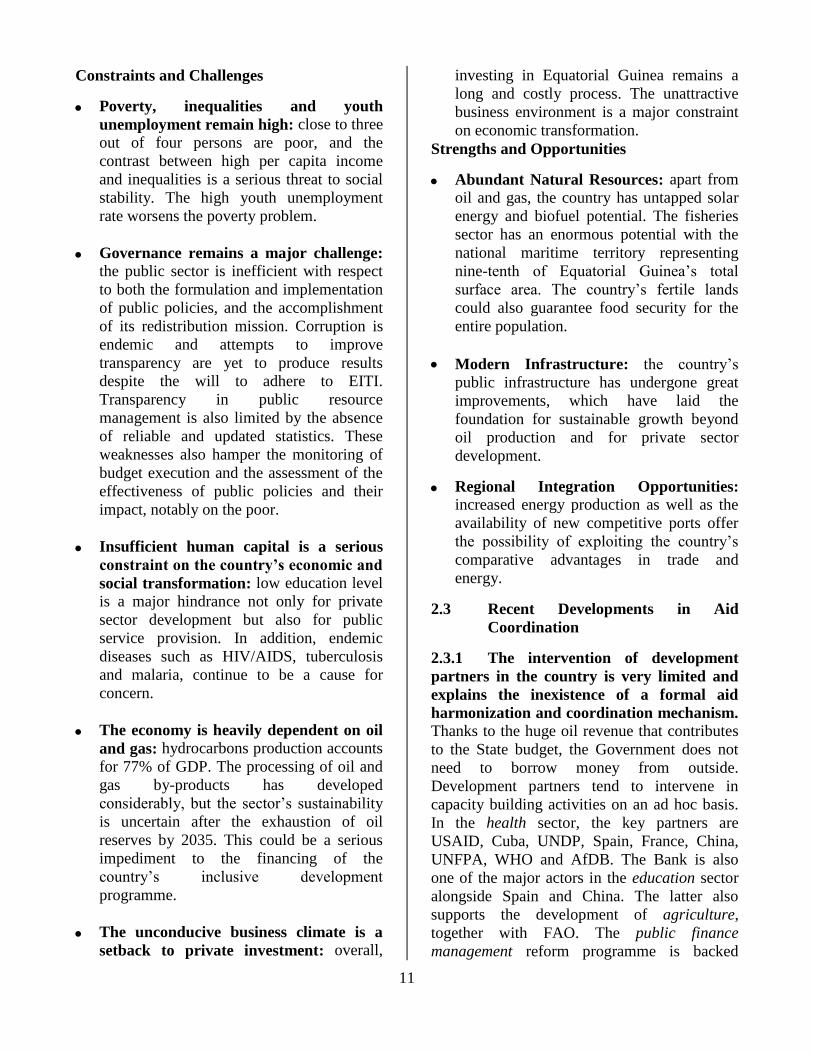
2.4.1 The Bank’s active portfolio comprises
four operations for a total commitment of
UA 64 million. Three investment projects
funded by the public sector window make up
the bulk of the active projects amounting to UA
63.4 million, that is 99.1% of commitments
and an MIC grant of UA 0.4 million. The
portfolio distribution by sector is as follows:
78.2% for the social sector and 21.8% for
governance support (Graph 2). REG is also
beneficiary of a sustainable ecosystems
management project funded by the Congo
Basin Forest Fund (CBFF) to the tune of UA
0.46 million.
Graph 2: Active Portfolio Distribution by Sector
Source: ORCE, AfDB.
Portfolio Performance
2.4.2 The assessment of portfolio
performance in March 2013 shows that it is
unsatisfactory, with a score of 1.83 on 3. As
at end-March 2013, the overall portfolio
disbursement rate, whose average age is 4.3
years, stood at 3.6%. It comprises three risky
projects for a committed amount of UA 49.9
million, representing 77.7% of total
commitments. Such low performance is
characterized by: (i) delays in the fulfilment of
conditions precedent to first disbursement; (ii)
non-compliance with Bank procurement rules
and procedures; (iii) unsatisfactory financial
management of projects; and (iv) delays in the
supply of products. These problems are due to
the project staff’s low capacity and
inexperience in project management, and the
lack of the Bank’s permanent presence in the
field. Box 7 and Annex 7 present a summary of
the performance and lessons from the portfolio
review.
2.4.3 Nevertheless, there have been
improvements in project implementation
since end-2012. Such improvements are largely
due to measures taken by the Bank to ensure
close monitoring following the
recommendations of the CSP mid-term review.
The measures have resulted in a slight
improvement in key portfolio performance
indicators between 2012 and 2013. Moreover,
at Government’s request and to improve project
performance and support the implementation of
the new CSP 2013-2017, the Bank is in the
process of deploying an international expert
(Chief Programmes Office, CPO) in Malabo.
13
Box 7 : Lessons from the 2012 Portfolio Review
• Ensure greater Government involvement in project
preparation. The delays caused by requests for the
modification of project activities and institutional
arrangements could be reduced through greater Government
involvement from the early stages of project design.
• Streamline project disbursement conditions. Reduce these
conditions to the barest minimum and include capacity
building in all Bank projects.
• Take into account financial management weaknesses and
lapses. Close assistance, particularly during the project start-
up phase, is essential to ensure that Bank conditions are
fulfilled and that project execution plans are effectively and
efficiently implemented.
• Strengthen policy dialogue. A more sustained high-level
dialogue is necessary to draw Government’s attention to the
need to focus on public institution building, promotion of
transparency and production of socio-economic data.
Reinforce the Bank’s presence in Equatorial Guinea.
Greater Bank presence in the field is necessary to help the
Government to eliminate bottlenecks and contribute to
capacity building.
Lessons from Implementing the Previous
CSP
2.4.4 CSP 2008-2012 centred on building
the capacity to manage the country’s huge
financial resources as well as institutions and
human capital, in order to create conditions
for economic diversification. That CSP was an
expression of the Government’s desire to
restore cooperation with the Bank. It hinged the
Bank’s assistance on NESDP on two pillars: (i)
capacity building; and (ii) creation of
conditions for economic diversification. To
achieve these strategic objectives, a loan and
grant programme amounting to UA 230 million
was scheduled. Of this total, only UA 64
million was committed, representing less than
30%. Approved operations were in line with
Government priorities as outlined in NESDP
2008-2020.
2.4.5 Overall, the outcomes of the
implementation of the previous strategy
were low, but considerable efforts made by
the Bank are beginning to bear fruit.
Although the previous CSP contributed to
capacity building, most of the expected
outcomes were not achieved owing to
significant delays in the start-up of the
assistance programme meant to back their
achievement. Specifically, lack of political
support, low ownership level and the country’s
limited human and institutional capacity were a
major obstacle to the satisfactory
implementation of CSP 2008-2012 and the
achievement of its strategic objectives.
However, over the period 2010-2012, the Bank
made enormous efforts to give fresh impetus to
dialogue with the authorities, thus helping to
speed up project implementation. Since 2010,
the Bank has undertaken eight missions in
REG, three of which were high-level dialogue
missions. Besides the intensification of
monitoring missions, the Bank financed the
services of a consultant based in Malabo to
back the PIUs in operations implementation.
These measures enabled effective project start-
up and contributed to better inform the
Government on Bank rules and procedures.
They led to a slight improvement in portfolio
performance and renewed Government interest
in Bank assistance.
2.4.6 CSP 2008-2012 should have been
less ambitious and more selective, backed by
enhanced policy dialogue. CSP programming
should have taken sufficient account of national
capacity and given preference to greater
selectivity of sectors of intervention. The small
number of projects approved reflects the
strategy’s overly ambitious approach. Only
three out of the thirteen operations programmed
were submitted to the Board for approval. A
more sustained policy dialogue would also have
contributed to strengthening Government’s
interest in operations proposed by the Bank.
The main lessons from the previous strategy are
presented in Annex 5 and summarized in Box
8. The current CSP builds on these lessons.
Box 8: Lessons from CSP 2008-2012 Implementation
Ensure the selectivity of intervention areas and
simplicity in operations design. Out of 13 public
loans proposed under CSP 2008-2012, only 3 have
been approved, highlighting the difficult environment
for providing development assistance in Equatorial
Guinea.
Intervene in areas where the Bank has
comparative advantage. In particular, avoid
prioritizing the financing of national public
infrastructure projects for which the Government
does not request additional Bank funding.
Design operations in a way that they achieve
14
visible outcomes quickly without compromising
their long-term sustainability. Rapid and tangible
outputs are essential for obtaining Government
adhesion and support for project implementation.
Assess properly the Government’s effective
adherence to the proposed reform programme.
This is particularly important for operations aimed at
promoting transparency, improving public
administration and financial management, and
strengthening the production of socio-economic data.
Explore opportunities for the private sector. The
Government has made significant investments to
develop public infrastructure, thereby laying the
foundation for production activity. The Bank should
intensify its efforts to develop non-sovereign
investments.
Identify risks properly. CSP 2008-2012 did not
identify the following key risks: (i) implementation
risk (weak capacity and/or reluctance to comply with
the Bank’s rules and procedures, particularly at the
start-up of project implementation); and (ii) lack of
ownership risk. Source: Combined CSP 2008-2012 and CPPR 2011 Completion
Report.
III. BANK GROUP STRATEGY FOR
EQUATORIAL GUINEA
3.1 Rationale for Bank Group’s
Intervention
This CSP offers the Bank an
opportunity to revive and strengthen its
cooperation ties with Equatorial Guinea.
Thanks to the Bank’s sustained efforts to
eliminate obstacles to effective portfolio
implementation and to give a fresh impetus to
policy dialogue, its operations are now on track
and have begun to yield visible outputs. These
tangible outputs help to restore the
Government’s confidence, adherence to and
support for the satisfactory implementation of
the Bank Group assistance. Therefore, the
Bank’s continued assistance is essential to take
advantage of the Government’s keen political
interest and the fresh impetus to cooperation
with the country, as well as strengthen
partnership with REG. It will also enable the
Bank to respond to the Government’s request
for support to accelerate its development
programme, which seeks to transform the
economy.
3.2. CSP Strategic Objectives and Pillars
3.2.1 CSP strategic options and objectives
stem from extensive consultations with the
Government and greatly build on lessons
from the previous strategy. The preparation
of the CSP was based on extensive
consultations with all stakeholders. The high-
level dialogue held with the Government since
the CSP 2008-2012 mid-term review led to a
convergence of views between the authorities
and the Bank on the CSP approach and strategic
orientations, particularly the need to emphasize
the implementation of active projects. The 2013-2017 intervention strategy builds on
implementation lessons from the previous CSP,
which recommend that future Bank assistance
should prioritize the completion of on-going
operations and exploration of investment
opportunities, particularly non-sovereign
investments. Lastly, CSP options are guided by
the orientations of the 2013-2022 strategy,
RISP 2011-2015 for Central Africa and the
Strategic Framework for Strengthening Bank
Support to MICs.
3.2.2 The main objective of the Bank’s
intervention strategy is to support REG’s
economic and social transformation.
Specifically, this strategy seeks to contribute to
achieving NESDP’s objective of diversifying
the economy and laying the foundation for
sustainable and inclusive growth driven by the
private sector, through the development of
human capital and the creation of an enabling
environment for business. Poverty and
unemployment remain major concerns despite
REG’s sustained growth and remarkable
financial resources. Thus, within the framework
of on-going operations, the CSP will strengthen
the Bank’s support to the Government's
programme to build capacity in the governance,
health and technical and vocational training
domains, all of which are vital to the promotion
of diversified and inclusive growth.
3.2.3 The CSP is hinged on one pillar,
namely: Promote Human Capital Development
and Capacity Building for Economic
Transformation. This pillar is completely
15
aligned with the priorities of the second phase
of the Government’s development plan. By
supporting human capacity building and the
promotion of an enabling environment for
business, the Bank will contribute to remedying
the weaknesses hindering the country from
taking advantage of its opportunities and
promoting inclusive growth so as to create
sufficient jobs, particularly for youths and
women. The CSP will also contribute to
ensuring the judicious use of public resources
for inclusive development.
3.2.4 In line with lessons from the
previous CSP, this strategy will be more
selective and focused on the accelerated
implementation of on-going operations. This
option helps to ensure continuity with the
previous CSP and to consolidate recent
achievements, while closely aligning with the
country’s development objectives. All on-going
operations on health, education and governance
can significantly impact the country’s
development and remain consistent with
NESDP priorities. This approach, which was
adopted in conjunction with the Government
during the CSP preparation, will help to
consolidate the positive outcomes of on-going
projects, build on the Government’s renewed
confidence and interest, and increase the
chances of success of this strategy. The 2015
mid-term review will provide an opportunity to
examine a supplementary programme of
operations better informed by the findings of
studies in the pipeline. Such studies are also an
important component of the proposed strategy.
3.2.5 The Bank will intensify its efforts to
develop a pipeline of non-sovereign
operations while ensuring the continuity of
on-going operations, in accordance with the
recommendations of the completion report.
Given the significant improvements in the
country’s infrastructure and the need to
diversify the economy, the Bank will explore
avenues to seize any opportunities to invest in
anchor projects that can strengthen the private
sector, the main driver of economic
transformation and job creation. In line with its
private sector strategy and depending on REG’s
investment potential, the Bank will seek out
ways of assisting the Government to create
value chains and sub-contracting opportunities
for local SMEs, in order to broaden the base of
pro-poor growth. This will enable the Bank to
take full advantage of its commitment margin
for the country and produce a significant impact
on development.
3.2.6 In accordance with the operational
priorities of the Regional Integration
Strategy for Central Africa with which the
CSP is aligned, the Bank will support
regional infrastructure projects that are an
integral part of RISP 2011-2015. These
priority regional operations, in which REG has
promised to participate, concern: (i) the Kribi-
Campo (Cameroon) - Bata (Equatorial Guinea)
Road Project; and (ii) the Cameroon-Gabon-
Equatorial Guinea Electrical Grid
Interconnection Project. This support will help
to enhance the substantial investments made in
national infrastructure built by the country.
3.3 Lending and Non-lending Activity
Programme
3.3.1 Given the strategic approach
proposed for this CSP, emphasis will be laid
on the increased use of the country’s
sustainable commitment capacity. The two
main sources of financing for the Bank’s
strategy are the AfDB window for public and
private sector operations, and the Middle
Income Countries Technical Assistance Fund
for non-lending operations. The Bank will also
intensify the use of bilateral and thematic trust
funds to finance economic and sector work that
will be needed for the identification and
preparation of operations to be financed after
the mid-term review.
Lending Programme
3.3.2 This strategy, which builds on
lessons from CSP 2008-2012, will be largely
supported by the existing portfolio. To
guarantee the success of this strategy, CSP
programming will focus on the 2013-2014 period and regional operations in which REG

16
has promised to participate, and the Statistical
Capacity Building Project. This support will be
strengthened by potential investments that
could be financed through the private sector
window. The mid-term review scheduled for
2015 will provide an opportunity to examine
potential operations for the 2015-2017 period.
Table 4 presents on-going operations and the
2013-2014 Indicative Lending Programme.
Table 4: On-going Operations and 2013-2014 Indicative
Lending Programme (in UA million)
Project Name Amount Sector
Pillar: Promote Human Capital Development and Capacity Building
for Economic Transformation
On-going Operations
Health System Development 14 Health
Middle and Senior Management
Training Programme 36 Education
PAGFP 14 Governance
Lending Programme:
2014
Statistical Capacity Building Statistics
Non-lending Activities Programme
3.3.3 The Non-lending Activity
Programme is an important component of
this strategy. It will focus on key studies on
the preparation of potential operations for
the 2015-2017 period and the strengthening
of the Bank’s advisory support. Specifically,
the Economic and Sector Work Programme is
designed to facilitate the continuation and
extension of the Bank’s commitment,
particularly from 2015 (Table 5). In this regard,
the following studies have been proposed:
A study on the identification of value
chains and sub-contracting opportunities
for SMEs;
A study on the private sector profile to
identify specific investment opportunities
for the Bank’s private sector window;
A statistical profile to serve as a basis for
the Statistical Capacity Building Project to
be implemented in 2014;
A study on road and infrastructure
maintenance support to protect major
investments made in this sector.
Table 5: On-going Activities and 2013-2015 Indicative
Non-Lending Programme (in UA million) Project Name Amount Sector
Pillar: Promote Human Capital Development and Capacity Building for Economic Transformation
On-going Activities
MIC Grant to NESDP 0.4 Development Planning
Indicative Non-lending Programme
2013
MIC Grant for Statistical
Profile
0.2 Development Planning
2014
One-stop shop, sectors and subcontracting
opportunities for SMEs
T.D. Private Sector
Private Sector Profile T.D. Private Sector
2015
Study on Road and Infrastructure Maintenance
0.6 Development Planning
N.B.: TD: To be determined.
3.4 Expected Outcomes
The main outcomes of the CSP will
contribute to human capital development
and capacity building, which are vital to
economic transformation. These are mainly
based on-going operations. Through the
creation of vocational training institutions and
the provision of support to provincial
polytechnics and the National University, the
Middle and Senior Management Training
Programme will contribute to the Government’s
priority to improve the skills of the national
labour force with a view to reducing
unemployment. This project will also finance a
study on youth employment to help the
Government to adopt policies and initiate
reforms to improve their skills and
employability, thus increasing their chances of
availing themselves of available economic
opportunities. The Health System Development
Support Project will help to strengthen national
health service delivery and improve human
resource capacity. The Bank’s support under
PAGFP will contribute to: (i) strengthening
budgetary as well as public policy planning,
implementation and monitoring; (ii) improving
public resource utilisation and public service
delivery; (iii) ensuring transparency and
accountability; and (iv) improving the
efficiency of customs procedures. The
assistance provided under the Statistical
Development Project will contribute to building
national statistical capacity, producing and

17
disseminating reliable statistics in real time.
Hence, it will enable the Government to: (i)
better target its operations and adopt informed
investment policies and decisions; and (ii)
assess the impact of its programmes. The
Bank’s support for regional infrastructure will
contribute to private sector development by
reducing transport and transit costs and time,
and increasing intra-regional trade. The
potential operations to be financed by the
private sector window are expected to
contribute to economic diversification and job
creation. The expected outcomes of operations
implemented under this strategy are detailed in
the outcomes matrix in Annex 1.
3.5 Monitoring and Evaluation
The CSP monitoring and evaluation
system will be based on the outcome
indicators of on-going operations and
statistical capacity building provided under
this strategy. It will be supplemented by
annual portfolio reviews. The monitoring of the
strategy will also be strengthened by posting a
Bank expert to Malabo. The Bank will prepare
a mid-term strategy status report in 2015 to
assess progress towards achieving CSP
outcomes and will adjust the strategy and
programme where necessary, including the
relevance of reinforcing them with
complementary operations. A CSP completion
report will be prepared at the end of the strategy
in 2017. The main outcomes and indicators
retained for assessing progress made in CSP
implementation are included in the outcomes
matrix.
3.6 Country Dialogue
3.6.1 Dialogue with the Government will be
sustained further to strengthen the
authorities’ renewed interest in and
adherence to the Bank’s assistance
programme. The high-level missions fielded
and efforts made by the Bank over the last two
years have helped to give a fresh impetus to
policy dialogue with the Government and to
ensure effective project start-up. This has
produced visible results and rekindled the
country’s interest in AfDB’s assistance. These
efforts will be sustained to strengthen the
authorities’ confidence in and adherence to the
Bank’s operations. The Bank will also pursue
dialogue with Equatorial Guinea to strengthen
the common financing mechanism, which
stands at 50% for each party. Concerning the
broadening of reforms, dialogue with the
authorities will focus mainly on the following
aspects:
The sensitization of national authorities on
the need to make progress on the social
front, particularly by increasing budgetary
allocations to the social sectors to improve
the well-being of citizens and ensure
sustainable and inclusive development;
The need to improve the business climate so
as to unleash private sector potential through
greater transparency, better governance and
increased investments in human capital; and
Encouraging the Government to adhere to
EITI.
3.6.2 To improve portfolio performance,
country dialogue will focus on: (i) the
implementation of the Portfolio Performance
Improvement Plan; and (ii) national capacity
building. In addition, the Bank’s decision to
strengthen its presence in the country in order
to respond to repeated requests by the
Government will help to facilitate dialogue with
REG. The Bank has identified an international
expert who will be posted to Malabo, in
accordance with the decentralization roadmap.
3.7 Consultations with Stakeholders
Priority was given to consultations
with stakeholders. To ensure the authorities’
commitment to the programme retained and
consistency with national development
priorities, extensive consultations were held
with the Government, development partners
and representatives of business circles,
particularly local entrepreneurs and female
SME managers. Discussions focused on the
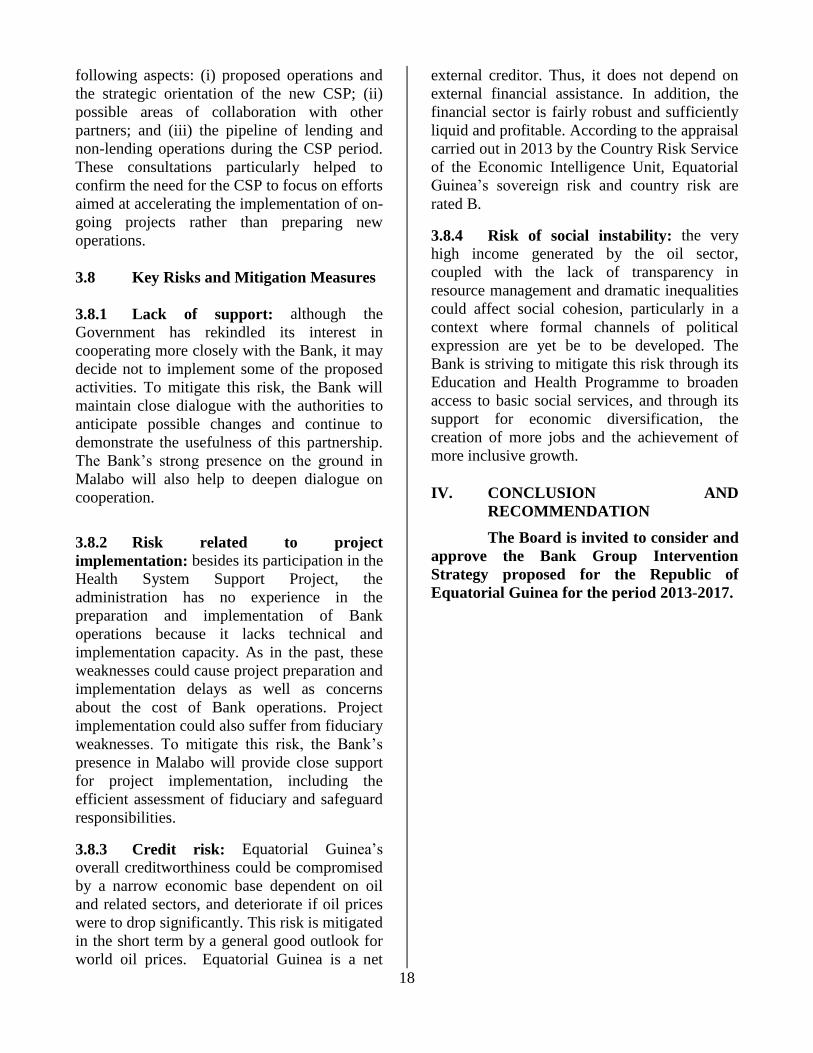
18
following aspects: (i) proposed operations and
the strategic orientation of the new CSP; (ii)
possible areas of collaboration with other
partners; and (iii) the pipeline of lending and
non-lending operations during the CSP period.
These consultations particularly helped to
confirm the need for the CSP to focus on efforts
aimed at accelerating the implementation of on-
going projects rather than preparing new
operations.
3.8 Key Risks and Mitigation Measures
3.8.1 Lack of support: although the
Government has rekindled its interest in
cooperating more closely with the Bank, it may
decide not to implement some of the proposed
activities. To mitigate this risk, the Bank will
maintain close dialogue with the authorities to
anticipate possible changes and continue to
demonstrate the usefulness of this partnership.
The Bank’s strong presence on the ground in
Malabo will also help to deepen dialogue on
cooperation.
3.8.2 Risk related to project
implementation: besides its participation in the
Health System Support Project, the
administration has no experience in the
preparation and implementation of Bank
operations because it lacks technical and
implementation capacity. As in the past, these
weaknesses could cause project preparation and
implementation delays as well as concerns
about the cost of Bank operations. Project
implementation could also suffer from fiduciary
weaknesses. To mitigate this risk, the Bank’s
presence in Malabo will provide close support
for project implementation, including the
efficient assessment of fiduciary and safeguard
responsibilities.
3.8.3 Credit risk: Equatorial Guinea’s
overall creditworthiness could be compromised
by a narrow economic base dependent on oil
and related sectors, and deteriorate if oil prices
were to drop significantly. This risk is mitigated
in the short term by a general good outlook for
world oil prices. Equatorial Guinea is a net
external creditor. Thus, it does not depend on
external financial assistance. In addition, the
financial sector is fairly robust and sufficiently
liquid and profitable. According to the appraisal
carried out in 2013 by the Country Risk Service
of the Economic Intelligence Unit, Equatorial
Guinea’s sovereign risk and country risk are
rated B.
3.8.4 Risk of social instability: the very
high income generated by the oil sector,
coupled with the lack of transparency in
resource management and dramatic inequalities
could affect social cohesion, particularly in a
context where formal channels of political
expression are yet be to be developed. The
Bank is striving to mitigate this risk through its
Education and Health Programme to broaden
access to basic social services, and through its
support for economic diversification, the
creation of more jobs and the achievement of
more inclusive growth.
IV. CONCLUSION AND
RECOMMENDATION
The Board is invited to consider and
approve the Bank Group Intervention
Strategy proposed for the Republic of
Equatorial Guinea for the period 2013-2017.

I
Annex 1
CSP 2013-2017 Outcomes Matrix
1
Government’s
Strategic Objectives
2
Obstacles to the
Achievement of
Expected Outcomes
3
Final Outcome
Indicators (2017)
4
Final Output Indicators
(2017) a/
5
Mid-term Outcome and
Output Indicators
(2017) a / 5
6
Key Actions
(2015) b/
7
Proposed Bank CPS
Operations and On-
going Operations c/
PILLAR: Promote Human Capital Development and Capacity Building for Economic Transformation
Building Human Capital Adapt technical,
vocational and university education to
market needs
(i) The quality of current
training is inadequate (ii) Lack of skilled
human resources
impedes long-term
development
prospects
(i) The number of qualified teachers in secondary
schools increases by 35%
(ii) Five regional
polytechnics (RP) are
completed
(i) At least 80% of project objectives are achieved
(2016)
(ii) Some 30 000 people, at
least 1/3 of them women,
have received skills
training
(i) The number of qualified
teachers in secondary schools increases by
20%
(ii) Reference level: 386
qualified teachers in
secondary schools in
2007/08 (Ministry of Education)
(iii) Two regional
polytechnics (RP) are completed
(iv) Baseline: No. RP in
2011 (v) Training programmes
are prepared using the
skills-based approach (SBA)
(vi) Baseline: No training programme in 2012
(i) At least 25% of project
objectives are achieved (ii) About 1 000 people, at
least 1/3 of them women,
have received skills
training
On-going
Middle and Senior Management Training Programme (UA 36
million)
Build the human and
institutional capacity
of the health sector
Weak human resources
limit the population’s
contribution to national development
The quality of human
resources is improved
About 90% of project
objectives are achieved (2016)
The proportion of skilled
personnel increases by 20%
About 50% of project
objectives are achieved On-going
Health Services Development Project
(UA 14 million)
Strengthen Governance Capacity
Promote healthier and more inclusive
economic growth
through efficient and transparent public
finance management
Simplification of trade procedures
Inadequate inclusion of sector priorities in the
budget
The non-oil private sector
faces major constraints in
international trade
The rates of social sector budget allocation and
execution increase by 6%
and 44% in 2006 and 15% and 80% in 2017,
respectively
Official import and export
procedures have improved
The Action Plan has been implemented successfully
Evidence required: Letter from
the Minister of Finance
The time required to import
and export goods has reduced
from 44 day to 29 days in 2012 and from 30 days to 20 days in
2017, respectively
The rates of social sector budget allocation and
execution reach 10% of the
overall public budget
Simplification of operational
procedures
The PEFA-type diagnostic study, including its reform
action plan, is completed
(validated by the relevant Government authorities)
The time required to import
and export goods has reduced
from 44 days to 29 days in 2012 and from 30 days to 20
days in 2017, respectively
Baseline: Doing Business indicators
On-going
Public Finance
Management Support (UA 14 million)

II
1
Government’s
Strategic Objectives
2
Obstacles to the
Achievement of
Expected Outcomes
3
Final Outcome
Indicators (2017)
4
Final Output Indicators
(2017) a/
5
Mid-term Outcome and
Output Indicators
(2017) a / 5
6
Key Actions
(2015) b/
7
Proposed Bank CPS
Operations and On-
going Operations c/ Establish an efficient
national statistical
system
The weak capacity of the
statistical system distorts
financial and natural resource forecasts and
estimates, and impedes the
development planning process
An efficient national
statistical system, including
gender-disaggregated data, is established
The Central Statistics Office is
established and is operational
(2016)
The formulation of the
National Statistical
Development Strategy (NSDS) is completed. The
implementation of the
NSDS, particularly the training of the officials of
the various entities involved
in the production of statistics, has been launched.
The regulatory and legal
framework for the
establishment of an independent Central
Statistical Office is finalized
and approved by the Government
Proposal
Statistical Profile (MIC Grant: UA 0.20 million)
Statistical Capacity Building Project (UA 11
million)

III
Annex 2
Active Projects in Equatorial Guinea as at 31 March 2013 (UA million)
Sector Project Name Abbrev. Approval Date Effectiveness
Date Closing Date
Net Amount
Approved
Amount
Disbur. % Disbur.
Source of
Financing
Social
Middle and Senior
Management Training
Programme (PFCMS)
PFCMS 11 Dec. 2008 23 Sept. 2010 31 Dec. 2014 36.01 0.40 1.12% [ADB]
Social
Health System
Development Support
Project (PADSS)
PADSS 29 Oct. 2008 2 April 2010 31 Dec. 2014 13.86 1.73 12.47% [ADB]
Multi-sector
Public Finance
Management Support
Project (PAGFP)
PAGFP 25 Nov. 2008 10 Aug. 2010 31 Dec. 2013 13.51 0.14 1.05% [ADB]
Multi-sector
Support for the
Implementation of the
National Economic and
Social Development Plan
(NESDP)
NESDP 10 April 2009 10 April 2009 30 June 2014 0.396 - 0.00% TAF-MIC
Total effective operations 63.77 2.28 3.58%
Environment
Sustainable Management
of Ecosystems of High
Socio-Economic Value of
the Rio Camp Nature
Reserve
Rio Camp 16 Dec. 2011 23 Feb. 2012 31 Dec. 2015 0.46 0.08 18.01% [CBFF]
Source: ORCE quarterly report as at 10 April 2013.
Note: 1/The initial amount was approved in EUR.
IV
Annex 3
Linkages Between NESDP 2008-2020 and CSP 2013-2017
NESDP 2008-2020 CSP 2013-2017
Strategic Objective Objective Pillar Proposed and On-going Projects
Build a diversified
economy driven by
the private sector
Promote private sector
development, regional
integration and key
high-potential sectors
such as tourism,
financial services,
agriculture and fisheries
Pillar I: Promote
Human Capital
Development and
Capacity Building
for Economic
Transformation
Middle and Senior Management
Training Programme
Build human capital
and improve the
quality of life of
every citizen
Improve access to
education and health
services, promote
vocational training and
gender equality.
Improve infrastructure
and social services and
establish a new social
security system
Health Services Development
Project
Institute good
governance at the
service of every
citizen
Improve public
administration and
economic planning, the
rule of law, national
security, the
participation of civil
society and local
authorities
Public Finance Management
Support Project (PAGFP)
Build world class
infrastructure
Improve transport
infrastructure, the
generation of and access
to energy, the provision
of public services and
access to IT
Statistical Capacity Building
Project
Road and Infrastructure
Maintenance Project/Study

V
Annex 4
Progress Towards NESDP Implementation
Build World Class Infrastructure
The Djibloho hydro-electric plant went operational in 2011. The power transmission
grid was modernized and extended to high-energy zones (2010-2011). Subsidized
programmes helped to improve energy distribution to some disadvantaged zones (2009-
2011).
The optical fibre link between Malabo and Bata has been completed (2011).
The main regional roads have been completed (2008-2012). The Malabo Airport
highway has been completed (2010).
The Malabo and Anabon Airports have been completed (2008-2010). The Bata airport
has been modernized (2010). The ports of Malabo and Bata have virtually been
completed (2010-2012).
Build Human Capital and Improve the Quality of Life of Every Citizen
Two new vocational training schools have been built in Bata and Malabo (2010-2012).
The Health Facilities Improvement Programme has been completed (2010). Two modern
hospitals have been built and are operational in Bata and Malabo (2008-2011).
The first phase of the Urban and Rural Water Supply Programme has been completed
(2010).
More than 20 000 social housing units have been built in Malabo (2009-2011).
The Government has adopted the legal mechanism applicable to protected areas (2011).
Build a Diversified Economy Driven by the Private Sector
The credit risk guarantee system to reduce the cost of lending to SMEs has been
established (2012).
The Industrial Fishing Promotion Programme has been launched (2012).
Institute Good Governance at the Service of Every Citizen
The Audit Court has been established (2012).
The technical unit in charge of steering public sector reforms has been established
(2011).
Efforts have been made to revive EITI (2011-2012).
Main On-going Reforms
Completion of the second phase of NESDP (acceleration phase).
Completion of the Climate Change Adaptation Strategy. Source: Ministry of Planning, Economic Development and Public Investment

VI
Annex 5
Summary of the Combined CSP 2008-2012 and CPPR 2011
Completion Report
1. The Country Strategy Paper (CSP), which is based on the 2008-2012 outcomes (approved in
October 2008), underpins the National Economic and Social Development Plan (NESDP) 2008-2020.
Its objective is to diversify and restructure the economy to make the country an emerging economy by
2020. To support NESDP, the CSP 2008-2012 consists of two pillars, namely Pillar I – Capacity
Building comprising four public sector projects, and Pillar II – Creation of Enabling Conditions for
Economic Diversification comprising three public sector projects. A mid-term review was approved in
December 2010. During the period under review, Equatorial Guinea’s economy was hard hit by the
2009 economic crisis, highlighting the need for the country to redouble its diversification efforts.
2. Equatorial Guinea has made significant progress in developing transport and energy
infrastructure without the Bank’s support. However, pro-poor spending remains limited while poverty
and inequality are rife. The road and electricity networks were significantly improved during NESDP
Phase I. Major social infrastructure projects have been completed but do not yet benefit the poor (77%
of the population).
3. CSP 2008-2012 has not succeeded in arousing sufficient interest on the part of the
Government. Although it is consistent with NESDP, CSP 2008-2012 was based on an approach which,
given the country’s context, was not efficient enough to engage Government's attention, hence the
small number of projects approved and implemented.
4. CSP 2008-2012 was too ambitious and not sufficiently selective. The low proportion of
projects that have reached the approval stage reflects the overly ambitious approach of the strategy and
its inability to focus on priority areas where the Government had requested the Bank’s assistance. A
more sustained policy dialogue would have helped to rekindle the Government's interest in operations
proposed by the Bank.
5. Portfolio performance has been hampered by weak capacity. The weak capacity of the
Government and its poor mastery of the Bank’s rules and procedures were not considered during the
design of operations. Project implementation benefitted from the missions and assistance of consultants
of the Bank; delays could have been reduced if the Bank had been more present on the ground.
6. The report recommends that the completion of on-going projects and more sustained policy
dialogue as well as the exploration of private sector activities should be the priority targets for future
assistance. Despite start-up delays, all the three on-going projects are of great political interest and are
operational. The Bank should take advantage of the reports prepared and the political interest secured,
and continue to strengthen cooperation through these projects. It must also engage in a more sustained
dialogue to win the Government’s confidence and raise its awareness on the importance of reforms,
particularly in terms of transparency, public institution building and socio-economic data. Lastly, given
the country’s remarkable infrastructure and the need to diversify the economy, activities that can
strengthen the private sector should be pursued.

VII
Annex 6
Intervention Sectors of Equatorial Guinea’s Development Partners
Source: Interviews and information provided by donors.
Donor Period Intervention Sector Amount
(in million)
Health
UNICEF/WHO 2006-08
HIV/AIDS control/Adolescent health support
USD 4.4 Maternal health/Nutrition/EPI support/Improvement of immunization
coverage
Development of children's rights/Protection and alliance policy
World Bank 2005-10 Sensitization through annual campaigns; promotion of sex education
USD 9 HIV/AIDS prevention; promotion of antiretroviral treatment
Marathon 2005-09 Malaria control USD 7
Cuba 2009-13 Deployment of doctors in rural areas n.a.
AfDB 2008-13 Health service support and demographic survey UA 14
Education
Spain
Educational System Reform Support Project - Prepare and adapt the content
of the baccalaureate syllabus EUR 0.8
Project to Strengthen Public Education - primary, secondary and vocational
training EUR 3
Support provided by the Spanish Cooperation Agency to schools in Malabo
and Bata and the University Development Programme EUR 1.5
Permanent Capacity Building and Teacher Retention Programme EUR 0.8
France
Support for the dissemination of French EUR 0.8
French Cultural Centre Media Development Support Project n.a.
University Cooperation n.a.
Amerada HESS Programme for the Development of Education in Equatorial Guinea
(PRODEGE)
USD 40
AfDB 2008-13 Public Service Middle and Senior Management Staff Training Programme UA 36
Public Sector Development and Governance
European Commission Support for human rights and the rule of law EUR 7.3
Good Governance Programme
Spain
Technical assistance for the implementation of the poverty reduction
strategy EUR 0.75
Technical assistance to support the Ministries of Public Service, the Interior
and Local Governments, and the Economy n.a.
France Support to economic and financial services (PAAFIE) EUR 0.5
World Bank (Technical
Assistance)
Implementation of the EITI initiative USD 0.9
Public expenditure review n.a.
Build the capacity of the General Directorate of Statistics to prepare national
accounts and consumer price indexes
n.a.
IMF (TA) National accounts and the adoption a macro-economic model n.a.
UNDP Study on public administration reform and streamlining of operational
procedures to attract private investment
n.a.
AFRITAC Support for the improvement of budgetary classifications and the monitoring
of expenditure commitments
n.a.
AfDB 2008-13 PAGFP and MIC / TAC to support NESDP implementation UA 14.5

VIII
Annex 7
March 2013 Updated Review of 2012 Portfolio Performance
Indicators
Middle and Senior
Management
Training Programme
(PFCMS)
Health System
Development Support
Project (PADSS)
Public Finance
Management Support
Project (PAGFP)
Support for the
Implementation of the
National Economic and
Social Development Plan
(NESDP)
REG - Global
P-GQ-IAE-001 P-GQ-IBE-002 P-GQ-K00-003 P-GQ-K00-004 April 2013 Jan. 2012
Last supervision 10 April 2013 14 January 2013 18 March 2013 23 September 2012
A. Compliance with conditions 2.00 2.00 1.00 2.00 1.75 1.75
B. Procurement performance 2.00 2.00 2.00 1.00 1.75 1.83
C. Financial management
performance 1.60 3.00 2.00 1.40 2.00 2.01
D. Activities and outputs 2.25 2.50 2.50 1.00 2.06 1.50
E. Impact on development 1.50 3.00 2.00 2.00 2.13 2.06
F. Aggregate rating 1.82 2.55 1.90 1.69 1.99 1.83
STATUS
Implementation Progress (IP) 1.93 2.42 1.92 1.36 1.91
Development Objectives (DO) 1.50 3.00 2.00 2.00 2.13
Overall status PPP NON-PP/NON-PPP PPP PP 1 PP and 2
PPP 1 PP
Rating:
Highly satisfactory performance (3)
Satisfactory performance (2-3)
Unsatisfactory performance (1-2)
Highly unsatisfactory performance (0-
1)
Source: ORCE – 10 April 2013

IX
Annex 8
Key Economic and Financial Indicators
Indicators Unit 2000 2007 2008 2009 2010 2011 2012 (e)
National Accounts GNI at Current Market Prices USD million 661 6,240 9,544 11,381 9,610 10,472 ... GNI per Capita USD 1,270 9,690 14,410 16,710 13,720 14,540 ... GDP at Current Prices USD million 1,243 12,585 18,464 12,166 14,407 19,607 24,070 GDP at 2000 Constant Prices USD million 1,243 5,330 5,899 6,171 6,139 6,612 6,976 Real GDP Growth % 8.2 21.4 10.7 4.6 -0.5 7.7 5.5 Real GDP Growth per Capita % ... ... ... ... ... ... ... Gross Domestic Investment % of GDP 58.7 50.8 19.1 69.2 74.2 43.6 33.4 Public Investment % of GDP 5.2 35.0 6.8 52.7 52.0 30.5 22.1 Private Investment % of GDP 53.5 15.7 12.3 16.5 22.3 13.1 11.2 National Savings % of GDP 45.2 38.6 26.7 40.7 34.1 29.5 28.7
Prices and Currency Inflation (CPI) % 4.6 5.5 6.0 6.0 5.6 4.8 4.5 Exchange Rate (Annual Average Local currency /USD 712.0 479.3 447.8 472.2 495.3 471.9 510.5 Money Supply, Annual Change (M2) % ... ... ... ... ... ... ... Velocity (GDP / M2) % 5.4 7.5 7.1 12.1 14.5 11.9 ...
Public Finance Total Revenue and Grants % of GDP 19.6 38.3 37.0 45.5 30.2 30.8 31.6 Total Expenditure and Net Lending % of GDP 11.5 20.5 21.3 49.3 35.3 29.9 25.6 Overall Deficit (-) / Surplus (+) % of GDP 8.1 17.8 15.7 -3.8 -5.1 0.9 6.0
External Sector Exports Volume Growth (Goods) % -23.2 11.6 3.9 -8.5 -6.9 6.2 4.9 Imports Volume Growth (Goods)
% -9.6 3.5 110.0 42.8 -28.7 1.4 29.9 Terms of Trade Growth % 71.5 -2.1 38.6 -20.2 -9.1 11.9 39.5 Current Account Balance USD million -196 501 -424 -2,151 -2,947 -1,173 837 External Reserves % of GDP -15.8 4.0 -2.3 -17.7 -20.5 -6.0 3.5 International Reserves month of imports 0.3 12.1 7.7 5.3 3.7 3.9 5.1
Debt and Financial Flows Debt Service % of exports 0.8 0.4 0.1 0.2 0.3 0.3 1.7 Total External Debt % of GDP 34.4 1.1 0.7 5.1 5.0 6.8 7.8 Net Total Financial Flows USD million 22 -207 -984 428 91 -78 ... Net Official Development Assistance USD million 21 31 32 31 85 24 ... Net Foreign Direct Investment USD million 154 1,243 -794 1,636 1,369 737 ...
Source: AfDB Statistics Department; IMF: Global Economic Outlook, October 2012 and International Financial Statistics, October 2012; Statistics Department: Data Platform (database), March 2013; OECD, Statistics Systems Division Notes: … Not Applicable ' (e) Estimates Last Update: March 2013
-10.0 0.0
10.0 20.0 30.0 40.0 50.0 60.0 70.0 80.0
2000 2001 2002 2003 2004 2005 2006 2007 2008 2009 2010 2011 2012
%
Real GDP Growth Rate, 2000-2012
-4.0 -2.0 0.0 2.0 4.0 6.0 8.0
10.0
2000 2001 2002 2003 2004 2005 2006 2007 2008 2009 2010 2011 2012
Inflation (CPI), 2000–2012
-50.0 -40.0 -30.0 -20.0 -10.0
0.0 10.0 20.0
2000 2001 2002 2003 2004 2005 2006 2007 2008 2009 2010 2011 2012
Current Account Balance as % of GDP, 2000 – 2012

X
Annex 9
Progress Towards Achieving the MDGs
Year Equatorial
Guinea
Africa Developing
Countries
Developed Countries
Basic Indicators
Area ('000 Km²) 2011 28 30,323 98,458 35,811 Total Population (million) 2012 0.7 1,070.1 5,807.6 1,244.6 Urban Population (% of Total) 2012 40.2 40.8 46.0 75.7 Population Density (per Km²) 2012 25.7 34.5 70.0 23.4 GNI per Capita (USD) 2011 14 540 1 609 ... ... Labour Force Participation - Total (%) 2012 51.3 37.8 68.7 71.7 Labour Force Participation – Female (%) 2012 44.7 42.5 39.1 43.9 Gender-Related Development Index Value 2007 0.700 0.502 0.694 0.911 Human Development Index (Rank among 186 Countries) 2012 136 ... ... ... Population Living Below USD 1.25 a Day (% of Population) 2011 ... ... 22.4 ...
Demographic Indicators
Population Growth Rate – Total (%) 2012 2.8 2.3 1.3 0.3 Population growth Rate - Urban (%) 2012 3.4 3.4 2.3 0.7 Population < 15 years (%) 2012 39.0 40.0 28.5 16.6 Population >= 65 years (%) 2012 2.8 3.6 6.0 16.5 Dependency Ratio (%) 2012 72.0 77.3 52.5 49.3 Sex Ratio (per 100 females) 2012 105.0 100.0 103.4 94.7 Female Population 15-49 years (% of Total Population) 2012 23.5 49.8 53.2 45.5 Life Expectancy at Birth – Total (years) 2012 51.4 58.1 67.3 77.9 Life Expectancy at Birth- Female (years) 2012 52.8 59.1 69.2 81.2 Crude Birth Rate (per 1000) 2012 36.1 33.3 20.9 11.4 Crude Death Rate (per 1000) 2012 14.2 10.9 7.8 10.1 Infant Mortality Rate (per 1000) 2012 94.3 71.4 46.4 6.0 Under-five Mortality Rate (per 1000) 2012 152.3 111.3 66.7 7.8 Total Fertility Rate (per Woman) 2012 5.0 4.2 2.6 1.7 Maternal Mortality Rate (per 100000) 2010 240.0 417.8 230.0 13.7 Women Using Contraception (%) 2012 21.0 31.6 62.4 71.4
Health and Nutrition Indicators Physicians (per 100000 people) 2004-2010 30.0 49.2 112.2 276.2 Nurses (per 100000 people) 2004 53.0 ... 187.6 730.7 Births Attended by Trained Health Personnel (%) 2000-2010 64.6 ... 65.4 ... Access to Safe Water (% of Population) 2006 51.0 67.3 86.4 99.5 Access to Health Services (% of Population) 2000 ... 65.2 80.0 100.0 Access to Sanitation (% of Population) 2006 89.0 39.8 56.2 99.9 Percent. of Adults (aged 15-49) Living with HIV/AIDS 2009-2011 5.0 4.6 0.9 0.4 Incidence of Tuberculosis (per 100000) 2011 202.0 234.6 146.0 14.0 Child Immunization Against Tuberculosis (%) 2011 73.0 81.6 83.9 95.4 Child Immunization Against Measles (%) 2011 51.0 76.5 83.7 93.0 Underweight Children (% of children under 5 years) 2004-2011 10.6 19.8 17.4 1.7 Daily Calorie Intake per Capita 2009 ... 2 481 2 675 3 285 Public Expenditure on Health (as % of GDP) 2010 3.4 5.9 2.9 8.2
Education Indicators Gross Enrolment Ratio (%) Primary - Total 2010-2012 87.0 101.9 103.1 106.6 Primary - Female 2010-2012 86.0 98.4 105.1 102.8 Secondary - Total 2002-2012 27.5 42.3 66.3 101.5 Secondary - Female 2002-2012 20.1 38.5 65.0 101.4 Primary School Female Teaching Staff (% of Total) 2011 40.1 43.2 58.6 80.0 Adult Literacy Rate - Total (%) 2010 93.9 67.0 80.8 98.3 Adult Literacy Rate – Male (%) 2010 97.1 75.8 86.4 98.7 Adult Literacy Rate - Female (%) 2010 90.6 58.4 75.5 97.9 Percentage of GDP Spent on Education 2003-2009 0.6 5.3 3.9 5.2
Environmental Indicators Arable Land (as % Total Land Area) 2009 4.7 7.6 10.7 10.8 Annual Rate of Deforestation (%) 2000-2009 0.6 0.6 0.4 -0.2 Forests (as % of Land Area) 2010 58.0 23.0 28.7 40.4 Per Capita CO2 Emissions (metric tons) 2009 7.1 1.2 3.1 11.4
Source: AfDB Statistics Department; last update: March 2013 World Bank WDI ; UNAIDS; UNSD; WHO, UNICEF, WRI, UNDP, Country Reports.
Notes: n.a. Not Applicable; … : Data Applicable
0 20 40 60 80
100 120
2004 2005 2006 2007 2008 2009 2010 2011 2012
Infant Mortality Rate (Per 1000)
Equatorial Guinea Africa
0.0 0.5 1.0 1.5 2.0 2.5 3.0 3.5
2004 2005 2006 2007 2008 2009 2010 2011 2012
Population Growth Rate (%)
Equatorial Guinea Africa
1 11 21 31 41 51 61 71
2004 2005 2006 2007 2008 2009 2010 2011 2012
Life Expectancy at Birth (years)
Equatorial Guinea Africa
0 2000 4000 6000 8000
10000 12000 14000 16000 18000
2003 2004 2005 2006 2007 2008 2009 2010 2011
GNI per Capita USD
Equatorial Guinea Africa
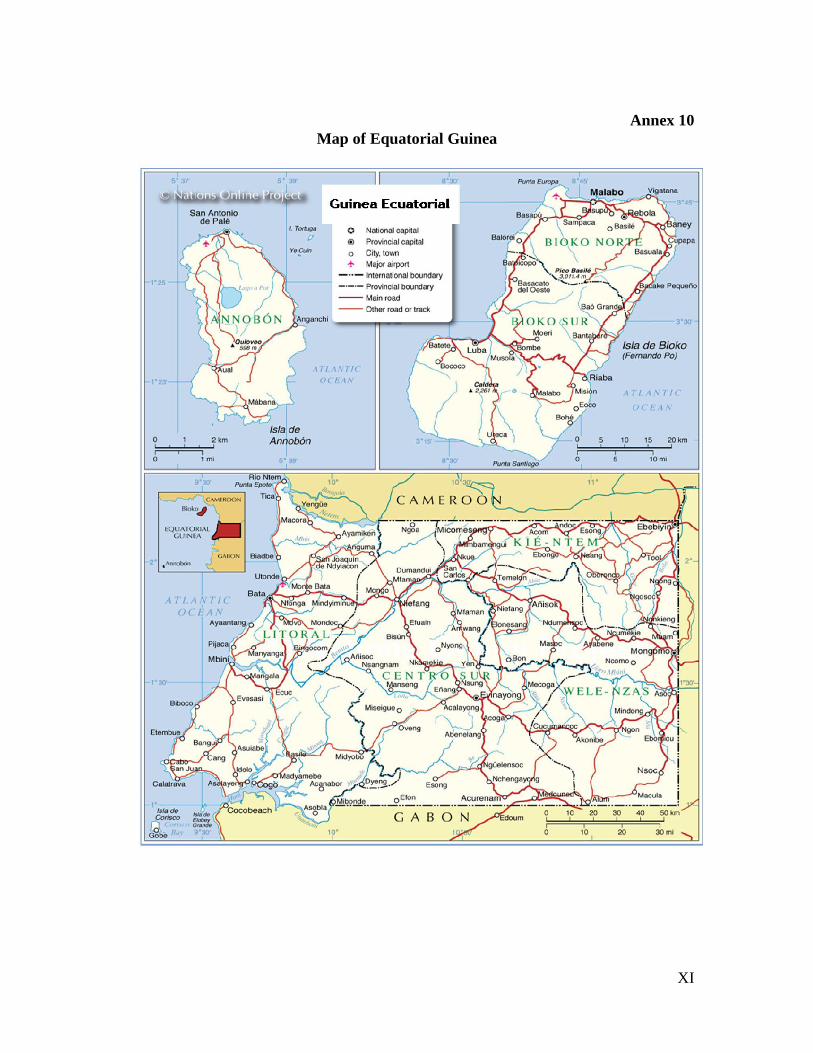
XI
Annex 10
Map of Equatorial Guinea