Equations for Estimating Synthetic Unit-Hydrograph ... · U.S. GEOLOGICAL SURVEY Open-File Report...
54
U.S. GEOLOGICAL SURVEY Open-File Report Equations for Estimating Synthetic Unit-Hydrograph Parameter Values for Small Watersheds in Lake County, Illinois 96–474 Prepared in cooperation with LAKE COUNTY STORMWATER MANAGEMENT COMMISSION
-
Upload
truongkiet -
Category
Documents
-
view
226 -
download
1
Transcript of Equations for Estimating Synthetic Unit-Hydrograph ... · U.S. GEOLOGICAL SURVEY Open-File Report...

U.S. GEOLOGICAL SURVEY
Open-File Report
Equations for Estimating Synthetic Unit-Hydrograph Parameter Values for Small Watersheds in Lake County, Illinois
96–474
Prepared in cooperation withLAKE COUNTY STORMWATER MANAGEMENT COMMISSION

U.S. GEOLOGICAL SURVEY
Open-File Report
Equations for Estimating Synthetic Unit-Hydrograph Parameter Values for Small Watersheds in Lake County, Illinois
By CHARLES S. MELCHING and JASON S. MARQUARDT
Urbana, Illinois1997
96-474
Prepared in cooperation withLAKE COUNTY STORMWATER MANAGEMENT COMMISSION

U.S. DEPARTMENT OF THE INTERIORBRUCE BABBITT, Secretary
U.S. GEOLOGICAL SURVEY
Gordon P. Eaton, Director
The use of firm, trade, and brand names in this report is for identification purposes only and doesnot constitute endorsement by the U.S. Geological Survey
For additional information write to: Copies of this report can be purchased
U.S. Geological SurveyBranch of Information ServicesBox 25286Federal CenterDenver, CO 80225
from:
U.S. Geological Survey District Chief 221 N. Broadway Ave. Urbana, Illinois 61801 (217) 344-0037

CONTENTS
Abstract . . . . . . . . . . . . . . . . . . . . . . . . . . . . . . . . . . . . . . . . . . . . . . . . . . . . . . . . . . . . . . . . . . . . . . . . . . . . . . . . . . . . . . . . . 1Introduction . . . . . . . . . . . . . . . . . . . . . . . . . . . . . . . . . . . . . . . . . . . . . . . . . . . . . . . . . . . . . . . . . . . . . . . . . . . . . . . . . . . . . . 2
Purpose and Scope. . . . . . . . . . . . . . . . . . . . . . . . . . . . . . . . . . . . . . . . . . . . . . . . . . . . . . . . . . . . . . . . . . . . . . . . . . . . 3Description of Study Area . . . . . . . . . . . . . . . . . . . . . . . . . . . . . . . . . . . . . . . . . . . . . . . . . . . . . . . . . . . . . . . . . . . . . . 3Acknowledgments . . . . . . . . . . . . . . . . . . . . . . . . . . . . . . . . . . . . . . . . . . . . . . . . . . . . . . . . . . . . . . . . . . . . . . . . . . . . 7
Synthetic Unit-Hydrograph Methods . . . . . . . . . . . . . . . . . . . . . . . . . . . . . . . . . . . . . . . . . . . . . . . . . . . . . . . . . . . . . . . . . . 7Clark Unit-Hydrograph Method . . . . . . . . . . . . . . . . . . . . . . . . . . . . . . . . . . . . . . . . . . . . . . . . . . . . . . . . . . . . . . . . . 7Soil Conservation Service Dimensionless Unit-Hydrograph Method. . . . . . . . . . . . . . . . . . . . . . . . . . . . . . . . . . . . . 8Linear-Reservoir Method. . . . . . . . . . . . . . . . . . . . . . . . . . . . . . . . . . . . . . . . . . . . . . . . . . . . . . . . . . . . . . . . . . . . . . . 10Previous Relations Between Synthetic Unit-Hydrograph Parameters and Watershed Characteristics in Illinois. . . . 11
Determination and Evaluation of Synthetic Unit-Hydrograph Parameters . . . . . . . . . . . . . . . . . . . . . . . . . . . . . . . . . . . . . . 13Storm Selection . . . . . . . . . . . . . . . . . . . . . . . . . . . . . . . . . . . . . . . . . . . . . . . . . . . . . . . . . . . . . . . . . . . . . . . . . . . . . . 13Hydrograph-Parameter Determination by Manual Computation . . . . . . . . . . . . . . . . . . . . . . . . . . . . . . . . . . . . . . . . 14Hydrograph-Parameter Determination by Rainfall-Runoff Model Calibration . . . . . . . . . . . . . . . . . . . . . . . . . . . . . 14Comparison of Calibrated Hydrograph-Parameter Values with Results of Previous Relations . . . . . . . . . . . . . . . . . 16
Equations for Estimating Synthetic Unit-Hydrograph Parameters . . . . . . . . . . . . . . . . . . . . . . . . . . . . . . . . . . . . . . . . . . . . 16Equation Development . . . . . . . . . . . . . . . . . . . . . . . . . . . . . . . . . . . . . . . . . . . . . . . . . . . . . . . . . . . . . . . . . . . . . . . . 18Equation Verification . . . . . . . . . . . . . . . . . . . . . . . . . . . . . . . . . . . . . . . . . . . . . . . . . . . . . . . . . . . . . . . . . . . . . . . . . . 19Application Limits for the Estimation Equations . . . . . . . . . . . . . . . . . . . . . . . . . . . . . . . . . . . . . . . . . . . . . . . . . . . . 25Application Example . . . . . . . . . . . . . . . . . . . . . . . . . . . . . . . . . . . . . . . . . . . . . . . . . . . . . . . . . . . . . . . . . . . . . . . . . . 26
Summary and Conclusions . . . . . . . . . . . . . . . . . . . . . . . . . . . . . . . . . . . . . . . . . . . . . . . . . . . . . . . . . . . . . . . . . . . . . . . . . . 27References Cited . . . . . . . . . . . . . . . . . . . . . . . . . . . . . . . . . . . . . . . . . . . . . . . . . . . . . . . . . . . . . . . . . . . . . . . . . . . . . . . . . . 28
FIGURES
1-2. Maps showing:1. Location of Lake County in northeastern Illinois and U.S. Geological Survey rain gages . . . . . . . . . . . . . . . . 42. Locations of the watersheds in Lake County, Ill., utilized to develop, verify, and illustrate equations for
estimation of synthetic unit-hydrograph parameters . . . . . . . . . . . . . . . . . . . . . . . . . . . . . . . . . . . . . . . . . . . . . 63. Soil Conservation Service dimensionless curvilinear unit hydrograph and equivalent triangular unit
hydrograph . . . . . . . . . . . . . . . . . . . . . . . . . . . . . . . . . . . . . . . . . . . . . . . . . . . . . . . . . . . . . . . . . . . . . . . . . . . . . . . . . 94. Graph showing time of concentration for storms on nine watersheds in Lake County, Ill., for the Clark unit-
hydrograph method measured and computed as a function of watershed area, percentage of impervious cover, and depth of effective precipitation . . . . . . . . . . . . . . . . . . . . . . . . . . . . . . . . . . . . . . . . . . . . . . . . . . . . . . . . . 21
5. Graph showing watershed-storage coefficient for storms on nine watersheds in Lake County, Ill., for the Clark unit hydrograph measured and computed as a function of watershed area, percentage of impervious cover, and main channel slope. . . . . . . . . . . . . . . . . . . . . . . . . . . . . . . . . . . . . . . . . . . . . . . . . . . . . . . . . . . . . . . . . . . . . . . . 22
6. Graph showing unit-graph lag for storms on nine watersheds in Lake County, Ill., for the Soil Conservation Service dimensionless unit hydrograph measured and computed as a function of watershed area, percentage of impervious cover, and depth of effective precipitation. . . . . . . . . . . . . . . . . . . . . . . . . . . . . . . . . . . . . . . . . . . . . . . . 23
7. Graph showing hydrograph-time lag for storms on nine watersheds in Lake County, Ill., measured and computed as a function of watershed area, percentage of impervious cover, main channel slope, and depth of effective precipitation . . . . . . . . . . . . . . . . . . . . . . . . . . . . . . . . . . . . . . . . . . . . . . . . . . . . . . . . . . . . . . . . . . 24
8-18. Graphs showing measured direct-runoff hydrographs and direct-runoff hydrographs simulated with the Clark unit-hydrograph method in the U.S. Army Corps of Engineers Flood Hydrograph Package HEC-1 with the time of concentration and storage coefficient determined from the estimation equations for Lake County, Ill., for the storms of:
8. April 26, 1995, on Bull Creek . . . . . . . . . . . . . . . . . . . . . . . . . . . . . . . . . . . . . . . . . . . . . . . . . . . . . . . . . . . . . . 39
Contents III

9. April 26, 1995, on Indian Creek. . . . . . . . . . . . . . . . . . . . . . . . . . . . . . . . . . . . . . . . . . . . . . . . . . . . . . . . . . . . 4010. November 5, 1994, on Green Lake Ditch. . . . . . . . . . . . . . . . . . . . . . . . . . . . . . . . . . . . . . . . . . . . . . . . . . . . . 4111. November 27, 1994, on Green Lake Ditch. . . . . . . . . . . . . . . . . . . . . . . . . . . . . . . . . . . . . . . . . . . . . . . . . . . . 4212. April 26, 1995, on North Branch of the Chicago River . . . . . . . . . . . . . . . . . . . . . . . . . . . . . . . . . . . . . . . . . . 4313. May 23, 1995, on North Branch of the Chicago River. . . . . . . . . . . . . . . . . . . . . . . . . . . . . . . . . . . . . . . . . . . 4414. April 26, 1995, on Skokie River at Lake Forest . . . . . . . . . . . . . . . . . . . . . . . . . . . . . . . . . . . . . . . . . . . . . . . . 4515. April 26, 1995, on Skokie River near Highland Park. . . . . . . . . . . . . . . . . . . . . . . . . . . . . . . . . . . . . . . . . . . . 4616. April 26, 1995, on Squaw Creek . . . . . . . . . . . . . . . . . . . . . . . . . . . . . . . . . . . . . . . . . . . . . . . . . . . . . . . . . . . 4717. April 26, 1995, on Flint Creek . . . . . . . . . . . . . . . . . . . . . . . . . . . . . . . . . . . . . . . . . . . . . . . . . . . . . . . . . . . . . 4818. May 23, 1995, on Flint Creek. . . . . . . . . . . . . . . . . . . . . . . . . . . . . . . . . . . . . . . . . . . . . . . . . . . . . . . . . . . . . . 49
TABLES
1. Rainfall data-collection sites in and near Lake County, Ill.. . . . . . . . . . . . . . . . . . . . . . . . . . . . . . . . . . . . . . . . . . 52. Geomorphologic and land-cover characteristics of watersheds in Lake County, Ill., selected for
determination of equations for estimation of synthetic unit-hydrograph parameters. . . . . . . . . . . . . . . . . . . . . . 73. Average values of measures of calibration quality for the calibrated Clark unit-hydrograph method and the
calibrated Soil Conservation Service dimensionless unit-hydrograph method for all storms on selected watersheds in Lake County, Ill., utilized to develop and verify the equations for estimation of synthetic unit-hydrograph parameters. . . . . . . . . . . . . . . . . . . . . . . . . . . . . . . . . . . . . . . . . . . . . . . . . . . . . . . . . . . . . . . . . . 15
4. Range and mean of unit-hydrograph peak factors of the type applied in the Soil Conservation Service dimensionless unit-hydrograph method determined by manual hydrograph analysis for all storms on selected watersheds in Lake County, Ill., utilized to develop and verify the equations for estimation of synthetic unit-hydrograph parameters . . . . . . . . . . . . . . . . . . . . . . . . . . . . . . . . . . . . . . . . . . . . . . . . . . . . . . . . . . 16
5. Time of concentration for the Clark unit-hydrograph method estimated with the method of Graf and others (1982b) compared with the minimum, mean, and maximum values determined from calibration for all storms on selected watersheds in Lake County, Ill., utilized to develop and verify the equations for estimation of synthetic unit-hydrograph parameters . . . . . . . . . . . . . . . . . . . . . . . . . . . . . . . . . . . . . . . . . . . . . . . 17
6. Watershed-storage coefficient for the Clark unit-hydrograph method estimated with the method of Graf and others (1982b) compared with the minimum, mean, and maximum values determined from calibration for all storms on selected watersheds in Lake County, Ill., utilized to develop and verify the equations for estimation of synthetic unit-hydrograph parameters . . . . . . . . . . . . . . . . . . . . . . . . . . . . . . . . . . . . . . . . . . . . . . . 17
7. Time-to-peak for the Snyder unit-hydrograph method estimated with the method of Singh (1981) compared with the minimum, mean, and maximum values determined from calibration for all storms on selected watersheds in Lake County, Ill., utilized to develop and verify the equations for estimation of synthetic unit-hydrograph parameters. . . . . . . . . . . . . . . . . . . . . . . . . . . . . . . . . . . . . . . . . . . . . . . . . . . . . . . . . . . . . . . . . . 17
8. Standard error and multiple correlation coefficient for logarithmic data in the equations for estimating synthetic unit-hydrograph parameters for Lake County, Ill. . . . . . . . . . . . . . . . . . . . . . . . . . . . . . . . . . . . . . . . . . 19
9. Percentage error in the estimated peak discharge and time-to-peak discharge for the verification storms on selected watersheds in Lake County, Ill., simulated with the Clark unit-hydrograph method utilizing estimated values of time of concentration and watershed-storage coefficient. . . . . . . . . . . . . . . . . . . . . . . . . . . . . . . . . . . . 20
10. Direct-runoff hydrograph characteristics and parameters determined from manual analysis of hydrographs on watersheds in Lake County, Ill., for storms utilized to develop and verify the equations for estimation of synthetic unit-hydrograph parameters . . . . . . . . . . . . . . . . . . . . . . . . . . . . . . . . . . . . . . . . . . . . . . . . . . . . . . . . . . 33
11. Parameters for the Clark and Snyder unit-hydrograph methods determined from calibration of the U.S. Army Corps of Engineers (1990) Flood Hydrograph Package HEC-1 and measures of calibration quality for data from watersheds in Lake County, Ill., for storms utilized to develop and verify the equations for estimation of synthetic unit-hydrograph parameters . . . . . . . . . . . . . . . . . . . . . . . . . . . . . . . . . . . . 35
12. Unit-graph lag for the Soil Conservation Service dimensionless unit hydrograph determined from calibration of the U.S. Army Corps of Engineers (1990) Flood Hydrograph Package HEC-1 and percentage error in calibrated-hydrograph peak discharge for data from watersheds in Lake County, Ill., for storms utilized to develop and verify the equations for estimation of synthetic unit-hydrograph parameters 37
IV Contents

CONVERSION FACTORS
Multiply By To obtain
inch (in.) 25.4 millimeter
inch per hour (in/h) 25.4 millimeter per hour
foot (ft) 0.3048 meter
mile (mi) 1.609 kilometer
acre 2.471 hectare
square mile (mi2) 2.59 square kilometer
cubic foot per second (ft3/s) 0.0283 cubic meter per second
foot per mile (ft/mi) 0.1894 meter per kilometer
Contents V

VI Contents
Equations for Estimating Synthetic Unit-Hydrograph Parameter Values for Small Watersheds in Lake County, IllinoisBy Charles S. Melching and Jason S. Marquardt
Abstract
Design hydrographs computed from design storms, simple models of abstractions (intercep-tion, depression storage, and infiltration), and syn-thetic unit hydrographs provide vital information for stormwater, flood-plain, and water-resources management throughout the United States. Rain-fall and runoff data for small watersheds in Lake County collected between 1990 and 1995 were studied to develop equations for estimation of syn-thetic unit-hydrograph parameters on the basis of watershed and storm characteristics. The synthetic unit-hydrograph parameters of interest were the time of concentration (TC) and watershed-storage coefficient (R) for the Clark unit-hydrograph method, the unit-graph lag (UL) for the Soil Con-servation Service (now known as the Natural Resources Conservation Service) dimensionless unit hydrograph, and the hydrograph-time lag (TL) for the linear-reservoir method for unit-hydrograph estimation. Data from 66 storms with effective-precipitation depths greater than 0.4 inches on 9 small watersheds (areas between 0.06 and 37 square miles (mi2)) were utilized to develop the estimation equations, and data from 11 storms on 8 of these watersheds were utilized to verify (test) the estimation equations. The syn-thetic unit-hydrograph parameters were deter-mined by calibration using the U.S. Army Corps of Engineers Flood Hydrograph Package HEC-1(TC, R, and UL) or by manual analysis of the rainfall and runoff data (TL). The relation between syn-thetic unit-hydrograph parameters, and watershed and storm characteristics was determined by mul-
tiple linear regression of the logarithms of the parameters and characteristics.
Separate sets of equations were developed with watershed area and main channel length as the starting parameters. Percentage of impervious cover, main channel slope, and depth of effective precipitation also were identified as important characteristics for estimation of synthetic unit-hydrograph parameters. The estimation equations utilizing area had multiple correlation coefficients of 0.873, 0.961, 0.968, and 0.963 for TC, R, UL, and TL, respectively, and the estimation equations utilizing main channel length had multiple correla-tion coefficients of 0.845, 0.957, 0.961, and 0.963 for TC, R, UL, and TL, respectively.
Simulation of the measured hydrographs for the verification storms utilizing TC and R obtained from the estimation equations yielded good results without calibration. The peak discharge for 8 of the 11 storms was estimated within 25 percent and the time-to-peak discharge for 10 of the 11 storms was estimated within 20 percent. Thus, application of the estimation equations to determine synthetic unit-hydrograph parameters for design-storm simulation may result in reliable design hydro-graphs; as long as the physical characteristics of the watersheds under consideration are within the range of those for the watersheds in this study (area: 0.06-37 mi2, main channel length: 0.33-16.6 miles, main channel slope: 3.13-55.3 feet per mile, and percentage of impervious cover: 7.32-40.6 percent). The estimation equations are most reliable when applied to watersheds with areas less than 25 mi2.
Abstract 1

INTRODUCTION
Design of stormwater management facilities and other hydraulic structures (culverts, bridge water-ways), determination of flood plain boundaries, and assessment of the safety of structures in rivers typically involve the application of a design hydrograph. These design hydrographs are computed on the basis of design storms of a specified probability of occurrence determined from standard references, such as the U.S. Weather Bureau Technical Paper Number 40 (TP40) (Hershfield, 1961) or the Illinois State Water Survey Bulletin 70 (Bulletin 70) (Huff and Angel, 1989). Abstractions from rainfall resulting from inter-ception, depression storage, and infiltration are then determined on the basis of available data from the literature and considering the effects of the soil type, land cover/land use, and antecedent moisture condi-tions. Typically, the Soil Conservation Service (SCS, now known as the Natural Resources Conservation Ser-vice) (1985) curve-number method is applied to determine the abstractions. By subtracting the abstractions from the design rainfall, the precipitation excess, which approximately equals the direct runoff (effective precipitation) resulting from the design storm, is obtained. The precipitation excess is then transformed into a hydrograph at the outlet of the watershed utilizing a synthetic unit hydrograph. If a large area is studied, it is subdivided into a number of subwatersheds and the runoff hydrographs from each of these subwatersheds is routed to the watershed outlet with hydrologic or hydraulic routing methods. For example, Snider (1971) recommended that a single SCS dimensionless unit hydrograph should not be used for watersheds greater than 20 mi2.
The primary advantage of utilizing synthetic unit hydrographs is that the complete unit hydrograph may be determined with the specification of one or two hydrograph parameters. Further, many studies have shown that relations between these hydrograph parameters and watershed and storm characteristics may be developed. Synthetic unit hydrographs may be derived for ungaged watersheds utilizing the relations between hydrograph parameters, and watershed and storm characteristics as long as the ungaged watersheds are hydrologically similar to the gaged watersheds for which the relation was devel-oped. Hydrologic similarity includes similarity in topography, geomorphology, soil types, land cover/land use, and climate. For some synthetic unit hydro-graphs, the relation between hydrograph parameters,
and watershed and storm characteristics had been developed for application on a national (or even global) basis if suitable relations for local conditions are not available. The relations for estimating the time of concentration and traveltime for the SCS Technical Release 55 (TR55) (Soil Conservation Service, 1986) are examples of national relations. Application of national relations may result in substantial errors in a specific region.
The Clark (1945) unit-hydrograph method as implemented in the U.S. Army Corps of Engineers (1990) Flood Hydrograph Package HEC-1 and the SCS dimensionless unit-hydrograph method as imple-mented in TR55 are the most commonly applied synthetic unit-hydrograph methods in Illinois. In addi-tion to utilizing a unit-graph-lag parameter, the SCS dimensionless unit-hydrograph method applies a fixed relation between unit-hydrograph peak discharge and watershed area and time-to-peak. This peak factor has been found to be substantially high in a number of areas in the United States (Woodward and others, 1995).
Lake County, Ill., is undergoing rapid urbaniza-tion and management of the resultant increases in stormwater runoff and flooding is an important activity in the county. Design hydrographs are needed for stormwater management planning, flood plain delinea-tion, and stormwater-mitigation structure design in Lake County. The U.S. Geological Survey (USGS) has operated an extensive network of rainfall and streamflow gages in and near Lake County since December 1989 in cooperation with the Lake County Stormwater Management Commission (LCSMC). The data from this network are sufficient to develop rela-tions between hydrograph parameters, and watershed and storm characteristics for stormwater management on small watersheds (less than 25 mi2) in Lake County. Therefore, the USGS, in cooperation with the LCSMC, began a study to develop relations between hydrograph parameters (unit-graph lag, time of concentration, hydrograph-time lag, and watershed-storage coeffi-cient), and watershed (area, main channel length and slope, percentages of impervious cover, forest cover, and open water) and storm (effective-precipitation depth, duration, and intensity) characteristics for use in stormwater management in Lake County, Ill. The applicability of the peak factor utilized in the SCS dimensionless unit hydrograph for small watersheds in Lake County also was evaluated.
2 Equations for Estimating Synthetic Unit-Hydrograph Parameter Values for Small Watersheds in Lake County, Illinois

Purpose and Scope
This report (1) describes the procedures utilized to develop and test the relations between hydrograph parameters, and watershed and storm characteristics, and (2) illustrates the accuracy and application of the relations developed for computation of synthetic unit hydrographs for small, ungaged watersheds in Lake County, Ill. The development of the relations included detailed analysis of rainfall and runoff data to identify storms suitable for hydrograph-parameter determina-tion; computation of hydrograph-time lag by manual analysis; determination of unit-graph lag, time of concentration, and watershed-storage coefficient by calibration of HEC-1; and determination of the relations by multiple nonlinear regression. Testing of the relations included comparison of hydrograph-parameter values determined for verification storms to values estimated with the relations and comparison of hydrographs computed utilizing the estimated values of the hydrograph parameters to measured hydrographs for verification storms. The accuracy of the relations is inferred from the results of HEC-1 calibration, nonlinear regression, and relation verifica-tion.
Description of Study Area
The objective of this study is to develop relations between hydrograph parameters, and watershed and storm characteristics for computation of synthetic unit hydrographs for small, ungaged watersheds in Lake County. Therefore, the areas studied are the watersheds in Lake County for which detailed rainfall and runoff data are available. The network of rainfall gages oper-ated by the USGS in and near Lake County during the study period is shown in figure 1 and the station num-bers, names, and periods of record of the rain gages are listed in table 1. The watersheds utilized to develop the estimation equations are shown in figure 2. The factors affecting the selection of these watersheds are described below.
The network of rain gages in and near Lake County was started in December 1989 with the installation of eight gages at various locations throughout the county. The network increased to 14 rain gages in February 1990, to 18 rain gages in April 1990, and finally to 23 rain gages in May 1991. All installations included tipping-bucket rain gages capable of measuring rainfall depths of 0.01 in. at a
time step of 5 minutes. This network of rain gages was installed to develop rainfall-runoff relations for simulation of streamflow for watersheds in Lake County as described by Duncker and others (1995). When the project to develop rainfall-runoff relations was completed on September 30, 1993, four of the rain gages were discontinued and a new rain gage was installed in Highland Park, Ill. Thus, data from a total of 24 rain gages in and near Lake County (fig. 1) were available at various times (table 1) to assist in the devel-opment of the estimation equations. The areal extent of the rain-gage network results in reliable rainfall-depth and temporal distribution data for determination of hydrograph parameters for watersheds with streamflow gages in Lake County.
Streamflow data are available at 14 gages on streams draining watersheds, primarily in Lake County, during the period of detailed rainfall data (December 1989-September 1993). These streamflow gages are listed below.
Stationnumber Station name
05527940 Tempel Farms Ditch near Old Mill Creek, Ill.
05527950 Mill Creek at Old Mill Creek, Ill.05528030 Bull Creek near Libertyville, Ill.05528040 Terre Faire Ditch at Libertyville, Ill.05528230 Indian Creek at Praire View, Ill.05528475 Green Lake Ditch at Buffalo Grove, Ill.05528500 Buffalo Creek near Wheeling, Ill.05534500 North Branch Chicago River at
Deerfield, Ill.05535000 Skokie River at Lake Forest, Ill.05535070 Skokie River near Highland Park, Ill.05535500 West Fork of North Branch of Chicago
River at North Brook, Ill.05547755 Squaw Creek at Round Lake, Ill.05549835 Lakeview Plaza Ditch at
Lake Zurich, Ill.05549850 Flint Creek near Fox River Grove, Ill.
Five of these watersheds and streamflow gages were not considered in this study for the following reasons. Tempel Farms Ditch drains a small 0.492-mi2 watershed consisting of 100 percent pervious land cover in the form of agricultural pasture. As a result of the pervious land cover, and corresponding high interception and depression storage in the watershed,
Introduction 3

4 Equations for Estimating Synthetic Unit-Hydrograph Parameter Values for Small Watersheds in Lake County, Illinois
Figure 1. Location of Lake County in northeastern Illinois and U.S. Geological Survey rain gages.
3 6 MILES
3 6 KILOMETERS0
0Base from U.S. Geological Survey1:100,000 Digital DataAlbers Equa-Area Conic ProjectionStandard paralleles 33˚ and 45˚, central meridian -89˚
ILLINOISL
AK
E
MC
HE
NR
Y
LAKE
COOK
WISCONSIN
LakeMichigan
42° 30′
42° 15′
42° 22′ 30″
88°88° 07′ 30″ 87° 52′ 30″
Flint
FoxLake
Mill
Cr
Cr
Cr
Bul
l
Indian
PlainesR
iver
Cr
Cr
Des
Squaw
SpringGrove
Lindenhurst
Old MillCreek
Wheeling
Wauconda
Waukegan
LakeZurich
RoundLake
FoxLake
EXPLANATIONU.S. GEOLOGICAL SURVEY RAIN GAGE
AND SITE NUMBER--See table 1
1
24
1
21
22
6
4
17
14
16
10
5
12
20
11
18
13
7
9
2
3
19
8
15
23
45
12
14
41
Grayslake
Gurnee
Libertyville LakeForest
Highland Park
Deerfield
BuffaloGrove
FoxRiverGrove
LakeCounty
ILL

Table 1. Rainfall data-collection sites in and near Lake County, Ill.[Site identifiers correspond to those in figure 1; present refers to September 10, 1996]
Site Station Periodidentifier number Station name of record
1 040874126 Southwest Fork of South Branch of Ravine 10 at Highland Park, Ill. 12/07/93-present2 05527800 Des Plaines River at Russell, Ill. 12/05/89-present3 05527940 Tempel Farms Ditch near Old Mill Creek, Ill. 07/11/91-present4 05528000 Des Plaines River near Gurnee, Ill. 12/06/89-present5 05528030 Bull Creek near Libertyville, Ill. 12/04/89-present
6 05528040 Terre Faire Ditch at Libertyville, Ill. 05/08/91-present7 05528475 Green Lake Ditch at Buffalo Grove, Ill. 04/25/91-present8 05528500 Buffalo Creek near Wheeling, Ill. 04/17/90-present9 05534500 North Branch Chicago River at Deerfield, Ill. 12/10/89-present10 05535070 Skokie River near Highland Park, Ill. 12/04/89-present
11 05547755 Squaw Creek at Round Lake, Ill. 12/06/89-11/21/9312 05548280 Nippersink Creek near Spring Grove, Ill. 03/13/91-present13 05549835 Lakeview Plaza Ditch at Lake Zurich, Ill. 04/08/91-04/20/9414 05549850 Flint Creek near Fox River Grove, Ill. 12/06/89-present15 421113088042200 Lake Zurich Wastewater Treatment Facility at Lake Zurich, Ill. 02/13/90-present
16 421215087573400 Vernon Hills Rain Gage at Praire View, Ill. 04/17/90-present17 421428088012900 Diamond Lake Wastewater Treatment Facility at Diamond Lake, Ill. 02/13/90-present18 421533088084600 Wauconda Wastewater Treatment Facility at Wauconda, Ill. 02/12/90-present19 422118088014700 Grayslake Wastewater Treatment Facility at Grayslake, Ill. 02/01/90-present20 422315088091800 Fox Lake Rain Gage at Fox Lake, Ill. 04/23/90-present
21 422459087520700 Waukegan Airport at Waukegan, Ill. 04/17/90-present22 422553088015300 Lindenhurst Wastewater Treatment Facility at Lindenhurst, Ill. 12/06/89-12/03/9323 423451088052400 Paddock Lake Wastewater Treatment Facility at Paddock Lake, Wis. 02/06/90-12/06/9324 423526087551800 Kenosha Airport Rain Gage at Kenosha, Wis. 02/06/90-present
no storms produced more than the target level of direct-runoff volume for hydrograph analysis (discussed in the “Determination and Evaluation of Synthetic Unit-Hydrograph Parameters” section). Mill Creek drains a 59.6 mi2 primarily rural watershed with substantial wetland areas along the main stem. The wetlands and semipermanent debris jams along Mill Creek result in substantial attenuation of the runoff hydrograph for this watershed, which is not representative of condi-tions on small (less than 25 mi2), ungaged watersheds in Lake County. The Buffalo Creek watershed was eliminated from consideration because of a flood- control reservoir about 1 mi upstream from the streamflow gage. The West Fork of the North Branch of Chicago River watershed was eliminated from consideration because of two off-line flood-control reservoirs in the watershed that substantially alter the natural rainfall-runoff process for larger storms. Finally, Lakeview Plaza Ditch drains a 0.0055-mi2 watershed consisting of nearly 100 percent impervious area in the form of a commercial shopping mall and adjacent parking lot. The hydrograph parameters for this watershed are not useful for development of rela-tions for general application because of the extremely
small size and high imperviousness of the watershed. Because the goal of this study was to develop estima-tion equations suitable for watersheds with areas less than 25 mi2, data from Indian and Flint Creeks could have been omitted from the analysis. However, data from these watersheds were retained to include a wider range of watershed conditions in the regression analy-sis. Thus, the study area consists of nine watersheds in and near Lake County, Ill. (fig. 2).
Lake County lies entirely within the Wheaton Morainal Region (Leighton and others, 1948). Under the more natural, nonurban conditions present in 1954, Mitchell (1954, p. 335) noted that the Wheaton Morainal Region is characterized by flat slopes, long, narrow basins, and large storage in lake and swamp areas. In the mid 1980’s, rapid urbanization began in rural areas in Lake County. Since then the presence of impervious areas and drainage structures (storm sewers and swales) has substantially affected the rainfall- runoff process and resulting hydrographs in Lake County. The primary geomorphologic and land-cover characteristics of the watersheds utilized for determina-tion of the parameters for synthetic unit hydrographs and development of relations for estimating these
Introduction 5

6 Equations for Estimating Synthetic Unit-Hydrograph Parameter Values for Small Watersheds in Lake County, Illinois
Figure 2. Location of the watersheds in Lake County, Ill., utilized to develop, verify, and illustrate equations for estimation of synthetic unit-hydrograph parameters.
McH
EN
RY
LAK
E
COOKLAKE
WISCONSIN
ILLINOIS
Base from U.S. Geological Survey1:100,000 Digital DataAlbers Equal-Area Conic Projectionstandard parallels 33˚ and 45˚, central meridian -89˚
1 2 3 4 5 MILES
1 2 3 4 5 KILOMETERS0
0
Cr
BuffaloCreek
Flint Cr
No
rthB
ran
ch
Chica
go
River
River
Sko
kie
Rive
r
Des
FoxLake
Squaw
Plaines
Cr
Cr
LakeMichigan
Old MillCreek
Lindenhurst
FoxLake
RoundLake
Wauconda
Deerfield
WheelingBuffaloGrove
GLD
88° 07′ 30″
42° 30′
42° 22′ 30″
42° 15′
42° 07′ 30″
88° 87° 52′ 30″
Grayslake
45
12
41
GurneeWaukegan
LakeForest
Ind
ian
TFDBull
Libertyville
Fox RiverGrove
14
LakeZurich
HighlandPark
EXPLANATION
TERRE FAIRE DITCH
GREEN LAKE DITCH
TFD
GLD
WATERSHED BOUNDARY--For Skokie River,northern watershed is Skokie River at LakeForest, and the entire watershed is Skokie River near Highland Park
LakeCounty
ILL
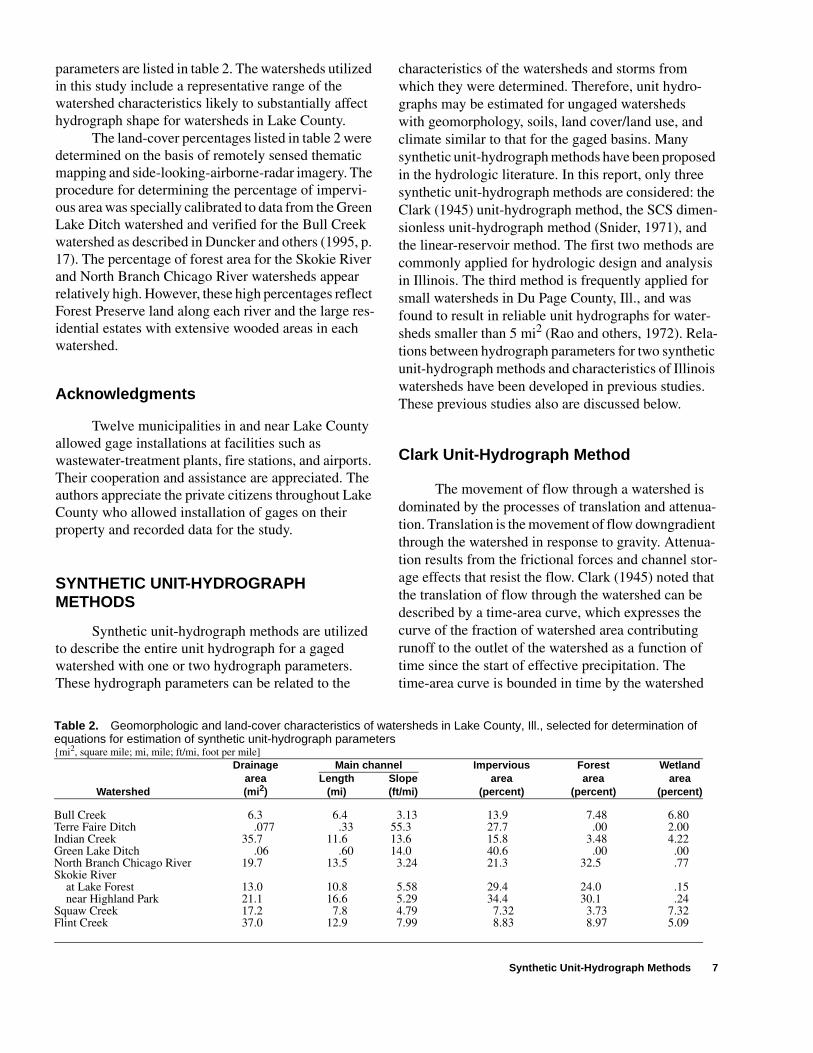
parameters are listed in table 2. The watersheds utilized in this study include a representative range of the watershed characteristics likely to substantially affect hydrograph shape for watersheds in Lake County.
The land-cover percentages listed in table 2 were determined on the basis of remotely sensed thematic mapping and side-looking-airborne-radar imagery. The procedure for determining the percentage of impervi-ous area was specially calibrated to data from the Green Lake Ditch watershed and verified for the Bull Creek watershed as described in Duncker and others (1995, p. 17). The percentage of forest area for the Skokie River and North Branch Chicago River watersheds appear relatively high. However, these high percentages reflect Forest Preserve land along each river and the large res-idential estates with extensive wooded areas in each watershed.
Acknowledgments
Twelve municipalities in and near Lake County allowed gage installations at facilities such as wastewater-treatment plants, fire stations, and airports. Their cooperation and assistance are appreciated. The authors appreciate the private citizens throughout Lake County who allowed installation of gages on their property and recorded data for the study.
SYNTHETIC UNIT-HYDROGRAPH METHODS
Synthetic unit-hydrograph methods are utilized to describe the entire unit hydrograph for a gaged watershed with one or two hydrograph parameters. These hydrograph parameters can be related to the
characteristics of the watersheds and storms from which they were determined. Therefore, unit hydro-graphs may be estimated for ungaged watersheds with geomorphology, soils, land cover/land use, and climate similar to that for the gaged basins. Many synthetic unit-hydrograph methods have been proposed in the hydrologic literature. In this report, only three synthetic unit-hydrograph methods are considered: the Clark (1945) unit-hydrograph method, the SCS dimen-sionless unit-hydrograph method (Snider, 1971), and the linear-reservoir method. The first two methods are commonly applied for hydrologic design and analysis in Illinois. The third method is frequently applied for small watersheds in Du Page County, Ill., and was found to result in reliable unit hydrographs for water-sheds smaller than 5 mi2 (Rao and others, 1972). Rela-tions between hydrograph parameters for two synthetic unit-hydrograph methods and characteristics of Illinois watersheds have been developed in previous studies. These previous studies also are discussed below.
Clark Unit-Hydrograph Method
The movement of flow through a watershed is dominated by the processes of translation and attenua-tion. Translation is the movement of flow downgradient through the watershed in response to gravity. Attenua-tion results from the frictional forces and channel stor-age effects that resist the flow. Clark (1945) noted that the translation of flow through the watershed can be described by a time-area curve, which expresses the curve of the fraction of watershed area contributing runoff to the outlet of the watershed as a function of time since the start of effective precipitation. The time-area curve is bounded in time by the watershed
Synthetic Unit-Hydrograph Methods 7
Table 2. Geomorphologic and land-cover characteristics of watersheds in Lake County, Ill., selected for determination of equations for estimation of synthetic unit-hydrograph parameters{mi2, square mile; mi, mile; ft/mi, foot per mile]
Drainage Main channel Impervious Forest Wetlandarea Length Slope area area area
Watershed (mi2) (mi) (ft/mi) (percent) (percent) (percent)
Bull Creek 6.3 6.4 3.13 13.9 7.48 6.80Terre Faire Ditch .077 .33 55.3 27.7 .00 2.00Indian Creek 35.7 11.6 13.6 15.8 3.48 4.22Green Lake Ditch .06 .60 14.0 40.6 .00 .00North Branch Chicago River 19.7 13.5 3.24 21.3 32.5 .77Skokie River at Lake Forest 13.0 10.8 5.58 29.4 24.0 .15 near Highland Park 21.1 16.6 5.29 34.4 30.1 .24Squaw Creek 17.2 7.8 4.79 7.32 3.73 7.32Flint Creek 37.0 12.9 7.99 8.83 8.97 5.09

time of concentration (TC). Thus, TC is a hydrograph parameter of the Clark unit-hydrograph method. Atten-uation of flow can be represented with a simple, linear reservoir for which storage is related to outflow as
S = RO, (1)
where, S is the watershed storage, R is the watershed-storage coefficient, and O is the outflow from the watershed. Therefore, Clark (1945) proposed that a synthetic unit hydrograph could be obtained by routing 1 in. of direct runoff into the channel in proportion to the time-area curve and routing the runoff entering the channel through a linear reservoir.
Numerous researchers have found that the actual time-area curve for the watershed need not be deter-mined to obtain a reasonable unit hydrograph. For example, Turner and Burdoin (1941) and O’Kelly (1955) found that reasonable unit hydrographs were obtained when simple geometric shapes were substi-tuted for the actual time-area curve. Experience with the Clark unit-hydrograph method at the U.S. Army Corps of Engineers, Hydrologic Engineering Center, indicates that a detailed time-area curve usually is not necessary for accurate synthetic unit-hydrograph esti-mation (Ford and others, 1980). In most instances, the dimensionless time-area curve included in HEC-1 (U.S. Army Corps of Engineers, 1990) is satisfactory for obtaining a reliable synthetic unit hydrograph.
In Illinois, HEC-1 (U.S. Army Corps of Engi-neers, 1990) typically is utilized to compute the Clark unit hydrograph. The hydrograph parameters required for HEC-1 computations of the Clark unit hydrograph are TC and R. The time of concentration for the Clark unit hydrograph is slightly different than the typical definition applied in stormwater management, such as in the Rational method (Kuichling, 1889). In the typical definition, the time of concentration (tc) is the travel-time required for the first drop of effective precipitation at the hydraulically most distant point in the watershed to reach the watershed outlet. In the Clark unit-hydrograph method, TC is the time from the end of effective precipitation to the inflection point of the recession limb of the runoff hydrograph. The inflection point on the runoff hydrograph corresponds to the time when overland flow to the channel network ceases and beyond that the measured runoff results from drainage of channel storage. Therefore, Clark’s TC is the travel-
time required for the last drop of effective precipitation at the hydraulically most distant point in the watershed to reach the channel network. From linear system the-ory and the conceptual model of pure translatory flow, the two definitions of time of concentration are equiva-lent. However, the subtle differences in the definition of time of concentration between the Rational method and the Clark unit-hydrograph method imply that the time of concentration estimation equations commonly applied in the Rational method may not be appropriate for the Clark unit-hydrograph method. In most applica-tions of HEC-1, TC is determined from values cali-brated with measured rainfall and runoff data either directly, by scaling from hydrologically similar water-sheds, or from relations, such as those developed in this study.
Soil Conservation Service Dimensionless Unit-Hydrograph Method
In the SCS dimensionless unit-hydrograph method, all the hydrograph ordinates are given by ratios between instantaneous discharge and peak discharge and between time and time-to-peak as illus-trated in figure 3. The unit-hydrograph peak discharge also is directly related to the time-to-peak from consid-eration of the volume of the unit hydrograph. This is best illustrated for the SCS dimensionless, triangular unit hydrograph shown in figure 3. The volume of the unit hydrograph in cubic feet is
V = (1 in.)(A mi2)(1 ft/12 in.)(5,280 ft/1 mi)2 = 2,323,200 A, (2)
where V is volume of direct runoff in cubic feet and A is watershed area in square miles.
The volume of runoff under the SCS dimension-less, triangular unit hydrograph is
V = 0.5{(qp ft3/s)[(Tp hr) + (Tr hr)]}(3,600 s/1 hr)
V = 1,800 qp(Tp + Tr),
where qp is unit-hydrograph peak discharge in cubic feet
per second, Tp is the time-to-peak discharge in hours, and
8 Equations for Estimating Synthetic Unit-Hydrograph Parameter Values for Small Watersheds in Lake County, Illinois

Syn
thetic U
nit-H
ydro
grap
h M
etho
ds
9
Figure 3. Soil Conservation Service dimensionless curvilinear unit hydrograph and equivalent triangular unit hydrograph.

Tr is the time of recession in hours, which is equal to 1.67 Tp for the SCS dimensionless, triangu-lar unit hydrograph.
Therefore, the volume is
V = 1,800 qp(Tp + 1.67Tp) = 4,800 qpTp. (3)
Combining equations 2 and 3, the triangular unit-hydrograph peak discharge is
qp = 484 A/Tp. (4)
The SCS dimensionless, triangular unit hydrograph is an approximation of the SCS dimensionless, curvilin-ear unit hydrograph, as illustrated in figure 3. Thus, equation 4 also expresses the relation between peak discharge and time-to-peak for the curvilinear unit hydrograph. Further, equation 4 is applied in (1) the computer program (Soil Conservation Service, 1982) implementing the SCS Technical Release 20 (TR20), which was utilized to develop the nomographs and tables for estimating peak discharges and design hydrographs in SCS TR55 (Soil Conservation Service, 1986); and (2) the implementation of the SCS dimen-sionless unit hydrograph in HEC-1 (U.S. Army Corps of Engineers, 1990). In the SCS dimensionless unit-hydrograph method, the time-to-peak is estimated as
Tp = Td/2 + UL, (5)
where Td is the duration of effective precipitation and UL is the unit-graph lag. The unit-graph lag is the time from the centroid of effective rainfall hyetograph to the time of peak discharge. The shape of the SCS dimensionless unit hydrograph is most correct when the duration of effective precipitation equals 0.222 UL. However, equation 5 is commonly applied for effec-tive-precipitation durations substantially different than 0.222 UL to circumvent complex S-curve computations of the appropriate unit hydrograph.
On the basis of the derivation of equation 4 given previously, the value of the peak factor (484) is fixed for the shape of the SCS dimensionless unit hydrograph shown in figure 3. Changing the peak factor would require development of a new dimensionless unit hydrograph for each watershed. Therefore, it is not practical to develop relations between the peak factor and watershed and storm characteristics from rainfall and runoff data in Lake County. The reliability of the
fixed peak factor (484) was checked in two ways for this study. First, calibrated values of UL are determined for each storm on each watershed in HEC-1 simulation. The corresponding peak discharge for the calibrated hydrograph is compared to the measured peak dis-charge to determine the percent error resulting from the use of the fixed peak factor. Second, values of qpTp/A can be determined for each storm on each watershed by manual analysis of the rainfall and runoff data with the assumption that each direct-runoff hydrograph is the result of a single period of uniform effective precipita-tion. Almost all of the direct-runoff hydrographs are the result of storms with several periods of effective precip-itation (multiperiod storms). For multiperiod storms, deconvolution techniques must be applied to determine the unit hydrograph. Deconvolution is difficult to apply and erratic variations in the computed unit hydrograph may result because of errors in the data and in the deter-mination of the time distribution of the effective precip-itation (Chow and others, 1988, p. 218). Therefore, deconvolution was not done, and the comparison of the fixed peak factor and the measured peak factors is only approximate because the measured unit hydrographs do not meet the theoretical definition of a unit hydrograph as resulting from a storm of uniform effec-tive-precipitation intensity.
Linear-Reservoir Method
The linear reservoir described in equation 1 can be applied to obtain a unit hydrograph on the basis of the following procedure. The instantaneous unit hydrograph (the unit hydrograph resulting from 1 in. of effective precipitation falling in an infinitesimal period of time) resulting for a watershed simulated with a lin-ear-reservoir model is
Q(t) = (1/R)e-t/R, (6)
where Q(t) is the discharge at time t. The derivation of equation 6 is given in Chow and others (1988, p. 208). The unit hydrograph corresponding to an effective precipitation with a duration of Td hours may be obtained by integrating the convolution integral:
, (7)Qu t( ) I τ( ) 1/R( )e τ t–( )/R–
0
Td
∫ dτ=
10 Equations for Estimating Synthetic Unit-Hydrograph Parameter Values for Small Watersheds in Lake County, Illinois
where Qu(t) is the unit-hydrograph value at time t, τ is a dummy parameter for integration, I(τ) is the intensity of effective-precipitation input
converted to a discharge for the watershed area,
which is
I(τ) = A(1 in./TD)(5,280 ft/1 mi)2(1 hour/3,600 second)(1 ft/12 in.) = 645.33 A/TD
for 0 ≤¹ τ ≤¹ Td, and
I(τ) = 0
for τ > Td.Integration of equation 7 to a time equal to Td yields
Qu(t) = 645.33A/Td (1 - e-t/R). (8a)
This is the unit hydrograph up to t = Td. For times after Td, application of S-curve principles (Chow and others, 1988, p. 213-218; Viessman and others, 1989, p. 192-196) to express the drainage from the linear reservoir result in the remainder of the unit hydrograph
Qu(t) = 645.33A/Td (e-(t-Td)/R - e-t/R). (8b)
Only the storage coefficient, R, is required for the linear-reservoir method of computing the synthetic unit hydrograph presented above. For a single linear-reser-voir model, the storage coefficient is equal to the hydrograph-time lag, TL, which is the time difference between the centers of mass of the direct-runoff hydrograph and the effective precipitation hyetograph. Therefore, the R for the linear-reservoir method was determined manually from the direct-runoff hydrograph and effective precipitation hyetograph.
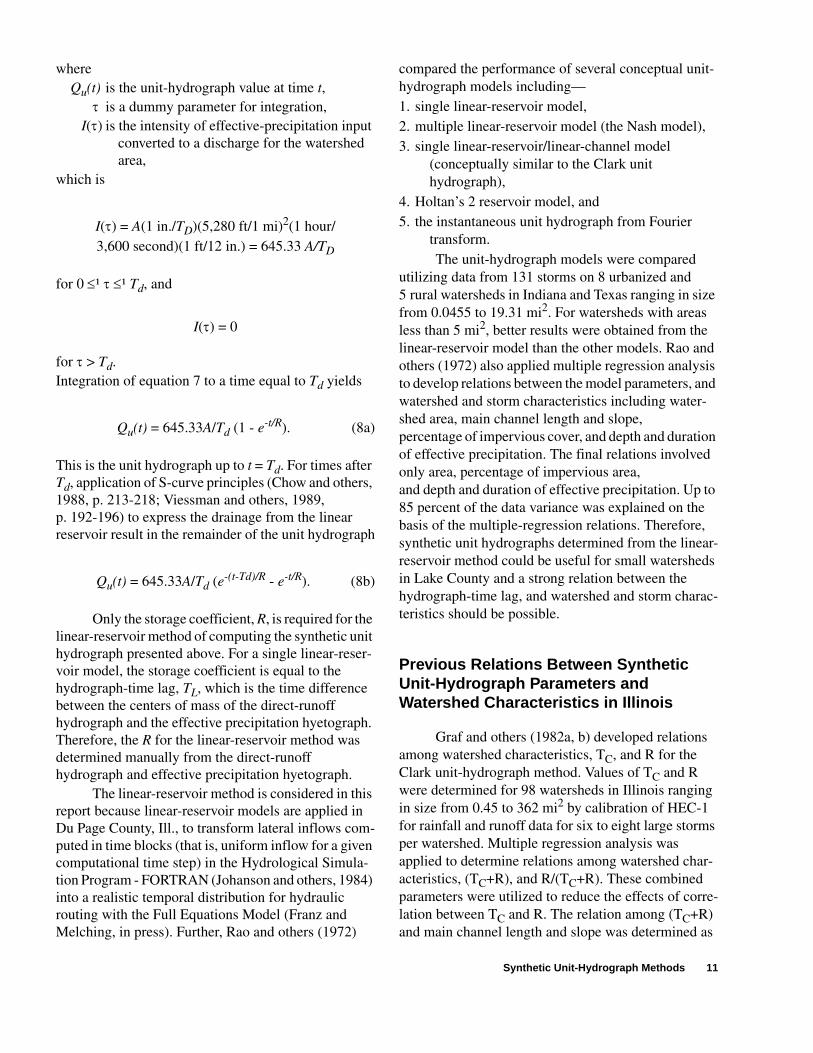
The linear-reservoir method is considered in this report because linear-reservoir models are applied in Du Page County, Ill., to transform lateral inflows com-puted in time blocks (that is, uniform inflow for a given computational time step) in the Hydrological Simula-tion Program - FORTRAN (Johanson and others, 1984) into a realistic temporal distribution for hydraulic routing with the Full Equations Model (Franz and Melching, in press). Further, Rao and others (1972)
compared the performance of several conceptual unit-hydrograph models including—1. single linear-reservoir model,2. multiple linear-reservoir model (the Nash model),3. single linear-reservoir/linear-channel model
(conceptually similar to the Clark unit hydrograph),
4. Holtan’s 2 reservoir model, and5. the instantaneous unit hydrograph from Fourier
transform.The unit-hydrograph models were compared
utilizing data from 131 storms on 8 urbanized and 5 rural watersheds in Indiana and Texas ranging in size from 0.0455 to 19.31 mi2. For watersheds with areas less than 5 mi2, better results were obtained from the linear-reservoir model than the other models. Rao and others (1972) also applied multiple regression analysis to develop relations between the model parameters, and watershed and storm characteristics including water-shed area, main channel length and slope, percentage of impervious cover, and depth and duration of effective precipitation. The final relations involved only area, percentage of impervious area, and depth and duration of effective precipitation. Up to 85 percent of the data variance was explained on the basis of the multiple-regression relations. Therefore, synthetic unit hydrographs determined from the linear-reservoir method could be useful for small watersheds in Lake County and a strong relation between the hydrograph-time lag, and watershed and storm charac-teristics should be possible.
Previous Relations Between Synthetic Unit-Hydrograph Parameters and Watershed Characteristics in Illinois
Graf and others (1982a, b) developed relations among watershed characteristics, TC, and R for the Clark unit-hydrograph method. Values of TC and R were determined for 98 watersheds in Illinois ranging in size from 0.45 to 362 mi2 by calibration of HEC-1 for rainfall and runoff data for six to eight large storms per watershed. Multiple regression analysis was applied to determine relations among watershed char-acteristics, (TC+R), and R/(TC+R). These combined parameters were utilized to reduce the effects of corre-lation between TC and R. The relation among (TC+R) and main channel length and slope was determined as
Synthetic Unit-Hydrograph Methods 11

(TC+R) = 35.2L0.39S-0.78, (9)
where L is the stream length measured along the main channel from the watershed outlet to the watershed divide in miles, and S is the main channel slope deter-mined from elevations at points 10 and 85 percent of the distance along the channel from the watershed out-let to the watershed divide, in feet per mile. Regional values of R/(TC+R) were determined for various areas of the State. A value of R/(TC+R) equal to 0.7 is appro-priate for the study area in Lake County. It was hypoth-esized that these regional values partially account for aspects of watershed geomorphology and land cover/land use not considered in the analysis, such as imper-vious area and wetland area.
Singh (1981) developed synthetic unit hydro-graphs for use in dam safety studies in Illinois. The Singh synthetic unit hydrograph applied modifications of the Snyder (1938) synthetic unit hydrograph. In the Snyder synthetic unit hydrograph, the peak discharge, runoff duration, and hydrograph width at various per-centages of the peak discharge are related to the time-to-peak, and the time-to-peak is related to watershed characteristics. Singh (1981) determined relations among watershed characteristics and the peak dis-charge, time-to-peak, runoff duration, and several key ordinates of the unit hydrograph. Unit hydrographs were determined, converted to a common storm dura-tion utilizing the S-curve, averaged, and smoothed for rainfall and runoff data for four large storms on each of 131 watersheds in Illinois ranging in size between 0.07 and 464 mi2. The State of Illinois was subdivided into eight hydrologic regions, and relations between water-shed characteristics and hydrograph parameters were developed for each region. For the region including Lake County, data from 20 watersheds, ranging in size between 0.07 and 324 mi2, were utilized. The resulting relation for the time-to-peak (tps) is
tps = 3.0 A0.421S-0.075. (10)
The Snyder (1938) synthetic unit hydrograph is not studied in detail in this report. However, the Snyder and Clark synthetic unit hydrographs are strongly related in HEC-1, and hydrograph parameters for the Snyder syn-thetic unit hydrograph corresponding to the optimized Clark synthetic unit hydrograph are output in HEC-1. Therefore, the utility of the Singh (1981) synthetic unit
hydrograph for application in Lake County can be con-sidered here.
Hydrograph-parameter values for small water-sheds (less than 25 mi2) in Lake County estimated on the basis of the previous studies are subject to three deficiencies in the data and analyses. These deficien-cies are discussed in detail below.
The rain gages utilized to determine the water-shed-average storm rainfall and the temporal distribu-tion of rainfall were often located 5 to 25 mi outside of the watershed where runoff data were available. There-fore, uncertainties in the temporal distribution of effec-tive precipitation could substantially affect the reliability of the hydrograph parameters determined by Graf and others (1982a) from calibration of TC and R in HEC-1. Further, uncertainties in effective precipita-tion could appreciably affect the estimated storm dura-tion in the determination of the unit hydrograph in Singh (1981). Problems in determining storm duration are a primary cause of variations in the S-curve that are difficult to correct. Thus, if the storm duration is incor-rectly identified, the S-curve and averaged and smoothed unit hydrograph could be substantially affected.
Neither Graf and others (1982a) nor (Singh, 1981) directly considered the effects of land-cover/land-use characteristics that could substantially affect the hydrograph parameters, such as percentages of impervious cover and wetland cover. These factors are partially considered in the development of the Singh (1981) synthetic unit hydrograph by the division of the State into eight regions. However, as discussed later, the variation of fraction of impervious area and fraction of wetland area is substantial within Lake County, which constitutes a small portion of the region consid-ered by Singh. These factors also are partially accounted for by the regional variation in R/(TC+R) in the analysis of Graf and others (1982b). Graf and others (1982b) noted that the scattergrams of the esti-mated and measured values of TC and R showed no clear separation of the results for the 19 urban water-sheds studied relative to the results for all other water-sheds.
A substantial amount of data from watersheds larger than the largest watershed in Lake County ana-lyzed in this study (37 mi2) was utilized in each previ-ous study. Fifty-one of the 98 watersheds analyzed by Graf and others (1982a and b) were larger than 37 mi2 and 63 were larger than 25 mi2. The large amounts of data from large watersheds may appreciably affect the
12 Equations for Estimating Synthetic Unit-Hydrograph Parameter Values for Small Watersheds in Lake County, Illinois

reliability of estimates of TC and R for small water-sheds. Only 5 of the 20 watersheds analyzed by Singh (1981) for the region including Lake County were larger than 37 mi2, and 8 were larger than 25 mi2. How-ever, the average area in this region was 54 mi2, and because area is a key parameter in equation 10, the esti-mated values of tps may be appreciably affected by the values for the large watersheds.
To assess the utility of the methods of Graf and others (1982b) and Singh (1981), TC and R are esti-mated for each watershed studied by the method of Graf and others (1982b), and tps is estimated by the method of Singh (1981). These estimated values are compared to the values obtained from calibration of HEC-1 for rainfall and runoff data for each watershed.
DETERMINATION AND EVALUATION OF SYNTHETIC UNIT-HYDROGRAPH PARAMETERS
Determination of parameters for synthetic unit hydrographs involved storm selection on the basis of a detailed analysis of available rainfall and runoff data, manual computations of the selected storms to deter-mine hydrograph-time lag and an approximate peak factor for the SCS dimensionless unit hydrograph, and calibration of the selected storms with HEC-1 (U.S. Army Corps of Engineers, 1990). Calibration was done to obtain optimal values of TC and R for the Clark unit hydrograph and UL for the SCS dimension-less unit hydrograph. Evaluation of the parameters determined in this study included consideration of the fit quality of the calibrated hydrographs and compari-son of the parameters to the results of previously developed relations for the estimation of parameters for synthetic unit hydrographs.
Storm Selection
A unit hydrograph is the discharge-time graph (hydrograph) of a unit volume of direct runoff resulting from a spatially evenly distributed effective precipita-tion (approximately equal to precipitation excess if interflow is small) with a uniform intensity over a given duration. Thus, storms for determination of parameters for synthetic unit hydrographs should be selected to conform to some extent with the definition of a unit hydrograph. Ideally, Viessman and others (1989, p. 186) recommend that the storms utilized to
determine unit hydrographs should include the follow-ing characteristics.1. Storms with a simple storm structure resulting in
well defined hydrographs with distinct peaks.2. Storms with uniform distribution of rainfall through-
out the period of effective precipitation.3. Storms with uniform spatial distribution over the
entire watershed.Calibration of HEC-1 (U.S. Army Corps of Engineers, 1990) reduces the importance of the second character-istic because the multiple periods of effective precipita-tion are adequately deconvoluted in the calibration process if the direct-runoff hydrograph is well defined with a distinct peak (characteristic 1). Further, Viessman and others (1989, p. 186) recommend that the direct runoff for the selected storm should range from 0.5 to 1.75 in. The design storms to be simulated with the synthetic unit hydrographs will typically result in direct runoff values in this range. Further, Laurenson and Mein (1985, p. 87) stated that small storms, result-ing in less than about 0.4 in. of runoff, are often more difficult to fit than large storms because of extreme areal variability of runoff, partial-area runoff, and large differences in the time distribution of effective precipi-tation resulting from small errors in the applied abstrac-tion model. Therefore, selection of storms resulting in at least 0.4 in. of direct runoff could reduce problems resulting from nonuniform spatial distributions of effective precipitation (characteristic 3). Thus, only storms resulting in at least 0.4 in. of direct runoff were considered in this study (with the exception of one storm with 0.36 in. of direct runoff on Green Lake Ditch). Hydrographs that were affected by snowmelt were not considered in this study.
Determination of direct-runoff hydrographs requires separation of (subtraction of) base flow from the total-runoff hydrograph. Base flow was estimated by extending the trend in flow prior to the start of the storm (linearly or with the application of the standard recession curve described below) to the time of peak discharge. After the time of peak discharge the base flow increased linearly to the time when the total- runoff hydrograph consisted of only base flow. This time was defined as the point on a semilogarithmic plot of the total-runoff hydrograph (with discharge on the logarithmic scale), where the recession limb becomes approximately linear as described in Chow (1964, p. 14-10).
Storms may be spaced in time such that well-defined rises in the hydrograph with distinct peaks
Determination and Evaluation of Synthetic Unit-Hydrograph Parameters 13

result, but the second rise begins in the latter part of the recession curve of the first rise. In this case, rises in the hydrograph must be separated so that the direct-runoff hydrographs from each storm may be evaluated. Storm separation was done on the basis of a standard reces-sion curve. The standard recession curve was devel-oped by averaging the recession curves for the storms on the given watershed that were not affected by addi-tional rainfall during the recession period. Typically, the agreement among these recession curves was close. In storm separation, the standard recession curve was matched to the recession curve of the first rise and uti-lized to extend the normal recession under the second rise. In some cases, the second rise began at discharges above those utilized in the standard recession curve and the direct-runoff hydrographs resulting from the two storms could not be reliably separated. The computed depth of direct runoff, direct-runoff peak discharge, and time-to-peak discharge for the direct runoff for each storm on each watershed are listed in table 10 (at the end of the report) for the storms utilized to develop and verify the hydrograph-parameter estimation equa-tions.
Hydrograph-Parameter Determination by Manual Computation
The hydrograph-time lag is the time difference between the center of mass of the direct-runoff hydrograph and the effective precipitation hyetograph. The direct-runoff hydrograph is obtained as previously described. The effective precipitation hyetograph was estimated by applying a uniform loss rate to the hyeto-graph of basin average precipitation (determined with Thiessen polygons). The uniform loss rate was adjusted such that effective precipitation equalled the depth of direct runoff. The centers of mass of the direct-runoff hydrograph and effective precipitation hyetograph were then computed on the basis of 1-hour data for the watersheds larger than 5 mi2 and 5-minute data for the watersheds smaller than 1 mi2. The computed hydrograph-time lags for each storm on each watershed are listed in table 10 for the storms utilized to develop and verify the hydrograph-parameter estimation equa-tions.
The peak factor (qPTP/A) for the SCS dimen-sionless unit hydrograph was approximated utilizing the assumption that the direct-runoff hydrograph resulted from a single period of uniform effective precipitation. Therefore, the unit-hydrograph peak
discharge (qP) was determined by dividing the direct-runoff peak discharge by the depth of direct runoff. Determination of the time-to-peak was more difficult. For storms with a single, distinct period of effective precipitation (1 to 5 hours of more than 0.1 in/h) or with an extended period of light (less than 0.09 in/h) varied effective precipitation, the time from beginning of effective precipitation to direct-runoff peak discharge was taken as TP. For storms with several hours of more than 0.1 in. of effective precipitation separated by a few hours, these multiple hours of “heavy rain” (multiple 5-minute periods of heavy rain were considered for Terre Faire Ditch and Green Lake Ditch) result in incomplete rises in the rising limb of the direct-runoff hydrograph and (or) prolonged high discharges in the vicinity of the peak discharge. Thus, the time from beginning of effective precipitation to direct-runoff peak discharge may be considerably longer than the time-to-peak for the separate periods of heavy rain. For these storms, the time-to-peak corresponding to the period of the largest effective precipitation is taken as TP. The peak factor was then computed as the product of the estimated TP and qP divided by the watershed area. For the second type of storm, the computed peak factor is less than the actual peak factor because the measured direct-runoff peak discharge is primarily the result of a fraction of the total depth of direct runoff; therefore, qP is underestimated. The appropriate frac-tion of the depth of direct runoff can only be assessed by deconvoluting the direct-runoff hydrograph. The computed peak factors for each storm on each water-shed are listed in table 10 for the storms utilized to develop and verify the hydrograph-parameter estima-tion equations.
Hydrograph-Parameter Determination by Rainfall-Runoff Model Calibration
The time of concentration and watershed-storage coefficient for the Clark (1945) unit hydrograph were determined by calibrating HEC-1 (U.S. Army Corps of Engineers, 1990) for hyetographs of basin average precipitation (determined with Thiessen polygons) and direct-runoff hydrographs for a total of 66 storms on the nine watersheds utilized to develop and 11 storms utilized to verify the hydrograph-parameter estimation equations. Optimal values of the initial loss and con-tinuing-loss rate also were determined in HEC-1 cali-bration, primarily to match the depths of effective precipitation and direct runoff, and were not used
14 Equations for Estimating Synthetic Unit-Hydrograph Parameter Values for Small Watersheds in Lake County, Illinois

further in the development of the estimation equations. The quality of the calibration was assessed on the basis of the coefficient of model-fit efficiency (Nash and Sutcliffe, 1970):
, (11)
where Qmi is the measured direct runoff at time i, Qm is the average measured direct runoff for the
storm, Qsi is the simulated direct runoff at time i, and n is the number of simulated hydrograph ordi-
nates.Multiple starting points were utilized, as necessary, in the nonlinear optimization applied in HEC-1 to ensure that a close match between the measured and simulated direct-runoff hydrographs was obtained. The percent-age error between the measured and simulated direct-runoff peak discharges was computed as a measure of the reliability of applying the Clark unit-hydrograph method in Lake County. The time of concentration and watershed-storage coefficient for the Clark unit hydrograph, the time-to-peak for the Snyder synthetic unit hydrograph, the model-fit efficiency, and the per-centage error in the simulated direct-runoff peak dis-charge are listed in table 11 (at the end of the report) for the storms utilized to develop and verify the hydrograph-parameter estimation equations.
Model-fit efficiency values greater than 0.9, generally, indicate a close match between measured and simulated direct-runoff hydrographs. The model-fit efficiency for 15 of the 66 storms utilized to develop and 2 of the 11 storms utilized to verify the hydrograph-parameter estimation equations was less than 0.9. Four of the 17 storms were on Bull Creek, but model-fit efficiencies greater than 0.875 resulted for 3 of those storms. Three of the 17 storms were on Green Lake Ditch. Green Lake Ditch is the smallest and most impervious watershed considered, and the hydrographs indicate a rapid response to rainfall that is difficult to simulate. The remainder of the storms with model-fit efficiencies less than 0.9 were distributed among the other watersheds. The average model-fit efficiency and percentage error in simulation of direct-runoff peak discharge are listed in table 3 for each watershed. The average percentage errors listed in table 3 indicate that under optimal (calibrated) conditions application of the Clark unit-hydrograph method results in average over-estimations of the measured peak discharge from 5.9 to 19.1 percent for watersheds in Lake County.
The unit-graph lag for the SCS dimensionless unit hydrograph (Snider, 1971) was determined by cal-ibrating HEC-1 (U.S. Army Corps of Engineers, 1990) for hyetographs of basin average precipitation (deter-mined with Thiessen polygons) and direct-runoff hydrographs for a total of 66 storms on the nine water-sheds utilized to develop and 11 storms utilized to verify the hydrograph-parameter estimation equations. The application of the fixed peak factor (qPTP/A = 484) in the SCS dimensionless unit-hydrograph method precludes obtaining close fits between the measured and simulated direct-runoff hydrographs. Therefore, the model-fit efficiency was not computed for the
EFF
Qmi Qm–( )2 Qmi Qsi–( )2
i 1–
n
∑–i 1=
n
∑
Qmi Qm–( )2
i 1
n
∑
-------------------------------------------------------------------------------------=
Determination and Evaluation of Synthetic Unit-Hydrograph Parameters 15
Table 3. Average values of measures of calibration quality for the calibrated Clark unit-hydrograph method and the calibrated Soil Conservation Service dimensionless unit-hydrograph method for all storms on selected watersheds in Lake County, Ill., utilized to develop and verify the equations for estimation of synthetic unit-hydrograph parameters[SCS, Soil Conservation Service]
SCS dimensionlessClark unit hydrograph unit hydrograph
Model-fit Error in simulated Error in simulatedNumber of efficiency peak discharge peak discharge
Watershed storms (percent) (percent)
Bull Creek 11 0.913 19.1 120Terre Faire Ditch 4 .933 16.8 56.3Indian Creek 11 .954 9.5 46.2Green Lake Ditch 4 .855 17.4 74.2North Branch Chicago River 10 .961 5.9 71.6Skokie River at Lake Forest 10 .938 16.4 99.3Skokie River near Highland Park 7 .952 9.3 59.3Squaw Creek 8 .885 15.0 75.1Flint Creek 12 .942 7.4 38.9

Table 4. Range and mean of unit-hydrograph peak factors of the type applied in the Soil Conservation Service dimensionless unit-hydrograph method determined by manual hydrograph analysis for all storms on selected watersheds in Lake County, Ill., utilized to develop and verify the equations for estimation of synthetic unit-hydrograph parameters
Watershed Minimum Mean Maximum
Bull Creek 112 236 355Terre Faire Ditch 306 415 494Indian Creek 333 397 447Green Lake Ditch 121 276 449North Branch Chicago River 155 320 474Skokie River at Lake Forest 189 319 411Skokie River near Highland Park 190 363 478Squaw Creek 143 267 422Flint Creek 305 390 487
calibrated hydrographs for the SCS dimensionless unit-hydrograph method. The unit-graph lag for the SCS dimensionless unit hydrograph and the percentage error in the simulated direct-runoff peak discharge are listed in table 12 (at the end of the report) for the storms utilized to develop and verify the hydrograph-parame-ter estimation equations. The average percentage error in simulation of direct-runoff peak discharge is listed for each watershed in table 3.
The average percentage errors listed in table 3 indicate that under optimal (calibrated) conditions application of the SCS dimensionless unit-hydrograph method results in average overestimations of the measured peak discharge of 38.9 to 120 percent for watersheds in Lake County. These results are supported by the range and mean of the computed peak factors listed in table 4. For each of the nine watersheds in Lake County studied, the mean of the estimated peak factors is considerably less than the fixed value of 484 applied in the SCS dimensionless unit-hydrograph method.
Comparison of Calibrated Hydrograph-Parameter Values with Results of Previous Relations
For estimation of unit hydrographs for water-sheds in Illinois, Graf and others (1982b) developed relations between TC and R for the Clark (1945) unit hydrograph and watershed characteristics, and Singh (1981) developed relations between tps of a modified Snyder (1938) unit hydrograph and watershed charac-teristics. Data from the Skokie River streamflow gages at Lake Forest and near Highland Park were considered in the development of the method of Graf and others. Data from the streamflow gages on the Skokie River at
Lake Forest and the North Branch Chicago River were considered in the development of the method of Singh.
The results of applying the methods of Graf and others (1982b) and Singh (1981) to the gaged watersheds in Lake County and the results of HEC-1 (U.S. Army Corps of Engineers, 1990) calibration for these watersheds are shown in tables 5-7. The value of TC, estimated with the method of Graf and others, is within the range of values determined in this study for Terre Faire Ditch, Indian Creek, North Branch Chicago River, and Squaw Creek (table 5), and for each of these watersheds the difference between the estimated and mean values is greater than 40 percent. The value of R, estimated with the method of Graf and others, is within the range of values determined in this study for Bull Creek, North Branch Chicago River, Skokie River at Lake Forest, and Skokie River near Highland Park (table 6). As expected, the agreement between the estimated and mean values for both Skokie River watersheds is within 20 percent. The value of tps estimated with the method of Singh is within the range of values determined in this study for Terre Faire Ditch, Indian Creek, North Branch Chicago River, and Squaw Creek (table 7). These results indicate that the previous studies may yield reliable estimates for some watersheds in Lake County, but that development of relations for estimation of hydrograph parameters specifically for application in Lake County will provide valuable information for engineers and planners.
EQUATIONS FOR ESTIMATING SYNTHETIC UNIT-HYDROGRAPH PARAMETERS
The equations for estimating four synthetic unit-hydrograph parameters (time of concentration and
16 Equations for Estimating Synthetic Unit-Hydrograph Parameter Values for Small Watersheds in Lake County, Illinois

Table 5. Time of concentration for the Clark unit-hydrograph method estimated with the method of Graf and others (1982b) compared with the minimum, mean, and maximum values determined from calibration for all storms on selected watersheds in Lake County, Ill., utilized to develop and verify the equations for estimation of synthetic unit-hydrograph parameters
Estimated from Determined from storm calibrationGraf and others Minimum Mean Maximum
Watershed (hours) (hours) (hours) (hours)
Bull Creek 8.94 1.03 1.81 4.62Terre Faire Ditch .30 .12 .53 1.17Indian Creek 3.58 3.57 12.1 23.8Green Lake Ditch 1.11 .09 .098 .11North Branch Chicago River 11.6 1.17 6.38 18.8Skokie River at Lake Forest 6.99 1.04 2.09 5.34Skokie River near Highland Park 8.61 1.42 4.75 7.05Squaw Creek 6.93 4.03 12.1 27.5Flint Creek 5.66 13.1 30.7 57.7
Table 6. Watershed-storage coefficient for the Clark unit-hydrograph method estimated with the method of Graf and others (1982b) compared with the minimum, mean, and maximum values determined from calibration for all storms on selected watersheds in Lake County, Ill., utilized to develop and verify the equations for estimation of synthetic unit-hydrograph parameters
Estimated from Determined from storm calibrationGraf and others Minimum Mean Maximum
Watershed (hours) (hours) (hours) (hours)
Bull Creek 20.9 19.6 29.0 38.1Terre Faire Ditch .70 .93 1.47 2.67Indian Creek 8.35 16.7 28.7 45.9Green Lake Ditch 2.58 .83 .89 .99North Branch Chicago River 27.2 17.7 24.3 28.7Skokie River at Lake Forest 16.3 13.1 19.8 26.9Skokie River near Highland Park 20.1 13.2 22.9 31.8Squaw Creek 16.2 34.6 53.2 73.1Flint Creek 13.2 36.0 52.1 78.3
Table 7. Time-to-peak for the Snyder unit-hydrograph method estimated with the method of Singh (1981) compared with the minimum, mean, and maximum values determined from calibration for all storms on selected watersheds in Lake County, Ill., utilized to develop and verify the equations for estimation of synthetic unit-hydrograph parameters
Estimated Determined from storm calibrationfrom Singh Minimum Mean Maximum
Watershed (hours) (hours) (hours) (hours)
Bull Creek 5.98 1.79 2.78 5.17Terre Faire Ditch .75 .23 .54 1.10Indian Creek 11.1 3.91 11.9 22.5Green Lake Ditch .75 .14 .145 .15North Branch Chicago River 9.63 1.82 6.67 17.7Skokie River at Lake Forest 7.76 1.80 2.87 5.52Skokie River near Highland Park 9.56 2.24 5.19 7.13Squaw Creek 8.84 4.87 12.6 27.9Flint Creek 11.7 13.6 29.9 54.0
watershed-storage coefficient for the Clark unit hydrograph, unit-graph lag for the SCS dimensionless unit hydrograph, and hydrograph-time lag) were devel-
oped utilizing the results of calibration and manual computations for 66 storms on nine small watersheds in Lake County, Ill. Eleven storms on eight of the small
Equations for Estimating Synthetic Unit-Hydrograph Parameters 17

watersheds were utilized to verify the estimation equa-tions. The procedure applied to develop the estimation equations, the resulting equations, the results of equa-tion verification, and the range of applicability of the equations are presented below.
Equation Development
Equations for estimating synthetic unit-hydrograph parameters were developed utilizing multi-ple linear regression to relate the logarithms of hydrograph parameters to logarithms of watershed area; main channel length and slope; percentages plus one of impervious, forest, and wetland cover; depth, duration, and maximum 1-hour depth of effective pre-cipitation; and depth, duration, and maximum 1-hour depth of precipitation. The multiple linear regression in logarithms resulted in estimation equations of the form
hpi = a W1b1 W2
b2 ... S1c1 S2
c2 ... , (12)
where hpi is hydrograph parameter i, Wj are watershed characteristics j, Sk are storm characteristics k, a is a coefficient, bj are exponents corresponding to water-shed characteristics j, and ck are exponents correspond-ing to storm characteristics k. Nonlinear equations, such as equation 12, between hydrograph parameters, and watershed and storm characteristics have been determined theoretically from the kinematic wave approximation (Ragan and Duru, 1972), experimen-tally in the laboratory (Shen, 1974), and empirically from field data (Snyder, 1938; Rao and others, 1972; and others). The multiple linear regression was applied in a stepwise approach. Watershed and storm character-istics were added to the regression model (eq. 12) one at a time, and characteristics were retained in the regression model only if the corresponding exponents were statistically significant (the corresponding 95-percent confidence interval for the parameter did not include zero) and the sign of the exponent was correct from a physical viewpoint. For example, hydrograph-timing parameters should increase with increasing area, main channel length, and percentage of open water, and decrease with increasing slope and per-centage of impervious cover (which indicates a decrease in overland flow roughness and, typically, an increase in channelized drainage).
Watershed area and main channel length are both scale parameters and strongly correlated. Thus,
separate equations for estimating the hydrograph parameters were developed with watershed area and main channel length as the primary watershed charac-teristics. The equations for estimating the synthetic unit-hydrograph parameters in hours as a function of watershed and storm characteristics with watershed area as the primary watershed characteristic are
TC = 39.1 A0.577(I+1)-1.146D0.781, (13)
R = 123 A0.390(I+1)-0.722S-0.303, (14)
UL = 44.5 A0.483(I+1)-0.805D0.336, (15)
and
TL = 119 A0.345(I+1)-0.690S-0.182D0.187. (16)
where I is the percentage of impervious cover, and D is the depth of effective precipitation in inches. The equations for estimating the synthetic unit-hydrograph parameters in hours as a function of watershed and storm characteristics with main channel length as the primary watershed characteristic are
TC = 87.5 L0.868(I+1)-1.563D0.780, (17)
R = 81.1 L0.759(I+1)-0.994, (18)
UL = 74.9 L0.777(I+1)-1.133D0.371, (19)
and
TL = 105 L0.637(I+1)-0.930D0.214. (20)
The multiple correlation coefficient and standard error in the logarithms for these equations are listed in table 8. With the exception of the Clark time of concentration, more than 90 percent of the variance in the logarithms of each of the hydrograph parameters is explained by equations 13-20. The hydrograph parameters estimated with equations utilizing area (equations 13-16) and the hydrograph parameters determined through calibration or manual computations are shown in scattergrams in figures 4-7,
18 Equations for Estimating Synthetic Unit-Hydrograph Parameter Values for Small Watersheds in Lake County, Illinois

Table 8. Standard error and multiple correlation coefficient for logarithmic data in the equations for estimating synthetic unit-hydrograph parameters for Lake County, Ill.
Synthetic Multiple correlation coefficient Standard errorunit- Equation Equation Equation Equation
hydrograph utilizing utilizing utilizing utilizingparameter area length area length
Clark timeof concentration 0.873 0.845 0.735 0.808Clark storagecoefficient .961 .957 .296 .308Soil Conservation Serviceunit-graph lag .968 .961 .272 .286hydrograph-time lag .963 .963 .247 .242
respectively. The results for the equations utilizing main channel length (equations 17-20) are similar to those shown in figures 4-7 and are not included here.
The watershed and storm characteristics included in equations 13-20 are consistent with physi-cal reasoning and the results of controlled experiments (Shen, 1974), which supports application of these equations on ungaged watersheds. For example, the storage in the stream system upstream from a point (streamflow gage) should be a function of the physical characteristics of the watershed independent of storm characteristics. Shen (1974) found that for laboratory experiments of the rainfall-runoff process on impervi-ous surfaces, the hydrograph-timing parameters were mildly affected by watershed slope. Thus, it is reason-able that main channel slope is included in only one of six equations for estimating hydrograph-timing parameters. Further, inclusion of the main channel slope could improve the equations for estimating TC; however, the exponent on slope would be positive indicating TC increases with slope. This is not reason-able from a physical viewpoint, and this result further indicates the relative insensitivity of hydrograph- timing parameters to slope. Finally, Shen (1974) found that hydrograph-timing parameters increased with the product of storm intensity and duration (storm depth). Thus, it is reasonable that each synthetic unit-hydrograph time parameter increases with the depth of effective precipitation.
Equations for estimating TC+R and R/(TC+R) as a function of watershed and storm characteristics, as done by Graf and others (1982b), also were evaluated. Equations for estimating TC+R were obtained with multiple correlation coefficients greater than 0.96. However, equations for estimating R/(TC+R) had multiple correlation coefficients less than 0.7, and
comparison of the results from these equations with the values determined from calibration indicated high scatter in the estimates. Therefore, the equations for estimating TC and R separately are more reliable for application in Lake County.
Equation Verification
During the 1995 Water Year (October 1, 1994-September 30, 1995), 11 storms on eight of the nine watersheds, which met the criteria for storm selection discussed previously, were identified for verification of the equations for estimation of synthetic unit-hydrograph parameters. These verification storms were analyzed manually and through HEC-1 calibration to determine storm and hydrograph characteristics, and synthetic unit-hydrograph parameters in the same manner as the 66 storms utilized to develop the estima-tion equations. The direct-runoff depth and peak dis-charge, time-to-peak discharge, hydrograph-time lag, and peak factor for the verification storms are listed in table 10. The time of concentration, watershed-storage coefficient, Snyder unit-hydrograph time-to-peak, model-fit efficiency, and percentage error in the peak discharge for the HEC-1 calibration of the Clark unit hydrograph for the verification storms are listed in table 11. The unit-graph lag and percentage error in peak dis-charge for the HEC-1 calibration of the SCS dimen-sionless unit hydrograph for the verification storms are listed in table 12.
Equation 13 was utilized to estimate TC values for the Clark unit-hydrograph method for the verifica-tion storms as a function of the watershed area, percent-age of impervious cover, and depth of effective precipitation. The estimated TC values and the measured TC values for the verification storms are
Equations for Estimating Synthetic Unit-Hydrograph Parameters 19

shown in figure 4. Equation 14 was utilized to estimate R values for the Clark unit-hydrograph method for the verification storms as a function of the watershed area, percentage of impervious cover, and main channel slope. The estimated R values and the measured R values for the verification storms are shown in figure 5. Equation 15 was utilized to estimate UL values for the SCS dimensionless unit hydrograph for the verification storms as a function of the watershed area, percentage of impervious cover, and depth of effective precipita-tion. The estimated UL values and the measured UL val-ues for the verification storms are shown in figure 6. Equation 16 was utilized to estimate TL values for the verification storms as a function of the watershed area, percentage of impervious cover, main channel slope, and depth of effective precipitation. The estimated TL values and the measured TL values for the verification storms are shown in figure 7. The synthetic unit-hydrograph-parameter values estimated for the verifi-cation storms with equations 13-16 are scattered around the line of perfect agreement between estimated and measured values (1:1 line on figs. 4-7) in a similar manner as the synthetic unit-hydrograph parameter val-ues estimated for the storms utilized in the develop-ment of the equations. Therefore, the accuracy of equations 13-16 when estimating synthetic unit-hydrograph parameters for independent storms is simi-lar to the fit accuracy of equations 13-16 listed in table 8. The verification results for the equations utilizing main channel length (equations 17-20) are similar to those shown in figures 4-7 and are not included here.
The time of concentration tends to be underesti-mated with equations 13 (fig. 4) or 17. The effects of the underestimation of TC on the ultimate goal of
accurately simulating design hydrographs may be eval-uated by comparison of hydrographs simulated utiliz-ing the hyetograph of effective precipitation determined in hydrograph time-lag computations and TC and R estimated with equations 13 and 14 or 17 and 18, respectively. This comparison provides a more stringent test of the utility of the estimation equations than the comparison of measured and estimated TC and R values in figures 4 and 5. The percentage errors in the estimated peak discharge and time-to-peak discharge for the verification storms simulated with the Clark unit-hydrograph method utilizing TC and R estimated with equations 13 and 14 or 17 and 18, respectively, are listed in table 9. For 8 of the 11 verification storms, the error in the peak discharge is less than 25 percent with either set of estimation equations. For 10 of the 11 verification storms, the error in the time-of-peak discharge is less than 20 percent with either set of esti-mation equations. The average percentage error in the peak discharge and time-to-peak is less than 10 percent with either set of estimation equations.
The simulated and measured hydrographs are shown in figures 8-18 (at the end of the report). The agreement between the measured and simulated hydro-graphs is excellent for the storm of April 26, 1995, on Indian Creek (fig. 9), the North Branch Chicago River (fig. 12), and Flint Creek (fig. 17); and the storm of November 5, 1994, on Green Lake Ditch (fig. 10). The agreement between the measured and simulated hydro-graphs is good for the storm of November 27, 1994, on Green Lake Ditch (fig. 11), the storm of May 23, 1995, on the North Branch Chicago River (fig. 13), and the storm of April 26, 1995, on Squaw Creek (fig. 16). The agreement between the measured and simulated
20 Equations for Estimating Synthetic Unit-Hydrograph Parameter Values for Small Watersheds in Lake County, Illinois
Table 9. Percentage error in the estimated peak discharge and time-to-peak discharge for the verification storms on selected watersheds in Lake County, Ill., simulated with the Clark unit-hydrograph method utilizing estimated values of time of concentration and watershed-storage coefficient
Error in peak discharge Error in time-to-peakEquations Equations Equations Equations
Storm based on based on based on based onWatershed date length area length area
Bull Creek 4/26/95 52.1 41.5 16.0 12.0Indian Creek 4/26/95 .17 3.25 -13.2 -5.26Green Lake Ditch 11/05/94 -4.16 .38 .00 .00Green Lake Ditch 11/27/94 -27.9 -23.7 .00 .00North Branch Chicago River 4/26/95 -2.94 -8.46 7.14 7.14North Branch Chicago River 5/23/95 4.51 -2.26 -20.0 -20.0Skokie River at Lake Forest 4/26/95 47.7 45.7 -6.67 -6.67Skokie River near Highland Park 4/26/95 22.8 28.0 -11.1 -11.1Squaw Creek 4/26/95 22.3 16.5 -17.1 -19.5Flint Creek 4/26/95 -12.2 -3.54 -9.62 -9.62Flint Creek 5/23/95 -12.0 -2.29 -39.5 -39.5

Equations for Estimating Synthetic Unit-Hydrograph Parameters 21
Figure 4. Time of concentration for storms on nine watersheds in Lake County, Ill., for the Clark unit-hydrograph method measured and computed as a function of watershed area, percentage of impervious cover, and depth of effective precipitation.
600 5 10 15 20 25 30 35 40 45 50 55
COMPUTED TIME OF CONCENTRATION (T ), IN HOURS
60
0
5
10
15
20
25
30
35
40
45
50
55
ME
AS
UR
ED
TIM
E O
F C
ON
CE
NT
RA
TIO
N (
T
), I
N H
OU
RS
Calibrat ion storms
Veri f icat ion storms
Line of perfect agreement
C
C

22 Equations for Estimating Synthetic Unit-Hydrograph Parameter Values for Small Watersheds in Lake County, Illinois
Figure 5. Watershed-storage coefficient for storms on nine watersheds in Lake County, Ill., for the Clark unit hydrograph measured and computed as a function of watershed area, percentage of impervious cover, and main channel slope.
COMPUTED WATERSHED STORAGE COEFFICIENT (L ), IN HOURS
ME
AS
UR
ED
WA
TE
RS
HE
D S
TO
RA
GE
CO
EF
FIC
IEN
T (
R),
IN
HO
UR
S
600 5 10 15 20 25 30 35 40 45 50 55
60
0
5
10
15
20
25
30
35
40
45
50
55
Cal ibrat ion storms
Veri f icat ion storms
Line of perfect agreement
R
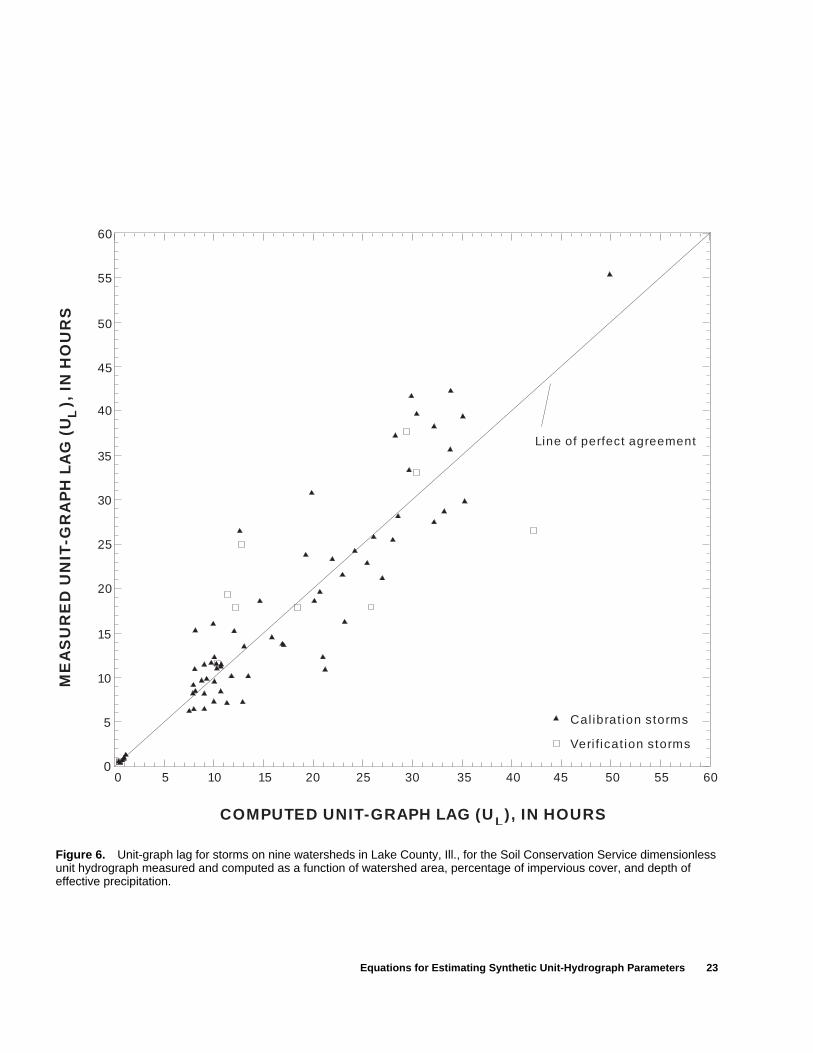
Equations for Estimating Synthetic Unit-Hydrograph Parameters 23
Figure 6. Unit-graph lag for storms on nine watersheds in Lake County, Ill., for the Soil Conservation Service dimensionless unit hydrograph measured and computed as a function of watershed area, percentage of impervious cover, and depth of effective precipitation.
Line of perfect agreement
600 5 10 15 20 25 30 35 40 45 50 55
COMPUTED UNIT-GRAPH LAG (U ), IN HOURS
60
0
5
10
15
20
25
30
35
40
45
50
55
ME
AS
UR
ED
UN
IT-G
RA
PH
LA
G (
U
), I
N H
OU
RS
Calibrat ion storms
Veri f icat ion storms
L
L
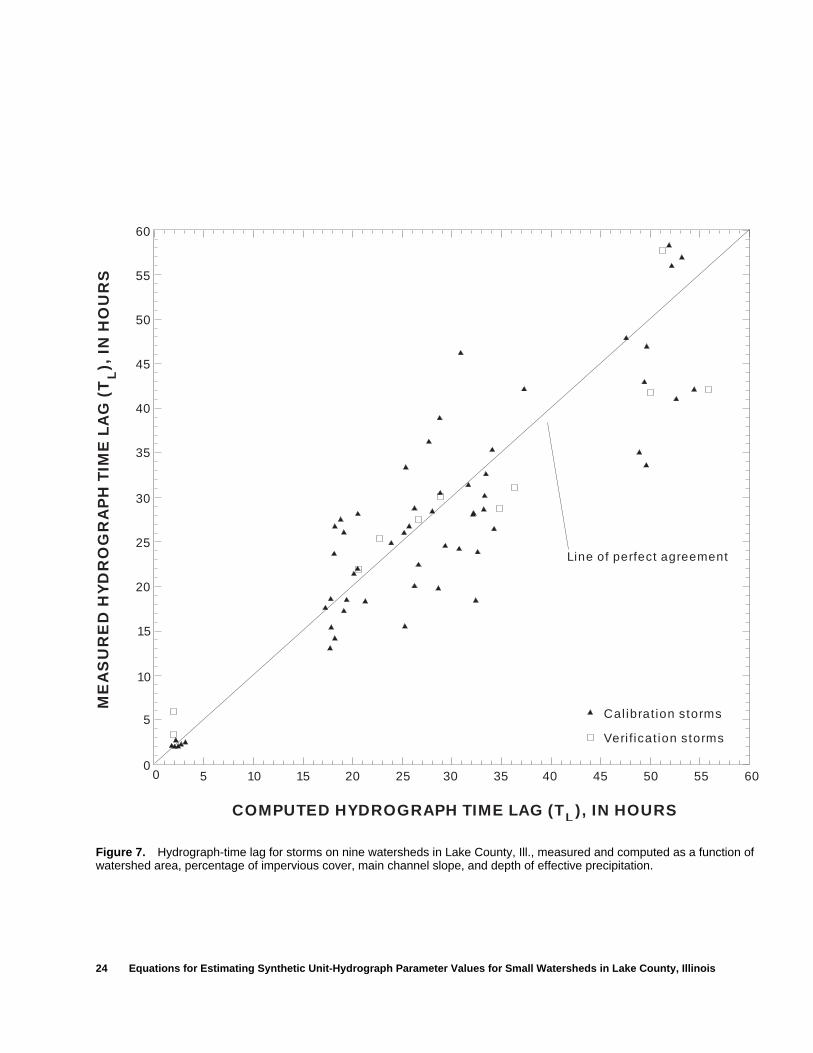
24 Equations for Estimating Synthetic Unit-Hydrograph Parameter Values for Small Watersheds in Lake County, Illinois
Figure 7. Hydrograph-time lag for storms on nine watersheds in Lake County, Ill., measured and computed as a function of watershed area, percentage of impervious cover, main channel slope, and depth of effective precipitation.
Line of perfect agreement
600 5 10 15 20 25 30 35 40 45 50 55
COMPUTED HYDROGRAPH TIME LAG (T ), IN HOURS
60
0
5
10
15
20
25
30
35
40
45
50
55
ME
AS
UR
ED
HY
DR
OG
RA
PH
TIM
E L
AG
(T
),
IN
HO
UR
S
Calibrat ion storms
Veri f icat ion storms
L
L

hydrographs is poor for the April 26, 1995, storm on the Skokie River near Highland Park, but this may be the result of an unusually shaped measured hydrograph near the peak discharge (fig. 15). Thus, only 3 of the 11 verification storms—storm of April 26, 1995, on Bull Creek (fig. 8) and the Skokie River at Lake Forest (fig. 14), and the storm of May 23, 1995, on Flint Creek (fig. 18)—were poorly simulated utilizing the estima-tion equations.
Application Limits for the Estimation Equations
The verification results presented in table 9 and figures 8-18 indicate that application of the estimation equations may result in very accurate simulation of hydrographs from actual storms without calibration. Thus, application of the estimation equations to deter-mine synthetic unit-hydrograph parameters for design-storm simulation may result in reliable design hydro-graphs. The application limits for the estimation equa-tions must be considered for proper utilization of the estimation equations. These application limits are dis-cussed below.
In the development of the estimation equations by stepwise multiple linear regression, the watershed characteristics (area, length, percentage of impervious cover, and, to a lesser extent, main channel slope) were found to be the primary predictor variables for the syn-thetic unit-hydrograph parameters. The depth of effec-tive precipitation provided a small adjustment factor among storms on the same watershed. Thus, the good verification results for the simulated hydrographs presented in table 9 and figures 8-18 were expected because the verification storms were measured on the watersheds utilized to develop the estimation equa-tions. Rainfall and streamflow gages were installed on December 7, 1993, and April 6, 1994, respectively, on the Southwest Fork of the South Branch of Ravine 10 at Highland Park, Ill., to provide data for independent verification of the estimation equations. During the period from April 6, 1994, to September 30, 1995, only the storm of June 23, 1994, resulted in runoff that met the criteria for unit-hydrograph derivation in this study. The Southwest Fork of the South Branch of Ravine 10 drains 0.218 mi2 with 48 percent impervious cover near downtown Highland Park, Ill. The final drainage channel in the watershed is a 54-in. storm sewer. Because of the small size, high percentage of impervious cover, and the storm sewer drainage, the
runoff response to rainfall on this watershed is very rapid, and it is difficult to separate the runoff peaks resulting from closely spaced rainfall bursts. A reliable calibration or determination of the synthetic unit-hydrograph parameters for the June 23, 1994, storm on this watershed was not possible. Thus, no independent verification of the estimation equations was done.
The objective of developing the estimation equa-tions is reliable simulation of design hydrographs for small (less than 25 mi2), urban watersheds in Lake County. The range of values for area (0.06-37 mi2), main channel length (0.33-16.6 mi), and main channel slope (3.13-55.3 ft/mi) for the watersheds utilized to develop the estimation equations is representative of the conditions for small watersheds in Lake County. However, the range of the percentage of impervious cover (7.32-40.6 percent) may not include the full range of conditions of interest for small watersheds in Lake County. For example, it may be necessary to com-pare peak discharges before and after development, and the conditions before development may include low percentages of impervious cover. In such cases, the computed hydrographs should be checked carefully to determine if the results are reasonable.
The example of the Southwest Fork of the South Branch of Ravine 10 illustrates the limitation of the application of the estimation equations with respect to the percentage of impervious cover. This watershed includes 48 percent impervious cover, whereas the esti-mation equations were developed for watersheds with percentages of impervious cover from 7.32 to 40.6 per-cent. The rainfall and runoff data from the Southwest Fork of the South Branch of Ravine 10 indicate that unit hydrographs may be difficult to derive and apply on watersheds with high percentages of impervious cover. Thus, if the estimation equations are applied to areas with greater than 40.6 percent impervious cover, the computed hydrographs should be checked carefully to determine if the results are reasonable.
The maximum measured depth of effective pre-cipitation for the storms utilized to develop the estima-tion equations was 2.16 in. from Terre Faire Ditch for the storm of June 30, 1993. Computed depths of effective precipitation for long-duration (greater than 6 hours), high-return period (50- or 100-year) storms on areas with high percentages of impervious cover may be more than twice the maximum measured value utilized in the development of the estimation equations. Thus, application of the estimation equations could result in estimated hydrograph-timing parameters, TC,
Equations for Estimating Synthetic Unit-Hydrograph Parameters 25

UL, and TL substantially higher than observed. For example, 5 in. of effective precipitation results in TC, UL, and TL values of 1.93, 1.33, and 1.17, respectively, times the values for 2.16 in. of effective precipitation (applying equations 13, 15, and 16, respectively). These large increases in the hydrograph-timing param-eters may be physically justified. For large floods, sub-stantial overbank flow and subsequent flood-wave attenuation result. Thus, large values of TC, UL, and TL may reflect flood-wave attenuation. Nevertheless, the reasonableness of TC, UL, and TL values estimated for design storms with large values of precipitation excess should be carefully considered before these values are utilized for design-hydrograph computation.
Application Example
The Buffalo Creek at Lake Zurich, Ill., watershed forms part of the southern boundary of the Indian Creek watershed and the eastern boundary of the Flint Creek watershed (fig. 1). This watershed drains 1.03 mi2 with a main channel length and slope of 2.87 mi and 38.34 ft/mi, respectively. The dominant soils in this watershed are Markham silt loam, Beecher silt loam, and Morley silt loam, which are SCS hydro-logic-soil type C (Soil Conservation Service, 1969). The land use in this watershed is assumed (for this example) to be 1 acre residential lots with 20 percent impervious cover and an SCS curve number of 79 (Soil Conservation Service, 1986). To illustrate the applica-tion of the estimation equations, it is assumed that the 50-year, 24-hour storm is the critical storm for hydro-logic design for this watershed, and the synthetic unit- hydrograph parameters are sought to simulate the design hydrograph for this watershed. On the basis of the isohyetal maps in Bulletin 70 (Huff and Angel, 1989, p. 57), the depth of the 50-year, 24-hour storm for this watershed is 5.75 in. Applying the SCS curve num-ber, the depth of effective precipitation for the 50-year, 24-hour storm is 3.46 in. Thus, the values of the time of concentration and storage coefficient for the Clark unit-hydrograph method for this design storm on the Buffalo Creek at Lake Zurich, Ill., watershed are estimated with equations 13 and 14, respectively, as
TC = 39.1 (1.03)0.577 (20 + 1)-1.144 (3.46)0.781 =
3.22 hours, and
R = 123 (1.03)0.390 (20 + 1)-0.722 (38.34)-0.303 = 4.58 hours;
and estimated with equations 17 and 18, respectively, as
TC = 87.5 (2.87)0.868 (20 + 1)-1.563 (3.46)0.780 = 4.94 hours, and
R = 81.1 (2.87)0.759 (20 + 1)-0.994 = 8.76 hours.
These values of TC and R could then be input to HEC-1 (U.S. Army Corps of Engineers, 1990) along with the design hyetograph, SCS curve number, and watershed characteristics to compute the design hydrograph. The design hydrographs obtained using the area-based and length-based equations should be compared, and the most reasonable equation applied. The differences in TC and R estimated with the area-based and length-based equations appear substantial; however, in simulation of multiperiod storms the differ-ences in the final computed hydrographs may be small as illustrated in figures 8-18.
The value of the unit-graph lag for the SCS dimensionless unit hydrograph for this design storm on the Buffalo Creek at Lake Zurich, Ill., watershed is esti-mated with equation 15 as
UL = 44.5 (1.03)0.483 (20 + 1)-0.805 (3.46)0.336 = 5.91 hours,
and estimated with equation 19 as
UL = 74.9 (2.87)0.777 (20 + 1)-1.133 (3.46)0.371 = 8.55 hours.
These values of UL could then be input to HEC-1 or TR20 (Soil Conservation Service, 1982) with the design hyetograph, SCS curve number, and watershed characteristics to compute the design hydrograph. Again, the design hydrographs obtained using the area-based and length-based equations should be compared, and the most reasonable equation applied. The design hydrograph obtained on the basis of the SCS dimen-sionless unit-hydrograph method should be expected to result in substantial overestimates of the peak discharge similar to the values reported in table 3.
26 Equations for Estimating Synthetic Unit-Hydrograph Parameter Values for Small Watersheds in Lake County, Illinois
The value of the hydrograph-time lag for this design storm on the Buffalo Creek at Lake Zurich, Ill., watershed is estimated with equation 16 as
TL = 119 (1.03)0.345 (20 + 1)-0.690 (38.34)-0.182
(3.46)0.187 = 9.56 hours,
and estimated with equation 20 as
TL = 105 (2.87)0.637 (20 + 1)-0.930 (3.46)0.214 = 15.8 hours.
Again, the analyst should select the most reasonable value of TL between these estimates for further hydro-logic analysis of Buffalo Creek at Lake Zurich, Ill.
SUMMARY AND CONCLUSIONS
Design hydrographs computed from design storms, simple models of abstractions (interception, depression storage, and infiltration), and synthetic unit hydrographs provide vital information for stormwater, flood-plain, and water-resources management through-out the United States. The U.S. Geological Survey, in cooperation with the Lake County Stormwater Man-agement Commission, studied rainfall and runoff data for small watersheds in Lake County collected between 1990 and 1995 to develop equations for estimation of synthetic unit-hydrograph parameters on the basis of watershed and storm characteristics. The synthetic unit-hydrograph parameters of interest were the time of concentration (TC) and watershed-storage coefficient (R) for the Clark unit-hydrograph method, the unit-graph lag (UL) for the Soil Conservation Service dimensionless unit hydrograph, and the hydrograph-time lag (TL) for the linear-reservoir method for unit-hydrograph estimation. Data from nine small water-sheds ranging in area from 0.06 to 37 mi2 were utilized in this study including Bull Creek near Libertyville, Terre Faire Ditch at Libertyville, Indian Creek at Praire View, Green Lake Ditch at Buffalo Grove, North Branch Chicago River at Deerfield, Skokie River at Lake Forest, Skokie River near Highland Park, Squaw Creek at Round Lake, and Flint Creek near Fox River Grove. Data from 66 storms with effective-precipita-tion depths greater than 0.4 in. on these watersheds were utilized to develop the estimation equations and data from 11 storms on 8 of these watersheds were
utilized to verify (test) the estimation equations. The synthetic unit-hydrograph parameters were determined by calibration applying the U.S. Army Corps of Engi-neers (1990) HEC-1 flood hydrograph package (TC, R, and UL) or by manual analysis of the rainfall and runoff data (TL). Relations between synthetic unit-hydrograph parameters and watershed and storm characteristics were determined by multiple linear regression of the logarithms of the parameters and characteristics.
The watershed characteristics considered included area; length and slope of the main channel; and percentages of impervious, forest, and wetland cover. The storm characteristics considered were dura-tion, depth, and maximum 1-hour depth for total and effective precipitation. Area and main channel length are watershed-scale parameters and highly correlated. Thus, separate sets of equations were developed with area and main channel length as the starting parame-ters. Percentage of impervious cover, main channel slope, and depth of effective precipitation also were identified as important characteristics for the estima-tion of synthetic unit-hydrograph parameters. The estimation equations utilizing area had multiple corre-lation coefficients of 0.873, 0.961, 0.968, and 0.963 for TC, R, UL, and TL, respectively. The estimation equa-tions utilizing main channel length had multiple corre-lation coefficients of 0.845, 0.957, 0.961, and 0.963 for TC, R, UL, and TL, respectively.
Simulation of the measured hydrographs for the verification storms utilizing TC and R, obtained from the estimation equations, yielded good results without calibration. The peak discharge for 8 of the 11 storms was estimated within 25 percent, and the time-to-peak discharge for 10 of the 11 storms was estimated within 20 percent. Thus, application of the estimation equations to determine synthetic unit-hydrograph parameters for design-storm simulation may result in reliable design hydrographs as long as the physical characteristics of the watersheds under con-sideration are within the range of those for the water-sheds considered in this study (area: 0.06-37 mi2, main channel length: 0.33-16.6 mi, main channel slope: 3.13-55.3 ft/mi, and percentage of impervious cover: 7.32-40.6 percent). The estimation equations are most reliable when applied to watersheds with areas less than 25 mi2. In the applications of the estimation equa-tions, the percentage of impervious cover is most likely to be outside of the range of conditions in the study watersheds, and in such cases the computed synthetic unit-hydrograph parameters and design hydrographs
Summary and Conclusions 27

must be checked carefully to determine if the results are reasonable.
REFERENCES CITED
Chow, V.-T., ed., 1964, Runoff, section 14: Handbook of applied hydrology, New York, McGraw-Hill Book Company, variable pagination.
Chow, V.-T., Maidment, D.R., and Mays, L.W., 1988, Applied hydrology: New York, McGraw-Hill Book Company, 572 p.
Clark, C.O., 1945, Storage and the unit hydrograph: Trans-actions, American Society of Civil Engineers, vol. 110, p. 1419-1488.
Duncker, J.D., Vail, T.J., and Melching, C.S., 1995, Regional rainfall-runoff relations for simulation of streamflow for watersheds in Lake County, Illinois: U.S. Geologi-cal Survey Water-Resources Investigations Report 95-4023, 71 p.
Ford, D.T., Morris, E.C., and Feldman, A.D., 1980, Corps of Engineers’ experience with automatic calibration of precipitation-runoff model: Water and Related Land Resource Systems, Y. Haimes and J. Kindler, eds., New York, Pergamon Press, New York, p. 467-476.
Franz, D.D., and Melching, C.S., in press, Full equations (FEQ) model for the solution of the full, dynamic equations of motion for one-dimensional unsteady flow in open channels and through control structures: U.S. Geological Survey Water-Resources Investiga-tions Report 96-4240
Graf, J.B., Garklavs, G., and Oberg, K.A., 1982a, Time of concentration and storage coefficient values for Illinois streams: U.S. Geological Suvey Water-Resources Investigations Report 82-13, 35 p.
Graf, J.B., Garklavs, G., and Oberg, K.A., 1982b, A tech-nique for estimating time of concentration and storage coefficient values for Illinois streams: U.S. Geological Survey Water-Resources Investigations Report 82-22, 10 p.
Hershfield, D.M., 1961, Rainfall frequency atlas of the United States for durations from 30 minutes to 24 hours and return periods from 1 to 100 years: Weather Bureau Technical Paper 40, U.S. Department of Commerce, Washington, D.C., 115 p.
Huff, F.A., and Angel, J.R., 1989, Frequency distributions and hydroclimatic characteristics of heavy rainstorms in Illinois: Illinois State Water Survey Bulletin 70, Champaign, Ill., 177 p.
Johanson, R.C., Imhoff, J.C., Kittle, J.L., Jr., and Donigan, A.S., Jr., 1984, Hydrological simulation program - FORTRAN (HSPF), user’s manual for release 9.0: U.S. Environmental Protection Agency Report EPA-600/3-84-066, 767 p.
Kuichling, E., 1889, The relation between the rainfall and the discharge of sewers in populous districts: Transactions, American Society of Civil Engineers, vol. 20, p. 1-60.
Laurenson, E.M., and Mein, R.G., 1985, RORB-Version 3 runoff routing program user manual: Department of Civil Engineering, Monash University, Clayton, Victoria, Australia, 155 p.
Leighton, M.M., Ekblaw, G.E., and Horberg, L., 1948, Phys-iographic divisions of Illinois, Illinois State Geologic Survey Report of Investigations 129, Champaign, Ill., 33 p.
Mitchell, W.D., 1954, Floods in Illinois, magnitude and frequency: Illinois Department of Public Works and Buildings, Division of Waterways, 386 p.
Nash, J.E. and Sutcliffe, J.V., 1970, River flow forecasting through conceptual models, Part 1--A discussion of principles: Journal of Hydrology, v. 10, p. 282-290.
O’Kelly, J.J., 1955, The employment of unit hydrographs to determine the flows of Irish arterial drainage channels: Proceedings, Institution of Civil Engineers (Ireland), vol. 4, no. 3, p. 365-412.
Ragan, R.M., and Duru, J.O., 1972, Kinematic wave nomo-graph for times of concentration: Journal of the Hydrau-lics Division, American Society of Civil Engineers, vol. 98, no. HY10, p. 1765-1771.
Rao, A.R., Delleur, J.W., and Sarma, B.S.P., 1972, Concep-tual hydrologic models for urbanizing basins: Journal of the Hydraulics Division, American Society of Civil Engineers, vol. 98, no. HY7, p. 1205-1220.
Shen, Y.-Y., 1974, Experimental investigation of the effects of rainstorm and watershed characteristics on surface runoff: Ph.D. Thesis, Department of Civil Engineering, University of Illinois at Urbana-Champaign, Urbana, Ill., 197 p.
Singh, K.P., 1981, Derivation and regionalization of unit hydrograph parameters for Illinois (dam safety pro-gram): Illinois State Water Survey Contract Report 258, Champaign, Ill., 84 p.
Snider, D., 1971, Hydrographs, Chapter 16: Soil Conserva-tion Service National Engineering Handbook, U.S. Department of Agriculture, Washington, D.C., variable pagination.
Snyder, F.F., 1938, Synthetic unit-graphs: Transactions, American Geophysical Union, vol. 19, p. 447-454.
Soil Conservation Service, 1969, General soil map, Lake County, Illinois: Unpublished map on file in the Grayslake office of the Natural Resources Conservation Service, scale 1:190,080.
Soil Conservation Service, 1982, TR-20 computer program for project formulation hydrology: U.S. Department of Agriculture, Washington, D.C., variable pagination.
Soil Conservation Service, 1985, National engineering hand-book, Section 4. hydrology: U.S. Department of Agri-culture, Washington, D.C., variable pagination.
28 Equations for Estimating Synthetic Unit-Hydrograph Parameter Values for Small Watersheds in Lake County, Illinois
Soil Conservation Service, 1986, Urban hydrology for small watersheds: Soil Conservation Service Technical Release 55, U.S. Department of Agriculture, Washing-ton, D.C., variable pagination.
Turner, H.M. and Burdoin, A.J., 1941, The flood hydrograph: Journal of the Boston Society of Civil Engineers, vol. 28, no. 3, p. 232-281.
U.S. Army Corps of Engineers, 1990, HEC-1 flood hydrograph package, user’s manual: U.S. Army Corps of Engineers Hydrologic Engineering Center, Davis, Calif., variable pagination.
Viessman, W., Jr., Lewis, G.L., and Knapp, J.W., 1989, Intro-duction of hydrology, third edition: New York, Harper and Row, Publishers, 780 p.
Woodward, D.E., Merkel, W., and Sheridan, J., 1995, NRCS unit hydrographs background and future: Water Resources Engineering, W.H. Espey, Jr. and P.G. Combs, eds., American Society of Civil Engineers, New York, v. 2, p. 1693-1697.
Summary and Conclusions 29

TABLES 10-12FIGURES 8-18

Table 10. Direct-runoff hydrograph characteristics and parameters determined from manual analysis of hydrographs on watersheds in Lake County, Ill., for storms utilized to develop and verify the equations for estimation of synthetic unit-hydrograph parameters[in., inches; ft3/s, cubic feet per second; qP, unit-hydrograph peak discharge in cubic feet per second per inch of direct runoff; TP, time to peak in hours; A, watershed area in square miles; *, indicates that the time-to-peak corresponding to the period of the largest effective precipitation is taken as TP]
Direct-Direct- runoffrunoff peak Time-to-peak Hydrograph Peak
Storm depth discharge discharge time lag factorWatershed date (in.) (ft3/s) (hours) (hours) (qPTP/A)
Bull Creek 8/17/90 0.66 83.1 15 20.0 30011/27/90 .66 80.7 *13 28.7 2523/27/91 .54 76.2 11 15.5 2464/08/91 .53 53.9 *17 26.0 2744/14/91 .59 66.5 11 26.7 1975/25/91 .94 82.7 8 28.4 1123/22/93 .55 72.3 17 33.3 3553/31/93 1.08 72.3 17 38.9 1817/08/93 .88 79.9 8 36.2 1157/18/93 .40 61.8 9 24.8 221
14/26/95 1.11 94.2 25 30.1 342
Terre Faire Ditch 5/25/91 .72 9.7 *1.75 2.68 3066/30/93 2.16 31.0 *2.00 2.21 3737/08/93 1.14 24.4 *1.75 2.00 4867/18/93 1.23 25.6 *1.83 2.35 494
Indian Creek 5/09/90 .53 364 23 18.4 44211/04/90 .42 217 *25 46.2 3624/08/91 .62 371 25 28.6 4194/14/91 .56 420 21 23.8 4415/25/91 .78 612 16 26.4 3523/22/93 .71 391 29 35.3 4473/31/93 1.13 517 26 42.1 3334/14/93 .52 325 *22 27.9 3856/08/93 .48 152 50 60.4 4447/18/93 .46 218 30 31.4 398
14/26/95 1.00 584 *21 31.1 344
Green Lake Ditch 5/25/91 .36 7.3 1.33 2.07 4496/30/93 .82 19.2 .75 1.97 293111/05/
94.63 9.1 *1.00 5.94 242
111/27/94
.58 8.4 *.50 3.32 121
North Branch Chicago River 5/08/90 1.35 435 *11 32.6 1808/17/90 .59 551 *10 19.8 47411/27/90 1.32 449 *9 30.1 1553/27/91 .61 195 19 30.4 3084/08/91 1.09 395 *14 28.0 2574/14/91 .86 363 22 24.2 4716/18/93 .40 221 12 22.4 3376/30/93 .67 271 10 24.5 205
14/26/95 1.69 544 *29 28.8 47415/23/95 .40 133 20 27.6 338
Skokie River at Lake Forest 8/17/90 .78 270 12 17.2 32011/05/90 .53 149 *15 18.6 32411/27/90 .84 273 *14 18.5 3503/27/91 .45 168 11 17.6 3164/08/91 .52 186 11 13.0 3034/14/91 .54 240 11 15.4 3763/31/93 1.14 271 19 28.1 3474/14/93 .78 180 14 26.0 2497/08/93 .71 174 *10 27.5 189
14/26/95 1.18 300 *21 21.9 411
Table 10. 33

Table 10. Direct-runoff hydrograph characteristics and parameters determined from manual analysis of hydrographs on watersheds in Lake County, Ill., for storms utilized to develop and verify the equations for estimation of synthetic unit-
hydrograph parameters—ContinuedSkokie River near Highland Park 11/05/90 0.70 335 *17 21.4 38611/27/90 .94 465 *18 18.3 42211/01/92 .41 224 *13 14.1 3374/19/93 .40 175 15 23.7 3116/30/93 .77 308 10 22.0 1907/08/93 .41 151 *24 26.7 41914/26/95 1.35 504 *27 25.4 478
Squaw Creek 4/08/91 .67 82.3 20 71.1 1434/14/91 .83 97.7 *34 38.1 2333/22/93 .72 110 33 57.0 2933/31/93 .55 114 35 33.6 4224/14/93 .70 87.7 33 58.3 2404/19/93 .51 126 25 34.0 3597/08/93 .44 76.7 22 47.8 22314/26/95 .78 121 *25 42.1 225
Flint Creek 5/09/90 .57 182 41 56.9 3548/19/90 1.84 408 56 77.9 33611/27/90 .56 198 39 41.0 3733/27/91 .56 162 55 62.0 4294/14/91 .67 235 40 42.1 3795/25/91 .41 157 41 46.9 4244/08/93 .51 134 43 62.2 3054/14/93 .66 184 42 64.4 3164/19/93 .40 168 37 42.9 4206/07/93 .51 130 64 69.4 44114/26/95 1.14 395 52 57.7 48715/23/95 .43 175 38 41.8 418
1Storm utilized to verify the relations for estimating the synthetic unit-hydrograph parameters.
Direct-Direct- runoffrunoff peak Time-to-peak Hydrograph Peak
Storm depth discharge discharge time lag factorWatershed date (in.) (ft3/s) (hours) (hours) (qPTP/A)
34 Equations for Estimating Synthetic Unit-Hydrograph Parameter Values for Small Watersheds in Lake County, Illinois

Table 11. Parameters for the Clark and Snyder unit-hydrograph methods determined from calibration of the U.S. Army Corps of Engineers (1990) Flood Hydrograph Package HEC-1 and measures of calibration quality for data from watersheds in Lake
County, Ill., for storms utilized to develop and verify the equations for estimation of synthetic unit-hydrograph parametersClark unit hydrograph Snyder unitTime of Watershed hydrograph Errorconcen- storage time-to-peak Model- in peak
Storm tration coefficient discharge fit dischargeWatershed date (hours) (hours) (hours) efficiency (percent)
Bull Creek 8/17/90 1.50 24.0 2.68 0.930 16.911/27/90 1.03 24.1 1.79 .914 51.23/27/91 1.54 23.4 2.70 .897 22.44/08/91 1.03 32.3 1.81 .891 5.54/14/91 1.35 24.7 2.54 .879 28.85/25/91 2.78 34.2 3.75 .850 39.93/22/93 1.86 19.6 2.75 .957 22.73/31/93 1.03 38.1 1.81 .920 5.57/08/93 4.62 36.1 5.17 .914 16.37/18/93 1.56 27.0 2.73 .956 -8.0
14/26/95 1.62 35.9 2.79 .932 8.5
Terre Faire Ditch 5/25/91 .12 2.67 .23 .868 20.06/30/93 1.17 1.23 1.10 .960 9.77/08/93 .20 .93 .24 .968 20.87/18/93 .64 1.04 .60 .934 16.7
Indian Creek 5/09/90 3.57 16.7 3.91 .973 .611/04/90 9.05 42.0 9.35 .940 29.04/08/91 23.8 24.7 22.5 .926 4.34/14/91 4.77 22.5 5.08 .973 14.55/25/91 16.2 18.7 15.4 .977 8.33/22/93 19.7 24.1 18.7 .980 3.63/31/93 12.8 34.3 12.8 .985 3.54/14/93 17.2 23.5 16.5 .957 -2.26/08/93 3.66 45.9 4.66 .953 17.17/18/93 10.8 34.4 11.0 .853 18.8
14/26/95 11.1 28.5 11.1 .980 6.7
Green Lake Ditch 5/25/91 .10 .88 .15 .888 14.36/30/93 .09 .83 .14 .810 31.6111/05/
94.11 .99 .15 .820 11.1
111/27/94
.09 .86 .14 .900 12.5
North Branch Chicago River 5/08/90 4.24 27.9 4.83 .971 11.98/17/90 1.30 20.6 2.25 .990 6.0 11/27/90 5.90 25.2 6.14 .967 16.53/27/91 4.69 27.6 5.10 .950 13.84/08/91 7.93 25.6 8.08 .985 -1.84/14/91 18.8 20.4 17.7 .935 -4.46/18/93 1.17 17.7 1.82 .900 5.96/30/93 2.39 28.7 3.12 .973 5.5
14/26/95 4.07 26.0 4.70 .970 2.215/23/95 13.3 22.9 13.0 .970 3.8
Skokie River at Lake Forest 8/17/90 2.47 16.8 2.95 .951 17.411/05/90 1.57 19.0 2.66 .934 20.811/27/90 5.34 16.4 5.52 .920 20.53/27/91 1.16 16.8 1.81 .939 17.64/08/91 1.35 16.4 2.24 .900 2.94/14/91 2.37 13.1 2.84 .948 26.83/31/93 2.70 22.1 3.54 .975 9.94/14/93 1.44 26.4 2.67 .966 16.77/08/93 1.45 26.9 2.68 .870 19.5
14/26/95 1.04 24.2 1.80 .973 11.7
Table 11. 35

Table 11. Parameters for the Clark and Snyder unit-hydrograph methods determined from calibration of the U.S. Army Corps of Engineers (1990) Flood Hydrograph Package HEC-1 and measures of calibration quality for data from watersheds in Lake County, Ill., for storms utilized to develop and verify the equations for estimation of synthetic unit-hydrograph
parameters—ContinuedSkokie River near Highland Park 11/05/90 7.05 20.9 7.08 0.973 -0.611/27/90 6.85 16.5 6.90 .960 18.311/01/92 1.42 13.2 2.24 .939 12.54/19/93 3.72 19.1 4.10 .967 11.46/30/93 1.58 31.8 2.76 .935 13.97/08/93 6.85 31.3 7.13 .955 13.214/26/95 5.81 27.4 6.11 .935 -3.4
Squaw Creek 4/08/91 4.03 59.8 4.87 .890 5.54/14/91 27.5 73.1 27.9 .897 10.23/22/93 8.46 53.9 9.05 .868 19.13/31/93 17.0 45.2 17.1 .885 9.64/14/93 12.2 64.9 12.6 .920 12.54/19/93 11.9 34.6 12.1 .920 3.27/08/93 9.99 39.8 10.2 .868 40.314/26/95 5.94 54.2 6.75 .830 19.6
Flint Creek 5/09/90 36.7 55.3 36.2 .940 4.98/19/90 57.7 51.8 54.0 .965 13.311/27/90 17.3 54.0 17.5 .870 9.63/27/91 30.5 55.0 30.2 .980 6.84/14/91 17.5 46.0 17.6 .935 12.35/25/91 40.8 41.5 38.6 .900 11.54/08/93 13.1 78.3 13.6 .952 10.44/14/93 27.7 68.5 27.9 .980 1.64/19/93 33.1 36.0 31.4 .966 5.46/07/93 28.8 58.0 28.7 .930 5.414/26/95 34.5 44.9 33.4 .980 -1.015/23/95 30.9 36.3 29.7 .910 8.6
1Storm utilized to verify the relations for estimating the synthetic unit-hydrograph parameters.
Clark unit hydrograph Snyder unitTime of Watershed hydrograph Errorconcen- storage time-to-peak Model- in peak
Storm tration coefficient discharge fit dischargeWatershed date (hours) (hours) (hours) efficiency (percent)
36 Equations for Estimating Synthetic Unit-Hydrograph Parameter Values for Small Watersheds in Lake County, Illinois

Table 12. Unit-graph lag for the Soil Conservation Service dimensionless unit hydrograph determined from calibration of the U.S. Army Corps of Engineers (1990) Flood Hydrograph Package HEC-1 and percentage error in calibrated-hydrograph peak discharge for data from watersheds in Lake County, Ill., for storms utilized to develop and verify the equations for estimation of synthetic unit-hydrograph parameters[SCS, Soil Conservation Service]
Unit-graph lag for Errorthe SCS dimension- in peak
Storm less unit hydrograph dischargeWatershed date (hours) (percent)
Bull Creek 8/17/90 11.2 96.411/27/90 8.42 1383/27/91 7.26 1794/08/91 16.0 66.74/14/91 11.0 1305/25/91 15.2 1193/22/93 9.52 93.33/31/93 26.5 62.57/08/93 10.1 2167/18/93 6.43 182
14/26/95 25.0 34.0
Terre Faire Ditch 5/25/91 .64 1106/30/93 1.28 29.07/08/93 .80 70.87/18/93 .96 15.4
Indian Creek 5/09/90 12.3 3.911/04/90 23.8 92.04/08/91 23.3 21.64/14/91 10.9 98.85/25/91 16.2 32.53/22/93 21.6 25.63/31/93 21.2 54.04/14/93 19.6 21.56/08/93 30.8 11.27/18/93 18.6 94.014/26/95 17.9 53.6
Green Lake Ditch 5/25/91 .53 71.46/30/93 .39 121111/05/
94.48 66.7
111/27/94
.54 37.5
North Branch Chicago River 5/08/90 13.6 82.78/17/90 7.21 132
11/27/90 13.8 72.03/27/91 13.5 1004/08/91 14.5 58.84/14/91 18.6 15.46/18/93 7.11 76.96/30/93 10.1 12014/26/95 17.9 30.715/23/95 19.4 27.8
Skokie River at Lake Forest 8/17/90 8.16 96.011/05/90 9.15 98.611/27/90 9.84 59.33/27/91 6.19 1394/08/91 8.19 67.34/14/91 6.39 1073/31/93 11.5 69.74/14/93 11.4 1207/08/93 9.62 15314/26/95 11.6 83
Table 12. 37

Table 12. Unit-graph lag for the Soil Conservation Service dimensionless unit hydrograph determined from calibration of the U.S. Army Corps of Engineers (1990) Flood Hydrograph Package HEC-1 and percentage error in calibrated-hydrograph peak discharge for data from watersheds in Lake County, Ill., for storms utilized to develop and verify the equations for estimation of synthetic unit-hydrograph parameters—Continued
Skokie River near Highland Park 11/04/90 11.6 58.211/27/90 11.5 48.011/01/92 8.45 29.94/19/93 10.9 69.76/30/93 12.2 1017/08/93 15.3 78.814/26/95 17.9 29.6
Squaw Creek 4/08/91 25.5 1514/14/91 39.7 74.53/22/93 28.1 85.53/31/93 25.8 54.44/14/93 37.2 67.04/19/93 22.9 39.77/08/93 24.2 92.214/26/95 37.7 36.4
Flint Creek 5/09/90 42.2 30.28/19/90 55.3 27.811/27/90 28.7 69.73/27/91 35.6 44.74/14/91 29.8 40.85/25/91 41.6 17.84/08/93 27.4 1324/14/93 39.4 56.54/19/93 33.3 22.66/07/93 38.2 47.014/26/95 26.6 6.815/23/95 33.1 -29.1
1 Storm utilized to verify the relations for estimating the synthetic unit-hydrograph parameters.
Unit-graph lag for Errorthe SCS dimension- in peak
Storm less unit hydrograph dischargeWatershed date (hours) (percent)
38 Equations for Estimating Synthetic Unit-Hydrograph Parameter Values for Small Watersheds in Lake County, Illinois

Fig
ure 8.
39
Figure 8. Measured direct-runoff hydrograph and direct-runoff hydrographs simulated with the Clark unit-hydrograph method in the U.S. Army Corps of Engineers Flood Hydrograph Package HEC-1 with the time of concentration and storage coefficient determined from the estimation equations for Lake County, Ill., for the storm of April 26, 1995, on Bull Creek.

40
Eq
uatio
ns fo
r Estim
ating
Syn
thetic U
nit-H
ydro
grap
h P
arameter V
alues fo
r Sm
all Watersh
eds in
Lake C
ou
nty, Illin
ois
Figure 9. Measured direct-runoff hydrograph and direct-runoff hydrographs simulated with the Clark unit-hydrograph method in the U.S. Army Corps of Engineers Flood Hydrograph Package HEC-1 with the time of concentration and storage coefficient determined from the estimation equations for Lake County, Ill., for the storm of April 26, 1995, on Indian Creek

Fig
ure 10.
41
Figure 10. Measured direct-runoff hydrograph and direct-runoff hydrographs simulated with the Clark unit-hydrograph method in the U.S. Army Corps of Engineers Flood Hydrograph Package HEC-1 with the time of concentration and storage coefficient determined from the estimation equations for Lake County, Ill., for the storm of November 5, 1994, on Green Lake Ditch.

42
Eq
uatio
ns fo
r Estim
ating
Syn
thetic U
nit-H
ydro
grap
h P
arameter V
alues fo
r Sm
all Watersh
eds in
Lake C
ou
nty, Illin
ois Figure 11. Measured direct-runoff hydrograph and direct-runoff hydrographs simulated with the Clark unit-hydrograph method in the U.S. Army Corps of Engineers
Flood Hydrograph Package HEC-1 with the time of concentration and storage coefficient determined from the estimation equations for Lake County, Ill., for the storm of November 27, 1994, on Green Lake Ditch.

Fig
ure 12.
43
Figure 12. Measured direct-runoff hydrograph and direct-runoff hydrographs simulated with the Clark unit-hydrograph method in the U.S. Army Corps of Engineers Flood Hydrograph Package HEC-1 with the time of concentration and storage coefficient determined from the estimation equations for Lake County, Ill., for the storm of April 26, 1995, on North Branch of the Chicago River.

44
Eq
uatio
ns fo
r Estim
ating
Syn
thetic U
nit-H
ydro
grap
h P
arameter V
alues fo
r Sm
all Watersh
eds in
Lake C
ou
nty, Illin
ois
Figure 13. Measured direct-runoff hydrograph and direct-runoff hydrographs simulated with the Clark unit-hydrograph method in the U.S. Army Corps of Engineers Flood Hydrograph Package HEC-1 with the time of concentration and storage coefficient determined from the estimation equations for Lake County, Ill., for the storm of May 23, 1995, on North Branch of the Chicago River.

Fig
ure 14.
45
Figure 14. Measured direct-runoff hydrograph and direct-runoff hydrographs simulated with the Clark unit-hydrograph method in the U.S. Army Corps of Engineers Flood Hydrograph Package HEC-1 with the time of concentration and storage coefficient determined from the estimation equations for Lake County, Ill., for the storm of April 26, 1995, on Skokie River at Lake Forest.

46
Eq
uatio
ns fo
r Estim
ating
Syn
thetic U
nit-H
ydro
grap
h P
arameter V
alues fo
r Sm
all Watersh
eds in
Lake C
ou
nty, Illin
ois Figure 15. Measured direct-runoff hydrograph and direct-runoff hydrographs simulated with the Clark unit-hydrograph method in the U.S. Army Corps of Engineers
Flood Hydrograph Package HEC-1 with the time of concentration and storage coefficient determined from the estimation equations for Lake County, Ill., for the storm of April 26, 1995, on Skokie River at Highland Park.

Fig
ure 16.
47
Figure 16. Measured direct-runoff hydrograph and direct-runoff hydrographs simulated with the Clark unit-hydrograph method in the U.S. Army Corps of Engineers Flood Hydrograph Package HEC-1 with the time of concentration and storage coefficient determined from the estimation equations for Lake County, Ill., for the storm of April 26, 1995, on Squaw Creek.

48
Eq
uatio
ns fo
r Estim
ating
Syn
thetic U
nit-H
ydro
grap
h P
arameter V
alues fo
r Sm
all Watersh
eds in
Lake C
ou
nty, Illin
ois Figure 17. Measured direct-runoff hydrograph and direct-runoff hydrographs simulated with the Clark unit-hydrograph method in the U.S. Army Corps of Engineers
Flood Hydrograph Package HEC-1 with the time of concentration and storage coefficient determined from the estimation equations for Lake County, Ill., for the storm of April 26, 1995, on Flint Creek.

Fig
ure 18.
49
Figure 18. Measured direct-runoff hydrograph and direct-runoff hydrographs simulated with the Clark unit-hydrograph method in the U.S. Army Corps of Engineers Flood Hydrograph Package HEC-1 with the time of concentration and storage coefficient determined from the estimation equations for Lake County, Ill., for the storm of May 23, 1995, on Flint Creek