EpiInfo Community Health Assessment Tutorial Version3 · linked table. Data sources other than the...
19
1 Analysis: Basics SUMMARY This lesson is an introduction to the Analysis module of Epi Info™. This lesson shows different ways information can be viewed, based on selection inside Analysis. In Lesson 3, you entered student data in a survey to collect information on asthma symptoms. In Lesson 4, you will use the Analysis module to READ in that data and view it. Once records are in Analysis, you can use several commands to SELECT, SORT, or LIST data that can be included in the asthma report you want to create to apply for funding. Lesson 4 covers these basic skills and shows you how to READ in data and Change Projects, which are important skills you will use every time you open the Analysis module. Length of time to complete: 1 hour Beginner Getting Started with Analysis Overview of basic information to navigate Analysis. Includes information about the Current Project and Data Source settings. Use the READ Command to view the Asthma Survey 2005 Project. Use the List Command Use the LIST Command to view the variables in your dataset. Use the Sort Command Use the SORT Command to organize your data. Use the Select Command Use the SELECT Command to organize your data. Includes a practice lesson. Skills Review Series of five review questions based on the reading and hands-on activities in this lesson. BEFORE YOU BEGIN Complete Lesson 3 Enter Data Lesson4
-
Upload
truongtuong -
Category
Documents
-
view
221 -
download
2
Transcript of EpiInfo Community Health Assessment Tutorial Version3 · linked table. Data sources other than the...

1
Analysis: Basics
S U M M A R Y
This lesson is an introduction to the Analysis module of Epi Info™. This lesson shows different ways information can be viewed, based on selection inside Analysis.
In Lesson 3, you entered student data in a survey to collect information on asthma symptoms. In Lesson 4, you will use the Analysis module to READ in that data and view it. Once records are in Analysis, you can use several commands to SELECT, SORT, or LIST data that can be included in the asthma report you want to create to apply for funding. Lesson 4 covers these basic skills and shows you how to READ in data and Change Projects, which are important skills you will use every time you open the Analysis module.
Length of time to complete: 1 hour Beginner
Getting Started with Analysis
Overview of basic information to navigate Analysis. Includes information about the Current Project and Data Source settings. Use the READ Command to view the Asthma Survey 2005 Project.
Use the List Command
Use the LIST Command to view the variables in your dataset.
Use the Sort Command
Use the SORT Command to organize your data.
Use the Select Command
Use the SELECT Command to organize your data. Includes a practice lesson.
Skills Review
Series of five review questions based on the reading and hands-on activities in this lesson.
B E F O R E Y O U B E G I N
Complete Lesson 3 Enter Data
Lesson 4
W H A T Y O U N E E D
Asthma Survey 2005.MDB- If you have not completed Lesson 3, you can use the Asthma Survey 2005.MDB project to complete this lesson as an introduction to Analysis; however, you will have ten records rather than twelve.
Appendix D: Skills Reviews Answer Key
F I V E G O A L S
Understand and be able to use the READ/IMPORT command. This command is used every time you open Analysis.
Use the LIST command to create a grid or web table and view the variables in your data table.
Use the SORT command to view variables in a specified order.
Use the SELECT command to view requested variables.
Be able to cancel a SELECT or a SORT and return to the original data count.

L E S S O N 4
3
Getting Started with Analysis
The Analysis module can be accessed by clicking Analyze Data from the Epi Info™ main page. You can also select Programs>Analyze Data. Analysis can read data files created in Make View and other types of databases such as DBase, FoxPro, MS Excel, and others. Analysis can produce graphs and interact with Epi Map to display geographic data. Once you have collected your data, Analysis acts as a statistical toolbox providing you with many ways to transform you data and perform statistical evaluations. Analysis also provides you with ways to export your data to new file formats such as MS Excel.
The Analysis module contains three working areas: the Analysis Command Tree, the Analysis Output window, and the Program Editor.
1. The Analysis Command Tree contains a list of available commands separated into folders by command type. The Command Tree is used to create the functions and programs that run your statistics from the data. Selecting a command opens the corresponding dialog box for that command, function, or statistic to run.
2. The Output window acts as a browser and displays all the information that is generated from the commands run in the Program Editor. The Output window buttons allow you to navigate through the program scripts that have been run and displayed in the output screen.
3. The Program Editor displays the dialog/code of the commands created using the Command Tree. Commands can be directly typed into the Program Editor. Programs or .PGM files written in Analysis are stored in the open .MDB. Programs can be saved and run against new data when the data becomes available.

The Analysis Workspace
1. Click Analyze Data or select Programs>Analyze Data to open the Analysis module.
This is an example of the Analyze Data workspace. The top of the page shows that you are in the Analysis module. The Analysis module consists of three windows: the Command Tree, the Output window, and the Program Editor.
Reading in a Project
Read this section and then Read/Import your survey data by completing the steps listed in the next section.
In order to analyze data, you must Read or Import a project into the Analysis module. The Read command allows you to select a project and data table on which to run your statistics. The Read/Import command will be used every time you open the Analysis module in order to begin work.
From the READ dialog box, you will select a project containing data for analyses. The Current Project is the database file (.MDB) which is the default source of data. Output files created

L E S S O N 4
5
from this data will be stored in this destination folder, unless otherwise specified. In our project, the destination for Output files is the EIHA Tutorial folder.
It is recommended that the Current Project and the Data Source match. Having the same Project and Data Source allows you to keep all your data and tables together. If they do not match, click Change Project. The project you select will appear as the Current Project and Data Source.
If you Read in a file where the Project and Source do not match, you will be asked to create a linked table. Data sources other than the current project are accessed through link tables located in the current project. Linked files are references to the data tables, and not the actual data, so if you move your files to a new location, the links will be broken.
From the Data Formats drop-down you will specify the data format for the data to be read
or written, for example MS Excel. From the Show section, you can select project Views or
All tables, views, and links for a project. When you click OK, the READ command will be
saved in the Program Editor and it will run the command at the same time. Save Only allows
you to save the command to the Program Editor only and does not run the READ command.

Read/Import an Epi Info™ Project
1. From the Analysis Command Tree, click Read (Import). The READ dialog box opens.
2. Click Change Project. The READ File Name box opens.
3. Use the Look In drop-down menu to locate your C drive.
4. Open the Epi_Info folder.
5. Open the EIHA Tutorial folder.
6. Select the project Asthma Survey 2005. This is the project you added records to from the Enter module in Lesson 3.
7. Click Open. The Current Project field and the Data Source field inside the READ dialog box will populate.
8. Select the view PreInterventionSurvey from the Show section.
9. Click OK. The Output window opens.
The Output window shows your Current View from inside the EIHA Tutorial folder.

L E S S O N 4
7
You should have a Record Count of 12.
Notice the READ command you executed appears in the Program Editor.
Navigating Analysis
Read the following sections and familiarize yourself with the Analysis workspace. Click Cancel or the close X to exit any dialog or command boxes you open.
Output Window
The Analysis Output window acts as a browser to display all the output information that is generated from the commands created and run in the Program Editor. The Output window buttons allow you to navigate through program scripts that have been run and displayed including Previous, Next, Last, History, Open, Bookmark, Print, and Maximize.
Program Editor Menu
File
Use the File Menu to create New files, Open, Save, Close, Print, and Exit.
Edit
Use the Edit Menu to Copy, Paste, Delete, Find, Replace, or go to the Program Beginning, and Program End.
View
Use the View Menu to place the Status Bar and/or the Tool Bar.
Fonts
Use the Fonts Menu to select Fonts, Style, and Color.
Run
Use the Run Menu to Run a Program or Run This Command to run one line of code.
Commands in this Lesson
The Command Tree contains a set of commands located in a series of nine folders.

READ/IMPORT
READ is the most commonly used command. The Read (Import) command changes the current data source and/or the current project. It removes any standard defined variables. The READ command operates on many different types of data. Epi Info™ can Read in 24 different types of files. Located in the Data folder.
SELECT
The Select command specifies a condition that must be true for a record to be processed. Use to select a set of records for analyses. For example, select records based on gender or zip code. Located in the Select/If folder.
CANCEL SELECT
The Cancel Select command cancels a previous SELECT command. Located in the Select/If folder.
SORT
The Sort command specifies the sequence in which records will appear when using the LIST, GRAPH, or WRITE commands. SORT organizes the listed data in an ascending or descending order, based on selected variables. For example, you can sort by last name or age. Located in the Select/If folder.
CANCEL SORT
The Cancel Sort command cancels a previous SORT command. Located in the Select/If folder.
LIST
The List command creates a listing of the current data table. Lists can be customized to list all, exclude, or show specific records. Located in the Statistics folder.
Use the LIST Command
The LIST command creates a line listing of the current dataset. Select specific variables from the Variables drop-down to narrow the list or select * (the Wild Card) to display all the variables. Check the All (*) Except box and select from the Variables drop-down to exclude variables from the list.
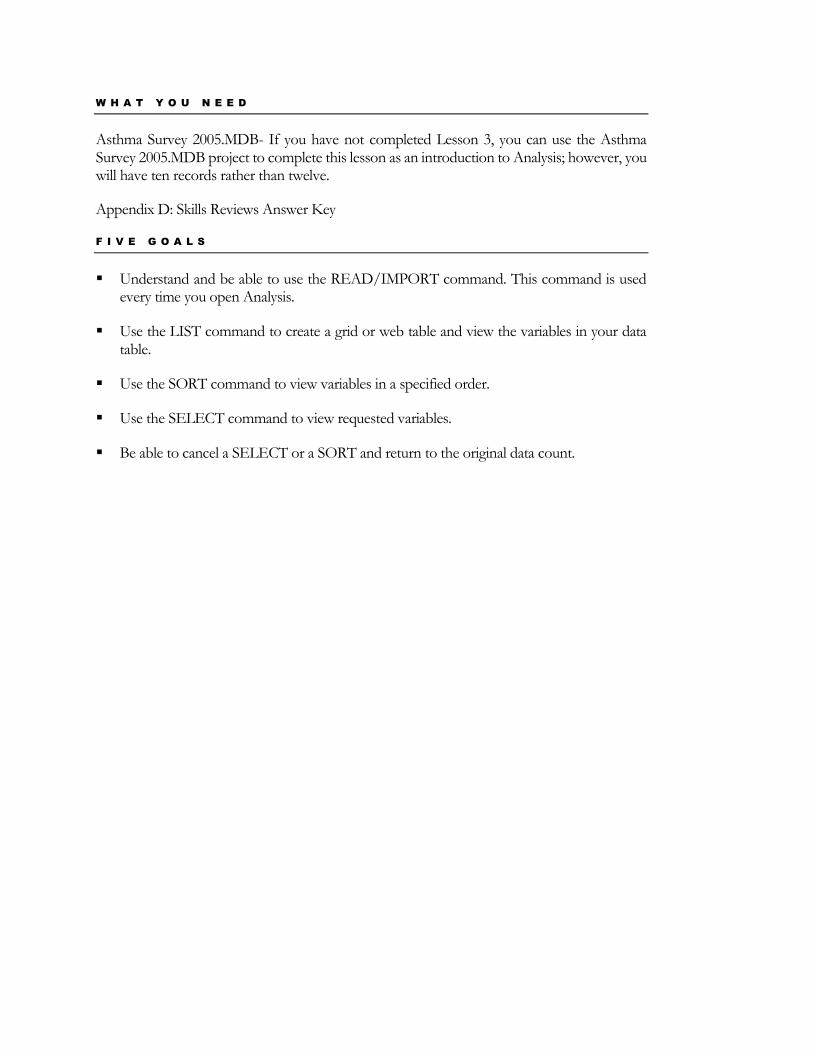
1. From the Command Tree Statistics folder, click List. The LIST dialog box opens.
L E S S O N 4
9
2. Click OK to accept the default settings. The variables in your dataset appear in a grid table inside your Output Window.
Notice the LIST command in the Program Editor.
Grid output is not embedded, so an Output file is not created.

Create a Web Format List
1. Click List. The LIST dialog box opens.
2. From the Display Mode section of the LIST box, select the radio button Web (HTML).
3. Click OK. The List appears in the Output window in a web table format.
Web display mode creates an embedded Output file.
Notice the title bar now contains the name of your default output file.

11
Use the Sort Command
The SORT command allows you to specify the sequence in which records will appear. If more than one variable is selected, records are sorted in order by the first variable. After you sort records, you must use the LIST command to see the results.
1. From the Command Tree Select/If folder, click Sort. The SORT dialog box opens.
2. Double click the variable DOB to place it in the Sort Variables field.
Variables can be sorted by ascending or descending order.
3. Click OK.
The Record Count stays at 12.
4. Use the LIST command to view all the variables. You can view the list in the format you prefer, Grid or HTML.
Notice how the list is sorted based on the DOB variable.
5. Click Cancel Sort. The CANCEL SORT dialog opens.
6. Click OK.
Records remain sorted until you close Analysis, Read in a new project, or Cancel Sort.
Notice the Sort information is listed in your Output window.

Create a List of Sorted Variables
1. Click Sort. The SORT dialog box opens.
2. Double click the variable ChildLast to place it in the Sort Variables field.
3. Click OK.
4. Click List. The LIST dialog box opens.
5. Select Web (HTML) from the Display Mode.
6. From the Variables drop-down select
ChildFirst
ChildLast
Asthmatic Conditions
7. Click OK. The selected variables appear in a web table format.
Notice the list is sorted alphabetically by the Child's Last Name variable.
8. Click Cancel Sort. The CANCEL SORT dialog box opens.
9. Click OK. The original dataset order is applied.

L E S S O N 4
13
Use the Select Command
You can use the SELECT command to specify criteria for data to be included in Analysis functions. Think about the various ways you could divide your data into groups using this command. From the current data, you could select based on Age, Gender, Zip Code, or any combination of variables, in addition to illness information.
Once you make a selection, it affects all the analyses that follows. You must use the Cancel Select command to remove the selection. Selections accumulate until you Cancel Select, close Analysis, or Read in a new project. Use the LIST Command to see the selected records.
From the survey, select only the male students' data.
1. From the Command Tree Select/If folder, click Select. The SELECT dialog box opens.
2. From the Available Variables drop-down, select Gender. Gender appears in the Select Criteria field.
3. Click the = operator.
4. Click or type quote ".
5. Type the word Male.
The word Male must be enclosed in quotes because it is a text field. Text variables must appear in quotes.
6. Click or type quote " to close the expression.
7. Click OK. The Output window updates with your new selection criteria.
The Current View stays the same
The Select criteria appears as Gender="Male"
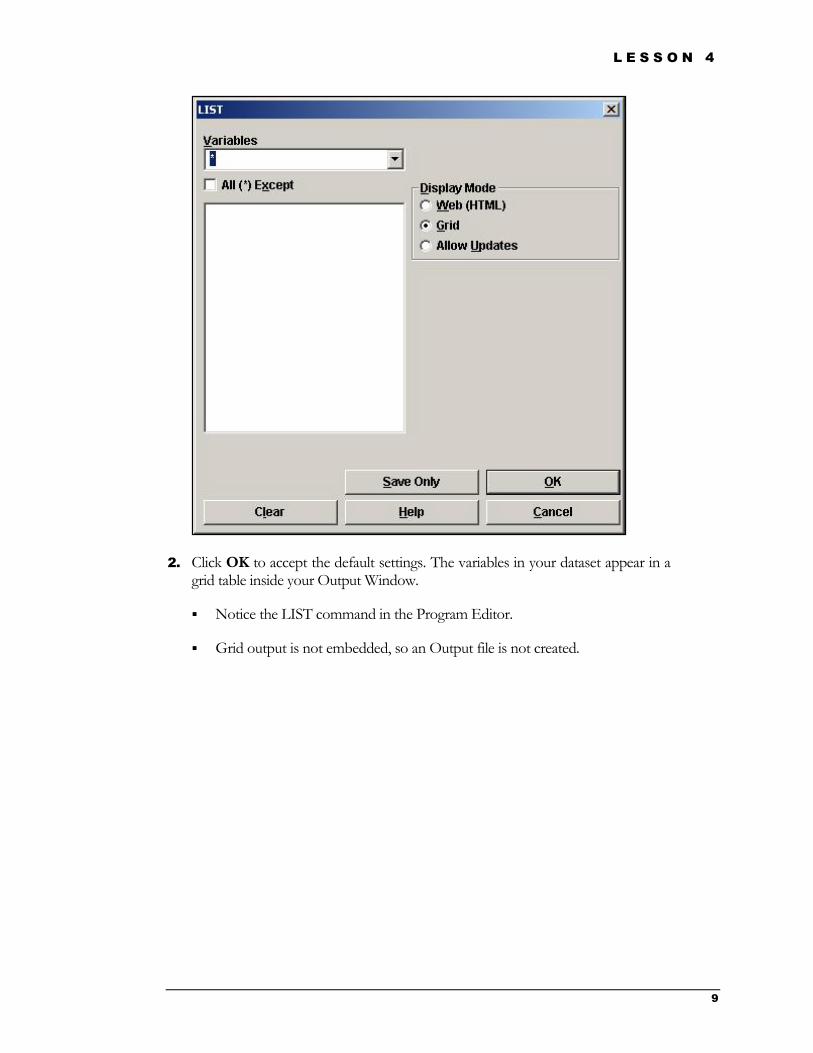
The Record Count changes to 9.
The Program Editor contains the Select command information.
List the Selected Records
1. Click List. The LIST Dialog box opens.
2. Select Web (HTML) as the Display Mode.
3. Click OK to view all the variables.
Notice that all the records in the list are for male students.

L E S S O N 4
15
Select Based on Age
Remember the Select command has a cumulative affect on your data. Now select all the Male students who are younger than the age of 9. You have already selected the male students.
1. Click Select. The SELECT dialog box opens.
2. From the Available Variables drop-down, select Age.
3. Click or type <.
4. Type the number 9.
The Select Criteria field should read Age<9.
5. Click OK. The Output window updates.
Notice the Record Count is now 2.
Notice that your Select criteria reads (Gender = "male") AND (Age < 9). This expression could have been entered into the Select Criteria field at one time.
The expression SELECT Gender = "male" AND Age < 9 could have been typed and Run directly from the Program Editor.
6. List the records in a Web format.
7. Click Cancel Select.
Notice the Record Count returns to the original 12.

Practice
Select the students who answered Yes to Bronchitis. (Hint: Bronchitis="+") You should get a Record Count of 8.
Sort those 8 students by Age.
List the students in a web format.
Do not forget to Cancel Sort and Cancel Select to return to the original 12 records.

17
Skills Review
Place a checkmark next to the correct answer for each of the following questions. Refer to Appendix D Skills Reviews Answer Key for further details.
1. After you run a command, the code appears in which window?
Output window
Program Editor window
Command Tree
2. What command allows you to open a project for analysis?
LIST
READ
SELECT
3. What command would you use to see variables and records in the current data table?
LIST
SORT
READ
4. What command would you use to specify a sequence for records to appear?
SORT
LIST
SELECT
5. What are the two Display Modes you can use with the LIST command?
Web (HTML)
Grid
MS Word

Lesson Complete!
W H A T Y O U L E A R N E D
How to
Read/Import an Epi Info™ project.
Use the LIST Command.
Use the SORT Command.
Use the SELECT Command.
Cancel and Sort or Select of records.

R E F E R E N C E S
19
This page intentionally blank.